the Creative Commons Attribution 4.0 License.
the Creative Commons Attribution 4.0 License.
 | 12 Jan 2024
A modern pollen dataset from lake surface sediments on the central and western Tibetan Plateau
Qingfeng Ma
Jianting Ju
Junbo Wang
Yong Wang
Lei Huang
Torsten Haberzettl
Modern pollen datasets are essential for pollen-based quantitative paleoclimate (e.g. precipitation) reconstructions, which can aid in better understanding recent climate change and its underlying forcing mechanisms. A modern pollen dataset based on surface sediments from 90 lakes in the shrub, meadow, steppe and desert regions of the central and western Tibetan Plateau (TP) was established to fill geographical gaps left by previous datasets. Ordination analyses of pollen data and climatic parameters revealed that annual precipitation is the dominant factor in modern pollen distribution on the central and western TP. A regional transfer function for annual precipitation was developed with weighted averaging partial least squares (WA-PLS), which suggests a good inference power of the modern pollen dataset for annual precipitation. A case study in which the transfer function was effectively applied to a fossil pollen record from Tangra Yumco on the central TP for paleoprecipitation reconstruction demonstrated the significance of the modern pollen dataset in a lower data region for paleoclimate change studies. Data from this study, including pollen data for each sample and information on the sampled sites (location, altitude and climate data), are openly available via the Zenodo portal (https://doi.org/10.5281/zenodo.8008474, Ma et al., 2023).
- Article
(3728 KB) - Full-text XML
- BibTeX
- EndNote


Quantitative reconstructions of climate beyond the range of the instrumental record are required to understand climate change at global and regional scales (Nakagawa et al., 2002; Lu et al., 2011) and to identify the underlying forcing mechanisms of climate change. Pollen extracted from lake sediment sequences has frequently been used to quantitatively reconstruct paleoclimate at different scales from continental, regional or site-specific (Seppä et al., 2004; Lu et al., 2011). Available pollen–climate calibration sets consist of modern pollen data and the corresponding climate data. Modern pollen data from different sources (topsoils, moss pollsters, peat bogs and lake sediments) in one region have different relevant pollen source areas and taphonomy (Wilmshurst and McGlone, 2005; Zhao et al., 2009; Birks et al., 2010). Therefore, for quantitative paleoclimate reconstructions based on fossil pollen in lake sediment records, modern pollen data for the calibration set should be extracted preferably from lake surface sediments if possible to ensure a high comparable quality (Birks et al., 2010).
The Tibetan Plateau (TP), known as the “Third Pole” of Earth, covers a vast geographical area with an average elevation of more than 4000 m a.s.l. (Yao et al., 2013). Due to its large-scale climatic influence, sensitivity to climate change and weak degree of anthropogenic influence, the TP has become a key region for studying present and past climate change and the underlying forcing mechanisms. To date, there are several modern pollen datasets from the TP that have been used to develop the pollen–climate calibration sets (Shen et al., 2006; Herzschuh et al., 2010; Lu et al., 2011; Wang et al., 2014; Cao et al., 2021). However, these datasets are mostly from the eastern TP and are short of samples from lake surface sediments evenly distributed across the central and western TP. A large number of evenly distributed lakes from the central and western TP provide an opportunity to establish a lake surface sediment pollen dataset for this region.
Here we present and analyse a modern pollen dataset from lake surface sediments on the central and western TP. Our aims are to (1) describe the modern pollen assemblages on the central and western TP; (2) determine the key climatic variable that is mainly responsible for controlling the pollen distribution on the central and western TP; (3) derive a regional pollen–climate transfer function to be able to quantitatively reconstruct the key climatic variable; and (4) evaluate the predictive power of our pollen dataset for quantitative paleoclimate reconstruction through a case study. This modern pollen dataset not only supports accurate regional paleoclimate reconstruction on the central and western TP, but also fills a geographical gap left by previous datasets to improve the reliability of quantitative climate reconstructions for the entire TP.
2.1 Topography and climate
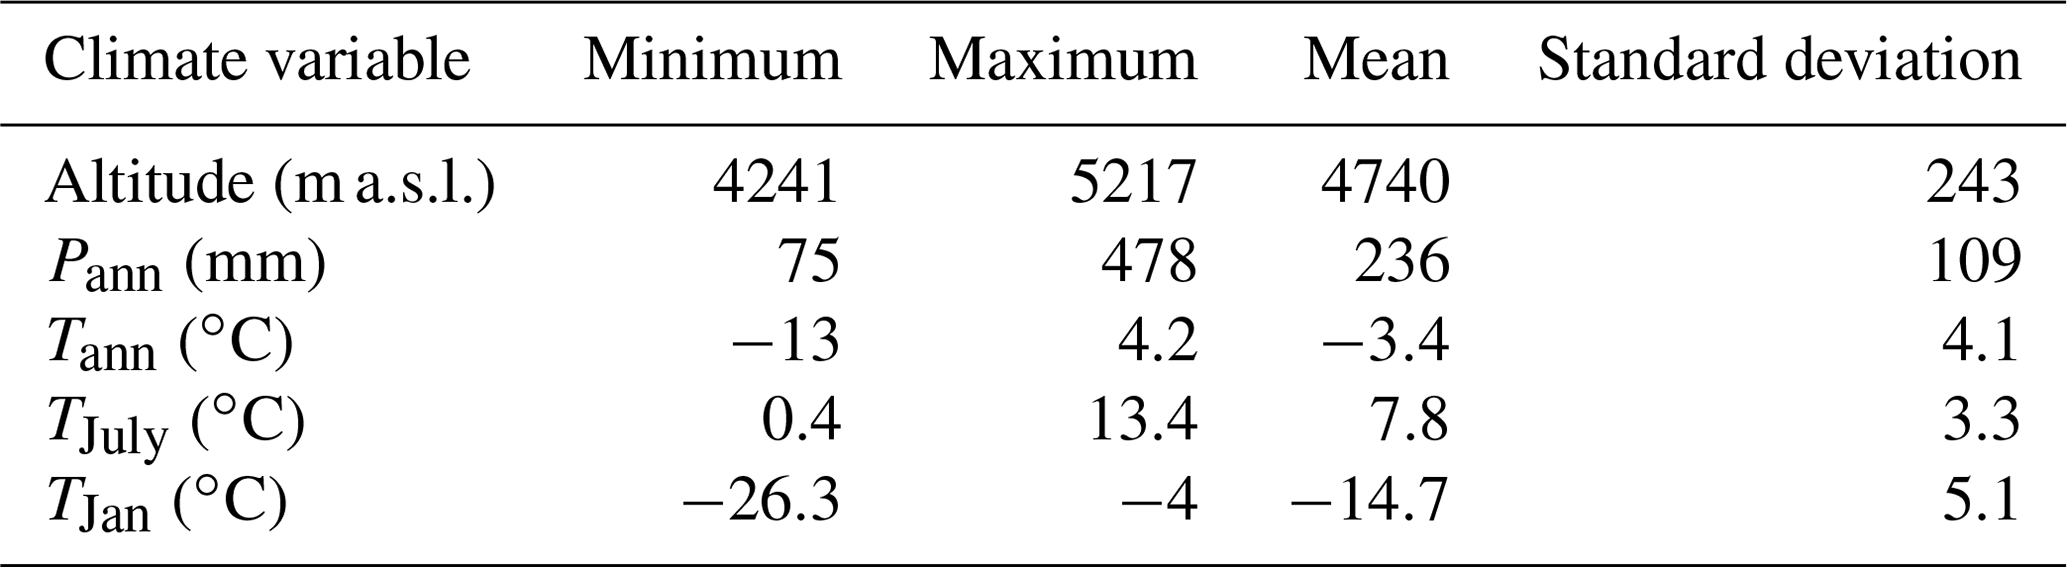
The TP is the broadest and highest-elevation collisional system of Earth (Ding et al., 2022). Under the long-term comprehensive effect of the internal and external agency, the TP manifests extremely complex topographic features. Our study region is located on the central and western TP between 28.5–35.2∘ N and 79.8–91.5∘ E. Several nearly west–east-trending mountain ranges are distributed in the region, which are the Himalayas, the Gangdese–Nyainqentanglha Mountains, the Karakorum–Tanggula Mountains and the Kunlun Mountains from south to north. Between these mountain ranges there are several broad valleys that are divided by secondary tectogenesis into many sedimentary basins of different sizes. A large number of lakes lie at the bottom of the basins (ITCAS, 1988). A total of 90 lakes were sampled in the study region, whose information is presented in Ma et al. (2023). Altitudes of the sampled lakes for surface sediment range from 4240 to 5220 m a.s.l. (Table 1). The average elevation of these lakes is 4740 m a.s.l. The area is influenced by the Indian summer monsoon in summer and the westerlies in winter (Yao et al., 2013). The region spans over several climatic zones, from the frigid arid climate zone in the north-west to the temperate arid climate zone in the western part and to the sub-frigid semi-arid climate zone in the centre and north and the temperate semi-arid climate zone in the south (Institute of Geography, 1990). The study area is characterized by cool–humid summers and cold–dry winters with mean annual temperatures between −13 and 5 ∘C and a mean annual precipitation of 50–500 mm from 1981 to 2010 (Fig. 1a; He et al., 2020).
Table 1Summary statistics of environmental parameters in the pollen dataset.
2.2 Vegetation
The vegetation mainly consists of shrubs, meadows, steppes and deserts (Fig. 1b; ITCAS, 1988; Institute of Geography, 1990; Hou, 2001). The shrubs, generally including Sophora, Ceratostigma, Rosa, Caragana, Rhododendron, Potentilla and Berberis, are mainly distributed below 4800 m a.s.l. in the southern part of the study area. Alpine meadows are mainly found at an elevation of 4500–5300 m a.s.l. in the eastern part, at 4700–5200 m a.s.l. in the south and at 5100–5300 m a.s.l. in the central and southern part. They mainly consist of Kobresia pygmaea communities associated with plants of Kobresia, Carex, Poaceae, Stipa, Asteraceae, Ranunculaceae, Polygonaceae and Fabaceae. Alpine steppes occupy the greatest part of the study area and are distributed at 5100–5400 m a.s.l. in the north-western part and below 5100 m a.s.l. in the other parts. The composition of family and genus in the Tibetan steppe is dominated by Poaceae (e.g. Stipa spp.) and Asteraceae (e.g. Artemisia spp.) together with Cyperaceae, Fabaceae, Caryophyllaceae, Brassicaceae and Amaranthaceae (formerly known as Chenopodiaceae, classified into the family Amaranthaceae). Alpine deserts are mainly distributed in the west and north-west (4200–5100 m a.s.l.). The plant communities are dominated by Amaranthaceae and Asteraceae, such as Ceratoides latens, C. compacta, Ajania fruticulosa and Artemisia sp. together with Poaceae, Fabaceae, Brassicaceae and Ephedra (ITCAS, 1988; Institute of Geography, 1990; Hou, 2001).
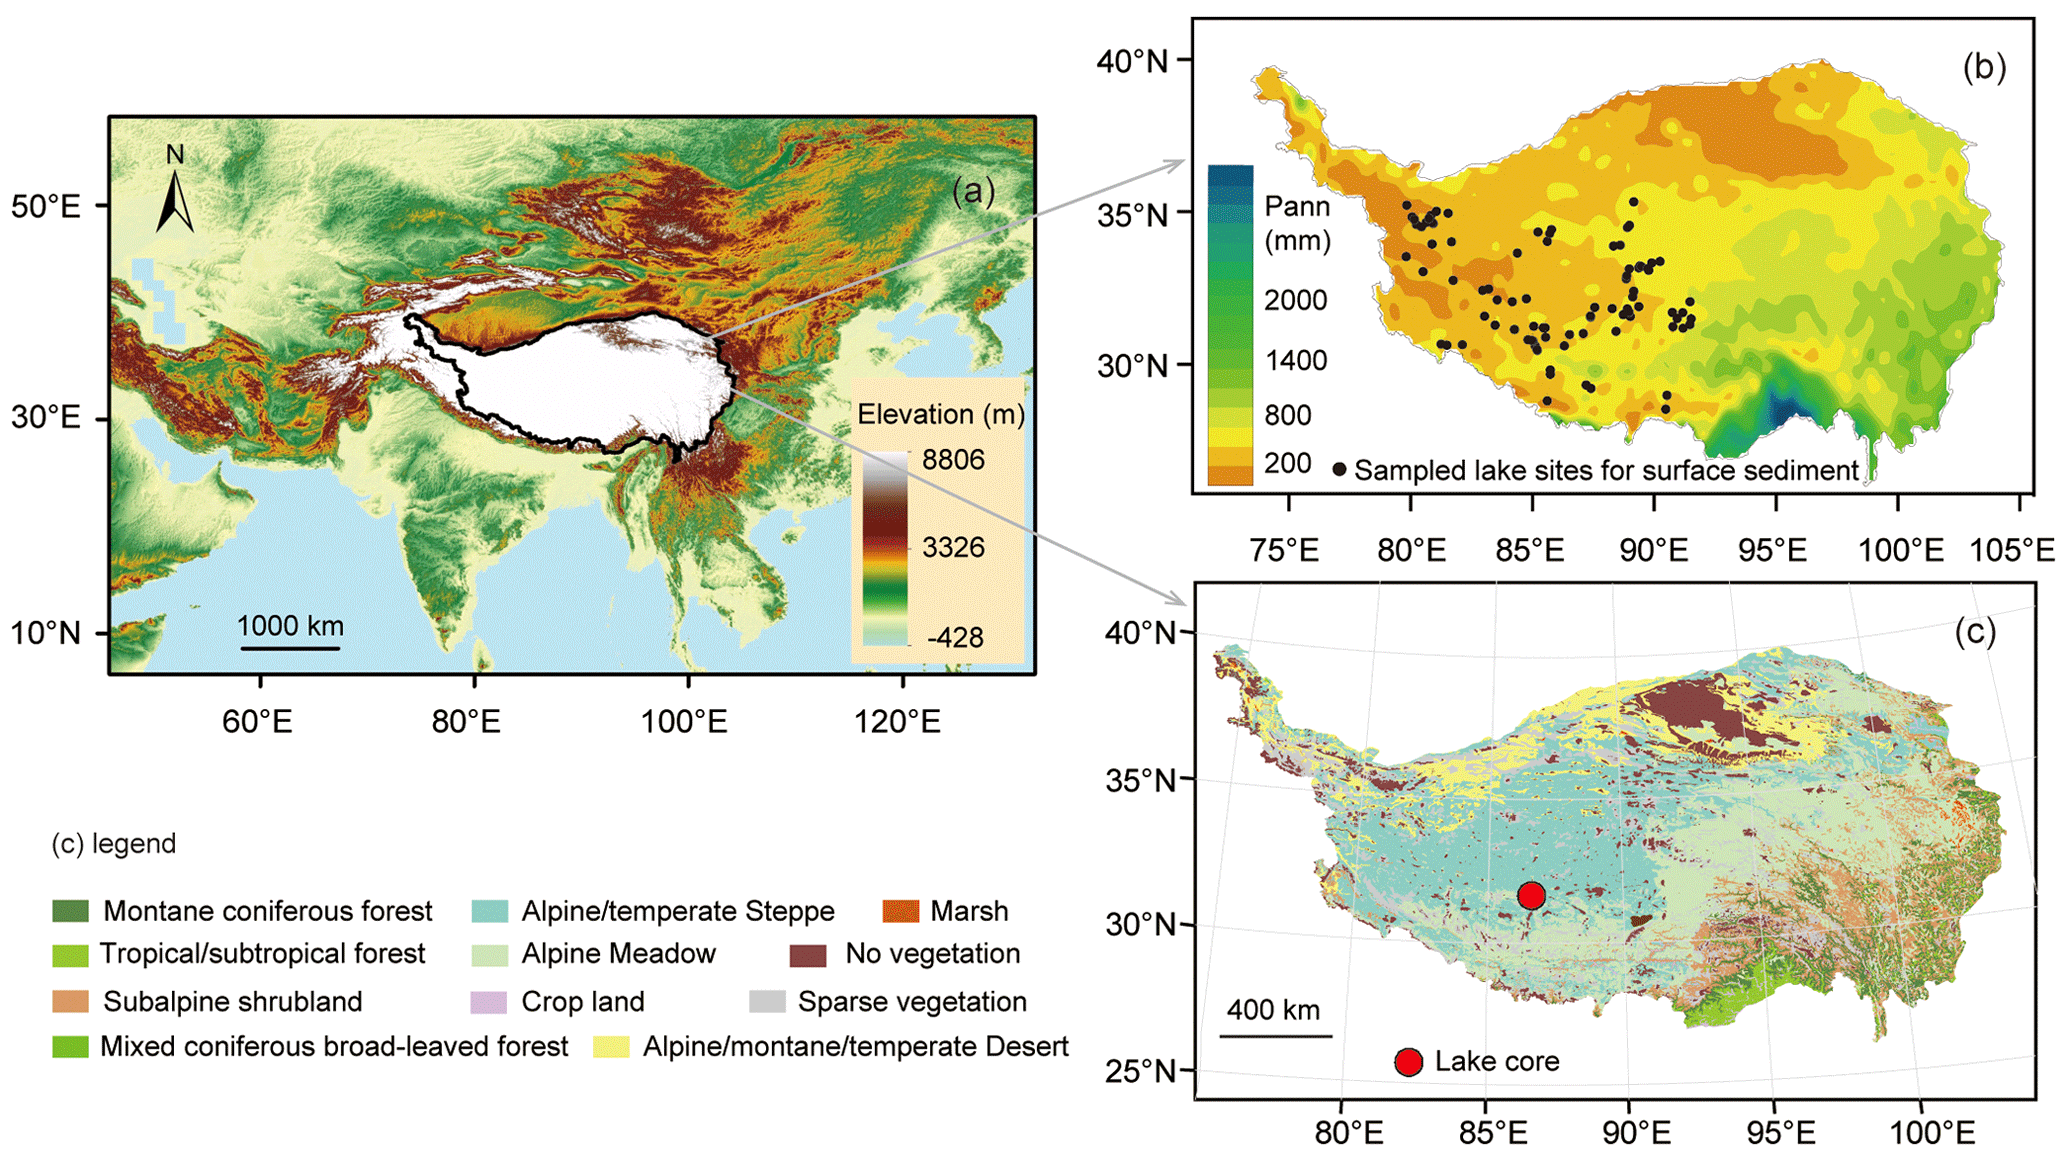
Figure 1Study area and sampling sites of modern lake sediments. (a) Location of the study area; (b) spatial distribution of sampling lake sites (black dots) and annual precipitation; (c) vegetation map of the Tibetan Plateau with the location of Tangra Yumco (red dot).
3.1 Pollen sample collection and analysis
Lake surface sediments were collected from 90 lakes in the study area, including the previously studied 31 lake surface sediment samples (Ma et al., 2017). These lakes fill the geographical gaps on the central and western TP, especially in northern Tibet, which is difficult to access due to the lack of settlements and roads (Fig. 1a). To reduce the influence of the lakeshore vegetation on the pollen spectra, surface sediments were sampled from the central part of each lake. The top 2 cm of sediment was collected as a single sample for each lake, corresponding approximately to the deposition of the last 10–20 years (Wang et al., 2020). Approximately 5 g (dry weight) of each sample was subsampled and used for pollen extraction. Samples were prepared using standard techniques (Faegri and Iversen, 1975) involving 10 % HCl, 10 % KOH, 40 % HF and a mixture (9:1) of acetic anhydride and sulfuric acid, followed by sieving through a 10 µm mesh. Pollen identification and counting were performed under a ZEISS microscope at 400× magnification aided by published keys (Tang et al., 2017; Wang et al., 1995). More than 300 pollen grains were counted for each sample. A total of 70 pollen taxa were recognized from the surface sediments of 90 lakes (Table 2).
3.2 Climate parameter processing
Climate data were obtained from the Chinese Meteorological Forcing Dataset (He et al., 2020). The dataset is based on a fusion of remote sensing products, reanalysis datasets and in situ station data, with a temporal resolution of 3 h and a spatial resolution of 0.1∘. The gridded reanalysis and remote sensing data are GLDAS NOAH10SUBP 3H, GLDAS NOAH025 3H, Modern Era Retrospective-Analysis for Research and Applications (MERRA) MAI3CPASM 5.2.0 20, Global Energy and Water Exchanges – Surface Radiation Budget (GEWEX-SRB) REL3.0 SW 3HRLY 21 and TRMM 3B42 v7. The dataset introduces high-resolution elevation data to the interpolating process of particular variables, such as air temperature. The dataset has been positively validated for western China, where observational data are sparse. Near-surface (2 m) air temperature and precipitation rates were extracted for each lake during 1981–2010 based on their longitude and latitude. These were subsequently transformed to mean annual temperature (Tann), mean July temperature (TJuly), mean January temperature (TJan) and mean annual precipitation (Pann) to estimate the influence of climate variables on modern pollen distribution. The four climate variables were selected because they are important limiting factors in pollen distribution and plant growth, are commonly presented in climate models and are most relevant for paleoclimatic reconstructions (Lu et al., 2011; Cao et al., 2021). Summary statistics for the four climate variables are presented in Table 1.
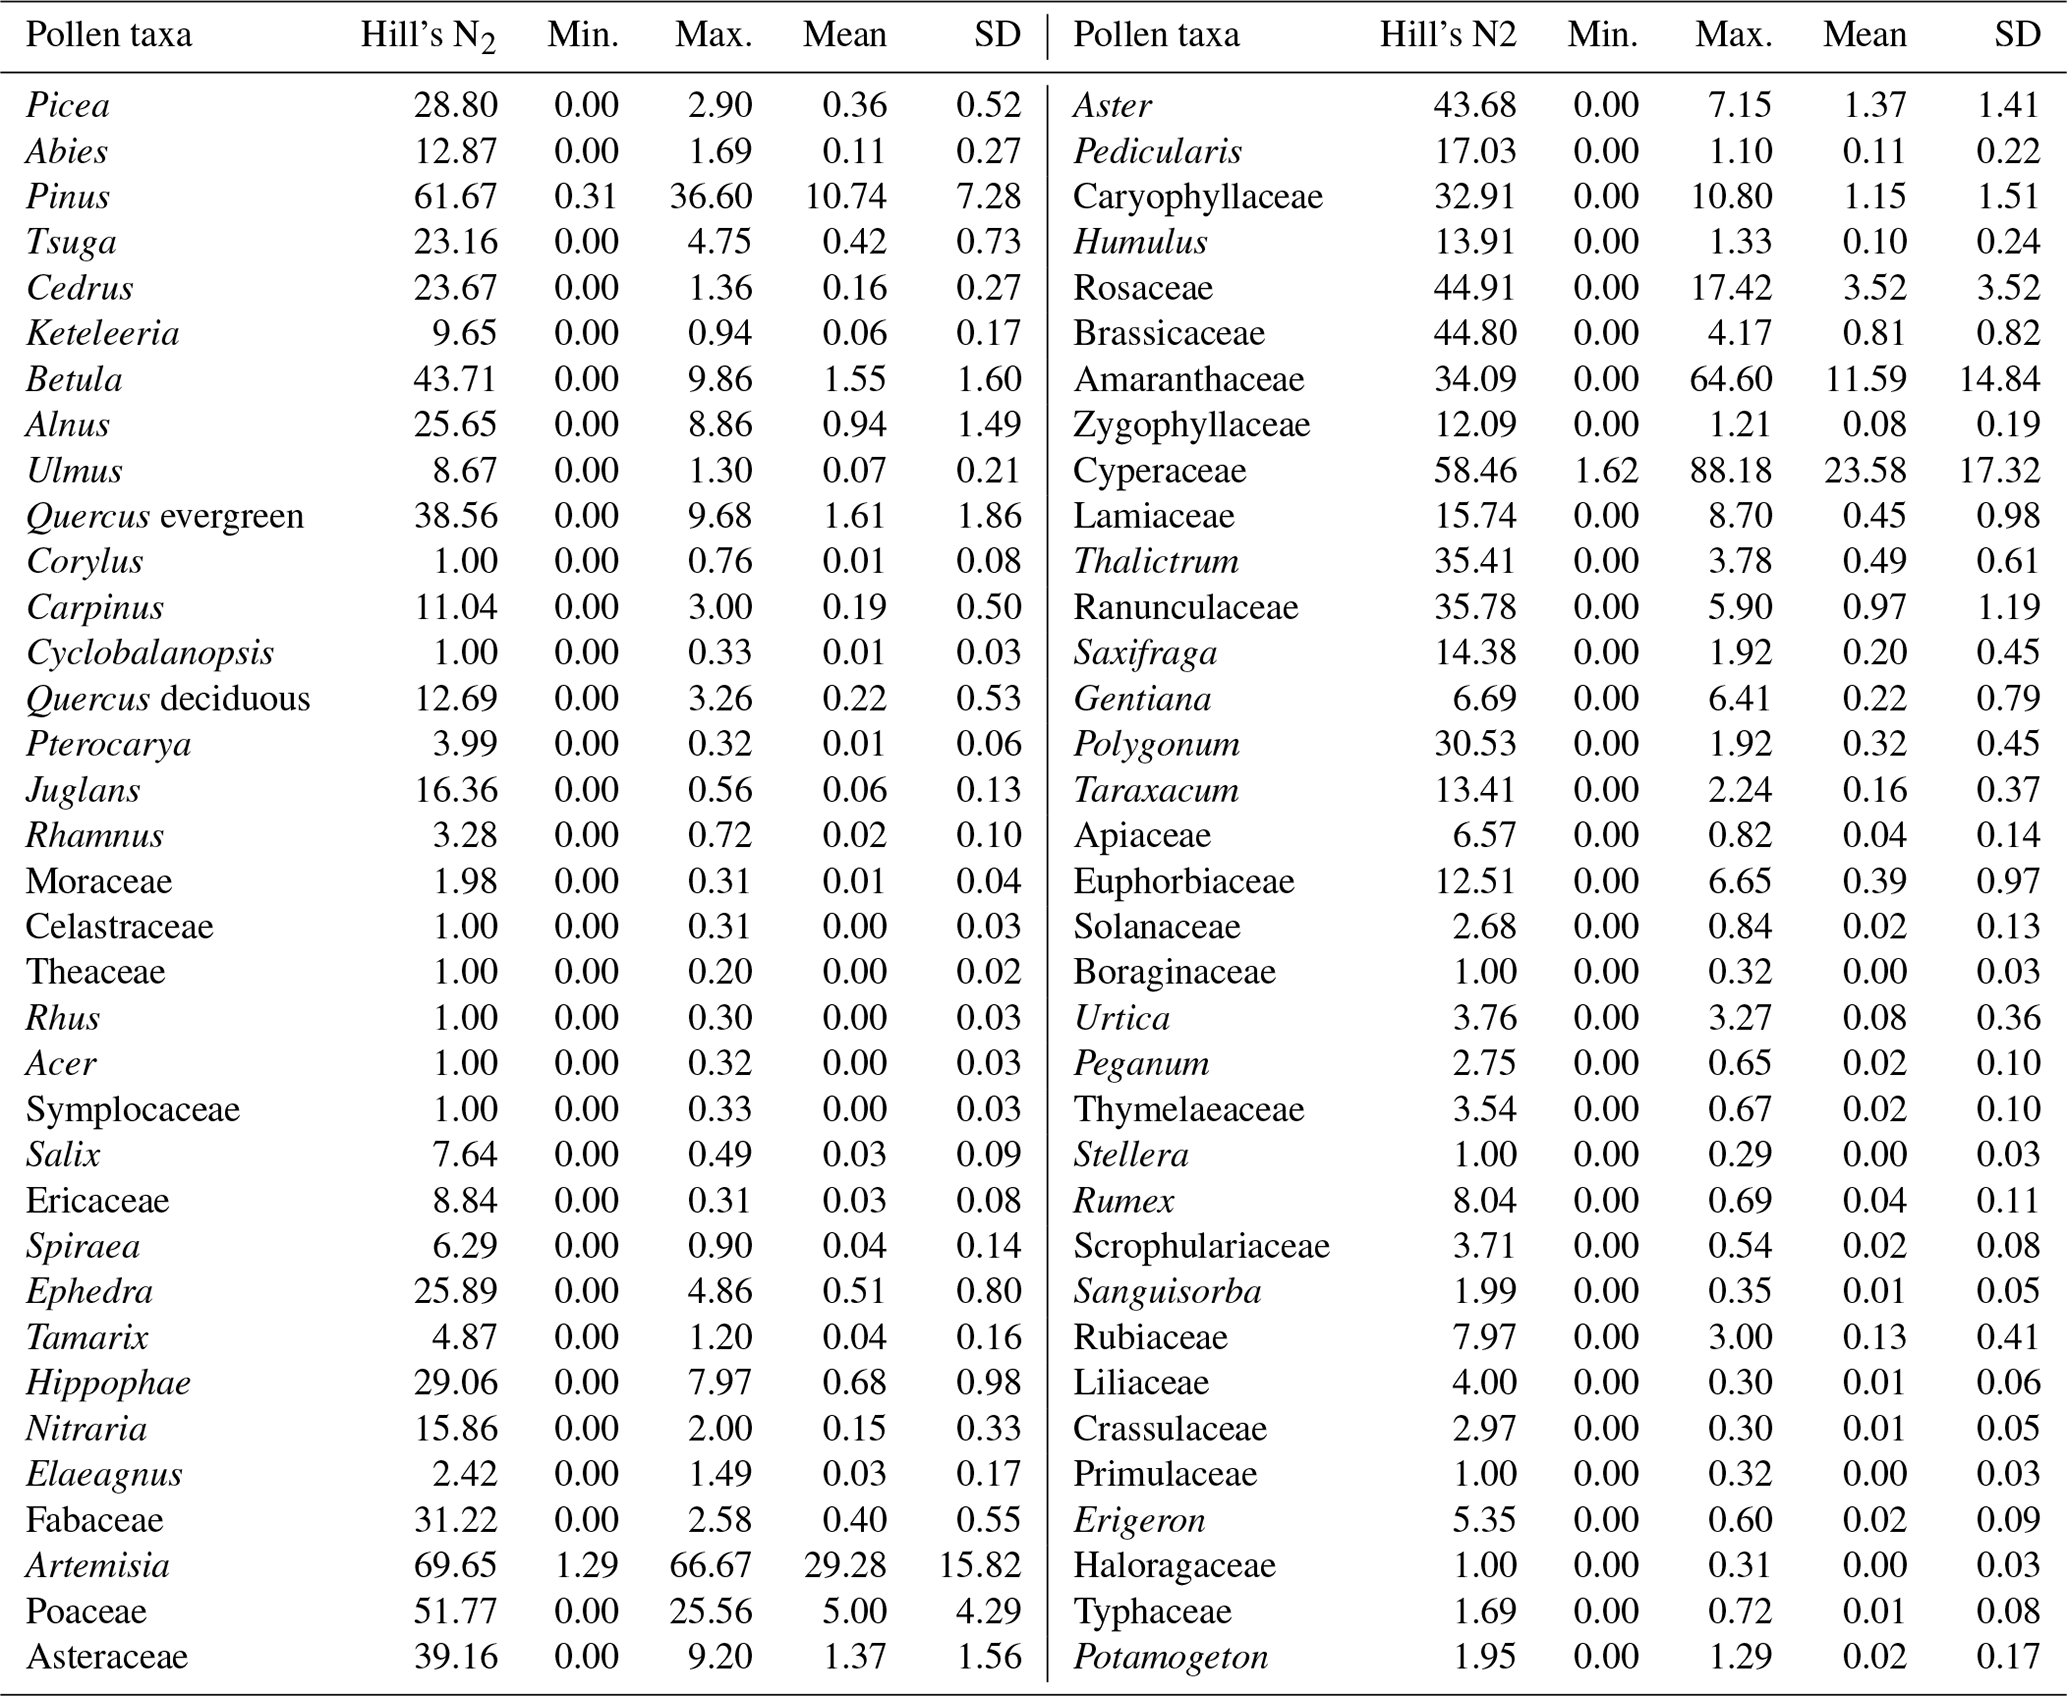
Table 2List of the 70 pollen taxa in the modern dataset, derived from lake surface sediments (SD: standard deviation).
3.3 Numerical analyses
Ordination techniques were used to identify co-varying patterns between modern pollen spectra and environmental variables. In order to stabilize the variances and to optimize the signal-to-noise ratio in the dataset, pollen percentages were square-root-transformed (Prentice, 1980). Detrended correspondence analysis (DCA) was used to determine which method (e.g. linear or non-linear method) was most suitable based on gradient length as the criterion. The DCA result showed that pollen data have a gradient length of 2.2 standard deviations. Therefore, a linear method (redundancy analysis, RDA) was considered appropriate for our pollen data (ter Braak and Prentice, 1988; ter Braak and Verdonschot, 1995). An RDA was carried out to detect the influence of climate variables on our modern pollen dataset. Monte Carlo permutation tests (999 unrestricted permutations) were used to assess the statistical significance of the RDA models. To reduce the bias caused by the effects of high collinearity between climate variables in the ordination analysis process, we examined the variance inflation factors (VIFs) for each variable. If the VIF value of a variable was larger than 20, the variable was expected to be collinear with other variables and to capture little variance (ter Braak, 1988; ter Braak and Šmilauer, 2012). The initial RDA showed that the VIF values of the variables Tann, TJan and TJuly were greater than 20. However, after deleting Tann, which had the highest VIF value, the remaining three climate variables had VIF values lower than 20 and could therefore be used in the final RDA to discern their influence on the modern pollen dataset. These analyses were performed using the Canoco 5 software (ter Braak and Šmilauer, 2012).
To assess the potential of the modern pollen dataset for quantitative estimates of climate parameters, the weighted averaging partial least squares (WA-PLS) model was run. WA-PLS is one of the most robust techniques for numerical climate inference (ter Braak and Juggins, 1993) and has been widely used in quantitative analyses of relationships between biological assemblages and environmental factors on the TP, such as on pollen (Shen et al., 2006; Herzschuh et al., 2010) and other proxy data, e.g. chironomids (Zhang et al., 2019). Error estimates of the WA-PLS model were compared with other calibration models, including weighted averaging (WA) regression with inverse deshrinking (Birks et al., 1990), the modern analogue technique (MAT) (Overpeck et al., 1985), the weighted average of the k closest modern analogues (WMAT) (ter Braak, 1995), as well as WA-PLS and tolerance-weighted WA-PLS (TWA-PLS) (Liu et al., 2020). TWA-PLS is an improved version of WA-PLS by considering the information about the climatic tolerances of taxa (Liu et al., 2020). TWA-PLS was performed using the TWAPLS.w function in the fxTWAPLS package version 0.1.2 (Liu et al., 2020) for R 4.2.3. In addition to the traditional leave-one-out cross-validation, another method (Telford and Birks, 2011) was used to assess the statistical significance of the climate reconstruction for the WA-PLS reconstruction method using the R 4.2.3 statistical package (R Core Team, 2023) with the randomTF function in the palaeoSig package 2.1-3 (Telford and Trachsel, 2023). Final model development and climate reconstructions for WA-PLS were performed with the C2 software (Juggins, 2003).
To evaluate the inference power of our pollen dataset for paleoclimatic parameters, an application of the WA-PLS model to the Tangra Yumco fossil pollen record (covering the last 17.5 cal kyr BP; Ma et al., 2019, 2020) was made to quantitatively estimate the last deglacial and Holocene paleoclimate in the southern and central part of the TP. Tangra Yumco (31.2∘ N, 86.7∘ E; 4545 m a.s.l.) is located in the semi-arid region, and its catchment is mainly occupied by alpine steppe (Fig. 1b).
The pollen assemblages in the surface sediments of the 90 lakes, consisting of a total of 70 pollen taxa, are summarized in Table 1. The pollen assemblages (Fig. 2) are dominated by herbaceous taxa, especially Artemisia (mean 29.3 ± 15.8 %, max. 66.7 %), Cyperaceae (mean 23.6 ± 17.3 %, max. 88.2 %) and Amaranthaceae (mean 11.6 ± 14.8 %, max. 64.6 %). The sum percentage of these three taxa is up to 64.4 %. Other common herbaceous pollen taxa include Poaceae (mean 5 ± 4.3 %, max. 25.6 %), Aster (mean 1.4 ± 1.4 %, max. 7.2 %), Asteraceae (mean 1.4 ± 1.6 %, max. 9.2 %), Caryophyllaceae (mean 1.2 ± 1.5 %, max. 10.8 %), Ranunculaceae (mean 1.0 ± 1.2 %, max. 5.9 %), Brassicaceae (mean 0.8 ± 0.8 %, max. 4.2 %) and Thalictrum (mean 0.5 ± 0.6 %, max. 3.8 %). Tree pollen consists mainly of Pinus (mean 10.7 ± 7.3 %, max. 36.6 %), Quercus evergreen (Quercus E; mean 1.6 ± 1.9 %, max. 9.7 %), Betula (mean 1.6 ± 1.6 %, max. 9.9 %) and Alnus (mean 1.0 ± 1.5 %, max. 8.9 %). Shrub pollen percentages are low, mainly consisting of Rosaceae (mean 3.5 ± 3.5 %, max. 17.4 %), Hippophae (mean 0.7 ± 1.0 %, max. 8.0 %) and Ephedra (mean 0.5 ± 0.8 %, max. 4.9 %).
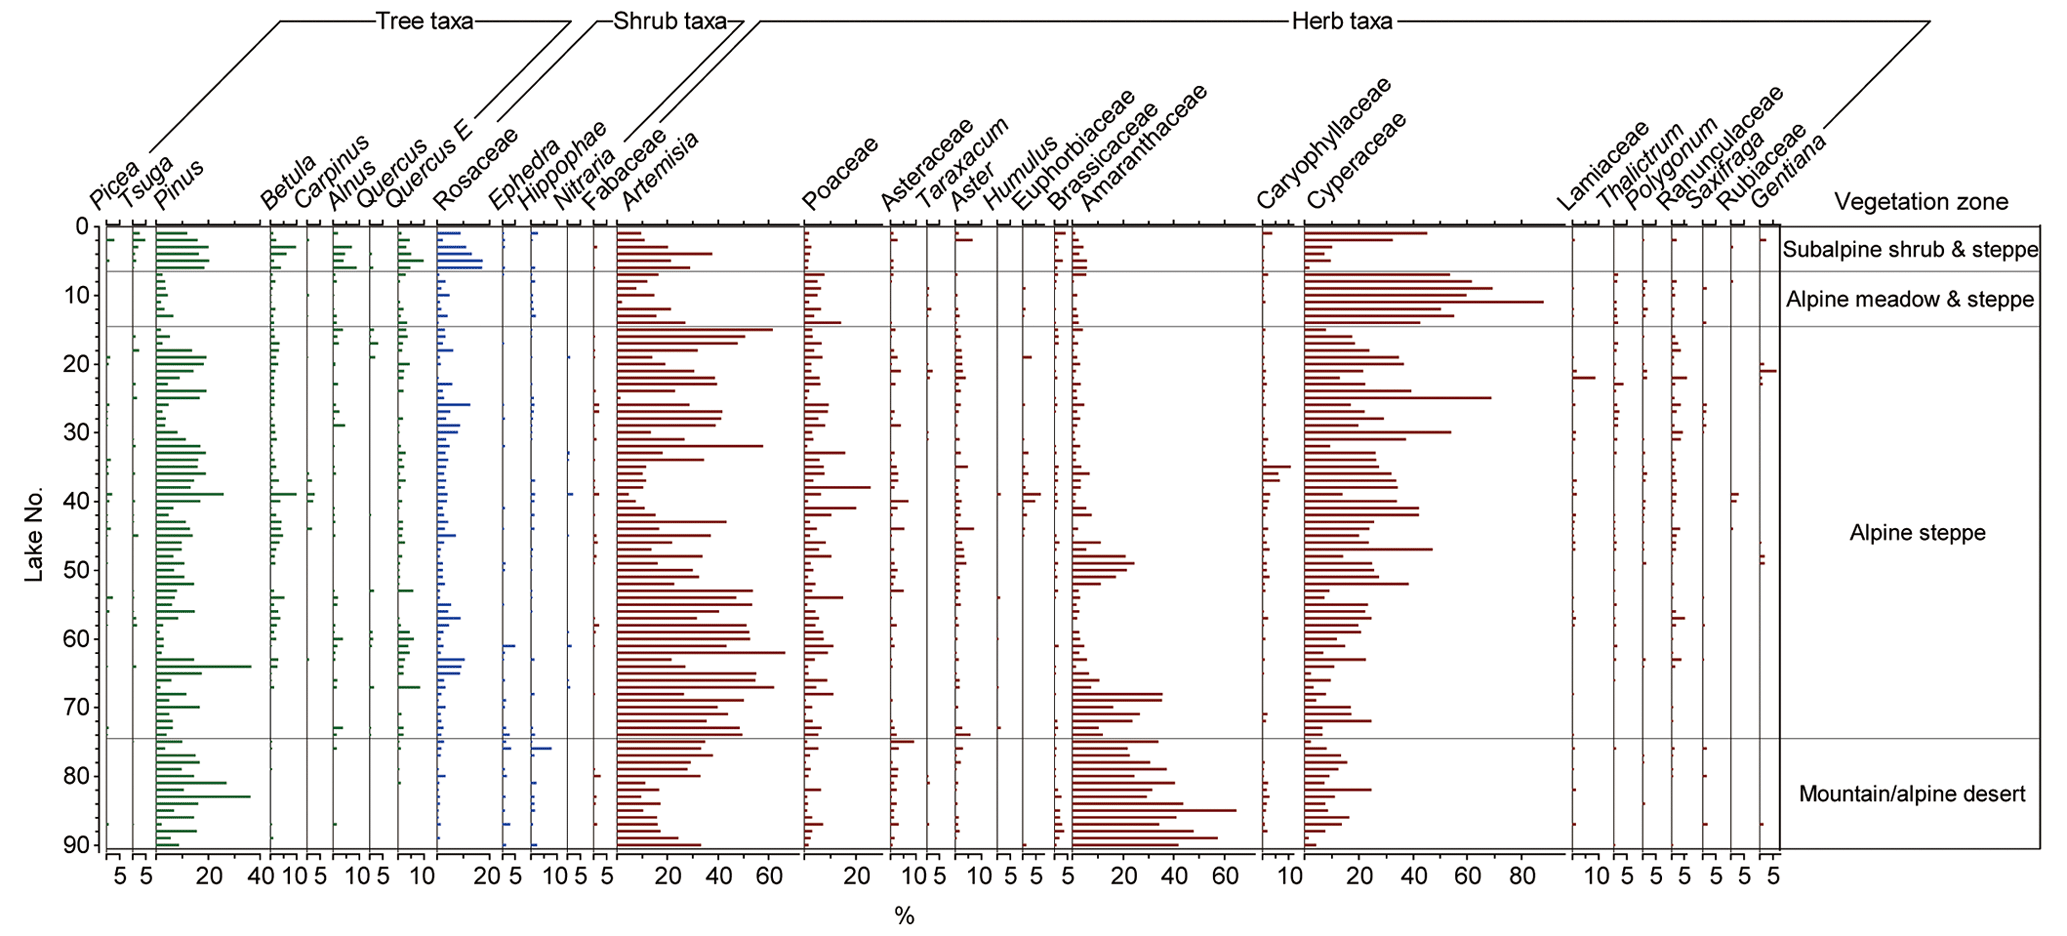
Figure 2Pollen diagram for lake surface sediments from the central and western Tibetan Plateau showing the percentage values of selected pollen taxa. The samples are arranged according to their vegetation zones.
A series of RDAs based on 31 pollen taxa (1 % in at least two samples) and three climatic variables (Pann, TJan and TJuly) shows that Pann, as the sole variable, explains 24.2 % of the variation in the pollen data, which is significantly more than the explained proportion of TJan (8.6 %) and TJuly (2.5 %). The RDA result with all the climatic variables is shown in Fig. 3. RDA axis 1 and axis 2 capture 26.5 % and 7.2 % of the variation in the pollen data, respectively. Humidity-preferring taxa including Cyperaceae, Thalictrum, Ranunculaceae and Polygonum are located along the positive direction of Pann, whereas aridity-preferring taxa consisting of Amaranthaceae, Ephedra, Artemisia and Asteraceae are distributed along the negative direction of Pann. Tree pollen taxa are mainly located along the positive direction of TJan and TJuly.
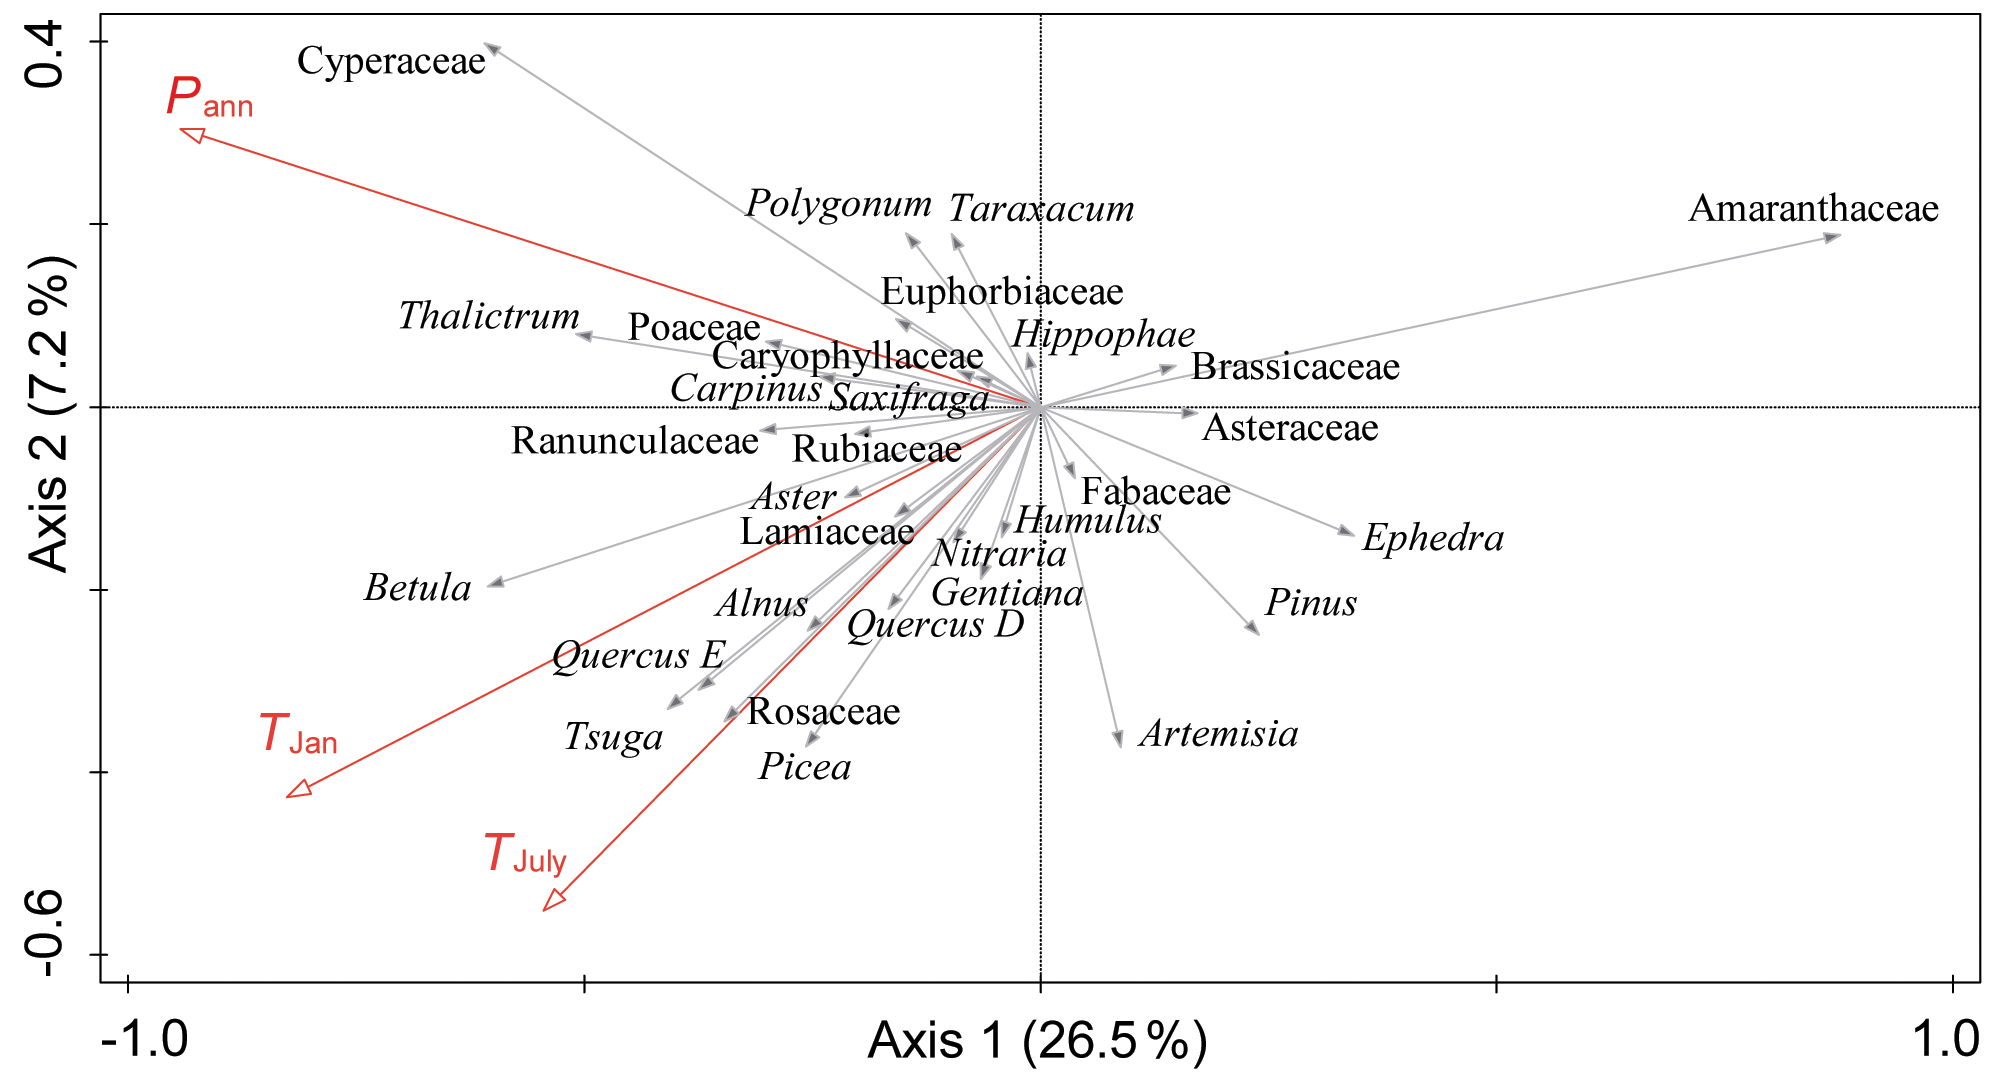
Figure 3Redundancy analysis (RDA) results for the main pollen taxa in the surface lake sediments and three important climatic variables (Pann: mean annual precipitation; TJan: January temperature; TJuly: July temperature).
RDA results indicate that Pann is the leading climate variable for modern pollen distribution on the central and western TP (Fig. 3; Table 3). The associated Monte Carlo permutation test shows that the relationship between pollen taxa and Pann is significant (p=0.001) (Table 3). Thus, the numerical relationship between modern Pann and pollen assemblages shows that the pollen dataset has a robust ability to infer the changes in climatic variables. Performances of various calibration models are shown in Table 4. The last significant number of components for WA-PLS or TWA-PLS is considered to be the suitable component for each method. Thus, WA-PLS component 2 (p=0.031) and TWA-PLS component 2 (p=0.047) are used to compare with other methods. WA-PLS component 2 and TWA-PLS component 2 show better performances than WA, MAT and WMAT due to their lower root mean square error of prediction (RMSEP) and higher R2. Further comparison between WA-PLS and TWA-PLS reveals that WA-PLS component 2 has a lower RMSEP and a higher R2. This means that TWA-PLS does not improve model performance based on our pollen dataset compared with WA-PLS. One explanation could be that our sample size is not large enough and that the sample sites are mainly distributed in the middle and lower parts of the precipitation gradient with a relatively uniform distribution. Finally, we still use the WA-PLS method to develop the pollen–precipitation transfer function for our dataset.
Table 3Summary statistics of redundancy analysis (RDA) based on the main pollen taxa and four climate variables. VIF is the variance inflation factor (without Tann). Variance explained (%) is the proportion of variation in the pollen assemblages explained by each variable as the sole constraining variable in RDA. p value indicates the statistical significance of each variable assessed by Monte Carlo permutation tests (999 unrestricted permutations).
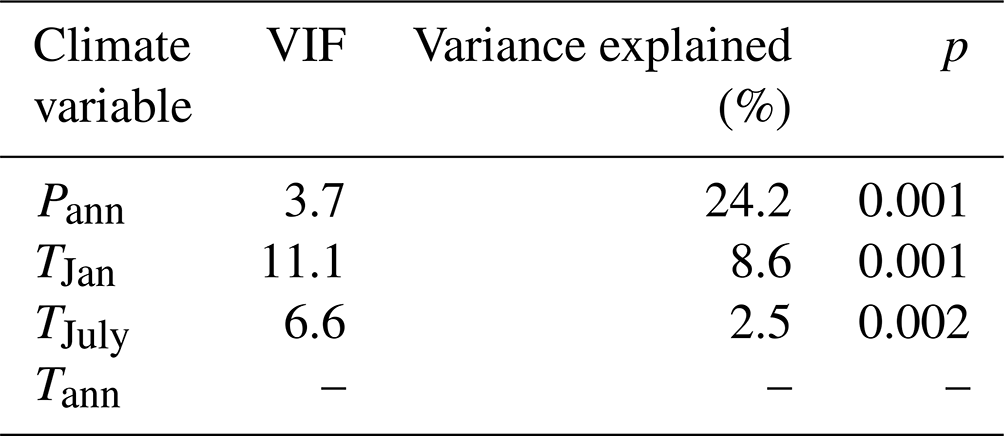
Table 4Error estimates for different Pann calibration models, assessed by leave-one-out cross-validation. R2 (R2_Jack) is the coefficient of determination between predicted and observed Pann. RMSEP is the root mean square error of prediction. The p value for each component assesses whether using the current component is significantly different from using one component less.
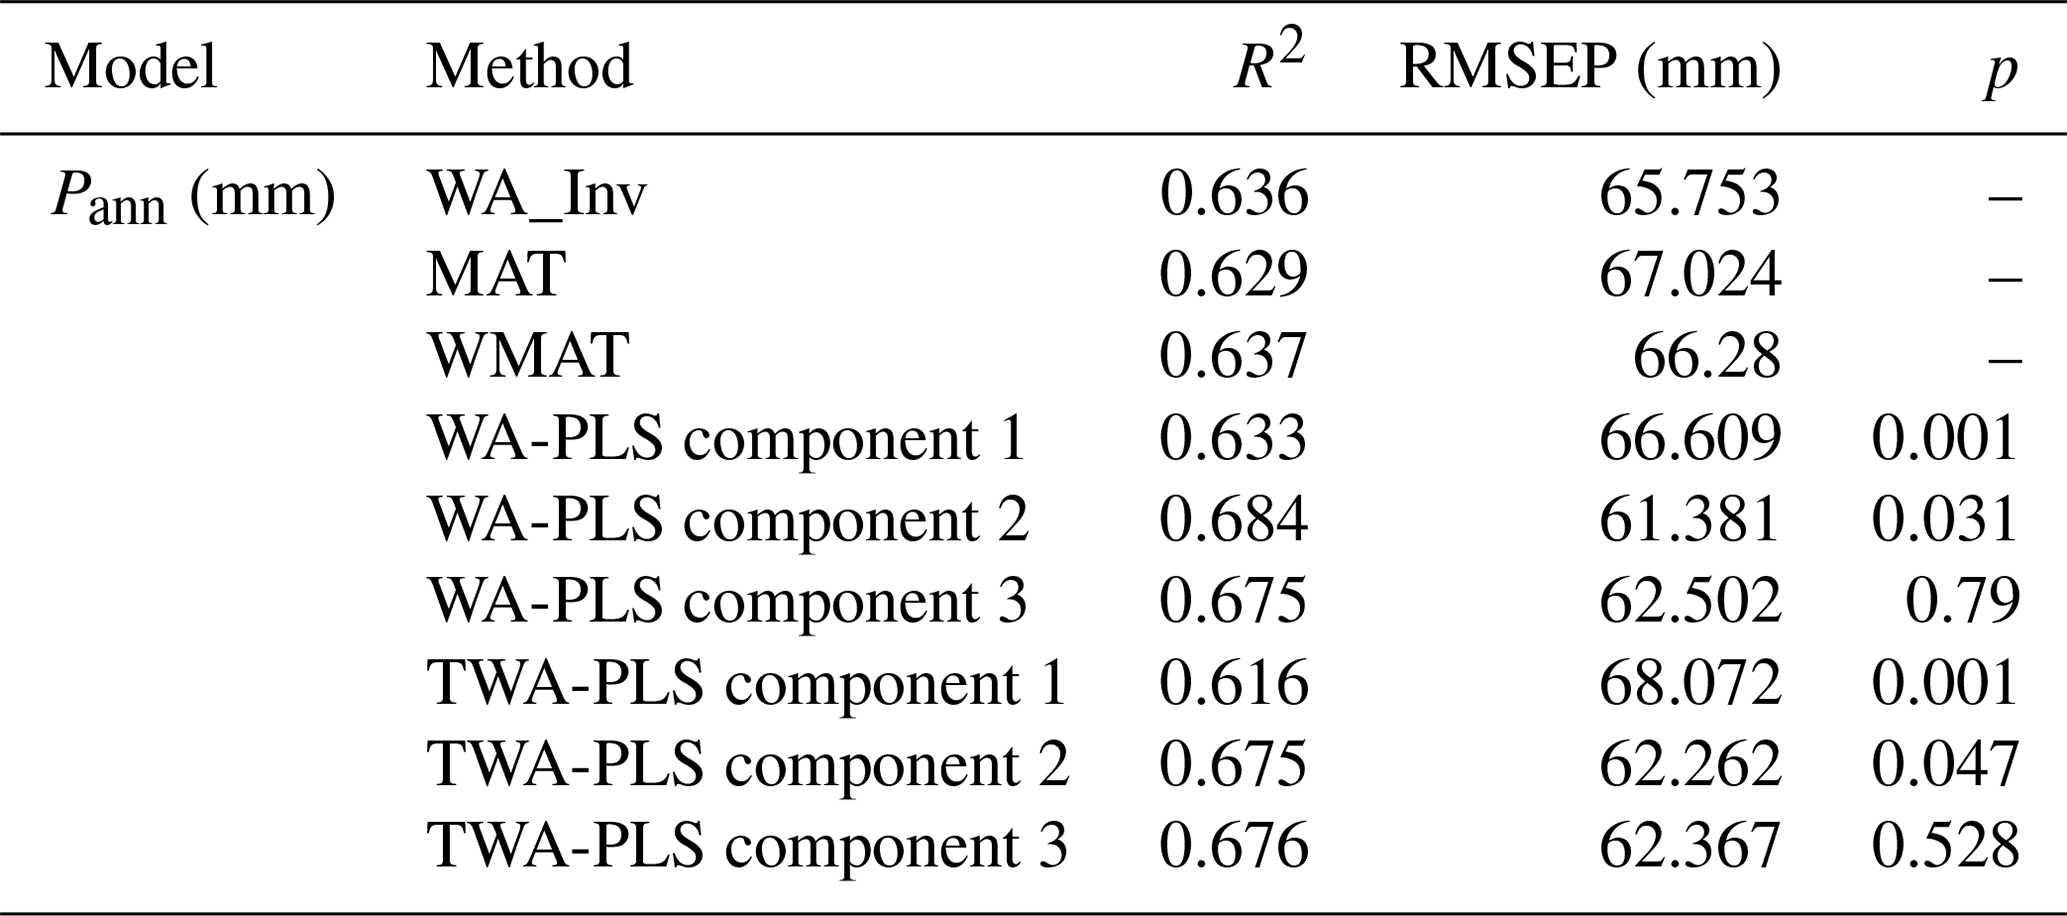
The final WA-PLS component 2 model shows a good performance (R2=0.684, RMSEP = 61.381 mm). The results of the WA-PLS component 2 model for Pann with a plot of predicted vs. observed values are shown in Fig. 4. The results indicate that WA-PLS component 2 performs well for Pann inference. However, the plot of the residuals vs. Pann values shows an underestimate for humid sites (Pann>400 mm). Nevertheless, quantitative reconstructions covering the arid and semi-arid region of the TP (Pann<400 mm) should be credible due to the low bias.
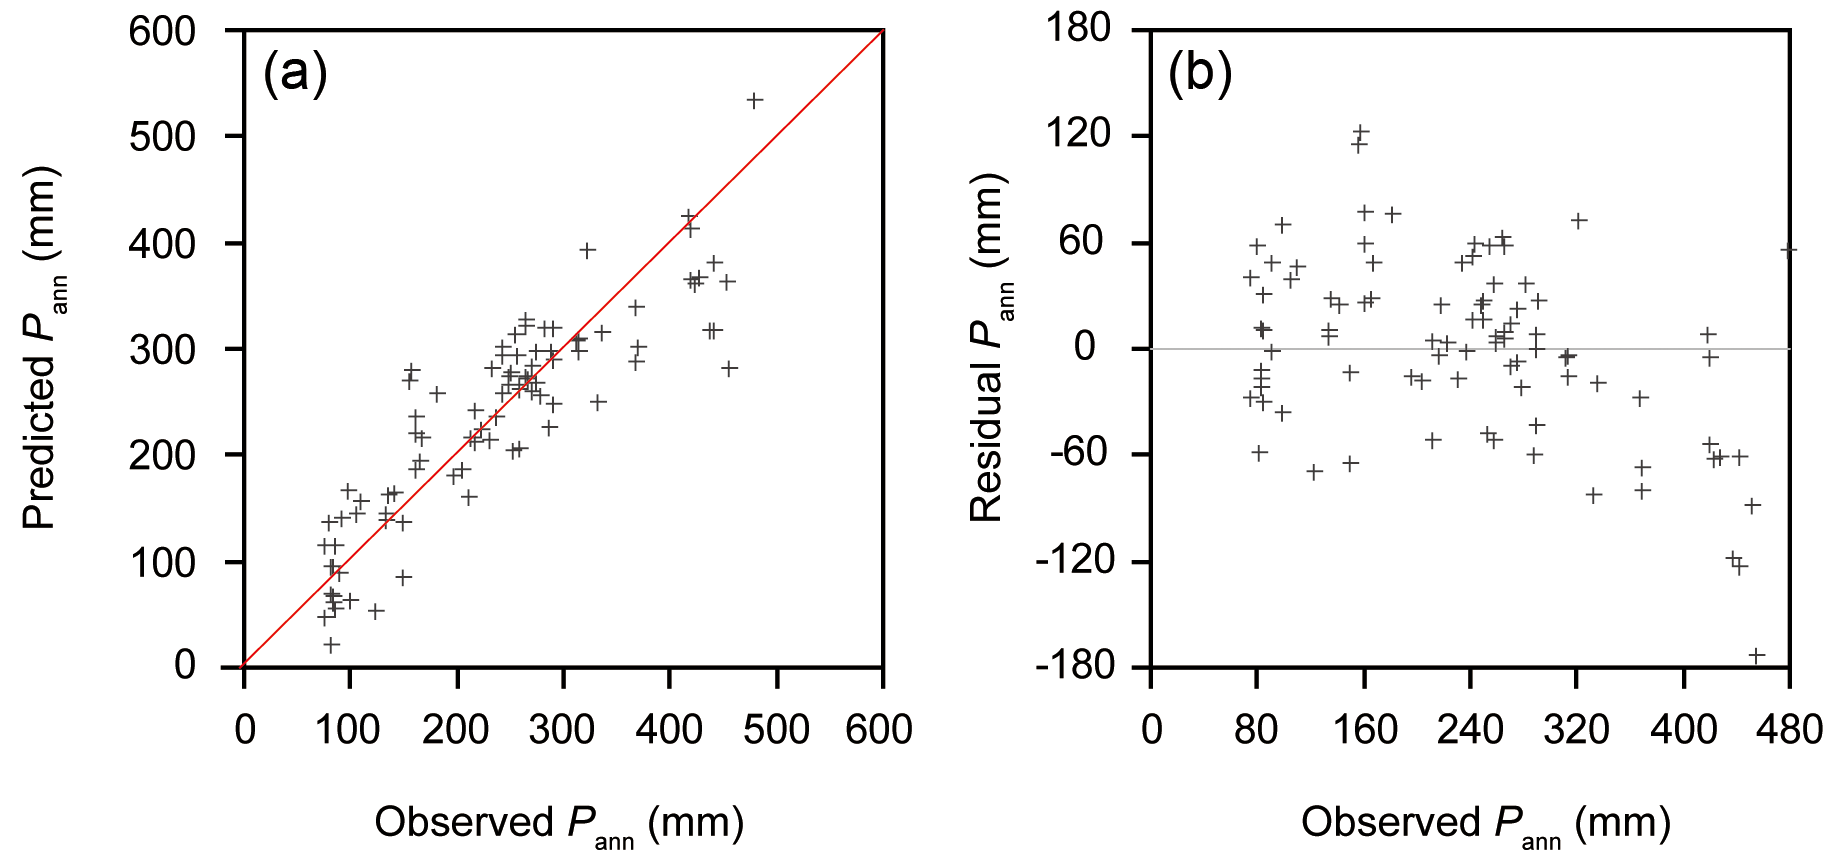
Figure 4Scatter plots of the WA-PLS inference model for observed annual precipitation (Pann) vs. predicted Pann values (a) and residuals vs. Pann values (b).
Our pollen–climate transfer function can be considered a regional calibration model for the central and western TP. So far, there has been no special calibration model for this region. Compared with the large-scale calibration models covering our study region and other regions (Lu et al., 2011; Zheng et al., 2014), our regional calibration model has several features: (1) samples are only from lake surface sediments, rather than from multiple sedimentary environments; (2) samples are distributed more evenly in space, rather than along the main roads; and (3) the RMSEP for mean annual precipitation is lower. Therefore, our calibration model can work well in precipitation reconstruction for the central and western TP. However, it is a regional calibration model and cannot be used for broad areas like other large-scale calibration models.
Fossil pollen assemblages and concentrations from Tangra Yumco revealed that the desert vegetation was replaced by steppe vegetation during the last deglaciation, and alpine steppe persisted in the basin during the Holocene (Ma et al., 2019, 2020). The results indicated that arid or semi-arid climatic conditions persisted since 17.5 cal kyr BP. Therefore, the regional transfer function for Pann can be used for this record. Statistical significance tests showed that the Pann reconstruction for Tangra Yumco explained more of the variance in the fossil data than 95 % of the reconstructions from transfer functions trained on random data (Telford and Birks, 2011). The results indicate that the Pann reconstruction for Tangra Yumco is statistically significant, and the reconstruction is reliable using the WA-PLS model (Fig. 5).
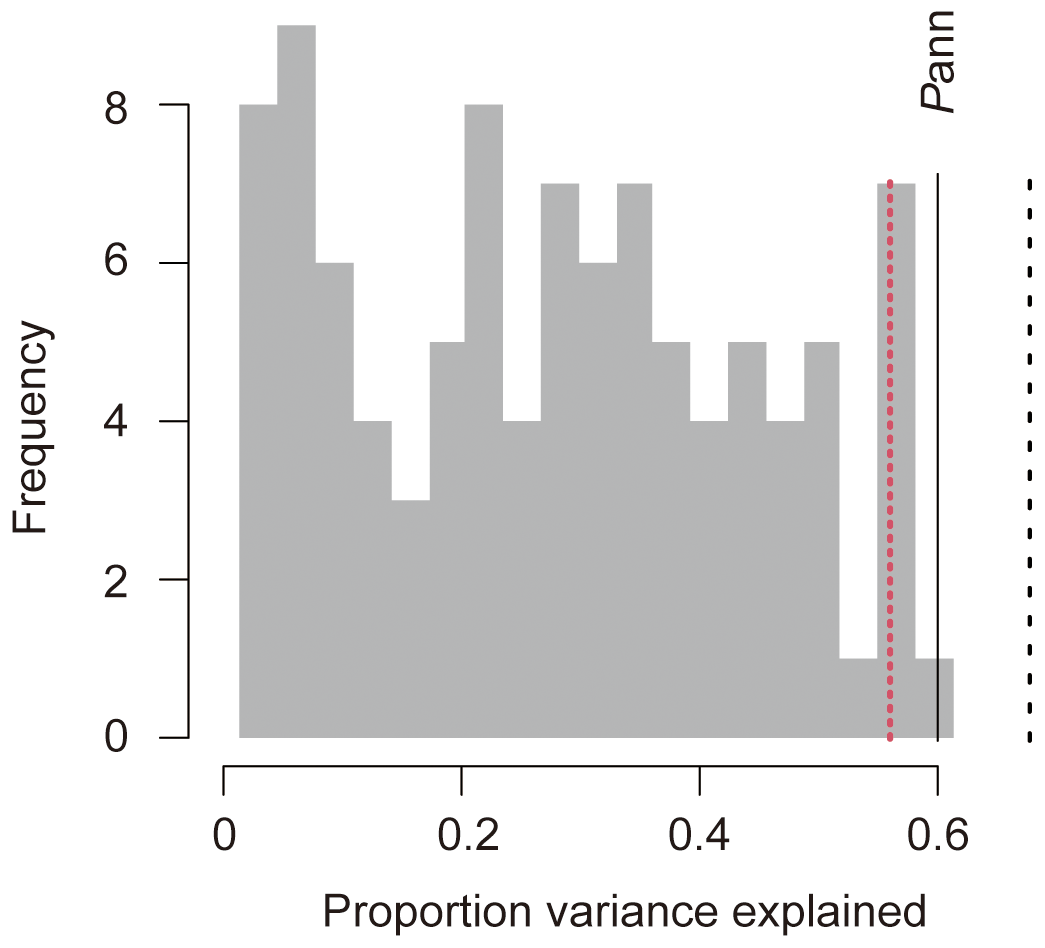
Figure 5Statistical significance test of Pann reconstruction for Tangra Yumco. Histogram showing the proportion of the variance in the pollen record of Tangra Yumco explained by reconstructions of 99 Pann calibration functions trained with random data. The dotted red line represents the proportion of variance explained by random data-trained calibration functions at the 95 % confidence level. The solid black line indicates the proportion of variance explained by the reconstructed Pann. The dotted black line marks the proportion of variance explained by the first axis of the principal component analysis (PCA).
The application of the WA-PLS transfer function for Pann to the Tangra Yumco pollen data is the first quantitative record on the central and western TP located in the Indian summer monsoon margin. To ensure an effective number of species occurrences and uniformity, predicted Pann values for fossil samples with Hill's N2 >4 (Hill, 1973) were used in the reconstruction result (Fig. 6). The pollen-derived precipitation record shows that the lake basin was most arid from 17.5 to 16.1 cal kyr BP, with <100 mm of Pann. During 16.1–13.2 cal kyr BP, Pann increased rapidly up to >200 mm. Pann showed a peak value (up to 300 mm) at approximately 13 cal kyr BP, followed by a low value of 240 mm at approximately 12 cal kyr BP. Pann was highest in the early and middle Holocene (11.6–5 cal kyr BP), which is 70 mm (nearly 30 %) higher than modern annual precipitation on average. After 5 cal kyr BP, Pann showed a decreasing trend.
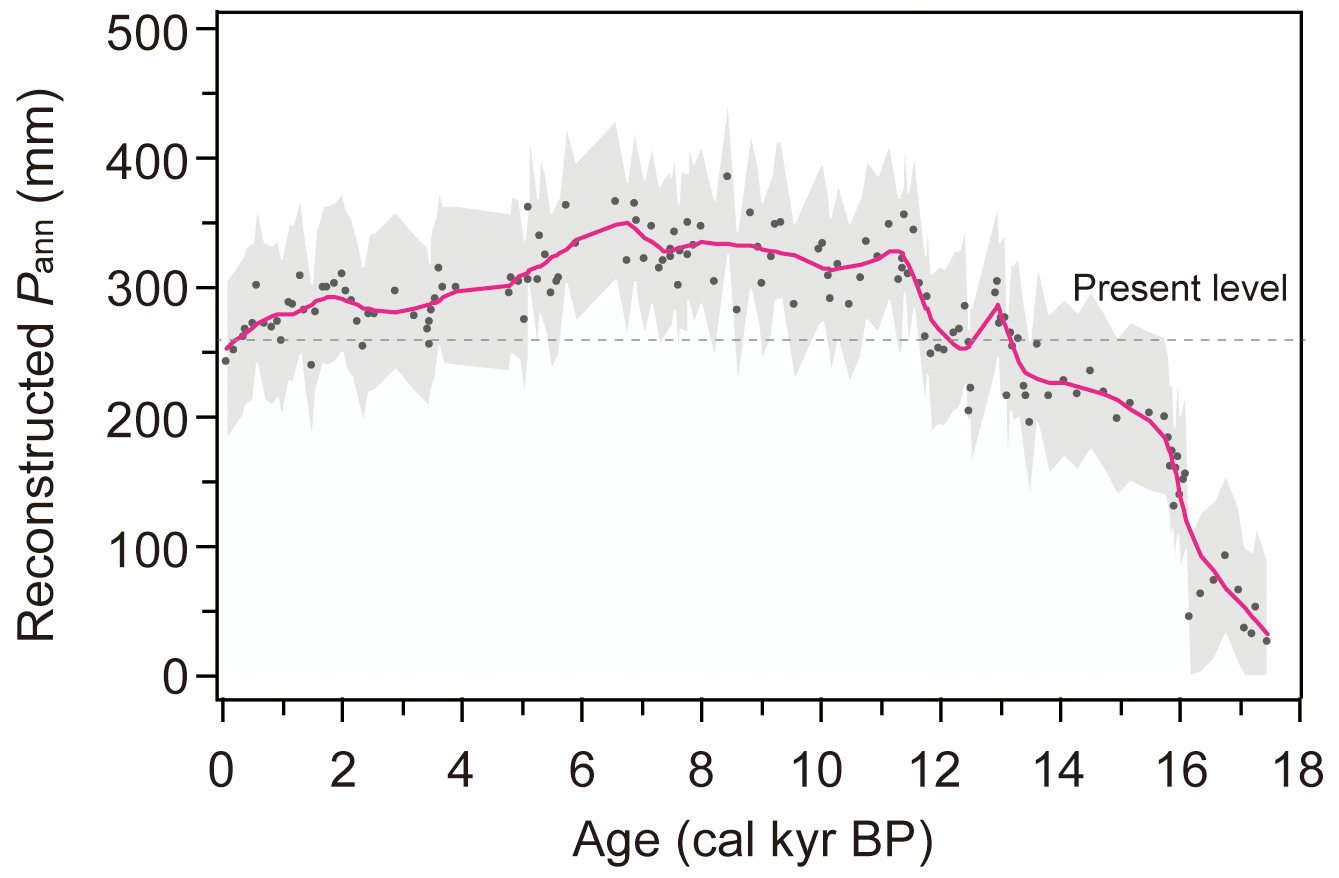
Figure 6Predicted annual precipitation (Pann) for Tangra Yumco using the weighted averaging partial least squares (WA-PLS) inference model. The dotted line represents the modern annual precipitation of the basin. Grey shading indicates the ranges from predicted values subtracting the root mean square error of prediction (RMSEP) to predicted values adding the RMSEP.
The dataset includes pollen counts and pollen percentages of the lake surface samples. Locations (latitude, longitude and altitude) and climatic data for each lake site are also given in the dataset. This dataset is openly accessible via the Zenodo portal: https://doi.org/10.5281/zenodo.8008474 (Ma et al., 2023).
We present and analyse a pollen dataset based on surface sediments from 90 lakes covering the central and western TP. This dataset includes pollen counts and percentages as well as latitude, longitude, altitude and the corresponding climate data. Ordination analyses indicate that mean annual precipitation (Pann) is the dominant climatic parameter controlling variations in the modern pollen distribution of the dataset on the central and western TP. A quantitative transfer function was developed to estimate Pann from the modern pollen dataset using weighted averaging partial least squares (WA-PLS). Our results indicate that the regional pollen dataset can provide useful and reliable quantitative estimates of past precipitation change on the central and western TP. The pollen-derived transfer function was tested for a pollen record on the central TP, which is the first quantitative paleoprecipitation record in the Indian summer monsoon margin.
Most of our lake sites are located in extremely remote areas with difficult access. The pollen data from these localities can fill the geographical gap left by other published modern pollen datasets and make the samples evenly distributed in the combined pollen dataset. Apart from its use for quantitative precipitation reconstructions on the central and western TP, our dataset can also be combined with other pollen datasets to improve the reliability of quantitative climate reconstructions across the entire TP.
LZ designed the study. QM, JJ, JW, YW and LH collected the samples. QM did the pollen extraction and identification and drafted the manuscript. JJ, JW, YW, LH and TH revised the manuscript.
The contact author has declared that none of the authors has any competing interests.
Publisher’s note: Copernicus Publications remains neutral with regard to jurisdictional claims made in the text, published maps, institutional affiliations, or any other geographical representation in this paper. While Copernicus Publications makes every effort to include appropriate place names, the final responsibility lies with the authors.
We thank all colleagues and students in the field for their help with sampling. We would like to thank Qinghai Xu, Lingyu Tang and Xinmiao Lü for their help with sample treatment and pollen identification. We also acknowledge Ruimin Yang for her assistance in producing diagrams. Climate data were provided by the National Tibetan Plateau Data Center.
This research has been supported by the National Natural Science Foundation of China (grant nos. 41831177 and 42272223), the Second Tibetan Plateau Scientific Expedition and Research (STEP) (grant no. 2019QZKK0202) and the Innovation Program for Young Scholars of TPESER (grant no. TPESER-QNCX2022ZD-01).
This paper was edited by Hanqin Tian and reviewed by two anonymous referees.
Birks, H. J. B., Line, J. M., Juggins, S., Stevenson, A. C., and ter Braak, C. J. F.: Diatoms and pH reconstruction, Philos. Trans. R. Soc. B, 327, 263–278, https://doi.org/10.1098/rstb.1990.0062, 1990.
Birks, H. J. B., Heiri, O., Seppä, H., and Bjune, A. E.: Strengths and weaknesses of quantitative climate reconstructions based on late-Quaternary biological proxies, Open Ecol. J., 3, 68–110, https://doi.org/10.2174/1874213001003020068, 2010.
Cao, X., Tian, F., Li, K., Ni, J., Yu, X., Liu, L., and Wang, N.: Lake surface sediment pollen dataset for the alpine meadow vegetation type from the eastern Tibetan Plateau and its potential in past climate reconstructions, Earth Syst. Sci. Data, 13, 3525–3537, https://doi.org/10.5194/essd-13-3525-2021, 2021.
Ding, L., Kapp, P., Cai, F., Garzione, C. N., Xiong, Z., Wang, H., and Wang, C.: Timing and mechanisms of Tibetan Plateau uplift. Nat. Rev. Earth Env., 3, 652–667, https://doi.org/10.1038/s43017-022-00318-4, 2022.
Faegri, K. and Iversen, J.: Textbook of pollen analysis, Munksgaard, Copenhagen, ISBN 978-0-02-844470-3, 1975.
He, J., Yang, K., Tang, W., Lu, H., Qin, J., Chen, Y., and Li, X.: The first high-resolution meteorological forcing dataset for land process studies over China, Sci. Data, 7, 25, https://doi.org/10.1038/s41597-020-0369-y, 2020.
Herzschuh, U., Birks, H. J. B., Mischke, S., Zhang, C., and Böhner, J.: A modern pollen-climate calibration set based on lake sediments from the Tibetan Plateau and its application to a late Quaternary pollen record from the Qilian Mountains, J. Biogeogr., 37, 752–766, https://doi.org/10.1111/j.1365-2699.2009.02245.x, 2010.
Hill, M. O.: Diversity and evenness: A unifying notation and its consequences, Ecology, 54, 427–432, https://doi.org/10.2307/1934352, 1973.
Hou, X.: Vegetation Atlas of China, Science Press, Beijing, ISBN 978-7-03-008956-4, 2001.
Institute of Geography: Map of the Qinghai-Tibetan Plateau, Science Press, Beijing, ISBN 978-7-03-003397-0, 1990.
Investigation Team of Chinese Academy of Science (ITCAS): Vegetation in Tibetan Plateau, Science Press, Beijing, ISBN 978-7-03-000090-3, 1988.
Juggins, S.: User Guide: C2, software for ecological and palaeoecological data analysis and visualization user guide version 1.3., Department of Geography University of Newcastle, Newcastle upon Tyne, 69 pp., https://www.staff.ncl.ac.uk/stephen.juggins/software/code/C2.pdf (last access: 5 October 2022), 2003.
Liu, M., Prentice, I. C., ter Braak, C. J. F., and Harrison, S. P.: An improved statistical approach for reconstructing past climates from biotic assemblages, Proc. R. Soc. A, 476, 20200346, https://doi.org/10.1098/rspa.2020.0346, 2020.
Lu, H., Wu, N., Liu, K., Zhu, L., Yang, X., Yao, T., Wang, L., Li, Q., Liu, X., Shen, C., Li, X., Tong, G., and Jiang, H.: Modern pollen distributions in Qinghai-Tibetan Plateau and the development of transfer functions for reconstructing Holocene environmental changes, Quaternary Sci. Rev., 30, 947–966, https://doi.org/10.1016/j.quascirev.2011.01.008, 2011.
Ma, Q., Zhu, L., Lu, X., Wang, Y., Guo, Y., Wang, J., Ju, J., Peng, P., and Tang, L.: Modern pollen assemblages from surface lake sediments and their environmental implications on the southwestern Tibetan Plateau, Boreas, 46, 242–253, https://doi.org/10.1111/bor.12201, 2017.
Ma, Q., Zhu, L., Lü, X., Wang, J., Ju, J., Kasper, T., Daut, G., and Haberzettl, T.: Late glacial and Holocene vegetation and climate variations at Lake Tangra Yumco, central Tibetan Plateau, Global Planet. Change, 174, 16–25, https://doi.org/10.1016/j.gloplacha.2019.01.004, 2019.
Ma, Q., Zhu, L., Wang, J., Ju, J., Wang, Y., Lü, X., Kasper, T., and Haberzettl, T.: Late Holocene vegetation responses to climate change and human impact on the central Tibetan Plateau, Sci. Total Environ., 708, 135370, https://doi.org/10.1016/j.scitotenv.2019.135370, 2020.
Ma, Q., Zhu, L., Ju, J., and Wang, J.: A modern pollen dataset from lake surface sediments on the central-western Tibetan Plateau, Zenodo [data set], https://doi.org/10.5281/zenodo.8008474, 2023.
Nakagawa, T., Tarasov P. E., Nishida, K., Gotanda, K., and Yasuda, Y.: Quantitative pollen-based climate reconstruction in central Japan: application to surface and Late Quaternary spectra, Quaternary Sci. Rev., 21, 2099–2113, https://doi.org/10.1016/S0277-3791(02)00014-8, 2002.
Overpeck, J. T., Webb III, T., and Prentice, I. C.: Quantitative interpretation of fossil pollen spectra: Dissimilarity coefficients and the method of modern analogs, Quat. Res., 23, 87–108, https://doi.org/10.1016/0033-5894(85)90074-2, 1985.
Prentice, I. C.: Multidimensional scaling as a research tool in Quaternary palynology: a review of theory and methods, Rev. Palaeobot. Palynol., 31, 71–104, https://doi.org/10.1016/0034-6667(80)90023-8, 1980.
R Core Team: R, A language and environment for statistical computing, R Foundation for Statistical Computing, Vienna, https://www.r-project.org/, last access: 15 March 2023.
Seppä, H., Birks, H. J. B., Odland, A., Poska, A., and Veski, S.: A modern pollen–climate calibration set from northern Europe: developing and testing a tool for palaeoclimatological reconstructions, J. Biogeogr., 31, 251–267, https://doi.org/10.1111/j.1365-2699.2004.00923.x, 2004.
Shen, C., Liu, K., Tang, L., and Overpeck, J. T.: Quantitative relationships between modern pollen rain and climate in the Tibetan Plateau, Rev. Palaeobot. Palynol., 140, 61–77, https://doi.org/10.1016/j.revpalbo.2006.03.001, 2006.
Tang, L., Mao, L., Shu, J., Li, C., Shen, C., and Zhou, Z.: Atlas of Quaternary pollen and spores in China, Science Press, Beijing, ISBN 978-7-03-050568-2, 2017.
Telford, R. J. and Birks, H. J. B.: A novel method for assessing the statistical significance of quantitative reconstructions inferred from biotic assemblages, Quaternary Sci. Rev., 30, 1272–1278, https://doi.org/10.1016/j.quascirev.2011.03.002, 2011.
Telford, R. J. and Trachsel, M.: PalaeoSig: Significance tests for palaeoenvironmental reconstructions, version 2.1-3, http://cran.r-project.org/web/packages/palaeoSig/index.html (last access: 10 March 2023), 2023.
ter Braak, C. J. F.: Canoco – a FORTRAN program for canonical community ordination by (partial) (detrended) (canonical) correspondence analysis, principal components analysis and redundancy analysis (version 2.1). Technical Rep., LWA-88-02, GLW, Wageningen, 95 pp., https://www.researchgate.net/publication/227944702 (last access: 12 April 2023), 1988.
ter Braak, C. J. F.: Non-linear methods for multivariate statistical calibration and their use in palaeoecology: a comparison of inverse (k-nearest neighbours, partial least squares and weighted averaging partial least squares) and classical approaches, Chemometr. Intell. Lab., 28, 165–180, https://doi.org/10.1016/0169-7439(95)80048-E, 1995.
ter Braak, C. J. F. and Juggins S.: Weighted averaging partial least squares regression (WA-PLS): an improved method for reconstructing environmental variables from species assemblages, Hydrobiologia, 269, 485–502, https://doi.org/10.1007/BF00028046, 1993.
ter Braak, C. J. F. and Prentice, I. C.: A theory of gradient analysis, Adv. Ecol. Res., 18, 271–317, https://doi.org/10.1016/S0065-2504(08)60183-X, 1988.
ter Braak, C. J. F. and Šmilauer, P.: CANOCO reference manual and user's guide: software for ordination (version 5), Microcomputer Power Ithaca, New York, 2012.
ter Braak, C. J. F. and Verdonschot, P. F. M.: Canonical correspondence analysis and related multivariate methods in aquatic ecology, Aquat. Sci., 57, 255–289, https://doi.org/10.1007/BF00877430, 1995.
Wang, F., Qian, N., Zhang, Y., and Yang, H.: Pollen flora of China, Science Press, Beijing, ISBN 978-7-03-003635-3, 1995.
Wang, M., Tian, Q., Li, X., Liang, J., He, Y., and Hou, J.: TEX86 as a potential proxy of lake water pH in the Tibetan Plateau, Palaeogeogr. Palaeoclimatol. Palaeoecol., 538, 109381, https://doi.org/10.1016/j.palaeo.2019.109381, 2020.
Wang, Y., Herzschuh, U., Shumilovskikh, L. S., Mischke, S., Birks, H. J. B., Wischnewski, J., Böhner, J., Schlütz, F., Lehmkuhl, F., Diekmann, B., Wünnemann, B., and Zhang, C.: Quantitative reconstruction of precipitation changes on the NE Tibetan Plateau since the Last Glacial Maximum – extending the concept of pollen source area to pollen-based climate reconstructions from large lakes, Clim. Past, 10, 21–39, https://doi.org/10.5194/cp-10-21-2014, 2014.
Wilmshurst, J. M. and McGlone, M. S.: Origin of pollen and spores in surface lake sediments: comparison of modern palynomorph assemblages in moss cushions, surface soils and surface lake sediments, Rev. Palaeobot. Palynol., 136, 1–15, https://doi.org/10.1016/j.revpalbo.2005.03.007, 2005.
Yao, T., Masson-Delmotte, V., Gao, J., Yu, W., Yang, X., Risi, C., Sturm, C., Werner, M., Zhao, H., He, Y., Ren, W., Tian, L., Shi, C., and Hou, S.: A review of climatic controls on δ18O in precipitation over the Tibetan Plateau: observations and simulations, Rev. Geophys., 51, 525–548, https://doi.org/10.1002/rog.20023, 2013.
Zhang, E., Chang, J., Shulmeister, J., Langdon, P., Sun, W., Cao, Y., Yang, X., and Shen, J.: Summer temperature fluctuations in Southwestern China during the end of the LGM and the last deglaciation, Earth Planet. Sc. Lett., 509, 78–87, https://doi.org/10.1016/j.epsl.2018.12.024, 2019.
Zhao, Y., Xu, Q., Huang, X., Guo, X., and Tao, S.: Differences of modern pollen assemblages from lake sediments and surface soils in arid and semi-arid China and their significance for pollen-based quantitative climate reconstruction, Rev. Palaeobot. Palynol., 156, 519–524, https://doi.org/10.1016/j.revpalbo.2009.05.001, 2009.
Zheng, Z., Wei, J., Huang, K., Xu, Q., Lu, H., Tarasov, P., Luo, C., Beaudouin, C., Deng, Y., Pan, A., Zheng, Y., Luo, Y., Nakagawa, T., Li, C., Yang, S., Peng, H., and Cheddadi, R.: East Asian pollen database: modern pollen distribution and its quantitative relationship with vegetation and climate, J. Biogeogr., 41, 1819–1832, https://doi.org/10.1111/jbi.12361, 2014.
- Abstract
- Introduction
- Study area
- Materials and methods
- Pollen data and relations to climate factors
- Pollen–climate transfer function construction and application
- Data availability
- Summary
- Author contributions
- Competing interests
- Disclaimer
- Acknowledgements
- Financial support
- Review statement
- References