the Creative Commons Attribution 4.0 License.
the Creative Commons Attribution 4.0 License.
 | 28 Jun 2024
Physical, social, and biological attributes for improved understanding and prediction of wildfires: FPA FOD-Attributes dataset
Yavar Pourmohamad
John T. Abatzoglou
Erin J. Belval
Erica Fleishman
Karen Short
Matthew C. Reeves
Nicholas Nauslar
Philip E. Higuera
Eric Henderson
Sawyer Ball
Amir AghaKouchak
Jeffrey P. Prestemon
Julia Olszewski
Mojtaba Sadegh
Wildfires are increasingly impacting social and environmental systems in the United States (US). The ability to mitigate the adverse effects of wildfires increases with understanding of the social, physical, and biological conditions that co-occurred with or caused the wildfire ignitions and contributed to the wildfire impacts. To this end, we developed the FPA FOD-Attributes dataset, which augments the sixth version of the Fire Program Analysis Fire-Occurrence Database (FPA FOD v6) with nearly 270 attributes that coincide with the date and location of each wildfire ignition in the US. FPA FOD v6 contains information on location, jurisdiction, discovery time, cause, and final size of wildfires in the US between 1992 and 2020 . For each wildfire, we added physical (e.g., weather, climate, topography, and infrastructure), biological (e.g., land cover and normalized difference vegetation index), social (e.g., population density and social vulnerability index), and administrative (e.g., national and regional preparedness level and jurisdiction) attributes. This publicly available dataset can be used to answer numerous questions about the covariates associated with human- and lightning-caused wildfires. Furthermore, the FPA FOD-Attributes dataset can support descriptive, diagnostic, predictive, and prescriptive wildfire analytics, including the development of machine learning models. The FPA FOD-Attributes dataset is available at https://doi.org/10.5281/zenodo.8381129 (Pourmohamad et al., 2023).
- Article
(2917 KB) - Full-text XML
-
Supplement
(2996 KB) - BibTeX
- EndNote


Wildfire (hereafter “fire”) hazards have increased across many regions of the world in recent decades, increasing the burden on fire prevention and suppression efforts (Alizadeh et al., 2021; Modaresi Rad et al., 2023; Rad et al., 2023). Climatic changes in the past several decades have generally decreased the fire season moisture content of living and dead vegetation, lengthened the fire season, and contributed to a marked increase in the number of critical fire danger days across much of the United States (US), with distinct geographical and seasonal trends and patterns (Westerling, 2016; Dennison et al., 2014; Bowman et al., 2011; Alizadeh et al., 2023). These changes have overlapped with the impacts of decade-long fire suppression policies in the US that have resulted in anthropogenic fire deficits and increased fuel loads in many regions, especially low-elevation forests in the western US (Bowman et al., 2009). Human-caused ignitions compound the fire burden, particularly near the wildland–urban interface (WUI), where wildland areas intermingle with human settlements (Stephens et al., 2013; Wildland Fire Executive Council, 2013). Moreover, increases in the area and density of human settlement and infrastructure in the WUI have further increased exposure to fire hazards across the US (Scott et al., 2012). The intersection of changes in the number and timing of ignitions and changing environmental conditions has resulted in several fires that have caused substantial loss of life (e.g., Miller and Ager, 2012).
Studies have focused on understanding the patterns and drivers of human-caused ignitions, given the potential for reducing the number of such ignitions and the negative impacts associated with the resulting fires, particularly near the WUI (Short, 2014; Balch et al., 2017). The primary factors that are often included in models of human-caused ignitions are social and economic (e.g., demographics), environmental (e.g., vegetation, meteorology, and topography), anthropogenic (e.g., land ownership and distance to roads), and timing metrics (e.g., holidays and weekends) (Short, 2022). Similarly, advances in the predictive understanding of lightning-ignited fires have improved the speed and effectiveness of suppression responses (Ronchi et al., 2017; McGee et al., 2015). Fuel moisture (Viegas et al., 1992; Meisner et al., 1993; Pineda et al., 2022), vegetation type and condition (Dissing and Verbyla, 2003; Wierzchowski et al., 2002), weather (Wierzchowski et al., 2002; Hély et al., 2001), pre-fire-season snowpack (Chen and Jin, 2022), duration of lightning contact with fuel (Fuquay et al., 1979; Latham and Williams, 2001), number of lightning strikes (Flannigan and Wotton, 1991), and topography (Hessilt et al., 2022) are the main cited factors that affect natural fires. However, the confluence of factors that shape spatial and temporal patterns of ignitions, especially human-caused ignitions, confounds efforts to predict, prevent, and prepare for the impacts of fires.
The most comprehensive source of georeferenced fire ignition data in the US is the Fire Program Analysis Fire-Occurrence Database (Short, 2014), which aggregates fire reports from federal, state, and local entities with fire protection and reporting responsibilities. All fires in the FPA FOD database are referenced to a discovery date, final fire size (area within the fire perimeter), and a point location at least as precise as a Public Land Survey System section (i.e., 1 square mile, or 2.6 km2, grid). Most fire records are also associated with attributes including fire name, discovery time, reporting agency information, ignition cause, and containment date and time. The 13 cause classes, as determined by the reporting agency, are as follows: natural; recreation and ceremony; equipment and vehicle use; debris and open burning; smoking; arson, or incendiarism; railroad operations and maintenance; misuse of fire by a minor; power generation, transmission, or distribution; fireworks; firearms and explosives use; other causes; and missing data, not specified, or undetermined (Short, 2021). FPA FOD also includes incident identification numbers that can be referenced to other fire databases, such as Monitoring Trends in Burn Severity (Eidenshink et al., 2007) and the All-hazards dataset (St. Denis et al., 2023). The sixth version of FPA FOD includes more than 2.3×10⁶ fire records that correspond to a total of more than 72.8×10⁶ ha (180×106 acres) burned from 1992 to 2020 across the US (Short, 2022).
To enable stronger inferences about factors that affect and predict fire ignitions and outcomes, we augmented the sixth version of FPA FOD (FPA FOD v6) with 267 attributes associated with the date and location of ignition across the US. Major classes of these attributes encompass climate, weather and fire danger, topography, land cover and vegetation, jurisdiction and management, infrastructure, and social context. Although the attributes are associated with the date and point of ignition, we also included summary statistics within a temporal buffer (e.g., 5 d centered on the ignition date) and a spatial buffer (e.g., 1 km) around the ignition point. Additionally, we included monthly, satellite-derived vegetation indices during the 12 months prior to the ignition. The resultant FPA FOD-Attributes dataset includes a total of 310 attributes associated with more than 2.3×10⁶ fire incidents across the US from 1992 to 2020. This rich, tabular dataset can be used in a variety of hypothesis-driven or data-exploration applications.
2.1 Data sources
The FPA FOD-Attributes dataset brings together 267 attributes associated with fire ignitions from 24 data sources (Tables 1, S1). The accuracy, precision, and uncertainty of each attribute, including spatial and temporal resolution, depends on the source data. Availability of attributes for individual fire incidents also depends on the spatial and temporal coverage of the source data. Table 1 lists general categories of attributes, their resolution and coverage, and their sources. Table S1 lists more detail about individual attributes that are included in the FPA FOD-Attributes dataset.
Source data were either in raster or vector/point formats. For raster data, we selected the attribute value of the grid cell that contained the ignition point recorded in the FPA FOD dataset. Similarly, for data in vector/shapefile format, we selected the attribute value of the area associated with the ignition point. When distance from the fire location to a vector was of interest, we estimated the nearest perpendicular distance. We conducted all analyses with the following Python libraries: xarray and GDAL (raster data) or GeoPandas (vector data). Source code is provided along with the FPA FOD-Attributes dataset to support future use (see the “Code availability” and “Data availability” sections).
Table 1Variables in the FPA FOD-Attributes dataset and their data sources. See Table S1 for a detailed description of all variables and sources.
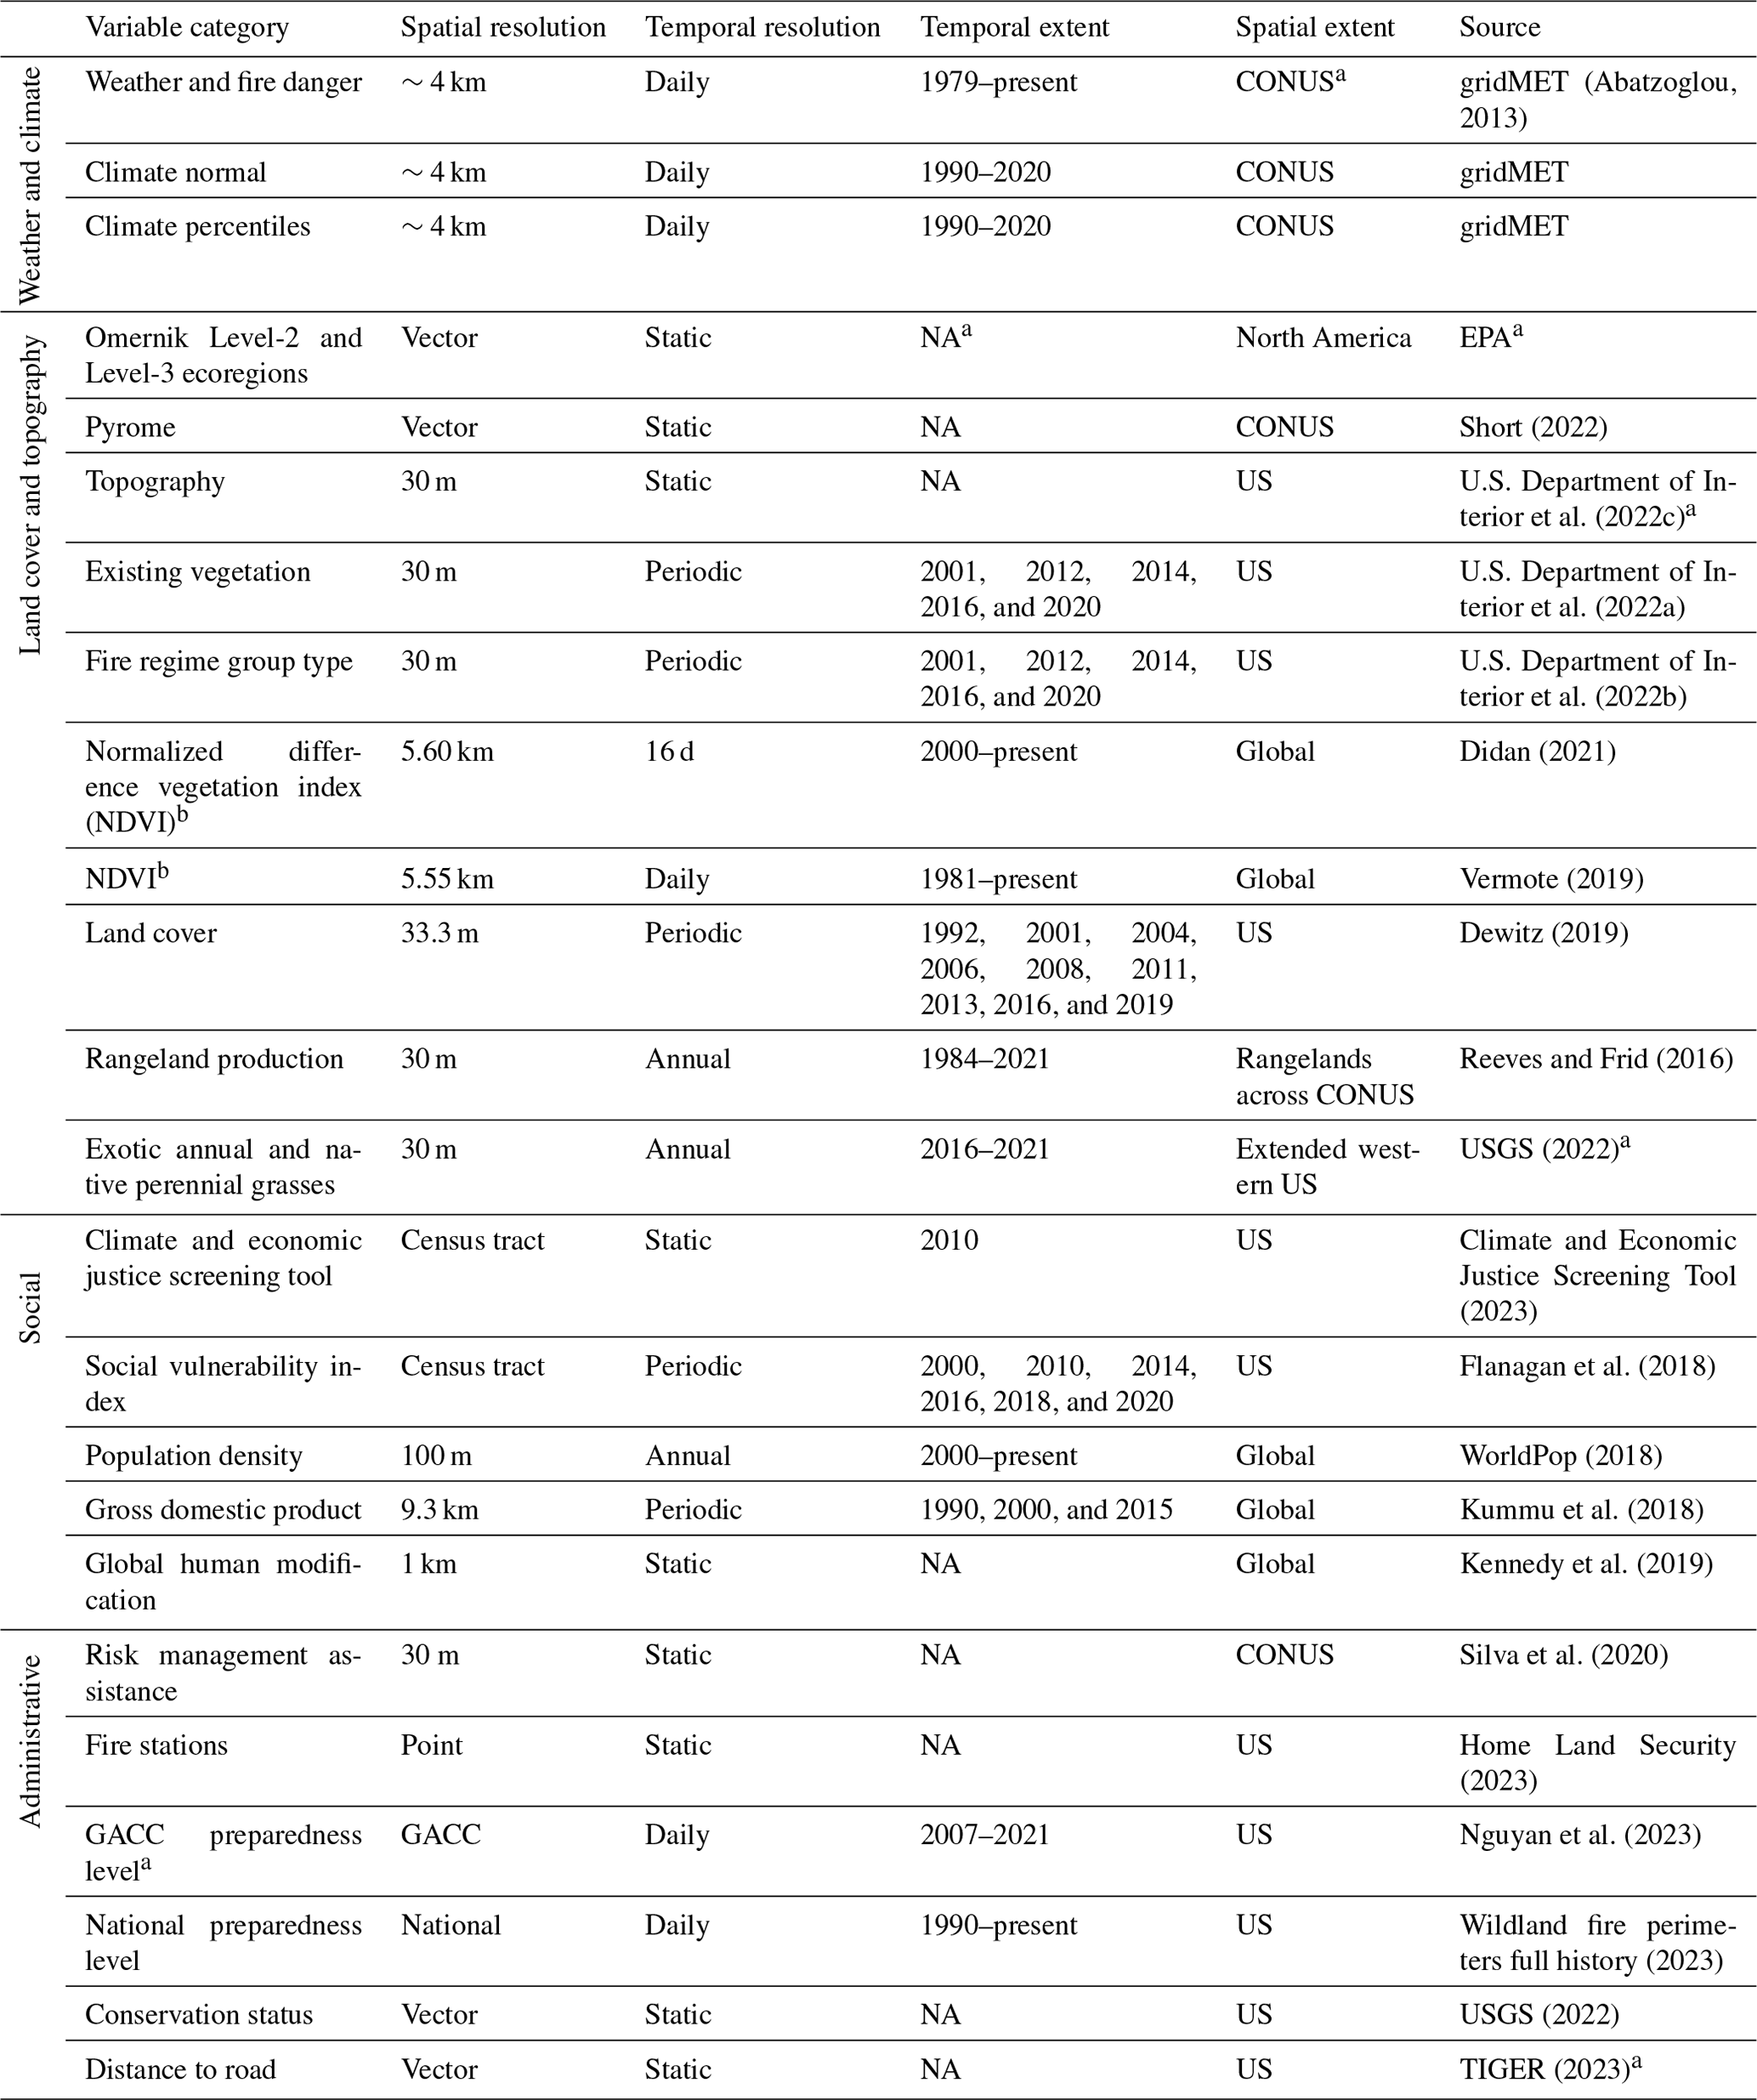
a The abbreviations/acronyms used in the table are as follows: EPA – US Environmental Protection Agency; USGS – US Geological Survey; GACC – Geographic Area Coordination Center; TIGER – Topologically Integrated Geographic Encoding and Referencing; NA – not applicable; CONUS – contiguous United States.
b The NDVI from Didan (2021) provides monthly mean vegetation health information for the 12 months prior to fire, whereas Vermote (2019) offers the NDVI value on the day prior to the fire start date as well as the daily mean, max, and min NDVI for each month within 1 year prior to fire.
2.2 Data compilation
Here, we briefly discuss the data compilation process and assumptions. Table S1 provides a detailed description of the variables, their units, and their sources. Unless otherwise specified, the FPA FOD-Attributes dataset provides a complete record of values of each variable for all fire events from 1992 to 2020.
2.2.1 Weather and climate
Our main source of weather and climate data was gridMET (Abatzoglou, 2013), which merged gridded climate and reanalysis data with gauge-based precipitation data to provide spatially and temporally complete, high-resolution (4 km) gridded data on surface meteorological variables. gridMET also provides daily fire danger indices based on Fuel Model G from the National Fire Danger Rating System 77 (Cohen and Deeming, 1985). gridMET is widely used in fire-related studies (Alizadeh et al., 2021, 2023). The weather and climate data collated in this work are outlined in the following.
Weather and fire danger indices
Attributes associated with each fire ignition in the FPA FOD-Attributes dataset include daily precipitation, maximum and minimum temperature (2 m above ground), relative humidity, specific humidity, wind velocity (10 m above ground), surface downward shortwave radiation, reference evapotranspiration, and vapor pressure deficit; all data are for the date and point of fire ignition. We also derived the following fire danger indices for the date and point of fire ignition: 100 and 1000 h dead-fuel moisture, energy release component (ERC), and burning index (BI). ERC and BI are fuel model dependent and, hence, are aligned with a single-fuel model (Fuel Model G – dense coniferous forest fuel type), but 100 and 1000 h dead-fuel moisture variables are fuel model agnostic. Additionally, we derived maximum, minimum, and average values of these variables within a 5 d window centered on the fire ignition date (i.e., from 2 d prior to 2 d after the ignition date). This arbitrary selection is to allow additional analyses, especially for fires associated with uncertainty in detection/reporting of start dates.
Climate normals
A climate normal is defined as the long-term (1990–2020) average of daily surface meteorological variables. Climate normals characterize average weather conditions. The attributes include climate normals of all meteorological and fire danger indices listed above for the location and day of year of fire ignition.
Climate percentiles
We calculated the percentile range for meteorological and fire danger indices for the location and the day of year of fire ignition, relative to values from the same day of the year from 1979 to 2020. The percentile range enables the user to compare the attribute with long-term records. We report the data in the following discrete percentile ranges: <10th, 10th–30th, 30th–50th, 50th–70th, 70–90th, and >90th. Depending on the attribute, a higher percentile range might be associated with higher (e.g., ERC) or lower (e.g., 1000 h dead-fuel moisture) fire danger.
2.2.2 Land cover and topography
We used data from the US Forest Service (USFS), US Geological Survey (USGS), LANDFIRE, National Oceanic and Atmospheric Administration (NOAA), National Aeronautics and Space Administration (NASA), and US Environmental Protection Agency (EPA) to derive attributes associated with land surface conditions at the location and time of fire ignition. We provide multiple land cover data sources to allow users to select the source that best suits their needs.
Given the potential biases in reporting of the ignition location, statistics of variables within a 1 km radius around the ignition location, especially variables derived from 30 m or other fine-resolution products, are likely a more accurate representation of the ground conditions than values specifically at the point of ignition. For fires that burn large areas, note that land cover can vary widely and, thus, may differ from that at the point of ignition.
Omernik ecoregions
Ecoregions denote areas with similar biotic and abiotic attributes (Omernik, 1987). Ecoregion shapefiles (i.e., vector data) are available at four levels: 15 Level-1 ecoregions, 50 Level-2 ecoregions, and 182 Level-3 ecoregions across North America, and 967 Level-4 ecoregions in the CONUS. Many fire-related studies used Level-2 or Level-3 ecoregions (Dennison et al., 2014; Alizadeh et al., 2021, 2023), and we provide these two ecoregion classifications at the ignition point of each fire.
Pyrome
Pyromes are regions with relatively homogeneous contemporary fire regimes (e.g., start and end date of fire season, frequency of fire, and modality and large-fire size); 128 pyromes have been identified in CONUS (Short et al., 2020). We provide the pyrome associated with the ignition point of each fire.
Topography
Topography affects the likelihood of fire ignition and fire behavior. We derived elevation, slope, aspect, the topographic position index (TPI), and the terrain ruggedness index (TRI). Positive and negative TPI values represent locations that are higher and lower, respectively, than their neighboring grid cells (Weiss, 2001). TRI indicates the magnitude of elevation change between neighboring grid cells (Riley et al., 1999). We derived elevation (above mean sea level), slope, and aspect from LANDFIRE products (30 m resolution). We derived TPI and TRI from the LANDFIRE digital elevation model with the GDAL library in Python. The FPA FOD-Attributes dataset includes these variables at the fire ignition point as well as averaged across a 1 km radius around the fire ignition point.
Existing vegetation
We used existing vegetation cover (EVC), existing vegetation height (EVH), and existing vegetation type (EVT) data from LANDFIRE (30 m resolution) to represent vegetation as close as possible to the point and date of fire ignition. EVC, EVH, and EVT are available for 2001, 2012, 2014, 2016, and 2020. For each fire ignition, we used the most recent prior data product. For all fires prior to 2001, we used the 2001 product. We used the codes for vegetation variables as in the original dataset (https://landfire.gov/vegetation.php, last access: 16 October 2023). We also report the most frequently occurring EVC, EVH, and EVT classification within a 1 km radius around each fire ignition point.
Fire regime group
Fire regime group (FRG) characterizes the presumed historical fire regime in a given location. We report the most frequently occurring FRG within a 1 km radius around each ignition point, for the prior year closest to the date of ignition. Data on FRG are available through LANDFIRE for 2001, 2012, 2014, and 2016. We used the 2001 product for all ignitions prior to 2001. FRG codes in FPA FOD-Attributes correspond to those in LANDFIRE (https://landfire.gov/CSV/FRG.csv, last access: 16 October 2023).
Normalized difference vegetation index (NDVI) and enhanced vegetation index (EVI) from NASA's MODIS sensor
The NDVI is an index of vegetation greenness (Rouse et al., 1974) that is closely related to primary productivity and leaf cover. The EVI is a similar index that is generally more accurate in regions with high vegetation biomass (Huete et al., 2002). We obtained the NDVI and EVI from NASA's MOD13C2 v6.1 product (5.6 km resolution), which provides monthly NDVI and EVI indices from 2000 to present. We derived the NDVI and EVI at the point of ignition in the month prior to the ignition date and the 11 previous months. The FPA FOD-Attributes dataset does not include the NDVI and EVI values for ignitions prior to 2000.
NDVI from NOAA
We also obtained the NDVI from NOAA's daily gridded NDVI product (5.55 km resolution), which was derived from the Surface Reflectance Climate Data Record based on Advanced Very High Resolution Radiometer (AVHRR) and Visible Infrared Imaging Radiometer Suite (VIIRS) images (Vermote, 2019). We acquired the NDVI value associated with the location of ignition on the day prior to the fire discovery date. FPA FOD-Attributes also includes monthly mean, maximum, and minimum NDVI for the 12 months prior to the ignition date.
Land cover
We used the National Land Cover Database (NLCD) to derive the most recent prior land cover type associated with each point and date of fire ignition. These data are similar to EVC, and users may opt to select one or the other. NLCD data are available for 1992, 2001, 2004, 2006, 2008, 2011, 2013, 2016, and 2019. Land cover classes and the method used to classify land cover from Landsat images differed between 1992 and all other years (Dewitz, 2019). The attributes include land cover type at the point of ignition and the three land cover types with the greatest percentage of cover within a 1 km radius around the ignition point.
Rangeland production
The rangeland production metric quantifies annual plant biomass production on 268×106 ha (662×106 acres) of rangeland across the CONUS from 1984 to present at a 30 m resolution. We derived rangeland production values at the ignition point and within a 1 km radius around the ignition point for the year of fire. Values of rangeland production are only provided for ignitions within the domain of the Rangeland Production Monitoring Service (Reeves et al., 2021).
Exotic annual and native perennial grasses
We used annual fractional cover maps (30 m resolution) for (1) a group of 17 exotic annual grasses, (2) cheatgrass (Bromus tectorum), (3) medusahead (Taeniatherum caput-medusae), and (4) Sandberg bluegrass (Poa secunda) from 2016 to 2021 (USGS, 2022). These data are generated from on-the-ground observations by the US Bureau of Land Management and application of a machine learning model to Harmonized Landsat and Sentinel images (Dahal et al., 2022). The FPA FOD-Attributes dataset provides the percentage cover for each of the four abovementioned categories of grasses on the date and for the location of ignition from 2016 to 2020, within the spatial domain of the source data (extended western US).
2.2.3 Social and economic context
We used a variety of government and academic data sources to derive social and economic attributes associated with the location of fire ignitions. Many of these sources are based on the US or, in some cases, global census data.
Climate and economic justice screening tool
We used the US Council on Environmental Quality's Climate and Economic Justice Screening Tool (CEJST) v.0 to derive metrics associated with community-level burdens related to climate change, energy, health, housing, legacy pollution, transportation, water and wastewater, and workforce development. Because values of CEJST's 107 variables are currently static, we assigned values to all fire ignitions in the entire period of record on the basis of location. CEJST is derived from 2010 US census data, and values of variables are available at the tract level. CEJST classifies a community as disadvantaged if it is “(1) at or above the threshold for one or more environmental, climate, or other burdens, and (2) at or above the threshold for an associated socioeconomic burden” (https://screeningtool.geoplatform.gov/, last access: 10 December 2023).
Social vulnerability index
We used the US Centers for Disease Control and Prevention's nested hierarchical social vulnerability index (SVI), which provides a measure of vulnerability for each census tract in terms of overall vulnerability, four general dimensions of vulnerability (socioeconomic status, household composition and disability, housing type and transportation, and minority status and language), and 15 subdimensions of vulnerability (e.g., income, age, minority, and no vehicles). Values of the SVI range from 0 (low vulnerability) to 1 (high vulnerability). SVI estimates are available for 2000, 2010, 2014, 2016, 2018, and 2020. The FPA FOD-Attributes dataset includes the overall SVI value and values of the dimensions and subdimensions of vulnerability for the location and year of each fire ignition. We used the most recent SVI prior to the ignition date. We assigned vulnerability attributes to ignitions prior to 2000 from the 2000 SVI data.
Population density
We obtained population density and its average within a 1 km radius around the point of ignition from the WorldPop dataset (Tatem, 2017), which provides annual global population data from 2000 to present at a 100 m resolution. We did not assign a population density value to fire ignitions prior to 2000.
Gross domestic product
We derived the per capita gross domestic product (GDP) at the location of each ignition in the most recent year prior to the ignition date. Our global data source (Kummu et al., 2018) provides subnational GDP per capita for 1990, 2000, and 2015 at a 5 arcmin resolution.
Global human modification
We assigned a static global human modification (GHM) index, which indicates the cumulative human modification of lands, to each fire ignition on the basis of its location. We derived GHM values from data provided by the NASA Socioeconomic Data and Applications Center (1 km resolution at the global level), which were originally developed by Kennedy et al. (2019).
2.2.4 Administrative
We used a variety of data sources, mostly from the US government, to acquire attributes associated with management. These sources are outlined in the following.
Risk management assistance program
We used the two static, raster-formatted risk maps provided by the Risk Management Assistance program to acquire evacuation time from the fire ignition location to a medical care facility and the suppression difficulty index (SDI; Silva et al., 2020) for the fire ignition point. The SDI is a measure of relative difficulty of fire control given topography, fuels, expected severe weather fire behavior, firefighter line production rates in various vegetation types, and accessibility (e.g., distance from roads or trails).
Fire stations
We derived the number of fire stations within a 1, 5, 10, and 20 km radius around each fire ignition point. The location of fire stations comes from the static Homeland Infrastructure Foundation-Level Data.
Geographic area coordination center (GACC) preparedness level
The nine GACCs in CONUS also have preparedness levels that are based on the regional availability of wildland firefighting resources and fire activity. We obtained the GACC preparedness level for all fire ignitions over the period from 2007 to 2020 (Nguyan et al., 2023). Data are not available for fire ignitions prior to 2007.
National preparedness level (NPL)
The national preparedness level indicates suppression resource availability for emerging fires on the basis of fuel and weather conditions, current fire activity, and resource commitments; there is a single NPL reflecting the entire nation. We acquired the NPL associated with the date of all fire ignitions from the National Interagency Fire Center (NIFC). NPLs are determined by the National Multi-Agency Coordination Group or the National Interagency Coordination Center (NICC) daily during the fire season and are published by NICC as a part of the daily Incident Management Situation Report (IMSR; Nguyan et al., 2023).
Conservation status
The Gap Analysis Project (GAP) is a USGS-based program that evaluates whether common species of plants and animals are adequately protected and tracks the conservation status of lands and waters nationwide. From GAP's vector-based static data, we obtained management jurisdiction and agency (e.g., US Fish and Wildlife Service), land management designation (e.g., Wilderness Area, National Recreation Area), and GAP status code and priority (extent to which conservation of biological diversity is prioritized) for all fire ignition points.
Distance to road
We used the vector-based, static Topologically Integrated Geographic Encoding and Referencing (TIGER) database to derive the minimum distance (perpendicular) from the point of fire ignition to primary, secondary, local, and other roads as well as to all-terrain vehicle and non-motorized vehicle trails.
The FPA FOD-Attributes dataset is a derivative dataset; hence, the accuracy, precision, and uncertainty of the fire attributes reflect those of the source data. We selected reliable source data to ensure the quality of attribute data associated with each fire. Our validation process was focused on ensuring the attributes are consistent with the source. We followed four steps to validate our data:
-
manual comparison of attribute values for selected fires from the source data to those in the FPA FOD-Attributes dataset;
-
comparison of the attributes in the FPA FOD-Attributes dataset and another published study;
-
investigation of the temporal evolution of attributes associated with selected fires and those in the FPA FOD-Attributes dataset;
-
comparison of attributes from the FPA FOD-Attributes dataset with those reported by the news media.
3.1 Manual comparison
We compared values of attributes of 100 randomly selected fires that spanned the spatial and temporal domain from the FPA FOD-Attributes dataset and manually extracted source data in QGIS (raster- and vector-based data) or Excel (tabular data). We assumed that manual comparison would detect any systematic errors in the Python code used to develop the FPA FOD-Attributes dataset. All attribute values for all selected fire ignitions matched those of the source data.
3.2 Comparison with the literature
We compared the meteorological and fire danger indices associated with seven fires in Southern California listed in Table S6 of Khorshidi et al. (2020) with those in the FPA FOD-Attributes dataset. Because Khorshidi et al. (2020) also used gridMET, we expected the two sets of values to match. With the exception of rounding errors, values of vapor pressure deficit (VPD), 100 and 1000 h dead-fuel moisture (FM100 and FM1000, respectively), and burning index (BI) from the two sources matched (Fig. 1, Table S2).
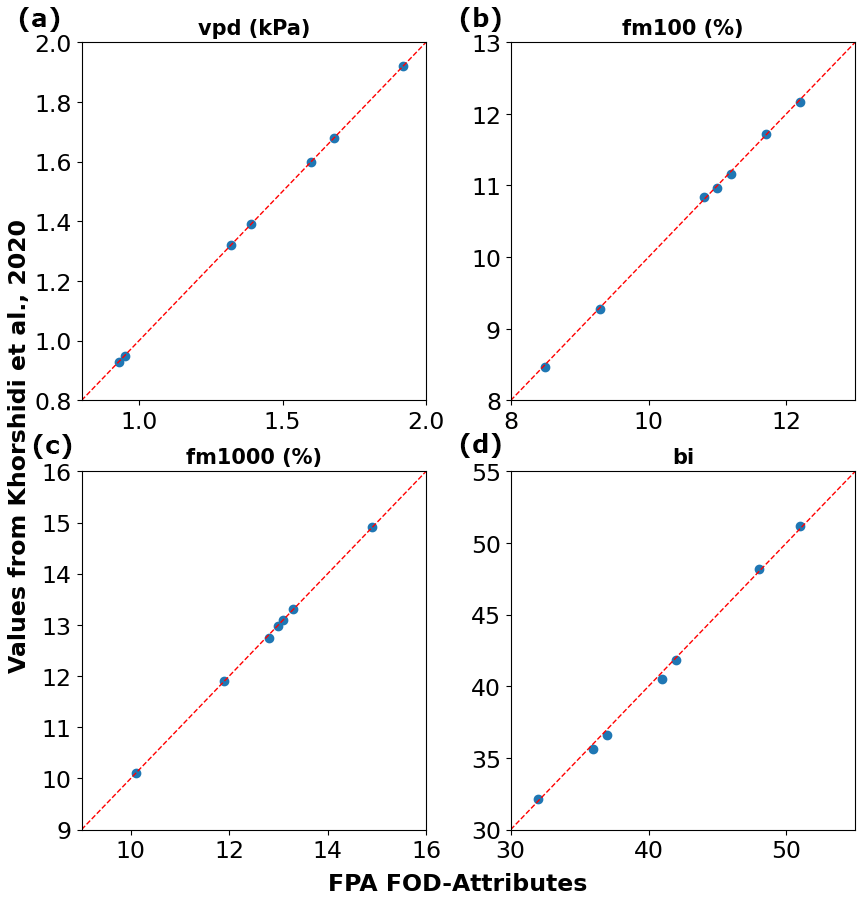
Figure 1Comparison of values of meteorological and fire danger indices associated with seven fires from FPA FOD-Attributes and Khorshidi et al. (2020).
3.3 Temporal evolution of fire attributes
We analyzed the temporal evolution of meteorological and fire danger indices at the point of ignition between the fire discovery and containment dates of seven high-impact fires (Table S3, Figs. 2 and S1–S6) distributed across CONUS. The FPA FOD-Attributes dataset provides these attributes on the ignition date and in a 5 d window centered around the ignition date. Here, we present the results for the Camp Fire, which started on 8 November 2018, near Paradise, California. This fire claimed 85 lives and destroyed more than 18 000 structures. The Camp Fire was ignited by power transmission lines in the coniferous forests of Butte County, California, and spread quickly due to strong easterly downslope winds. The FPA FOD-Attributes dataset indicates that the fire was ignited in an evergreen forest (NLCD classification) and that the land cover within a 1 km radius was 50 % evergreen forest, 41 % shrub/scrub, and 6 % “developed, open space”. The three most prevalent existing vegetation heights within a 1 km radius of the ignition point were 18 m (trees; 43 %), 38 m (trees; 23 %), and 0.8 m (herbaceous plants; 9 % herb). These data match the official reports and news accounts of the fire (e.g., Maranghides et al., 2021, and references therein). The elevation of the fire ignition in the FPA FOD-Attributes dataset, 608 m, is consistent with the downslope spread of the fire from the ignition point toward the city of Paradise (elevation 542 m).
We extracted wind velocity (VS), VPD, FM100, FM1000, energy release component (ERC), and BI from late October to early December 2018 at the ignition point of the Camp Fire from gridMET and the FPA FOD-Attributes dataset. Values of the two sets of variables matched (Fig. 2). Furthermore, the evolution of meteorological and fire danger variables followed the known pattern: the Camp Fire started on a windy day (Fig. 2a, f) concurrent with dry vegetation (Fig. 2b–e), and it was contained by the first rainstorm of the water year on 25 November. The arrival of the storm decreased fire danger and increased fuel moisture (Fig. 2b–f).
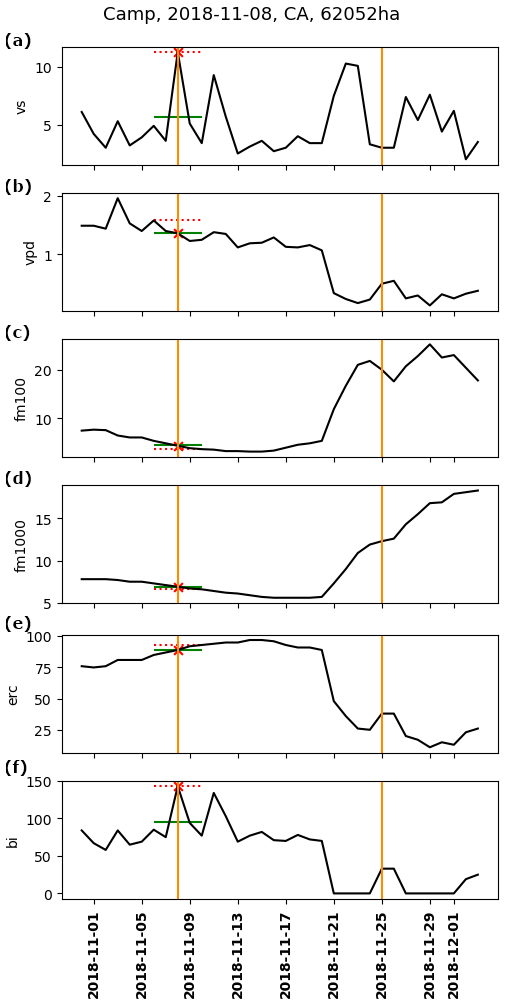
Figure 2Evolution of meteorological and fire danger indices from late October to early December 2018 at the ignition point of the Camp Fire. Fire discovery and containment dates are indicated with vertical orange lines, the attribute value at the date of ignition is indicated with red asterisks, and the attributes' 5 d average and maximum (VS, VPD, ERC, and BI) or minimum (FM100 and FM1000) values are indicated with green and red horizontal lines. VS: wind speed; VPD: vapor pressure deficit; ERC: energy release component; BI: burning index; FM100/FM1000: 100/1000 h dead-fuel moisture.
Figures S1–S6 show the evolution of meteorological and fire danger attributes associated with six additional fires across the CONUS, also providing evidence of the validity of the FPA FOD-Attributes dataset.
3.4 Comparison with media reports
We also compared the fire attributes from the FPA FOD-Attributes dataset with media accounts of two major fires, the Martin and East Troublesome fires. The 2018 Martin fire burned more than 168 680 ha of shrublands and grasslands in Paradise Valley, Nevada. High winds and high cover of cheatgrass are believed to have contributed to the quick spread of this fire (Rothberg, 2018). The FPA FOD-Attributes dataset indicated that the prevalent land cover (derived from NLCD) in a 1 km radius around the ignition point was shrub/scrub or grassland/herbaceous and that the majority of existing vegetation height (derived from LANDFIRE) was 0.3 m (herbaceous), 0.2 m (herbaceous), and 0.8 m (shrubs). Furthermore, land cover at the point of ignition included 21 % cheatgrass and 27 % other exotic annual grasses, and daily average wind speed was in the 70 %–90 % range of historical records for the day of the year, which is consistent with news reports (Rothberg, 2018). The FPA FOD-Attributes dataset indicates an elevation of 1415 m at the point of ignition, which is comparable to the Paradise Valley, Nevada, elevation of 1389 m.
The 2020 East Troublesome Fire burned 78 430 ha in the high elevations of the central Rocky Mountains of Colorado (above 2740 m). Low relative humidity and high winds enabled the fire to spread rapidly through coniferous forest, kill two people, and destroy more than 400 structures (Colorado Encyclopedia, 2023). The FPA FOD-Attributes dataset indicates that VPD and VS on the date of ignition were high relative to their historical range on the same day of the year (80 %–90 % and >90 %, respectively) and that the fire ignited at an elevation of 2757 m. Land cover (derived from NLCD) within a 1 km radius around the ignition point included evergreen forest (61 %), shrub/scrub (32 %), and deciduous forest (6 %). Cheatgrass is uncommon at such high elevations, and the FPA FOD-Attributes dataset did not assign any cheatgrass cover to the ignition point. These metrics are consistent with the news records.
Trends and interannual variability in the number of wildfires are apparent over the 1992–2020 time period covered by the FPA FOD dataset. Human-caused fires increased, whereas lightning-ignited (hereafter “natural”) fires decreased (Fig. 3). Interannual variability in fire ignitions is partially explained by seasonal climate and weather conditions, for example, modulated through fuel receptiveness to ignitions and abundance of outdoor activities (Noonan-Wright et al., 2011; Finney et al., 2011). Trends are mainly attributable to fire prevention strategies and climatic changes (e.g., increases in the number of critical fire danger days) (Noonan-Wright et al., 2011; Khorshidi et al., 2020; Alizadeh et al., 2023). Importantly, fire ignitions have temporal and spatial structures, enabling the development of targeted fire prevention and response strategies (Douglas et al., 2001). Figure 4, for example, shows a clear spatial pattern in both human-caused and natural ignitions across the CONUS. Human-caused fires are close to human settlements and roads (which can be partially explained by reporting biases; Fig. 4a), whereas natural fires are associated with mountains in the western CONUS (Fig. 4b). Figures S7–S19 display the spatial distribution of ignitions associated with 13 specific fire causes (natural and subcategories of human-caused fires).
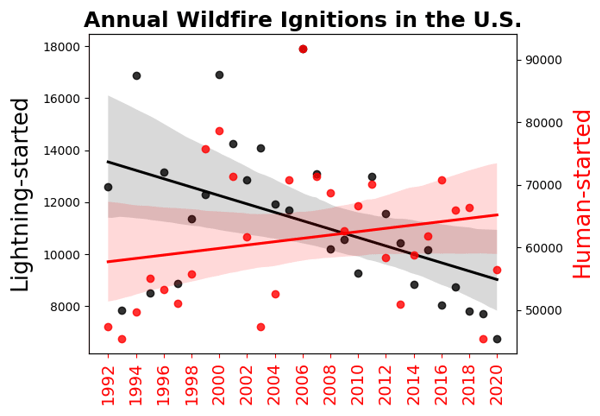
Figure 3Trends in the annual number of natural (denoted in black) and human-caused (denoted in red) fires in the contiguous US from 1992 to 2020.
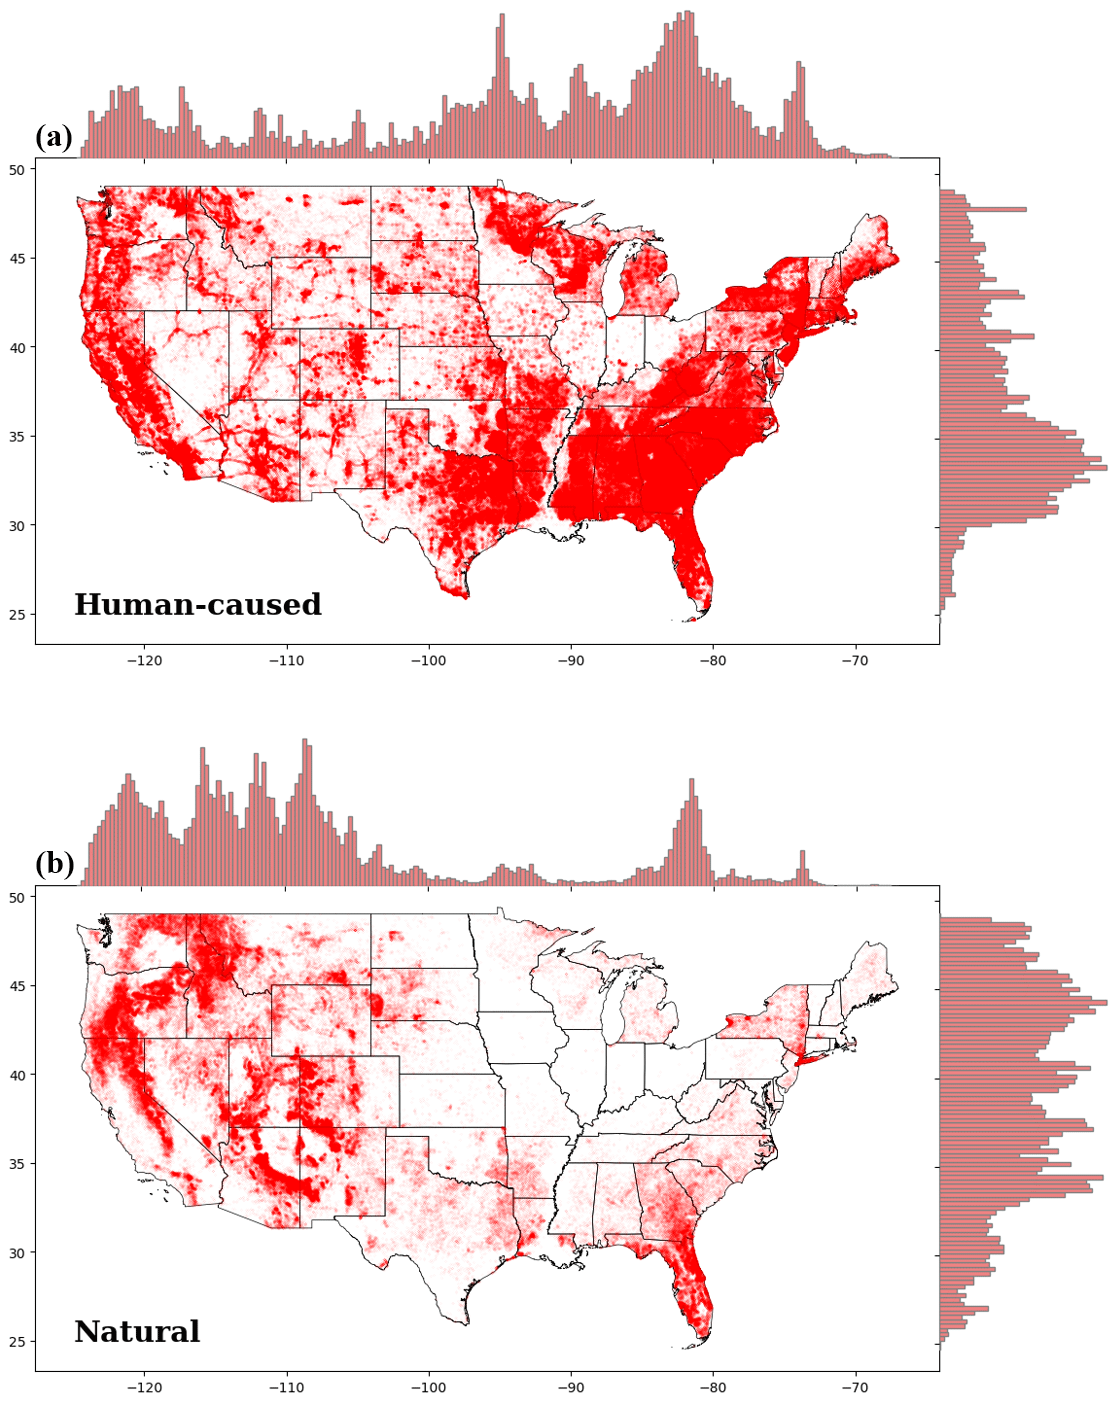
Figure 4Spatial distribution of human-caused and natural fire ignitions in the contiguous US from 1992 to 2020. Bars on the x and y axes are histograms of the longitudinal and latitudinal of ignitions, respectively.
We also visualized selected attributes associated with CONUS fires. Figure 5 shows the total number of fires from 1992 to 2020 in 0.5° grids across CONUS. We differentiated between small fires (less than 4 ha) and large fires (greater than or equal to 4 ha). A total of 89 % percent of fires were smaller than 4 ha, 59 % percent of all fires were smaller than 0.4 ha, and 97 % were smaller than 40 ha, with the latter two values accounting for 0.08 % and 2.28 % of total burned area across CONUS, respectively. The number of small fires (<4 ha) in the eastern US and California was greater than that elsewhere in the western US (Fig. 5a). The number of fires larger than 4 ha, however, was markedly greater in the western US, the Southern Great Plains, and Florida (Fig. 5b).
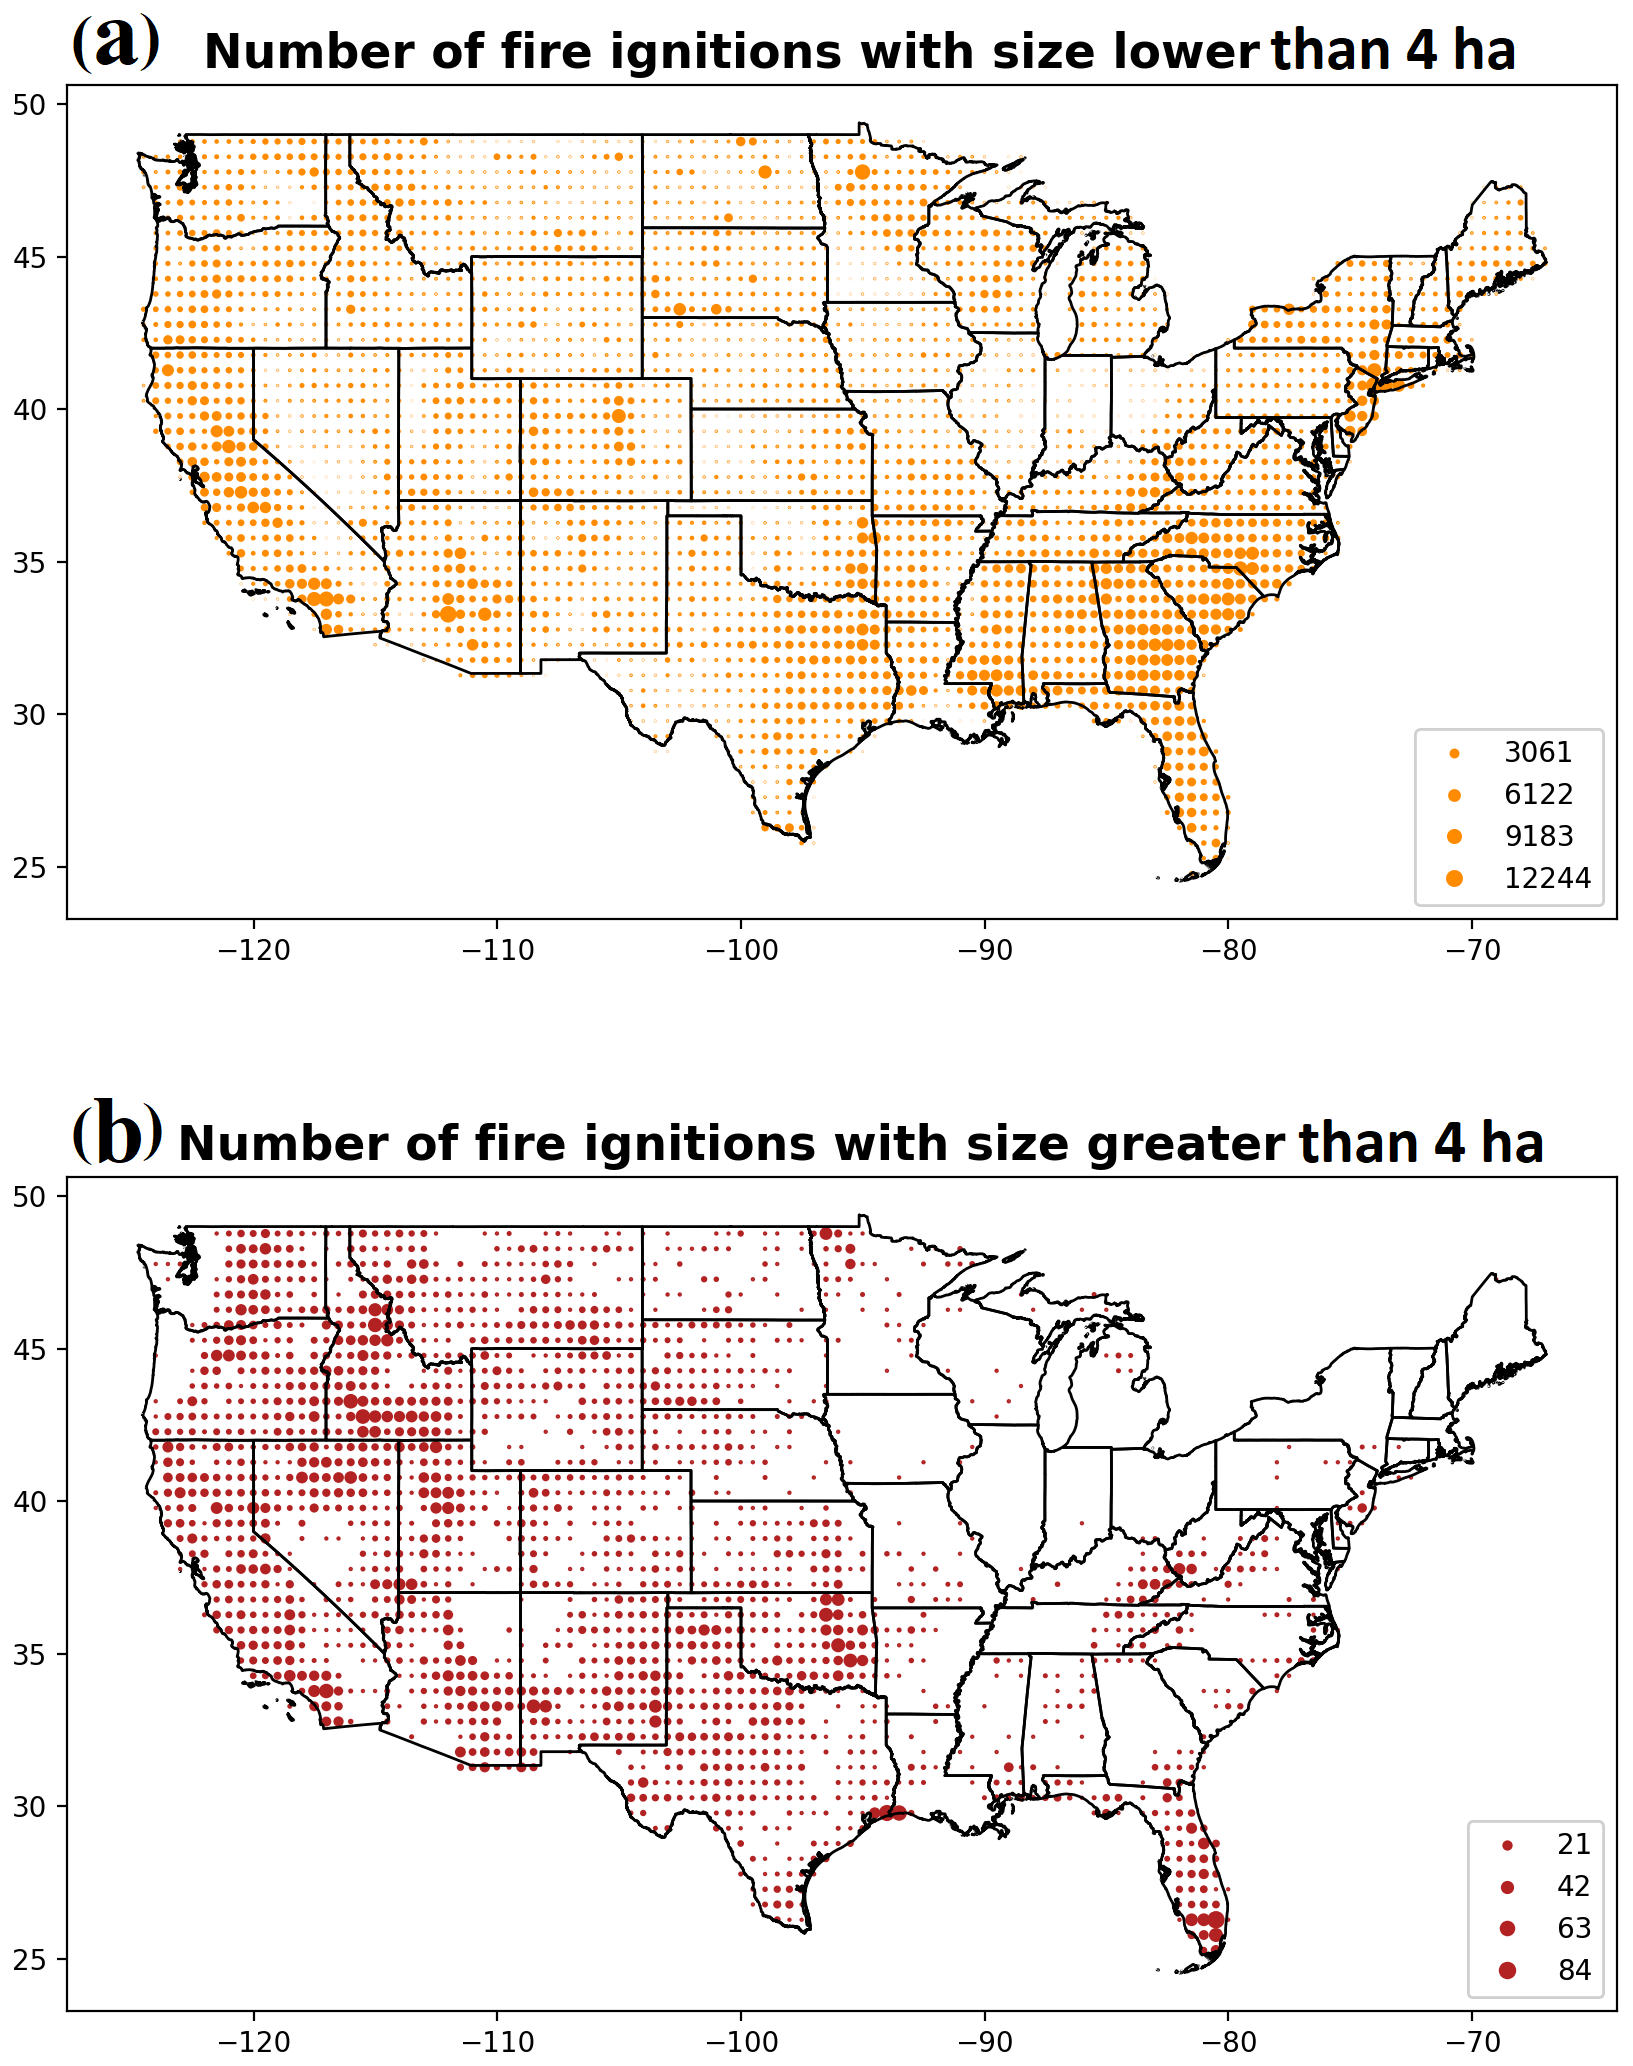
Figure 5Number of fires (a) less than 4 ha (10 acres) and (b) greater than or equal to 4 ha in 0.5° grid cells.
Small fires were associated with an average population density (2.35 people ha−1; Fig. 6a) that was an order of magnitude greater than that associated with large fires (0.24 people ha−1; Fig. 6b). Fires in California, the Front Range of Colorado, and Florida were associated with especially high population densities. In California, for example, small and large fires were associated with population densities of 3.88 and 1.04 people ha−1, respectively. Furthermore, the population density associated with human-caused fires was more than 4 times greater than that associated with natural fires (2.03 and 0.47 people ha−1, respectively).
Consistent with topography across CONUS, the average elevation of fires west of −102° longitude was 2146 m, compared with 1194 m to the east. The average elevations of the ignition points of natural fires were markedly higher (1863 m) than those of human-caused fires (571 m).
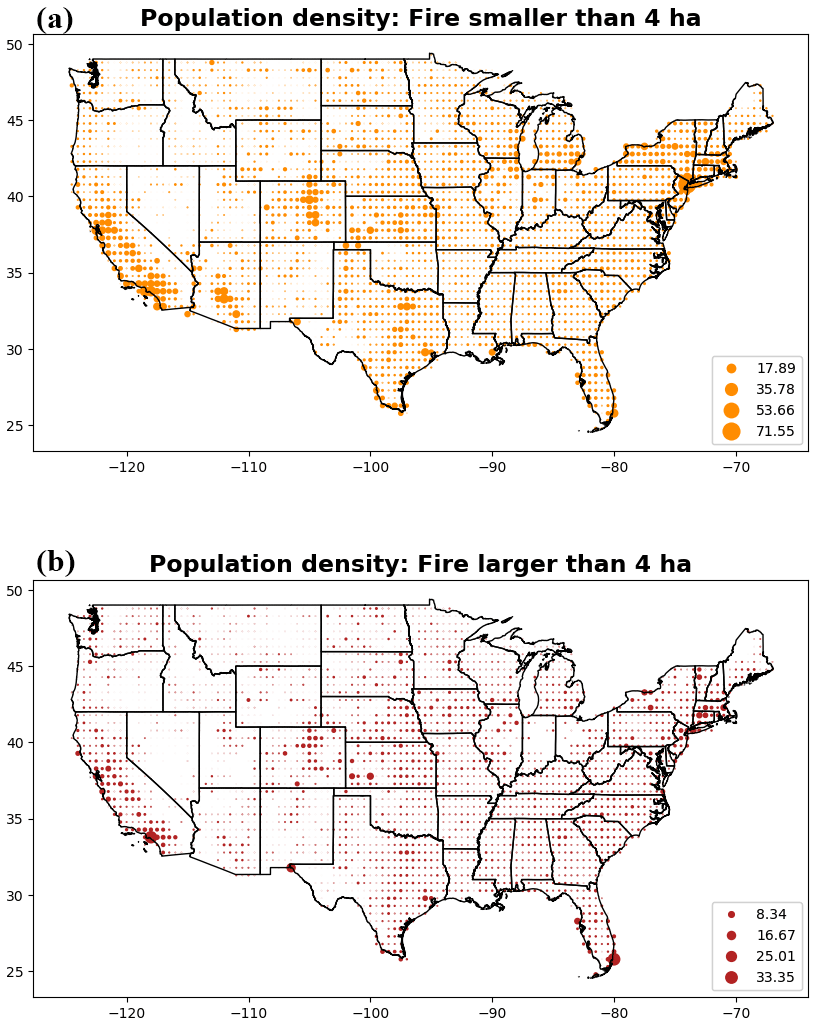
Figure 6Average population density (people per hectare) associated with fires that burned less than 4 ha (a) and more than or equal to 4 ha (b) in each 0.5° grid cell.
Values of several attributes of fires varied along a longitudinal gradient across CONUS (Figs. 7, 8). For example, the ERC and minimum distance to the nearest road were markedly greater in the western US than in the eastern US. Human-caused fires were associated with a greater ERC (60 in the western and 34 in the eastern US) than natural fires (56 in the western and 29 in the eastern US). The minimum distance to the nearest road was much lower in the eastern compared with the western US, which is consistent with the eastern US's higher road density and percentage of human-caused fires. Minimum distance to the nearest road did not differ markedly between natural and human-caused fires (Fig. 7b), which likely reflects a reporting bias.
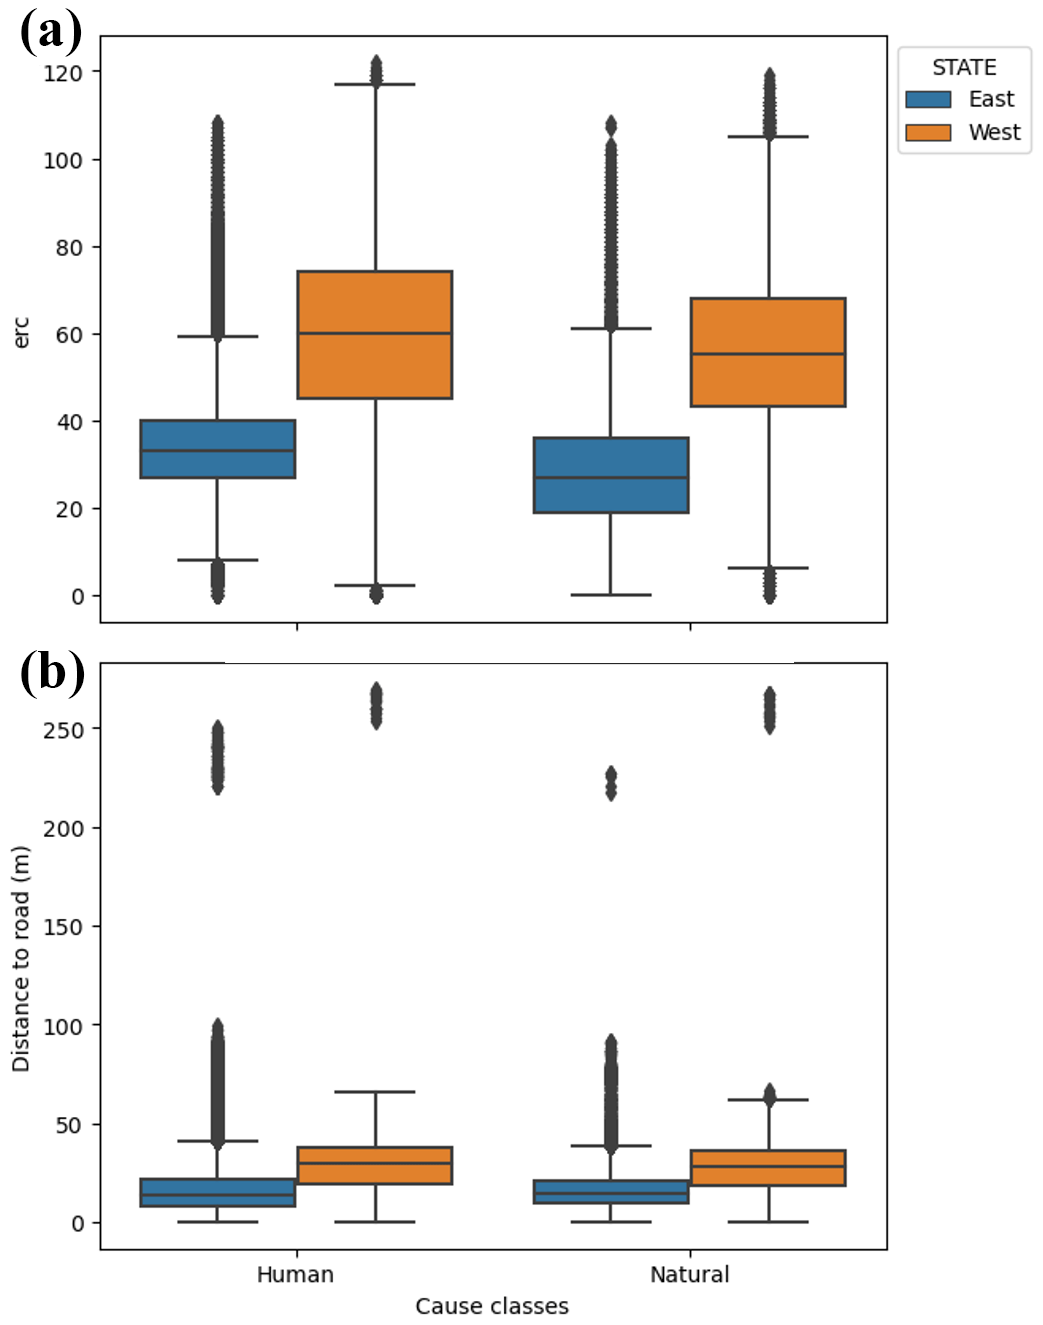
Figure 7Box plots of (a) the energy release component (ERC, fire danger index) and (b) minimum distance to the nearest road associated with human-caused and natural fires in the eastern and western US.
The elevation and slope associated with natural fires were higher than those of fires ignited by human causes (Fig. 8b, d). Natural fires were also associated with a lower population density, normalized difference vegetation index, and global human modification index than fires ignited by human causes (Fig. 8e, f). Differences in the overall social vulnerability and gross domestic product associated with the ignition locations of human-caused and natural fires were less noticeable (Fig. 8a, c), partly driven by the spatial resolution of the source data (Table 1).
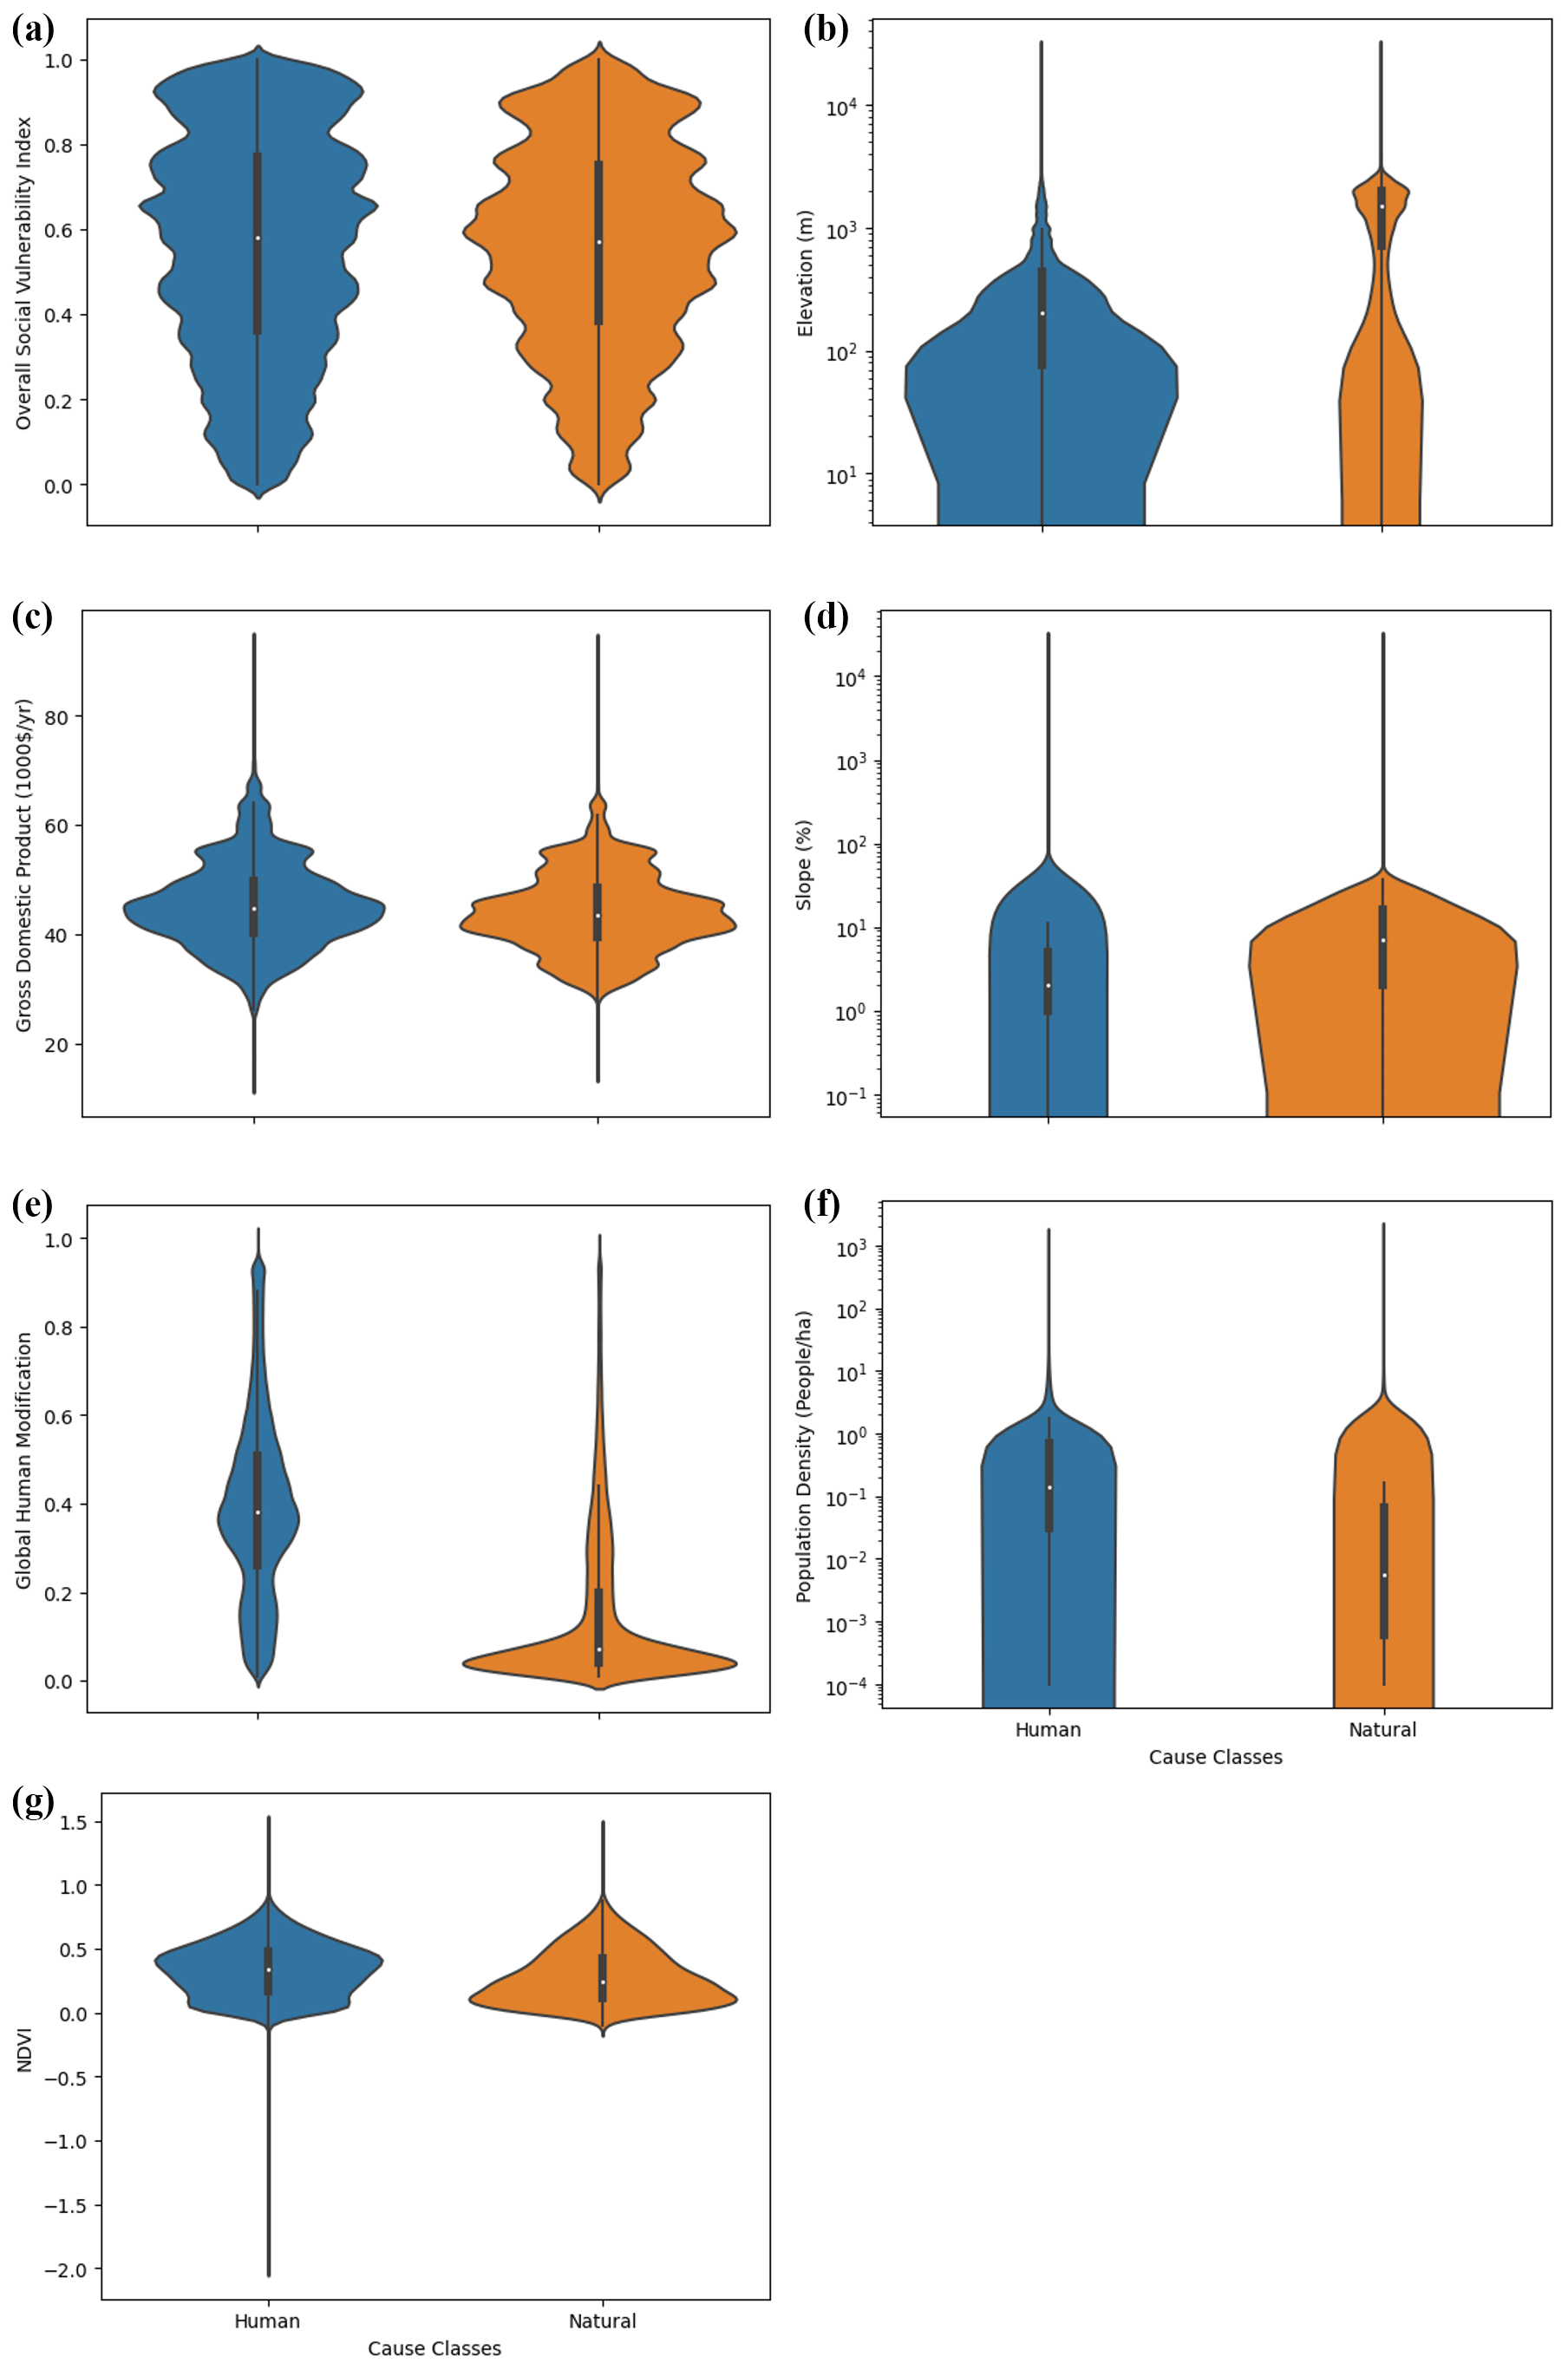
Figure 8Distribution of the (a) overall social vulnerability index, (b) elevation, (c) gross domestic product, (d) slope, (e) global human modification index, (f) population density, and (g) normalized difference vegetation index (1 d prior to ignition date) for fires ignited by natural and human causes.
The FPA FOD-Attributes dataset, for 1992–2020 and for individual years, is available from https://doi.org/10.5281/zenodo.8381129 (Pourmohamad et al., 2023) The dataset can be visualized and downloaded through https://fpafod.boisestate.edu (Boise State University, 2024). Source data used to develop FPA FOD-Attributes are listed in Table S1.
All codes that compiled FPA FOD-Attributes were developed in Python and are available from the FPA FOD-Attributes GitHub repository: https://github.com/YavarPourmohamad/FPA-FOD.git (last access: 26 June 2024) and https://doi.org/10.5281/zenodo.8381129 (Pourmohamad et al., 2023).
Critical analysis of past fire occurrences and assessment of the success of prevention and mitigation strategies are key for improving fire planning, response, adaptation, and mitigation (Show and Kotok, 1923; Short, 2014). Improved understanding of the causes and impacts of fires is needed to prioritize cost-effective mitigation and limit adverse fire impacts (Barros et al., 2021; Houtman et al., 2013; Santos et al., 2023). Scientific advances in the support of fire management require comprehensive, easily accessible data that harmonize fire occurrence data with potential covariates, causal factors, and associated impacts. Importantly, by integrating variables that represent a range of biological, physical, and social factors, the FPA FOD-Attributes dataset facilitates research that considers fire in the context of social–ecological–technological systems (Iglesias et al., 2022; Shuman et al., 2022).
The FPA FOD-Attributes dataset includes 310 biological, physical, social, and administrative attributes associated with more than 2.3×10⁶ fire records from 1992 to 2020 across the US. These attributes can be used for hypothesis testing and incorporation into artificial intelligence and machine learning (AI–ML) models that explain drivers of past fires or project likelihoods or effects of future fires. We recommend that future users carefully select variables among the wealth of information provided in FPA FOD-Attributes. Specifically for AI–ML modeling, variables have substantial overlap and correlation, which need to be addressed. The FPA FOD-Attributes dataset potentially could be integrated with satellite detection of fire starts. Satellites have been increasingly used to identify new fire starts, enabling rapid deployment of suppression resources (Weaver et al., 2004; Chuvieco et al., 2020). Satellite detection could be compared with the FPA FOD-Attributes dataset to identify ignitions with the potential to become destructive, given the surrounding conditions. This information could help prioritize the deployment of limited suppression resources (Roberto Barbosa et al., 2010; Mazzeo et al., 2022). The FPA FOD-Attributes dataset also could be used in collaborative planning of forest restoration or fuel treatments. In cases where ideas about prioritization of resources and assets for fire prevention efforts conflict (Butler et al., 2015), robust scientific data such as the FPA FOD-Attribute dataset can help facilitate a consensus (Colavito, 2017).
A rigorous quality assurance and quality check (QA/QC) process was applied to the original FPA FOD dataset, but some uncertainties remain. For example, some smaller fires are overseen by local jurisdictions that may not have reporting standards as strict as those of federal firefighting agencies (Short, 2014). The QA process checks for duplicate fire records, but it is possible that some duplicates remain due to the potential for multiple responding agencies to record different information on the same fire. There is also uncertainty associated with reported ignition locations. As a prerequisite for inclusion in the FPA FOD, a fire record's geographic location must be at least as precise as a Public Land Survey System section, which covers 1 square mile (2.6 km2). In addition, the locations of many smaller fires overseen by local jurisdictions may reflect the reporting location rather than the ignition location. For a full description of the fire selection process for the FPA FOD and potential uncertainty, see Short (2014). The FPA FOD-Attributes dataset does not provide details about large fire growth days that may have occurred days to weeks from the ignition date, and interested readers are encouraged to pair this dataset with the All-hazards dataset of St. Denis et al. (2023) for studies that focus on fire growth rates and intense fire behavior. Furthermore, the current version of FPA FOD-Attributes dataset does not directly support analysis of secondary fire impacts, such as wildfire emissions and smoke that impact downwind communities (Fowler et al., 2019).
Human ignition processes and wildfire impacts are prime areas for extensive new research, and the FPA FOD-Attributes dataset is an initial effort to facilitate such knowledge development. The FPA FOD-Attributes dataset also merits refinements and additions that would further enhance its utility. For example, some of the socioeconomic variables (GDP and population) are based on coarse-scale information gathered through international efforts; thus, using finer-scale data may enhance the accuracy of the fire attributes. Additional economic data to include in future versions may cover personal income and the workforce, also available at sub-state levels from the US Department of Commerce. Refined and expanded data could allow for more direct inferences that connect human-caused ignition processes to fire activity (e.g., Prestemon and Butry, 2005; Aldersley et al., 2011; Abt et al., 2015).
Although the entire FPA FOD-Attributes dataset is available in CSV format, the file is large (over 4 GB). Therefore, advanced computing resources are necessary to work with the data. To obtain a data file that is a more manageable size, the dataset can be filtered by attributes, time period, or locations from the web portal (https://fpafod.boisestate.edu/, last access: 16 October 2023) prior to the download.
The supplement related to this article is available online at: https://doi.org/10.5194/essd-16-3045-2024-supplement.
YP, MS, and JTA: conceptualization; YP, MS, JTA, EF, EJB, KS, MCR, NN, and JPP: methodology; YP, SB, and EH: software; YP, JTA, MS, EJB, and JO: validation; YP: formal analysis; YP, MS, and JTA: investigation; YP, MS, JTA, EF, EJB, KS, MCR, NN, and AA: resources; YP: data curation; MS, YP, JTA, EF, JO, PEH, AA, NN, JPP, KS, and MCR: writing – original draft; YP and MS: visualization; MS and JTA: supervision; MS: project administration; MS and JTA: funding acquisition.
The contact author has declared that none of the authors has any competing interests.
Publisher's note: Copernicus Publications remains neutral with regard to jurisdictional claims made in the text, published maps, institutional affiliations, or any other geographical representation in this paper. While Copernicus Publications makes every effort to include appropriate place names, the final responsibility lies with the authors.
The authors appreciate the contributions of David Adams, Benjamin Collins, Brenden Marks, Jeremy Stocking, Samuel Wasko, Ethan Raygor, and Parker Balbach to the development of the dataset portal: https://fpafod.boisestate.edu (last access: 16 October 2023).
This research has been supported by the Joint Fire Science Program (grant no. L21AC10247).
This paper was edited by Jia Yang and reviewed by four anonymous referees.
Abatzoglou, J. T.: Development of gridded surface meteorological data for ecological applications and modelling, Int. J. Climatol., 33, 121–131, 2013.
Abt, K. L., Butry, D. T., Prestemon, J. P., and Scranton, S.: Effect of fire prevention programs on accidental and incendiary wildfires on tribal lands in the United States, Int. J. Wildl. Fire, 24, 749–762, 2015.
Aldersley, A., Murray, S. J., and Cornell, S. E.: Global and regional analysis of climate and human drivers of wildfire, Sci. Total Environ., 409, 3472–3481, 2011.
Alizadeh, M. R., Abatzoglou, J. T., Luce, C. H., Adamowski, J. F., Farid, A., and Sadegh, M.: Warming enabled upslope advance in western US forest fires, P. Natl. Acad. Sci. USA, 118, e2009717118, https://doi.org/10.1073/pnas.2009717118, 2021.
Alizadeh, M. R., Abatzoglou, J. T., Adamowski, J., Modaresi Rad, A., AghaKouchak, A., Pausata, F. S. R., and Sadegh, M.: Elevation-dependent intensification of fire danger in the western United States, Nat. Commun., 14, 1773, https://doi.org/10.1038/s41467-023-37311-4, 2023.
Balch, J. K., Bradley, B. A., Abatzoglou, J. T., Chelsea Nagy, R., Fusco, E. J., and Mahood, A. L.: Human-started wildfires expand the fire niche across the United States, P. Natl. Acad. Sci. USA, 114, 2946–2951, https://doi.org/10.1073/pnas.1617394114, 2017.
Barros, A. M. G., Day, M. A., Preisler, H. K., Abatzoglou, J. T., Krawchuk, M. A., Houtman, R., and Ager, A. A.: Contrasting the role of human-and lightning-caused wildfires on future fire regimes on a Central Oregon landscape, Environ. Res. Lett., 16, 64081, https://doi.org/10.1088/1748-9326/ac03da, 2021.
Boise State University: FPA FOD-Attributes, Boise State University [data set], https://fpafod.boisestate.edu (last access: 20 June 2023), 2024.
Bowman, D. M. J. S., Balch, J. K., Artaxo, P., Bond, W. J., Carlson, J. M., Cochrane, M. A., D'Antonio, C. M., DeFries, R. S., Doyle, J. C., and Harrison, S. P.: Fire in the Earth system, Science, 324, 481–484, 2009.
Bowman, D. M. J. S., Balch, J., Artaxo, P., Bond, W. J., Cochrane, M. A., D'antonio, C. M., DeFries, R., Johnston, F. H., Keeley, J. E., and Krawchuk, M. A.: The human dimension of fire regimes on Earth, J. Biogeogr., 38, 2223–2236, 2011.
Butler, W. H., Monroe, A., and McCaffrey, S.: Collaborative implementation for ecological restoration on US public lands: implications for legal context, accountability, and adaptive management, Environ. Manage., 55, 564–577, 2015.
Chen, B. and Jin, Y.: Spatial patterns and drivers for wildfire ignitions in California, Environ. Res. Lett., 17, 055004, https://doi.org/10.1088/1748-9326/ac60da, 2022.
Chuvieco, E., Aguado, I., Salas, J., García, M., Yebra, M., and Oliva, P.: Satellite remote sensing contributions to wildland fire science and management, Curr. For. Reports, 6, 81–96, 2020.
Climate and Economic Justice Screening Tool: https://screeningtool.geoplatform.gov/, last access: 10 December 2023.
Cohen, J. D. and Deeming, J. E.: The National Fire Danger Rating System: Basic Equations (General Technical Report PSW-GTR-82), US Dep. Agric. For. Serv. Berkeley, CA, USA, 1985.
Colavito, M. M.: The role of science in the collaborative forest landscape restoration program, J. For., 115, 34–42, 2017.
Colorado Encyclopedia: East Troublesome Fire: https://coloradoencyclopedia.org/article/east-troublesome-fire, last access: 10 December 2023.
Dahal, D., Pastick, N. J., Boyte, S. P., Parajuli, S., Oimoen, M. J., and Megard, L. J.: Multi-Species Inference of Exotic Annual and Native Perennial Grasses in Rangelands of the Western United States Using Harmonized Landsat and Sentinel-2 Data, Remote Sens., 14, 807, https://doi.org/10.3390/rs14040807, 2022 (data available at: https://data.usgs.gov/datacatalog/data/USGS:61716970d34ea36449a77130, last access: 16 October 2023).
Dennison, P. E., Brewer, S. C., Arnold, J. D., and Moritz, M. A.: Large wildfire trends in the western United States, 1984–2011, Geophys. Res. Lett., 41, 2928–2933, 2014.
Dewitz, J.: National land cover database (NLCD) 2016 products, US Geol. Surv. data release, 10, P96HHBIE, https://doi.org/10.1016/j.rse.2021.112357, 2019.
Didan, K.: MODIS/Terra Vegetation Indices 16-Day L3 Global 1km SIN Grid V061. NASA EOSDIS Land Processes Distributed Active Archive Center [data set], https://doi.org/10.5067/MODIS/MOD13A2.061, 2021.
Dissing, D. and Verbyla, D. L.: Spatial patterns of lightning strikes in interior Alaska and their relations to elevation and vegetation, Can. J. For. Res., 33, 770–782, 2003.
Douglas, J., Mills, T. J., Artly, D., Ashe, D., Bartuska, A., Black, R. L., Coloff, S., Cruz, J., Edrington, M., and Edwardson, J.: Review and update of the 1995 federal wildland fire management policy, US Dept. of the Interior; US Dept. of Agriculture, 2001.
Eidenshink, J., Schwind, B., Brewer, K., Zhu, Z.-L., Quayle, B., and Howard, S.: A project for monitoring trends in burn severity, Fire Ecol., 3, 3–21, 2007.
Finney, M. A., McHugh, C. W., Grenfell, I. C., Riley, K. L., and Short, K. C.: A simulation of probabilistic wildfire risk components for the continental United States, Stoch. Environ. Res. Risk Assess., 25, 973–1000, 2011.
Flanagan, B. E., Hallisey, E. J., Adams, E., and Lavery, A.: Measuring community vulnerability to natural and anthropogenic hazards: the Centers for Disease Control and Prevention's Social Vulnerability Index, J. Environ. Health, 80, 34–36, 2018 (data available at: https://www.atsdr.cdc.gov/placeandhealth/svi/data_documentation_download.html, last access: 16 October 2023).
Flannigan, M. D. and Wotton, B. M.: Lightning-ignited forest fires in northwestern Ontario, Can. J. For. Res., 21, 277–287, 1991.
Fowler, M., Rad, A. M., Utych, S., Adams, A., Alamian, S., Pierce, J., Dennison, P., Abatzoglou, J. T., AghaKouchak, A., and Montrose, L.: A dataset on human perception of and response to wildfire smoke, Sci. Data, 6, 1–10, 2019.
Fuquay, D. M., Baughman, R. G., Latham, D. J.: A model for predicting lightning fire ignition in wildland fuels, Intermountain Forest and Range Experiment Station, Forest Service, US, Wildfires, Paper 5, https://digitalcommons.usu.edu/govdocs_wfires/5 (last access: 16 October 2023), 1979.
Hély, C., Flannigan, M., Bergeron, Y., and McRae, D.: Role of vegetation and weather on fire behavior in the Canadian mixedwood boreal forest using two fire behavior prediction systems, Can. J. For. Res., 31, 430–441, 2001.
Hessilt, T. D., Abatzoglou, J. T., Chen, Y., Randerson, J. T., Scholten, R. C., Van Der Werf, G., and Veraverbeke, S.: Future increases in lightning ignition efficiency and wildfire occurrence expected from drier fuels in boreal forest ecosystems of western North America, Environ. Res. Lett., 17, 054008, https://doi.org/10.1088/1748-9326/ac6311, 2022.
Home Land Security: Fire Stations, https://opendata.arcgis.com/api/v3/datasets/0ccaf0c53b794eb8ac3d3de6afdb3286_0/downloads/data?format=shp&spatialRefId=3857&where=1%3D1, last access: 13 March 2023.
Houtman, R. M., Montgomery, C. A., Gagnon, A. R., Calkin, D. E., Dietterich, T. G., McGregor, S., and Crowley, M.: Allowing a wildfire to burn: estimating the effect on future fire suppression costs, Int. J. Wildl. Fire, 22, 871–882, 2013.
Huete, A., Didan, K., Miura, T., Rodriguez, E. P., Gao, X., and Ferreira, L. G.: Overview of the radiometric and biophysical performance of the MODIS vegetation indices, Remote Sens. Environ., 83, 195–213, 2002.
Iglesias, V., Balch, J. K., and Travis, W. R.: US fires became larger, more frequent, and more widespread in the 2000s, Sci. Adv., 8, eabc0020, https://doi.org/10.1126/sciadv.abc0020, 2022.
Kennedy, C. M., Oakleaf, J. R., Theobald, D. M., Baruch-Mordo, S., and Kiesecker, J.: Managing the middle: A shift in conservation priorities based on the global human modification gradient, Glob. Chang. Biol., 25, 811–826, 2019.
Khorshidi, M. S., Dennison, P. E., Nikoo, M. R., AghaKouchak, A., Luce, C. H., and Sadegh, M.: Increasing concurrence of wildfire drivers tripled megafire critical danger days in Southern California between 1982 and 2018, Environ. Res. Lett., 15, 104002, https://doi.org/10.1088/1748-9326/abae9e, 2020.
Kummu, M., Taka, M., and Guillaume, J. H. A.: Gridded global datasets for gross domestic product and Human Development Index over 1990–2015, Sci. Data, 5, 1–15, https://doi.org/10.5061/dryad.dk1j0, 2018.
Latham, D. and Williams, E.: Lightning and forest fires, in: Forest Fires, Elsevier, 375–418, 2001.
Maranghides, A., Link, E., Hawks, S., Wilson, M., Brewer, W., Brown, C., Vihnaneck, B., and Walton, W. D.: A Case Study of the Camp Fire–Fire Progression Timeline Appendix C, Community WUI Fire Hazard Evaluation Framework, 2021.
Mazzeo, G., De Santis, F., Falconieri, A., Filizzola, C., Lacava, T., Lanorte, A., Marchese, F., Nolè, G., Pergola, N., and Pietrapertosa, C.: Integrated Satellite System for Fire Detection and Prioritization, Remote Sens., 14, 335, https://doi.org/10.3390/rs14020335, 2022.
McGee, T., McFarlane, B., and Tymstra, C.: Wildfire: a Canadian perspective, in: Wildfire hazards, risks and disasters, Elsevier, 35–58, 2015.
Meisner, B. N., Chase, R. A., McCutchan, M. H., Mees, R., Benoit, J. W., Ly, B., Albright, D., Strauss, D., and Ferryman, T.: A lightning fire ignition assessment model, in: 12th Conference on Fire and Forest Meteorology'. Jekyll Island, GA, 172–178, 1993.
Miller, C. and Ager, A. A.: A review of recent advances in risk analysis for wildfire management, Int. J. Wildl. fire, 22, 1–14, 2012.
Modaresi Rad, A., Abatzoglou, J. T., Kreitler, J., Alizadeh, M. R., AghaKouchak, A., Hudyma, N., Nauslar, N. J., and Sadegh, M.: Human and infrastructure exposure to large wildfires in the United States, Nat. Sustain., 6, 1–9, 2023.
Nguyan, D., Belval, E. J., Wei, Y., Short, K. C., and Calkin, D. E.: Dataset of United States Incident Management Situation Reports, 2007–2021, Sci. Data, 11, https://doi.org/10.1038/s41597-023-02876-8, 2023.
Noonan-Wright, E. K., Opperman, T. S., Finney, M. A., Zimmerman, G. T., Seli, R. C., Elenz, L. M., Calkin, D. E., and Fiedler, J. R.: Developing the US wildland fire decision support system, J. Combust., 2011, 1–14, https://doi.org/10.1155/2011/168473, 2011.
Omernik, J. M.: Ecoregions of the conterminous United States, Annals of the Association of American Geographers 77:118-125, https://gaftp.epa.gov/EPADataCommons/ORD/Ecoregions/us/us_eco_l4_state_boundaries.zip (last access: 10 December 2023), 1987.
Pineda, N., Altube, P., Alcasena, F. J., Casellas, E., Segundo, H. S., and Montanyà, J.: Characterising the holdover phase of lightning-ignited wildfires in Catalonia, Agric. For. Meteorol., 324, 1–15, https://doi.org/10.1016/j.agrformet.2022.109111, 2022.
Pourmohamad, Y., Abatzoglou, J., Belval, E., Short, K., Fleishman, E., Reeves, M., Nauslar, N., Higuera, P., Henderson, E., Ball, S., AghaKouchak, A., Prestemon, J., Olszewski, J., and Sadegh, M. Physical, Social, and Biological Attributes for Improved Understanding and Prediction of Wildfires: FPA FOD-Attributes Dataset (1.0), Zenodo [data set], https://doi.org/10.5281/zenodo.8381129, 2023.
Prestemon, J. P. and Butry, D. T.: Time to burn: modeling wildland arson as an autoregressive crime function, Am. J. Agric. Econ., 87, 756–770, 2005.
Rad, A. M., Abatzoglou, J., Fleishman, E., Mockrin, M. H., Radeloff, V. C., Pourmohamad, Y., Cattau, M. E., Johnson, J. M., Higuera, P. E., Nauslar, N., and Sadegh, M.: Social vulnerability of the people exposed to wildfires, Sci. Adv., 9, eadh461, https://doi.org/10.1126/sciadv.adh4615, 2023.
Reeves, M. and Frid, L.: The Rangeland Vegetation Simulator: A user-driven system for quantifying production, succession, disturbance and fuels in non-forest environments, in: 10th International Rangeland Congress, 1062, 2016.
Reeves, M. C., Hanberry, B. B., Wilmer, H., Kaplan, N. E., and Lauenroth, W. K.: An assessment of production trends on the Great Plains from 1984 to 2017, Rangel. Ecol. Manag., 78, 165–179, 2021.
Riley, S. J., DeGloria, S. D., and Elliot, R.: Index that quantifies topographic heterogeneity, Intermt. J. Sci., 5, 23–27, 1999.
Roberto Barbosa, M., Carlos Sícoli Seoane, J., Guimarães Buratto, M., Santana de Oliveira Dias, L., Paulo Carvalho Raivel, J., and Lobos Martins, F.: Forest Fire Alert System: a Geo Web GIS prioritization model considering land susceptibility and hotspots – a case study in the Carajás National Forest, Brazilian Amazon, Int. J. Geogr. Inf. Sci., 24, 873–901, 2010.
Ronchi, E., Gwynne, S. M. V, Rein, G., Wadhwani, R., Intini, P., and Bergstedt, A.: e-Sanctuary: Open multi-physics framework for modelling wildfire urban evacuation, Fire Protection Research Foundation Quincy, 2017.
Rothberg, D.: “It's gone, it's gone:” Nation's largest wildfire in Nevada devastates ranches, sage grouse, Nevada Indep., 12 July 2018.
Rouse, J. W., Haas, R. H., Schell, J. A., and Deering, D. W.: Monitoring vegetation systems in the Great Plains with ERTS, NASA Spec. Publ, 351, 309, https://doi.org/10.4095/330629, 1974.
Santos, F., Bailey, J. K., and Schweitzer, J. A.: The eco-evolutionary role of fire in shaping terrestrial ecosystems, Funct. Ecol., 37, 2090–2095, 2023.
Scott, J., Helmbrecht, D., Thompson, M. P., Calkin, D. E., and Marcille, K.: Probabilistic assessment of wildfire hazard and municipal watershed exposure, Nat. Hazards, 64, 707–728, 2012.
Short, K. C.: A spatial database of wildfires in the United States, 1992–2011, Earth Syst. Sci. Data, 6, 1–27, https://doi.org/10.5194/essd-6-1-2014, 2014.
Short, K. C.: Spatial wildfire occurrence data for the United States, 1992–2018 [FPA_FOD_20210617], 5th Edition. Fort Collins, CO: Forest Service Research Data Archive, https://doi.org/10.2737/RDS-2013-0009.5, 2021.
Short, K. C.: Spatial wildfire occurrence data for the United States, 1992–2020 [FPA_FOD_20221014], 6th Edition. Fort Collins, CO: Forest Service Research Data Archive, https://doi.org/10.2737/RDS-2013-0009.6, 2022.
Short, K. C., Grenfell, I. C., Riley, K. L., and Vogler, K. C.: Pyromes of the conterminous United States, Forest Service Research Data Archive [data set], https://doi.org/10.2737/RDS-2020-0020, 2020.
Show, S. B. and Kotok, E. I.: Forest fires in California, 1911–1920: an analytical study, U.S. Dept. of Agriculture, Washington, D.C., 1923.
Shuman, J. K., Balch, J. K., Barnes, R. T., Higuera, P. E., Roos, C. I., Schwilk, D. W., Stavros, E. N., Banerjee, T., Bela, M. M., and Bendix, J.: Reimagine fire science for the anthropocene, P. Natl. Acad. Sci. USA Nexus, 1, pgac115, https://doi.org/10.1093/pnasnexus/pgac115, 2022.
Silva, F. R., Martínez, J. R. M., and González-Cabán, A.: A methodology for determining operational priorities for prevention and suppression of wildland fires, Int. J. Wildl. fire, 23, 544–554, 2014.
Silva, F. R. Y., O'Connor, C. D., Thompson, M. P., Martinez, J. R. M., and Calkin, D. E.: Modelling suppression difficulty: current and future applications, Int. J. Wildl. FIRE, 29, 752, https://doi.org/10.1071/wf19042, 2020.
St. Denis, L. A., Short, K. C., McConnell, K., Cook, M. C., Mietkiewicz, N. P., Buckland, M., and Balch, J. K.: all-hazards dataset mined from the US National Incident Management System 1999–2020, Sci. data, 10, 112, https://doi.org/10.1038/s41597-023-01955-0, 2023.
Stephens, S. L., Agee, J. K., Fule, P. Z., North, M. P., Romme, W. H., Swetnam, T. W., and Turner, M. G.: Managing forests and fire in changing climates, Science, 342, 41–42, 2013.
Tatem, A. J.: WorldPop, open data for spatial demography, Sci. Data, 4, 1–4, 2017.
TIGER: US Census Roads: https://www.census.gov/geographies/mapping-files/time-series/geo/tiger-line-file.2022.html#list-tab-790442341, last access: 16 October 2023.
U.S. Department of Interior, Geological Survey, and U.S. Department of Agriculture: LANDFIRE Existing Vegetation Type layer, http://landfire.cr.usgs.gov/viewer/ (last access: 16 October 2023), last update: May 2022a.
U.S. Department of Interior, Geological Survey, and U.S. Department of Agriculture: LANDFIRE Fire Regime Groups Type layer, http://landfire.cr.usgs.gov/viewer/ (last access: 16 October 2023), last update: May 2022b.
U.S. Department of Interior, Geological Survey, and U.S. Department of Agriculture: LANDFIRE Topography Type layer, http://landfire.cr.usgs.gov/viewer/ (last access: 16 October 2023), last update: May 2022c.
U.S. Geological Survey (USGS): Gap Analysis Project (GAP): Protected Areas Database of the United States (PAD-US) 3.0: U.S. Geological Survey data release, https://doi.org/10.5066/P9Q9LQ4B, 2022.
Vermote, E.: NOAA Climate Data Record (CDR) of AVHRR normalized difference vegetation index (NDVI), version 5, NOAA National Centers for Environmental Information, https://doi.org/10.7289/V5ZG6QH9, 2019.
Viegas, D. X., Viegas, M., and Ferreira, A. D.: Moisture content of fine forest fuels and fire occurrence in central Portugal, Int. J. Wildl. Fire, 2, 69–86, 1992.
Weaver, J. F., Lindsey, D., Bikos, D., Schmidt, C. C., and Prins, E.: Fire detection using GOES rapid scan imagery, Weather Forecast., 19, 496–510, 2004.
Weiss, A.: Topographic position and landforms analysis, in: Poster presentation, ESRI user conference, 9–13 July 2001, San Diego, CA, poster no. 200, 2001.
Westerling, A. L.: Increasing western US forest wildfire activity: sensitivity to changes in the timing of spring, Philos. T. Roy. Soc. B, 371, 20150178, https://doi.org/10.1098/rstb.2015.0178, 2016.
Wierzchowski, J., Heathcott, M., and Flannigan, M. D.: Lightning and lightning fire, central cordillera, Canada, Int. J. Wildl. Fire, 11, 41–51, 2002.
Wildland Fire Executive Council: The National Cohesive Wildland Fire Management Strategy: Phase III Western Regional Action Plan, 99 pp., https://www.frames.gov/catalog/14351 (last access: 5 January 2024), 2013.
Wildland fire perimeters full history: https://data-nifc.opendata.arcgis.com/datasets/nifc::wfigs-wildland-fire-perimeters-full-history/explore, last access: 26 February 2023.
WorldPop: Global high resolution population denominators project, Funded by Bill Melinda Gates Found. Sch. Geogr. Environ. Sci. Univ. Southampton; Dep. Geogr. Geosci. Univ. Louisville; Dep. Geogr. Univ. Namur) Cent. Int. Earth Sci. Inf. Netw.(CIESIN), Columbia Univ, 2018.