the Creative Commons Attribution 4.0 License.
the Creative Commons Attribution 4.0 License.
 | 28 Jun 2024
Dataset of spatially extensive long-term quality-assured land–atmosphere interactions over the Tibetan Plateau
Yaoming Ma
Yingying Chen
Shaomin Liu
Ziwei Xu
Lunyu Shang
Xiaobo He
Xianhong Meng
Weiqiang Ma
Baiqing Xu
Huabiao Zhao
Junbo Wang
Guangjian Wu
Xin Li
The climate of the Tibetan Plateau (TP) has experienced substantial changes in recent decades as a result of the location's susceptibility to global climate change. The changes observed across the TP are closely associated with regional land–atmosphere interactions. Current models and satellites struggle to accurately depict the interactions; therefore, critical field observations on land–atmosphere interactions outlined here provide necessary independent validation data and fine-scale process insights for constraining reanalysis products, remote sensing retrievals, and land surface model parameterizations. Scientific data sharing is crucial for the TP since in situ observations are rarely available under these harsh conditions. However, field observations are currently dispersed among individuals or groups and have not yet been integrated for comprehensive analysis. This has prevented a better understanding of the interactions, the unprecedented changes they generate, and the substantial ecological and environmental consequences they bring about. In this study, we collaborated with different agencies and organizations to present a comprehensive dataset for hourly measurements of surface energy balance components, soil hydrothermal properties, and near-surface micrometeorological conditions spanning up to 17 years (2005–2021). This dataset, derived from 12 field stations covering a variety of typical TP landscapes, provides the most extensive in situ observation data available for studying land–atmosphere interactions on the TP to date in terms of both spatial coverage and duration. Three categories of observations are provided in this dataset: meteorological gradient data (met), soil hydrothermal data (soil), and turbulent flux data (flux). To assure data quality, a set of rigorous data-processing and quality control procedures are implemented for all observation elements (e.g., wind speed and direction at different height) in this dataset. The operational workflow and procedures are individually tailored to the varied types of elements at each station, including automated error screening, manual inspection, diagnostic checking, adjustments, and quality flagging. The hourly raw data series; the quality-assured data; and supplementary information, including data integrity and the percentage of correct data on a monthly scale, are provided via the National Tibetan Plateau Data Center (https://doi.org/10.11888/Atmos.tpdc.300977, Ma et al., 2023a). With the greatest number of stations covered, the fullest collection of meteorological elements, and the longest duration of observations and recordings to date, this dataset is the most extensive hourly land–atmosphere interaction observation dataset for the TP. It will serve as the benchmark for evaluating and refining land surface models, reanalysis products, and remote sensing retrievals, as well as for characterizing fine-scale land–atmosphere interaction processes of the TP and underlying influence mechanisms.
- Article
(14302 KB) - Full-text XML
- BibTeX
- EndNote


The Tibetan Plateau (TP) is the most spatially extensive highland with the highest altitude in the world. Here, strong interactions occur among nearly all major Earth system components, including the lithosphere, atmosphere, cryosphere, biosphere, and anthroposphere, making it an ideal natural laboratory for studying the Earth system (Yao et al., 2019; Chen et al., 2021). However, the climate over the TP is highly sensitive to global climate change owing to its distinct terrain and geographical location, with warming being amplified compared to other regions (Liu and Chen, 2000). It is therefore characterized as an amplifier for global climate change (Pan et al., 1996). Many of the TP's environmental system components have experienced evident changes over the past few decades (Kang et al., 2010), for example, substantial retreat of glaciers (Yao et al., 2012) and a dramatic decrease in snow depth and snow cover under the warming climate (Qin et al., 2006; You et al., 2020). Together, these consequences provide crucial feedback that exacerbates warming and hydroclimatic changes across the TP. Emerging evidence indicates that critical climate tipping points are likely being rapidly approached over the TP due to rising global temperatures, and passing through these thresholds could potentially have significant social consequences (Armstrong McKay et al., 2022).
Under these circumstances, policymakers and stakeholders rely heavily on the scientific research community to develop reliable models that can assist in designing and implementing effective forward-looking mitigation and adaptation strategies to help combat the effects of climate change (Thornton et al., 2021). However, developing these models is challenging and necessitates a thorough physical understanding on how the climate system operates and interacts, which relies on acquiring informative, comprehensive, and representative environmental data. Meanwhile, regional land–atmosphere interactions are closely linked to environmental system changes (Zhou et al., 2019), even if anthropogenic climate forcing is recognized as the primary driver of these changes (Duan et al., 2006). In particular, quantifying energy and water exchanges across the heterogeneous landscape of the TP remains a challenge for the scientific community (Ma et al., 2023c). Thus, it is imperative to gain a thorough understanding of the multiscale land–atmosphere interactions taking place over the TP. Establishing appropriate countermeasures in response to global climate change and offering insights into the associated ecological and environmental vulnerability are both made possible by this.
The TP presents immense challenges for the research on land–atmosphere interactions and feedback, arising from the inherent complexities of such interactions. However, challenges in obtaining crucial observations impede an enhanced comprehension of how these interactions work, the unprecedented changes they generate, and the massive ecological and environmental consequences they pose. In addition, site selection is made more difficult by the complex mountainous topography, which also raises issues of spatial representativeness and calls for dense station networks. Furthermore, a great deal of important processes are inherently linked by intricate feedback loops. The considerable diversity and spatiotemporal heterogeneity of these interactions complicate the modelling of water and heat flux transfer across this mountainous region. Data scarcity has constrained research on coupled land–atmosphere dynamics in this sensitive region. While remote sensing helps to fill in certain observation gaps and provides some insights into surface properties, space-borne sensors struggle with complex land surfaces and frequent cloud cover. Therefore, in situ measurements remain essential to elucidate fine-scale exchange processes and to validate retrievals. Although altitude, terrain, isolation, and climate pose combined challenges for establishing, maintaining, and managing the in situ network that is indispensable for monitoring the land–atmosphere interactions over the TP, expanding the observation network is imperative to fill in knowledge gaps.
In recent decades, significant progress has been made in establishing comprehensive field stations to comprehend the mechanisms of the regional water and energy cycles and to provide long-term observations for land–atmosphere interactions across the TP. This has been accomplished by major field campaigns, large-scale scientific experiments, and infrastructure development under research programmes. After decades of effort, the Tibetan Observation and Research Platform (TORP, Ma et al., 2008), the Third Pole Environment (TPE) Observation and Research Platform (TPEORP, Ma et al., 2018), and the TPE Integrated Three-dimensional Observation and Research Platform (TPEITORP, Ma et al., 2023c) have been established with optimized scientific design and layout. These efforts have expanded the availability of in situ meteorological, hydrological, and cryospheric measurements. For example, 29 comprehensive stations in the TPEITORP are dispersed throughout the major ecosystems and climatic gradients of the TP (Ma et al., 2023c). This makes it possible to characterize the heterogeneous water, energy, and carbon exchanges associated with the complex terrain. A large number of valuable long-term observations have been obtained, and these observations have been widely used in a range of disciplines and at a range of spatial scales, greatly advancing our understanding of the land–atmosphere interactions, supporting the development of land surface models, and facilitating the refinement of satellite retrieval algorithms (Yuan et al., 2021; Ma et al., 2023c).
A rising number of field observation datasets are progressively being made accessible and freely available to the public (e.g., Che et al., 2019; Ma et al., 2020; Liu et al., 2023; Meng et al., 2023). However, to the best of our knowledge, thorough data quality control procedures have not been implemented in the current publicly available datasets for land–atmosphere interactions over the TP, although these datasets have contributed significantly to the study of climate and environmental change in the mountainous region. The extreme conditions over the TP pose numerous threats to sensor functioning and can introduce measurement errors. These factors can degrade calibration or alter instrument response characteristics, resulting in biased readings. With sparse monitoring networks, even small data problems can propagate into significant uncertainties when datasets are used for analysis or assimilated into models. Unfortunately, uncertainties in observations at many different stages of their life cycle pose a barrier to guaranteeing the high quality of the field observations (Fiebrich et al., 2010). Although proactive maintenance and sensor recalibration can greatly improve data quality, errors may still be inevitable. Data quality is one of the main concerns in scientific studies, particularly in the TP. These risks require mitigation through rigorous quality control procedures to ensure the reliability, consistency, and integrity of the observation datasets. An effective quality assurance system has been recognized as essential for producing reliable, high-quality data (Peppler et al., 2008). While there are alternative software packages available for data quality assurance (e.g., MetPyQC and MADIS), our experience is that no single algorithm or combination of algorithms can identify all the specific data quality problems that exist at each field station as data problems vary considerably from one field station to another. Therefore, it is imperative to develop specific automatic data post-processing algorithms to handle the unique problems arising from each station.
With regard to observations of land–atmosphere interactions over the TP, currently available in situ data are restricted to short intense campaigns or cover only a few sites or particular processes, and they ignore data uncertainties brought about by possible sensor noise or measurement fluctuations caused by changes in weather conditions. This work closes these important gaps in the literature. The dataset presented here includes simultaneous measurements of surface energy balance components, soil hydrothermal properties, and near-surface micrometeorological conditions compiled from 12 field stations affiliated with different organizations, enabling a holistic analysis of land–atmosphere feedback. This represents the most extensive in situ observation dataset of land–atmosphere interactions available for the TP to date in terms of spatial coverage and duration. Sets of automated post-processing algorithms and manual assessments are specifically designed for the multi-process observation network of land–atmosphere interactions. This dataset undergoes a series of robust quality checks, including automated error screening, manual inspection, diagnostic checking, adjustments, and quality flagging, to guarantee that any suspicious observations are identified. By compiling this unique collection of multi-year, multi-variable in situ observations across the TP and making it freely available to the scientific community, this work aims to advance process-level understandings of the land–atmosphere interactions over this climatically sensitive region and to reduce uncertainties in satellite remote sensing, as well as in weather and climate predictions.
2.1 Integrated land–atmosphere interaction observation network
This dataset compiles integrated land–atmosphere interaction observations from 12 stations (Fig. 1), ranging from 3033 to 5150 m in altitude (Table 1). All the sites are characterized by flat and open terrain with a relatively homogeneous underlying surface, making them an ideal experimental field for observing and investigating the land–atmosphere interactions in the varied topography of the TP region.
Four sites (Arou, Dashalong, Jingyangling, and Yakou) are in the upper reaches of the Heihe River (UHR) basin, an endorheic basin with arid and semi-arid climate, located in the northeast of the TP (Li et al., 2013; Liu et al., 2018). The vegetation and soil type at these sites are dominated by alpine meadow and silt loam. The Arou station was constructed in a valley to the south of the Babao River, a tributary of the UHR, surrounded by rather flat and open terrain. The Yakou station is located on the highland on the east side of Dadongshu Mountain in the UHR. It is an ideal snow observation station as the experimental area is frequently blanketed with snow in autumn, winter, and spring. The annual precipitation amounts at Arou station and Dashalong station were approximately 570 and 420 mm, respectively, while this reached 600–800 mm at the Yakou station (Liu et al., 2018).
Two sites (Ngoring Lake and Maqu) are located in the source region of the Yellow River basin, a region that is “extremely sensitive” to climate change and that has a semi-arid climate (Lu et al., 2018; Xu et al., 2020). The Ngoring Lake site was established on a relatively flat grassland, about 2 km west of Lake Ngoring (Meng et al., 2023). Alpine meadow with a height of about 0.05–0.1 m covers its underlying surface. The Maqu site is situated in the south of the Maqu County, characterized by alpine meadow with a height of 0.2 m in the summer and of about 0.1 m in the winter (An et al., 2020). The Maqu site receives roughly 600 mm of precipitation on average, most of which falls during the summer because of the summer monsoon, and snowfall occurs very infrequently during the winter (Wang et al., 2017).
The TGL site is located in the Dongkemadi River basin in the source region of the Yangtze River on the TP, equipped with the world's first eddy covariance system in the uniform alpine swamp meadow above 5000 m (Guo et al., 2022).
The other five sites are all affiliated with the Institute of Tibetan Plateau Research, Chinese Academy of Sciences (ITPCAS). The National Observation and Research Station for Qomolangma Special Atmospheric Processes and Environmental Changes (QOMS) is situated at the bottom of the lower Rongbuk Valley, 30 km to the north of Mt. Qomolangma, and is an ideal location for monitoring atmospheric conditions in the Northern Hemisphere. Situated at the southeastern shoreline area of Nam Co (Co means lake), the Tibetan Nam Co Monitoring and Research Station for Multisphere Interactions, CAS (NAMORS) is an ideal place to measure the land–atmosphere interactions in the lake–land–mountain mesoscale system. Situated between Mt. Muztagh and Lake Karakuri, the Muztagh Ata Westerly Observation and Research Station, CAS (MAWORS) is a typical westerly climate zone with year-round westerly influences. The Ngari Station for Desert Environment Observation and Research, CAS (NASED) is ideally situated to study the westerly monsoon interactions on the desert landscape as it is located at the convergence zone of the Indian monsoon and the westerly monsoon. In a mountain valley near the forested southeast TP is the Southeast Tibet Plateau Station for integrated observation and research of alpine environment, CAS (SETORS). This is an important site for tracking the water and heat transport along the alpine valleys by the South Asian monsoon. For further details on these five sites, please refer to Ma et al. (2020).
2.2 Observation infrastructure
The integrated observation network for land–atmosphere interactions includes six superstations (after upgrading and reconstruction for MAWORS and NASED in 2020) with multi-layer meteorological data (up to six layers at the Arou station) and six ordinary stations that measure single-layer near-surface meteorological elements (Table 1). These stations cover the main landscapes of the TP, including alpine meadows, deserts, steppes, and grasslands. Vertical profiles of meteorological conditions (e.g., wind speed and direction, air temperature, and relative humidity) within the lower boundary layer are measured for the superstations (Arou, MAWORS, NASED, NAMORS, QOMS, and SETORS) but with a different planetary boundary layer (PBL) tower observing system layout (e.g., sensor height and instrument model). To ensure consistency, it is important to emphasize that all instruments deployed at NAMORS, QOMS, and SETORS before 2020 and all five stations that have been affiliated with ITPCAS (MAWORS, NASED, NAMORS, QOMS, and SETORS) since 2020 follow a similar deployment strategy. For instance, five layers of wind speed and direction anemometers and air temperature and humidity probes and one layer of air pressure barometers, rain gauges, and four-component radiation sensors were deployed at each station. These instruments have been of the same model at the five sites since the reconstruction of the observing system in 2020 and were installed at comparable or identical heights whenever feasible (for more specific information on site deployment, see Table 1). The near-surface meteorological components were observed at one level at regular stations (TGL, Ngoring Lake, Maqu, Yakou, and Jingyangling), as well as at the MAWORS and NASED stations before reconstruction.
The vertical soil hydrothermal profile of each station was measured with multilayer soil temperature–moisture probes. Except for a few sites (MAWORS, NASED, NAMORS, QOMS, and SETORS), where the depth of thermal sensors and probes for measuring soil hydrothermal properties was constant, there were notable variations in the number of layers and depth at the other sites. Although soil heat flux was also measured at the field stations constructed by ITPCAS using soil heat flux plates (HFP01SC, Hukseflux, Netherlands), observations are not included in this dataset because their reliability cannot be fully guaranteed based on our assessment (Ma et al., 2020). Detailed information regarding the sensors used and the heights at which the sensors were set is listed in Table 1.
Figure 1(a) The elevation, (b) spatial distribution of plant functional types (PFTs), and (c) photos of the integrated land–atmosphere interaction observation network.
A high-frequency eddy covariance (EC) system was deployed at each site to capture the sensible heat, latent heat, and carbon dioxide fluxes. The EC system consists of a sonic anemometer (CSAT3/CSAT3B, Campbell Scientific, USA) and a fast-response infrared gas analyser (LI-7500/7500A/7500DS/7500RS, LI-COR, USA). On the other hand, for Maqu, the EC150 open-path gas analyser (Campbell Scientific, USA) was used. The turbulent exchanges of heat, water vapour, carbon dioxide, and momentum were measured at 10 Hz. The high-frequency data series underwent quality verification and processing at 30 min average intervals. Specific processing procedures will be described in Sect. 3.1. A specific correction to the carbon dioxide flux observations is highly needed but has not yet been done since the self-heating issue of the instruments can have a significant impact on the measurement accuracy and stability of the open-path infrared gas analyser (Burba et al., 2008). Thus, this dataset does not include the carbon dioxide flux. The carbon dioxide flux observations will also be publicly shared after the data correction and validation are finished.
Calibration of instruments is critical for ensuring accurate measurements. It is important to note, however, that calibrating in a particularly harsh environment such as the TP is challenging. As a result, for meteorological and soil observations, both of which are relatively stable, calibrated reference instruments were used on a regular basis to perform field calibration across multiple stations, or the calibration was performed in a laboratory setting when instruments were returned for repair. In the case of turbulent observations, the measurement accuracy of the gas analyser (i.e., LI-7500 and LI-7500DS) depends upon the cleanliness of the instrument lenses; the gas analyser needs to be calibrated at regular intervals (once every 6 months at the five sites affiliated with the ITPCAS) due to signal attenuation for CO2 and/or H2O. The calibration consists of two major components: (1) determining the values of the calibration coefficients and (2) adjusting zero and span to align the gas analyser's actual response with the previously determined factory response. In addition, we conduct monthly inspections of the operational status of all observational equipment (Ma et al., 2023b), as well as semi-annual on-site instrument maintenance for all stations, which includes instrument cleaning, checking the level of commissioned instruments, and checking instrument cables and connectors. To the maximum extent feasible, qualified personnel will take over and rectify any instrument malfunctions found during routine inspection (on-site or remote) to ensure the accuracy and integrity of the observations. Data logger (e.g., CR6, Campbell Scientific, USA) recordings are, first, temporarily stored on the memory card before being routinely transmitted to our data-processing centre by wireless transmission or on-site collection for processing, analysis, and archiving.
2.3 Data post-processing workflow
To compile a high-quality set of in situ land–atmosphere interaction observations, this study used a series of automated post-processing algorithms and manual assessment specifically designed for this multi-process observation network of land–atmosphere interactions. The data processing workflow can be divided into data processing, quality control, gap filling, and data archiving (Fig. 2).
2.3.1 Data processing
The first step of data processing was mostly tailored to the raw 10 Hz turbulent data, while several operations (e.g., diagnostics for missing times and format conversion) were applied to all variables. All raw turbulent data were subjected to spike detection, spike and trend removal, sonic temperature correction, coordinate rotation, frequency response correction, and WPL (Webb–Pearman–Leuning) correction in accordance with the procedures implemented by Ma et al. (2020), Meng et al. (2023), and Liu et al. (2023). The quality of each specific turbulent flux value was evaluated according to the steady-state test and the developed turbulence condition test. The flagging policy proposed by Mauder and Foken (2006) was used to combine the two flags from the two tests into a final quality flag: 0 presents the highest-quality fluxes, 1 represents fluxes suitable for general analysis, and 2 represents fluxes that should be discarded. In addition to some targeted processing for the turbulent data, the continuity of the timestamps for all types of data was diagnosed. Although either NAN (not a number) or −9999 was used to denote a missing value prior to the post-processing of the data, the final data used 9999.9 to indicate missing data. Additionally, different instruments collected and recorded the data on various data loggers, and different organizations employed various data formats to store structured data; for these reasons, merging the data into a common format is a crucial step in data processing. The plain ASCII comma-separated value (CSV) file format was used in this study.
Figure 2(a) Flow chart of the data post-processing workflow and (b) the schematic diagram of the processing chain of the quality checks. Main steps are printed in red.
2.3.2 Data quality controlling
Quality controlling is particularly demanding for micrometeorological observations in complex environments. Owing to the unique characteristics of the climate and the way the observation network for land–atmosphere interactions was configured, certain practical issues detected in our previously released dataset (Ma et al., 2020) were not adequately addressed by some of the traditional quality control techniques currently in use. To provide the best level of accuracy feasible, an automatic processing scheme was specifically designed for each type of variable, following the guidelines described by Zahumenský (2004). The guidelines provide comprehensive documentation on basic quality control procedures used to ensure the accuracy of meteorological observations following World Meteorological Organization (WMO) standards. A wide array of methods have been proposed to obtain plausible micrometeorological data series; those methods share similar processing flows, but modifications of varying degrees were made to deal with site-specific concerns and unique problems that emerged from the field observations. This is due to the fact that generic methods frequently failed to resolve these issues. This scheme is specifically adapted and aims to verify the reliability of observations and to detect errors and suspicious values. The automatic data-processing chain was built up as a series of sequential checks recommended by Zahumenský (2004), with an emphasis on the continuity and inter-consistency of meteorological fields to detect suspect observations.
The programme first reads the data file for each station to be processed, and then checks are performed sequentially from left to right; only when all the prescribed check procedures for each variable are completed does the programme move on to the next one. The quality control procedures are arranged in a deliberate sequence and ignore values flagged as errors by preceding checks in the sequence because the checks each have specific data requirements (e.g., running average and corresponding standard deviation should be calculated based on correct data). In the following, we outline the check procedures followed.
Table 2Constant limits used for the range checks and temporal checks.
a Check is not implemented. b A range of values is given because they are defined individually for each site.
Range checks. The purpose of this check is to confirm that the values fall into a plausible range. Outliers are frequently encountered in field observations, particularly in the harsh natural environment of the TP. The wide variety of outliers is typically caused by unanticipated abrupt changes in the surrounding conditions, instrument fluctuations, or data logger malfunctions. The data points that failed the check were flagged as errors (with a QC score of 2). The range limits used in this study were constant, ignoring the seasonal variations, in contrast to the climatological limit check, where the range of limits depends on the season and regional climatic conditions (typically at least 20 years of archived data are required to define climate range thresholds). The constant limits were predetermined based on the sensor hardware specifications and theoretical limits, as well as following the limits in climatological conditions recommended by Zahumenský (2004). Minor adjustments were made at each site based on the unique climate to guarantee accurate and reliable detection results. Table 2 provides the range of limits for each of the observed variables.
Temporal checks. This check assesses the validity of changes in the time series of data at a station. Two tests were used to evaluate the temporal consistency: the persistence test was implemented to verify the “dead band” caused by blocked sensors or instrument malfunction by checking a minimum required variability between sequential values, and the step test was used to detect unrealistic jumps in values, with a verified maximum allowed variability, because of the changes in weather conditions. It was discovered during testing that there would be a significant uncertainty if soil temperature, soil moisture, and surface radiation were subjected to temporal consistency tests since the former two elements frequently exhibit little to no fluctuation while surface radiation is expected to exhibit substantial variability. As a result, we did not perform similar checks for surface radiation, soil temperature, and soil moisture. This study used a more subjective set of thresholds (minimal and maximum values) compared to range tests (Table 2). For the persistence test, when target variable values remain unchanged for more than 24 consecutive hours, data are deemed to be erroneous, and corresponding QC flags are assigned to 2. The step test was performed based on the standard deviation threshold. A moving average with a window size of 7 h was used to calculate the standard deviation of the sub-data list and the difference between each value and the mean value of this data list. Values that were more than 3 standard deviations from the mean were thought to be potentially erroneous and thus were flagged with 2.
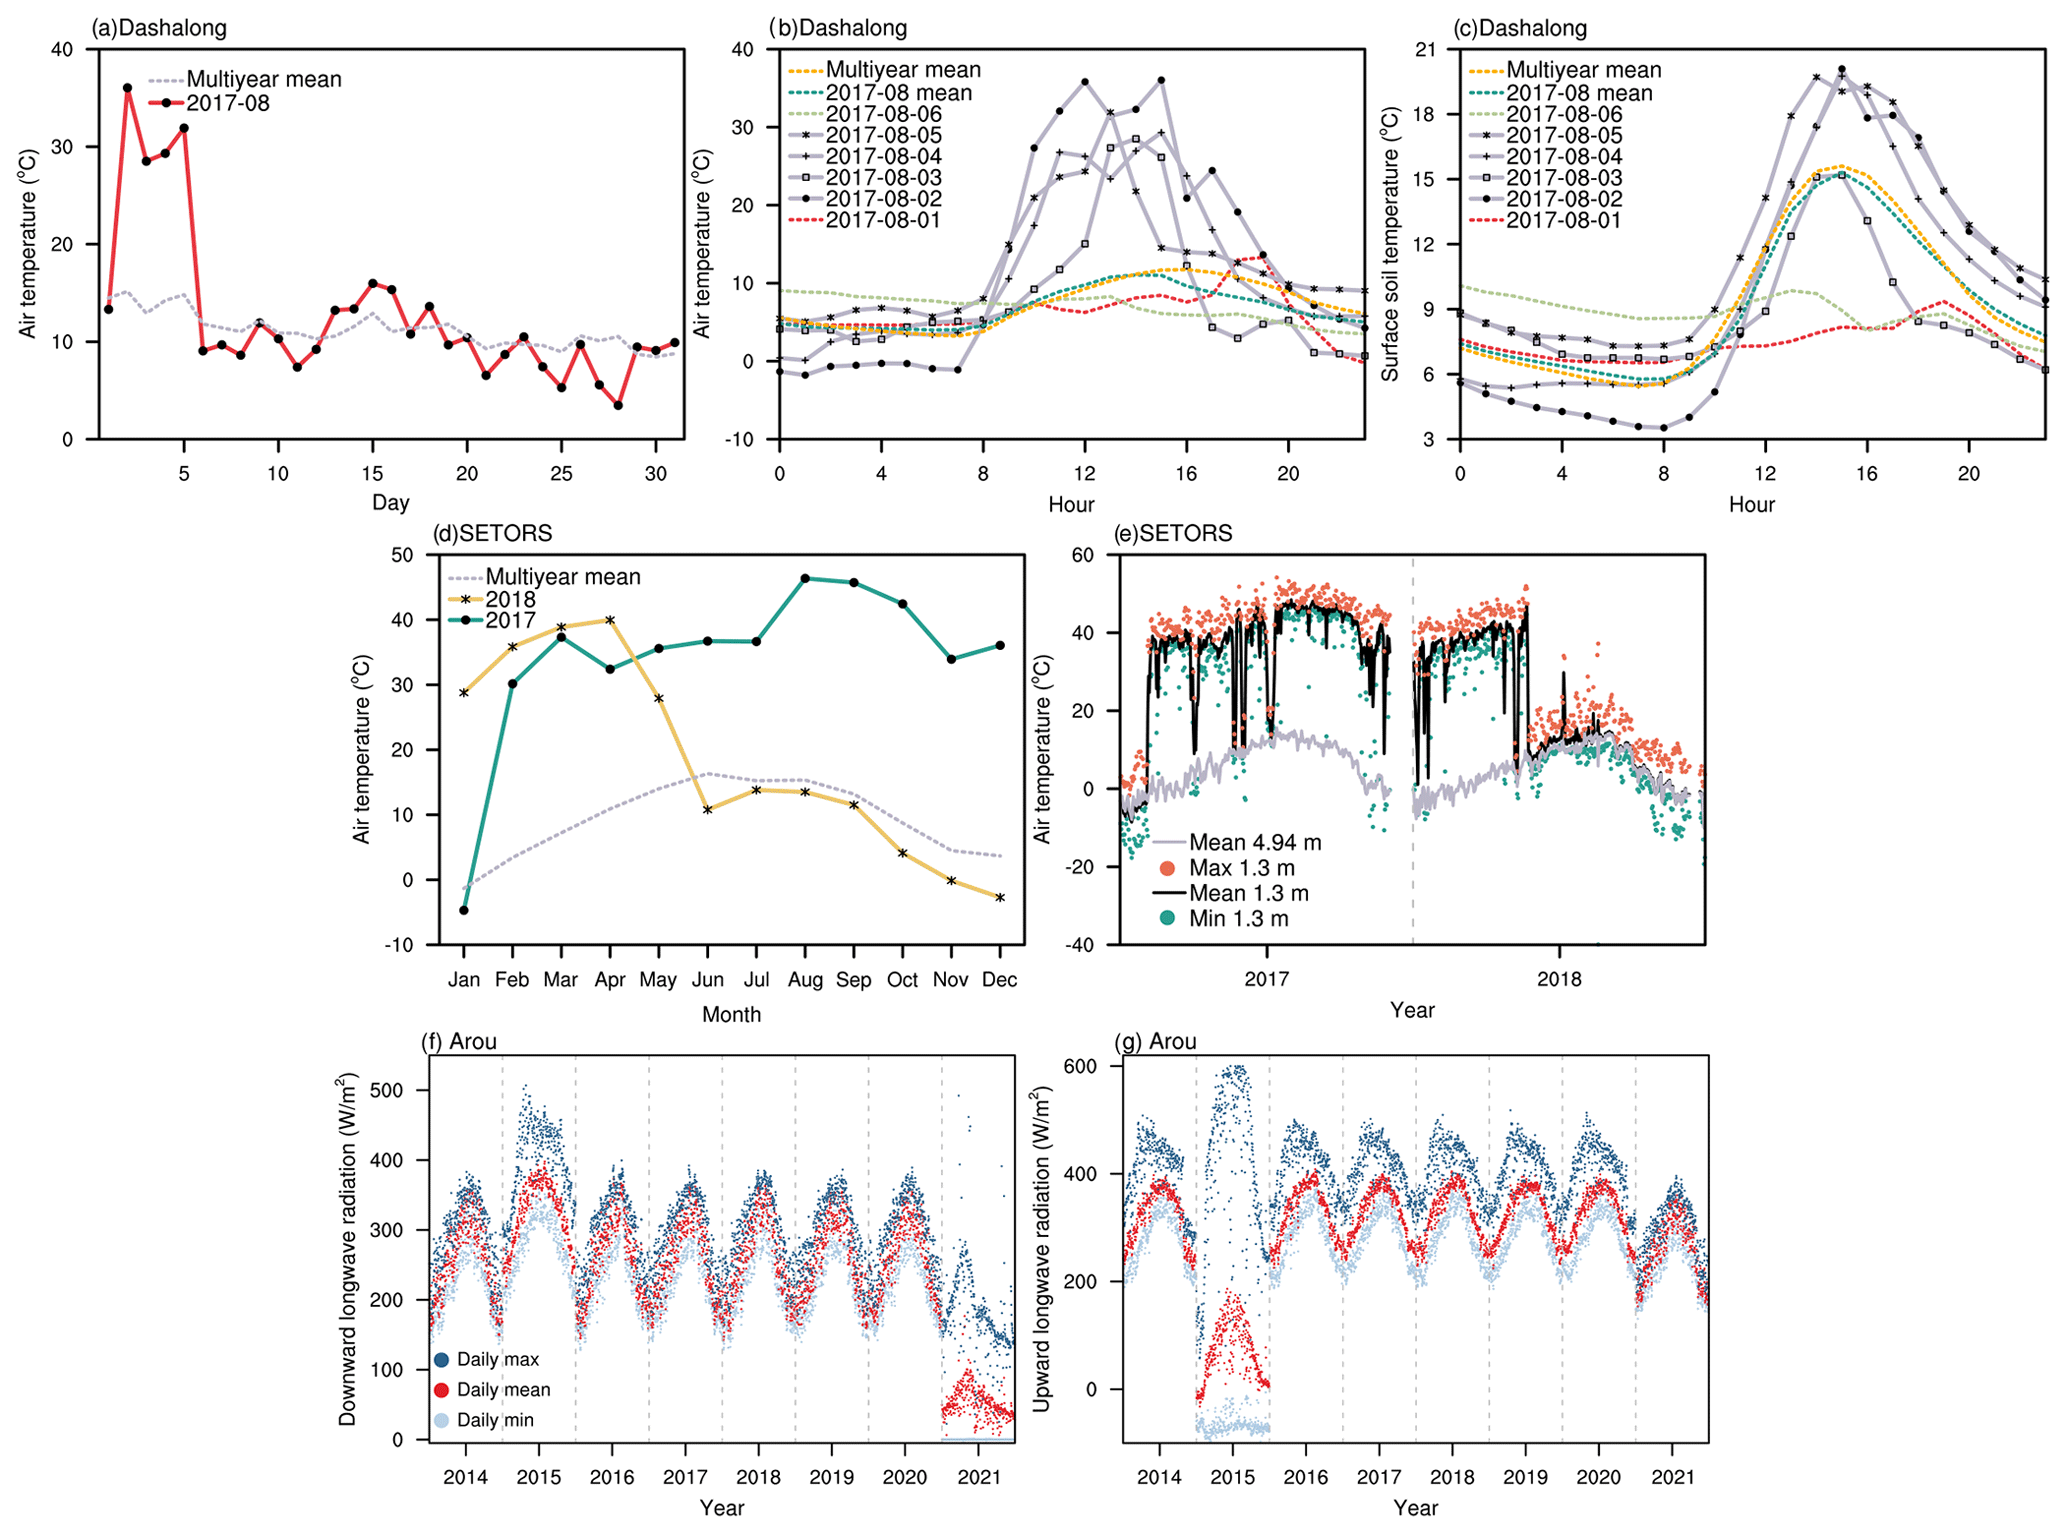
Figure 3(a) Variation in daily mean air temperature in August 2017 and the multi-year average for the corresponding month at the Dashalong station; temperatures during the period of 2–5 August 2017 were within the acceptable bounds but were significantly higher than neighbouring days. (b) Diurnal variations in the air temperature observed during 1–6 August 2017, monthly mean diurnal cycle in August 2017, and the multi-year average for August. (c) The diurnal variations in the surface soil temperature. (d) The seasonal variation in monthly mean 1.3 m height air temperature observed during 2017 and 2018, along with the multi-year average at the SETORS station; the monthly mean air temperatures from February 2017 to May 2018 deviated significantly from the multi-year mean. (e) The variations in daily minimal, mean, and maximum air temperature observed at 1.3 m and the daily mean temperatures observed at 4.94 m. (f) Variation in daily minimal, mean, and maximum downward longwave radiation. (g) Upward longwave radiation observed at the Arou station.
Internal consistency checks. This check is used to identify observations that deviate from a realistic meteorological relationship between two parameters (or from measurements of the same variable at different heights). When an internal consistency check was conducted, data with concurrent wind direction (wind speed) greater than 0 and zero wind speed (wind direction) were flagged as suspicious (with the QC code assigned to 1). Furthermore, if the wind speed and direction values remained unchanged for 12 consecutive hours, the likely cause was either a sensor that seized up due to extremely cold temperatures, as reported by Wang et al. (2023), or a data logger crash, which was occasionally observed at some sites on the TP. In this study, we performed internal consistency checks on soil temperature to verify their coordinated variation, making use of the relationships between adjacent layers of soil temperature series. Two layers that were adjacent to the target depth were employed as reference series. The data points were marked as errors when the data value differed from the mean value of two reference values by more than the site-specific defined thresholds (determined by a layer-by-layer analysis of the soil temperature time series at each site). For the first (deepest) layer, the two layers below (above) the target layer are defined as reference series. For other layers, the reference series is the one layer above and below the target layer.
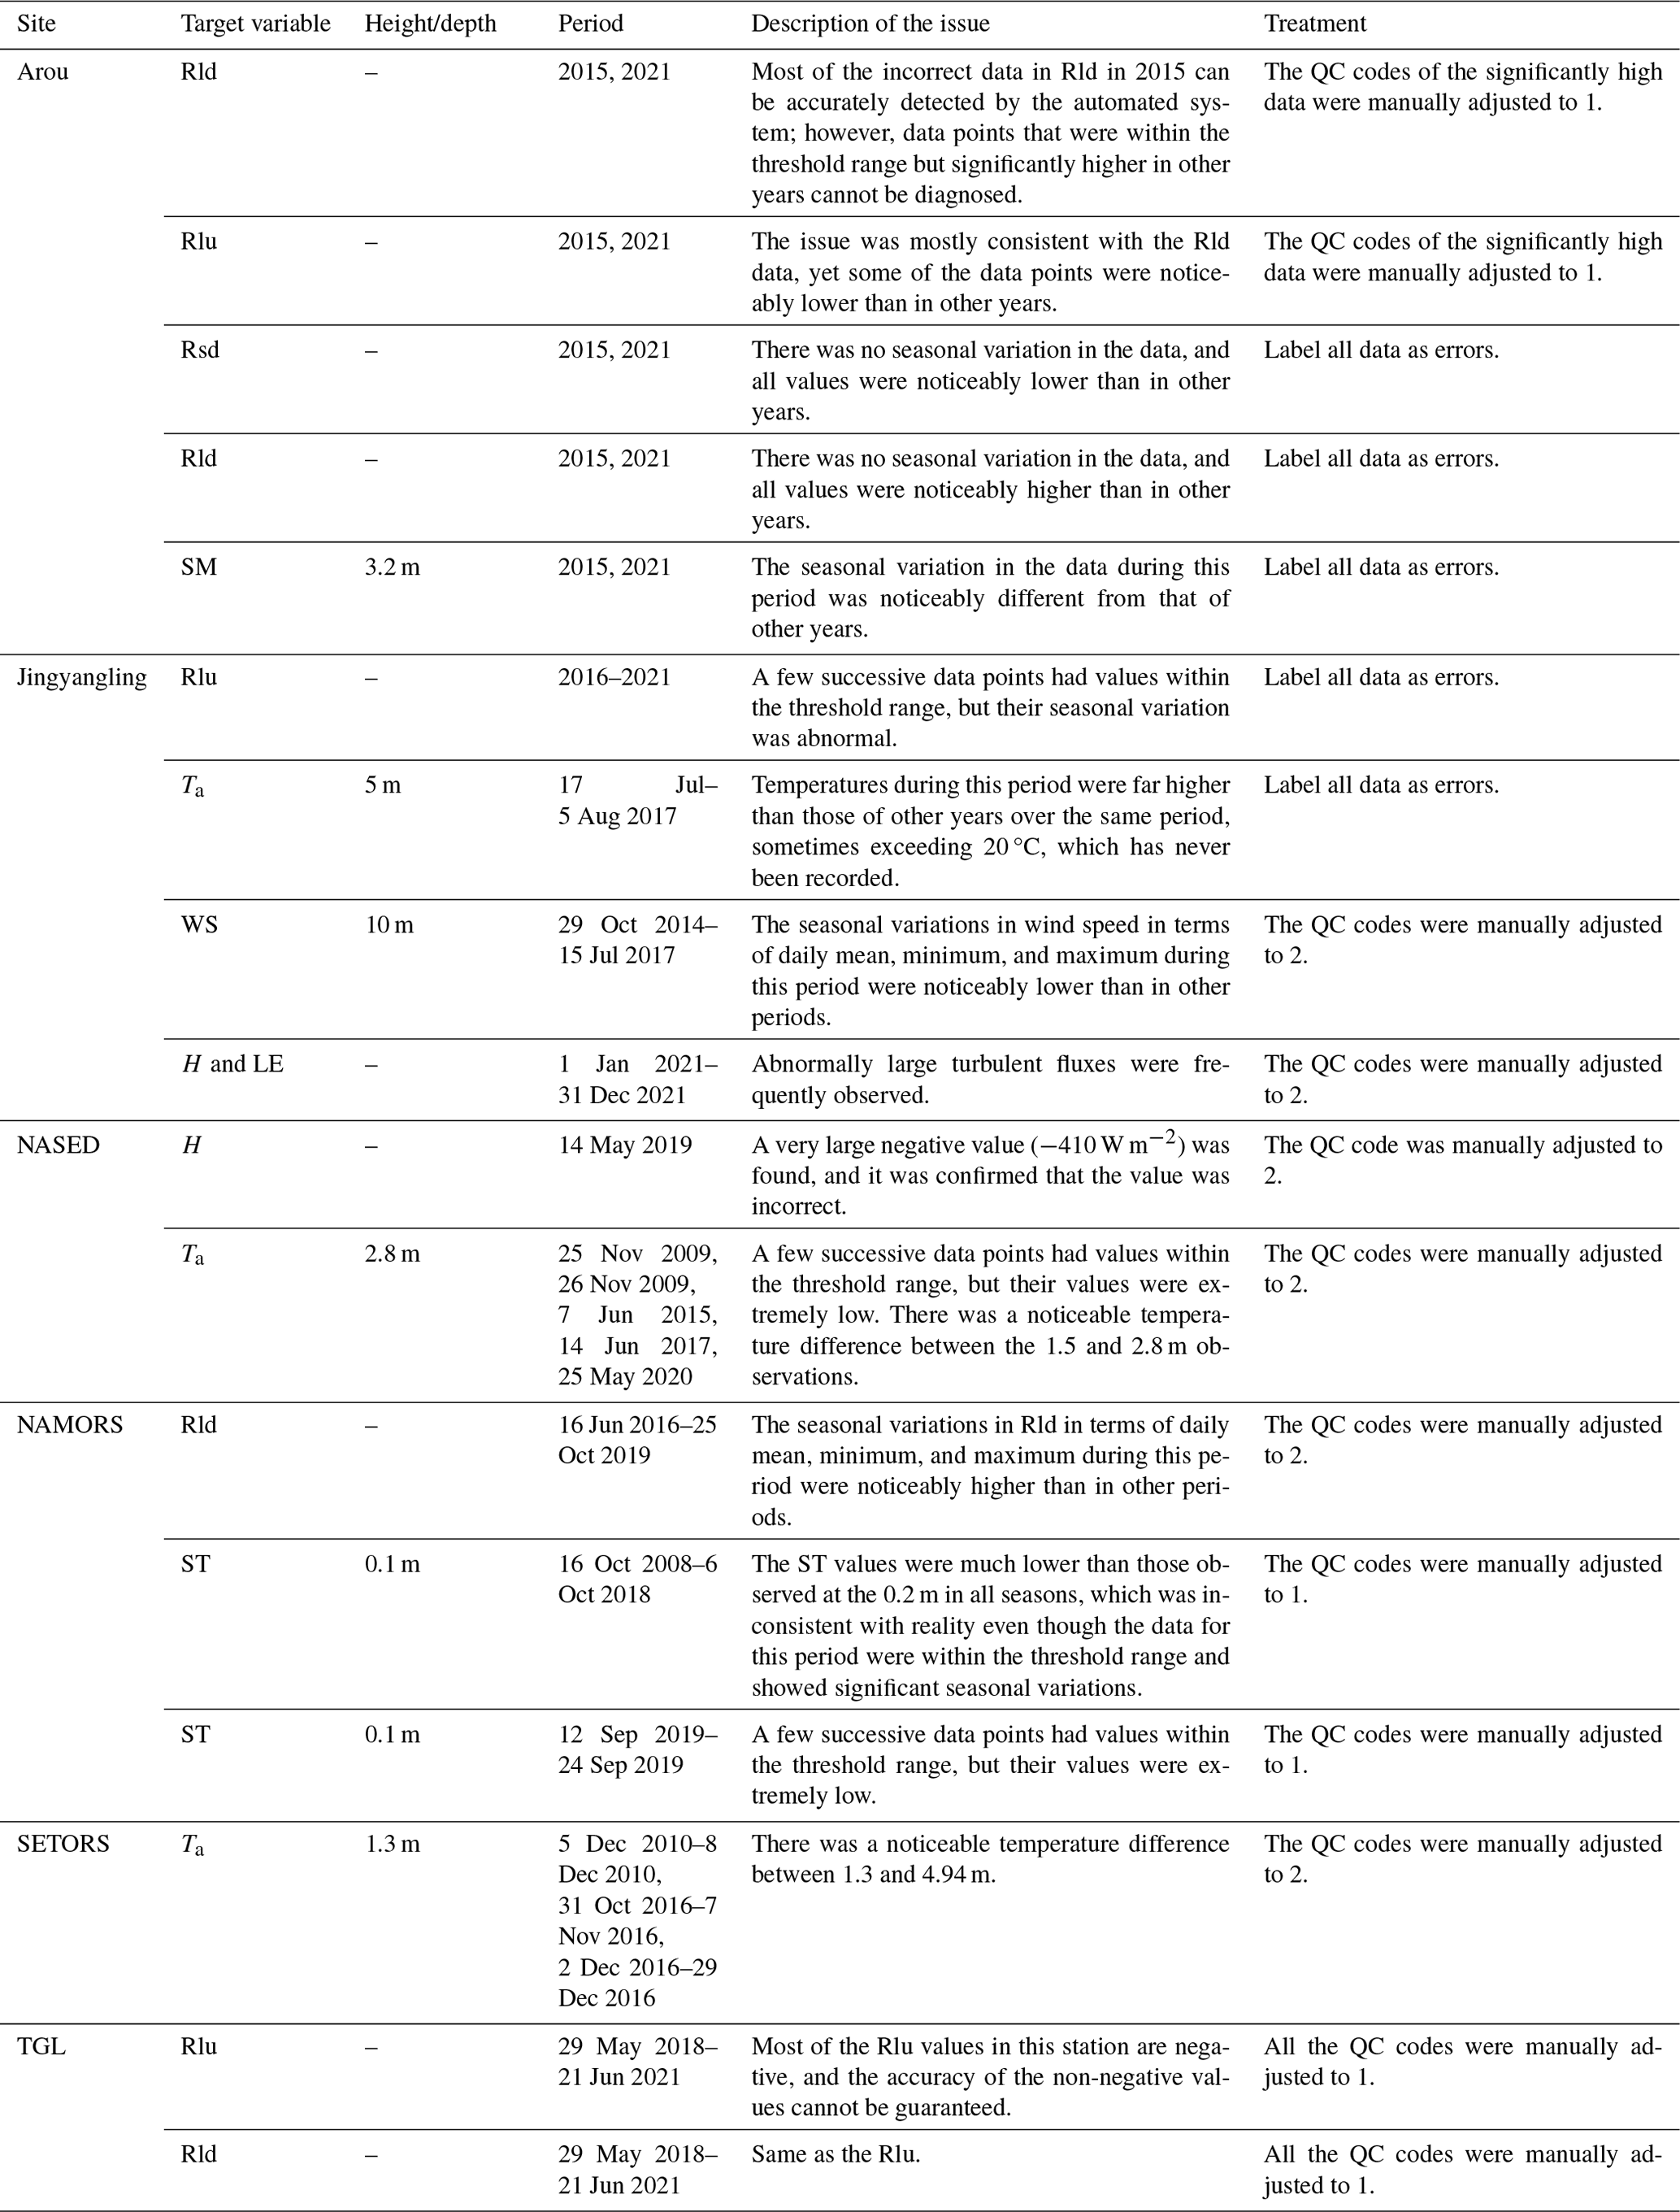
Manual quality assessment. Expert quality assurance is a vital means of ensuring data quality since it offers the crucial pieces of information that a quality assurance meteorologist needs to determine which data require further analysis. When all of the data points are within acceptable bounds and there is not an abnormal change, the algorithm might fail to accurately diagnose incorrect data. For instance, during the period of 2–5 August 2017, the maximum daily air temperature at the Dashalong station was approximately 30 °C, which was significantly higher than the mean maximum temperatures for the same period historically and on neighbouring days (Fig. 3a and b). Unfortunately, it was not possible to identify and flag these abnormally high temperatures (Fig. 3b) as these values were within the acceptable range. Further assessment is necessary to detect these abnormal values. Therefore, the seasonal diurnal cycles and the long-term variations in the minimum, average, maximum, and standard deviation of each variable at the daily scale were carefully examined. The reliability of the suspicious values was assessed by comparing them with other relevant variables (or the same variable but at different heights or depths) before performing manual QC code adjustments on these data points (see Fig. 3d and e, respectively, for a comparison of the abnormal temperature series at 1.3 m height from February 2017 through May 2018, with multi-year monthly means and daily means observed at 4.94 m, and see Fig. 3f and g for the abnormal variations in downward and upward longwave radiation in 2015 and 2021 for the Arou station). Table 3 lists all the QC scores that were manually revised following expert quality assessment.
Table 3A full list of manual adjustments of QC scores after expert quality assessment.
2.3.3 Gap filling
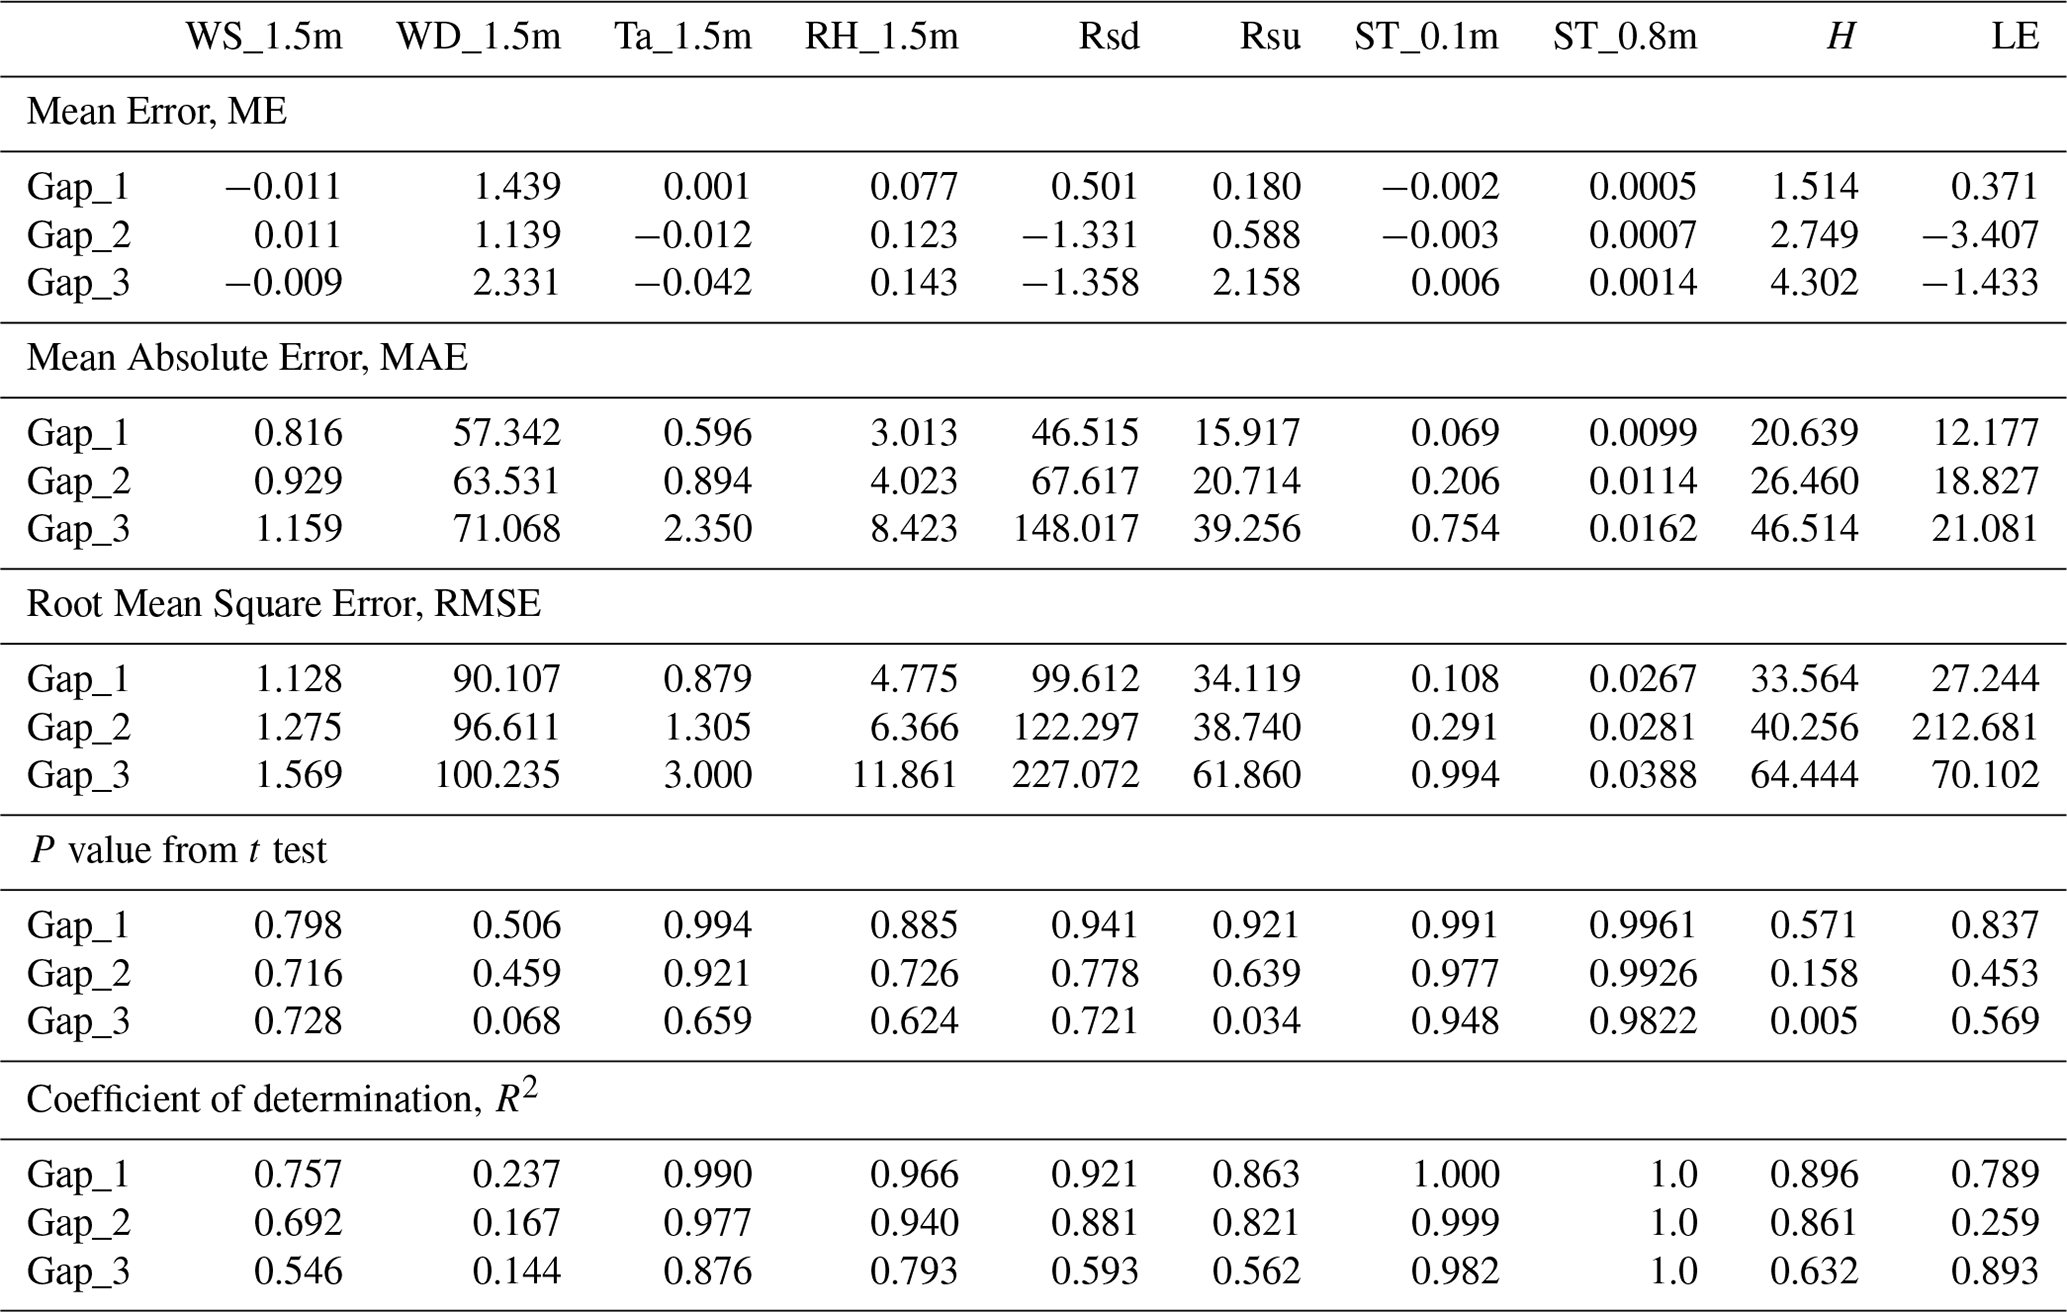
For all the data points marked as suspect, erroneous, and having missing values, the linear temporal interpolation method was applied if the number of consecutive non-zero QC flags was less than 3. Only short gaps were interpolated because the performance of the reconstruction method is strictly dependent on the length of the data gap (Henn et al., 2013). We believe that the entire set of procedures proposed here serves primarily to detect errors and was not intended to reconstruct data; although sophisticated methods (e.g., probabilistic filling and artificial neural networks) may offer increased performance for long-missing gap filling, a simple but effective linear interpolation method was used. All the gap-filled data points have their QC flag adjusted to 4. Series of random gaps (5000 records for each variable) with different lengths were artificially created to quantify the overall performance of the gap-filling method used and the robustness of the gap-filled data produced. The performance in terms of filling gaps in wind speed, wind direction, air temperature, relatively humidity, downward or upward shortwave radiation, soil temperatures (at depths of 0.1 and 0.8 m), sensible heat flux, and latent heat flux for gap lengths of 1, 2, and 3 h was evaluated. These variables were selected for assessment because they exhibit varying degrees of variability in the observed values over relatively short intervals. For example, wind speed and wind direction vary significantly over 1–3 h, whereas soil temperature changes less during that time. Table 4 shows the mean error, mean absolute error, root mean square error, p value from the t test, and r square. Results suggest that the gap length is one of the key factors that influences the performance. This is demonstrated by the fact that the longer the gap length is, the greater the error (ME, MAE, and RMSE) and the lower the coefficient of determination of the regression between the real values and the gap-filled values are; this is also the case for the relatively larger errors of the variables with a higher degree of variability in a short period of time (wind direction, for example, is the most unreliable to interpolate). The interpolated upward shortwave radiation series with 3 h gaps differs significantly (p<0.05) from the true values; for other variables evaluated, the difference is not significant. These findings suggest that the gap-filling method used in this study can reasonably reconstruct the gaps within 1 to 3 h.
Table 4Mean error (ME), mean absolute error (MAE), root mean square error (RMSE), p value from t test, and coefficient of determination calculated based on gap-filled artificially created missing data series and true values for gap lengths of 1, 2, and 3 h, respectively.
A final QC code was assigned to each specific variable, indicating correct (0), suspicious (1), erroneous (2), gap filled (4), missing (8), and without any check performed (9).
2.3.4 Data archiving
During the archiving step, the header descriptions of the output files were first standardized to include information about the variable name, height or depth, and units. This information was expressed in the following format: variable_height/depth(units). The variable names are expressed as abbreviations, which are listed in Appendix A. Two levels of datasets were produced for this study. Level 0 contains the hourly observations extracted from the raw data collection without any further processing applied and could contain errors and gaps in time. Level 1 is the quality-assured and partially gap-filled observations.
3.1 Near-surface meteorological data
To illustrate the near-surface micrometeorology characteristics of each station, Fig. 4 compares the diurnal variation in wind speed, air temperature, relative humidity, and air pressure at a monthly scale and the seasonal variation in daily mean values. Note that the lowest layer was chosen for stations with gradient meteorological parameters observed; although observing heights vary among stations, height adjustment is not implemented in this study. For the Yakou, Dashalong, and Jingyangling stations, the wind speeds were observed at a height of 10 m, which was much higher than at other stations.
3.1.1 Wind speed
Most stations exhibit discernible diurnal variation across the various seasons. Wind speed typically increased steadily from noon onwards and peaked between 15:00 and 17:00 UTC+8 (depending on the station). This was followed by a gradual decrease (see Fig. 4a and c). Wind speed was generally steady and modest during the night, except for the Yakou station, with nighttime wind speeds there being comparable to daytime wind speeds from October to December (Fig. 4a). Seasonally, winter wind speed observed at the TGL station exhibited the highest diurnal variation, whereas strong wind speeds throughout the day made the Yakou experience higher mean wind speeds on a daily scale than the others in October, November, December, and January. Winter is often the season with the highest daily mean wind speed; however, this was not the case for the Arou, Jingyangling, and NASED stations, and winter also did not see the largest diurnal variation in these stations. The seasonal differences in wind speeds observed at Arou and SETORS were not significant. In comparison to other stations, the SETORS station had the lowest daily mean wind speeds, while its diurnal variance was more pronounced than that of the Arou station. Variations in wind speed between different geographic locations are caused by several crucial factors. One major influence is the atmospheric pressure gradient forces, resulting from temperature gradients and variations in atmospheric pressure. This pertains to the relatively higher wind speeds observed at the TGL, QOMS, Ngoring Lake, and NAMORS stations. The wind in these regions accelerated due to thermal difference between the ice and/or lake and the land (Sun et al., 2007; Meng et al., 2023). Another factor to consider is the land surface conditions, including the roughness of the landscape that the air has to flow over and the local geographic features. Wind speed was typically higher in stations with smooth surfaces such as ice (TGL) or lakes (Ngoring Lake and NAMORS). On the other hand, over rough surfaces, such as at SETORS, which is surrounded by forests that increase friction and slow winds down, the wind speed was relatively small. It is worth noting that wind speeds recorded at Dashalong station between May 2014 and September 2015 were notably lower than during other periods.
3.1.2 Air temperature
The near-surface temperature did not follow a consistent declining trend with increasing altitude. In fact, air temperatures in certain lower-elevation regions were even colder than sites with higher elevation. This difference was particularly noticeable during the winter. For instance, the average daily mean winter temperature at Arou station (3033 m) was about 5.4 °C lower compared to that at the Maqu station (3434 m) and 8.9 °C lower than that observed at the QOMS station (4276 m). The latitude difference among the stations is a key factor as the maximum sunshine duration and the solar zenith angle are highly dependent on the latitude, influencing greatly the absorption of solar radiation. The seasonal variations in daily mean winter temperature from four stations (Arou, Dashalong, Jingyangling, and Yakou) located at similar latitudes confirmed this association (Fig. 4f). In this case, latitude is the determining factor in the rise of near-surface temperature with increasing elevation at these three stations. Additionally, elevation also has a significant impact on air temperature. For example, consider Maqu (3434 m) and Ngoring Lake (4280 m), which have comparable latitudes but show a range of around 800 m in terms of elevation. The daily mean air temperature observed at the higher-elevation station of Ngoring Lake was 4.5 °C colder than that of the Maqu station throughout the year (Fig. 4f). Moreover, the multi-year mean diurnal temperature variations indicate that the peak temperatures in Arou were noticeably higher than those recorded at the other three stations situated on the same latitude. The near-surface temperature at NASED (33.39° N, 4270 m) was higher than that at QOMS (28.36° N, 4276 m) station (Fig. 4g and f). These two stations are located at roughly the same altitude, with a latitude difference of nearly 5°. The fact that more rainfall events occur at the QOMS station during the monsoon season because of the summer monsoon may be the cause of this difference in air temperature.
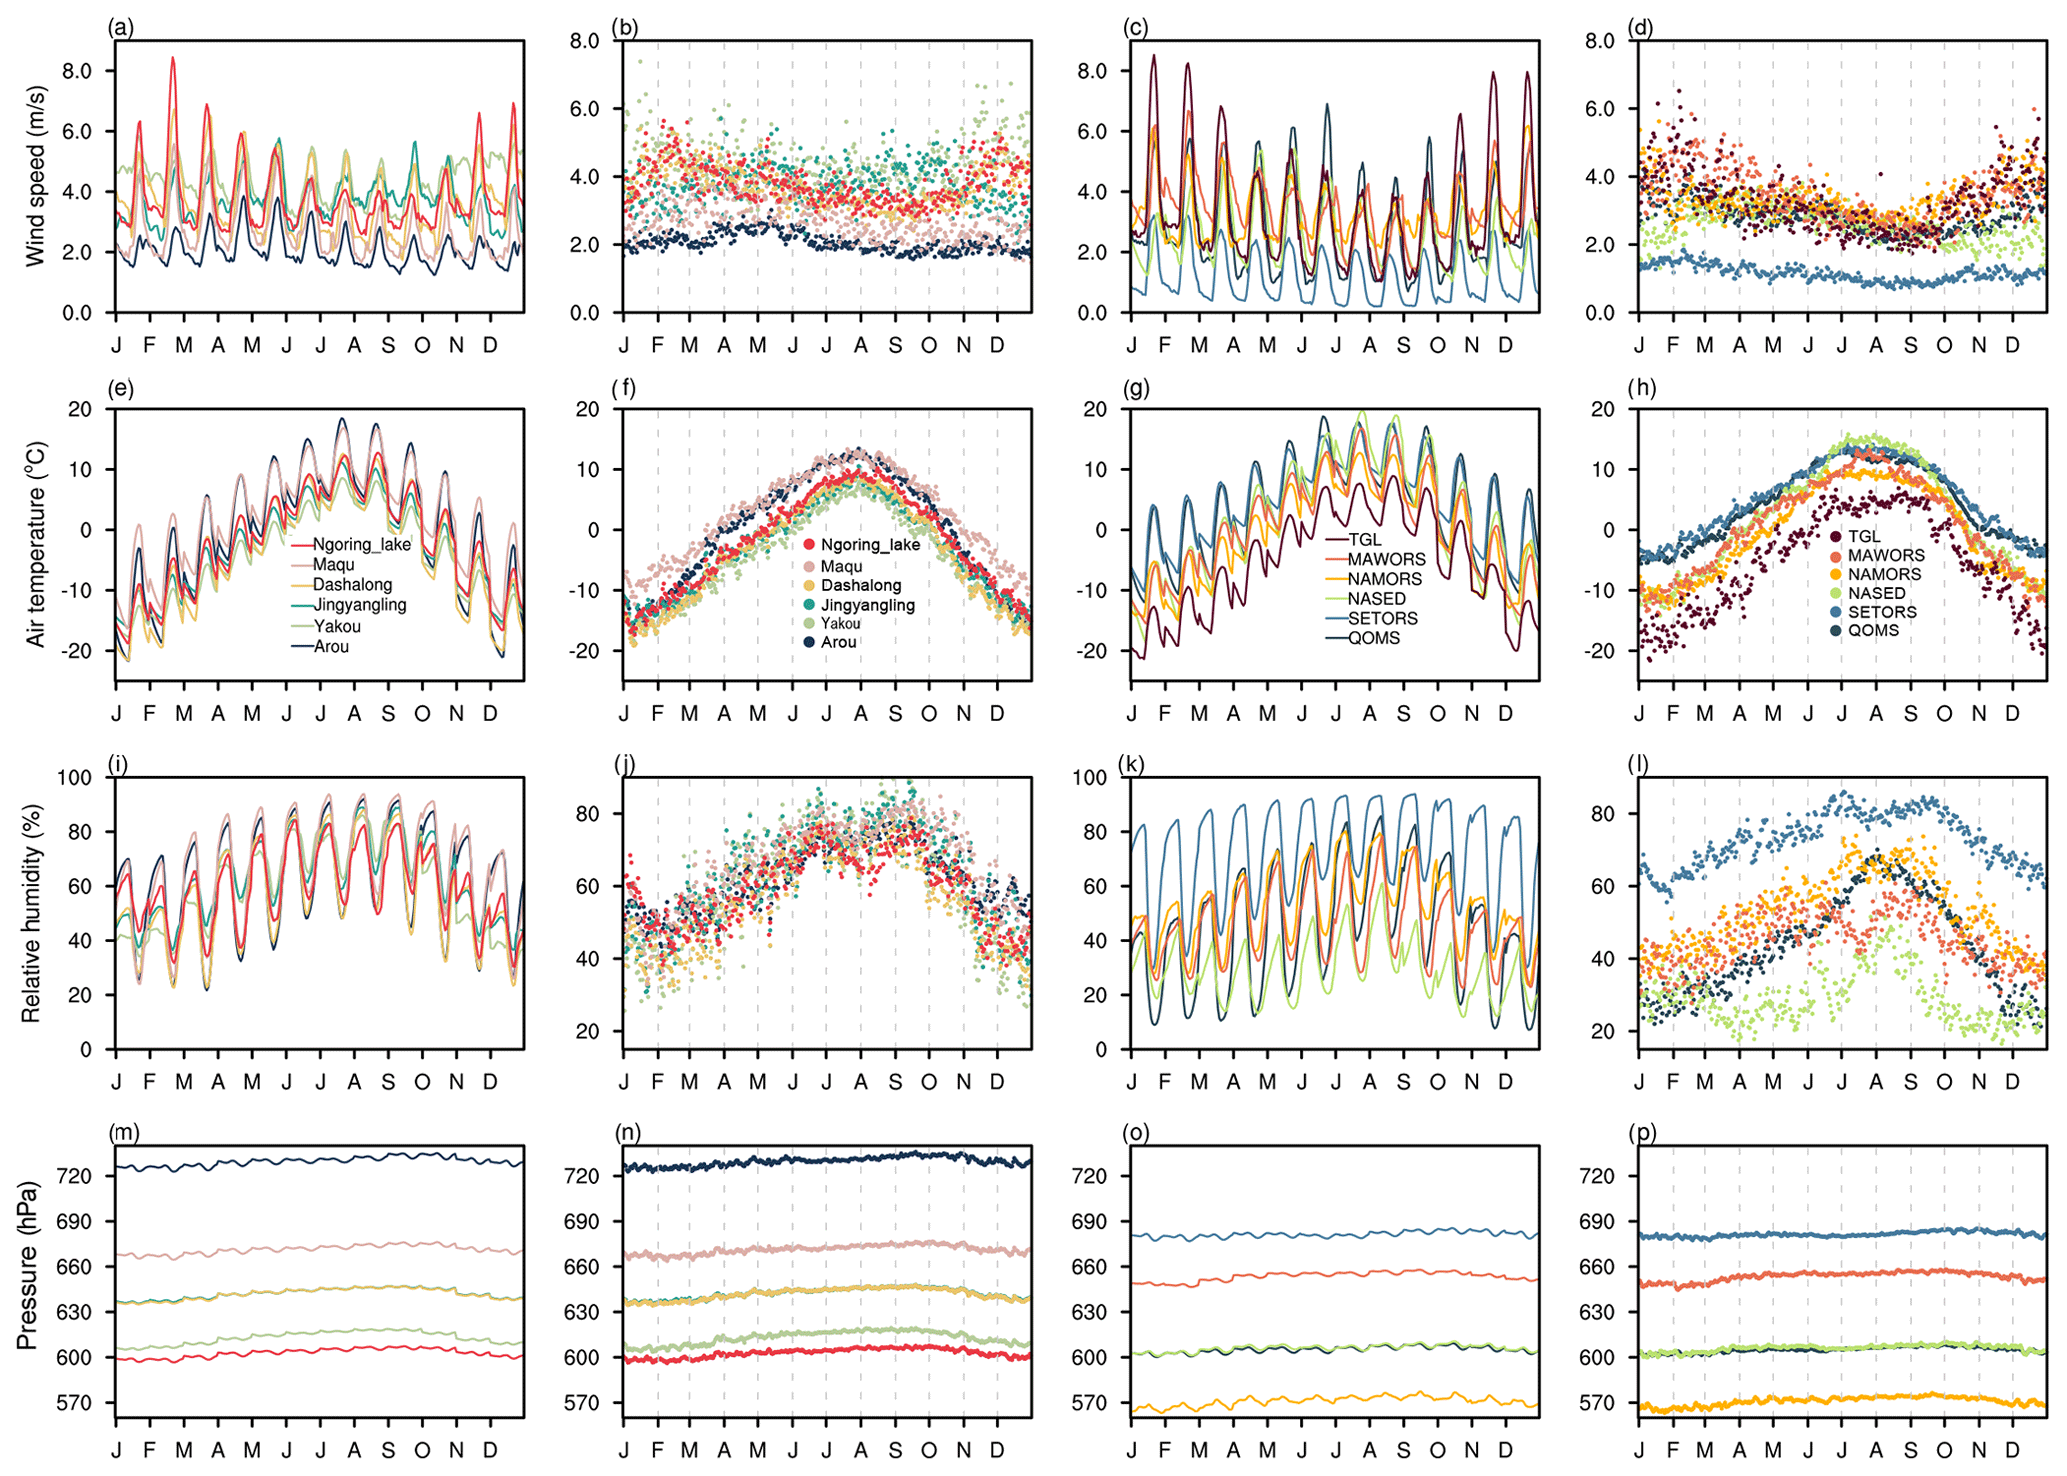
Figure 4Seasonal variations in the diurnal (the first and the third columns) and daily mean (the second and the fourth columns) wind speed (a–d), air temperature (e–h), relative humidity (i–l), and air pressure (m–p) at the 12 stations.
3.1.3 Humidity
There was a negative correlation between the diurnal variation in relative humidity and air temperature when compared across stations. The peak relative humidity (Fig. 4i and k) typically matched with the coldest temperatures (Fig. 4e and g). This also coincided with the deep V-shaped variation in relative humidity observed at each station when the summer daily mean temperature reached its peak. Station-specific differences existed in the timing of the summertime reduction in relative humidity (Fig. 4j and l). The relative humidity varied greatly at both the diurnal and seasonal timescales for the QOMS and SETORS stations, which share comparable values and seasonal variances in the daily mean air temperature. It was observed that the daily mean relative humidity at the SETORS station remained consistently higher (above 60 %) throughout the year. The wet atmosphere at the SETORS station was closely associated with its location within the largest corridor for water vapour transport to the TP. In contrast, with relative humidity below 40 % for most of the year save for the summer, NASED was the driest station apart from TGL (where relative humidity observations are unavailable).
3.1.4 Air pressure
The diurnal and seasonal air pressures showed slight variations (Fig. 4m–p). Among the stations where air pressure observations were available (excluding the TGL station, where air pressure was not recorded), the NAMORS station exhibited the lowest pressure due to its altitude being second only to that of the TGL station. Barometric pressure decreases with increasing altitude, with the highest recorded pressure being at Arou station, which has the lowest altitude among all stations. Moreover, although there were minor differences in altitude, stations like Dashalong, Jingyangling, QOMS, and NASED had almost identical air pressure.
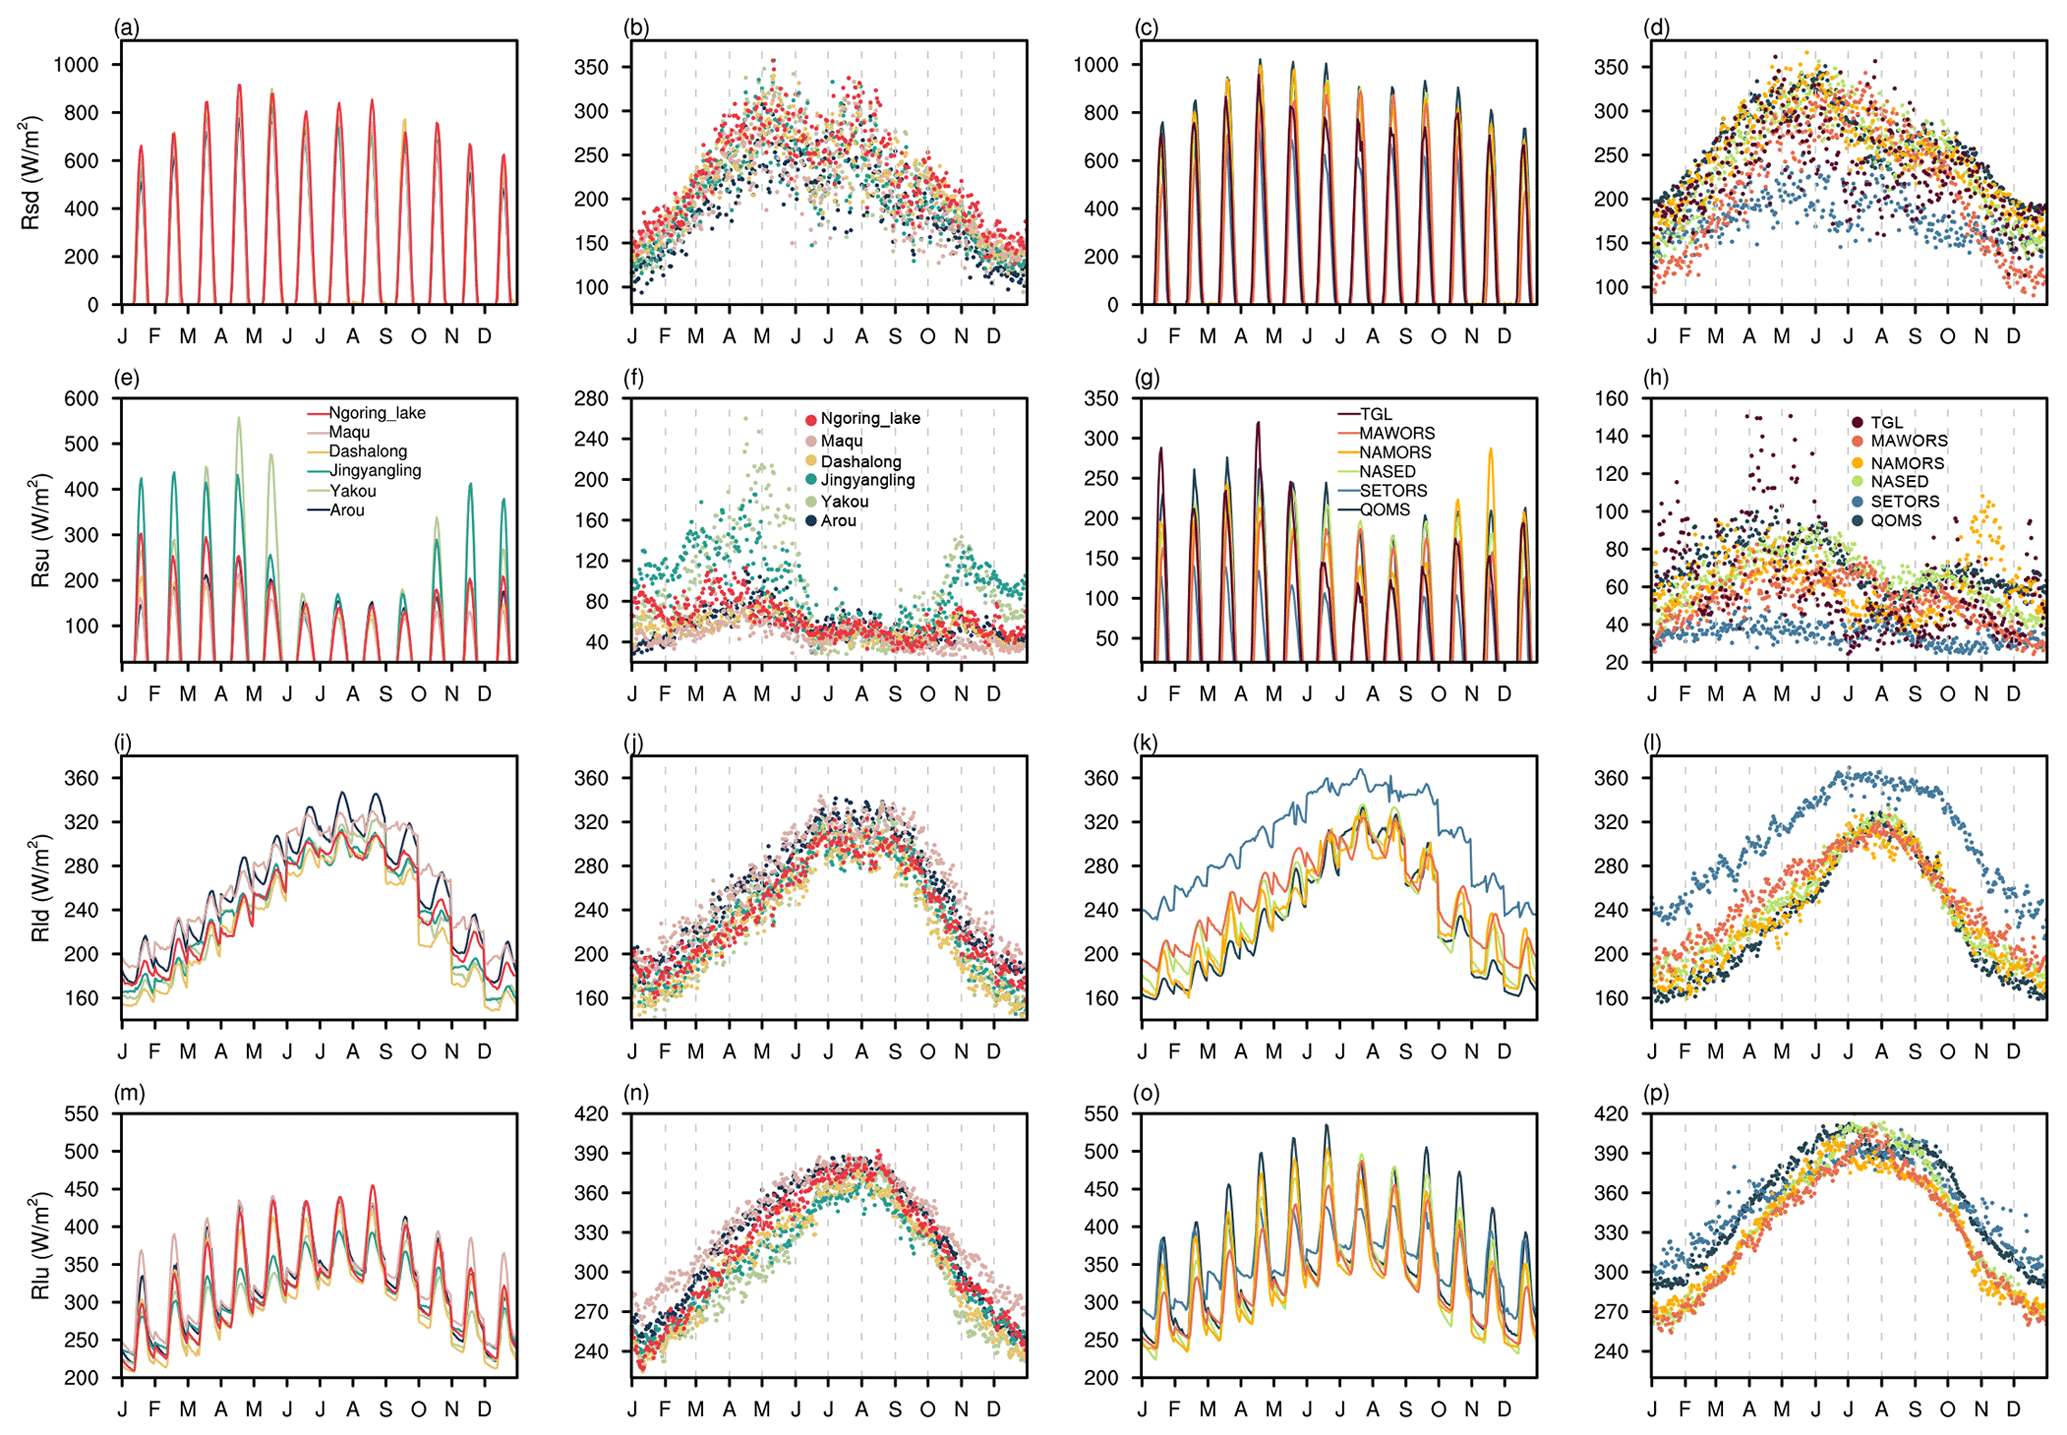
Figure 5Seasonal variations in the diurnal (the first and the third columns) and daily mean (the second and the fourth columns) downward shortwave radiation (a–d), upward shortwave radiation (e–h), downward longwave radiation (i–l), and upward longwave radiation (m–p) at the 12 stations.
3.1.5 Radiation
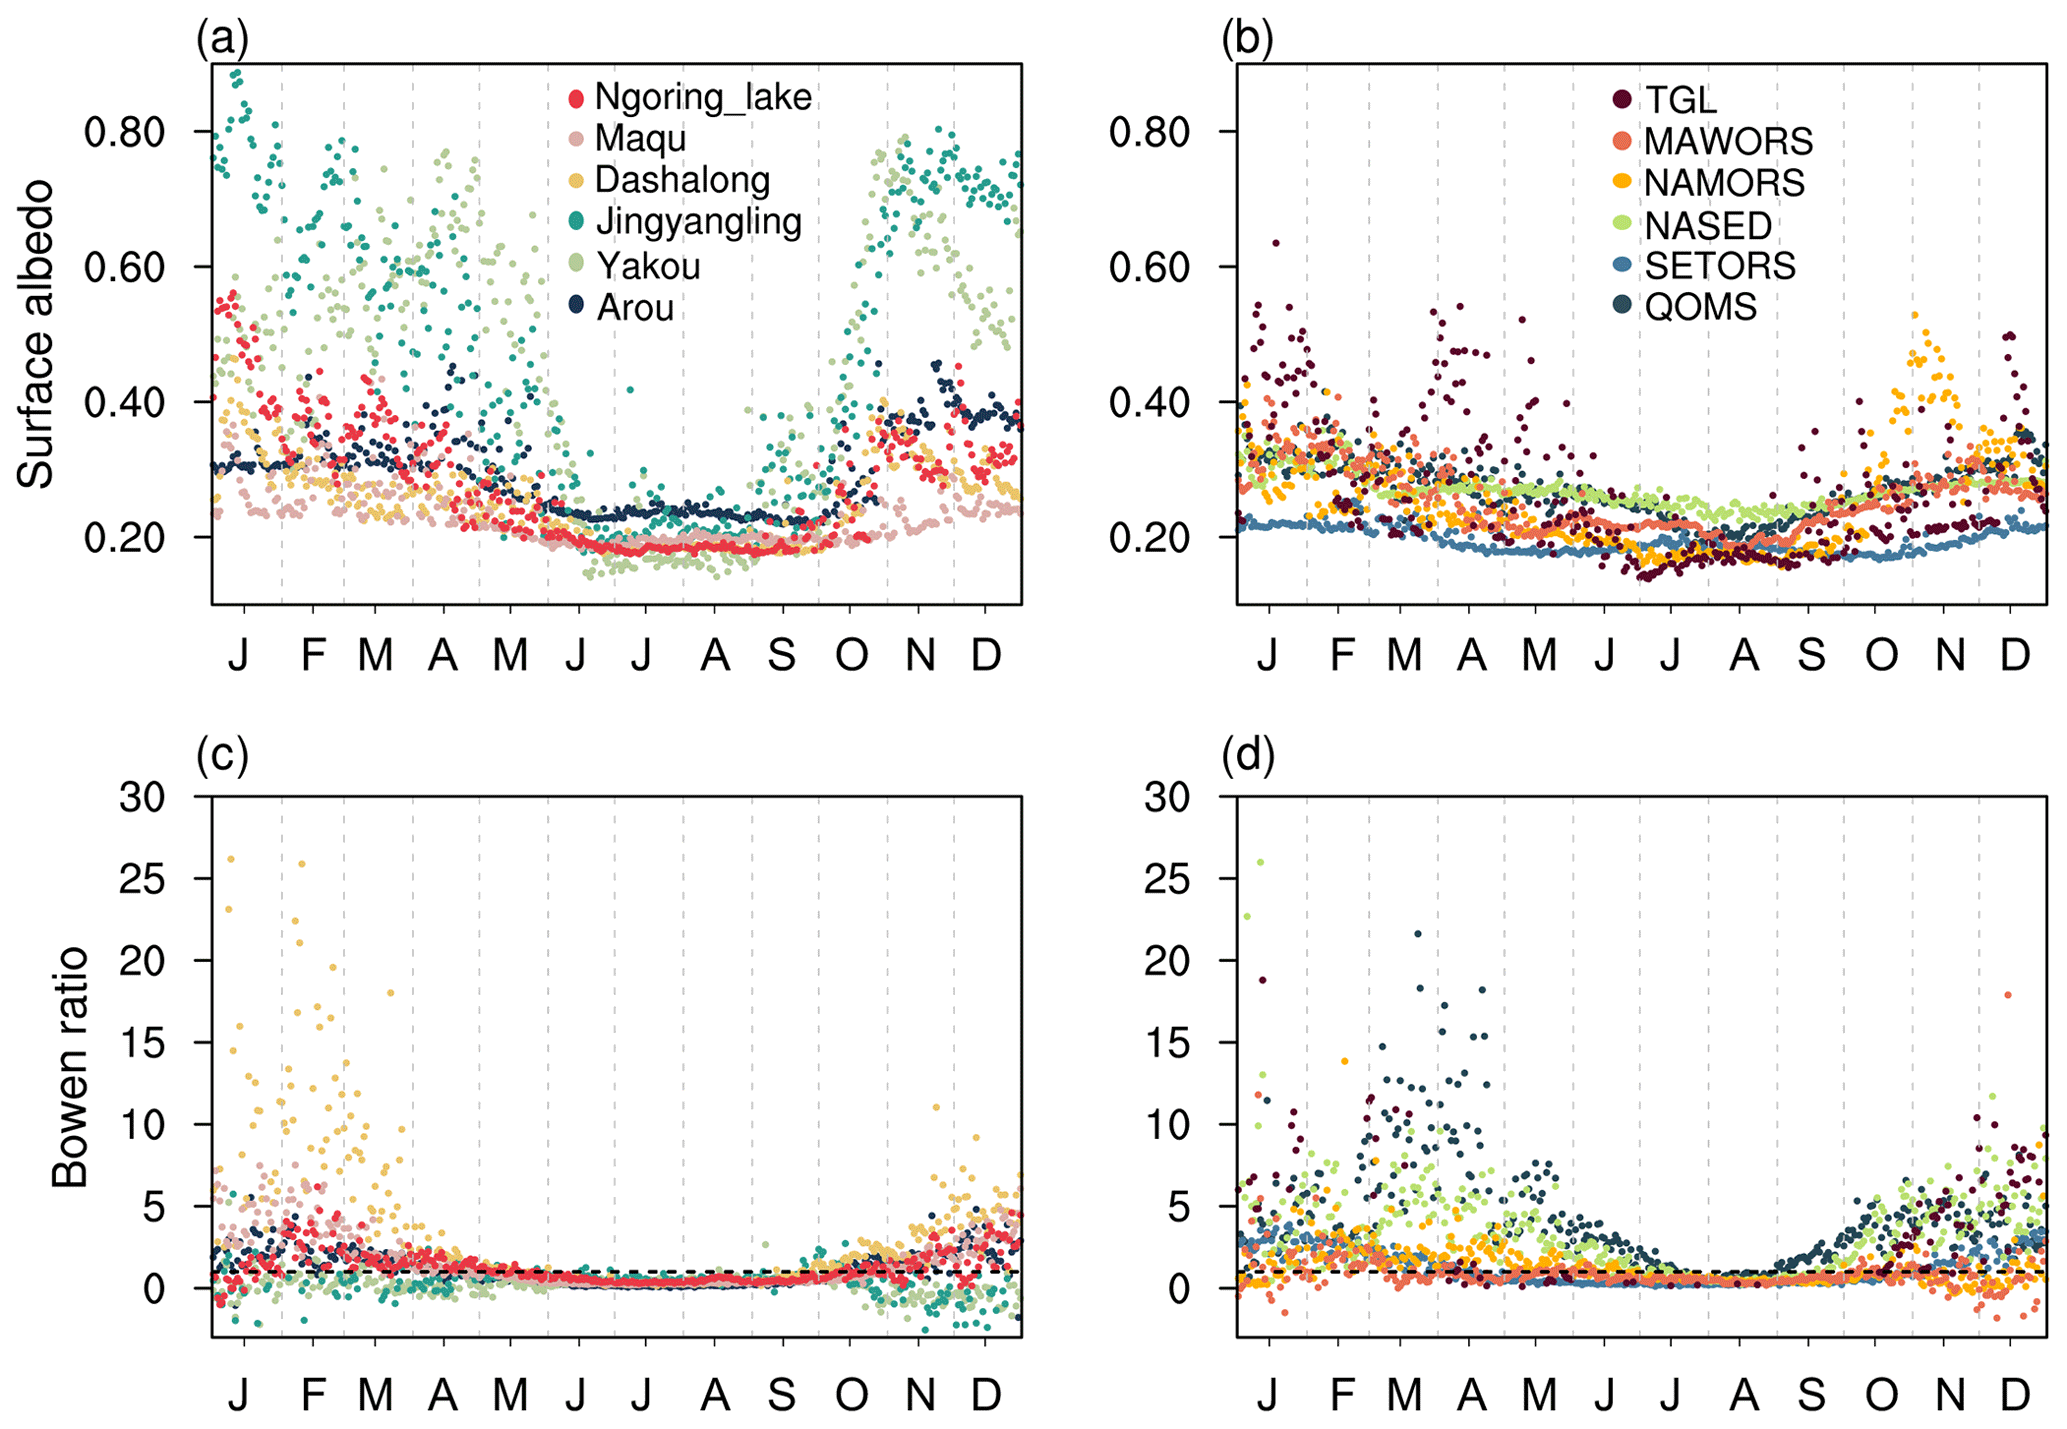
The downward shortwave radiation (Rsd) demonstrated a similar pattern in variation across all stations during the summer. Initially, there was a decrease in Rsd, followed by a subsequent recovery (Fig. 5b and d). While specific stations (e.g., SETORS and TGL) started to decline in May, the majority of the decline in Rsd happened in June and July. Given that the majority of the precipitation on the TP occurs in summer, there may be a direct connection between this and the concurrent precipitation events. The seasonal variation in solar radiation over the TP was also significantly influenced by changes in cloud cover. The upward shortwave radiation (Rsu) was very low during the rainy season (June to August), which can be explained by the low surface albedo (Fig. 6) caused by factors like the damp soil and the heavy vegetation cover during this period. A rapid rise in Rsu was observed at the Jingyangling, Yakou, TGL, Ngoring Lake, and NAMORS stations in late autumn and winter–spring, attributable to the high albedo of snow cover. Further analysis revealed that, from early October through May of the following year, the surface albedo at the Yakou and Jingyangling stations remained above 0.4 (Fig. 6). This result agreed with the changes in snow depth observed at Yakou station (Che et al., 2019), indicating that snow plays a dominant role in the local hydrologic cycle. In contrast, Maqu and SETORS exhibit small Rsu, presumably owing to the greater vegetation coverage and little snow cover distributed in these areas.
There was a noticeable seasonal variation in downward longwave radiation (Rld), but the diurnal variability was not very large throughout the seasons. The highest values were recorded in summer (June to August) when the total cloud cover was high. The SETORS station showed consistently higher Rld compared to other stations throughout the year, which was attributable not only to the warmer ambient temperatures but also its cloud cover. A more thorough examination of the seasonal variations in near-surface temperature, relative humidity, and Rsd at the QOMS and SETORS stations revealed that the difference in the water vapour content of the air was also a significant contributor to the spatial variability in Rld across stations. The figure did not display both downward and upward longwave radiation from TGL station since these observations failed the quality control test and were deemed to be anomalous. The QC codes of the Rld observed during the period from June 2016 to October 2019 were manually adjusted to 2 after the expert quality assessment (listed in Table 3).
3.2 Soil hydrothermal data
The soil hydrothermal process is crucial for the exchange of energy, moisture, and material between the land surface and the atmosphere. Figure 7 compares the multi-year mean diurnal and seasonal variations in the shallow-layer (0.1 m depth) soil temperature and soil moisture to better illustrate the hydrothermal differences due to the spatial variability in soil physical and chemical properties (e.g., soil type, porosity, organic matter content), vegetation characteristics, and meteorological conditions between stations. The soil hydrothermal measurements observed at 0.2 m depth were chosen for comparison for the NASED station as observations at 0.1 m depth were not recorded prior to 2020. It should be noted that the gaps in the annual variations were caused by the existence of missing data on soil temperature and moisture, such as the poor continuity of soil hydrothermal observations at TGL station.
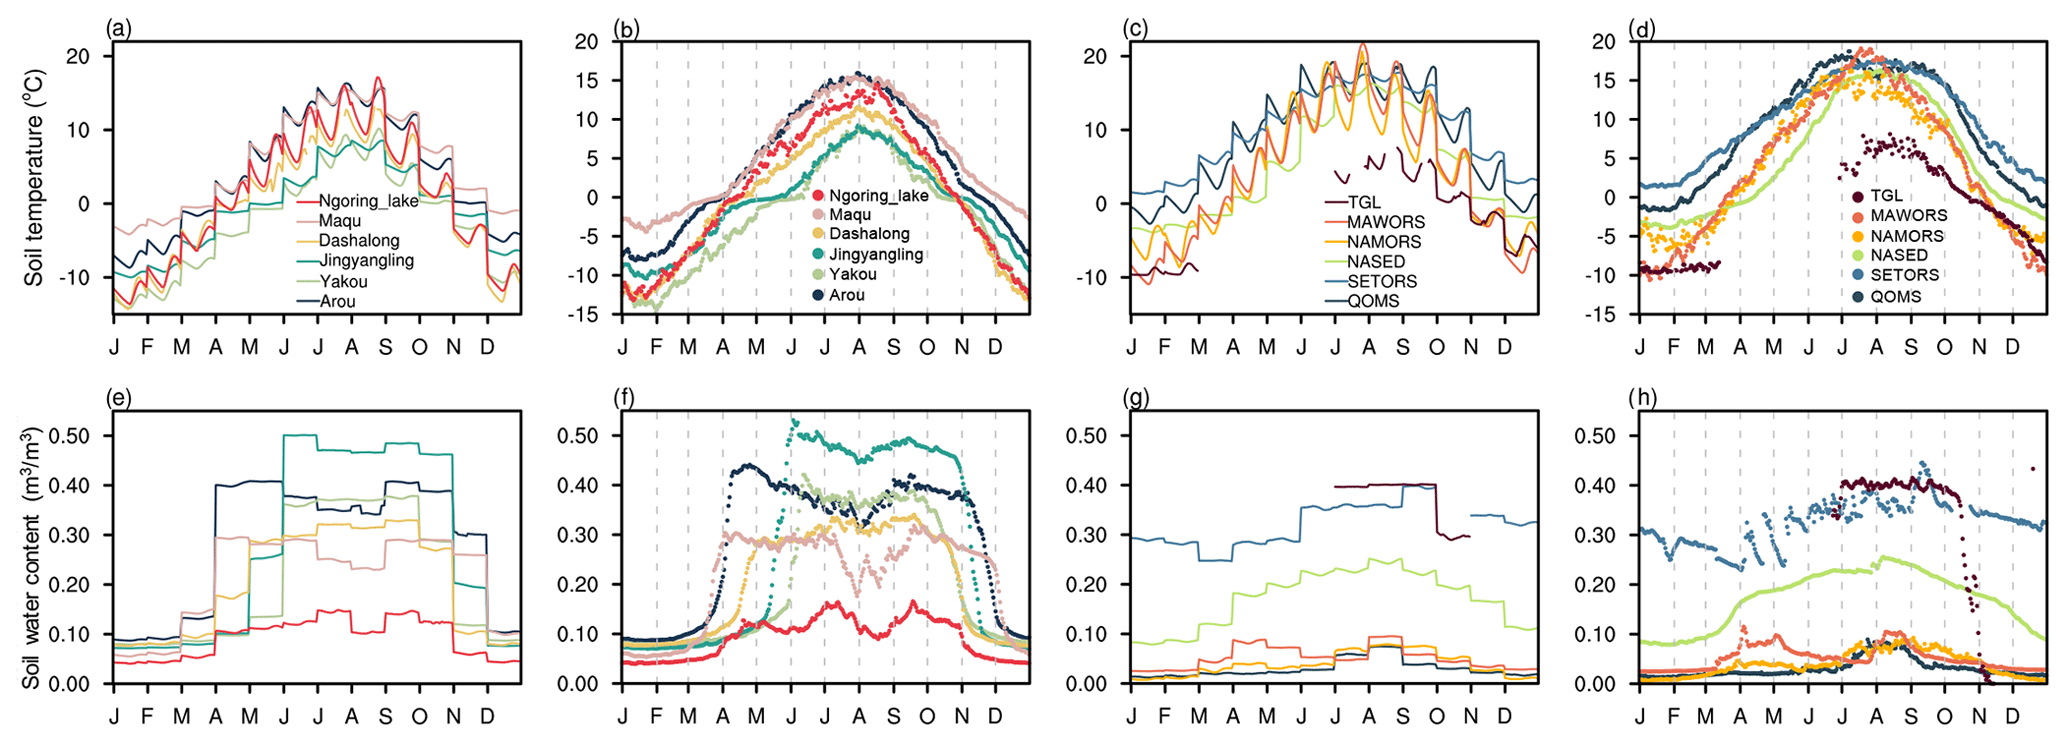
Figure 7Seasonal variations in the diurnal (the first and the third columns) and daily mean (the second and the fourth columns) shallow-layer (0.1 m depth for stations, except NASED, where 0.2 m was used) soil temperature (a–d) and soil water content (e–h) at the 12 stations.
3.2.1 Soil temperature
On a diurnal and seasonal basis, the soil temperature at 0.1 m depth at each station showed high consistency with the air temperature and upward longwave radiation. While the diurnal variations in soil temperature were not as great as those of the other two variables across the seasons, there were still appreciably greater spatial differences in soil temperature between stations. The data quality control and interpolation of missing points in time series can both benefit from the consistent variations across different variables. At the SETORS station, the 0.1 m depth soil temperature stayed above 0 °C throughout the year, with only minor daily variations between seasons (Fig. 7c and d). Conversely, the daily mean soil temperature at Yakou station can drop as low as −15 °C in winter. Specifically, it should be highlighted that the topsoil temperature (0 cm) is affected by multiple factors, resulting in a complex and substantial fluctuation with a high level of uncertainty. Therefore, considerable care must be taken in selecting the topsoil temperature observations for analysis.
3.2.2 Soil moisture
Soil moisture showed two peaks throughout the year, with a reduction occurring primarily during the summer season, followed by an increase in early autumn. This tendency was more noticeable at the northeastern stations (Fig. 7f). Soil moisture increased rapidly with temperatures exceeding 0 °C, and this was closely linked to the occurrence of precipitation and the resulting rise in surface runoff (Li et al., 2021). Summertime soil moisture was mostly dependent on precipitation; in the absence of precipitation, evapotranspiration and water infiltration caused a sharp decline in soil moisture at shallow depths. As shown in the surface albedo, annual variations highlight that snowfall followed by snowmelt might contribute to the late-summer and early-autumn rise in soil moisture. Because of the humid air, dense vegetation cover, and high soil temperature at the SETORS station, the shallow soil remained moist all year long. The 0.2 m soil moisture at the NASED station was much greater than that at the QOMS, NAMORS, and MAWORS stations, whose altitudes are equivalent to the NASED station. This suggests that the soil moisture profile had a large vertical variation.
3.3 Turbulent flux data
Sensible and latent heat fluxes are two main forms of heat transfer that occur between the surface and the atmosphere. Figure 8 displays the diurnal variations and annual fluctuation in these fluxes, with a QC flag labelled as 0 or 1. It should be specifically emphasized that the turbulent fluxes at the TGL station were seriously missing (see Fig. A3 in the Appendix for year-by-year data availability and data quality); hence, it is highly recommended that one assess the data availability before performing the analysis.
At each station, the sensible heat flux (H) increased as temperature rose but declined when precipitation occurred and cloud cover increased. The month in which H peaked varied greatly amongst stations; for instance, it typically peaked in March at SETORS and in June at QOMS. This was highly coincident with the beginning of precipitation events (Chen et al., 2012). Yakou and Jingyangling stations did not experience a significant increase in H in the spring due to the existence of surface snow cover. Instead, a rapid decrease in H to negative values was observed in middle to late October, indicating that the surface absorbed energy in this period was primarily used for snowmelt. This emphasized the critical role of the seasonal snowpack in the surface energy budget. At night, there was a high negative H, suggesting the frequent occurrence of a significant temperature inversion in the near-surface layer. This result agrees with earlier studies (Chen et al., 2012). In contrast, positive nighttime turbulent fluxes were frequently observed at Jingyangling station during May–October, but further analysis is required to explain the reasons behind this.
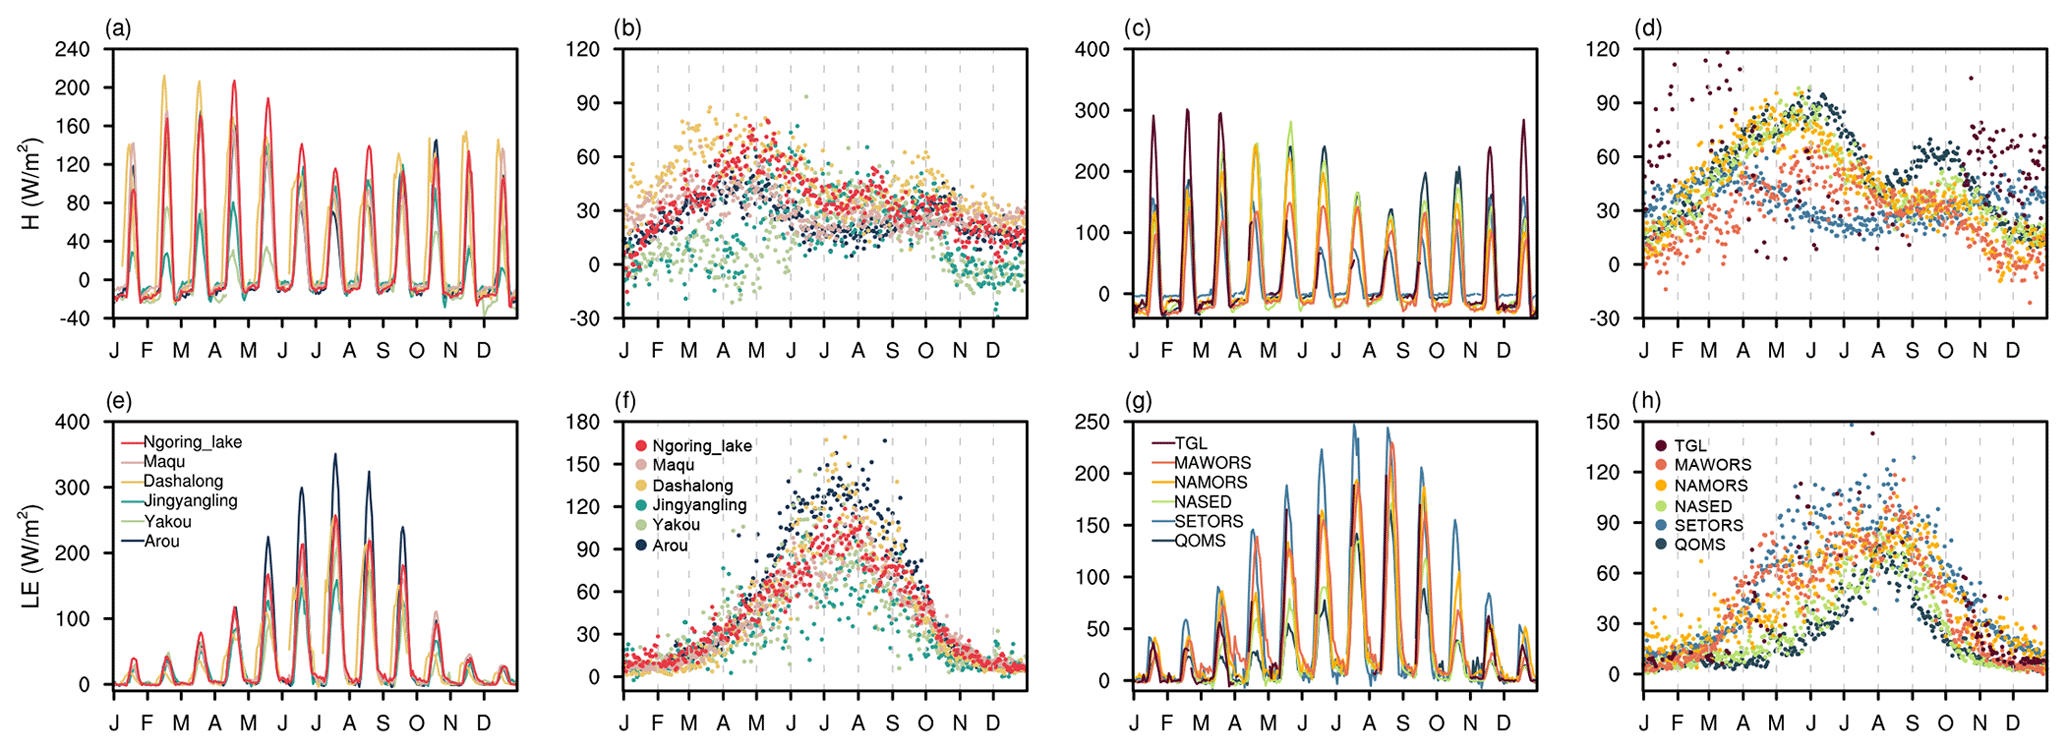
Figure 8Seasonal variations in the diurnal (the first and the third columns) and daily mean (the second and the fourth columns) sensible heat flux (a–d) and latent heat flux (e–h) at the 12 stations.
With the gradual onset of precipitation at each station, the latent heat flux (LE) increased significantly, both in terms of the diurnal variability and the daily average. During the rainy season, LE was highest at Arou station on a diurnal scale, while it was lowest at Jingyangling station, with a maximum value not exceeding 200 W m−2. From the seasonal variation in the Bowen ratio calculated based on the daily mean H and LE at each station, most of the Bowen ratios at Arou, Dashalong, Jingyangling, Yakou, Maqu, Ngoring Lake, and NAMORS were below 1 from May to September, indicating the dominant role of H in the surface energy exchange in this period. From April to October, H dominated at the SETORS and MAWORS stations, while only July and August were dominated by H at the QOMS and NASED stations. These results indicate that H was the primary atmospheric heat source in the TP during the spring and winter seasons.
3.4 Data consistency before and after the reconstruction of the observation system
The observation system was adjusted in 2020 at ITP-affiliated stations, with minor differences in the observation heights or depths before and after the adjustment. We thoroughly checked the daily variations in each variable to a maintain consistent time series. Figure 9 illustrates the interannual variation in daily mean micrometeorological variables observed at the QOMS station, where the first-layer gradient measurement height remained unchanged. The data time series showed good consistency, indicating that different sensor types can accurately capture the atmospheric conditions and that the adjustment had little impact on the observations. This is demonstrated by comparing the features of the seasonal variation in the minimum and maximum values, as well as the amplitude of the variations before and after the adjustment.
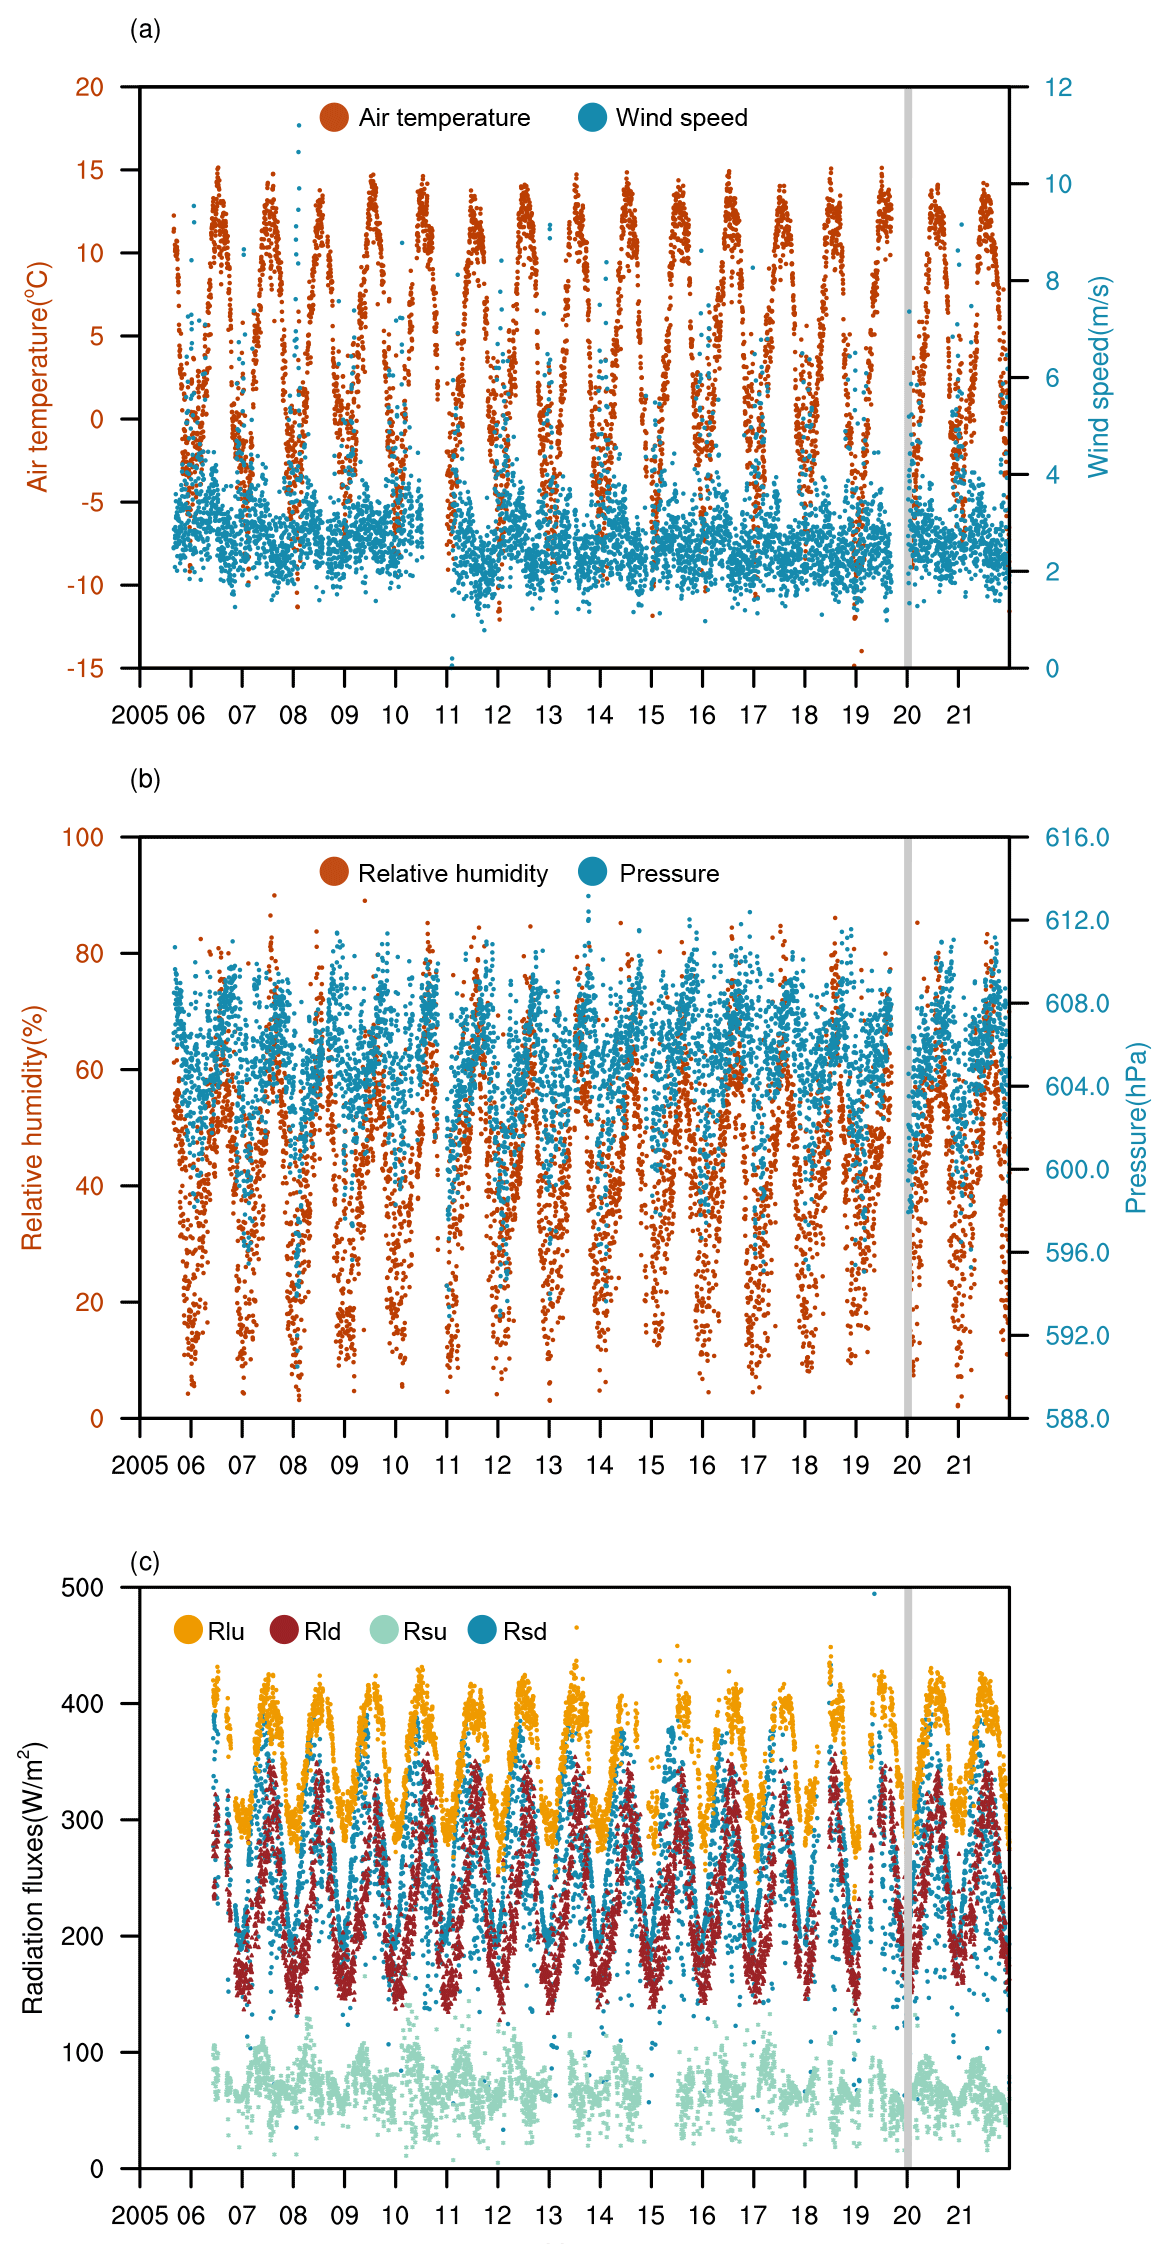
Figure 9Variations in the wind speed (a), air temperature (a), air pressure (b), relative humidity (b), downward shortwave radiation (c), upward shortwave radiation (c), downward longwave radiation (c), and upward longwave radiation (c) observed at the QOMS station. The vertical grey line indicates the date the observation system was uprated.
This integrated observation dataset for land–atmosphere interactions incorporates multi-year field observations from 12 stations that cover typical landscapes of the TP region and that were established by multiple research organizations. Compared with prior datasets released (e.g., Ma et al., 2020; Meng et al., 2023), this dataset involves more stations with various surface characteristics, allowing for a more thorough characterization of the spatial heterogeneity of land–atmosphere interactions over the TP. A strict data quality control procedure was implemented to process the dataset, and a quality flag was provided for each record; this pioneering initiative facilitates data users' access to reliable observations and minimizes the use of erroneous data, enabling its widespread usage in studying the Earth system of the TP. Sustained land surface monitoring of the TP can provide pivotal constraints to advance Earth system modelling, remote sensing capabilities, and reanalysis accuracy for this climate-vulnerable region. More specifically, field observations conducted across various landscapes and scales are indispensable for gaining a comprehensive understanding of the interactions between the land surface and overlying atmospheres. Taking the lake–atmosphere interactions as an example (e.g., Li et al., 2015; Wang et al., 2019), current field observations can provide fine-scale multi-component integrated observations at spatial and temporal scales ranging from centimetres to kilometres and from seconds to sub-hourly scales. By using the three-dimensional measurements from the PBL tower, the eddy covariance system, and profile measurements of temperature, humidity, and wind by microwave radiometers, wind profilers, and radiosonde systems, the physical mechanisms of land–atmosphere and boundary layer processes over the TP can be systematically investigated. Furthermore, field measurements are widely used to derive or calibrate land surface parameters for regional-scale estimates, satellite retrievals, and numerical simulations of energy and water exchanges over heterogeneous landscapes (Yang et al., 2008; Chen et al., 2013). There is no doubt that this enhanced observation network enables a systematic assessment of model robustness and uncertainty in representing the land–atmosphere interactions in complex mountainous regions, providing better guidance for physical parameterization optimization of numerical models involving cryospheric, hydrologic, and atmospheric processes in the intricate TP terrain. Meanwhile, extensive field measurements are critical for the validation, calibration, and refinement of remote sensing retrieval algorithms over the topographically complicated terrain. For instance, Yuan et al. (2021) used in situ measurements from this dataset to present an enhanced canopy transpiration model, as well as an improved approach for calculating soil evaporation using soil moisture and texture. Systemic biases in key land surface parameters in the reanalysis products can be decreased by integrating synthesis ground-based datasets and revised satellite products through sophisticated data assimilation techniques. For instance, Qi et al. (2023) improved the accuracy of land surface temperature retrievals over the TP based on the in situ data. The combination of credible datasets provides multidimensional insights into the intricate mechanisms driving the recent changes across the fragile environments of the TP. This makes it possible to comprehend the TP's critical role in Asian monsoons, water resources, and global climate teleconnections. In addition, predicting future changes and developing adaptive strategies for the environment and the communities of the TP that are currently experiencing disproportionate climate change impacts depend on these integrated land surface observations.
The dataset of near-surface micrometeorology and soil hydrothermal and turbulent fluxes observations can be openly accessed from the National Tibetan Plateau Data Center (https://doi.org/10.11888/Atmos.tpdc.300977, Ma et al., 2023a). It is available in two distinct directories that include raw data on an hourly scale (level 0) and quality-controlled data (level 1). Each observation station is assigned a subfolder within the directories. The data were divided into three categories: gradient meteorological data (met), soil hydrothermal data (soil), and turbulent flux data (flux). The CSV-formatted output files, which follow the naming convention datatype_station_year.csv (level 0) and QC_datatype_station_year.csv (level 1), are accessible for download. The data header of each CSV-formatted data file contains comprehensive information on the variable units and heights or depths, with the following naming format: variable_height/depth (units). The variable names are expressed as abbreviations. Appendix A provides a full list of the abbreviations for each variable. UTC+8 was adopted as the time standard for all the data files. Furthermore, a separate file provides information about data integrity and the percentage of correct data on a monthly scale. This information is presented for each year in Appendix B.
This paper presents a suite of integrated field observations of land–atmosphere interactions over the TP, with the cooperation of several agencies and organizations dedicated to field observations throughout the TP over several decades. This dataset includes hourly measurements of soil hydrothermal properties and near-surface micrometeorological conditions from 12 stations spanning up to 17 years (2005–2021). This paper highlights the complexity and spatial heterogeneity of land–atmosphere interactions over the mountainous region by describing in detail the observation network and presenting the hydrometeorological characteristics, soil hydrothermal properties, and surface energy balance components of these stations, covering various landscapes over the decades. All of the data series in this dataset have been quality controlled using a combination of automatic error screening, manual inspection, diagnostic checking, adjustments, and quality flagging as compared to other similar datasets that have previously been released. Suspicious and erroneous data were identified, and a QC code was assigned to each variable value. The specially designed data-processing procedures tailored to handle the data issues of this integrated network are detailed described. It is indisputable that the long-term hourly quality-assured dataset presented here will contribute to a broad research effort and will help to advance the fine-scale understanding of the land–atmosphere interactions over the heterogeneous TP region and to refine land surface models, reanalysis products, and remote sensing retrievals.
| Met | near-surface micrometeorological observations |
| Soil | soil hydrothermal profile observations |
| Flux | turbulent flux observations |
| WS | wind speed |
| WD | wind direction |
| Ta | air temperature |
| RH | relative humidity |
| Pressure | air pressure |
| Rsd | downward shortwave radiation |
| Rsu | upward shortwave radiation |
| Rld | downward shortwave radiation |
| Rlu | upward shortwave radiation |
| ST | soil temperature |
| SM | soil moisture |
| H | sensible heat flux |
| LE | latent heat flux |
| QC | quality control |
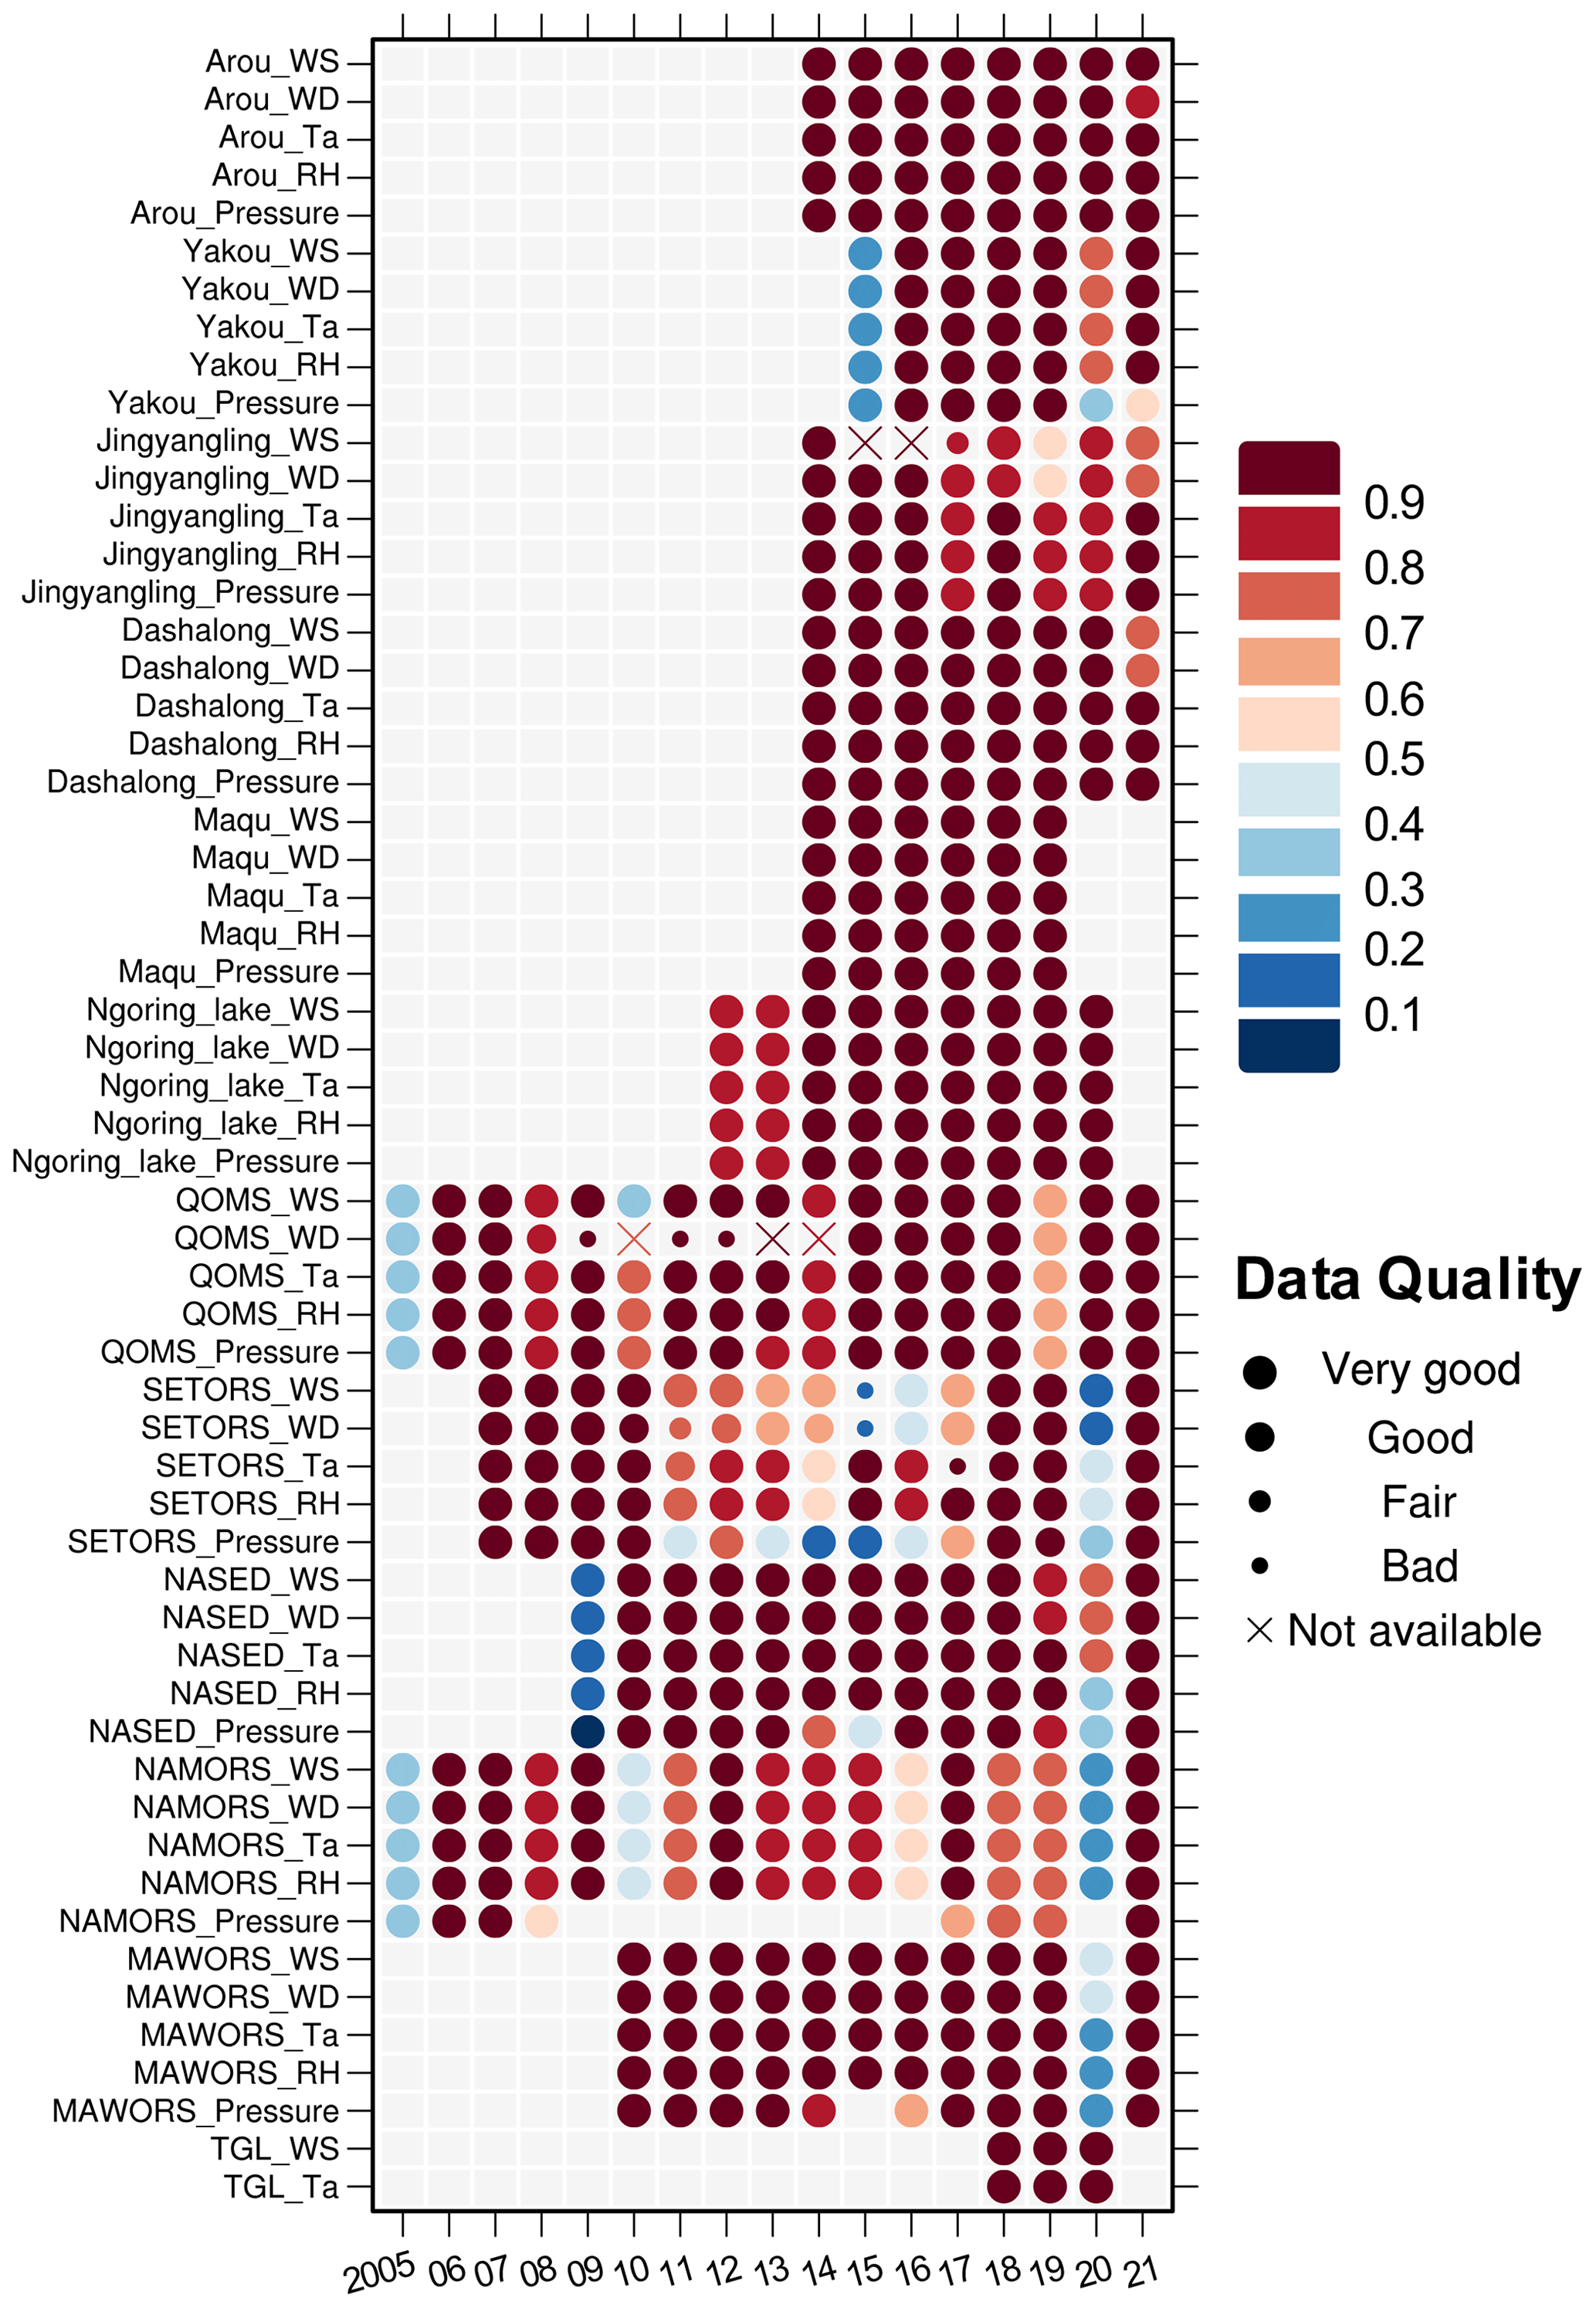
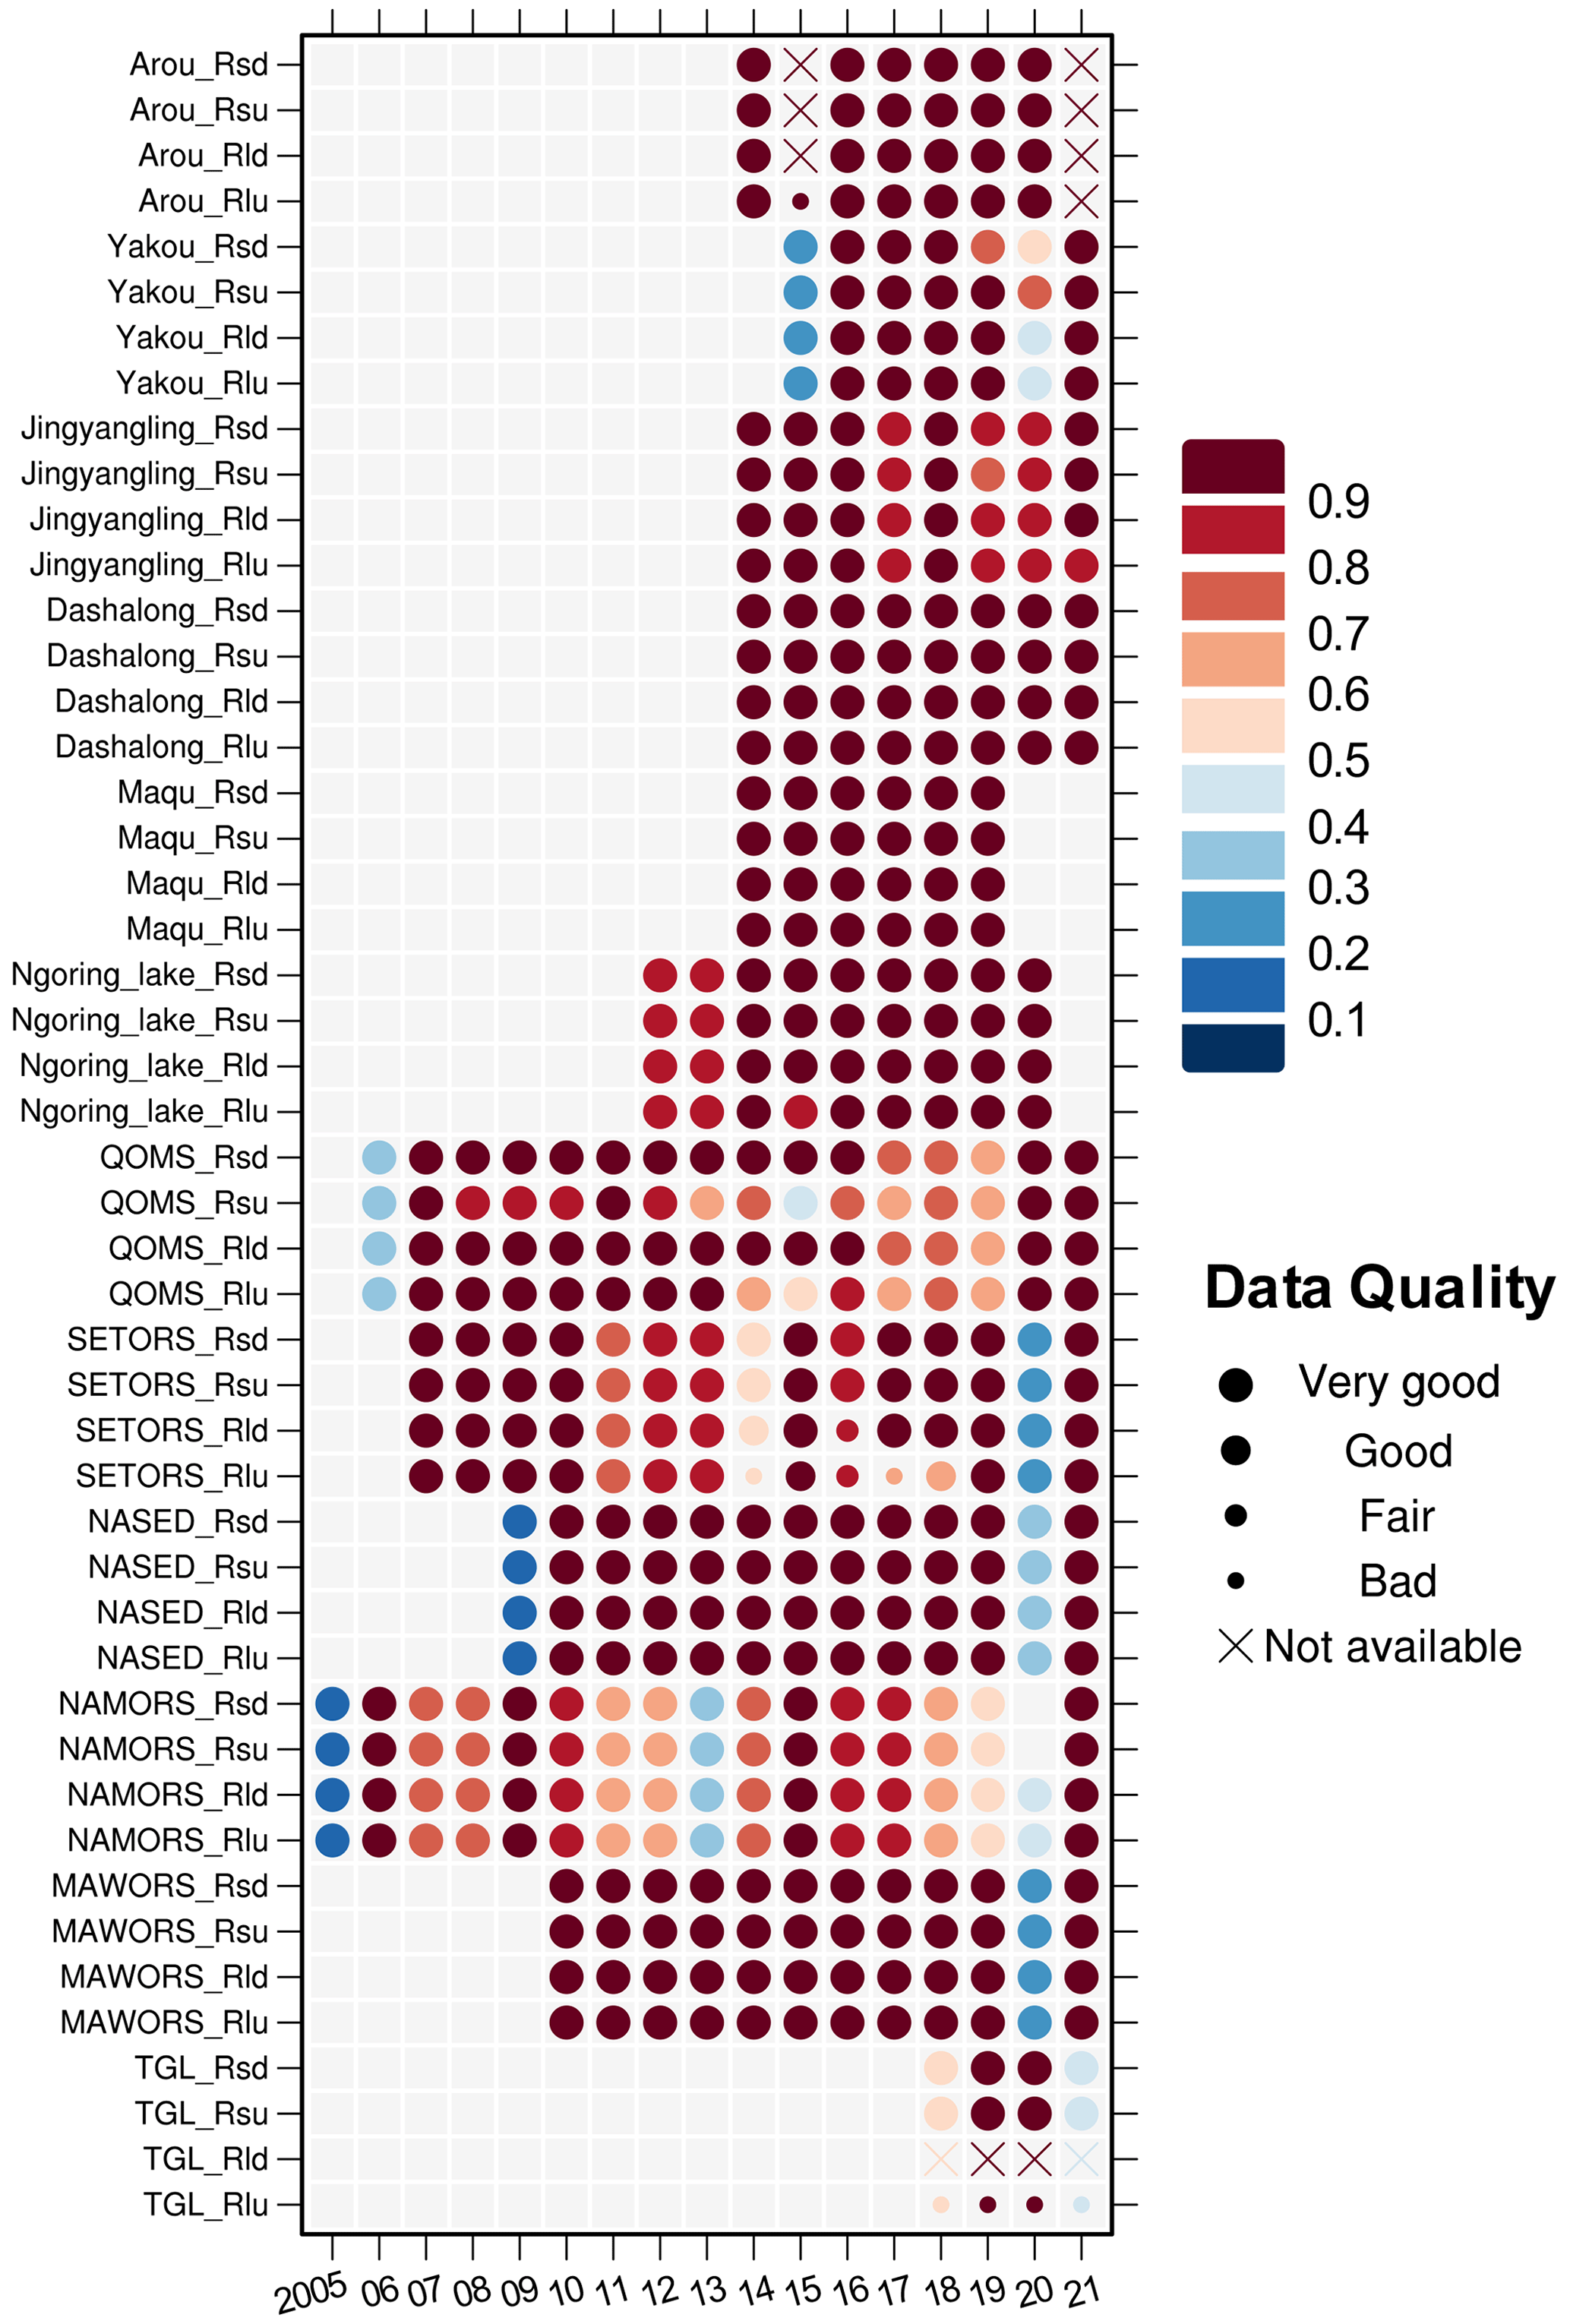
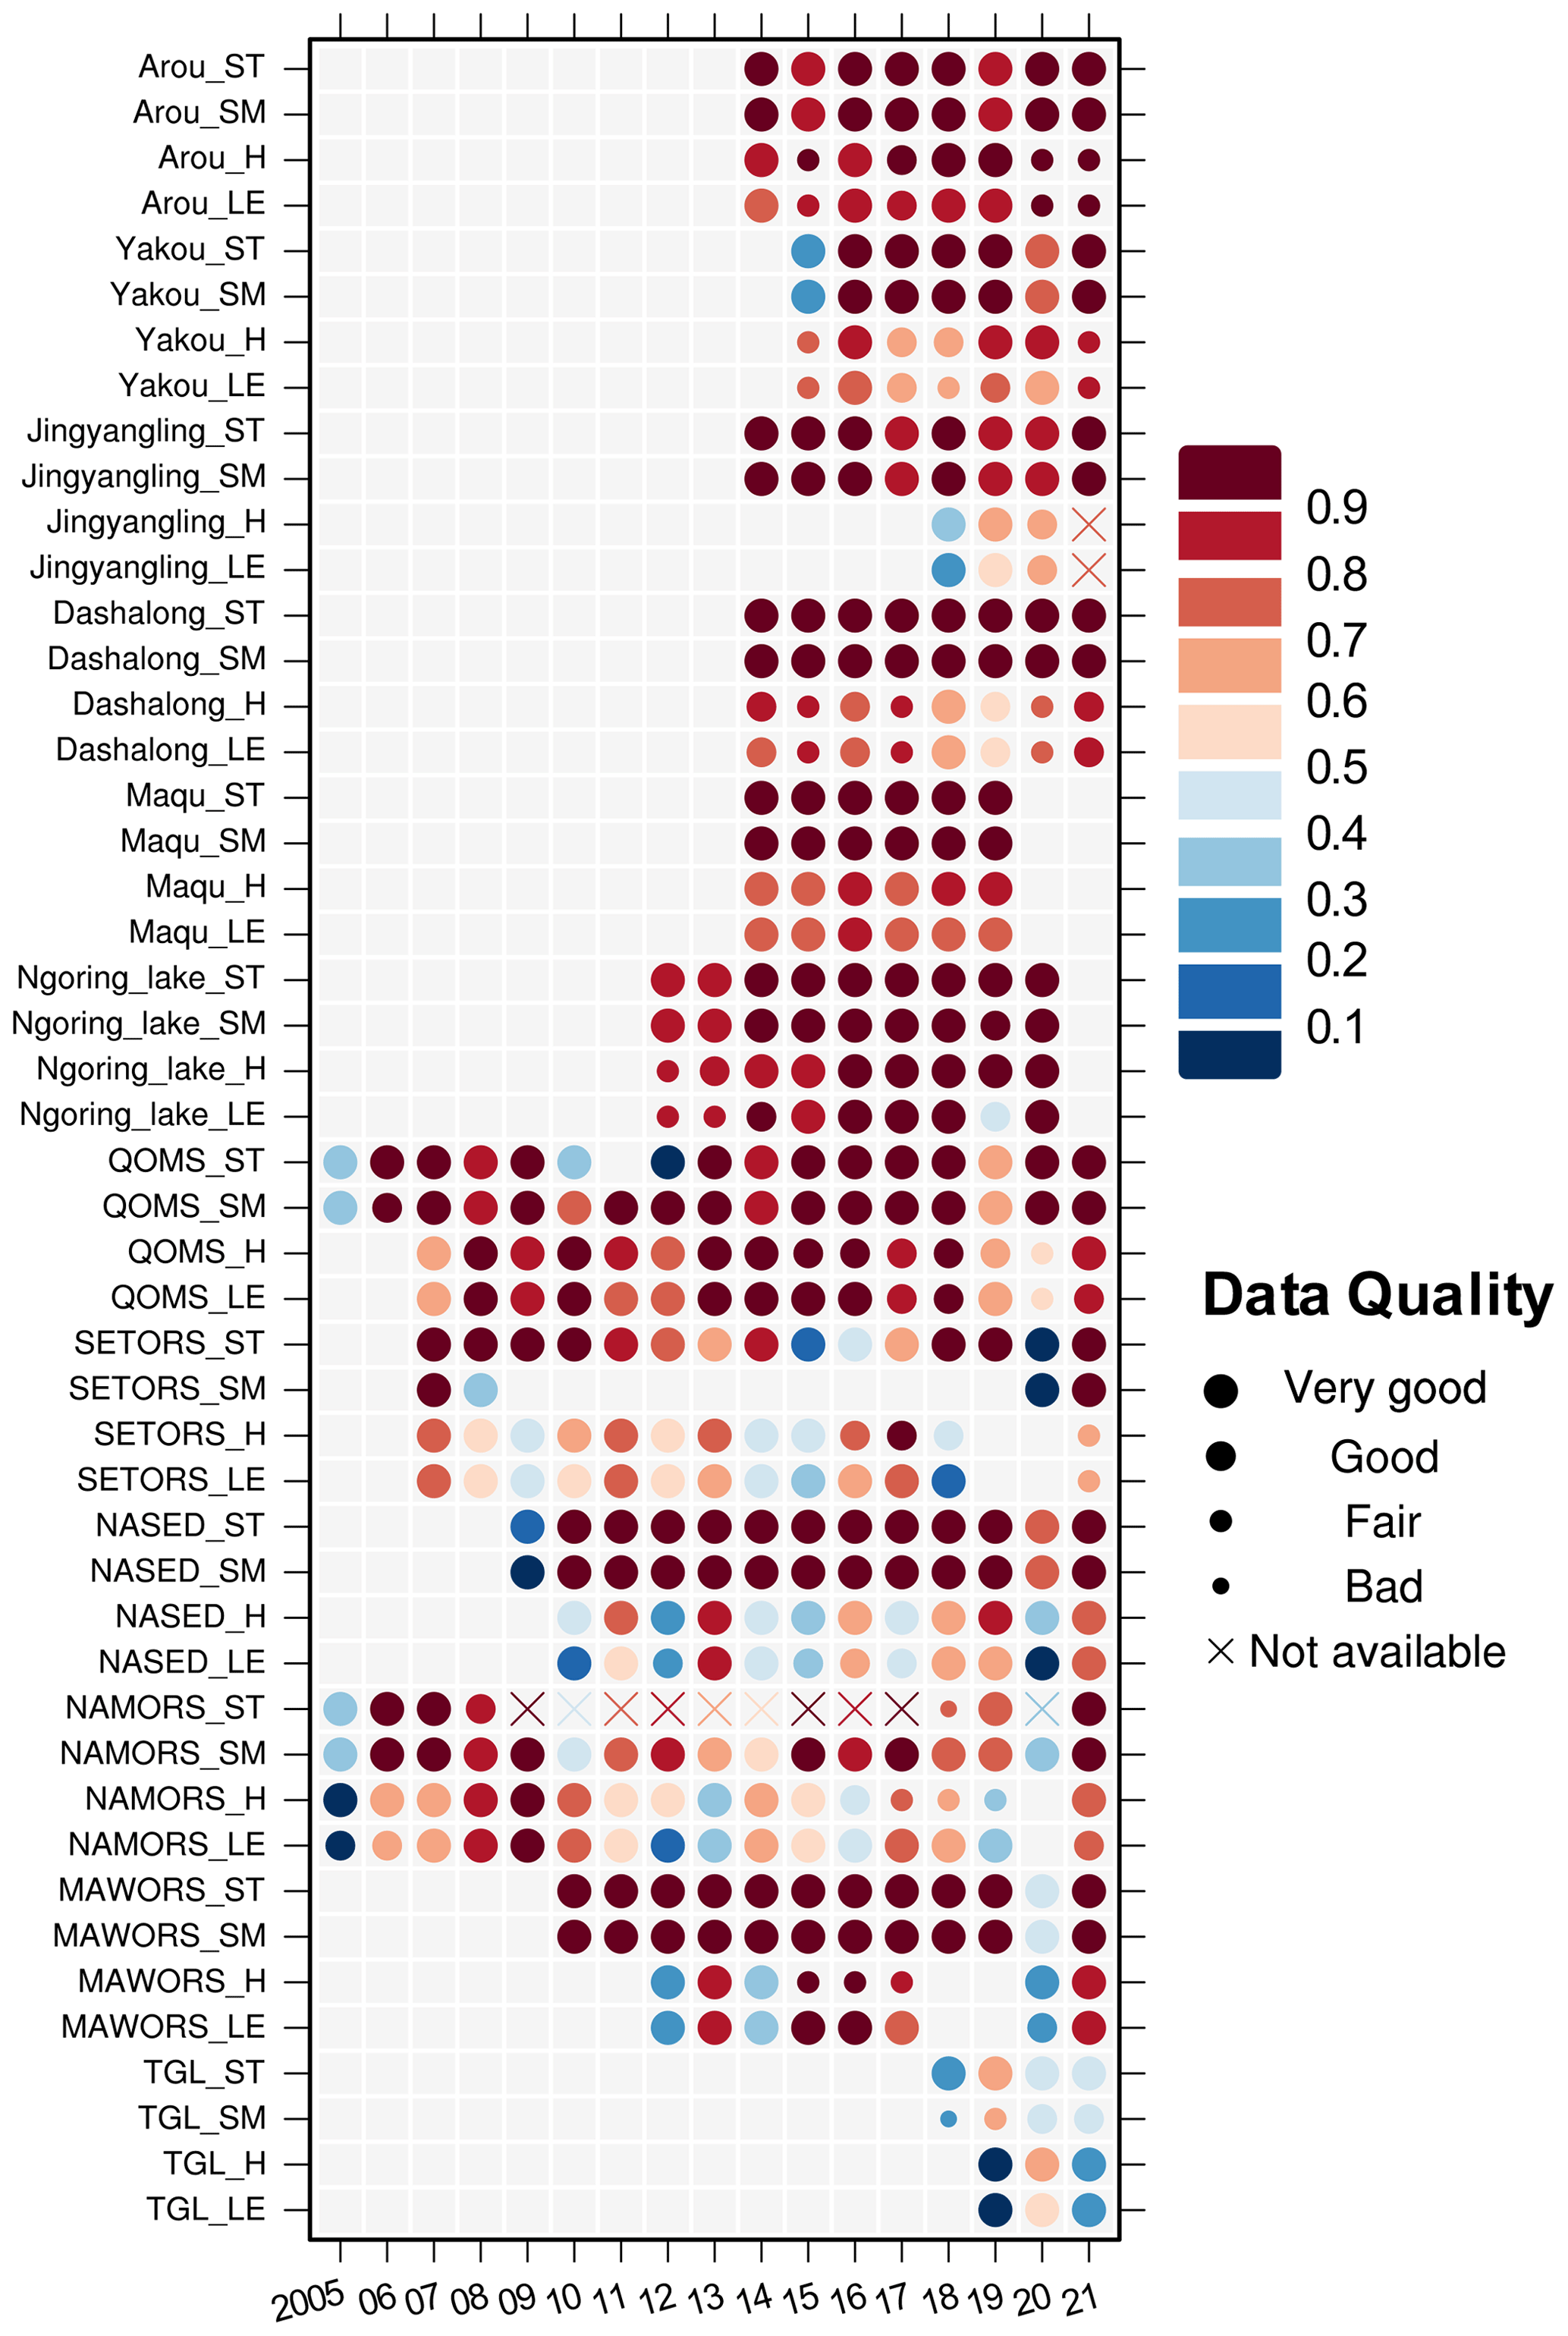
Figure B1The data integrity and data quality report of the met observations on a monthly scale. The colour of the dots denotes the percentage of the available data on a monthly scale (blank indicates that all data for the month are not provided), while the size of the dots denotes the quality of these data. Bad: the percentage of correct data is less than 30 %; fair: the percentage of correct data is greater than 30 % but less than 60 %; good: the percentage of correct data is greater than 60 % but less than 80 %; very good: more than 80 % of the data are correct. “Not available” indicates that all data for the month are not correct.
YM, XL, and YC developed and shaped the overall workflow for compiling this integrated dataset and reviewed and edited the article. ZhX developed the automated QC algorithm, prepared the data, and led the writing of this article. SL, TC, ZiX, LS, XH, WM, XM, SL, BX, HZ, JW, and GW provided the observations and reviewed and edited the article.
The contact author has declared that none of the authors has any competing interests.
Publisher's note: Copernicus Publications remains neutral with regard to jurisdictional claims made in the text, published maps, institutional affiliations, or any other geographical representation in this paper. While Copernicus Publications makes every effort to include appropriate place names, the final responsibility lies with the authors.
We would like to thank all the scientists, engineers, and students who participated in the field observations, instrument maintenance, and data processing. We highly appreciate the valuable and constructive comments on the paper provided by Shiqin Xu and other two anonymous reviewers. Computing resources for data processing were supported by the National Key Scientific and Technological Infrastructure project “Earth System Numerical Simulation Facility” (EarthLab).
This research has been supported by the Second Tibetan Plateau Scientific Expedition and Research (STEP) program (grant nos. 2019QZKK0103 and 2019QZKK020109), the National Natural Science Foundation of China (grant nos. 42230610, 42375075, and U2242208), and the Tibet Science and Technology Program (grant no. XZ202301ZY0001G).
This paper was edited by Dalei Hao and reviewed by Shiqin Xu and two anonymous referees.
An, Y., Meng, X., Zhao, L., Li, Z., Wang, S., Shang, L., Chen, H., Lyu, S., Li, G., and Ma, Y.: Performance of GLASS and MODIS Satellite Albedo Products in Diagnosing Albedo Variations during Different Time Scales and Special Weather Conditions in the Tibetan Plateau, Remote Sens.-Basel, 12, 2456, https://doi.org/10.3390/rs12152456, 2020.
Armstrong McKay, D. I., Staal, A., Abrams, J. F., Winkelmann, R., Sakschewski, B., Loriani, S., Fetzer, I., Cornell, S. E., Rockström, J., and Lenton, T. M.: Exceeding 1.5 °C global warming could trigger multiple climate tipping points, Science, 377, eabn7950, https://doi.org/10.1126/science.abn7950, 2022.
Burba, G. G., McDermitt, D. K., Grelle, A., Anderson, D. J., and Xu, L.: Addressing the influence of instrument surface heat exchange on the measurements of CO2 flux from open-path gas analyzers, Global Change Biol., 14, 1854–1876, https://doi.org/10.1111/j.1365-2486.2008.01606.x, 2008.
Che, T., Li, X., Liu, S., Li, H., Xu, Z., Tan, J., Zhang, Y., Ren, Z., Xiao, L., Deng, J., Jin, R., Ma, M., Wang, J., and Yang, X.: Integrated hydrometeorological, snow and frozen-ground observations in the alpine region of the Heihe River Basin, China, Earth Syst. Sci. Data, 11, 1483–1499, https://doi.org/10.5194/essd-11-1483-2019, 2019.
Chen, F., Ding, L., Piao, S., Zhou, T., Xu, B., Yao, T., and Li, X.: The Tibetan Plateau as the engine for Asian environmental change: the Tibetan Plateau Earth system research into a new era, Sci. Bull., 66, 1263–1266, https://doi.org/10.1016/j.scib.2021.04.017, 2021.
Chen, X., Su, Z., Ma, Y., and Sunt, F.: Analysis of Land-Atmosphere Interactions Over the North Region of Mt. Qomolangma (Mt. Everest), Arct. Antarct. Alp. Res., 44, 412–422, https://doi.org/10.1657/1938-4246-44.4.412, 2012.
Chen, X., Su, Z., Ma, Y., Yang, K., and Wang, B.: Estimation of surface energy fluxes under complex terrain of Mt. Qomolangma over the Tibetan Plateau, Hydrol. Earth Syst. Sci., 17, 1607–1618, https://doi.org/10.5194/hess-17-1607-2013, 2013.
Duan, A., Wu, G., Zhang, Q., and Liu, Y.: New proofs of the recent climate warming over the Tibetan Plateau as a result of the increasing greenhouse gases emissions, Chinese Sci. B., 51, 1396–1400, https://doi.org/10.1007/s11434-006-1396-6, 2006.
Fiebrich, C. A., Morgan, C. R., McCombs, A. G., Hall, P. K., and McPherson, R. A.: Quality assurance procedures for mesoscale meteorological data, J. Atmos. Ocean. Tech., 27, 1565–1582, https://doi.org/10.1175/2010jtecha1433.1, 2010.
Guo, H., Wang, S., He, X., Ding, Y., Fan, Y., Fu, H., and Hong, X.: Characteristics of Evapotranspiration and Crop Coefficient Correction at a Permafrost Swamp Meadow in Dongkemadi Watershed, the Source of Yangtze River in Interior Qinghai–Tibet Plateau, Water, 14, 3578, https://doi.org/10.3390/w14213578, 2022.
Henn, B., Raleigh, M. S., Fisher, A., and Lundquist, J. D.: A comparison of methods for filling gaps in hourly near-surface air temperature data, J. Hydrometeorol., 14, 929–945, https://doi.org/10.1175/Jhm-D-12-027.1, 2013.
Kang, S., Xu, Y., You, Q., Flügel, W.-A., Pepin, N., and Yao, T.: Review of climate and cryospheric change in the Tibetan Plateau, Environ. Res. Lett., 5, 015101, https://doi.org/10.1088/1748-9326/5/1/015101, 2010.
Li, X., Cheng, G., Liu, S., Xiao, Q., Ma, M., Jin, R., Che, T., Liu, Q., Wang, W., Qi, Y., Wen, J., Li, H., Zhu, G., Guo, J., Ran, Y., Wang, S., Zhu, Z., Zhou, J., Hu, X., and Xu, Z.: Heihe Watershed Allied Telemetry Experimental Research (HiWATER): Scientific Objectives and Experimental Design, B. Am. Meteorol. Soc., 94, 1145–1160, https://doi.org/10.1175/BAMS-D-12-00154.1, 2013.
Li, Z., Lyu, S., Zhao, L., Wen, L., Ao, Y., and Wang, S.: Turbulent transfer coefficient and roughness length in a high-altitude lake, Tibetan Plateau, Theor. Appl. Climatol., 124, 723–735, https://doi.org/10.1007/s00704-015-1440-z, 2015.
Li, Z., Lyu, S., Chen, H., Ao, Y., Zhao, L., Wang, S., Zhang, S., and Meng, X.: Changes in climate and snow cover and their synergistic influence on spring runoff in the source region of the Yellow River, Sci. Total Environ., 799, 149503, https://doi.org/10.1016/j.scitotenv.2021.149503, 2021.
Liu, S., Li, X., Xu, Z., Che, T., Xiao, Q., Ma, M., Liu, Q., Jin, R., Guo, J., Wang, L., Wang, W., Qi, Y., Li, H., Xu, T., Ran, Y., Hu, X., Shi, S., Zhu, Z., Tan, J., Zhang, Y., and Ren, Z.: The Heihe Integrated Observatory Network: A Basin-Scale Land Surface Processes Observatory in China, Vadose Zone J., 17, 1–21, https://doi.org/10.2136/vzj2018.04.0072, 2018.
Liu, S., Xu, Z., Che, T., Li, X., Xu, T., Ren, Z., Zhang, Y., Tan, J., Song, L., Zhou, J., Zhu, Z., Yang, X., Liu, R., and Ma, Y.: A dataset of energy, water vapor, and carbon exchange observations in oasis–desert areas from 2012 to 2021 in a typical endorheic basin, Earth Syst. Sci. Data, 15, 4959–4981, https://doi.org/10.5194/essd-15-4959-2023, 2023.
Liu, X. and Chen, B.: Climatic warming in the Tibetan Plateau during recent decades, Int. J. Climatol., 20, 1729–1742, https://doi.org/10.1002/1097-0088(20001130)20:14<1729::AID-JOC556>3.0.CO;2-Y, 2000.
Lu, W., Wang, W., Shao, Q., Yu, Z., Hao, Z., Xing, W., Yong, B., and Li, J.: Hydrological projections of future climate change over the source region of Yellow River and Yangtze River in the Tibetan Plateau: A comprehensive assessment by coupling RegCM4 and VIC model, Hydrol. Process., 32, 2096–2117, https://doi.org/10.1002/hyp.13145, 2018.
Ma, Y., Kang, S., Zhu, L., Xu, B., Tian, L., and Yao, T.: Tibetan observation and research platform: Atmosphere–land interaction over a heterogeneous landscape, B. Am. Meteorol. Soc., 89, 1487-1492, https://doi.org/10.1175/2008BAMS2545.1, 2008.
Ma, Y., Wang, Y., and Han, C.: Regionalization of land surface heat fluxes over the heterogeneous landscape: from the Tibetan Plateau to the Third Pole region, Int. J. Remote Sens., 39, 5872–5890, https://doi.org/10.1080/01431161.2018.1508923, 2018.
Ma, Y., Hu, Z., Xie, Z., Ma, W., Wang, B., Chen, X., Li, M., Zhong, L., Sun, F., Gu, L., Han, C., Zhang, L., Liu, X., Ding, Z., Sun, G., Wang, S., Wang, Y., and Wang, Z.: A long-term (2005–2016) dataset of hourly integrated land–atmosphere interaction observations on the Tibetan Plateau, Earth Syst. Sci. Data, 12, 2937–2957, https://doi.org/10.5194/essd-12-2937-2020, 2020.
Ma, Y., Xie, Z., Chen, Y., Liu, S., Che, T., Xu, Z., Shang, L., He, X., Meng, X., Ma, W., Xu, B., Zhao, H., Wang, J., Wu, G., and Li, X.: Spatially extensive long-term quality-assured land-atmosphere interactions dataset over the Tibetan Plateau, National Tibetan Plateau/Third Pole Environment Data Center [data set], https://doi.org/10.11888/Atmos.tpdc.300977, 2023a.
Ma, Y., Xie, Z., Ma, W., Han, C., Sun, F., Sun, G., Liu, L., Lai, Y., Wang, B., and Liu, X.: QOMS: A Comprehensive Observation Station for Climate Change Research on the Top of Earth, B. Am. Meteorol. Soc., 104, E563–E584, 2023b.
Ma, Y., Yao, T., Zhong, L., Wang, B., Xu, X., Hu, Z., Ma, W., Sun, F., Han, C., Li, M., Chen, X., Wang, J., Li, Y., Gu, L., Xie, Z., Liu, L., Sun, G., Wang, S., Zhou, D., Zuo, H., Xu, C., Liu, X., Wang, Y., and Wang, Z.: Comprehensive study of energy and water exchange over the Tibetan Plateau: A review and perspective: From GAME/Tibet and CAMP/Tibet to TORP, TPEORP, and TPEITORP, Earth-Sci. Rev., 237, 104312, https://doi.org/10.1016/j.earscirev.2023.104312, 2023c.
Mauder, M. and Foken, T.: Impact of post-field data processing on eddy covariance flux estimates and energy balance closure, Meteorol. Z., 15, 597–609, https://doi.org/10.1127/0941-2948/2006/0167, 2006.
Meng, X., Lyu, S., Li, Z., Ao, Y., Wen, L., Shang, L., Wang, S., Deng, M., Zhang, S., Zhao, L., Chen, H., Ma, D., Li, S., Shu, L., An, Y., and Niu, H.: Dataset of Comparative Observations for Land Surface Processes over the Semi-Arid Alpine Grassland against Alpine Lakes in the Source Region of the Yellow River, Adv. Atmos. Sci., 40, 1142–1157, https://doi.org/10.1007/s00376-022-2118-y, 2023.
Pan, B., Li, J., and Chen, F.: Qinghai-Xizang Plateau – a driver and amplifier of the global climatic change J, Lanzhou University (Natural Science Edition), 32, 08-115, 1996.
Peppler, R. A., Long, C., Sisterson, D., Turner, D., Bahrmann, C., Christensen, S. W., Doty, K., Eagan, R., Halter, T., and Iveyh, M.: An overview of ARM program climate research facility data quality assurance, The Open Atmospheric Science Journal, 2, 192–216, https://doi.org/10.2174/1874282300802010192, 2008.
Qi, Y., Zhong, L., Ma, Y., Fu, Y., Wang, X., and Li, P.: Estimation of Land Surface Temperature Over the Tibetan Plateau Based on Sentinel-3 SLSTR Data, IEEE J. Sel. Top. Appl. Earth Obs., 16, 4180–4194, https://doi.org/10.1109/jstars.2023.3268326, 2023.
Qin, D., Liu, S., and Li, P.: Snow cover distribution, variability, and response to climate change in western China, J. Climate, 19, 1820–1833, https://doi.org/10.1175/JCLI3694.1, 2006.
Sun, F., Ma, Y., Li, M., Ma, W., Tian, H., and Metzger, S.: Boundary layer effects above a Himalayan valley near Mount Everest, Geophys. Res. Lett., 34, L08808, https://doi.org/10.1029/2007gl029484, 2007.
Thornton, J. M., Palazzi, E., Pepin, N. C., Cristofanelli, P., Essery, R., Kotlarski, S., Giuliani, G., Guigoz, Y., Kulonen, A., and Pritchard, D.: Toward a definition of essential mountain climate variables, One Earth, 4, 805–827, https://doi.org/10.1016/j.oneear.2021.05.005, 2021.
Wang, B., Ma, Y., Wang, Y., Su, Z., and Ma, W.: Significant differences exist in lake-atmosphere interactions and the evaporation rates of high-elevation small and large lakes, J. Hydrol., 573, 220–234, https://doi.org/10.1016/j.jhydrol.2019.03.066, 2019.
Wang, S., Zhang, Y., Lyu, S., Shang, L., Su, Y., and Zhu, H.: Radiation balance and the response of albedo to environmental factors above two alpine ecosystems in the eastern Tibetan Plateau, Sci. Cold Arid Reg., 9, 142–150, 2017.
Wang, Y., Zhang, X., Ning, W., Lazzara, M. A., Ding, M., Reijmer, C. H., Smeets, P. C. J. P., Grigioni, P., Heil, P., Thomas, E. R., Mikolajczyk, D., Welhouse, L. J., Keller, L. M., Zhai, Z., Sun, Y., and Hou, S.: The AntAWS dataset: a compilation of Antarctic automatic weather station observations, Earth Syst. Sci. Data, 15, 411–429, https://doi.org/10.5194/essd-15-411-2023, 2023.
Xu, S., Yu, Z., Lettenmaier, D. P., McVicar, T. R., and Ji, X.: Elevation-dependent response of vegetation dynamics to climate change in a cold mountainous region, Environ. Res. Lett., 15, 094005, https://doi.org/10.1088/1748-9326/ab9466, 2020.
Yang, K., Koike, T., Ishikawa, H., Kim, J., Li, X., Liu, H., Liu, S., Ma, Y., and Wang, J.: Turbulent flux transfer over bare-soil surfaces: Characteristics and parameterization, J. Appl. Meteorol. Climatol., 47, 276–290, https://doi.org/10.1175/2007JAMC1547.1, 2008.
Yao, T. D., Thompson, L., Yang, W., Yu, W. S., Gao, Y., Guo, X. J., Yang, X. X., Duan, K. Q., Zhao, H. B., Xu, B. Q., Pu, J. C., Lu, A. X., Xiang, Y., Kattel, D. B., and Joswiak, D.: Different glacier status with atmospheric circulations in Tibetan Plateau and surroundings, Nat. Clim. Change, 2, 663–667, https://doi.org/10.1038/Nclimate1580, 2012.
Yao, T. D., Xue, Y. K., Chen, D. L., Chen, F. H., Thompson, L., Cui, P., Koike, T., Lau, W. K. M., Lettenmaier, D., Mosbrugger, V., Zhang, R. H., Xu, B. Q., Dozier, J., Gillespie, T., Gu, Y., Kang, S. C., Piao, S. L., Sugimoto, S., Ueno, K., Wang, L., Wang, W. C., Zhang, F., Sheng, Y. W., Guo, W. D., Ailikun, Yang, X. X., Ma, Y. M., Shen, S. S. P., Su, Z. B., Chen, F., Liang, S. L., Liu, Y. M., Singh, V. P., Yang, K., Yang, D. Q., Zhao, X. Q., Qian, Y., Zhang, Y., and Li, Q.: Recent third pole's rapid warming accompanies cryospheric melt and water cycle intensification and interactions between monsoon and environment: Multidisciplinary approach with observations, modeling, and analysis, B. Am. Meteorol. Soc., 100, 423–444, https://doi.org/10.1175/BAMS-D-17-0057.1, 2019.
You, Q., Wu, T., Shen, L., Pepin, N., Zhang, L., Jiang, Z., Wu, Z., Kang, S., and AghaKouchak, A.: Review of snow cover variation over the Tibetan Plateau and its influence on the broad climate system, Earth-Sci. Rev., 201, 103043, https://doi.org/10.1016/j.earscirev.2019.103043, 2020.
Yuan, L., Ma, Y., Chen, X., Wang, Y., and Li, Z.: An Enhanced MOD16 Evapotranspiration Model for the Tibetan Plateau During the Unfrozen Season, J. Geophys. Res.-Atmos., 126, e2020JD032787, https://doi.org/10.1029/2020jd032787, 2021.
Zahumenský, I.: Guidelines on quality control procedures for data from automatic weather stations, World Meteorological Organization, Switzerland, 955, 2–6, 2004.
Zhou, S., Williams, A. P., Berg, A. M., Cook, B. I., Zhang, Y., Hagemann, S., Lorenz, R., Seneviratne, S. I., and Gentine, P.: Land-atmosphere feedbacks exacerbate concurrent soil drought and atmospheric aridity, P. Natl. Acad. Sci. USA, 116, 18848–18853, https://doi.org/10.1073/pnas.1904955116, 2019.
- Abstract
- Introduction
- Observation network and data processing
- Data description
- Potential applications enabled from this integrated dataset
- Data availability
- Conclusions
- Appendix A: Abbreviations used in text
- Appendix B: Data integrity and data quality report on a monthly scale
- Author contributions
- Competing interests
- Disclaimer
- Acknowledgements
- Financial support
- Review statement
- References