the Creative Commons Attribution 4.0 License.
the Creative Commons Attribution 4.0 License.
 | 21 Jun 2024
Development of a high-resolution integrated emission inventory of air pollutants for China
Nana Wu
Ruochong Xu
Shigan Liu
Xiaodong Liu
Qinren Shi
Ying Zhou
Yu Zhao
Yu Song
Junyu Zheng
Qiang Zhang
Kebin He
Constructing a highly resolved comprehensive emission dataset for China is challenging due to limited availability of refined information for parameters in a unified bottom-up framework. Here, by developing an integrated modeling framework, we harmonized multi-source heterogeneous data, including several up-to-date emission inventories at national and regional scales and for key species and sources in China to generate a 0.1° resolution inventory for 2017. By source mapping, species mapping, temporal disaggregation, spatial allocation, and spatial–temporal coupling, different emission inventories are normalized in terms of source categories, chemical species, and spatiotemporal resolutions. This achieves the coupling of multi-scale, high-resolution emission inventories with the Multi-resolution Emission Inventory for China (MEIC), forming the high-resolution INTegrated emission inventory of Air pollutants for China (INTAC). We find that INTAC provides more accurate representations for emission magnitudes and spatiotemporal patterns. In 2017, China's emissions of sulfur dioxide (SO2), nitrous oxides (NOx), carbon monoxide (CO), non-methane volatile organic compounds (NMVOCs), ammonia (NH3), PM10 and PM2.5 (particulate matter), black carbon (BC), and organic carbon (OC) were 12.3, 24.5, 141.0, 27.9, 9.2, 11.1, 8.4, 1.3, and 2.2 Tg, respectively. The proportion of point source emissions for SO2, PM10, NOx, and PM2.5 increases from 7 %–19 % in MEIC to 48 %–66 % in INTAC, resulting in improved spatial accuracy, especially mitigating overestimations in densely populated areas. Compared with MEIC, INTAC reduces mean biases in simulated concentrations of major air pollutants by 2–14 µg m−3 across 74 cities, compared against ground observations. The enhanced model performance by INTAC is particularly evident at finer-grid resolutions. Our new dataset is accessible at http://meicmodel.org.cn/intac (last access: 15 April 2024) and https://doi.org/10.5281/zenodo.10459198 (Wu et al., 2024), and it will provide a solid data foundation for fine-scale atmospheric research and air-quality improvement.
- Article
(5787 KB) - Full-text XML
-
Supplement
(1488 KB) - BibTeX
- EndNote


In recent years China has achieved remarkable progress in improving air quality and public health through the active implementation of clean-air policies (Liu et al., 2020; Xiao et al., 2022; Zhang and Geng, 2019; Q. Zhang et al., 2019). To further unlock the potential of targeted clean-air actions, there is an urgent need for an accurate and detailed depiction of emissions encompassing their magnitudes and spatial–temporal patterns. Developing a reliable, highly resolved emission inventory for China is also crucial for studies of atmospheric chemistry and climate change (Cheng et al., 2021a; Geng et al., 2021; Q. Zhang et al., 2019).
The construction of high-resolution emission inventories for China poses significant challenges due to the diversity and complexity of emission sources and technology distributions. Additionally, the limited availability of localized measurements for emission factors (EFs) and source profiles, along with the exact locations of the emission facilities, further compounds the difficulties (Li et al., 2017a). The widely used bottom-up approach involves the establishment of a unified framework that encompasses source categories, chemical speciation processes, spatial–temporal allocation profiles, and emission estimation methods (An et al., 2021; Huang et al., 2021). However, achieving both wide coverage and high accuracy in compiling an emission inventory for China through this approach remains a formidable task for individual research institutions.
Comprehensive national-scale emission inventories developed using the unified framework typically provide extensive coverage of space, species, and sectors (Li et al., 2017a; S. Li et al., 2023) but tend to exhibit limitations in spatial accuracy (Wu et al., 2021; Zhao et al., 2015; Zheng et al., 2021; Zhou et al., 2017b). Previous studies have indicated that the spatial allocation in large-scale emission inventories relies on spatial proxies (e.g., population and road networks), rather than latitude–longitude coordinates of emission sources, due to the unavailability of extensive spatial information (Li et al., 2017b; Zhang et al., 2009). The assumption of a linear correlation between emissions and spatial proxies might lead to an overestimation of emissions in urban areas especially at resolutions finer than 0.25° (Wu et al., 2021; Zheng et al., 2021, 2017). Biases introduced by the proxy-based method are found to be propagated as the grid size diminishes, resulting in uncertainties for chemical transport models (CTMs) (Zheng et al., 2021, 2017).
Emission inventories focused on a specific region (An et al., 2021; Huang et al., 2021; Liu et al., 2018), sector (Chen et al., 2016; Deng et al., 2020; Zhou et al., 2017a), or key species (Huang et al., 2012b; Li et al., 2021; Wang et al., 2023) under the aforementioned unified framework demonstrate enhanced accuracy but fail to achieve comprehensive coverage. These inventories assimilate substantial detailed foundational data from various statistical datasets, on-site measurements, or surveys to represent real-world emission magnitudes, including energy consumption, removal efficiencies, and localized speciation profile (An et al., 2021; Huang et al., 2021; Liu et al., 2018). Innovative data, such as measurements from continuous emission monitoring systems (Bo et al., 2021; Tang et al., 2023; Wu et al., 2022), or methodologies like process-based models (Kang et al., 2016; Zhao et al., 2020), are implemented to enable a more accurate characterization of complex emission dynamics. Facility-level geographical location is incorporated to optimize the representation of spatial patterns (F. Liu et al., 2015; Wang et al., 2019; Wu et al., 2023). The reliability of these local-scale, sector-specific, or species-specified inventories has been validated against satellite and ground-based measurements (F. Liu et al., 2016; Zhang et al., 2021; Zheng et al., 2019).
The other strategy for developing bottom-up emission inventories is commonly known as the integrated method. This method consolidates multiple emission datasets for specific regions, species, or sectors into a unified product ensuring extensive representation (Li et al., 2017b). Taking advantage of existing inventories derived from localized data and advanced methods, the integrated method facilitates the efficient generation of highly resolved emission inventories at large scales. However, the heterogeneity of different emission datasets presents challenges for the fusion, which are manifested in diverse data formats, sector categories, species, and spatial–temporal resolution. In recent years, there has been growing interest in adopting the integrated approach to enrich inventories with local insights, particularly at the global (Crippa et al., 2023; Janssens-Maenhout et al., 2015) and Asian scales (Kurokawa et al., 2013; M. Li et al., 2024; Li et al., 2017b; Zhang et al., 2009). Research on establishing integrated inventories for China is constrained due to the inherent complexity and challenging accessibility of the data. These efforts are concentrated in specific regions such as the Yangtze River Delta (YRD) (An et al., 2021).
In this work, with the support of several research institutions, we use an emission integration model to construct a high-resolution integrated emission inventory at a spatial resolution of 0.1° for China in 2017, denoted as INTAC (INTegrated emission inventory of Air pollutants for China). The challenges associated with coupling multi-source heterogeneous data are addressed through the implementation of an inventory integration framework. Then, leveraging the strengths of inventories enriched with local knowledge, we compile a comprehensive, highly resolved emission product to enhance the accurate representation of emissions from crucial regions, sectors, and species. Finally, the improved accuracy of emission magnitude and spatial distribution is evaluated using atmospheric chemistry models.
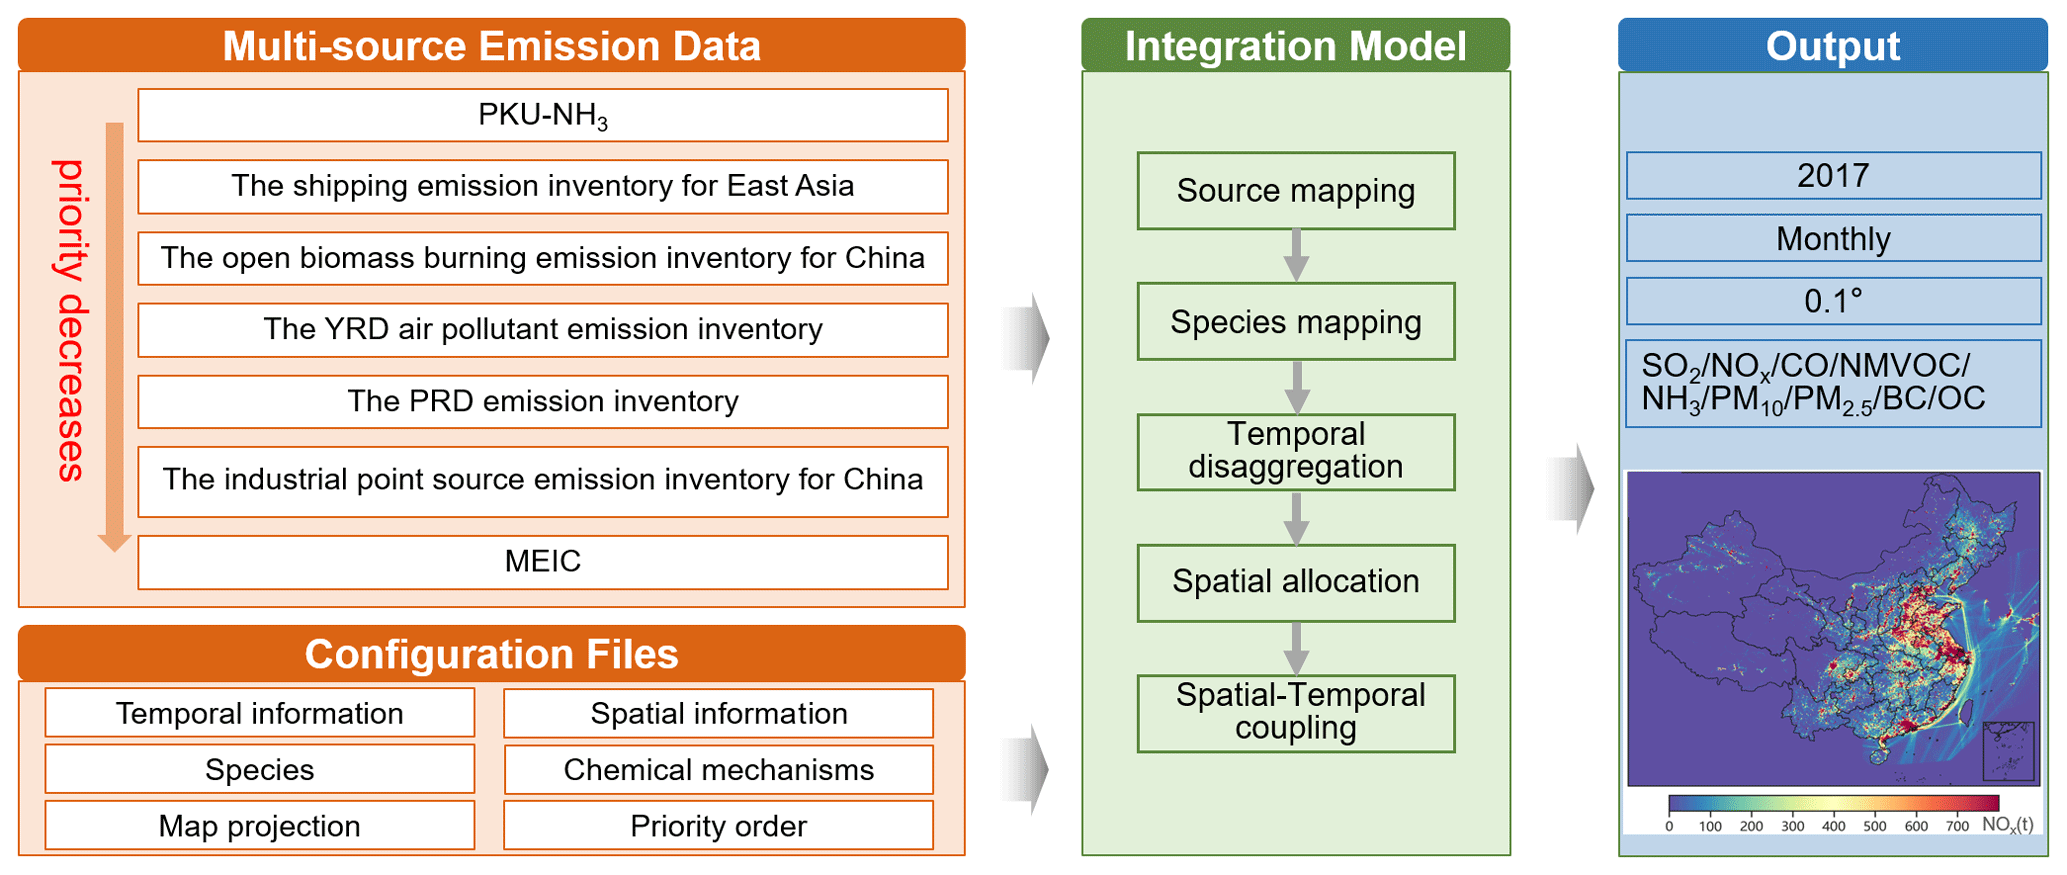
Figure 1Methodology framework of INTAC development.
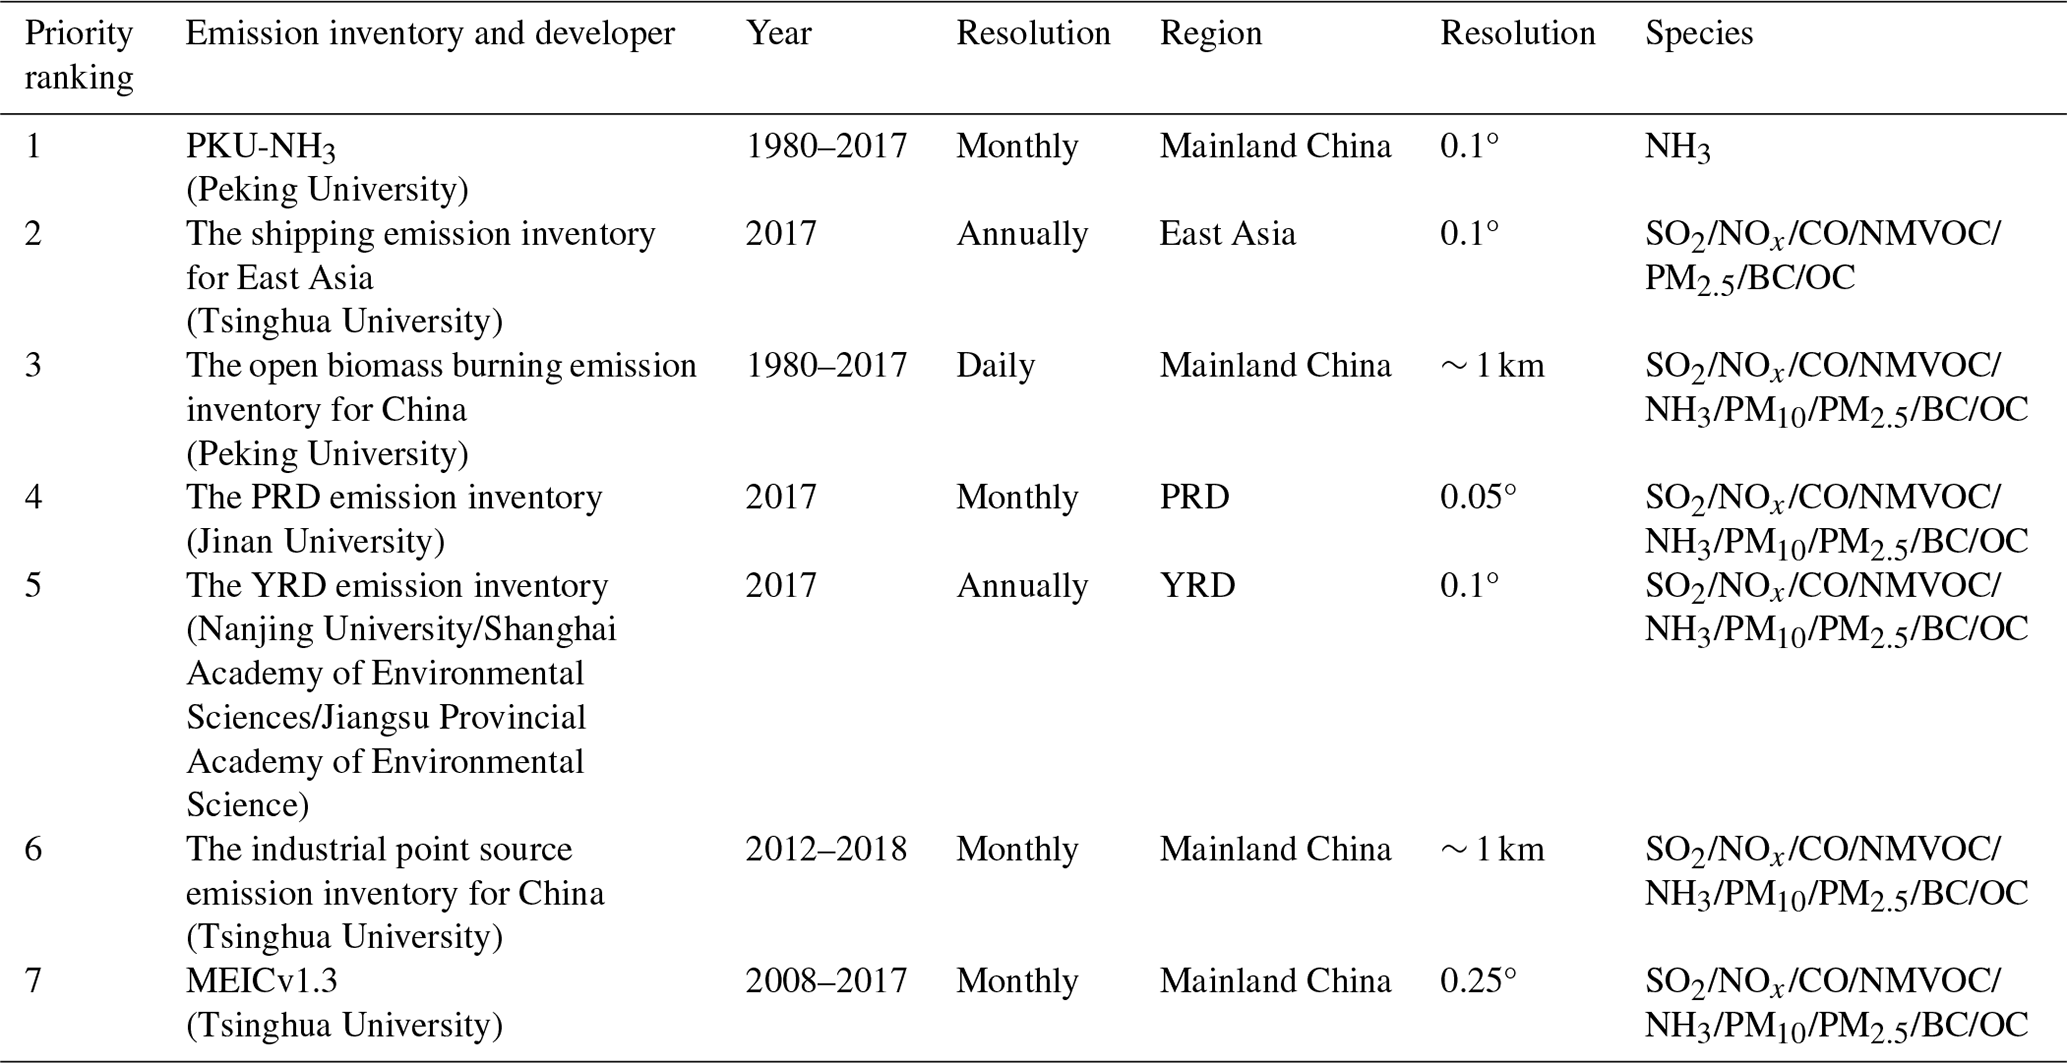
Figure 1 schematically illustrates the integration process of INTAC. We collect seven emission inventories: the Multi-resolution Emission Inventory for China (MEIC) developed by Tsinghua University (Li et al., 2017a; Zheng et al., 2018), the industrial point source emission inventory for China by the MEIC team (Zheng et al., 2021; Zheng et al., 2017), the YRD air pollutant emission inventory led by Nanjing University (An et al., 2021; Zhou et al., 2017b), the Pearl River Delta (PRD) emission inventory by Jinan University (Huang et al., 2021; Sha et al., 2021), the open biomass burning emission inventory in China by Peking University (Huang et al., 2012a; M. Liu et al., 2015; Song et al., 2009; Yin et al., 2019), the shipping emission inventory in East Asia by Tsinghua University (H. Liu et al., 2016; Liu et al., 2019), and the high-resolution ammonia emission inventory in China (PKU-NH3) by Peking University (Huang et al., 2012b; Kang et al., 2016). The details of these inventories and the rationale for choosing them will be described in Sect. 2.1.
An integration model is then established to merge emission inventories which have different sectors, species, spatial–temporal resolutions, and formats (i.e., point, area, and gridded forms). The integration process consists of five steps: source mapping, species mapping, temporal disaggregation, spatial allocation, and spatial–temporal coupling, as detailed in Sect. 2.2. Based on the priority order, multi-source emission inventories are assembled at the standardized species, sector, and grid levels, yielding a standardized data cube. Ultimately, the integrated emission inventory INTAC was created for China, featuring a resolution of 0.1° on a monthly scale and covering nine air pollutants: sulfur dioxide (SO2), nitrogen oxides (NOx), carbon monoxide (CO), non-methane volatile organic compounds (NMVOCs), ammonia (NH3), PM10 and PM2.5 (particulate matter), black carbon (BC), and organic carbon (OC).
2.1 Components of the integrated emission inventory INTAC
Table 1 lists the essential details about the seven inventories and priority order utilized for integration. Given MEIC's extensive coverage across species, sectors, and spatial domains, it functions as the default inventory in our integration, supplementing the missing data in other inventories. The remaining six inventories can be categorized into three types in sequence: point-source-based inventory (ranked sixth), regional inventories (ranked fifth and fourth), and process-based inventories (ranked third to first). The point-source-based inventory can directly correct the spatial misallocation of industrial emissions in MEIC at fine resolutions (Zheng et al., 2021, 2017). The regional inventories further enhance local investigations of individual emission sources and simultaneously refine estimation methods for mobile and area sources (Gu et al., 2023; Zhao et al., 2018; Zhou et al., 2017b). Process-based inventories typically adopt advanced methods to improve the characterization for emission processes and parameters specific to particular sectors or species, thereby providing emission totals and distributions that are more in line with measurements (Huang et al., 2012a, 2012b; Kang et al., 2016; H. Liu et al., 2016; Liu et al., 2019; M. Liu et al., 2015; Song et al., 2009; Yin et al., 2019).
2.1.1 MEIC
The integrated inventory INTAC is built upon MEIC, a comprehensive database with extensive coverage across time periods, space, species, and sectors. Developed by Tsinghua University since 2010 (http://meicmodel.org.cn, last access: 15 December 2022) (Li et al., 2017a; Zheng et al., 2018), MEIC provides monthly emissions for air pollutants and CO2 in China from 1990 to the present at a resolution of 0.25° × 0.25°. It caters to the demand for timely and accurate estimates of atmospheric emissions and has gained widespread adoption by both domestic and international research institutions. We use 2017 emissions from MEICv1.3 in this study.
MEIC employs several strategies to improve emission estimation parameters. This includes categorizing emission sources across ∼ 800 sectors, utilizing a technology- and big-data-driven approach for dynamic emission characterization, and employing a localized emission factor database (Li et al., 2017a; Zheng et al., 2018). Emission estimates for power, on-road, and residential sources are enhanced through the use of unit-level data (F. Liu et al., 2015), county-level emission estimates (Zheng et al., 2014), and integration of extensive household surveys (Peng et al., 2019), respectively. MEIC builds a database encompassing temporal allocation profiles (ranging from yearly to monthly, daily, and hourly) (Li et al., 2017b), spatial allocation proxies (from province to county and further to grids) (Geng et al., 2017; Li et al., 2017b; Zheng et al., 2017), and a speciation framework for NMVOCs involving five mechanisms (CB-IV, CB05, SAPRC-07, SAPRC-99, and RADM2) (Li et al., 2014) to support the development of model-ready gridded emissions.
Among the seven inventories, MEIC has the lowest priority and is only considered when the other six cannot provide the necessary emissions for a specific city and source.
2.1.2 The industrial point source emission inventory for China
The proxy-based method used for spatial allocation in MEIC introduces biases in emission mapping, especially at the kilometer scale (Zheng et al., 2021, 2017). To significantly reduce the uncertainty, we merged an industrial emission inventory with detailed information on ∼ 100 000 facilities into INTAC.
Compiled by the MEIC team at Tsinghua University for the year 2013 (Zheng et al., 2021) and updated by them for 2017, this point-based inventory combines three databases investigated under the guidance of the Chinese government, offering a comprehensive overview of industrial facilities. It includes details on the locations, activity rates, production technology, end-of-pipe pollution control devices, and other parameters. It is worth noting that the facility-level activity data were corrected using provincial activity data from MEIC as a total constraint to ensure consistency with national totals from statistics (Zheng et al., 2021). The facility-level, technology-based approach allows for dynamic tracking of emission fluctuations resulting from technological advancements and tightening emission regulations. Crucially, the use of facility geolocations, rather than relying on spatial proxies like urban population, enables the derivation of gridded industrial data at a resolution of ∼ 1 km. This approach significantly avoids misallocating emissions from rural to urban areas at fine grids, as supported by previous studies demonstrating its effectiveness in mitigating simulated biases in air pollutant concentrations within densely populated regions (e.g., Zheng et al., 2021). For temporal variations it employs the same monthly profiles as MEIC, including the production of various industrial goods or gross domestic product (GDP), as outlined in Li et al. (2017b). The NMVOC speciation also aligns with the MEIC model. This inventory takes priority over MEIC, indicating that only few industrial sources not covered in this inventory are substituted with MEIC.
2.1.3 The YRD air pollutant emission inventory
Regional emission inventories within YRD provide a more accurate representation of emissions compared with the national-scale MEIC, as proven by ground and satellite observations (Yang and Zhao, 2019; Zhang et al., 2021; Zhao et al., 2017a, 2018, 2020; Zhou et al., 2017b). This improvement is attributed to the avoidance of outdated or non-localized emission calculation parameters commonly present in large-scale inventories like MEIC. Here, we merge the 2017 YRD air pollutant emission inventory into INTAC to achieve state-of-the-art estimates for rapidly changing emissions over this core area (An et al., 2021; Gu et al., 2023; Zhou et al., 2017b).
Localized field surveys and measurements greatly enhance the reliability of calculation parameters within the YRD inventory. Highly resolved emissions for the power sector are acquired through on-site monitoring with high temporal resolution (Y. Zhang et al., 2019), rather than relying on static and outdated average emission factors. Facility-level information (e.g., the removal efficiencies) obtained from local investigation and a segment-based industrial process method enhances the understanding of both the quantity and spatial patterns of industrial emissions. Considering meteorological factors and land use conditions during agricultural processes results in more accurate seasonal and spatial distributions of NH3 emissions. (Zhao et al., 2020). An investigation of in-use machinery is conducted to capture the seasonal emission patterns from off-road machines (Zhang et al., 2020). Real-world surveys are performed to determine grain straw ratios and household burning proportions, facilitating the quantification of emissions from biomass-fueled stoves. The PM2.5 and NMVOC speciation profiles are updated based on multi-instrument sampling and analysis in both current and previous studies (Huang et al., 2018; Zhao et al., 2017a), satisfying the need for simulating PM2.5 chemical components and O3. The YRD inventory is collected with a spatial resolution of 0.1° and an annually temporal resolution in this study. Only CB05 volatile organic compound (VOC) species are collected.
2.1.4 The PRD emission inventory
The regional emission inventories within the PRD region have demonstrated enhanced reliability compared with previous studies (Huang et al., 2021; Sha et al., 2021; Zheng et al., 2012). The PRD emission inventory developed by Jinan University captures spatial and temporal variations within the PRD region under emission control policies, serving as a foundation for supporting air-quality modeling (Huang et al., 2021; Sha et al., 2021).
The PRD inventory exhibits notable accuracy improvements achieved by means of big-data-driven estimation methods, updated spatial–temporal allocations, and localized NMVOC speciation profiles. Gridded hourly open biomass burning emissions are quantified by fusing the fire radiative power data from three satellites, and hourly shipping emissions are estimated using high-frequency automatic identification system (AIS) records. A total of 31 monthly profiles and 10 spatial proxies are updated to reflect spatial–temporal patterns of emissions influenced by economic growth and energy consumption structural adjustment. Approximately 90 % of industrial emissions are disaggregated using exact locations, and novel proxies (e.g., farmland production potential) have been developed for several sectors. The NMVOC speciation is carried out through extensive localized measurements and literature reviews, manifested as a collection of 480 NMVOC source profiles across eight sectors and 380 species. The species relevant to the SAPRC-07 chemical mechanism are collected in this work. Additionally, the inventory encompasses 800 source categories, placing particular emphasis on incorporating new sectors relevant to VOC emissions. Activity rates are improved by utilizing extensive field surveys and data mining efforts involving investigations of production data for 10 000 industrial plants and the gathering of activity-relevant information for 50 million vehicles. Emission factors that reflect the local context are obtained or revised based on source measurements and the latest research findings. These updates help mitigate uncertainties in emission estimates for the PRD region. The PRD inventory is initially collected at a monthly resolution and a spatial resolution of 0.05°, with detailed spatial–temporal allocation proxies as outlined in Huang et al. (2021).
2.1.5 The open biomass burning emission inventory in China
As a significant source of CO2, BC, OC, and other pollutants, open biomass burning profoundly influences air quality, climate change, and human health (Reisen et al., 2013). A case study in summer 2011 for the YRD region revealed that during a severe haze episode, open biomass burning contributed to 37 %, 70 %, and 61 % of PM2.5, OC, and elemental carbon (EC) emissions, respectively (Cheng et al., 2014). To address the absence of this source in MEIC, we integrate a high-resolution open biomass burning emission inventory by Peking University into INTAC (Huang et al., 2012a; M. Liu et al., 2015; Song et al., 2009; Yin et al., 2019).
The inventory applies satellite observations to tackle considerable uncertainties associated with provincial statistical data and overcome the coarse resolution found in previous studies (Ni et al., 2015). The estimation of biomass consumption in the inventory is based on the fire radiative energy (FRE) approach, which depends on the energy emitted by fires. This approach helps reduce the biases introduced by burned-area algorithms, especially for small-scale fires. The inventory utilizes the high-spatial-resolution land cover dataset GlobeLand30 derived from multi-spectral images to classify biomass fuel types. Eventually, daily emissions from forest, grassland, cropland, and shrubland are calculated at a 1 km resolution. The reasonableness is validated by comparing with other datasets such as the fourth version of the Global Fire Emissions Database (GFED). The initially collected inventory lacks model-ready VOC species.
2.1.6 The shipping emission inventory in East Asia
In recent years, maritime trade in the East Asian region has significantly increased (United Nations Conference on Trade and Development (UNCTAD), 2014), resulting in a surge in shipping emissions with substantial impacts on air quality and climate. Previous studies have indicated that East Asian shipping emissions accounted for 16 % of the global total in 2013. Shipping emissions made a growing contribution to the rise in annual mean PM2.5 concentrations, reaching levels as high as 5.2 µg m−3 in 2015 (Lv et al., 2018). To address the omission of this emission source in MEIC, we integrate the shipping emission inventory in East Asia for 2017 into INTAC (H. Liu et al., 2016; Liu et al., 2019).
The inventory introduces an innovative approach based on comprehensive and dynamic ship activity data. A static dataset of approximately 66 000 vessels is compiled as a foundation, using information from Lloyd's Register and the China Classification Society. This dataset encompasses various ship properties including ship category, hull shape, engine rotational speed, engine capacity, maximum speed capability, and build year. High-quality AIS data are used to capture ship activities, incorporating the Maritime Mobile Service Identification identifier, geographical location, real-time speed, and time-related information. The AIS data are also employed to generate gridded emissions from shipping at a spatial resolution of 0.1°. The inventory enhances our comprehension of regional-level shipping emissions and significantly alleviates biases arising from the misallocation of marine fuels, as observed in global studies (Endresen et al., 2007). The collected shipping inventory provides emissions at an annual resolution for seven species including SO2, NOx, CO, NMVOC, PM2.5, BC, and OC.
2.1.7 PKU-NH3
As a prominent alkaline component in the atmosphere, ammonia plays a crucial role in atmospheric chemistry and also terrestrial and aquatic ecosystems through its participation in atmospheric reactions and deposition processes. This study integrates PKU-NH3, a high-resolution ammonia emission inventory for China developed by Peking University. PKU-NH3 is designed to track the evolution of NH3 emissions amid the rapid increase in grain and meat production in China over the past few decades (Huang et al., 2012b; Kang et al., 2016). This inventory offers a better grasp on NH3 emissions in China through the application of a process-based method and more reliable emission factors, in contrast to previous studies (Kurokawa et al., 2013; Li et al., 2017b). Top-down NH3 inversion through satellite observations provides additional validation for the accuracy of PKU-NH3 (Paulot et al., 2014).
Earlier studies of NH3 emissions commonly used fixed EFs, overlooked some ammonia emission sources, and had coarse resolutions (Ohara et al., 2007; Streets et al., 2003). Unlike previous approaches, PKU-NH3 incorporates dynamic and multifactorial EFs and more comprehensive emissions sources. The determination of emission factors takes into account various parameters related to local conditions and agricultural practices. When estimating NH3 emissions of synthetic fertilizer application, the model considers five types of fertilizers and factors such as soil acidity, ambient temperature, fertilizer application technique and dosage, wind speed, and in situ measurements of NH3 flux. For livestock waste, NH3 emissions are calculated using a mass-flow approach across four phases of manure management, considering variables such as animal rearing types, temperature, and wind speed. In addition, NH3 emissions from other small sources are quantified, including agricultural soil, nitrogen-fixing crops, crop residue compost, excretion of rural populations, open biomass burning, waste disposal, gasoline vehicles, diesel vehicles, and industrial processes. The NH3 emissions are allocated from provinces into 0.1° grids based on spatial proxies such as land cover, rural population, and other relevant indicators. Monthly emission factors shaped by meteorological conditions are used to calculate NH3 emissions from fertilizer application and livestock source at a monthly level.
2.2 The integration of multi-source heterogeneous data
In the integration process, seven heterogeneous inventories are first normalized in terms of emission sources, species, and spatial–temporal resolutions, and then they are integrated following a priority order to produce a standardized, highly resolved data cube.
2.2.1 Source mapping
To merge inventories under a unified emission source classification system, the emission sources in the MEIC model are categorized into 88 standard sectors for mapping (Table S1 in the Supplement). The first-level category comprises 10 subcategories, namely, stationary combustion, industrial process, mobile source, solvent use, agriculture, dust, biomass burning, storage and transportation, waste treatment, and other sources. These subcategories are then further subdivided into 88 second-level sources, which take industrial classification for national economic activities for reference. For example, the industrial process sector encompasses emission sources such as the manufacturing of non-metallic mineral products, manufacturing of chemical fibers, manufacturing of foods, and smelting and pressing of ferrous metals. In the initial step of integration, the sectors in each emission inventory are mapped to the standardized two-level sources.
2.2.2 Species mapping
In the next step, non-methane volatile organic compounds (NMVOCs), particulate matter (PM), and NOx in each inventory are converted into model-ready species to support CTMs. The species mapping process is grounded in the chemical species mapping methods in the MEIC model (Li et al., 2017b, 2014). The model supports aerosol chemical schemes such as AER05 and AER06. NOx emissions are allocated to NO and NO2 emissions based on ground observations. The step-by-step NMVOC speciation framework developed in Li et al. (2014) is employed to generate emissions for various gas-phase chemical mechanisms commonly used in CTMs, including CB-IV, CB05, SAPRC-07, SAPRC-99, and RADM2. The framework incorporates an explicit-assignment approach and updated profiles based on both local measurements and the SPECIATE database v.4.5. The sources abundant with oxygenated volatile organic compounds (OVOCs) are identified, and the incomplete profiles with missing OVOC fractions are corrected. The accurate speciation mapping helps reduce uncertainties in model-ready emissions. For inventories providing speciated VOC emissions for certain mechanisms (e.g., the YRD inventory for CB05 and the PRD inventory for SAPRC-07), we use their emissions directly, or alternatively, we utilize MEIC's speciation framework to generate model species for the five chemical mechanisms.
2.2.3 Temporal disaggregation
The seven emission inventories are collected at different temporal resolutions (Table 1) and need to be temporally allocated to a unified monthly scale for integration. Monthly emissions from PKU-NH3, the PRD inventory, the industrial point source inventory, and MEIC can be directly used for data merge. Daily-level emissions from the open biomass burning inventory are aggregated to monthly scales through summation. For annual inventories (e.g., the YRD inventory), sector-specific monthly profiles derived from the MEIC model are used for disaggregation (Li et al., 2017b). For instance, monthly power generation data from the National Bureau of Statistics describe variations in monthly power emissions. Industrial production or the GDP from the National Bureau of Statistics is employed to account for monthly emission fluctuations related to industrial heating, boilers, cement, iron and steel, and other industrial processes. Monthly emission factors calculated by the International Vehicle Emissions model are applied to on-road vehicles. Considering the insignificant monthly variations in automatic identification system data for marine shipping, the annual shipping emissions are uniformly disaggregated across the months.
2.2.4 Spatial allocation
The seven inventories are in different data formats, including point source and gridded formats at varying resolutions, necessitating spatial harmonization for integration. Although the industrial point source inventory and the open biomass burning inventory can accurately pinpoint the specific geographical locations of emission sources, the other five inventories rely on numerous spatial proxies to disaggregate emissions into grids, which inevitably introduce uncertainties at very fine resolutions. Therefore, we re-grid the final product to 0.1° to ensure high-level spatial accuracy. Gridded emissions finer than 0.1° resolution are aggregated to 0.1°, which is performed in the open biomass burning inventory and the PRD inventory. For the industrial point source inventory, latitude and longitude coordinates are employed to directly position them within grid locations. Area sources in MEIC are allocated to grids using spatial proxies within the MEIC model (Li et al., 2017b). For instance, industrial sources are assigned to grids based on urban population (Schneider et al., 2009). The road network (Zheng et al., 2014) serves as a proxy for disaggregating emissions of on-road vehicles, while rural population (Schneider et al., 2009) is used as the proxy for fertilizer and livestock sources. It is important to mention that uncertainties may arise at city borders if emissions from adjacent cities come from different inventories during the integration process. To mitigate biases introduced by border issues, all emissions at 0.1° resolution are first uniformly downscaled to 1 km in preparation for the spatial–temporal coupling process, and then they are re-gridded back to 0.1° for the final product.
2.2.5 Spatial–temporal coupling
Finally, following the procedures outlined in Sects. 2.2.1–2.2.4, all inventories are preprocessed to a standardized format encompassing 88 sectors, various species, a spatial resolution of 1 km, and a monthly temporal resolution. This preprocessing prepares the inventories for merging, ultimately resulting in the generation of a standardized data cube.
The integration is carried out at source-by-source, species-by-species, and grid-by-grid levels, with the process guided by the priority order of each inventory (Table 1). MEIC serves as the default inventory in our integration, offering extensive spatial and species coverage along with spatial proxies, temporal profiles, and NMVOC speciation methods within the model. The remaining six emission inventories are assigned a predefined priority order. The industrial point source emission inventory for China takes precedence over industrial emissions in MEIC, substituting proxy-based spatial allocation with precise geographical coordinates. This extends the applicability of MEIC from a resolution greater than 0.25° to finer scale (Zheng et al., 2021, 2017). To achieve fine-grained emission characterization in critical areas, the YRD and PRD emission inventories enriched with localized data and advanced methods are incorporated to update emissions in these areas. While MEIC comprehensively estimates emissions for ∼ 800 source categories in China, there may still be omissions for certain emission sources. The inclusion of inventories for open biomass burning and East Asian shipping helps partially fill this gap. PKU-NH3, generated by a process-based model to provide a comprehensive understanding of China's NH3 sources, is utilized to replace all NH3 emissions in other inventories. The prioritization is performed city by city. For emissions of a particular species from a specific emission sector, when multiple inventories overlap in city grids, the estimates from the highest-priority inventory are selected as the final emissions. Through this step the integrated inventories are developed based on the configured output settings such as map projection and spatial–temporal attributes.
2.3 Evaluation of the emission inventory using WRF/CMAQ model
We apply Weather Research and Forecasting version 3.9 (WRFv3.9) and Community Multiscale Air Quality version 5.2 (CMAQ5.2) as the air-quality simulation systems. Two nested simulation domains with horizontal resolutions of 36 and 12 km are used (Fig. S1 in the Supplement). The mother domain (172 × 127 cells) covers the entire Chinese mainland and parts of the neighboring countries, and the nested domain (226 × 241 cells) includes the heavily polluted eastern China. Some 4-month (January, April, July, and October) simulations in 2017 are carried out with a 7 d spin-up period preceding each month. The vertical resolution in WRF is set with 45 sigma levels ranging from the surface up to 100 hPa. Subsequently, it is collapsed into 28 layers through the Meteorology–Chemistry Interface Processor (MCIP) before being input into CMAQ.
The configurations of the WRF and CMAQ models in this study follow Cheng et al. (2019). The meteorological initial and boundary conditions for the simulation are provided by the final reanalysis data from the National Centers for Environmental Prediction (NCEP-FNL; https://rda.ucar.edu/datasets/ds083.2/, last access: 15 December 2022). The schemes for shortwave radiation, longwave radiation, land surface processes, boundary layer, cumulus parameterization, and cloud microphysics are selected as the New Goddard scheme (Chou et al., 1998), RRTM scheme (Mlawer et al., 1997), Pleim–Xiu surface layer scheme (Xiu and Pleim, 2001), ACM2 PLB scheme (Pleim, 2007), Kain–Fritsch scheme (Kain, 2004), and WSM6 scheme (Hong and Lim, 2006), respectively. Observational nudging and soil nudging are employed to enhance the meteorological simulation. Regarding the CMAQ model, the chemical mechanisms for gas-phase, aqueous-phase, and aerosol are configured as CB05, the regional acid deposition model (RADM), and AERO6, respectively. Photolysis rates are calculated online using the simulated aerosols and ozone concentrations. Anthropogenic emissions outside China are taken from the MIX inventory (Li et al., 2017b). The integrated inventories INTAC and MEIC are used for comparison within China. Biogenic emissions are calculated using the Model of Emissions of Gases and Aerosols from Nature version 2.1 (MEGANv2.1), while dust and lightning emissions are not considered in this study.
The performances of WRF for the meteorological parameters are evaluated against the Integrated Surface Database (ISD) from the National Climatic Data Center (NCDC; ftp://ftp.ncdc.noaa.gov/pub/data/noaa/). Evaluation metrics include the correlation coefficient (R), mean bias (MB), root mean square error (RMSE), normalized mean bias (NMB), and normalized mean error (NME). Table S2 demonstrates good agreement between WRF model results and ground-level observations. Similar configurations also have been validated in previous studies (Cheng et al., 2019, 2021a, b). CMAQ modeling performances are assessed using hourly observed concentrations of air pollutants obtained from the China National Environmental Monitoring Center (http://www.cnemc.cn/, last access: 15 December 2022).
3.1 China's emission characteristics in 2017
We use the integrated emission inventory to analyze air pollutant emissions in China for 2017. Major air pollutant emissions are estimated as follows: 12.3 Tg SO2, 24.5 Tg NOx, 141.0 Tg CO, 27.9 Tg NMVOCs, 9.2 Tg NH3, 11.1 Tg PM10, 8.4 Tg PM2.5, 1.3 Tg BC, and 2.2 Tg OC. The emission data, organized into power, industry, residential, transportation, agriculture, solvent use, shipping, and open biomass burning sectors, are available for download at https://doi.org/10.5281/zenodo.10459198 (Wu et al., 2024) and http://meicmodel.org.cn/intac. The following sections will characterize emissions in detail across sectors, fuel types, and spatial distributions.
Table 2Anthropogenic emissions (in Gg) of air pollutants by sector in the 2017 INTAC for China. The shipping sector includes inland waterway sources and the marine vessels.
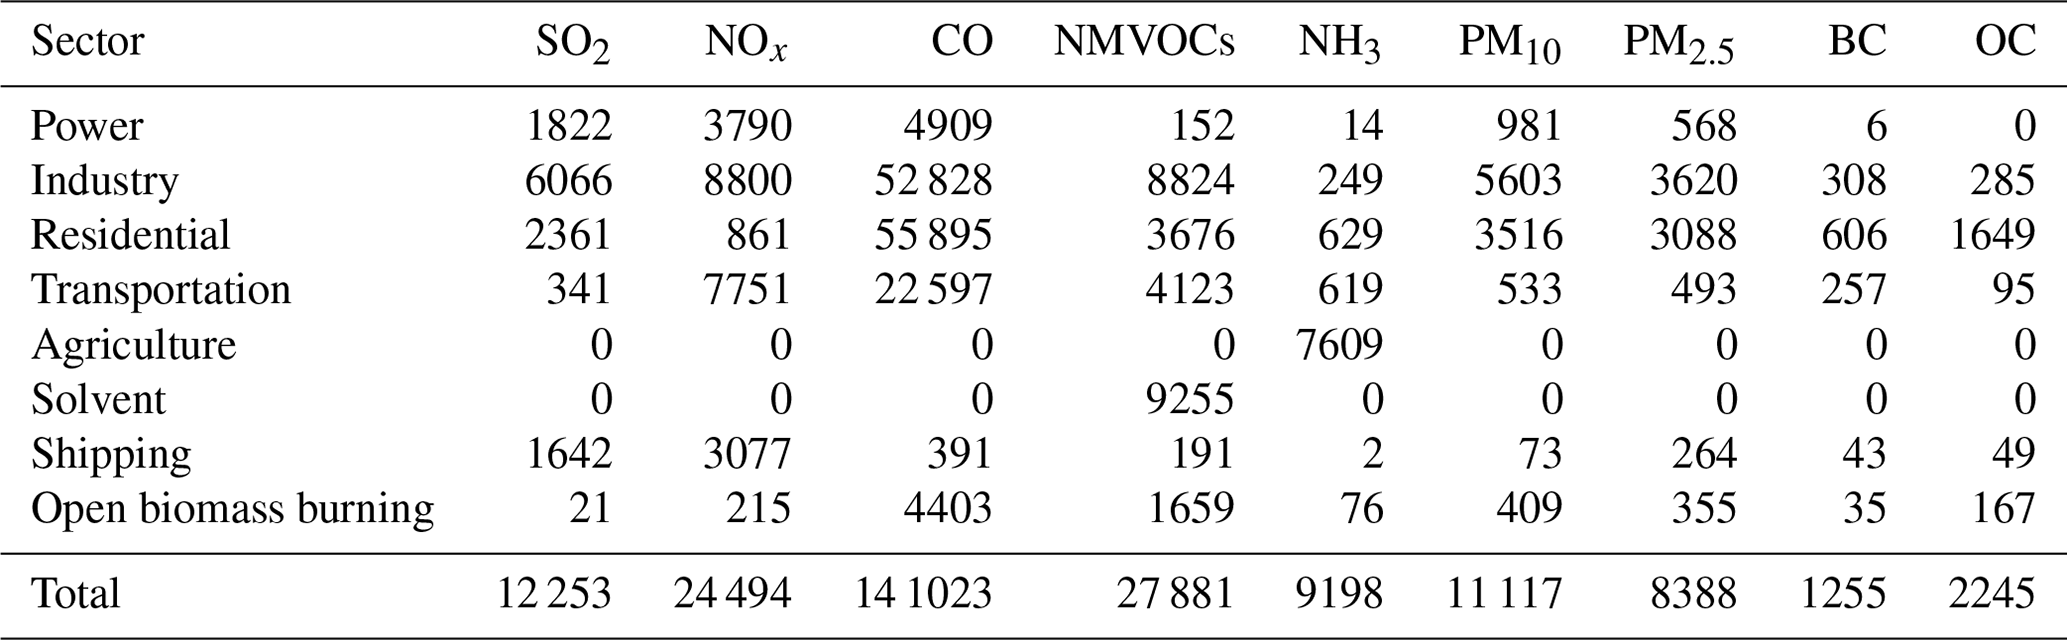
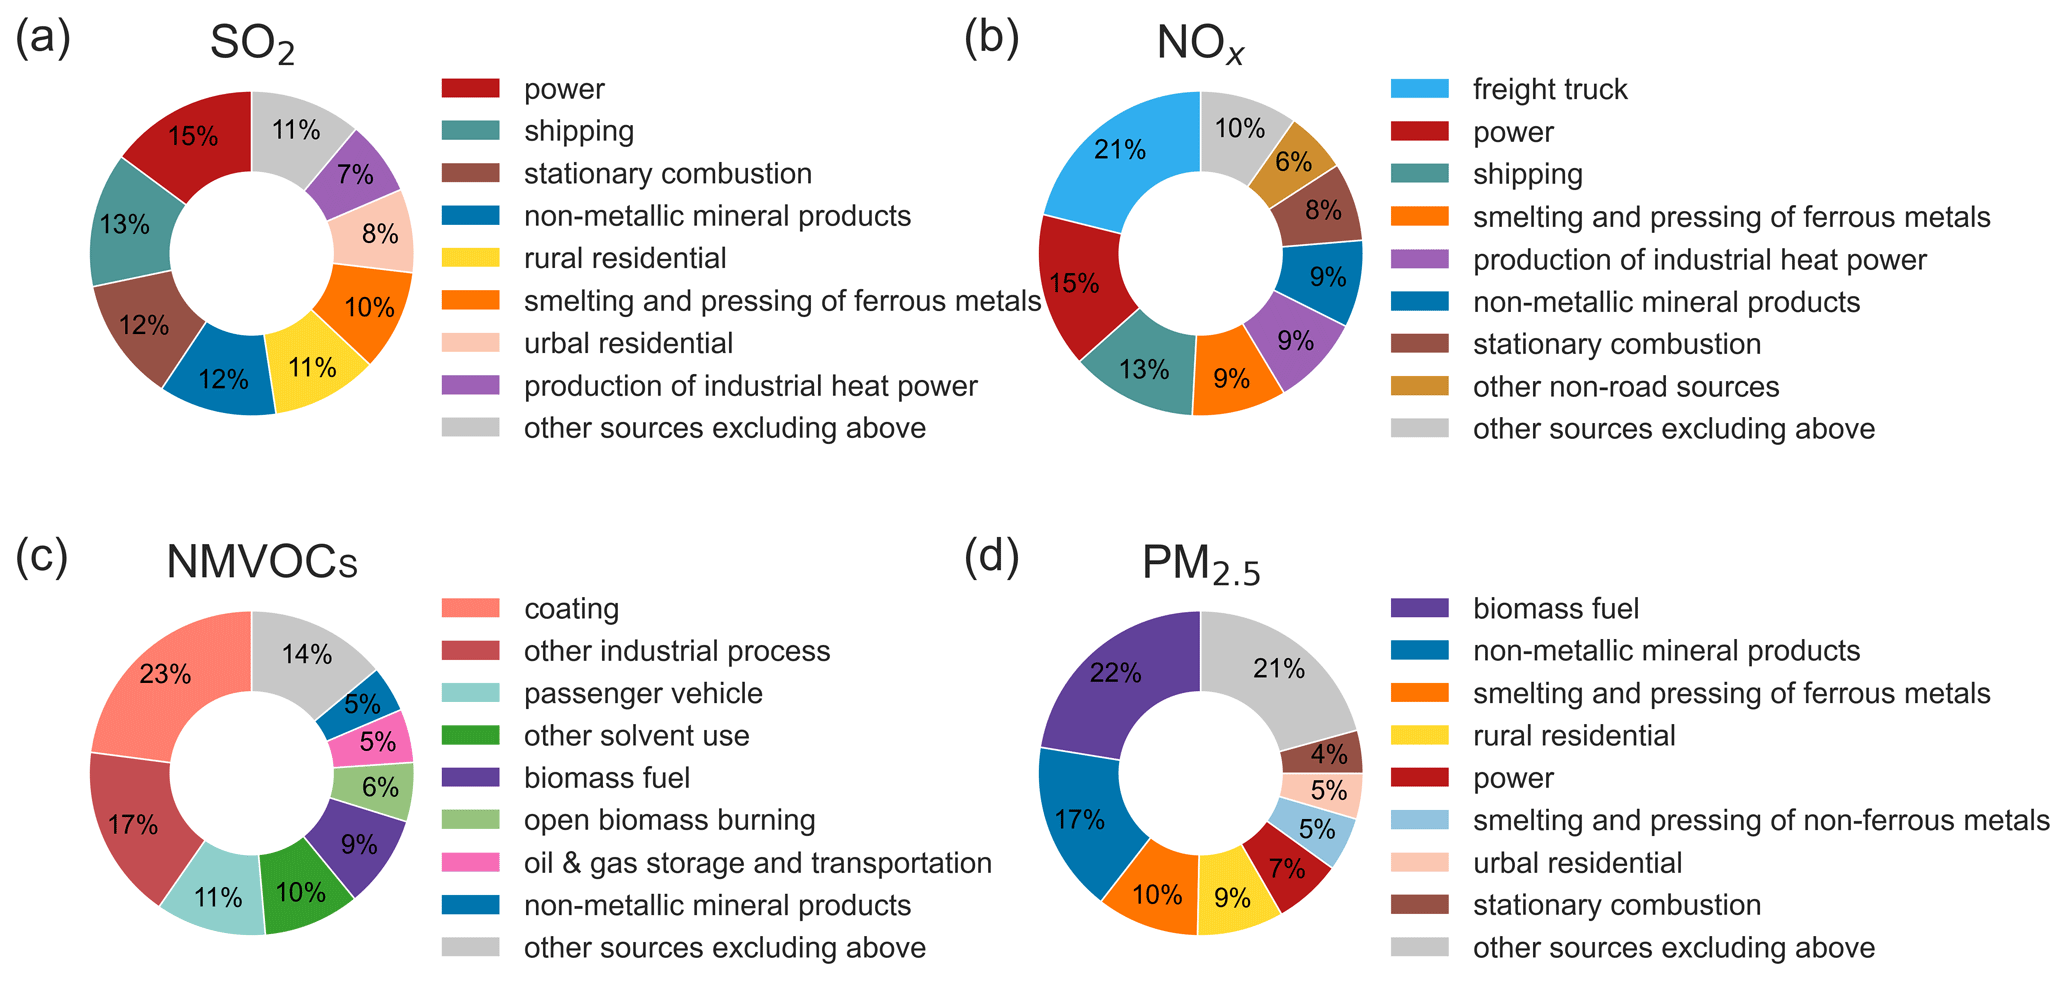
Figure 2Sector-specific distributions of emissions in the 2017 INTAC for China. Panels (a)–(c) represent the sectoral contributions for SO2, NOx, NMVOCs, and PM2.5, respectively. The figure only displays the top eight contributing sources, while sources excluding these are categorized as “other sources”.
3.1.1 By sector
Table 2 displays emissions specific to power, industry, residential, transportation, agriculture, solvent use, shipping, and open biomass burning sectors in INTAC. For pollutants primarily originating from fuel combustion and industrial processes (e.g., SO2, NOx, CO, PM10, and PM2.5), the power, industry, and transportation sources collectively contribute significantly to their emissions, ranging from 56 % to 83 %. Industrial sources take a leading role in various atmospheric pollutants, contributing more than 30 % for SO2, NOx, CO, NMVOC, PM10, and PM2.5 emissions. Due to low combustion efficiency and a lack of emission control measures, residential sources exhibit a high emission factor for products of incomplete combustion, leading to 40 % of CO, 48 % of BC, and 73 % of OC emissions. Solvent sources exclusively produce NMVOC emissions, contributing 33 % to the overall emissions. The complexity of VOC emission origins is evident in the diverse range of contributing sources. Agricultural sources dominate NH3 emissions, comprising an 83 % share of total emissions. As described in Sect. 2.1.7, PKU-NH3 incorporates a wide variety of NH3 sources, providing a more comprehensive understanding of the sectors contributing to NH3 emissions. Insignificant sources may exert a large influence in specific regions or periods, such as during large wildfires or in cities with heavy traffic. Additionally, the contribution of the supplemented open biomass burning source, especially for OC (7 %) and NMVOCs (6 %), cannot be overlooked.
Figure 2 consolidates 88 standardized emission sources into 25 categories, allowing for a more detailed analysis of sectoral emission patterns compared with Table 2. Owing to substantial coal use in industrial and power sectors, along with sulfur-rich ship fuels, prominent contributors to SO2 emissions include power, shipping, stationary combustion, and manufacture of non-metallic mineral product sources, accounting for 15 %, 13 %, 12 %, and 12 %, respectively, to total SO2 emissions. This indicates that achieving further reductions in SO2 emissions requires the implementation of more energy-efficient end-of-pipe control measures and adoption of low-sulfur fuels. The dominant origins of NOx emissions are from the freight truck, power generation, and shipping sectors, representing 21 %, 15 %, and 13 %, respectively, of the total emissions. Both freight trucks and vessels extensively use compression ignition engines, which are prone to generating NOx emissions under high-temperature and oxygen-rich conditions. Implementing strict vehicle standards is crucial to effectively reduce NOx emissions from exhaust gases. Coatings, other industrial processes, and passenger vehicle sources together account for 51 % of anthropogenic NMVOC emissions. The major contributors to primary PM2.5 emissions include biomass fuel, the manufacture of non-metallic mineral products, and the smelting and pressing of ferrous metal sources, making up 22 %, 17 %, and 10 %, respectively, of the total emissions. It is noteworthy that the use of biomass fuels (e.g., rice straw and firewood) for cooking or heating in rural areas results in considerable PM2.5 emissions especially in provinces like Sichuan, Anhui, Shandong, and Heilongjiang.
3.1.2 By fuel type
Figure 3 illustrates the proportions of major air pollutant emissions in 2017 for each fuel type. Fossil fuel combustion significantly dominates the emissions of PM10, PM2.5, CO, BC, SO2, and NOx, with proportions ranging from 38 % to 80 %. Coal combustion accounts for 56 % of SO2 emissions, with power, residential activities, and industrial production as the primary emitters. Furthermore, petroleum combustion, mainly from marine vessels, constitutes 20 % of SO2 emissions. For NOx emissions, petroleum combustion contributes 48 % of the total, predominantly arising from freight trucks (5.2 Tg), marine vessels (3.1 Tg), and passenger vehicles (1.0 Tg). Coal combustion processes, such as power and industrial boilers, also result in substantial NOx emissions (31 %). The biomass fuel source causes 53 % of OC emissions. Emissions of NMVOCs and NH3 are primarily associated with non-combustion processes.
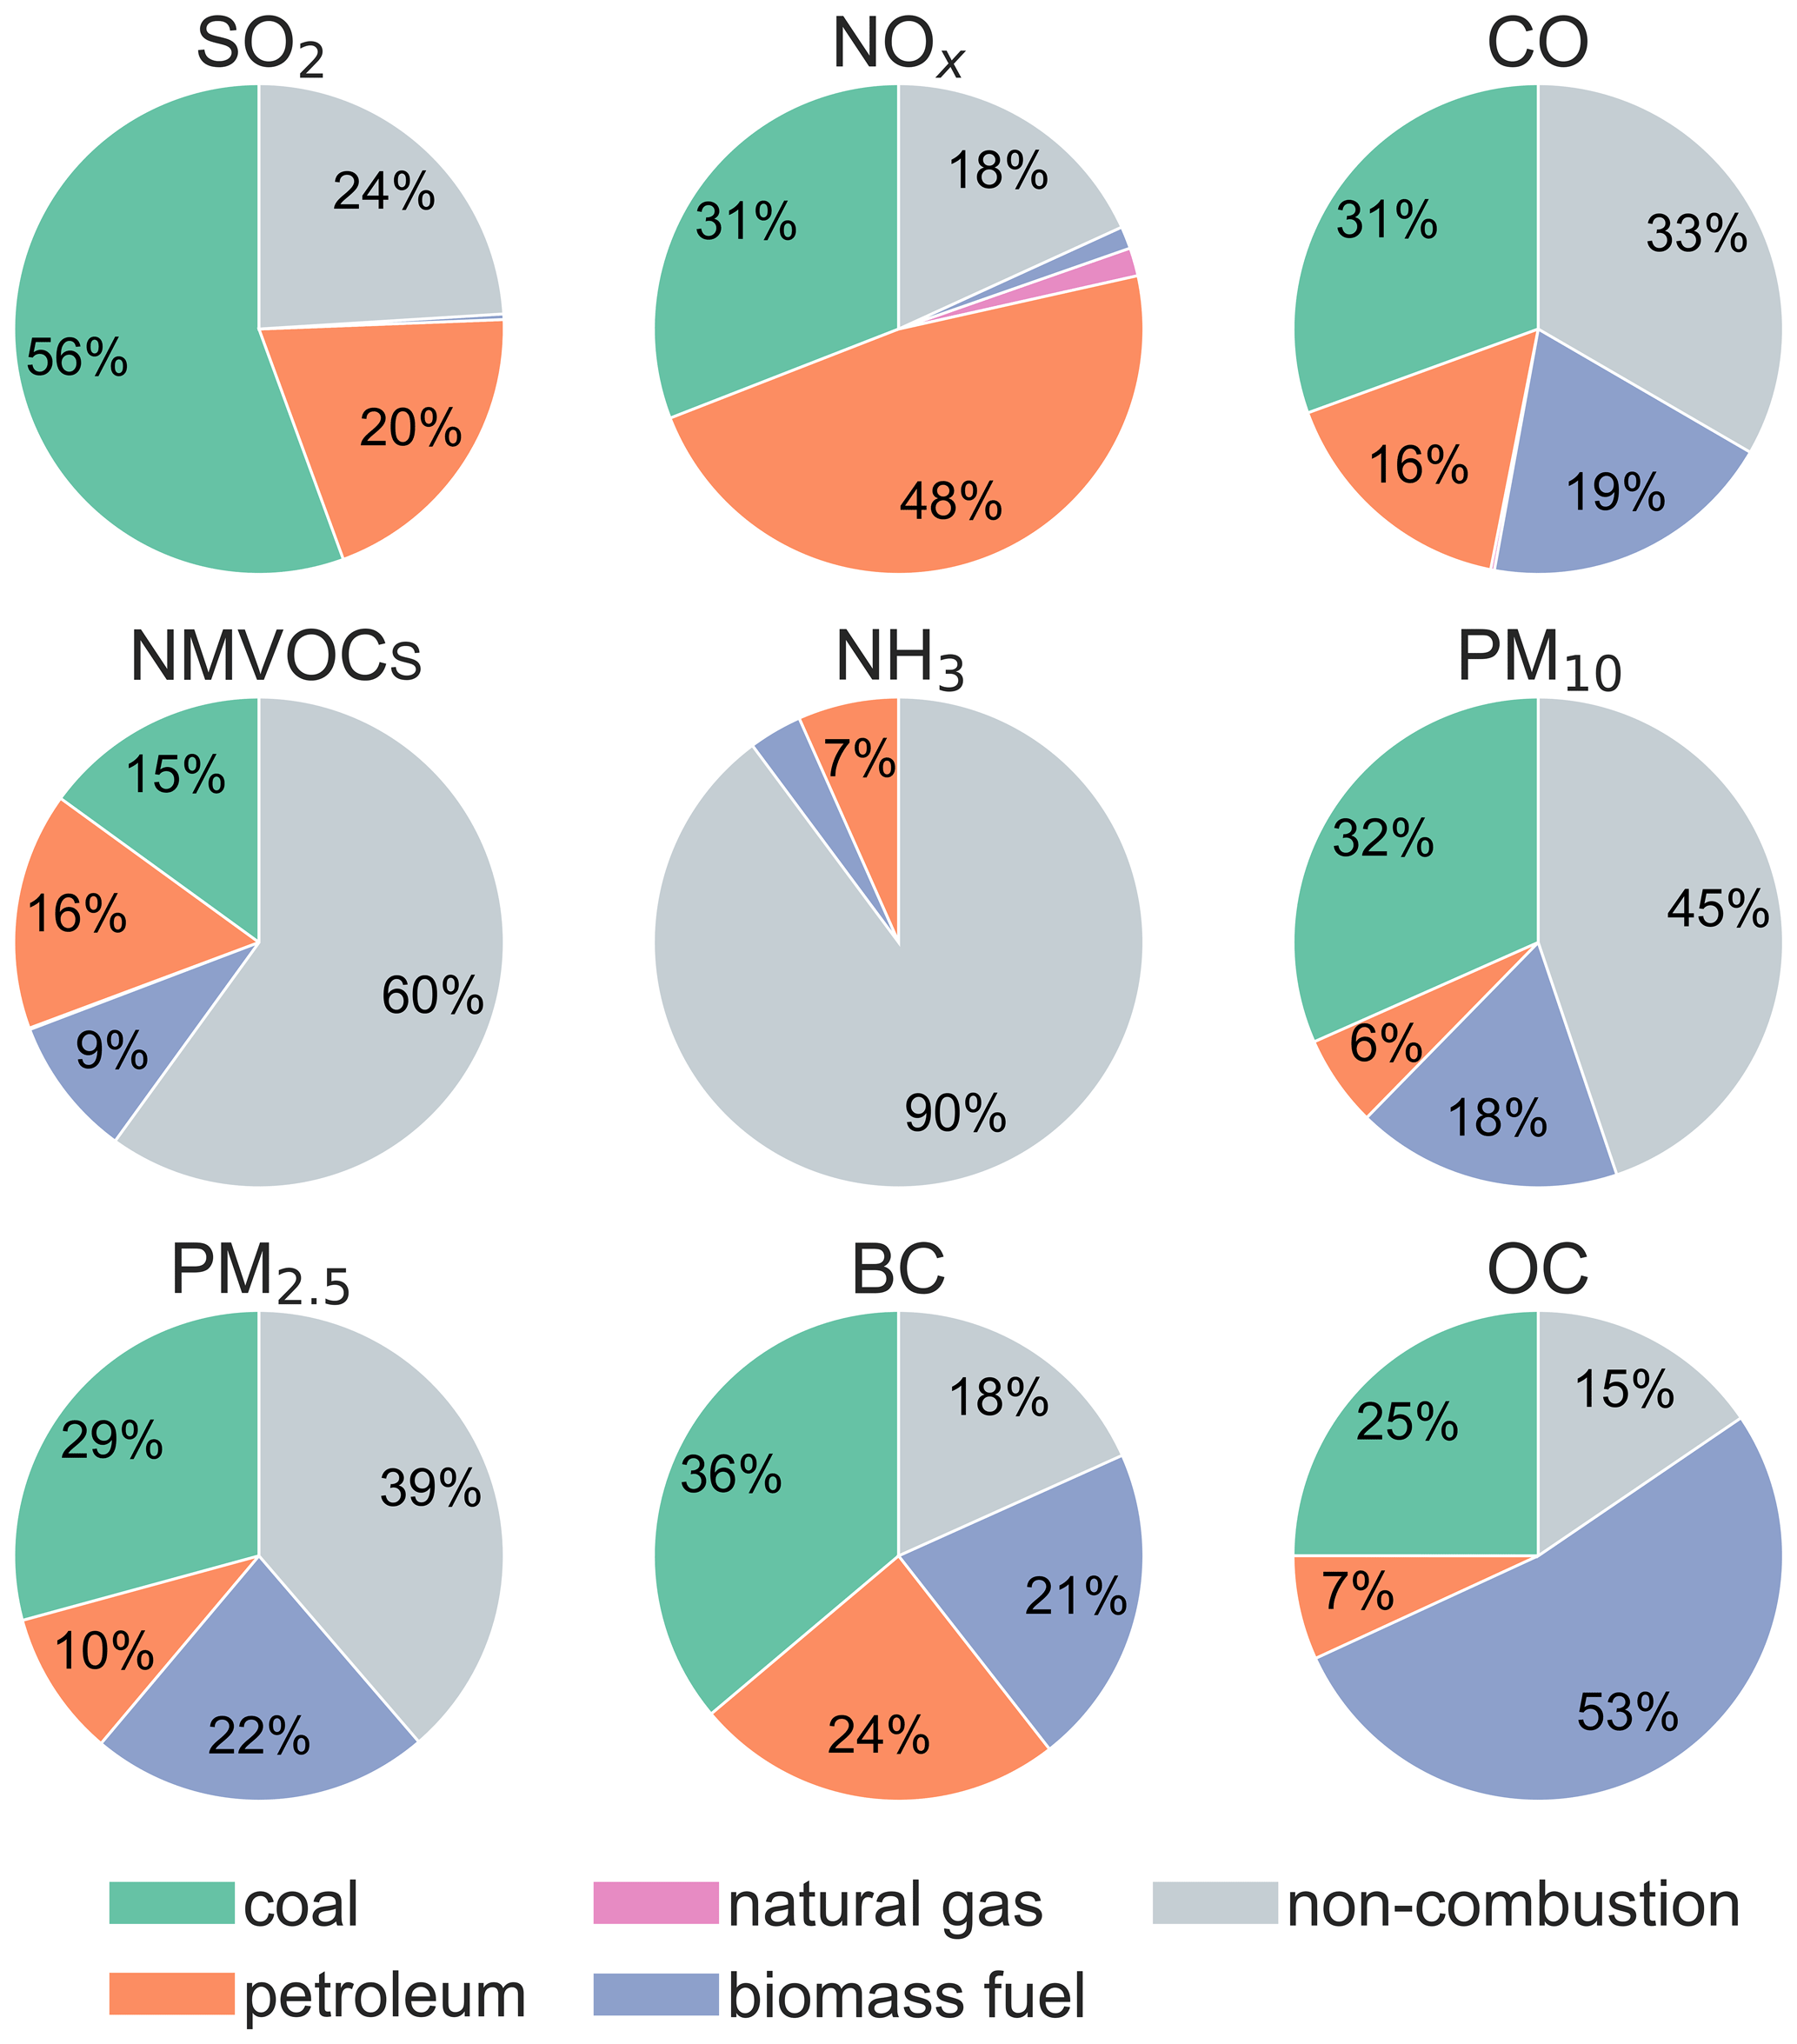
Figure 3Fuel-specific distributions of major air pollutant emissions in the 2017 INTAC for China.
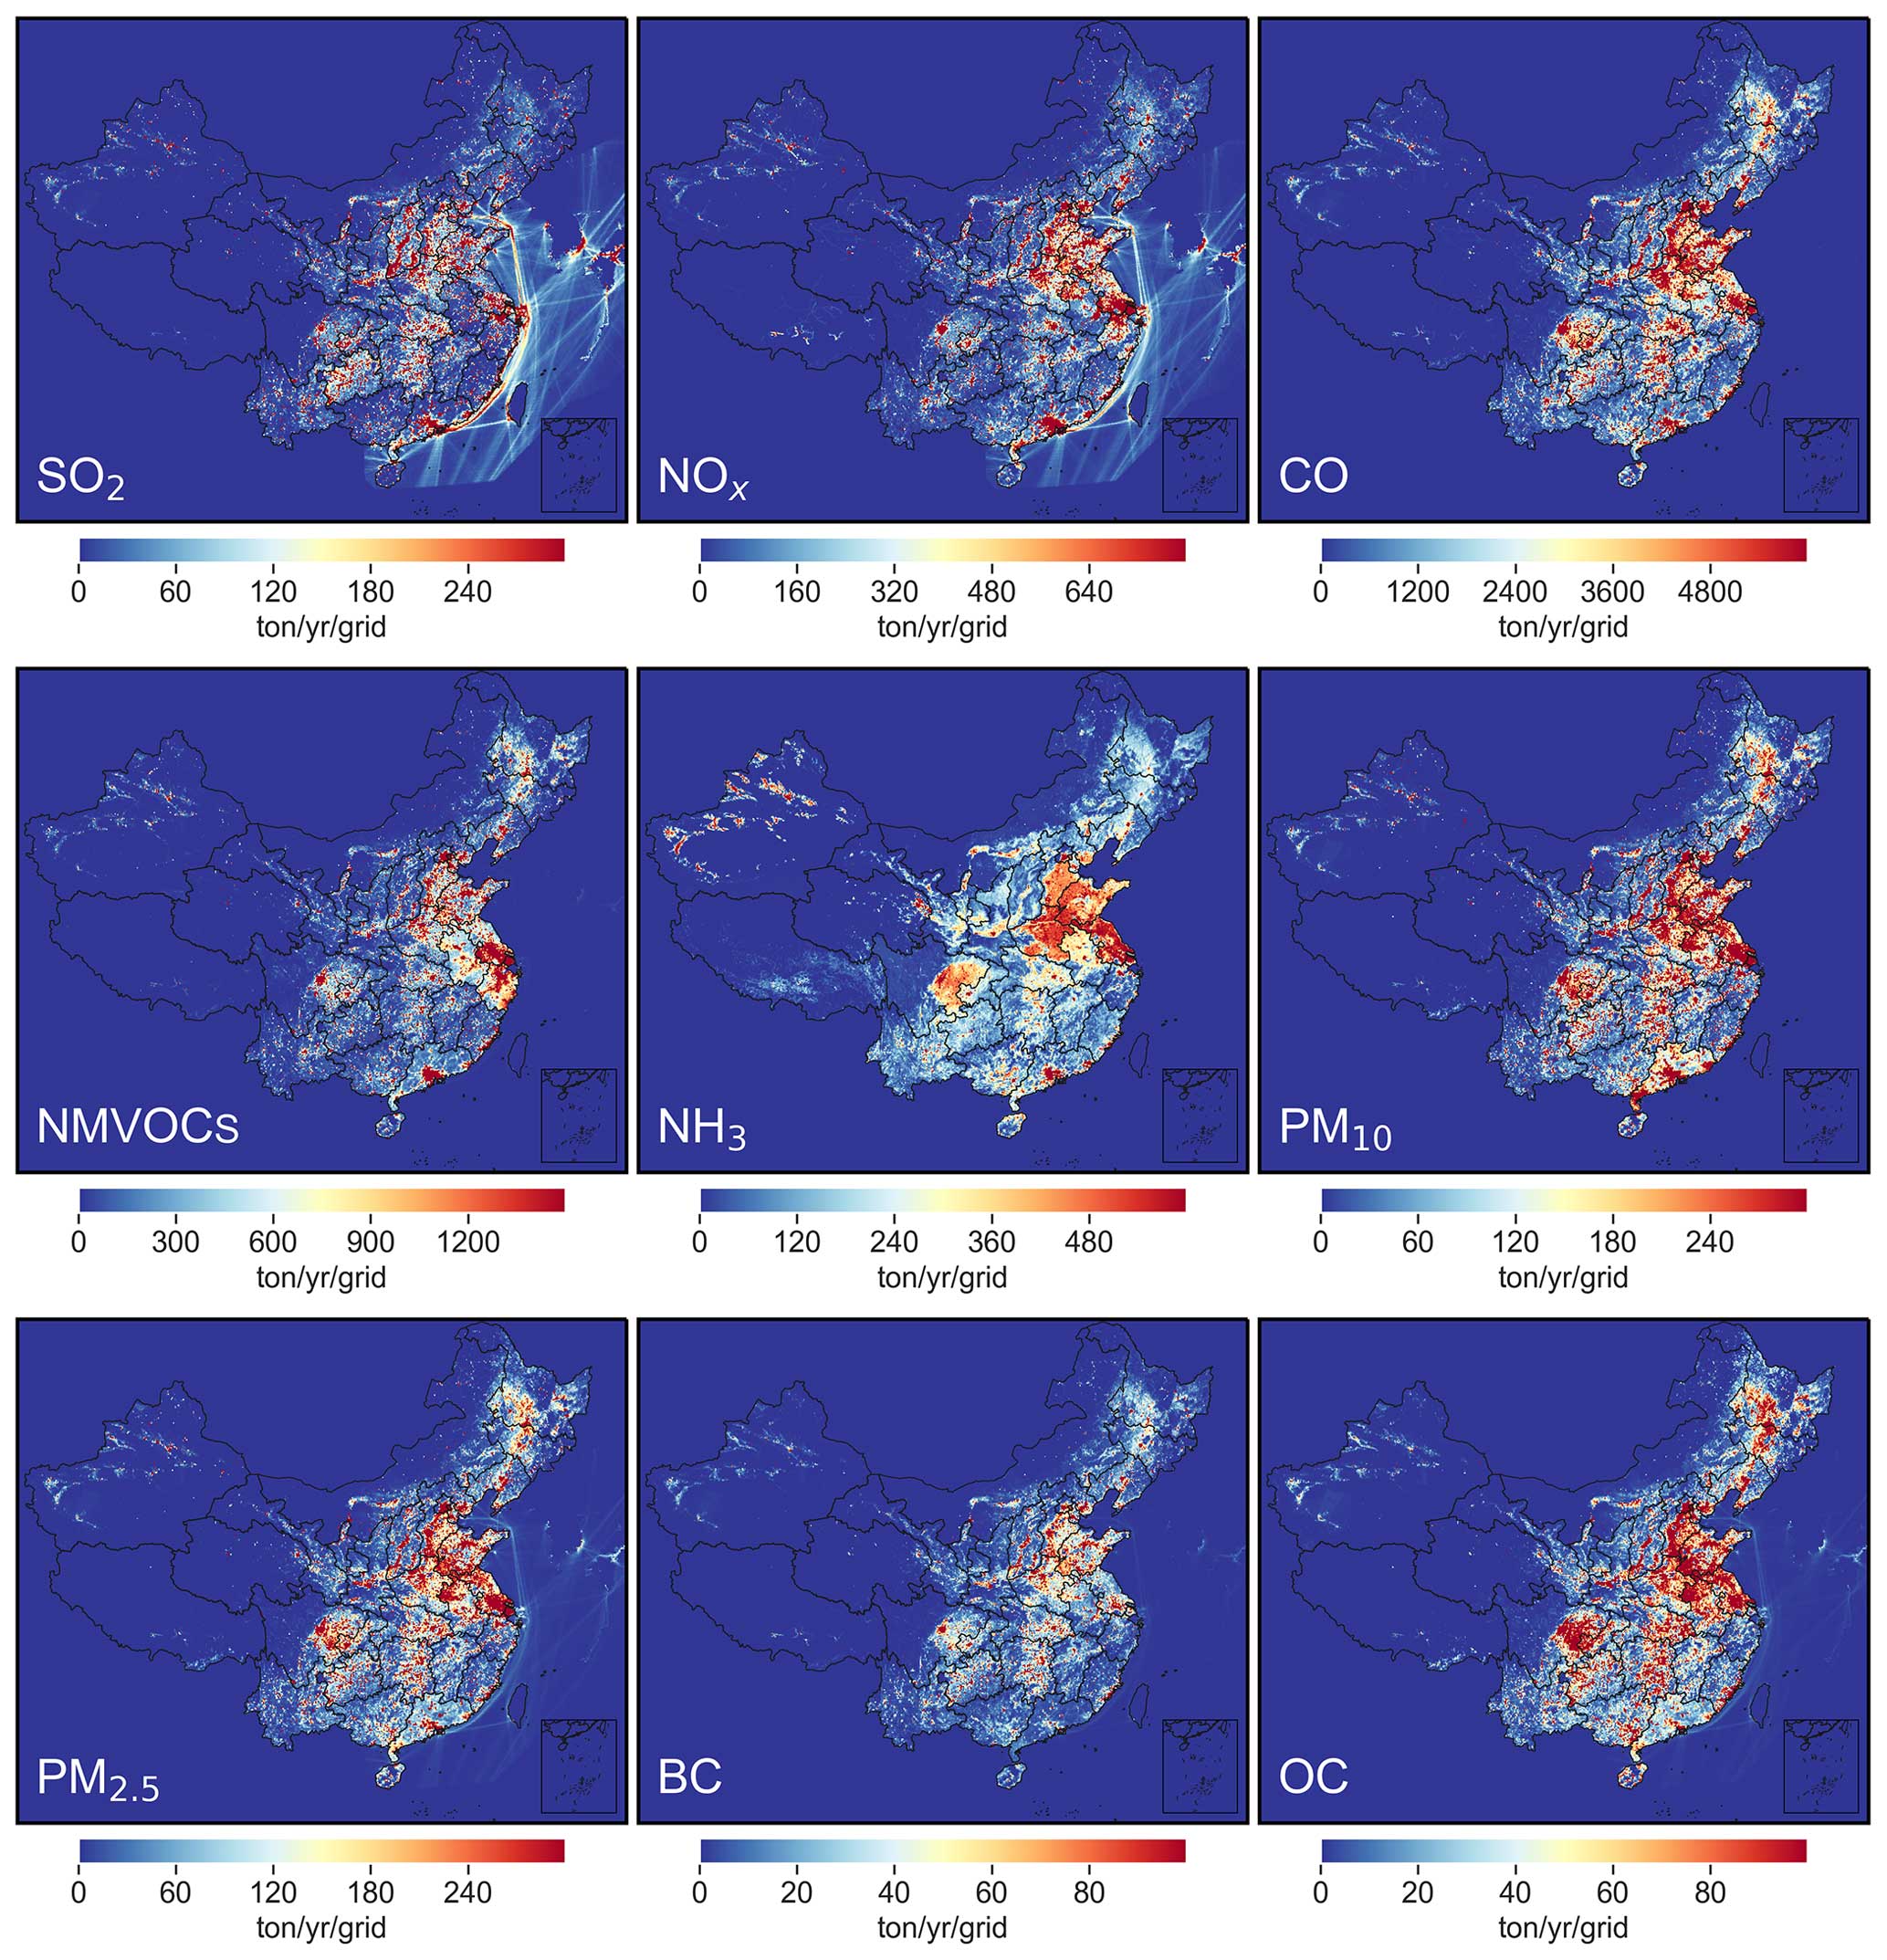
Figure 4Spatial distributions of major air pollutant emissions in the 2017 INTAC for China.
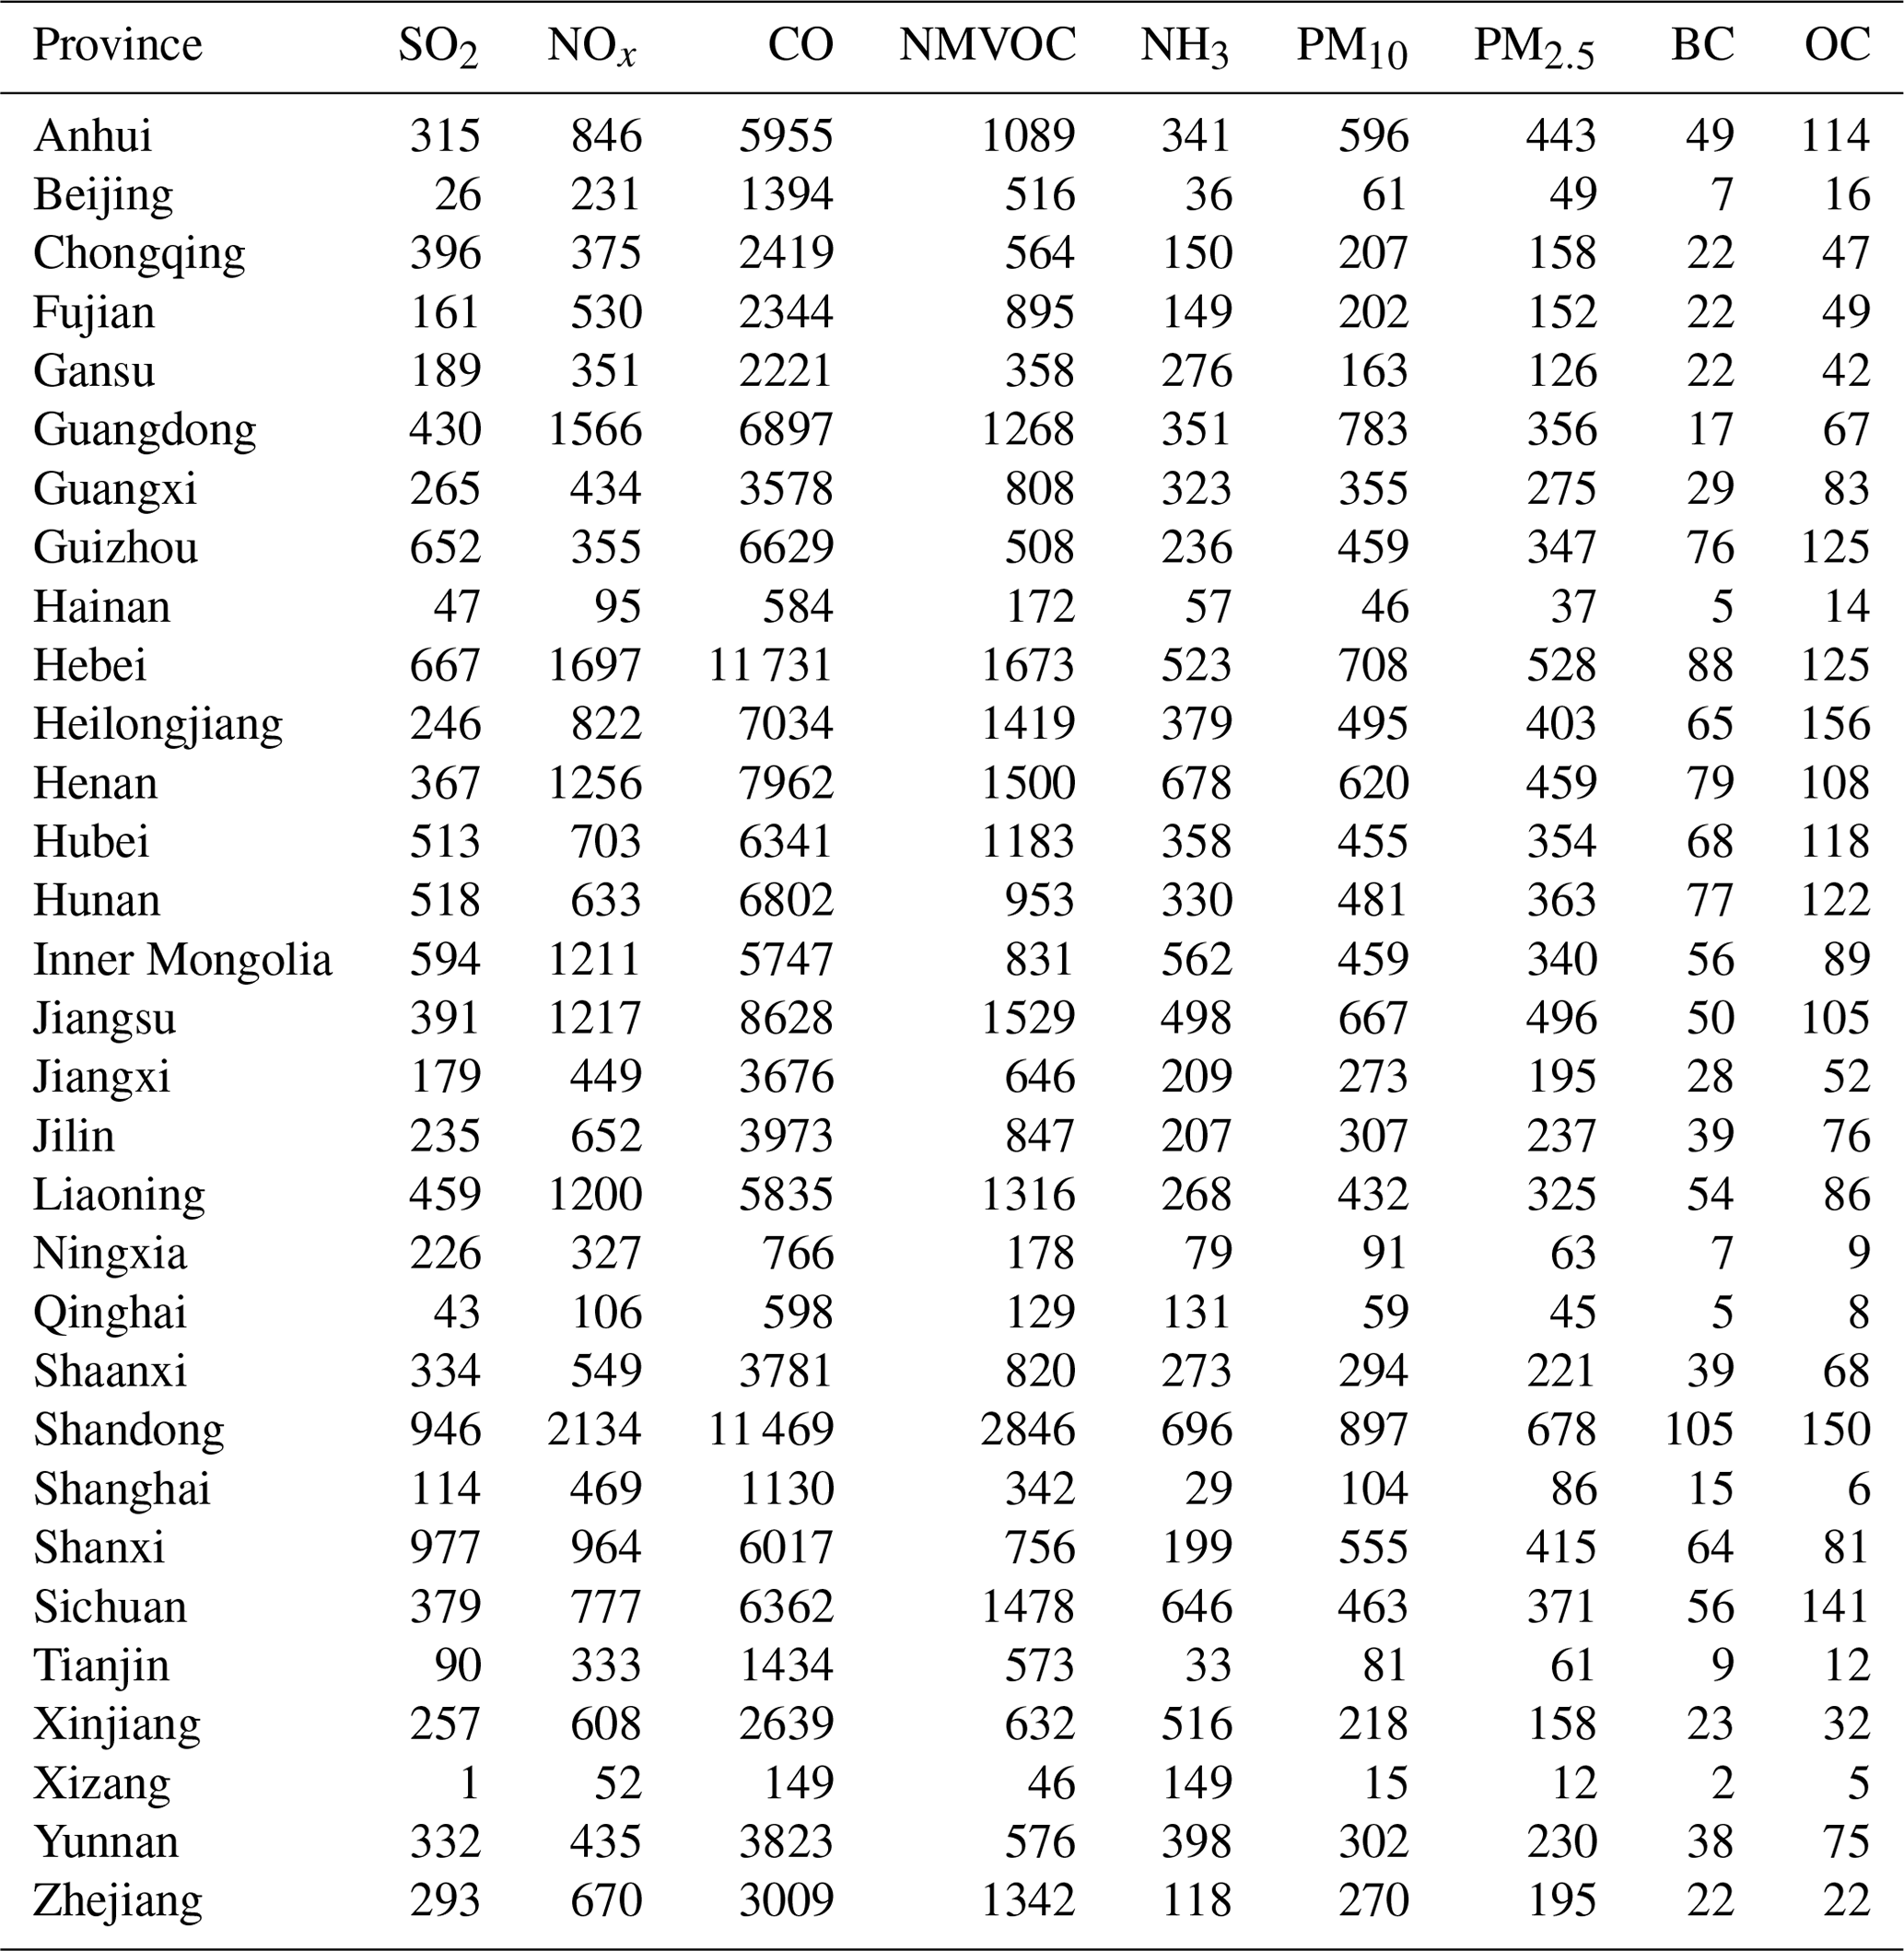
Table 3Anthropogenic emissions (in Gg) of air pollutants by province in the 2017 INTAC for China. Emissions from the shipping emission inventory in East Asia are not included.
3.1.3 Spatial distribution
We present the gridded emission maps of major air pollutants in Fig. 4. Emissions from anthropogenic sources in China exhibit significant spatial heterogeneity. Due to economic growth and industrial activities, air pollutant emissions are primarily concentrated in the central and eastern regions of China, especially in economically developed urban clusters such as the Beijing–Tianjin–Hebei (BTH) region, the YRD, and the PRD and in regions like Sichuan and Chongqing. These four key areas, as depicted in Fig. S2, collectively account for 25 %, 33 %, 35 %, 37 %, 30 %, 35 %, 33 %, 27 %, and 29 % of the national emissions of SO2, NOx, CO, NMVOCs, NH3, PM10, PM2.5, BC, and OC, respectively. Moreover, the emission maps at a fine spatial resolution of 0.1° × 0.1° present the local variations in emission patterns, identifying numerous hotspots in small areas and showcasing distinct gradients in emissions. Table 3 shows the provincial-level emissions (except Hong Kong SAR, Macao SAR, and Taiwan), and a map depicting provincial boundaries is displayed in Fig. S2. The emission levels in specific provinces are determined by factors such as resource endowments, industrial structure, energy consumption, and emission control measures. Taking SO2 as an example, the top five provinces are Shanxi, Shandong, Hebei, Guizhou, and Inner Mongolia, collectively accounting for 36 % of the national total SO2 emissions. Guizhou Province, located in the southwest of China, is characterized by high-sulfur coal and a relatively gradual implementation of pollution control measures, which result in elevated SO2 emissions. In the other four provinces, large-scale heavy industries have led to substantial coal consumption and correspondingly higher SO2 emissions. Provinces with a less industry-focused economic structure and lower energy consumption, including Tianjin, Hainan, Qinghai, Beijing, and Tibet, exhibit the lowest SO2 emissions accounting for approximately 2 % of the national total.
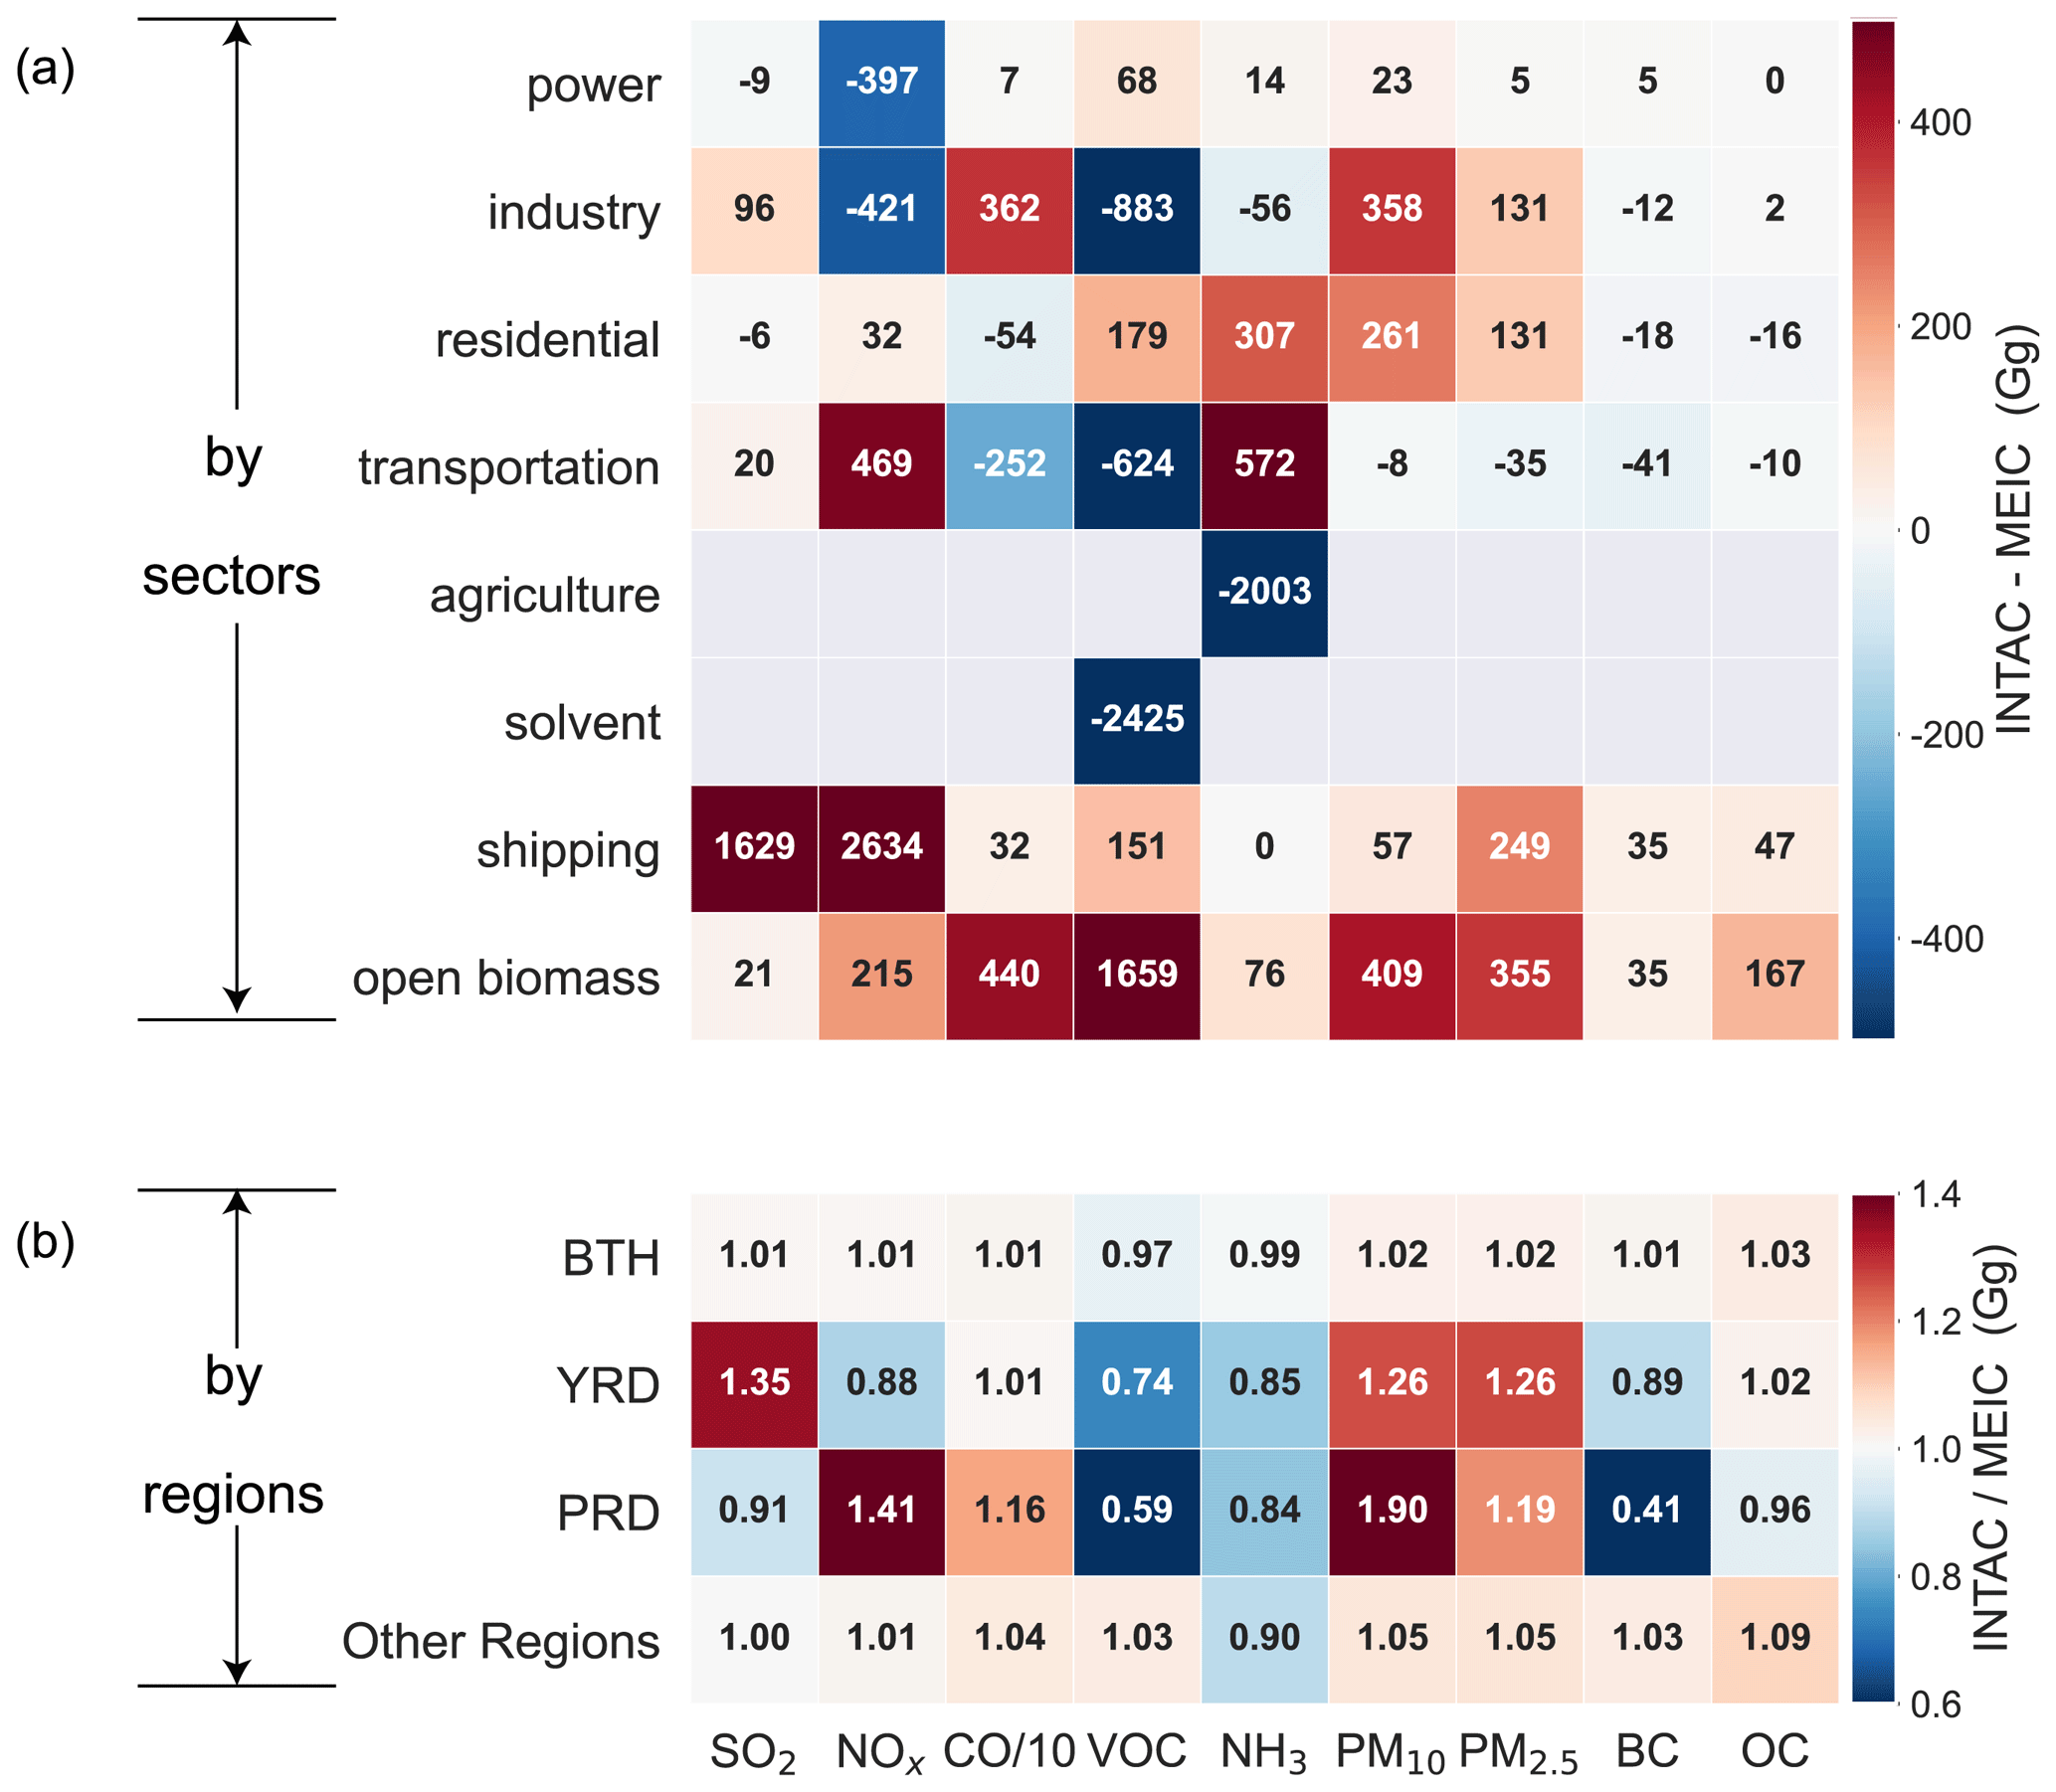
Figure 5Inter-comparisons of emission estimates between INTAC and MEIC. Panel (a) shows the difference by sector, and (b) presents the ratio of emissions in INTAC to those in MEIC.
3.2 Improved accuracy of INTAC for China's anthropogenic emissions
3.2.1 Comparison of emission magnitudes in INTAC with MEIC across sectors and regions
INTAC improves the representation of anthropogenic air pollutant emissions by incorporating a large number of industrial point sources, integrating high-resolution regional inventories, and supplementing missing emission sources in MEIC. Remarkable differences between INTAC and MEIC are illustrated in Fig. 5 across regions and sectors. Compared with MEIC, INTAC shows higher levels of 16.7 %, 11.5 %, 10.8 %, 11.0 %, and 9.1 % for SO2, NOx, PM10, PM2.5, and OC emissions, respectively. However, it indicates lower levels of 6.3 % and 10.6 % for NMVOCs and NH3. CO and BC emissions exhibit good agreement between the two inventories, with differences lower than 3.9 %. In comparison with MEIC, the supplementary emission sources in INTAC – specifically open biomass burning and marine shipping – account for the majority of increased emissions, contributing 95 %, 89 %, and 74 % for SO2, CO, and PM2.5, respectively. Additionally, the incorporation of PKU-NH3 in INTAC leads to a 21 % decrease in NH3 emissions from agricultural sources, while NH3 emissions from residential sources and transportation increase by 99 % and 13.1 times, respectively. Such difference in agricultural sources is mainly caused by the estimates of synthetic fertilizer (Kang et al., 2016), particularly concerning the treatment of fertilizer types and corresponding emission factors.
Many discrepancies between MEIC and INTAC arise from the integration of regional emission inventories. As presented in Fig. 5b, notable disparities are observed in the YRD and PRD regions. Estimates for NOx emissions in the YRD region are approximately 88 % of those derived from the MEIC model. This highlights an enhanced precision attributable to reliable assessments of denitrification efficiency in power plants and the measured NOx emission factors for both power plants and boilers within the integrated YRD inventory, as supported by previous studies (e.g., Zhao et al., 2018). INTAC's estimates for NMVOC emissions in the YRD region are 26 % lower than estimates in MEIC. The overestimation in MEIC mainly results from the uncertainties in solvent use source, particularly coating, printing, and dyeing processes. The integrated YRD emission inventory employs more accurate calculation parameters for NMVOCs such as statistical data from local city yearbooks, industry association reports, and apparent consumption of solvents. Furthermore, the speciation profiles of NMVOCs are localized and corrected based on the literature research and measurements. In the PRD region, the NOx emissions from INTAC are 41 % higher than MEIC estimates, with non-road sources and non-metallic mineral products contributing 45 % and 40 %, respectively, to this difference. The PRD inventory employs a detailed calculation approach for shipping emissions based on AIS data, in contrast to the simplified approach for inland waterway sources in MEIC. The NOx emissions from industrial processes of brick and flat-glass manufacturing are not considered in MEIC, a deficiency which is addressed in the integrated PRD inventory. INTAC's NMVOC emissions are approximately 59 % of those from MEIC. The disparity is particularly notable in industrial and solvent use sources, contributing 49 % and 35 %, respectively, to the observed difference. In INTAC nearly half of the VOC emission factors for industrial solvent sources are based on local measurements, and a preference for raw-material-based calculations over product-based ones reduces uncertainty in the estimation. For significant VOC-emitting sources like cleaning solvents, MEIC employs an emission factor of 1000 g kg−1, whereas the PRD inventory uses 850 g kg−1. In the case of oil refineries, the emission factors are 2.76 g kg−1 for MEIC and 1.82 g kg−1 for the PRD inventory.
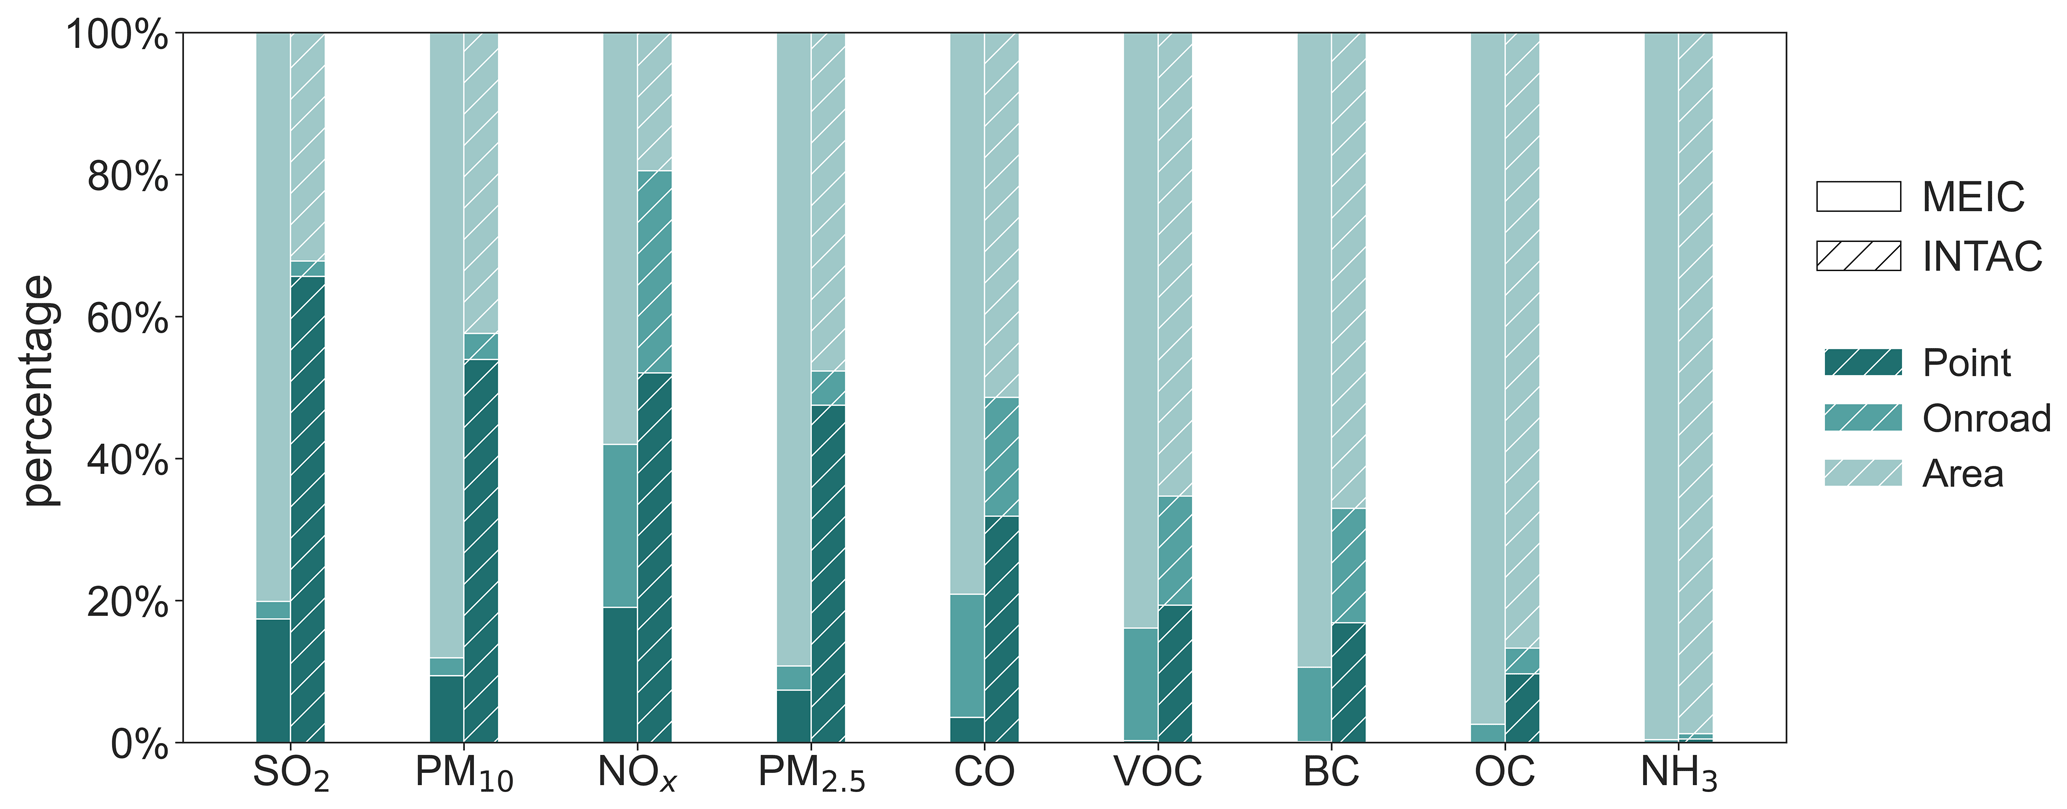
Figure 6Inter-comparisons of the percentage of point, on-road, and area source emissions between INTAC and MEIC.
3.2.2 Impact of point source contributions
The most accurate method for obtaining emissions at finer-scale grids relies on spatial allocation based on precise geographical coordinates. In MEIC the majority of emission sources are represented as area sources and distributed onto grids using spatial proxies, such as urban population, except for power plants. In contrast, the increased proportion of industrial point source emissions in INTAC significantly constrains the uncertainties associated with spatial proxies. Figure 6 shows the inter-comparisons of the percentage of point, on-road, and area source emissions between INTAC and MEIC. Air pollutants, especially those dominated by industrial combustion sources like SO2, NOx, PM10, and PM2.5, exhibit a significantly higher proportion of point source emissions within INTAC compared with MEIC. In MEIC the proportion of point source emissions for SO2, PM10, NOx, and PM2.5 is 17 %, 9 %, 19 %, and 7 %, respectively. However, in INTAC these percentages substantially increase to 66 %, 54 %, 52 %, and 48 %, respectively, indicating a more accurate representation of spatial patterns. For other species with emissions mainly from area sources (e.g., residential and transportation), there are limited improvements in the proportion of point source emissions in INTAC.
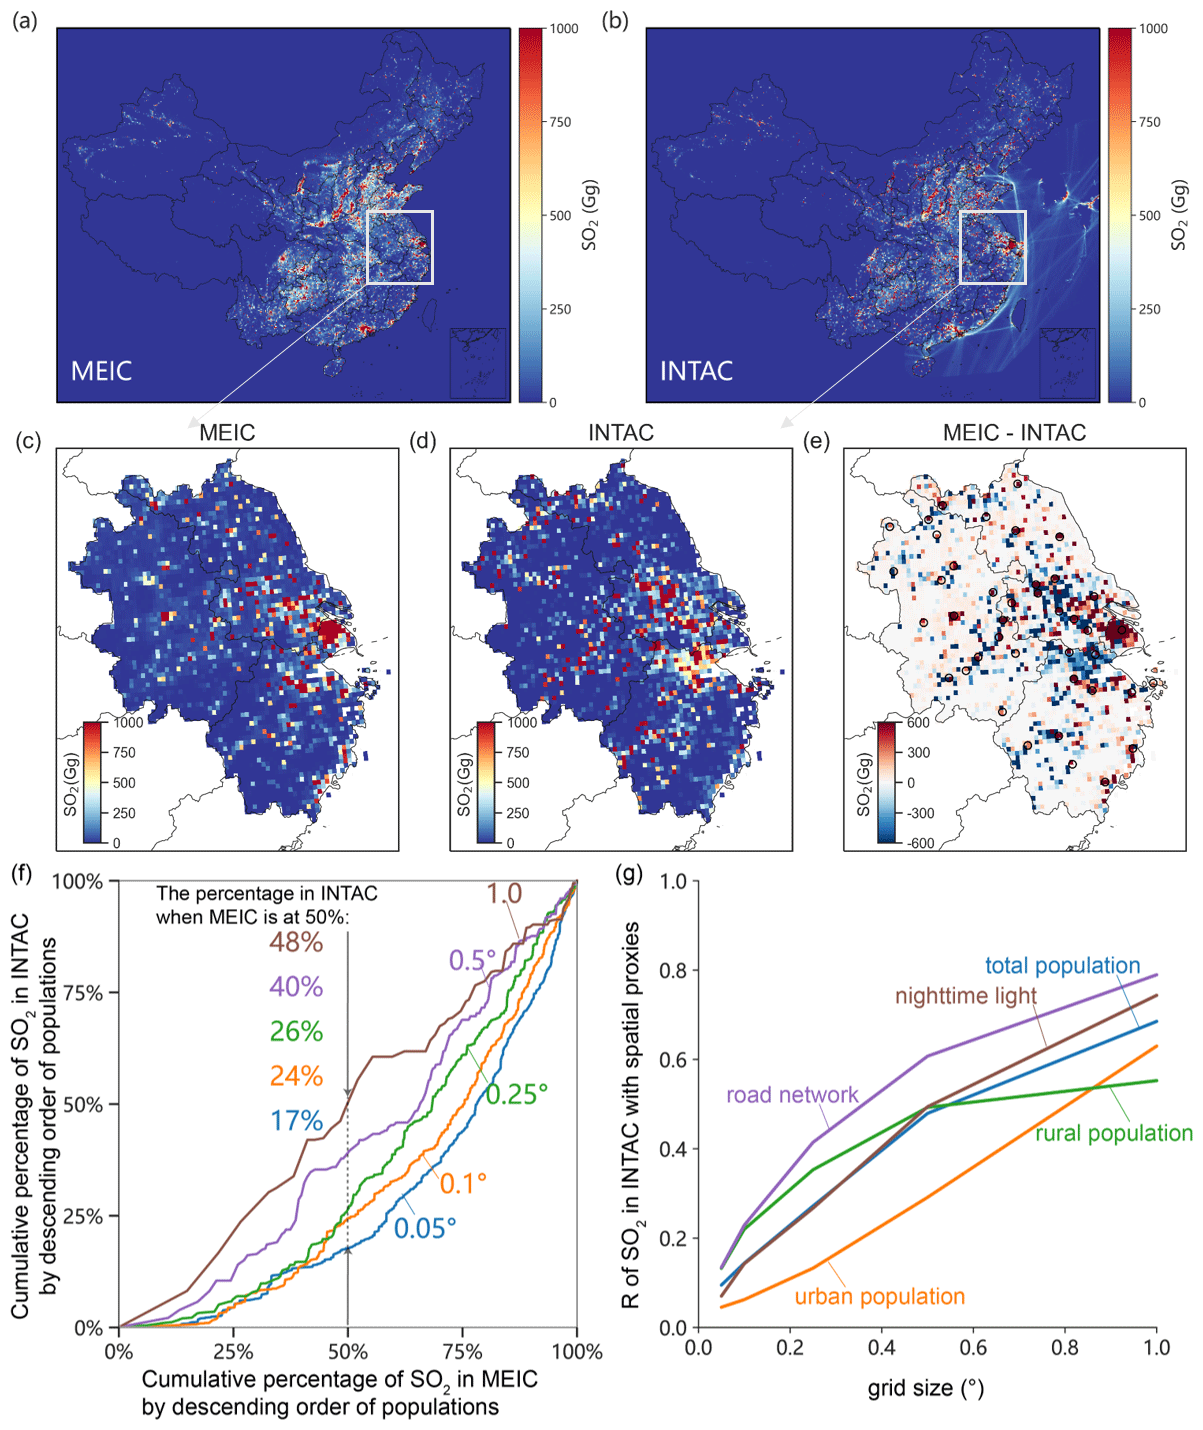
Figure 7Spatial pattern analysis of emissions in INTAC using SO2 emissions as an example. Panels (a) and (b) display the spatial distributions of SO2 emissions in MEIC and INTAC, respectively. MEIC emissions have been downscaled from 0.25 to 0.1° for comparison. To compare MEIC and INTAC in detail, the YRD region is zoomed in on. Panels (c)–(e) show spatial distributions of SO2 emissions in MEIC and INTAC, and also their difference. Circles in (e) represent the center of a city. Panel (f) compares cumulative percentage of SO2 emissions in INTAC with those in MEIC across different spatial resolutions. The gridded SO2 emissions, ranging in resolution from 0.05 to 1.0°, are cumulated in descending order of population. The percentage annotations in different colors indicate the level of accumulated SO2 emissions in INTAC at various spatial resolutions when SO2 emissions in MEIC reach 50 % accumulation. Panel (g) shows correlation coefficient between SO2 emissions in INTAC and multiple spatial proxies at different grid sizes.
To further assess the impact of point sources, Fig. 7 takes SO2 and the YRD region as an example to compare the spatial emission patterns between INTAC and MEIC. Figure 7c–e reveal that MEIC tends to overestimate emissions in urban centers and underestimate emissions in rural areas compared with INTAC. Amid economic growth and rapid urbanization, MEIC's use of urban population as a proxy for spatial allocation becomes impractical as many factories relocate from city centers to rural areas. To elucidate the difference between population-based and point-source-based allocation methods in emission mapping, we present the cumulative percentage of SO2 emissions in MEIC and INTAC based on descending population orders in Fig. 7f. We use the grid groups where densely populated areas contribute 50 % of SO2 emissions in MEIC as an example, and we compare them with the cumulative percentage in INTAC across various grid sizes. The results show that at a resolution of 0.05° INTAC only accounts for 17 % of the emissions, while it reaches 48 % as the grid size increases to 1.0°. This suggests that at a fine grid scale MEIC tends to allocate more emissions to densely populated urban areas, while INTAC allocates a larger proportion to suburban and rural areas, aligning better with the real-world emission spatial patterns. This mitigation of bias through INTAC is especially notable at finer resolutions. The close cumulative percentage at 1.0° in the two inventories can be attributed to the fact that urban and suburban areas often fall within the same grid, leading to a decreasing enhancement in the spatial accuracy achieved by INTAC. Figure 7g further presents the correlation between the spatial patterns of SO2 emissions in INTAC and various spatial proxies. At a resolution of 1.0° the correlation coefficients between emission distributions and factors (i.e., road networks, nighttime lights, total population, urban population, and rural population) fall within the range of 0.55–0.79. Nevertheless, at a resolution of 0.05° the correlation coefficients range from 0.05 to 0.13. This indicates that at higher spatial resolutions INTAC substantially reduces the bias introduced by spatial proxies in MEIC.
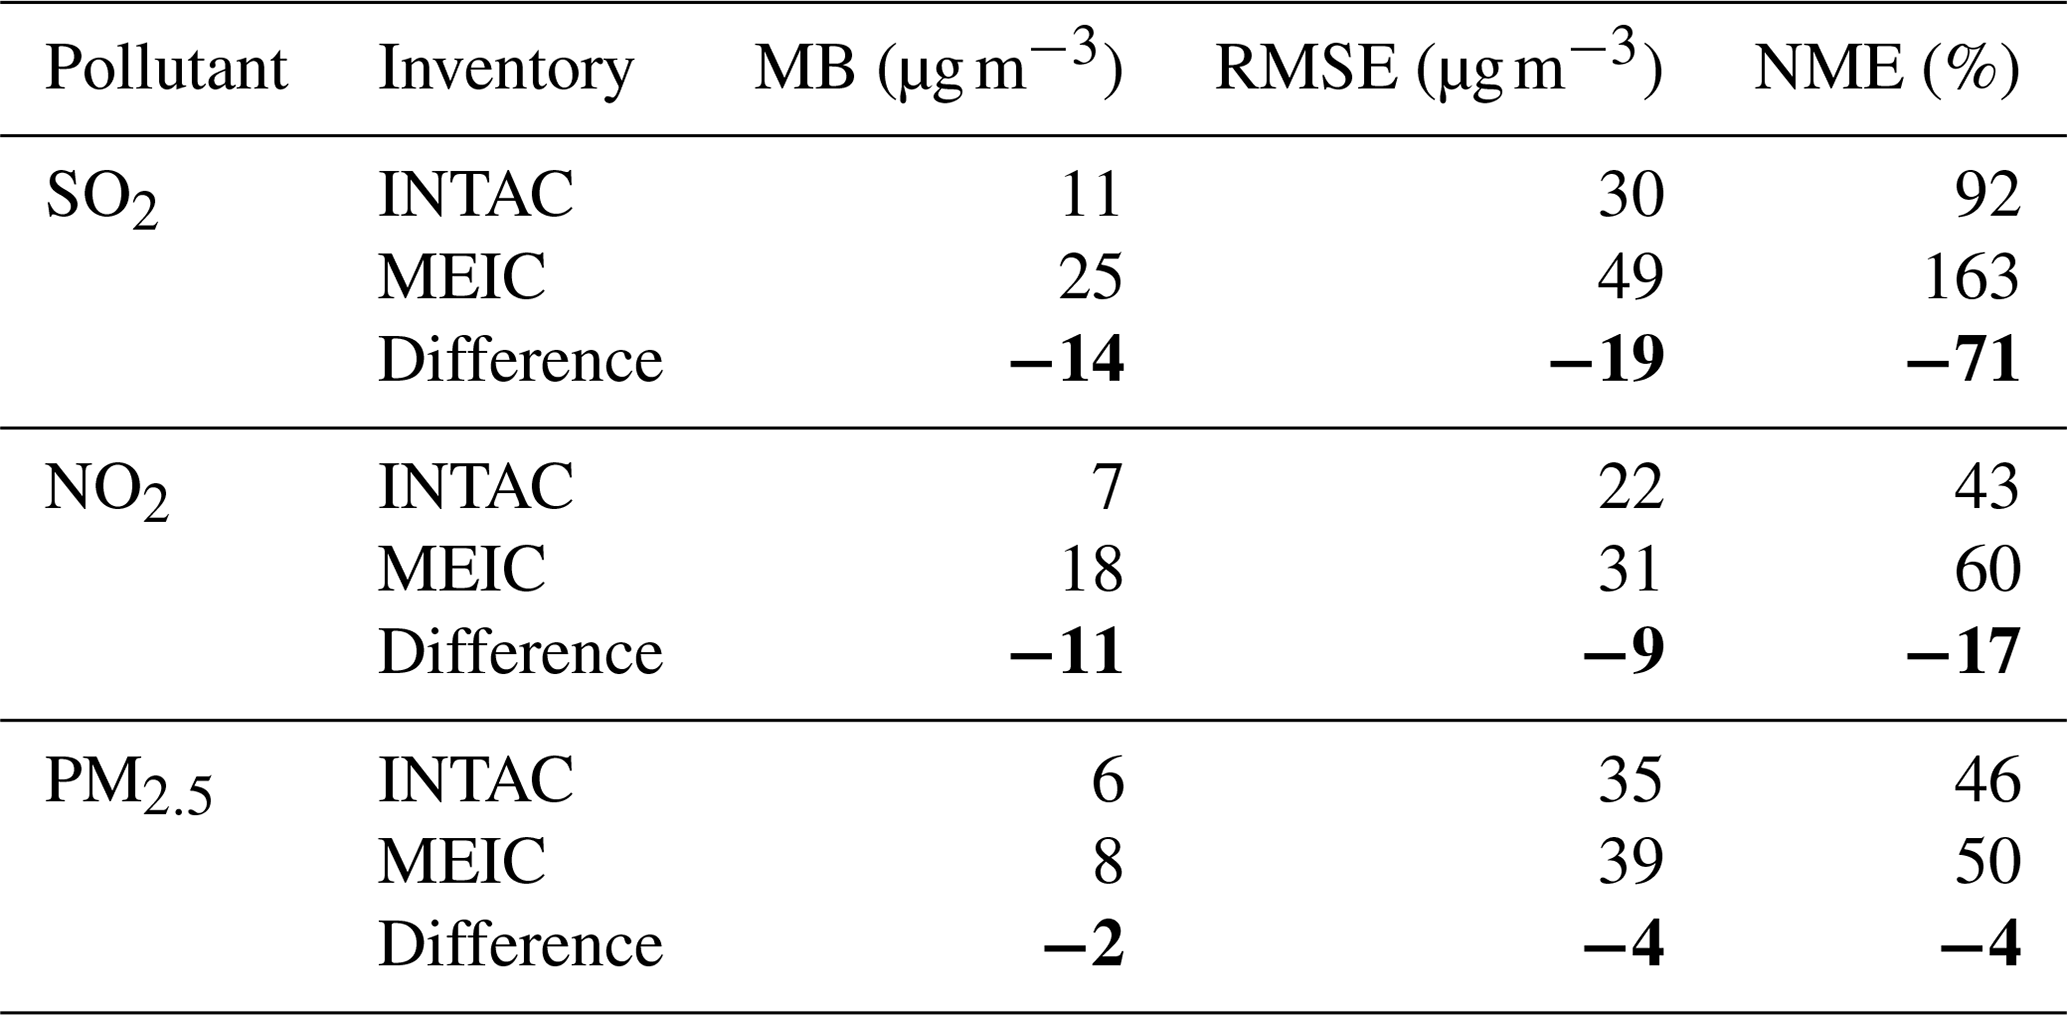
Table 4The discrepancies between simulated SO2, NO2, and PM2.5 concentrations, and observed values for 74 major cities at a resolution of 12 km, using MEIC and INTAC as emission inputs. The statistical metrics used for comparison include R, MB, and RMSE. The bold font represents the difference in modeling performance between INTAC and MEIC.
3.3 Improvements in air-quality modeling by INTAC
3.3.1 Overall performance in key regions
We conducted simulations using the WRF–CMAQ model driven by INTAC and MEIC separately to evaluate the improvements in modeled air pollutant concentrations. Table 4 evaluates the simulated emissions in 74 major cities (locations depicted in Fig. S2) against in situ observations, with corresponding scatterplots shown in Fig. S3. INTAC demonstrates improved agreement between modeled concentrations and ground-level observations, which benefits from the integrated high-resolution inventories. Compared with MEIC, INTAC leads to a decline in the mean bias of simulated major pollutant concentrations by 2–14 µg m−3, a reduction in the root mean square error by 4–19 µg m−3, and a decrease in the normalized mean error by 4 %–71 %. This finding indicates that INTAC produces a more accurate overall characterization of emissions in China. Furthermore, given that atmospheric pollution monitoring stations are mainly located in urban areas in China, the observed differences suggest that INTAC can mitigate the overestimation of major pollutant concentrations in urban centers. As discussed in Sect. 3.2.2, MEIC overestimates emissions in urban areas and underestimates them in rural and suburban areas, consequently introducing uncertainties into air-quality modeling. The improved accuracy in spatial distributions within INTAC significantly contributes to enhancing the overall accuracy of air pollutant modeling.
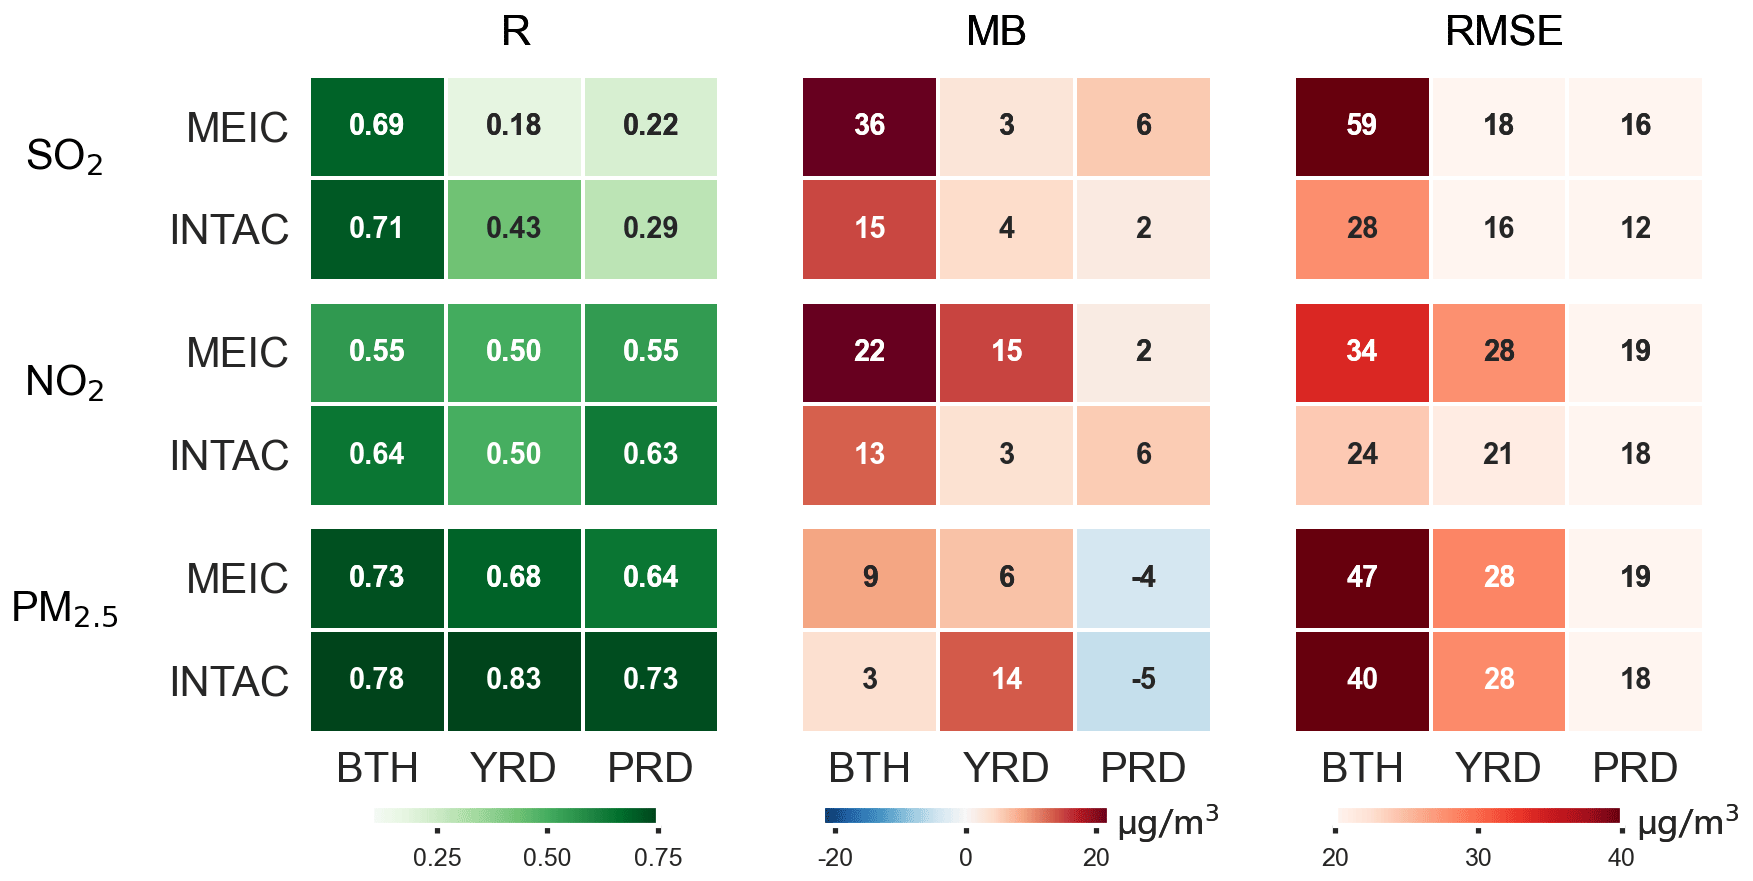
Figure 8Comparison of modeling performance across key regions (i.e., BTH, YRD, and PRD) when using MEIC and INTAC, respectively, as emission inputs. The statistical metrics used for comparison include R, MB, and RMSE. The regions under comparison comprise BTH, YRD, and PRD.
Figure 8 further compares the overall simulation performance between INTAC and MEIC in three key regions (BTH, YRD, and PRD), with corresponding scatterplots shown in Figs. S4–S6. Regarding PM2.5 and its precursors, MEIC shows a considerable mean bias of up to 36 µg m−3 and a root mean square error of up to 59 µg m−3 in key regions. In contrast, INTAC demonstrates maximum MB values of 15 µg m−3 and maximum RMSE values of 40 µg m−3. The correlation coefficients between simulated and observed concentrations of the three air pollutants are generally lower in MEIC compared with those in INTAC. The modeling performance driven by INTAC, particularly for short-lived pollutants, experiences significant improvement due to their strong correlation with spatial distributions of emission sources. Nonetheless, discrepancies between modeled and observed surface concentrations still exist because of uncertainties from meteorological, physical, and chemical processes within chemical transport models. Moreover, emission sources such as residential, transportation, and agriculture are treated in INTAC as non-point sources, and their allocation to grids using spatial proxies can introduce biases in air-quality modeling. It is noteworthy that ammonium () concentrations simulated by INTAC agree better with ground measurements than MEIC (Table S3). While concentrations are influenced by secondary chemical reactions, the improved model performance still reflects the benefits from the integration of PKU-NH3.
3.3.2 Improvements across different spatial resolutions
To provide a more in-depth assessment of improved spatial patterns in INTAC, Fig. 9 categorizes grid cells into different bins based on their urban population and calculates the ratio of simulated pollutant concentrations to ground observations for both INTAC and MEIC in each category. The results demonstrate that as the urban population increases, the enhanced model performance of INTAC over MEIC for SO2, NO2, and PM2.5 becomes more evident. Specifically, when the urban population is less than 50 000, both INTAC and MEIC exhibit a median range of simulated-to-observed concentration ratios close to 1. However, as the urban population exceeds 550 000, the average range for MEIC widens to 1.4–5.2, whereas it remains within the range of 0.9–1.0 for INTAC. This indicates a significant improvement in mitigating the overestimation of emissions in densely populated areas by INTAC. The incorporation of the industrial point source emission inventory for China along with the YRD and PRD emission inventories significantly increases point source shares in INTAC, thus producing better spatial representations for real-world emission distributions and smaller simulated deviations.
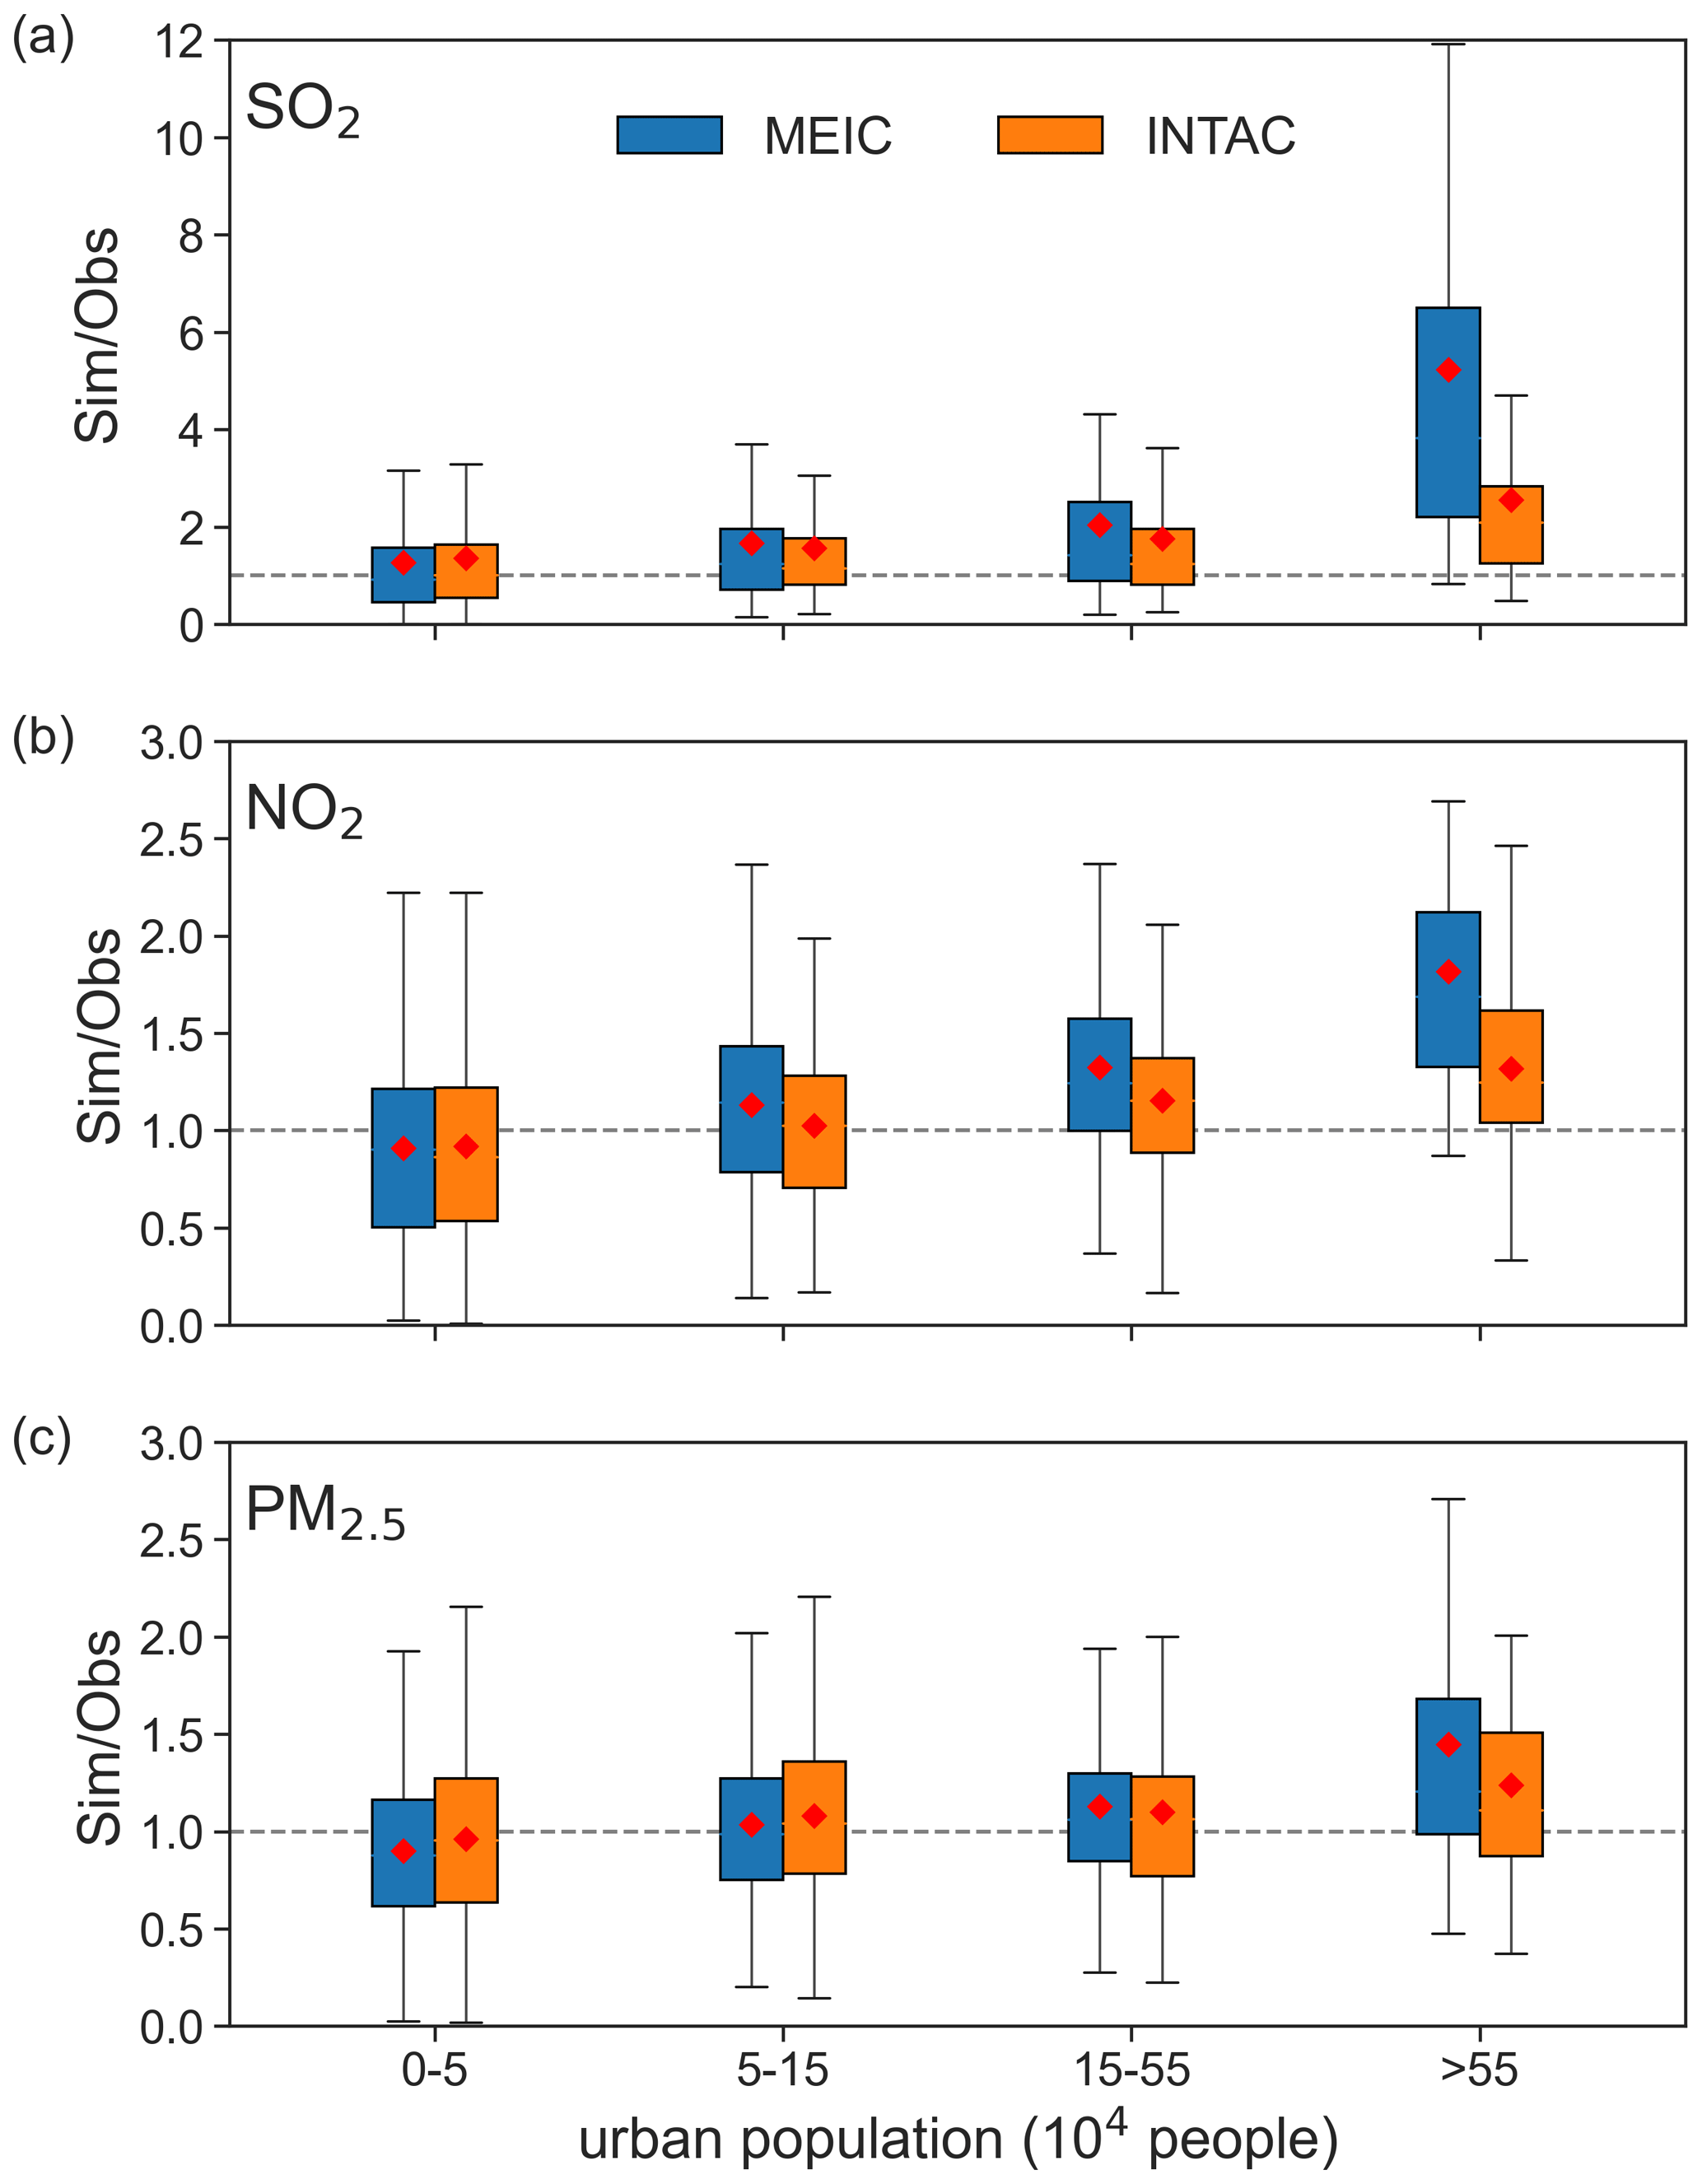
Figure 9Comparisons of modeling performance between INTAC and MEIC in different ranges of urban population. The 12 km grids are categorized to different bins according to the urban population residing within each grid. The ratio of simulated pollutant concentrations (Sim) to observed concentrations (Obs) for major pollutants (SO2, NO2, and PM2.5) are calculated. The boxplot presents the upper quartile, median (red dot), and lower quartile of the ratios.
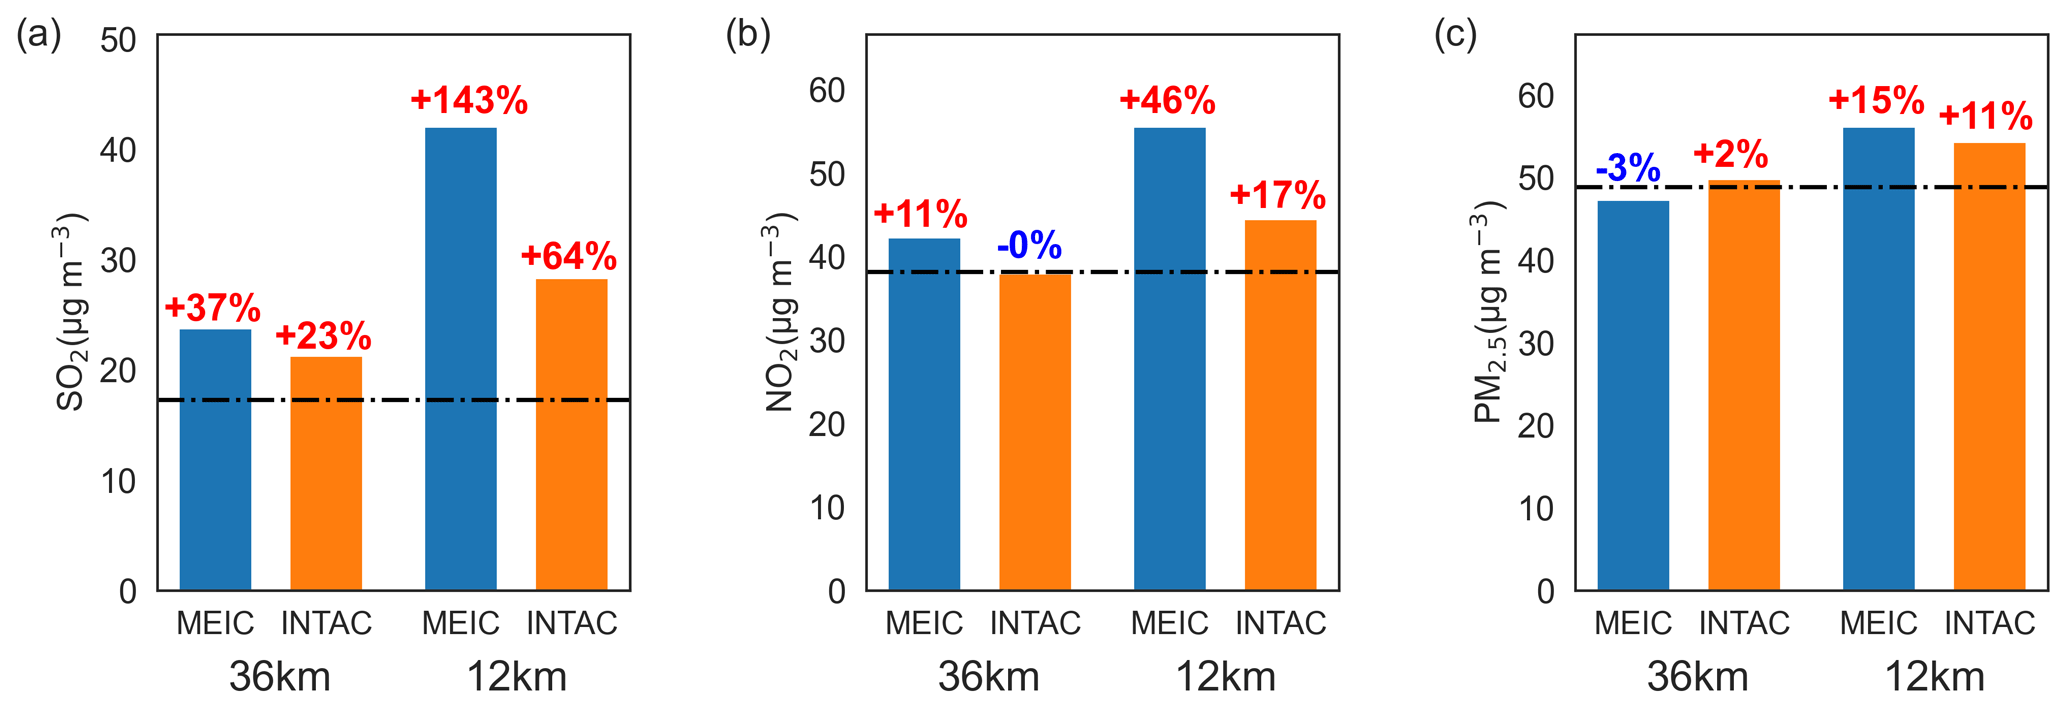
Figure 10Comparison of modeled air pollutant concentrations and ground observations for 74 cities at 36 and 12 km resolutions using MEIC and INTAC, respectively, as emission inputs. The dashed black line represents the observational mean, and the annotations above the bar charts indicate the mean biases between simulated concentrations and the corresponding observed values.
Model performance differences between MEIC and INTAC are influenced by grid size. Figure 10 presents the comparison between modeled SO2, NO2, and PM2.5 concentrations against ground observations for 74 major cities at resolutions of 36 and 12 km. Increasing spatial resolution does not lead to a reduction in simulation errors, especially for MEIC. As the horizontal resolution increases from 36 to 12 km, the mean biases of simulated SO2, NO2, and PM2.5 concentrations using MEIC as input show an increase from 37 % to 143 %, 11 % to 46 %, and −3 % to 15 %, respectively, when compared with in situ observations. In contrast, the simulation results using INTAC as input exhibit better agreement with ground observations, with mean biases for SO2, NO2, and PM2.5 increasing from 23 % to 64 %, −0 % to 17 %, and 2 % to 11 %, respectively. This is due to the fact that the deviations in finer grid cells, whether overestimated or underestimated, tend to cancel out at a coarse spatial resolution. The decoupling between emission spatial distributions with proxies at finer grids leads to more noticeable biases in air-quality modeling. Therefore, the findings suggest that the INTAC developed in this study can effectively constrain uncertainties in emissions and the modeling bias, especially at fine spatial scales. The improvement will help tackle emerging challenges in high-resolution air-quality modeling in China.
Table 5Uncertainties in the inventory components of INTAC (in %) contingent upon the availability of such information.
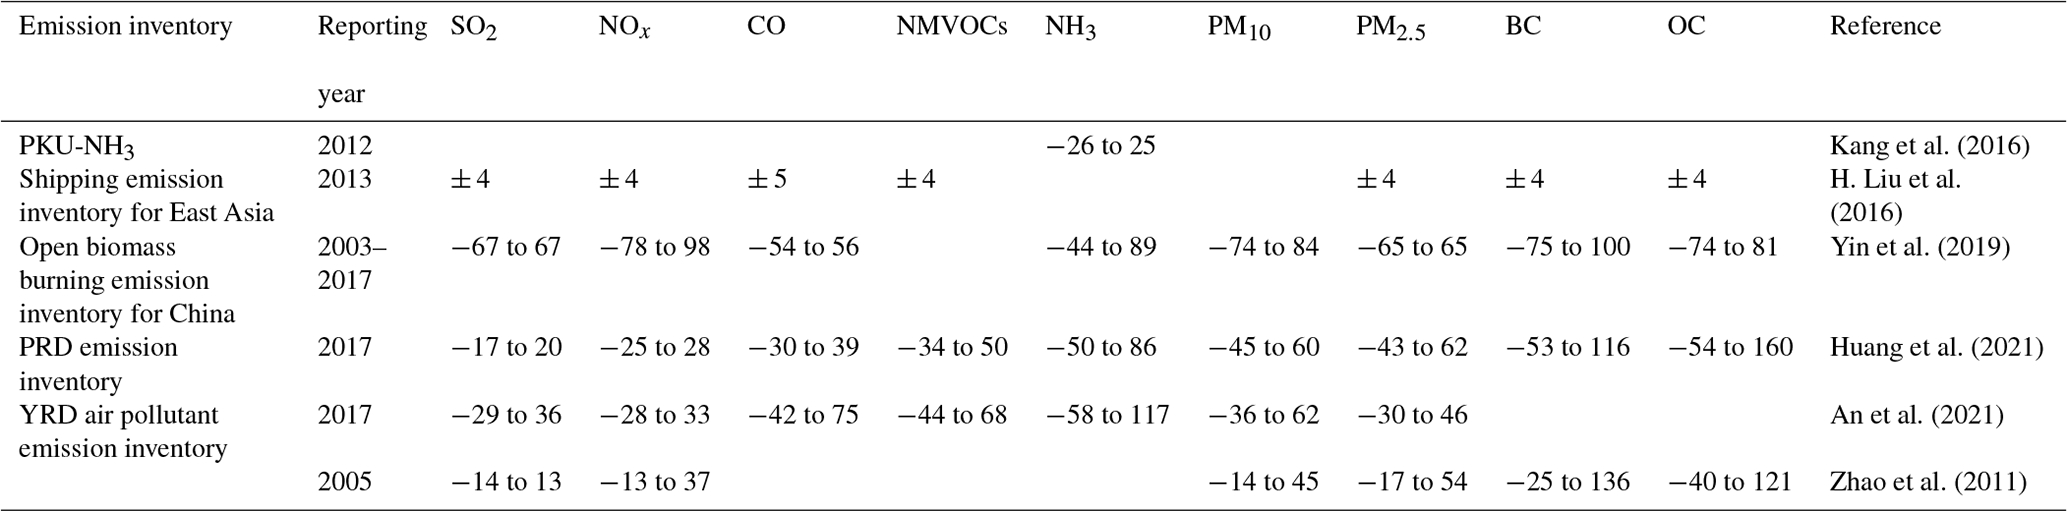
Both qualitative and quantitative uncertainty assessments are essential components of a comprehensive inventory for policy or scientific purposes. Approaches such as error propagation and Monte Carlo simulation are commonly used for quantitative uncertainty analysis in China's emission inventory (Lu et al., 2011; Streets et al., 2003; Zhao et al., 2011, 2017b). However, this study uses an integrated method, rather than a unified framework, to compile the high-resolution emission inventory for China. Collecting only emission quantities from the seven inventories without detailed calculation parameters makes it challenging to assess the overall uncertainties in INTAC here. We have summarized the estimated uncertainty range for components of INTAC in Table 5, where such information is available. Although the uncertainties might be reported for a year other than 2017, they still provide a rough representation of the uncertainty range in major air pollutant emission estimates within INTAC. Species such as SO2 and NOx exhibit relatively low uncertainties, benefiting from well-established estimates for large-scale combustion sources. The considerable uncertainties observed in BC and OC emissions may be attributed to inaccuracies in the emission factors of the residential sector. Further details regarding the uncertainties in each component inventory can be found in corresponding literature (An et al., 2021; Huang et al., 2021; Kang et al., 2016; H. Liu et al., 2016; Yin et al., 2019; Zhao et al., 2011).
The uncertainties in INTAC also arise from the integration process:
-
The emission sectors in all inventories need to be mapped to the 88 standard sectors first. Due to limited foundational information for an aggregated sector's disaggregation, this process may introduce biases for those who initially provide coarser source categories. For example, if an inventory only offers one aggregated sector for power, which needs to be broken down into four subsectors (i.e., production of power, supply of power, production of industrial heat power, and production of residential heat power), we use the energy consumption for corresponding sectors from the statistical yearbook as a reference basis for this allocation, which is a relatively reliable method despite potential deviations.
-
To generate speciated VOC species, sectoral NMVOC emissions in each inventory need to be matched to corresponding source profiles from the MEIC model. Discrepancies in emission source mapping can impact the outcomes, which will be overcome by gathering more detailed sectoral information for each inventory or directly collecting speciated species in future studies.
-
INTAC is made publicly available at a monthly scale, given that the majority of its components are gathered on a monthly or annual scale. The temporal disaggregation to finer resolutions for modeling is achieved using empirically selected weighting factors in the MEIC model. However, it is noteworthy that the parameters employed for allocating emissions to daily or hourly scales remain fixed and do not vary over time or region, introducing additional uncertainties. In the future, we plan to incorporate more advanced data or methods (e.g., real-time emission measurements) to enhance temporal accuracy at finer scales, as indicated in the previous work for the power sector (Wu et al., 2022).
-
The border issue is inevitable when emissions for the same species in two adjacent cities are derived from different inventories. Typical examples are the cities located at the boundaries of the YRD and PRD regions. In INTAC we downscale all emissions to 1 km before the spatial–temporal coupling process, thereby mitigating this uncertainty to some extent.
INTAC for 2017 is subject to some limitations: (1) In the integrated method, emission data for the same city and species across different sectors may come from different datasets. Similarly, emission data for different species within the same city and sector may also originate from different datasets. The utilization of species ratios requires careful consideration in these cases. (2) Limited resources present a substantial challenge in gathering emission inventories over extended time series from diverse research institutions within the scope of this study. Consequently, we exclusively present INTAC for 2017, with the possibility of extension to other years in subsequent research.
Data described in this paper can be accessed via Zenodo at https://doi.org/10.5281/zenodo.10459198 (Wu et al., 2024) and http://meicmodel.org.cn/intac (last access: 15 April 2024).
Compiling a comprehensive bottom-up emission inventory for China that achieves both extensive coverage and high resolution poses a significant challenge. In this work, we construct a 0.1° resolution integrated inventory for 2017 through the fusion of multi-source emission inventories. An integration model has been developed to effectively couple heterogeneous emission datasets, aimed at generating a standardized data cube with consistent sectors, species, and spatial–temporal resolution. INTAC is created through source mapping, species mapping, temporal disaggregation, spatial allocation, and spatial–temporal coupling. Six representative emission inventories focusing on national and regional scales, as well as key species and sources in China, are merged with MEIC. This integration harnesses the strengths of each inventory, resulting in an improved depiction of emission totals and spatial distribution patterns for China.
We find that the total emissions of SO2, NOx, CO, NMVOCs, NH3, PM10, PM2.5, BC, and OC in INTAC for 2017 are 12.3, 24.5, 141.0, 27.9, 9.2, 11.1, 8.4, 1.3, and 2.2 Tg, respectively. Industrial production serves as the main source of various atmospheric pollutants. Residential sources contribute over 40 % to CO, BC, and OC emissions. Apart from agricultural sources, which account for 83 % of NH3 emissions, the contributions from various minor emission sources cannot be overlooked. This study emphasizes the significance of shipping emissions, particularly in contributing to SO2 (13 %) and NOx (13 %). Fossil fuel combustion dominates the emissions of PM10, PM2.5, CO, BC, SO2, and NOx, ranging from 38 % to 80 %. The enhancement in emission estimates for China in INTAC is demonstrated by the comparison with MEIC. For instance, the incorporation of numerous point sources has notably addressed MEIC's tendency to overestimate emissions in urban centers, particularly at higher spatial resolutions. In comparison with MEIC, INTAC exhibits a mean bias reduction in simulated concentrations of major pollutants against ground observations across 74 cities, ranging from 2 to 14 µg m−3. The improvement in model performance achieved by INTAC is particularly noticeable at finer spatial resolutions.
Our study offers an efficient framework for creating a highly resolved emission inventory on a large scale. This approach integrates advantages from previous studies and holds the potential to support policymakers in making well-informed decisions for improving air quality. In the future, we anticipate the ongoing incorporation of additional emission datasets to offer a more reliable representation of emissions in China over extended time periods.
The supplement related to this article has six figures and three tables. The supplement related to this article is available online at: https://doi.org/10.5194/essd-16-2893-2024-supplement.
NW, GG, and QZ designed the study. NW developed the INTAC, conducted chemical transport modeling, and analyzed the emissions. JZ, YS, HL, YuZ, YiZ, and QS provided the emission inventories for the integration. RX helped with the data analysis. SL compiled the chemical transport model. XL contributed to the design of computer programs for the integration model. The manuscript was written by NW and GG, and it was revised and discussed by all coauthors.
The contact author has declared that none of the authors has any competing interests.
Publisher's note: Copernicus Publications remains neutral with regard to jurisdictional claims made in the text, published maps, institutional affiliations, or any other geographical representation in this paper. While Copernicus Publications makes every effort to include appropriate place names, the final responsibility lies with the authors. Regarding the maps used in this paper, please note that Figs. 1, 4, and 7 contain disputed territories.
We thank Zhijiong Huang, Junchi Wang, Mingxu Liu, Wenling Liao, and Chen Gu for their contributions to the handling and transfer of the emission inventories for the integration.
This research has been supported by the National Natural Science Foundation of China (grant no. 92044303), the National Key R&D Program of China (grant no. 2022YFC3700605), and the Major Project of High Resolution Earth Observation System (grant no. 30-Y60B01-9003-22/23).
This paper was edited by Yuqiang Zhang and reviewed by two anonymous referees.
An, J., Huang, Y., Huang, C., Wang, X., Yan, R., Wang, Q., Wang, H., Jing, S., Zhang, Y., Liu, Y., Chen, Y., Xu, C., Qiao, L., Zhou, M., Zhu, S., Hu, Q., Lu, J., and Chen, C.: Emission inventory of air pollutants and chemical speciation for specific anthropogenic sources based on local measurements in the Yangtze River Delta region, China, Atmos. Chem. Phys., 21, 2003–2025, https://doi.org/10.5194/acp-21-2003-2021, 2021.
Bo, X., Jia, M., Xue, X., Tang, L., Mi, Z., Wang, S., Cui, W., Chang, X., Ruan, J., Dong, G., Zhou, B., and Davis, S. J.: Effect of strengthened standards on Chinese ironmaking and steelmaking emissions, Nat. Sustain., 4, 811–820, https://doi.org/10.1038/s41893-021-00736-0, 2021.
Chen, H., Huang, Y., Shen, H., Chen, Y., Ru, M., Chen, Y., Lin, N., Su, S., Zhuo, S., Zhong, Q., Wang, X., Liu, J., Li, B., and Tao, S.: Modeling temporal variations in global residential energy consumption and pollutant emissions, Appl. Energ., 184, 820–829, https://doi.org/10.1016/j.apenergy.2015.10.185, 2016.
Cheng, J., Su, J., Cui, T., Li, X., Dong, X., Sun, F., Yang, Y., Tong, D., Zheng, Y., Li, Y., Li, J., Zhang, Q., and He, K.: Dominant role of emission reduction in PM2.5 air quality improvement in Beijing during 2013–2017: a model-based decomposition analysis, Atmos. Chem. Phys., 19, 6125–6146, https://doi.org/10.5194/acp-19-6125-2019, 2019.
Cheng, J., Tong, D., Liu, Y., Bo, Y., Zheng, B., Geng, G., He, K., and Zhang, Q.: Air quality and health benefits of China's current and upcoming clean air policies, Faraday Discuss., 226, 584–606, https://doi.org/10.1039/D0FD00090F, 2021a.
Cheng, J., Tong, D., Liu, Y., Yu, S., Yan, L., Zheng, B., Geng, G., He, K., and Zhang, Q.: Comparison of Current and Future PM2.5 Air Quality in China Under CMIP6 and DPEC Emission Scenarios, Geophys. Res. Lett., 48, e2021GL093197, https://doi.org/10.1029/2021GL093197, 2021b.
Cheng, Z., Wang, S., Fu, X., Watson, J. G., Jiang, J., Fu, Q., Chen, C., Xu, B., Yu, J., Chow, J. C., and Hao, J.: Impact of biomass burning on haze pollution in the Yangtze River delta, China: a case study in summer 2011, Atmos. Chem. Phys., 14, 4573–4585, https://doi.org/10.5194/acp-14-4573-2014, 2014.
Chou, M.-D., Suarez, M. J., Ho, C.-H., Yan, M. M. H., and Lee, K.-T.: Parameterizations for Cloud Overlapping and Shortwave Single-Scattering Properties for Use in General Circulation and Cloud Ensemble Models, J. Climate, 11, 202–214, https://doi.org/10.1175/1520-0442(1998)011<0202:PFCOAS>2.0.CO;2, 1998.
Crippa, M., Guizzardi, D., Butler, T., Keating, T., Wu, R., Kaminski, J., Kuenen, J., Kurokawa, J., Chatani, S., Morikawa, T., Pouliot, G., Racine, J., Moran, M. D., Klimont, Z., Manseau, P. M., Mashayekhi, R., Henderson, B. H., Smith, S. J., Suchyta, H., Muntean, M., Solazzo, E., Banja, M., Schaaf, E., Pagani, F., Woo, J.-H., Kim, J., Monforti-Ferrario, F., Pisoni, E., Zhang, J., Niemi, D., Sassi, M., Ansari, T., and Foley, K.: The HTAP_v3 emission mosaic: merging regional and global monthly emissions (2000–2018) to support air quality modelling and policies, Earth Syst. Sci. Data, 15, 2667–2694, https://doi.org/10.5194/essd-15-2667-2023, 2023.
Deng, F., Lv, Z., Qi, L., Wang, X., Shi, M., and Liu, H.: A big data approach to improving the vehicle emission inventory in China, Nat. Commun., 11, 2801, https://doi.org/10.1038/s41467-020-16579-w, 2020.
Endresen, Ø., Sørgård, E., Behrens, H. L., Brett, P. O., and Isaksen, I. S. A.: A historical reconstruction of ships' fuel consumption and emissions, J. Geophys. Res.-Atmos., 112, D12301, https://doi.org/10.1029/2006JD007630, 2007.
Geng, G., Zhang, Q., Martin, R. V., Lin, J., Huo, H., Zheng, B., Wang, S., and He, K.: Impact of spatial proxies on the representation of bottom-up emission inventories: A satellite-based analysis, Atmos. Chem. Phys., 17, 4131–4145, https://doi.org/10.5194/acp-17-4131-2017, 2017.
Geng, G., Zheng, Y., Zhang, Q., Xue, T., Zhao, H., Tong, D., Zheng, B., Li, M., Liu, F., Hong, C., He, K., and Davis, S. J.: Drivers of PM2.5 air pollution deaths in China 2002–2017, Nat. Geosci., 14, 645–650, https://doi.org/10.1038/s41561-021-00792-3, 2021.
Gu, C., Zhang, L., Xu, Z., Xia, S., Wang, Y., Li, L., Wang, Z., Zhao, Q., Wang, H., and Zhao, Y.: High-resolution regional emission inventory contributes to the evaluation of policy effectiveness: a case study in Jiangsu Province, China, Atmos. Chem. Phys., 23, 4247–4269, https://doi.org/10.5194/acp-23-4247-2023, 2023.
Hong, S. Y. and Lim, J.-O. J.: The WRF Single-Moment 6-Class Microphysics Scheme (WSM6), Asia-Pac. J. Atmos. Sci., 42, 129–151, 2006.
Huang, C., Hu, Q., Wang, H., Qiao, L., Jing, S. a., Wang, H., Zhou, M., Zhu, S., Ma, Y., Lou, S., Li, L., Tao, S., Li, Y., and Lou, D.: Emission factors of particulate and gaseous compounds from a large cargo vessel operated under real-world conditions, Environ. Pollut., 242, 667–674, https://doi.org/10.1016/j.envpol.2018.07.036, 2018.
Huang, X., Li, M., Li, J., and Song, Y.: A high-resolution emission inventory of crop burning in fields in China based on MODIS Thermal Anomalies/Fire products, Atmos. Environ., 50, 9–15, https://doi.org/10.1016/j.atmosenv.2012.01.017, 2012a.
Huang, X., Song, Y., Li, M., Li, J., Huo, Q., Cai, X., Zhu, T., Hu, M., and Zhang, H.: A high-resolution ammonia emission inventory in China, Global Biogeochem. Cy., 26, GB1030, https://doi.org/10.1029/2011GB004161, 2012b.
Huang, Z., Zhong, Z., Sha, Q., Xu, Y., Zhang, Z., Wu, L., Wang, Y., Zhang, L., Cui, X., Tang, M., Shi, B., Zheng, C., Li, Z., Hu, M., Bi, L., Zheng, J., and Yan, M.: An updated model-ready emission inventory for Guangdong Province by incorporating big data and mapping onto multiple chemical mechanisms, Sci. Total Environ., 769, 144535, https://doi.org/10.1016/j.scitotenv.2020.144535, 2021.
Janssens-Maenhout, G., Crippa, M., Guizzardi, D., Dentener, F., Muntean, M., Pouliot, G., Keating, T., Zhang, Q., Kurokawa, J., Wankmüller, R., Denier van der Gon, H., Kuenen, J. J. P., Klimont, Z., Frost, G., Darras, S., Koffi, B., and Li, M.: HTAP_v2.2: a mosaic of regional and global emission grid maps for 2008 and 2010 to study hemispheric transport of air pollution, Atmos. Chem. Phys., 15, 11411–11432, https://doi.org/10.5194/acp-15-11411-2015, 2015.
Kain, J. S.: The Kain–Fritsch Convective Parameterization: An Update, J. Appl. Meteorol., 43, 170–181, https://doi.org/10.1175/1520-0450(2004)043<0170:TKCPAU>2.0.CO;2, 2004.
Kang, Y., Liu, M., Song, Y., Huang, X., Yao, H., Cai, X., Zhang, H., Kang, L., Liu, X., Yan, X., He, H., Zhang, Q., Shao, M., and Zhu, T.: High-resolution ammonia emissions inventories in China from 1980 to 2012, Atmos. Chem. Phys., 16, 2043–2058, https://doi.org/10.5194/acp-16-2043-2016, 2016.
Kurokawa, J., Ohara, T., Morikawa, T., Hanayama, S., Janssens-Maenhout, G., Fukui, T., Kawashima, K., and Akimoto, H.: Emissions of air pollutants and greenhouse gases over Asian regions during 2000–2008: Regional Emission inventory in ASia (REAS) version 2, Atmos. Chem. Phys., 13, 11019–11058, https://doi.org/10.5194/acp-13-11019-2013, 2013.
Li, B., Chen, L., Shen, W., Jin, J., Wang, T., Wang, P., Yang, Y., and Liao, H.: Improved gridded ammonia emission inventory in China, Atmos. Chem. Phys., 21, 15883–15900, https://doi.org/10.5194/acp-21-15883-2021, 2021.
Li, M., Zhang, Q., Streets, D. G., He, K. B., Cheng, Y. F., Emmons, L. K., Huo, H., Kang, S. C., Lu, Z., Shao, M., Su, H., Yu, X., and Zhang, Y.: Mapping Asian anthropogenic emissions of non-methane volatile organic compounds to multiple chemical mechanisms, Atmos. Chem. Phys., 14, 5617–5638, https://doi.org/10.5194/acp-14-5617-2014, 2014.
Li, M., Liu, H., Geng, G., Hong, C., Liu, F., Song, Y., Tong, D., Zheng, B., Cui, H., Man, H., Zhang, Q., and He, K.: Anthropogenic emission inventories in China: a review, Natl. Sci. Rev., 4, 834–866, https://doi.org/10.1093/nsr/nwx150, 2017a.
Li, M., Zhang, Q., Kurokawa, J.-I., Woo, J.-H., He, K., Lu, Z., Ohara, T., Song, Y., Streets, D. G., Carmichael, G. R., Cheng, Y., Hong, C., Huo, H., Jiang, X., Kang, S., Liu, F., Su, H., and Zheng, B.: MIX: a mosaic Asian anthropogenic emission inventory under the international collaboration framework of the MICS-Asia and HTAP, Atmos. Chem. Phys., 17, 935–963, https://doi.org/10.5194/acp-17-935-2017, 2017b.
Li, M., Kurokawa, J., Zhang, Q., Woo, J.-H., Morikawa, T., Chatani, S., Lu, Z., Song, Y., Geng, G., Hu, H., Kim, J., Cooper, O. R., and McDonald, B. C.: MIXv2: a long-term mosaic emission inventory for Asia (2010–2017), Atmos. Chem. Phys., 24, 3925–3952, https://doi.org/10.5194/acp-24-3925-2024, 2024.
Li, S., Wang, S., Wu, Q., Zhang, Y., Ouyang, D., Zheng, H., Han, L., Qiu, X., Wen, Y., Liu, M., Jiang, Y., Yin, D., Liu, K., Zhao, B., Zhang, S., Wu, Y., and Hao, J.: Emission trends of air pollutants and CO2 in China from 2005 to 2021, Earth Syst. Sci. Data, 15, 2279–2294, https://doi.org/10.5194/essd-15-2279-2023, 2023.
Liu, F., Zhang, Q., Tong, D., Zheng, B., Li, M., Huo, H., and He, K. B.: High-resolution inventory of technologies, activities, and emissions of coal-fired power plants in China from 1990 to 2010, Atmos. Chem. Phys., 15, 13299–13317, https://doi.org/10.5194/acp-15-13299-2015, 2015.
Liu, F., Beirle, S., Zhang, Q., Dörner, S., He, K., and Wagner, T.: NOx lifetimes and emissions of cities and power plants in polluted background estimated by satellite observations, Atmos. Chem. Phys., 16, 5283–5298, https://doi.org/10.5194/acp-16-5283-2016, 2016.
Liu, H., Fu, M., Jin, X., Shang, Y., Shindell, D., Faluvegi, G., Shindell, C., and He, K.: Health and climate impacts of ocean-going vessels in East Asia, Nat. Clim. Change, 6, 1037–1041, https://doi.org/10.1038/nclimate3083, 2016.
Liu, H., Wu, B., Liu, S., Shao, P., Liu, X., Zhu, C., Wang, Y., Wu, Y., Xue, Y., Gao, J., Hao, Y., and Tian, H.: A regional high-resolution emission inventory of primary air pollutants in 2012 for Beijing and the surrounding five provinces of North China, Atmos. Environ., 181, 20–33, https://doi.org/10.1016/j.atmosenv.2018.03.013, 2018.
Liu, H., Meng, Z.-H., Lv, Z.-F., Wang, X.-T., Deng, F.-Y., Liu, Y., Zhang, Y.-N., Shi, M.-S., Zhang, Q., and He, K.-B.: Emissions and health impacts from global shipping embodied in US–China bilateral trade, Nat. Sustain., 2, 1027–1033, https://doi.org/10.1038/s41893-019-0414-z, 2019.
Liu, J., Zheng, Y., Geng, G., Hong, C., Li, M., Li, X., Liu, F., Tong, D., Wu, R., Zheng, B., He, K., and Zhang, Q.: Decadal changes in anthropogenic source contribution of PM2.5 pollution and related health impacts in China, 1990–2015, Atmos. Chem. Phys., 20, 7783–7799, https://doi.org/10.5194/acp-20-7783-2020, 2020.
Liu, M., Song, Y., Yao, H., Kang, Y., Li, M., Huang, X., and Hu, M.: Estimating emissions from agricultural fires in the North China Plain based on MODIS fire radiative power, Atmos. Environ., 112, 326–334, https://doi.org/10.1016/j.atmosenv.2015.04.058, 2015.
Lu, Z., Zhang, Q., and Streets, D. G.: Sulfur dioxide and primary carbonaceous aerosol emissions in China and India, 1996–2010, Atmos. Chem. Phys., 11, 9839–9864, https://doi.org/10.5194/acp-11-9839-2011, 2011.
Lv, Z., Liu, H., Ying, Q., Fu, M., Meng, Z., Wang, Y., Wei, W., Gong, H., and He, K.: Impacts of shipping emissions on PM2.5 pollution in China, Atmos. Chem. Phys., 18, 15811–15824, https://doi.org/10.5194/acp-18-15811-2018, 2018.
Mlawer, E. J., Taubman, S. J., Brown, P. D., Iacono, M. J., and Clough, S. A.: Radiative transfer for inhomogeneous atmospheres: RRTM, a validated correlated-k model for the longwave, J. Geophys. Res.-Atmos., 102, 16663–16682, https://doi.org/10.1029/97JD00237, 1997.
Ni, H., Han, Y., Cao, J., Chen, L. W. A., Tian, J., Wang, X., Chow, J. C., Watson, J. G., Wang, Q., Wang, P., Li, H., and Huang, R.-J.: Emission characteristics of carbonaceous particles and trace gases from open burning of crop residues in China, Atmos. Environ., 123, 399–406, https://doi.org/10.1016/j.atmosenv.2015.05.007, 2015.
Ohara, T., Akimoto, H., Kurokawa, J., Horii, N., Yamaji, K., Yan, X., and Hayasaka, T.: An Asian emission inventory of anthropogenic emission sources for the period 1980–2020, Atmos. Chem. Phys., 7, 4419–4444, https://doi.org/10.5194/acp-7-4419-2007, 2007.
Paulot, F., Jacob, D. J., Pinder, R. W., Bash, J. O., Travis, K., and Henze, D. K.: Ammonia emissions in the United States, European Union, and China derived by high-resolution inversion of ammonium wet deposition data: Interpretation with a new agricultural emissions inventory (MASAGE_NH3), J. Geophys. Res.-Atmos., 119, 4343–4364, https://doi.org/10.1002/2013JD021130, 2014.
Peng, L., Zhang, Q., Yao, Z., Mauzerall, D. L., Kang, S., Du, Z., Zheng, Y., Xue, T., and He, K.: Underreported coal in statistics: A survey-based solid fuel consumption and emission inventory for the rural residential sector in China, Appl. Energ., 235, 1169–1182, https://doi.org/10.1016/j.apenergy.2018.11.043, 2019.
Pleim, J. E.: A Combined Local and Nonlocal Closure Model for the Atmospheric Boundary Layer. Part I: Model Description and Testing, J. Appl. Meteorol. Clim., 46, 1383–1395, https://doi.org/10.1175/JAM2539.1, 2007.
Reisen, F., Meyer, C. P., and Keywood, M. D.: Impact of biomass burning sources on seasonal aerosol air quality, Atmos. Environ., 67, 437–447, https://doi.org/10.1016/j.atmosenv.2012.11.004, 2013.
Schneider, A., Friedl, M. A., and Potere, D.: A new map of global urban extent from MODIS satellite data, Environ. Res. Lett., 4, 044003, https://doi.org/10.1088/1748-9326/4/4/044003, 2009.
Sha, Q., Zhu, M., Huang, H., Wang, Y., Huang, Z., Zhang, X., Tang, M., Lu, M., Chen, C., Shi, B., Chen, Z., Wu, L., Zhong, Z., Li, C., Xu, Y., Yu, F., Jia, G., Liao, S., Cui, X., Liu, J., and Zheng, J.: A newly integrated dataset of volatile organic compounds (VOCs) source profiles and implications for the future development of VOCs profiles in China, Sci. Total Environ., 793, 148348, https://doi.org/10.1016/j.scitotenv.2021.148348, 2021.
Song, Y., Liu, B., Miao, W., Chang, D., and Zhang, Y.: Spatiotemporal variation in nonagricultural open fire emissions in China from 2000 to 2007, Global Biogeochem. Cy., 23, GB2008, https://doi.org/10.1029/2008GB003344, 2009.
Streets, D. G., Bond, T. C., Carmichael, G. R., Fernandes, S. D., Fu, Q., He, D., Klimont, Z., Nelson, S. M., Tsai, N. Y., Wang, M. Q., Woo, J. H., and Yarber, K. F.: An inventory of gaseous and primary aerosol emissions in Asia in the year 2000, J. Geophys. Res.-Atmos., 108, 8809, https://doi.org/10.1029/2002JD003093, 2003.
Tang, L., Jia, M., Yang, J., Li, L., Bo, X., and Mi, Z.: Chinese industrial air pollution emissions based on the continuous emission monitoring systems network, Scientific Data, 10, 153, https://doi.org/10.1038/s41597-023-02054-w, 2023.
United Nations Conference on Trade and Development (UNCTAD): Review of Maritime Transport 2014, United Nations, https://doi.org/10.18356/5a566ab1-en, 2014.
Wang, W., Khanna, N., Lin, J., and Liu, X.: Black carbon emissions and reduction potential in China: 2015–2050, J. Environ. Manage., 329, 117087, https://doi.org/10.1016/j.jenvman.2022.117087, 2023.
Wang, X., Lei, Y., Yan, L., Liu, T., Zhang, Q., and He, K.: A unit-based emission inventory of SO2, NOx and PM for the Chinese iron and steel industry from 2010 to 2015, Sci. Total Environ., 676, 18–30, https://doi.org/10.1016/j.scitotenv.2019.04.241, 2019.
Wu, N., Geng, G., Yan, L., Bi, J., Li, Y., Tong, D., Zheng, B., and Zhang, Q.: Improved spatial representation of a highly resolved emission inventory in China: evidence from TROPOMI measurements, Environ. Res. Lett., 16, 084056, https://doi.org/10.1088/1748-9326/ac175f, 2021.
Wu, N., Geng, G., Qin, X., Tong, D., Zheng, Y., Lei, Y., and Zhang, Q.: Daily Emission Patterns of Coal-Fired Power Plants in China Based on Multisource Data Fusion, ACS Environ. Au., 2, 363–372, https://doi.org/10.1021/acsenvironau.2c00014, 2022.
Wu, N., Geng, G., Xu, R., Liu, S., Liu, X., Shi, Q., Zhou, Y., Zhao, Y., Liu, H., Song, Y., Zheng, J., and Zhang, Q.: INTAC: a high-resolution INTegrated emission inventory of Air pollutants for China in 2017 [Data set], Zenodo, https://doi.org/10.5281/zenodo.10459198, 2024.
Wu, Q., Han, L., Li, S., Wang, S., Cong, Y., Liu, K., Lei, Y., Zheng, H., Li, G., Cai, B., and Hao, J.: Facility-Level Emissions and Synergistic Control of Energy-Related Air Pollutants and Carbon Dioxide in China, Environ. Sci. Technol., 57, 4504–4512, https://doi.org/10.1021/acs.est.2c07704, 2023.
Xiao, Q., Geng, G., Xue, T., Liu, S., Cai, C., He, K., and Zhang, Q.: Tracking PM2.5 and O3 Pollution and the Related Health Burden in China 2013–2020, Environ. Sci. Technol., 56, 6922–6932, https://doi.org/10.1021/acs.est.1c04548, 2022.
Xiu, A. and Pleim, J. E.: Development of a Land Surface Model. Part I: Application in a Mesoscale Meteorological Model, J. Appl. Meteorol., 40, 192–209, https://doi.org/10.1175/1520-0450(2001)040<0192:DOALSM>2.0.CO;2, 2001.
Yang, Y. and Zhao, Y.: Quantification and evaluation of atmospheric pollutant emissions from open biomass burning with multiple methods: a case study for the Yangtze River Delta region, China, Atmos. Chem. Phys., 19, 327–348, https://doi.org/10.5194/acp-19-327-2019, 2019.
Yin, L., Du, P., Zhang, M., Liu, M., Xu, T., and Song, Y.: Estimation of emissions from biomass burning in China (2003–2017) based on MODIS fire radiative energy data, Biogeosciences, 16, 1629–1640, https://doi.org/10.5194/bg-16-1629-2019, 2019.
Zhang, J., Liu, L., Zhao, Y., Li, H., Lian, Y., Zhang, Z., Huang, C., and Du, X.: Development of a high-resolution emission inventory of agricultural machinery with a novel methodology: A case study for Yangtze River Delta region, Environ. Pollut., 266, 115075, https://doi.org/10.1016/j.envpol.2020.115075, 2020.
Zhang, Q. and Geng, G.: Impact of clean air action on PM2.5 pollution in China, Science China Earth Sciences, 62, 1845–1846, https://doi.org/10.1007/s11430-019-9531-4, 2019.
Zhang, Q., Streets, D. G., Carmichael, G. R., He, K. B., Huo, H., Kannari, A., Klimont, Z., Park, I. S., Reddy, S., Fu, J. S., Chen, D., Duan, L., Lei, Y., Wang, L. T., and Yao, Z. L.: Asian emissions in 2006 for the NASA INTEX-B mission, Atmos. Chem. Phys., 9, 5131–5153, https://doi.org/10.5194/acp-9-5131-2009, 2009.
Zhang, Q., Zheng, Y., Tong, D., Shao, M., Wang, S., Zhang, Y., Xu, X., Wang, J., He, H., Liu, W., Ding, Y., Lei, Y., Li, J., Wang, Z., Zhang, X., Wang, Y., Cheng, J., Liu, Y., Shi, Q., Yan, L., Geng, G., Hong, C., Li, M., Liu, F., Zheng, B., Cao, J., Ding, A., Gao, J., Fu, Q., Huo, J., Liu, B., Liu, Z., Yang, F., He, K., and Hao, J.: Drivers of improved PM2.5 air quality in China from 2013 to 2017, P. Natl. Acad. Sci. USA, 116, 24463–24469, https://doi.org/10.1073/pnas.1907956116, 2019.
Zhang, Y., Bo, X., Zhao, Y., and Nielsen, C. P.: Benefits of current and future policies on emissions of China's coal-fired power sector indicated by continuous emission monitoring, Environ. Pollut., 251, 415–424, https://doi.org/10.1016/j.envpol.2019.05.021, 2019.
Zhang, Y., Zhao, Y., Gao, M., Bo, X., and Nielsen, C. P.: Air quality and health benefits from ultra-low emission control policy indicated by continuous emission monitoring: a case study in the Yangtze River Delta region, China, Atmos. Chem. Phys., 21, 6411–6430, https://doi.org/10.5194/acp-21-6411-2021, 2021.
Zhao, Y., Nielsen, C. P., Lei, Y., McElroy, M. B., and Hao, J.: Quantifying the uncertainties of a bottom-up emission inventory of anthropogenic atmospheric pollutants in China, Atmos. Chem. Phys., 11, 2295–2308, https://doi.org/10.5194/acp-11-2295-2011, 2011.
Zhao, Y., Qiu, L. P., Xu, R. Y., Xie, F. J., Zhang, Q., Yu, Y. Y., Nielsen, C. P., Qin, H. X., Wang, H. K., Wu, X. C., Li, W. Q., and Zhang, J.: Advantages of a city-scale emission inventory for urban air quality research and policy: the case of Nanjing, a typical industrial city in the Yangtze River Delta, China, Atmos. Chem. Phys., 15, 12623–12644, https://doi.org/10.5194/acp-15-12623-2015, 2015.
Zhao, Y., Mao, P., Zhou, Y., Yang, Y., Zhang, J., Wang, S., Dong, Y., Xie, F., Yu, Y., and Li, W.: Improved provincial emission inventory and speciation profiles of anthropogenic non-methane volatile organic compounds: a case study for Jiangsu, China, Atmos. Chem. Phys., 17, 7733–7756, https://doi.org/10.5194/acp-17-7733-2017, 2017a.
Zhao, Y., Zhou, Y., Qiu, L., and Zhang, J.: Quantifying the uncertainties of China's emission inventory for industrial sources: From national to provincial and city scales, Atmos. Environ., 165, 207–221, https://doi.org/10.1016/j.atmosenv.2017.06.045, 2017b.
Zhao, Y., Xia, Y., and Zhou, Y.: Assessment of a high-resolution NOX emission inventory using satellite observations: A case study of southern Jiangsu, China, Atmos. Environ., 190, 135–145, https://doi.org/10.1016/j.atmosenv.2018.07.029, 2018.
Zhao, Y., Yuan, M., Huang, X., Chen, F., and Zhang, J.: Quantification and evaluation of atmospheric ammonia emissions with different methods: a case study for the Yangtze River Delta region, China, Atmos. Chem. Phys., 20, 4275–4294, https://doi.org/10.5194/acp-20-4275-2020, 2020.
Zheng, B., Huo, H., Zhang, Q., Yao, Z. L., Wang, X. T., Yang, X. F., Liu, H., and He, K. B.: High-resolution mapping of vehicle emissions in China in 2008, Atmos. Chem. Phys., 14, 9787–9805, https://doi.org/10.5194/acp-14-9787-2014, 2014.
Zheng, B., Zhang, Q., Tong, D., Chen, C., Hong, C., Li, M., Geng, G., Lei, Y., Huo, H., and He, K.: Resolution dependence of uncertainties in gridded emission inventories: a case study in Hebei, China, Atmos. Chem. Phys., 17, 921–933, https://doi.org/10.5194/acp-17-921-2017, 2017.
Zheng, B., Tong, D., Li, M., Liu, F., Hong, C., Geng, G., Li, H., Li, X., Peng, L., Qi, J., Yan, L., Zhang, Y., Zhao, H., Zheng, Y., He, K., and Zhang, Q.: Trends in China's anthropogenic emissions since 2010 as the consequence of clean air actions, Atmos. Chem. Phys., 18, 14095–14111, https://doi.org/10.5194/acp-18-14095-2018, 2018.
Zheng, B., Cheng, J., Geng, G., Wang, X., Li, M., Shi, Q., Qi, J., Lei, Y., Zhang, Q., and He, K.: Mapping anthropogenic emissions in China at 1 km spatial resolution and its application in air quality modeling, Sci. Bull., 66, 612–620, https://doi.org/10.1016/j.scib.2020.12.008, 2021.
Zheng, H., Cai, S., Wang, S., Zhao, B., Chang, X., and Hao, J.: Development of a unit-based industrial emission inventory in the Beijing–Tianjin–Hebei region and resulting improvement in air quality modeling, Atmos. Chem. Phys., 19, 3447–3462, https://doi.org/10.5194/acp-19-3447-2019, 2019.
Zheng, J., He, M., Shen, X., Yin, S., and Yuan, Z.: High resolution of black carbon and organic carbon emissions in the Pearl River Delta region, China, Sci. Total Environ., 438, 189–200, https://doi.org/10.1016/j.scitotenv.2012.08.068, 2012.
Zhou, Y., Xing, X., Lang, J., Chen, D., Cheng, S., Wei, L., Wei, X., and Liu, C.: A comprehensive biomass burning emission inventory with high spatial and temporal resolution in China, Atmos. Chem. Phys., 17, 2839–2864, https://doi.org/10.5194/acp-17-2839-2017, 2017a.
Zhou, Y., Zhao, Y., Mao, P., Zhang, Q., Zhang, J., Qiu, L., and Yang, Y.: Development of a high-resolution emission inventory and its evaluation and application through air quality modeling for Jiangsu Province, China, Atmos. Chem. Phys., 17, 211–233, https://doi.org/10.5194/acp-17-211-2017, 2017b.