the Creative Commons Attribution 4.0 License.
the Creative Commons Attribution 4.0 License.
 | 04 Jun 2024
The ABoVE L-band and P-band airborne synthetic aperture radar surveys
Charles E. Miller
Peter C. Griffith
Elizabeth Hoy
Naiara S. Pinto
Yunling Lou
Scott Hensley
Bruce D. Chapman
Jennifer Baltzer
Kazem Bakian-Dogaheh
W. Robert Bolton
Laura Bourgeau-Chavez
Richard H. Chen
Byung-Hun Choe
Leah K. Clayton
Thomas A. Douglas
Nancy French
Jean E. Holloway
Gang Hong
Lingcao Huang
Go Iwahana
Liza Jenkins
John S. Kimball
Tatiana Loboda
Michelle Mack
Philip Marsh
Roger J. Michaelides
Mahta Moghaddam
Andrew Parsekian
Kevin Schaefer
Paul R. Siqueira
Debjani Singh
Alireza Tabatabaeenejad
Merritt Turetsky
Ridha Touzi
Elizabeth Wig
Cathy J. Wilson
Paul Wilson
Stan D. Wullschleger
Yonghong Yi
Howard A. Zebker
Yuhuan Zhao
Scott J. Goetz
Permafrost-affected ecosystems of the Arctic–boreal zone in northwestern North America are undergoing profound transformation due to rapid climate change. NASA's Arctic Boreal Vulnerability Experiment (ABoVE) is investigating characteristics that make these ecosystems vulnerable or resilient to this change. ABoVE employs airborne synthetic aperture radar (SAR) as a powerful tool to characterize tundra, taiga, peatlands, and fens. Here, we present an annotated guide to the L-band and P-band airborne SAR data acquired during the 2017, 2018, 2019, and 2022 ABoVE airborne campaigns. We summarize the ∼80 SAR flight lines and how they fit into the ABoVE experimental design (Miller et al., 2023; https://doi.org/10.3334/ORNLDAAC/2150). The Supplement provides hyperlinks to extensive maps, tables, and every flight plan as well as individual flight lines. We illustrate the interdisciplinary nature of airborne SAR data with examples of preliminary results from ABoVE studies including boreal forest canopy structure from TomoSAR data over Delta Junction, AK, and the Boreal Ecosystem Research and Monitoring Sites (BERMS) area in northern Saskatchewan and active layer thickness and soil moisture data product validation. This paper is presented as a guide to enable interested readers to fully explore the ABoVE L- and P-band airborne SAR data (https://uavsar.jpl.nasa.gov/cgi-bin/data.pl).
- Article
(8568 KB) - Full-text XML
-
Supplement
(19714 KB) - BibTeX
- EndNote


© California Institute of Technology. Government funding acknowledged.
The Arctic region contains a remarkable diversity of cold-adapted biota, habitats, and permafrost-affected ecosystems (McGuire et al., 2009; Vincent et al., 2011). As with other components of the Arctic system, Arctic ecosystems are strongly interdependent, and the rapid degradation of the Arctic cryosphere is altering their physical, biogeochemical, and biological linkages in ways that may be irreversible (Vincent et al., 2011; Hinzman et al., 2013). Understanding characteristics that make Arctic ecosystems vulnerable or resilient to this change is the overarching objective of NASA's Arctic Boreal Vulnerability Experiment (ABoVE; https://above.nasa.gov/, last access: 19 April 2024). Miller et al. (2019) describe how airborne campaigns fit into the broader ABoVE research strategy and how the foundational synthetic aperture radar (SAR) measurements formed the framework around which all other airborne data acquisitions were planned.
ABoVE SAR flight lines (Fig. 1) were planned to leverage legacy L- and P-band SAR transects acquired during the pre-ABoVE period; remotely sensed permafrost active layer thickness time series derived from satellite interferometric SAR observations (ReSALT) (Schaefer et al., 2015); SAR data from PALSAR, PALSAR-2, RadarSat, RadarSat-2, and Sentinel-1; historic or planned airborne lidar acquisitions; and data from existing field sites (Hoy et al., 2018). Legacy airborne SAR flight lines include the L-band grid acquired over the Boreal Ecosystem Research and Monitoring Sites (BERMS) area near Prince Albert, SK, during SMAP CanEx 2010 (Magagi et al., 2013); the P-band lines over the BERMS area acquired from 2012–2015 during the Airborne Microwave Observatory of Subcanopy and Subsurface (AirMOSS) Earth Ventures Suborbital (EV-S1) investigation (Allen et al., 2010; Moghaddam et al., 2016); and a collection of 10 L- and P-band flight lines acquired over the Seward Peninsula, northwestern Interior, and North Slope of Alaska during 2014 and 2015 (Chen et al., 2019a, b). The BERMS area observations, in particular, link ABoVE to the Boreal Ecosystem–Atmosphere Study (BOREAS) studies of the 1990s (Sellers et al., 1995, 1997).
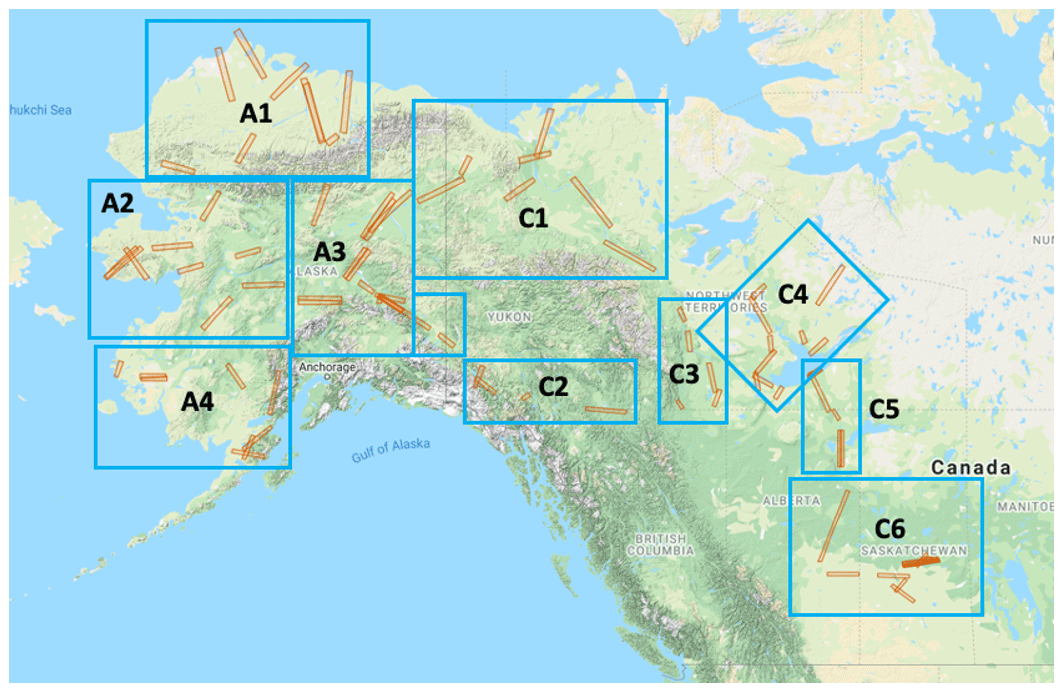
Figure 1Flight lines for the L-band and P-band PolInSAR measurements capture critical bioclimatic, permafrost, and geographic gradients as well as key field sites and long-term measurement records across the 4×10⁶ km2 ABoVE domain. The flight lines are collected into 10 composites which roughly correspond to the Alaskan (A1–A4) and Canadian (C1–C6) regions sampled on individual flight days. © Google Maps.
Hoy et al. (2018) compiled information on more than 6700 field sites and previous remote sensing data sets to help plan the SAR flight lines and the ABoVE airborne campaigns (Miller et al., 2019). This compilation is intended to help investigators understand flight line choices and identify ground locations used to anchor individual flight lines. SAR data users may also search for the underlying data available within each flight line. Key anchor points for the SAR flight lines include active layer thickness measurements from the Circumpolar Active Layer Monitoring network (CALM); permafrost temperatures and annual thaw depths from the Global Terrestrial Network for Permafrost (GTN-P) database; soil moisture and permafrost state data from the Department of Energy's Next Generation Ecological Experiment-Arctic (NGEE-Arctic) field sites on the Seward Peninsula and near Utqiaġvik (formerly Barrow) (AK); extensive in situ terrestrial and aquatic ecosystem data as well as airborne lidar and spectral imagery from NSF's National Ecological Observatory Network (NEON) D18 tundra field sites near Utqiaġvik (Barrow) (AK) and Toolik Lake (AK) and from the D19 taiga field sites near Caribou/Poker Creek (AK), Delta Junction (AK), and Healy (AK); detailed ecological and physical climate time series from NSF's Long Term Ecological Research (LTER) Arctic (Toolik Lake) and Boreal Forest (Bonanza Creek) sites; long-term boreal forest inventory data from the Canadian Forestry Service's (CFS) Climate Impacts on Productivity and Health of Aspen (CIPHA) and High Elevation and Latitude Climate Change Impacts and Adaptation (HELCIA) plots; and long-term permafrost, hydrology, and ecology time series records from the Canadian Changing Cold Regions Network (CCRN) sites at Trail Valley Creek, NWT, Havikpak Creek, NWT, Scotty Creek, NWT, Baker Creek, NWT, Wolf Creek Research Basin, YT, and the BERMS site at White Gull Creek, SK.
Airborne SAR data enable numerous ecosystem and ecosystem change research investigations (NRC, 2014). ABoVE researchers are using the airborne L- and P-band data to quantify permafrost active layer thickness and soil moisture content (Bakian-Dogaheh et al., 2020a, b); complement AirSWOT Ka-band acquisitions to determine water surface elevations (WSEs) in Arctic lakes, wetlands, and rivers (Pitcher et al., 2019a, b); investigate boreal forest and tundra fire scars, especially in conjunction with fire disturbance plots (Tank et al., 2018; Walker et al., 2018a, b, 2019a, b; French et al., 2020a, b; Holloway et al., 2020; Loboda et al., 2022); map tree density and distribution across the Tundra-Taiga ecotone; provide control point data for the ArcticDEM (Porter et al., 2018; Meddens et al., 2018); investigate lidar-radar fusion remote sensing for boreal forest characterization as a precursor to NISAR/IceSAT-2 investigations (Silva et al., 2021); quantify expansion and sediment mass flow from massive retrogressive thaw slumps – so-called megaslumps – on the Peel Plateau along the Dempster Hwy west of Fort McPherson, NT (Kokelj et al., 2013, 2015); classify Arctic wetlands and habitats (French, 2020); and support algorithm development for NISAR (L-band) and BIOMASS (P-band) estimates of boreal forest structure and aboveground biomass (Quegan et al., 2019; Saatchi et al., 2019). Goetz et al. (2022) summarize how the ABoVE airborne SAR data are helping advance Arctic–boreal understanding and the remaining knowledge gaps still to be addressed.
This paper presents an annotated guide to enable interested readers to fully explore the ABoVE L- and P-band SAR data acquired during the 2017, 2018, 2019, and 2022 ABoVE airborne campaigns. Section 2 provides details on the L- and P-band SAR instruments and the flight line catalog. Section 3 summarizes the daily sorties from each airborne campaign. Section 4 briefly describes the tomographic SAR (TomoSAR) experiments flown over Delta Junction, AK, and the BERMS site near Prince Albert, SK. Section 5 describes some of the ABoVE SAR data products and their validation. Section 6 highlights the synergies between the L- and P-band airborne SAR data and other airborne sensors. Section 7 summarizes access to the data products. Section 8 discusses potential future acquisitions and outlooks for exploiting these data. Additionally, we include supplementary information which describes the ∼80 ABoVE SAR flight lines and how each line fits into the ABoVE experimental design. The Supplement also provides extensive maps and tables for every flight plan and individual flight lines as well as a list of the acronyms and abbreviations and hyperlinked versions of the tables for direct access to flight lines and flight plans.
Both the L- and P-band airborne SARs are sensitive to geometrical and material properties of vegetation, soil surface, and subsurface profiles (Saatchi and Moghaddam, 2000; Tabatabaeenejad et al., 2011, 2015). The joint use of the L- and P-band gives enhanced sensitivity to near-surface (<5 cm, L-band) and root zone (10–40 cm, P-band) portions of the subsurface profile compared to the use of either wavelength alone (Du et al., 2015). Airborne acquisitions with both SARs provide 6–10 m spatial resolution, ∼15 km swaths, and transect lengths of 100–200 km, making them ideal for surveying aboveground biomass and vegetation canopy structure (Hensley et al., 2014, 2016) as well as the tundra-taiga ecotone (Montesano et al., 2016). Special TomoSAR data were acquired over the well-characterized BERMS site in northern Saskatchewan and the NEON site in Delta Junction, AK, to quantify the performance of both SARs in reproducing the structure and biomass of boreal forests.
2.1 The L-band SAR instrument
NASA's airborne L-band SAR (initially named the Uninhabited Aerial Vehicle Synthetic Aperture Radar (UAVSAR) system) is a compact pod-mounted polarimetric instrument for interferometric repeat-track observations that was developed at the NASA Jet Propulsion Laboratory (JPL) and Dryden Flight Research Center (DFRC) in Edwards, CA. It operates at a center frequency of 1.2575 GHz (wavelength=23.8 cm) with 80 MHz bandwidth. It is deployed on a Gulfstream III aircraft and images the Earth surface from a nominal 12.5 km altitude. The image data are collected off-nadir in a ∼22 km wide swath with incidence angles ranging from ∼22–67°. The instrument spatial resolution is 0.8 m (along flight-line) by 1.7 m (slant range, along line-of-sight (LOS) from the antenna to the ground). Topographic information is derived from phase measurements that, in turn, are obtained from two or more passes over a given target region. Its 1.26 GHz frequency results in radar images that are well-correlated from pass to pass. Polarization agility facilitates terrain and land-use classification.
All L-band SAR data are publicly available at https://uavsar.jpl.nasa.gov/ (last access: 19 April 2024) as individual interferometric SAR (InSAR) products or as a single-look-complex (SLC) stack product of coregistered images for individual flight lines. Products are also available from the UAVSAR data portal at the Alaska SAR Facility Distributed Active Archive Center (https://asf.alaska.edu/data-sets/sar-data-sets/uavsar/, last access: 19 April 2024). The L-band SAR provides key pre-launch algorithm development and validation data sets (Saatchi et al., 2019) for the NASA-ISRO SAR (NISAR) mission (Rosen et al., 2017).
2.2 The P-band SAR instrument
The P-band SAR was developed circa 2012 for the Earth Ventures Suborbital (EV-S1) Airborne Microwave Observatory of Subcanopy and Subsurface (AirMOSS) investigation (Allen et al., 2010; Moghaddam et al., 2016). The radar is based on JPL's L-band UAVSAR system. The P-band SAR inherits UAVSAR's existing L-band radio frequency and digital electronics subsystems. New up and down converters convert the L-band signals to UHF frequencies (280–440 MHz). The passive antenna is based on the legacy GeoSAR design (Chapin et al., 2012).
The P-band SAR was flown more than 1200 h from 2012 to 2015, covering regions of 2500 km2 spread over nine major biomes in North America during the AirMOSS EV-S1 investigation (Tabatabaeenejad et al., 2020). Legacy acquisitions in Alaska (Chen, 2019a, b) and over the BERMS site in northern Saskatchewan (Chapin et al., 2012, 2018) provide an opportunity for extended time series analysis. All P-band SAR data are publicly available at https://uavsar.jpl.nasa.gov/ (last access: 19 April 2024). Additionally, ABoVE P-band SAR data will provide valuable insights into the characterization of boreal forest and tundra ecosystems by the upcoming BIOMASS mission (Le Toan et al., 2011; Quegan et al., 2019).
2.3 The Platform Precision Autopilot (PPA) system
To support centimeter-precision interferometric land surface characterization, repeat pass measurements acquired by the SARs need to be taken from flight paths that are nearly identical. Both the L- and P-band SARs utilize real-time GPS that interfaces with the platform flight management system (FMS) to confine the repeat flight path to within a 10 m tube over a 200 km course in conditions of calm to light turbulence. The FMS is also referred to as the Platform Precision Autopilot (PPA). Additionally, the radar vector from the aircraft to the ground target area must be similar from pass to pass. This is accomplished with an actively scanned antenna designed to support electronic steering of the antenna beam with a minimum of 1° increments over a range not to exceed ±15° in the flight direction.
ABoVE SAR measurements were typically acquired with platform root mean square deviations less than ±3 m. Any platform deviations larger than ±10 m from the programmed flight path resulted in the acquisition being terminated and a real-time decision made to reacquire the line from the beginning or to continue with the flight plan and proceed to the next line. This decision balanced the science priority of the flight line, fuel consumption and remaining endurance, the number of flight lines yet to be acquired in the day's flight plan, distance from our base of operations, and whether there would be future opportunities to collect a given line by adding it to an upcoming flight plan. The flight team was extremely efficient in executing these decisions, resulting in 95 % flight line acquisition success across the 2017–2022 period.
2.4 Airborne SAR flight line and flight plan designations
The JPL SAR team devised a convenient and powerful way to identify airborne SAR data acquisitions for the Facility and PI instruments under their charge. Each L-band or P-band SAR flight line receives a unique five-digit identifier consisting of the three-digit GPS compass heading followed by a two-digit index. A six-character text string is also associated with each line for ease of identification. The text string precedes the numerical ID and usually provides abbreviated geographic or infrastructure information that characterizes the line. For example, L-band flight line Teller_04901 identifies the flight line on the Seward Peninsula that overflies the NGEE-Arctic Teller watershed. The flight line identifier is a constant and, once assigned, is used whenever a line is reflown. In some cases, there are overlapping or nearly identical flight lines which differ slightly in their ID number. L-band and P-band flight lines use the same flight line identification system, allowing rapid identification of overlapping L- and P-band data acquisitions.
Flight plans are assembled from the composite flight lines for a given sortie. Each flight plan also receives a unique five-digit identifier based on the year flown (digits 1 and 2) and the flight number for that year (digits 3–5). For example, L-band flight plan 17093 was flown in 2017 and was the 93rd sortie flown that year. Note that there may be more than one sortie flown on a given day, in which case each would have a unique flight plan identifier even though they were flown on the same calendar day and may include some or all of the same flight lines.
In the Supplement we provide hyperlinks to the JPL UAVSAR data portal (https://uavsar.jpl.nasa.gov/cgi-bin/data.pl, last access: 19 April 2024). This provides links to the individual flight line data, maps, and related flight plans that acquired data over one or more of the individual flight lines. We hope this enables interested readers to explore the ABoVE L- and P-band SAR data more fully. These data and all other airborne data from the ABoVE campaigns may be explored on NASA's EarthData ABoVE portal (https://search.earthdata.nasa.gov/portal/above/search, last access: 19 April 2024). Ground sites used to design the orientation and locations of the flight lines are archived at the ORNL DAAC (Hoy et al., 2018).
The L-band (Fig. 2) and P-band (Fig. 3) SARs were considered foundational measurements in the ABoVE airborne campaign strategy (Miller et al., 2019). The ∼80 flight lines described in the Supplement formed the framework for the remainder of the airborne remote sensing acquisitions. The ABoVE SAR strategy was to execute same day acquisitions of both L- and P-band flight lines (Fig. 1) for a given sortie during 2017 to optimize dual-frequency retrievals; however, technical issues forced us to fly the instruments sequentially. The baseline L-band campaigns were flown in June (DOY 164–173) and September (DOY 251–263) 2017 to characterize the land surface during periods of minimum and maximum active layer thickness, respectively. Subsequent L-band campaigns in 2018 (DOY 231–241), 2019 (DOY 247–260) and 2022 (DOY 226–237) provide a time series synched to maximum annual active layer thickness. P-band campaigns were conducted in May–June (DOY 142–157) and August (DOY 219–227) of 2017. There was a 2 d P-band mini-campaign in October 2017 to extend the legacy time series of early-cold-season acquisitions over the Seward Peninsula, NW Alaska, and North Slope Alaska (DOY 280–283).

Figure 2Sahtu students Mandy Bayha (front left) and Joanne Speakman (front center) pose with their mentor Cindy Gilday (front right) and NASA flight crew in Yellowknife, NT, after completing a L-band SAR survey flight around the Great Slave Lake Region on 22 August 2018 (flight plan 18048). This experience gave these Northerners a new appreciation for how NASA was helping understand, preserve, and protect their lands. Photo credit: Stephen M. Fochuk, Government of Northwest Territories.
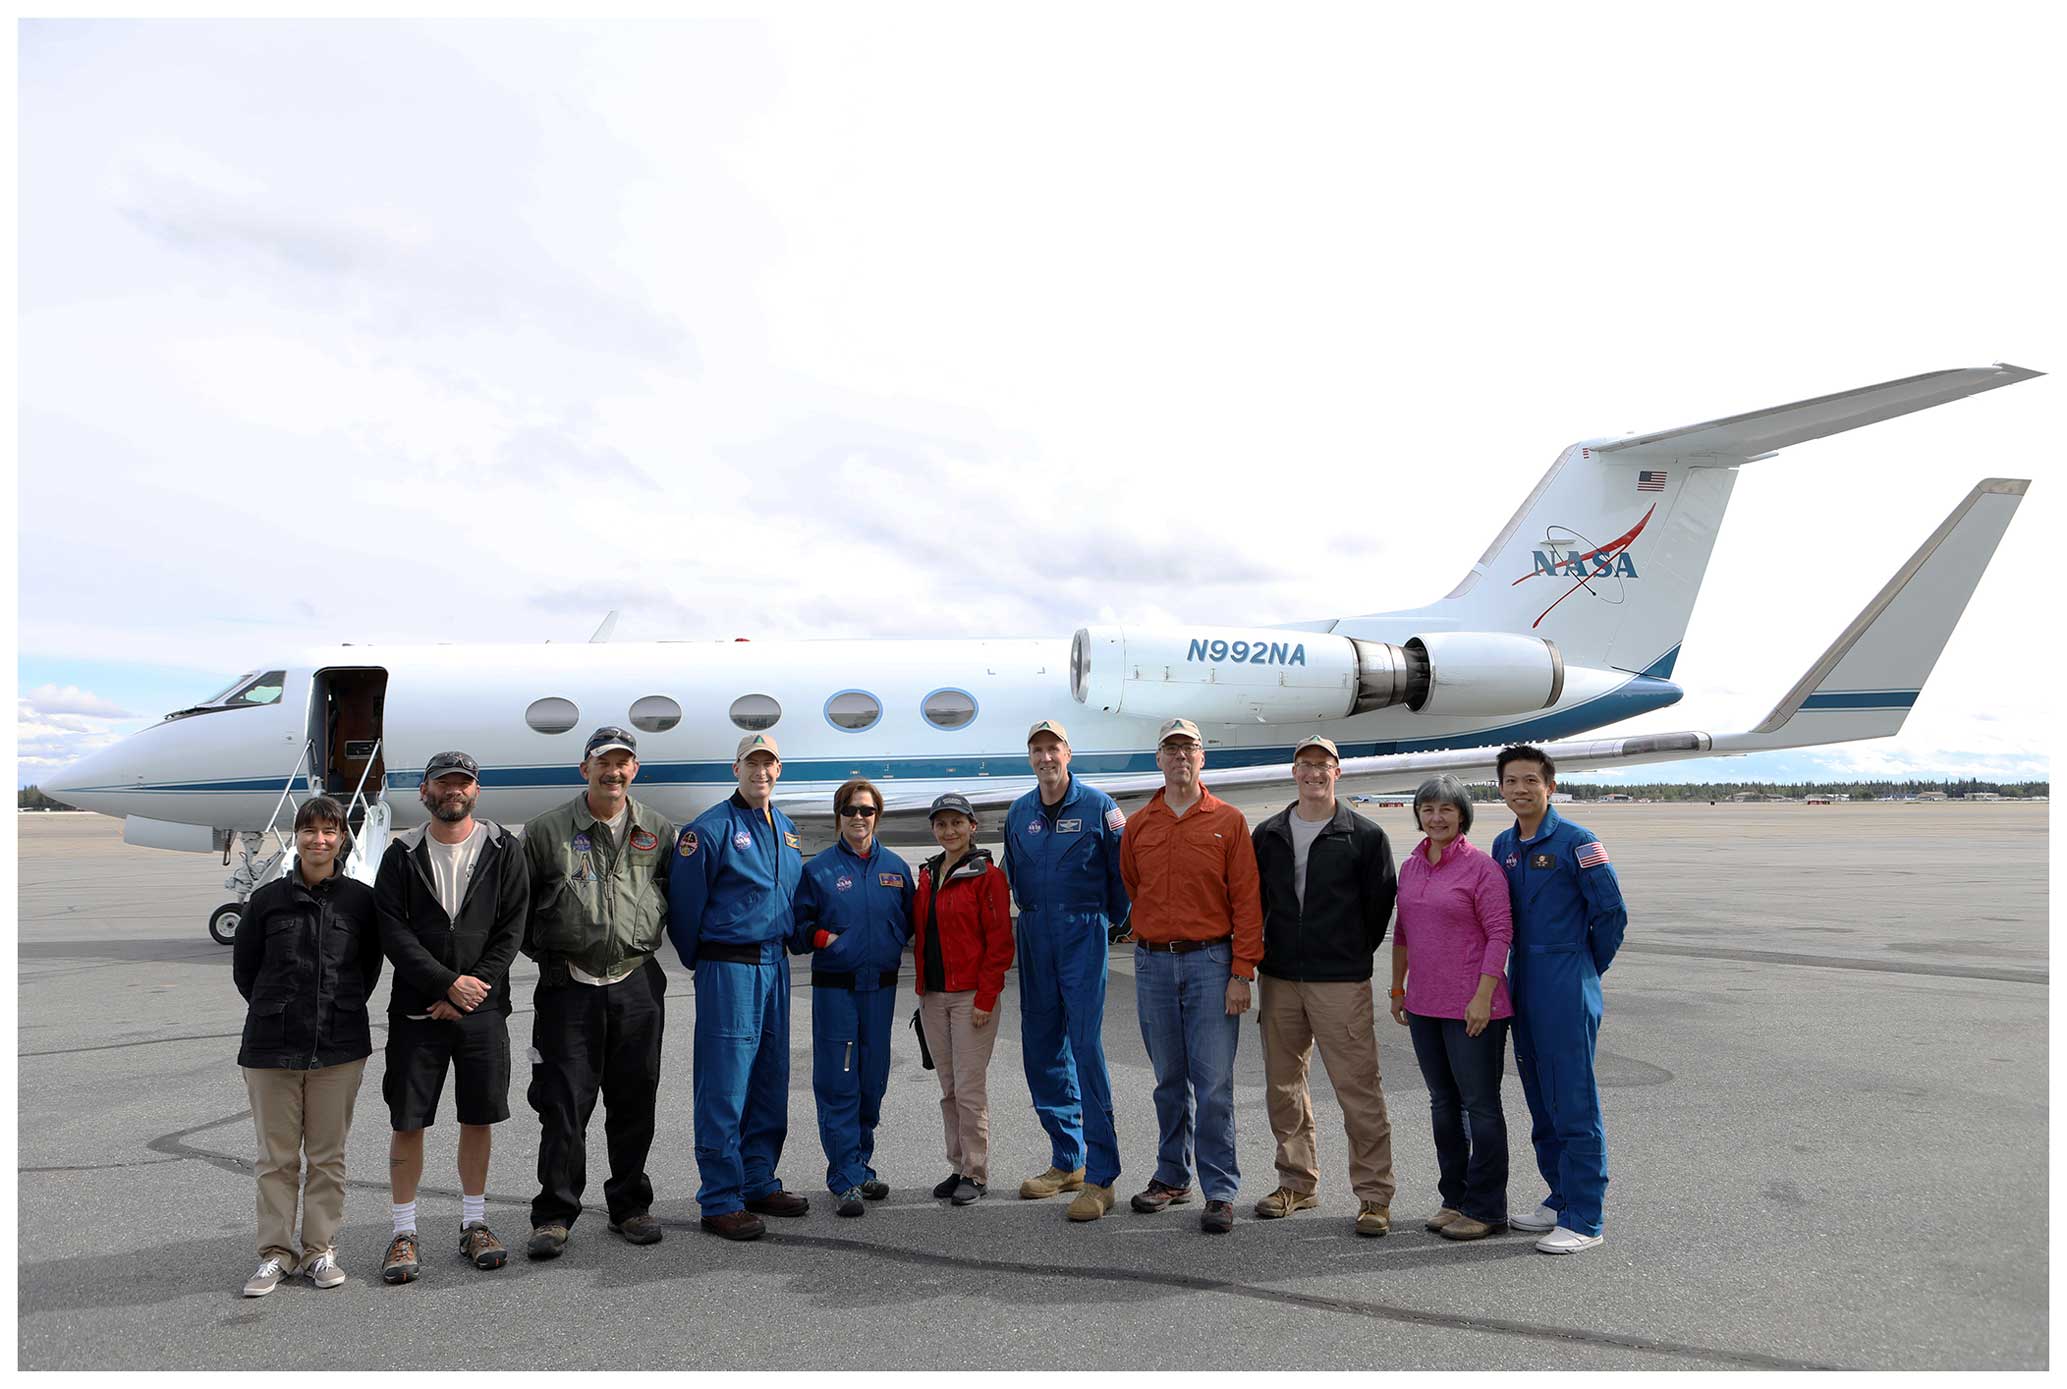
Figure 3The P-band SAR team with the NASA JSC G-III (N992NA) on the tarmac in Fairbanks, AK, on 18 August 2017 after completing a survey of the Upper Mackenzie Valley (flight plan 17083). Photo credit: Mahta Moghaddam.
3.1 Alaskan flight lines
The Alaskan SAR flight lines are broken into four main regional collections: (A1) North Slope Alaska, (A2) Seward Peninsula and Northwest Alaska, (A3) eastern Interior, and (A4) Southwest Alaska and the Yukon-Kuskokwim Delta (Fig. 1). Individual flight lines were planned based on long-term ground monitoring sites (Hoy et al., 2018), existing or planned field research, recent disturbances, important geographic or ecological gradients, complementary remote sensing data, and consultation with indigenous peoples and governments (Miller et al., 2019). Legacy L- and P-band flight lines from the AirMOSS EV-S1 investigation (Allen et al., 2010; Moghaddam et al., 2016) in the Seward Peninsula, NW Alaska, and the North Slope were adapted for ABoVE use. Acquisition of P-band flight lines in the central Interior was not possible due to a military radar keep-out zone centered near Clear, AK. The keep-out zone is shown in all P-band flight plan maps (Ex. Fig. 4).
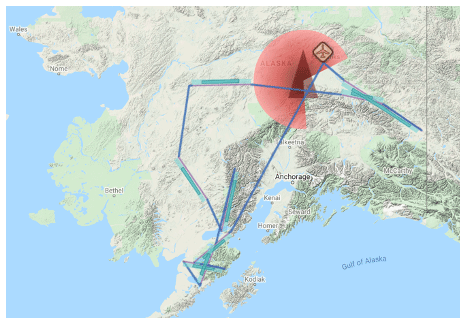
Figure 4The military radar at Clear, AK, creates a large P-band operations keep-out zone in the central Interior (red areas). The aircraft symbol marks our Fairbanks International Airport (PAFA) base of operations. Data acquisitions (blue bars) are from flight plan 17054. © Google Maps.
3.2 Canadian flight lines
The Canadian SAR flight lines are broken into six regional collections: (C1) Lower Mackenzie Valley and Northern Yukon Territory, (C2) Southern Yukon Territory, (C3) Upper Mackenzie Valley, (C4) Great Slave Lake Region, (C5) Transboundary Watershed, and (C6) Southern Boreal Forest/BERMS. Individual lines were planned based on long-term ground monitoring sites (Hoy et al., 2018), existing or planned field research, recent disturbances, important geographic or ecological gradients, complementary remote sensing data, and consultation with local inhabitants and governments (Miller et al., 2019). Legacy L- and P-band flight lines in the BERMS area from the CANEX 2010 campaign (Magagi et al., 2013) and the AirMOSS EV-S1 investigation (Chapin et al., 2012, 2018) provide the potential to establish longer time series.
Flight planning for the Canadian transects benefited tremendously from consultations with our Canadian colleagues and interested parties in Yellowknife, NT, and Whitehorse, YT, in 2015 and 2016. Extensive discussions with the Government of the Northwest Territories (GNWT); the Government of the Yukon Territory; First Nations representatives; and scientists from Polar Knowledge Canada (POLAR), the NWT Center for Geomatics, and the Canadian Forestry Service (CFS) Northern Forestry Centre (NoFC) were critical to designing a strategy that captured many of their observing priorities. Subsequent discussions in Yellowknife during 2017 and 2018 enabled us to disseminate preliminary results and coordinate the flights with same-day field data acquisitions.
SAR tomographic methods have proven extremely adept at measuring vegetation vertical structure at a variety of wavelengths including L- and P-bands. The three-dimensional vegetation structure and its changes resulting from either natural or anthropogenic causes are key ecosystem monitoring parameters. ABoVE collected tomographic L- and P-band SAR data over the boreal forest near Delta Junction, AK, in September of 2017. UAVSAR (L-band) and the German Space Agency's F-SAR (L- and S-bands) acquired coordinated tomographic SAR data at the BERMS site near Saskatoon, SK, in August 2018. Ground truth data sets and lidar data from the NASA Land, Vegetation, and Ice Sensor (LVIS) system were also acquired at BERMS in 2017 (Blair and Hofton, 2018a, b). We compared L- and P-band tomography at Delta Junction and L-band and S-band tomography from the two systems, to each other, and to the lidar data sets at BERMS. Here we provide a preliminary analysis of the data acquired at BERMS.
BERMS is a southern boreal forest site with gentle topography dominated by jack pine and aspen stands. There is active logging in the area, and the site contains clear-cut areas and new growth stands in various maturity states. The tomography data acquisition at BERMS was planned jointly in cooperation with the German Space Agency (DLR), who flew the F-SAR radar and acquired data at the L-band and S-band. The UAVSAR and F-SAR flight lines were designed to overlap each other and LVIS data acquired at the site in 2017. LVIS reacquired BERMS area data again in 2019 with the LVIS-F and LVIS-C instruments (https://lvis.gsfc.nasa.gov/Data/Maps/ABoVE2019Map.html, last access: 19 April 2024). Figure 5 (left) shows swaths for the UAVSAR and F-SAR radars along with the LVIS data. UAVSAR acquired L-band tomography data on a racetrack pattern to get multiple incidence angle data for most points in the swath. Because UAVSAR and F-SAR fly at 12 500 and 4200 , respectively, it is not possible to acquire data with the same incidence angles across the swath. Thus, we configured the flight lines to overlap so that the 40° incidence angle points would coincide. Figure 5 (right) shows photos collected at 4 of our 17 ground truth sites during the TomoSAR acquisitions.
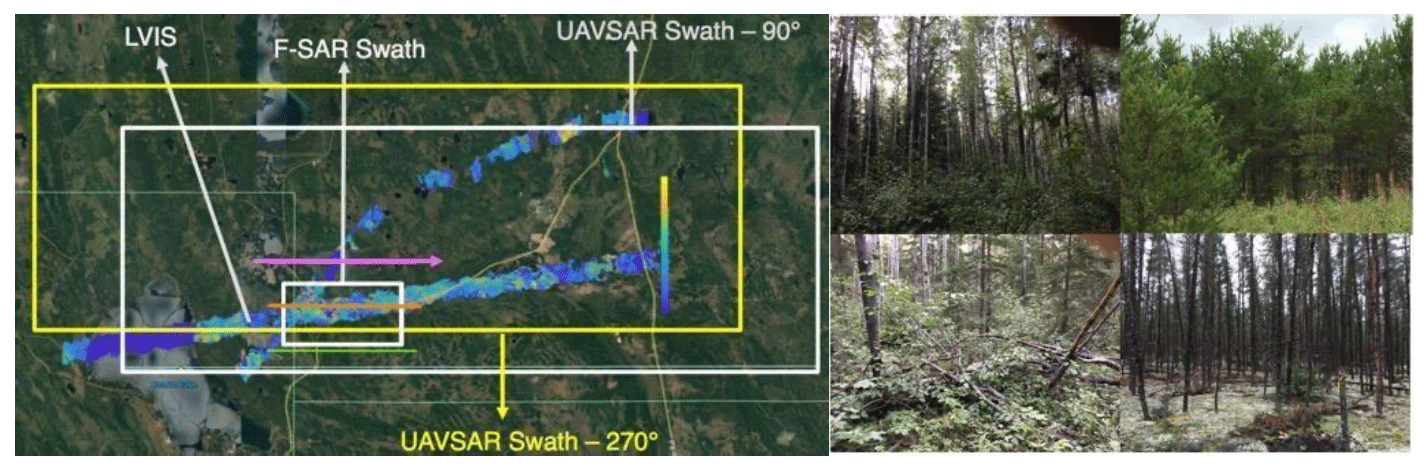
Figure 5Left: experimental design for the BERMS area TomoSAR flights in August 2018. The large white and yellow boxes show the ∼18 km wide UAVSAR L-band swaths. The offset is due to the off-nadir viewing angle of the L-band SAR – it is pointed to the south when flying the 270° swath and pointed north when flying the 90° swath. The small white box near the center of the image marks the ∼3 km wide F-SAR swath. LVIS lidar data are the ∼1.5 km wide colored swaths across the image; the color scaling reflects the canopy height. Right: photos from 4 of the 17 plots used for in situ ground truth measurement at BERMS. Vegetation at BERMS was mostly jack pine and aspen, with many areas having dense understory vegetation. Most areas have substantial detritus and ground litter left over from previous logging operations. © Google Earth.
LVIS full-waveform lidar provides surface elevations and tree height estimates as well as lidar echo strength throughout the canopy and thereby information on the canopy internal structure. From LVIS waveforms, many products are possible, including surface elevation, tree height, moments of the returned waveform distribution, and cumulative percentile elevations. We compared these waveforms to radar tomographic profiles for the different radar wavelengths.
BERMS field measurements consist of soil moisture measurements at the 17 sites using the average of 15 measurements distributed over 60 m×60 m plots on the day of the UAVSAR radar observations. At BERMS the soil was very dry, roughly 10 % volumetric soil moisture or less, during the radar observations. During the summer of 2020, measurements of diameter at breast height (DBH), used to estimate biomass, for a subset of our selected sites were planned but postponed due to COVID-19.
Figure 6 compares UAVSAR L-band tomography with F-SAR L-band and S-band tomography and LVIS lidar data along a transect shown as a yellow line on the right in the figure. Tree height along the transect varied from 10–20 m. The middle of Fig. 2 is the UAVSAR L-band transect. The top of the figure shows the LVIS RH25 m, RH50, RH75, and RH95 profiles overlaid on the UAVSAR tomogram, and below are the radar and lidar vertical profiles. On the left of Fig. 2 are the F-SAR L-band and S-band tomographic profiles along with the LVIS RH100 data. The L-band radar profiles exhibit power concentrated at the base of the canopy, whereas the LVIS lidar data show more return from the middle portion of the canopy. The S-band obtains greater returns in the upper canopy compared to the L-band and shows more uniform scattering within the canopy.
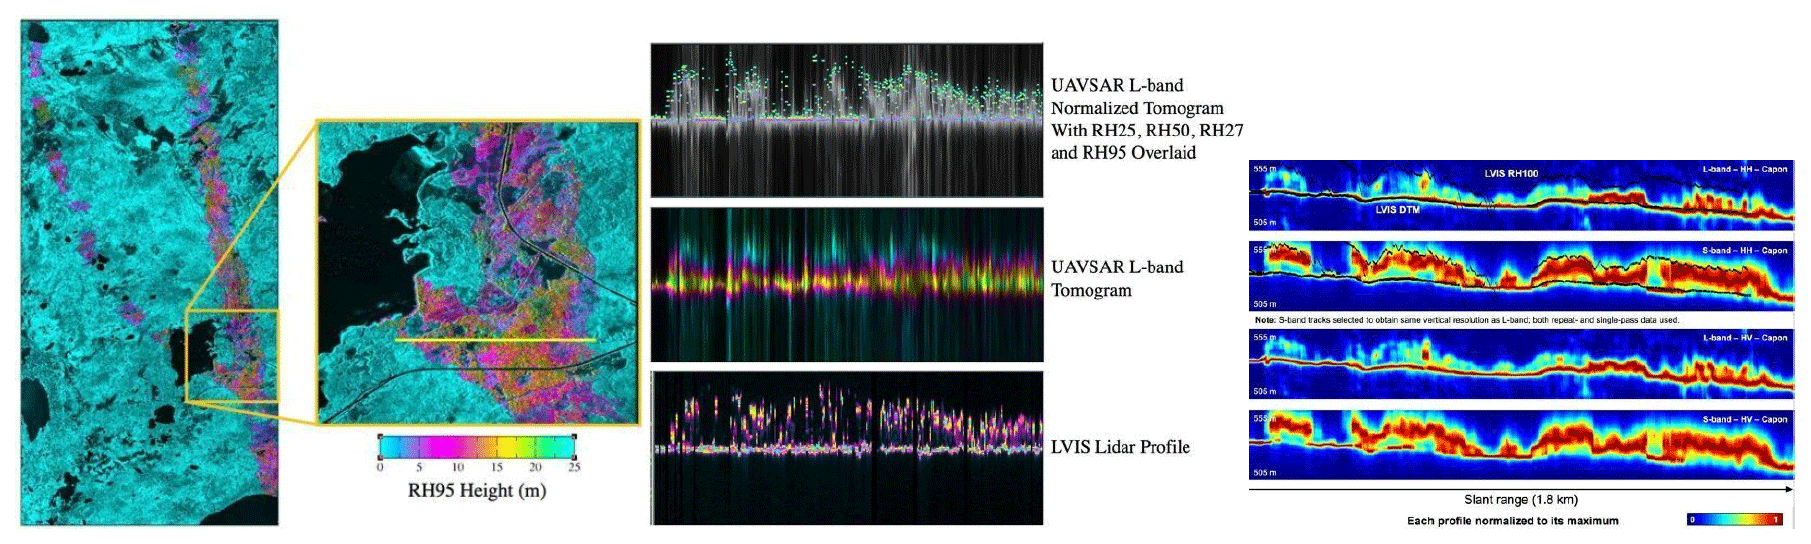
Figure 6On the left, the location of the transect is shown as a yellow line overlaid on UAVSAR imagery in grayscale and LVIS RH95 data in color where UAVSAR L-band, DLR F-SAR L and S-band and LVIS lidar profiles are compared. The center figure shows UAVSAR L-band tomographic profiles along the transect along with the corresponding LVIS lidar profiles. On the right are the corresponding F-SAR L and S-band tomographic profiles. The L-band radar profiles exhibit power concentrated at the base of the canopy, whereas the LVIS lidar data show more return from the middle portion of the canopy. The S-band obtains greater returns in the upper canopy compared to the L-band and shows more uniform scattering within the canopy.
Here we highlight some data sets enabling or derived from the ABoVE L- and P-band airborne SAR acquisitions. They represent the current state of the art for the study of permafrost-affected ecosystems using SAR. The ABoVE science team continues to develop additional products, and the insights from these studies will be published separately. Links to the repositories for each of these data sets are provided below.
5.1 Active layer thickness (ALT)
The Permafrost Dynamics Observatory (PDO) data product estimates seasonal subsidence, active layer thickness (ALT), soil volumetric water content (VWC), and uncertainties at 30 m resolution for 66 flight lines across Alaska and Northwest Canada (Michaelides et al., 2021; Chen et al., 2021, 2023). The PDO retrieval uses L-band synthetic aperture radar (SAR) data acquired by the Uninhabited Aerial Vehicle Synthetic Aperture Radar (UAVSAR) instrument and P-band data acquired by the Airborne Microwave Observatory of Subcanopy and Subsurface (AirMOSS) instrument. The PDO results for each flight line appear in separate NetCDF files. Each line has a spatial resolution of 30 m on the ABoVE common grid, with a width of 22 km based on the swath width of the AirMOSS instrument. The flight lines as a whole cover many ecosystem types and provide north–south and east–west gradients in ALT and soil moisture across the ABoVE domain (https://daac.ornl.gov/cgi-bin/dsviewer.pl?ds_id=1796, last access: 19 April 2024).
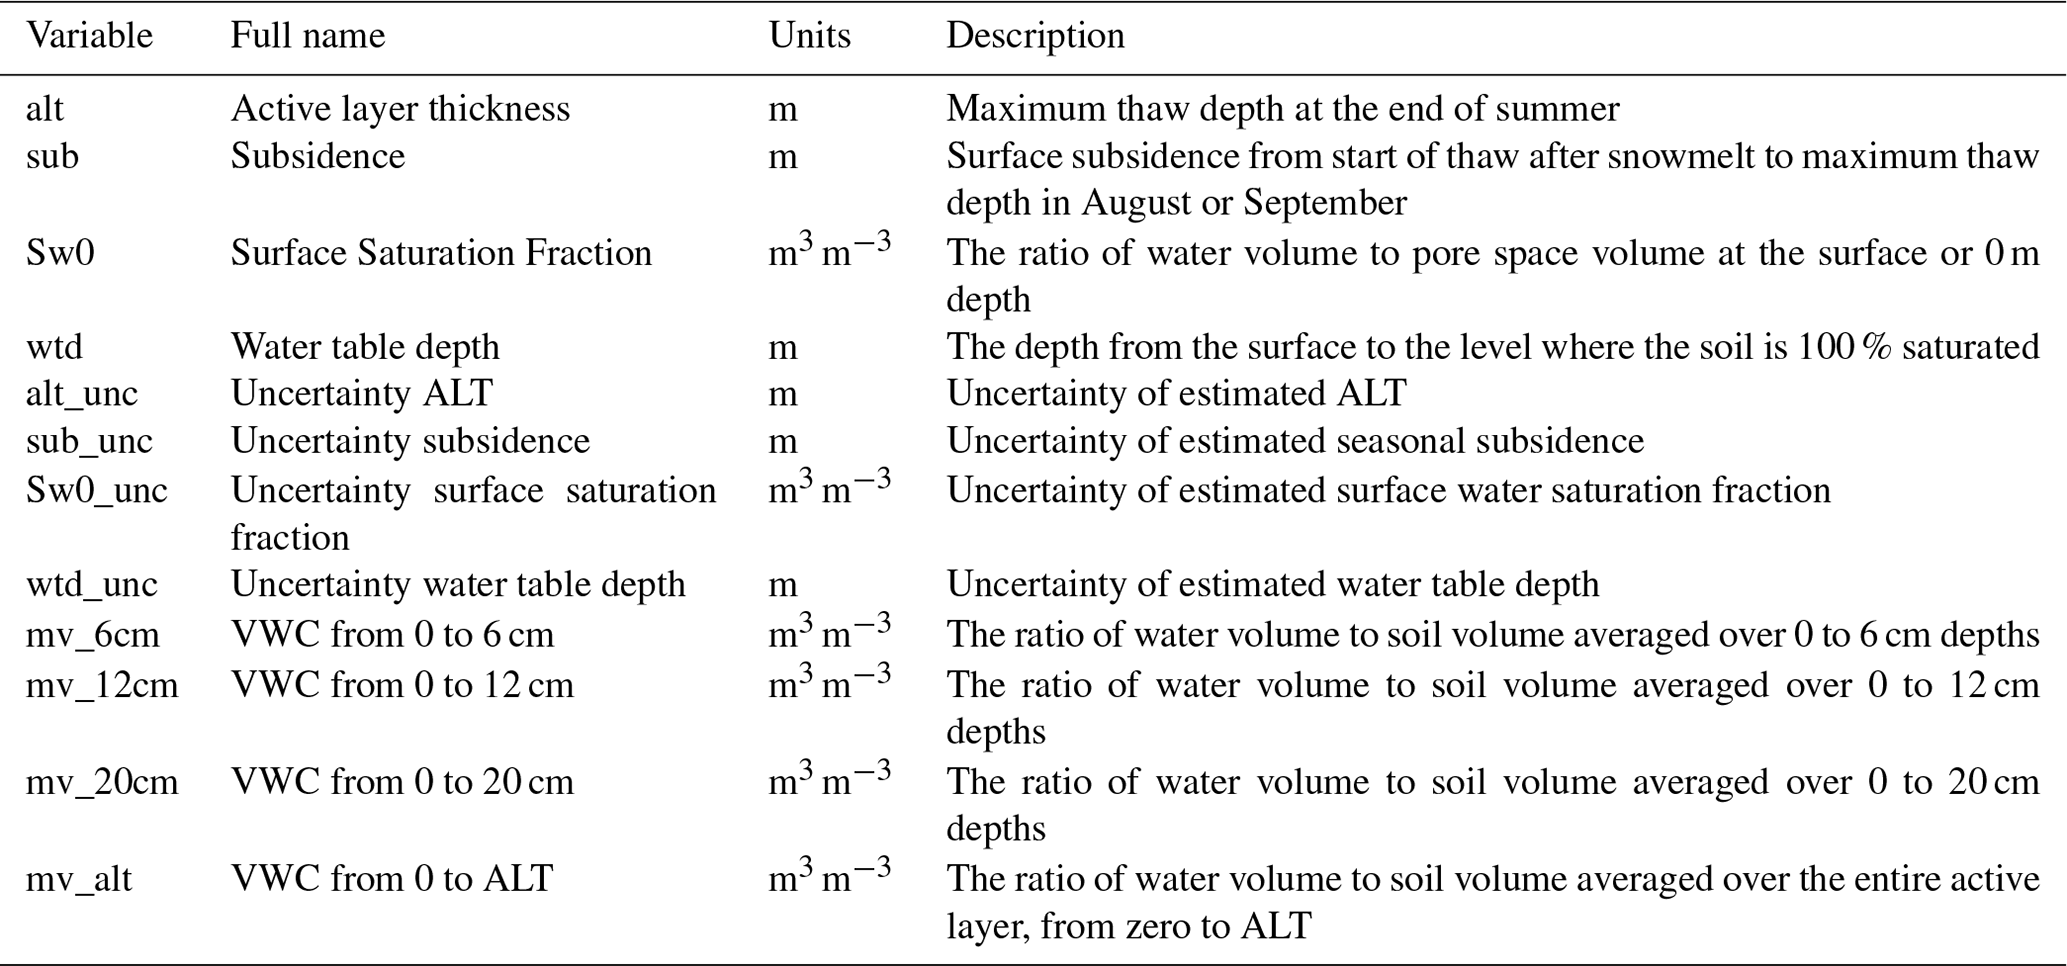
Table 1 defines all variables in PDO data files. The first eight variables represent the four primary outputs of the PDO algorithm and associated uncertainties. Subsidence and ALT represent one-time measurements for the 2017 thaw season (Schaefer et al., 2021a, b). VWC, defined as the ratio of water volume to total soil volume, represents soil moisture at maximum thaw for 2017. We assume a vertical profile of VWC and estimate surface saturation fraction (Sw0) and water table depth (wtd), the parameters that define the exact shape of the assumed profile. The product includes a Python script that will create a map of VWC averaged over any user specified depth range. We included maps of VWC averaged over depth ranges of handheld soil moisture probes commonly used in ABoVE fieldwork.
Table 1Variables in the Permafrost Dynamics Observatory (PDO) data files.
5.2 Alaska active layer and soil moisture properties from airborne P-band SAR
Chen et al. (2019a) synthesized the P-band polarimetric synthetic aperture radar (PolSAR) data collected in August and October of 2014 and 2015 during the AirMOSS EV-S1 investigation with the ABoVE P-band measurements collected in August and October of 2017 to estimate soil geophysical properties over 12 study sites in northern Alaska (see Fig. S2 in the Supplement). Soil properties reported include the ALT, soil dielectric constant, soil moisture profile, surface roughness, and their respective uncertainty estimates at 30 m spatial resolution (https://doi.org/10.3334/ORNLDAAC/1657, Chen et al., 2019b; https://doi.org/10.3334/ORNLDAAC/1676, Schaefer et al., 2019; https://doi.org/10.3334/ORNLDAAC/1903 Schaefer et al., 2021a; https://doi.org/10.3334/ORNLDAAC/1796 Schaefer et al., 2021b).
Most of the study sites are located within the continuous permafrost zone and where the aboveground vegetation consisting mainly of dwarf shrub and tussock, sedge, or moss tundra has a minimal impact on P-band radar backscatter. These data were used as inputs to the L-band ReSALT data set described in Sect. 5.1.
5.3 In situ soil moisture and thaw depth measurements
In situ measurements of soil moisture, thaw depth, and other quantities are essential to calibrate and validate ABoVE SAR retrievals. The ABoVE team established a set of standardized measurement protocols for field plots to ensure uniform data products and quality in measurements collected by different groups across the ABoVE domain and across multiple years. Numerous teams collected in situ data during the initial 2017 airborne campaign, with more targeted field acquisitions conducted in 2018 and 2019 (Bourgeau-Chavez et al., 2019a, b; Bakian-Dogaheh et al., 2020; Clayton et al., 2021; Loboda et al., 2021).
Bourgeau-Chavez et al. (2019a, b) collected soil moisture at 6, 12, 20, and 50 cm depths; ALT; soil profiles; and biophysical measurements of aboveground canopy and ground layers in the Great Slave Lake Region (C4). These data provide vegetation community characteristics and biophysical data collected in 2018 from areas that were burned by wildfire in 2014 and 2015 and from nine unburned validation sites. Vegetation data include vegetation inventories, ground cover, regrowth, tree diameter and height, and woody seedling/sprouting data at burned sites and similar vegetation community characterization at unburned validation sites. Additional measurements included soil moisture, collected for validation of the UAVSAR airborne collection, and depth to frozen ground at the nine unburned sites. This 2018 fieldwork completes 4 years of field sampling at the wildfire areas.
The measurements by Bakian-Dogaheh et al. (2020a, b) included soil dielectric properties, temperature, and moisture profiles; active layer thickness (ALT); and measurements of soil organic matter, bulk density, porosity, texture, and coarse root biomass from the surface to permafrost table in soil pits at selected sites along the Dalton Highway in Northern Alaska (A1). Their investigation sites included Franklin Bluffs, Sagwon, Happy Valley, Ice Cut, and Imnavait Creek. Measurements collected at Franklin Bluffs were concurrent with an August 2018 ABoVE L-band flight (https://doi.org/10.3334/ORNLDAAC/1759, Bakian-Dogaheh, 2020a).
Loboda et al. (2022) collected field measurements from unburned sites and single and repeated burns in the Noatak River valley and the Seward Peninsula regions of the Alaska tundra in July–August in the years 2016–2018. The data include ocular assessment of vegetation cover, soil moisture at 6 and 12 cm, soil temperature at 10 cm, organic soil thickness, thaw depth, and weather measurements (https://doi.org/10.3334/ORNLDAAC/1919, Loboda et al., 2022).
The strong partnership between the ABoVE and NGEE-Arctic projects also resulted in coordinated same-day acquisition of airborne L- and P-band SAR data with in situ soil moisture and thaw depth measurements over the NGEE-Arctic study site at Barrow (Utqiaġvik), AK, and the Seward Peninsula watersheds near Teller, AK; Council, AK; and Kougarok, AK (Wilson et al., 2018, 2021, 2022; Dann et al., 2022; Lathrop et al., 2022). These data provide critical calibration for the ABoVE SAR retrievals under continuous (Utqiaġvik) and discontinuous (Seward Peninsula) permafrost conditions. Version 2 (V2) of the in situ soil moisture and thaw depth measurements covering years 2017–2019 was released in November 2020 (https://doi.org/10.5440/1423892, Wilson et al., 2018, Ver. 2, https://www.osti.gov/biblio/1423892, Wilson et al., 2021; https://doi.org/10.5440/1856042, Wilson et al., 2022; https://doi.org/10.5440/1854940, Lathrop et al., 2022.).
Miller et al. (2019) described the overall ABoVE airborne campaign design strategy and anticipated airborne sensor synergies. Here, we highlight three SARs – AirSWOT (NASA), F-SAR (DLR), and LS-ASAR (ISRO) – and two lidars – LVIS (NASA) and G-LiHT (NASA) – whose acquisitions in the ABoVE domain were specifically designed to complement and leverage the ABoVE L- and/or P-band SAR acquisitions. Many other airborne sensor synergies are being exploited by the ABoVE science team and are reported separately.
6.1 AirSWOT
NASA's AirSWOT airborne instrument suite has been developed to support the Surface Water and Ocean Topography (SWOT) mission. The heart of AirSWOT is the Ka-band SWOT Phenomenology Airborne Radar (KaSPAR). KaSPAR collects two swaths of across-track interferometry data: one swath from nadir to 1 km and a second swath that extends from 1 to 5 km off-nadir. AirSWOT flight lines for ABoVE were designed to center the AirSWOT swath on the center of the P-band swath for maximum overlap. KaSPAR is complemented by a high-resolution color-infrared (CIR) digital camera system (Kyzivat et al., 2019, 2020) and a Precision Inertial Measurement Unit (IMU) for accurate attitude and positioning information. In 2015 AirSWOT made pre-ABoVE deployments to the Tanana River valley (Altenau et al., 2017) and the Yukon Flats (Pitcher et al., 2019a, b) in Region A3.
In 2017, AirSWOT deployed to acquire early-season (May–June) and late-season (August) WSEs across the ABoVE domain. Figure 7 shows the concentration of AirSWOT lines in wetlands complexes in the boreal forest, across the Canadian Shield, along the Mackenzie River valley, and into the Arctic tundra. All of these regions contain overlapping L- and P-band acquisitions. Of special interest are the lines in the Peace–Athabasca Delta (36000: PADelE and 18035: PADelW) and the Yukon Flats (21508: YFlatW, 21609: YflatE, and 04707: FtYuko) and Trail Valley Creek, NT (01703: TukHwy), where extensive on-water measurements were made (Pitcher et al., 2020). Future joint analyses of the Ka- and L-band data will highlight the advances possible in pan-Arctic hydrology from the upcoming NISAR and SWOT missions.
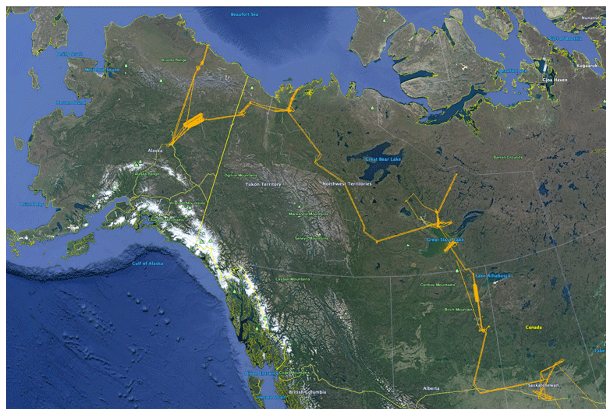
Figure 7AirSWOT flight lines acquired during the 2017 ABoVE airborne campaign sampled wetlands ranging from the Arctic Ocean coast to the southern boreal forest. AirSWOT's Ka-band acquisitions were designed to overlap with the L- and P-band SAR near-field acquisitions (See Fig. 1). © Google Earth.
6.2 F-SAR
The German Space Agency (DLR) developed the F-SAR instrument as an advanced airborne SAR test bed for technology and remote sensing applications (Reigber et al., 2013). F-SAR operates fully polarimetrically at X-, C-, S-, L-, and P-bands and features single-pass polarimetric interferometric SAR (PolInSAR) capabilities in X- and S-bands (Reigber et al., 2013). The radar covers an off-nadir angle range of 25 to 60° and provides sub-meter-scale spatial resolution from flight altitudes up to 6000
During August 2018 and April 2019, F-SAR was deployed to northern Canada as part of DLR's permafrost airborne SAR experiment (PermASAR). It was configured in X-, C-, S-, and L–band mode and flew on board a Dornier DO 228-212 research aircraft. Measurements were acquired from ∼4500 Coordinated TomoSAR transects were flown over the BERMS site in the southern boreal forest on 18 August (UAVSAR) and 23 August (F-SAR). Preliminary results (Hensley et al., 2020) are summarized in Sect. 4. F-SAR also acquired data over the Scotty Creek watershed, flux towers, and areas of interest (AOI; Fig. 8); the Smith Creek flux tower (Wrigley, NT); Baker Lake; Havipak Creek; Trail Valley Creek; and Herschel Island, providing extensive opportunities to cross-compare F-SAR and the ABoVE SAR acquisitions.
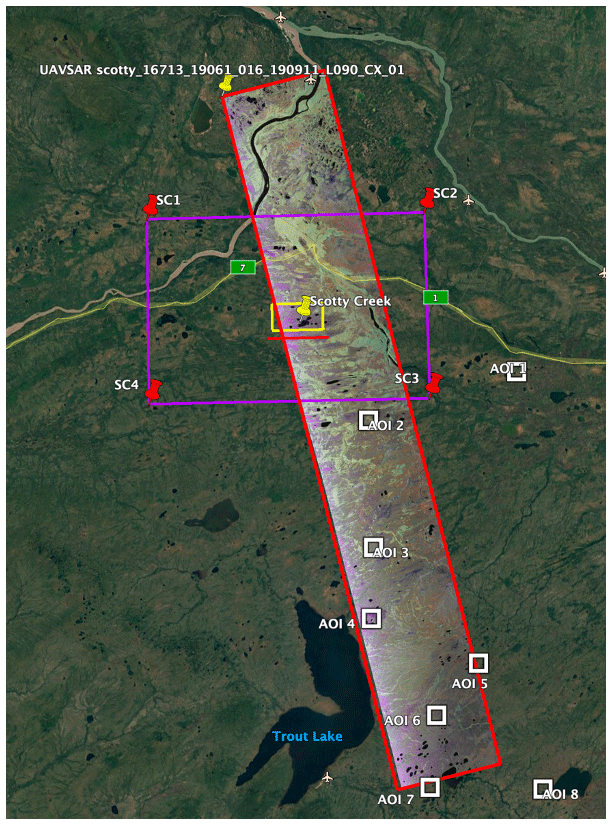
Figure 8Overlap of the F-SAR acquisition at Scotty Creek, NT (yellow box), and the ABoVE L-band SAR line 16713 (red box and polarized SAR false color). The ABoVE line also captures Scotty Creek AOI 2–6 (see Region C3 details, Sect. 5.3). The SAR data will complement and benefit from the extensive ground-based data acquired in this area (Quinton et al., 2019). © Google Earth.
6.3 LS-ASAR (ISRO)
The Indian Space Research Organisation (ISRO) and NASA are jointly developing the NASA-ISRO Synthetic Aperture Radar (NISAR), which will map Earth's surface in L-band and S-band every 12 d (Rosen et al., 2017). As a precursor to the NISAR mission, ISRO has developed a L- and S-band airborne SAR (LS-ASAR) to prepare the community to maximize the scientific and societal benefits of NISAR data (Ramanujam et al., 2016; Ramanujam and Mehra, 2019; Mehra and Ramanujam, 2019). LS-ASAR operates in dual-, quad-, and hybrid-polarization modes in both L- and S-bands. It covers incidence angles from 24–77°, with swaths ranging from 5.5 to 15 km.
In December 2019 LS-ASAR flew a series of Arctic sea ice sorties from Fairbanks, AK. During this deployment, LS-ASAR also acquired data over a number of the ABoVE flight lines in Regions A1 (North Slope) and A3 (eastern Interior) as well as over a number of glacier sites in the Alaska Range. The acquisitions may be accessed via the NASA and ISRO ASAR campaign page (https://uavsar.jpl.nasa.gov/cgi-bin/deployment.pl?id=L20191101, last access: 19 April 2024) and are summarized in Fig. 9. These data provide snow-on coverage that was a known deficiency of previous ABoVE airborne campaigns. Additionally, the LS-ASAR data extend coverage of these regions to S-band.
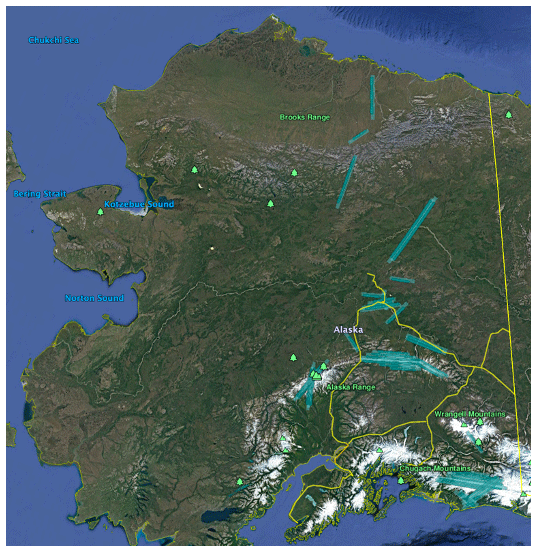
Figure 9L- and S-band SAR lines acquired over Alaska during the December 2019 ASAR campaign. ASAR flight lines on the North Slope, in the Yukon Flats, and in the western Interior exactly overlap ABoVE flight lines. These early-winter acquisitions provide a preliminary look at cold-season SAR data that will be explored in greater detail in the planned ABoVE-SnowEx campaign. © Google Earth.
6.4 LVIS
The Land, Vegetation, and Ice Sensor (LVIS) is an airborne, full-waveform scanning laser altimeter which produces topographic maps with decimeter accuracy as well as vegetation vertical height and structure measurements (Blair et al., 1999; Blair and Hofton, 1999). Flight lines for LVIS (∼1.4 km swath) were slaved to the centerline of the P-band swath during ABoVE, except where deviations were required to capture critical ground sites. LVIS-C (classic configuration) was deployed in 2017 aboard a B-200 aircraft and achieved limited coverage (Fig. 10, left panel). During 2019, the new LVIS Facility instrument (LVIS-F) and LVIS-C were deployed on the NASA Gulfstream V and achieved coverage of all legacy SAR lines (Fig. 10, right panel).
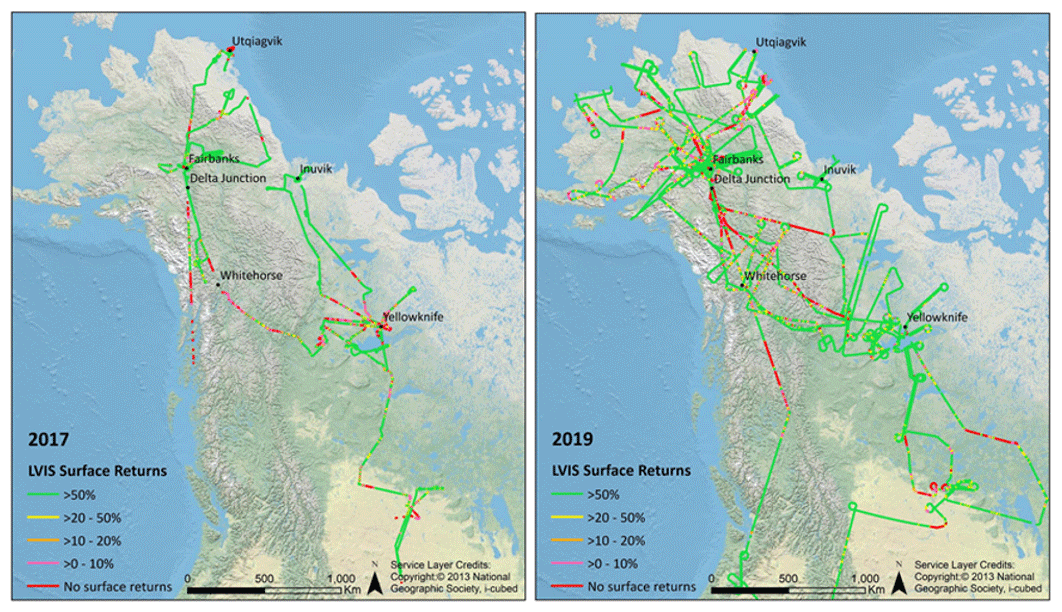
Figure 10Flight lines for the LVIS 2017 flights (left) and 2019 flights (right) were designed to overlap with the near-field portions of the L-band and P-band SAR swaths to maximize opportunities for synergistic science. Aircraft and weather limited coverage during the 2017 campaign, but complete coverage of the SAR flight lines, was achieved in 2019. These data will enable studies of SAR–lidar fusion over the Arctic–boreal regions as a precursor to NISAR/IceSat-2 studies. © National Geographic Society.
LVIS' unique capability for measuring the sub-meter topography beneath boreal forest canopies complemented the TomoSAR acquisitions over Delta Junction, AK and the BERMS site in northern Saskatchewan (Hensley et al., 2020; Sect. 4). LVIS altimetry will also prove valuable in analyses of such variables as permafrost degradation, active layer thickness, and water surface elevation; however, LVIS' significantly narrower swath limits the spatial extent over which these analyses may be performed.
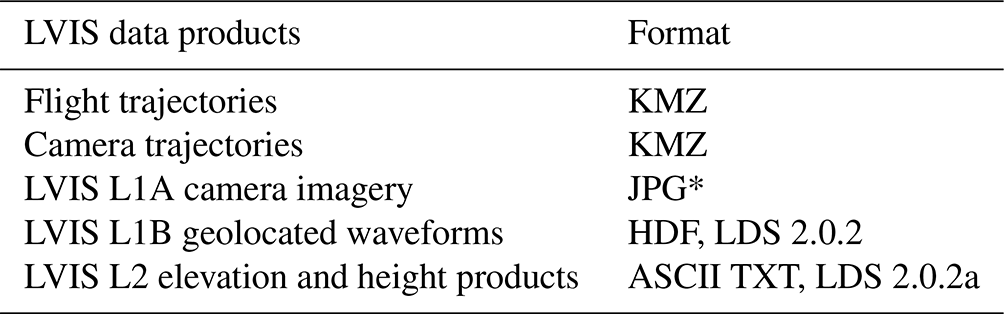
In June–July 2017, NASA's LVIS Classic was deployed to sites in northern Canada and Alaska as part of the ABoVE 2017 airborne campaign. During the 4-week deployment of LVIS-F, a total of 15 flights were flown over diverse science targets based out of multiple airports in Canada and Alaska. Data are available in both Level 1B and Level 2 formats (Table 2). The Level 1b data files contain the geolocated laser waveform data for each laser footprint. The Level 2 data files contain canopy top and ground elevations and relative heights derived from the Level 1b data. ABoVE LVIS L1B Geolocated Return Energy Waveforms, Version 1 (Blair and Hofton, 2018a) and L2 Geolocated Surface Elevation Product, Version 1 (Blair and Hofton, 2018b), may be obtained from the National Snow and Ice Data Center via https://doi.org/10.5067/UMRAWS57QAFU (Blair and Hofton 2018a) and https://doi.org/10.5067/IA5WAX7K3YGY (Blair and Hofton, 2018b), respectively.
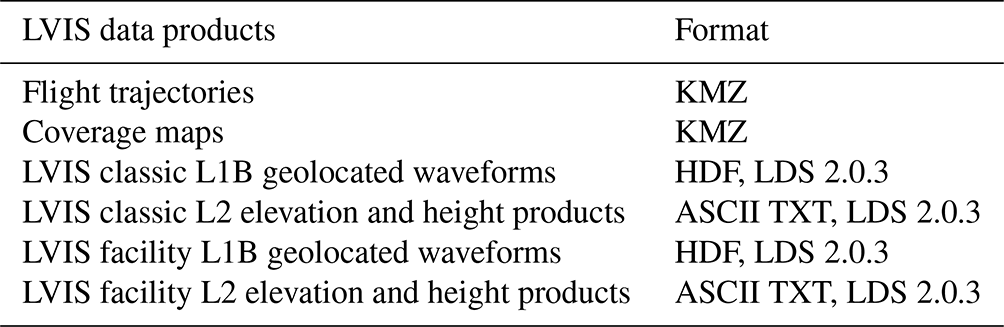
In July–August 2019, the NASA LVIS Facility and LVIS Classic were deployed to sites in northern Canada and Alaska as part of NASA's ABoVE 2019 airborne campaign. The increased range and endurance of the Gulfstream V platform enabled extensive sampling, including all L-band SAR lines, multiple IceSAT-2 underflights, and numerous ABoVE field sites. The available data products are given in Table 3.
6.5 G-LiHT
Zhao et al. (2022) used ABoVE airborne L- and P-band SAR to map boreal forest species and canopy height in the Tanana Valley State Forest (TVSF) near Delta Junction, AK. They employed machine learning (random forests) to train separate regression models for canopy height mapping and a classification model for forest species mapping. Data derived from NASA's Goddard lidar, Hyperspectral, and Thermal Imager (G-LiHT) system (Cook et al., 2013) were treated as ground truth for the canopy height model (CHM). Forest species prediction were referenced against (TVSF) timber inventory and Forest Inventory and Analysis (FIA) data. The experimental results show the proposed method yields a root mean square error of 1.90 m for forest height estimation and overall accuracy of 79.5 % for forest species classification. A significant finding was that PolSAR decomposition parameters, such as volume scattering and entropy, strongly influenced the canopy height estimates. Interestingly, topography played a crucial role in the species classification.
Links to the ABoVE L- and P-band SAR products, supporting data, derived products, and ancillary measurements are provided in the Supplement. Formal citations to all DOIs are provided in the References. The L- and P-band SAR data may be found at the JPL UAVSAR data portal, https://uavsar.jpl.nasa.gov/cgi-bin/data.pl (last access: 19 April 2024). L-band data may also be accessed via the UAVSAR portal at the Alaska SAR Facility (ASF) DAAC (https://asf.alaska.edu/data-sets/sar-data-sets/uavsar/, last access: 19 April 2024), while AirMOSS P-band data may be accessed via the ORNL DAAC, https://daac.ornl.gov/get_data/#projects (last access: 19 April 2024), select “AirMOSS”.
Miller et al. (2023; https://doi.org/10.3334/ORNLDAAC/2150) provide a detailed description of all 80 SAR flight lines and how each fits into the ABoVE experimental design. Extensive maps, tables, and hyperlinks give direct access to every flight plan as well as individual flight lines. It is a guide to enable interested readers to fully explore the ABoVE L- and P-band SAR data. Key supporting data sets include https://doi.org/10.3334/ORNLDAAC/1676 (Schaefer et al., 2021b), https://doi.org/10.3334/ORNLDAAC/1657 (Chen et al., 2019b), https://doi.org/10.3334/ORNLDAAC/1759 (Bakian-Dogaheh et al., 2020a), https://doi.org/10.5440/1423892 (Wilson et al., 2018), https://doi.org/10.5440/1854940 (Lathrop et al., 2022), and https://doi.org/10.3334/ORNLDAAC/1582 (Hoy et al., 2018).
The ABoVE project conducted airborne L-band PolInSAR surveys in 2017, 2018, 2019 and 2022 across Alaska and northwestern Canada. These were complemented by a P-band PolInSAR survey in 2017 along the same transects. This time series provides a powerful data set with which to evaluate the state of permafrost, active layer thickness, soil moisture, boreal forest structure, aboveground biomass, and water surface elevation. Additional studies leverage the PolInSAR data to address fire disturbance and recovery, thermokarst feature development, and retrogressive permafrost thaw megaslumps. Many of these analyses are in progress and will be published separately.
Miller et al. (2023) provide extensive, fully hyperlinked notes on the airborne SAR data. Researchers may discover these data via daily sorties and/or individual flight lines. Alternatively, they may be explored via the interactive map at the JPL UAVSAR data portal (https://uavsar.jpl.nasa.gov/cgi-bin/data.pl, last access: 19 April 2024), which provides links to the individual flight line data, maps, and related flight plans that acquired data over one or more of the individual flight lines. We have also identified the ground-based anchor points for each flight line to facilitate comparisons with those data. Calibration and validation data sets as well as many derived products produced by the ABoVE Science Team may be found at the Arctic Boreal Vulnerability Experiment (ABoVE) landing page at the ORNL DAAC (https://daac.ornl.gov/cgi-bin/dataset_lister.pl?p=34, last access: 19 April 2024).
The example studies (Sects. 4 and 5) and multi-instrument synergies (Sect. 6) described here are only a small portion of the studies currently being undertaken by the ABoVE Science Team and the SAR Working Group. We anticipate many new and innovative uses of the L-band and P-band SAR data as the ABoVE team expands its range of synthesis activities in Phase 3.
The ABoVE L-band SAR flights planned for 2020 and 2021 were postponed due to the global COVID-19 pandemic and safety considerations; however, flights were resumed in 2022, and we anticipate at least one more thaw season campaign in 2024. Finally, we note that the data and analyses discussed here set the stage for the upcoming NISAR mission (expected launch in 2024). NISAR will deliver global L- and S-band imagery with a 12 d revisit. Its emphasis on snow- and ice-covered surfaces has obvious applications in the ABoVE domain, and its global coverage will allow researchers to test the methods developed for the ABoVE domain across the pan-Arctic. Beyond NISAR, NASA is studying architectures for the Surface Deformation and Change (SDC) Earth System Observatory Mission and ESA are developing the Rose-L Copernicus expansion mission. SDC and Rose-L are also envisioned as L-band sensors. NISAR, SDC, and Rose-L will all benefit from the ABoVE SAR studies, algorithmic advances, and lessons learned.
The Supplement contains detailed descriptions of all L-band flight lines, as well as tables with hyperlinks to all L-band lines and sorties. Additionally, the Supplement includes tables and links to the P-band flight lines acquired during the ABoVE campaigns and to all Legacy L-band and P-band flight lines. The SI is identical to the file 〈Summary ABoVE L- & P-Band SAR Surveys – hyperlinked.pdf〉 that may be found in the /data folder of the uncompressed data download from Miller et al. (2023; https://doi.org/10.3334/ORNLDAAC/2150). The supplement related to this article is available online at: https://doi.org/10.5194/essd-16-2605-2024-supplement.
SJG, CEM, PCG, and the ABoVE Science Definition Team developed the preliminary ABoVE Implementation Plan; this was updated by SJG, CEM, PCG, and the ABoVE Science Team. CEM, PCG, and EH developed the initial flight lines based on the ABoVE Implementation Plan and consultations with the ABoVE Science Team and partners. NSP translated the notional flight lines into the UAVSAR planning system. NSP, YL, MaM, PCG, ELH, and CEM served as scientist on board during the data acquisition flights. YL, SH, BC, NP and the JPL Suborbital Radar Science and Engineering Team (334F) processed the L- and P-band SAR data. CW, KS, MT, JB, LBC, RHC, MiM, SW, MaM, RJM, TL, LJ, PS, AT, and RD collected calibration–validation (cal/val) field data. CW and SW coordinated ground cal/val data acquisitions at the NGEE-Arctic sites. SH, PS, and NSP performed the TomoSAR analyses, and SH contributed the text and images for Sect. 6. KS, MaM, and the ABoVE SAR Working Group calibrated the L-band SAR data. MaM, AT, and RHC processed the P-band data. NSP and YL coordinated the LS-ASAR flights and the joint BERMS area TomoSAR flights with F-SAR. DS coordinated all data product submissions to the ORNL DAAC. CEM wrote the initial manuscript, and all co-authors contributed to the final version.
The contact author has declared that none of the authors has any competing interests.
Publisher's note: Copernicus Publications remains neutral with regard to jurisdictional claims made in the text, published maps, institutional affiliations, or any other geographical representation in this paper. While Copernicus Publications makes every effort to include appropriate place names, the final responsibility lies with the authors.
The L- and P-band SAR data acquisitions would not have been possible without the indefatigable support of our NASA pilots and flight crews. We thank John McGrath and the NASA AFRC C-20 (N30502) team as well as Derek Rutovic and the NASA JSC G-III (N995NA) team. We also thank the instrument scientists, operators, and data processing team from the JPL Suborbital Radar Science and Engineering Team (334F), who were essential to the successful execution of these experiments and rapid processing of the resulting data products. The fieldwork supporting the SAR campaigns was made possible by the excellent support from Dan Hodkinson, Sarah Sackett, and the ABoVE Logistics Office. Finally, we thank the data curation team at the Oak Ridge Distributed Active Archive Center for their support and expert advice.
This work was supported by the NASA Terrestrial Ecology Program's Arctic Boreal Vulnerability Experiment (ABoVE). Jennifer Baltzer was supported by GNWT CIMP 170 and the Canada Research Chairs program. Laura Bourgeau-Chavez was supported by NASA ABoVE (grant nos. NNX15AT83A and 80NSSC19M0107). Thomas A. Douglas was supported by the Strategic Environmental Research and Development Program (project RC18-1170) and the Environmental Security Technology Demonstration Program (project RC22-7408). Nancy French was supported under grant no. 80NSSC19M0108 from the NASA Terrestrial Ecology Program ABoVE project. Scott J. Goetz received support from NASA (grant no. 80NSSC22K1247). John S. Kimball was supported under the NASA Terrestrial Ecology program (grant no. 80NSSC22K1238). This work was performed in part at the University of Southern California under grants from the National Aeronautics and Space Administration, Science Mission Directorate, Arctic Boreal Vulnerability Experiment program. Kevin Schaefer and Leah K. Clayton were supported by NASA (grant nos. NNX17AC59A and NNX16AH36A) and award 1562619 from the National Science Foundation. A portion of this work was performed at the Jet Propulsion Laboratory, California Institute of Technology, under contract with National Aeronautics and Space Administration (grant no. 80NM0018D0004). Government funding was received.
This paper was edited by Kirsten Elger and reviewed by two anonymous referees.
Allen, B. D., Braun, S. A., Crawford, J. H., Jensen, E. J., Miller, C. E., Moghaddam, M., and Maring, H.: Proposed investigations from NASA's Earth Venture-1 (EV-1) airborne science selections, in: 2010 IEEE International Geoscience and Remote Sensing Symposium, Honolulu, HI, USA, 2010, 2575–2578, https://doi.org/10.1109/IGARSS.2010.5651920, 2010.
Altenau, E. H., Pavelsky, T. M., Moller, D., Lion, C., Pitcher, L. H., Allen, G. H., Bates, P. D., Calmant, S., Durand, M., and Smith, L. C.: AirSWOT measurements of river water surface elevation and slope: Tanana River, AK, Geophys. Res. Lett., 44, 181–189, https://doi.org/10.1002/2016GL071577, 2017.
Bakian-Dogaheh, K., Chen, R. H., Moghaddam, M., Yi, Y., and Tabatabaeenejad, A.: ABoVE: Active Layer Soil Characterization of Permafrost Sites, Northern Alaska, 2018, ORNL DAAC, Oak Ridge, Tennessee, USA, https://doi.org/10.3334/ORNLDAAC/1759, 2020a.
Bakian-Dogaheh, K., Chen, R. H., Moghaddam, M., and Tabatabaeenejad, A.: Electromagnetic scattering behavior of a new organic soil dielectric model for long-wavelength radar retrieval of permafrost active layer soil properties, 2020 IEEE International Geoscience and Remote Sensing Symposium, Virtual Symposium, 26 September–2 October 2020b.
Blair, J. B. and Hofton, M. A.: Modeling laser altimeter return waveforms over complex vegetation using high‐resolution elevation data, Geophy. Res. Lett., 26, 2509–2512, https://doi.org/10.1029/1999GL010484, 1999.
Blair, J. B. and Hofton, M.: ABoVE LVIS L1B Geolocated Return Energy Waveforms, Version 1,NASA National Snow and Ice Data Center Distributed Active Archive Center, Boulder, Colorado USA [data set], https://doi.org/10.5067/UMRAWS57QAFU, 2018a.
Blair, J. B. and Hofton, M.: ABoVE LVIS L2 Geolocated Surface Elevation Product, Version 1, National Snow and Ice Data Center (NSIDC), the LVIS DAAC [data set], https://doi.org/10.5067/IA5WAX7K3YGY, 2018b.
Blair, J. B., Rabine, D. L., and Hofton, M. A.: The Laser Vegetation Imaging Sensor: a medium-altitude, digitisation-only, airborne laser altimeter for mapping vegetation and topography, ISPRS J. Photogramm., 54, 115–122, https://doi.org/10.1016/S0924-2716(99)00002-7, 1999.
Bourgeau-Chavez, L. L., Battaglia, M., Kane, E. S., Cohen, L. M., and Tanzer, D.: ABoVE: Post-Fire and Unburned Vegetation Community and Field Data, NWT, Canada, 2018, ORNL DAAC, https://doi.org/10.3334/ORNLDAAC/1703, 2019a.
Bourgeau-Chavez, L. L., Graham, J. A., Grelick, S. E., French, N. H. F., Battaglia, M., Hansen, D., and Tanzer, D.: ABoVE: Ecosystem Map, Great Slave Lake Area, Northwest Territories, Canada, 1997–2011, ORNL DAAC, https://doi.org/10.3334/ORNLDAAC/1695, 2019b.
Chapin, E., Chau, A., Chen, J., Heavey, B., Hensley, S., Lou, Y., Machuzak, R., and Moghaddam, M.: AirMOSS: An Airborne P-band SAR to measure root-zone soil moisture, in: 2012 IEEE Radar Conference, Atlanta, GA, USA, 7–11 May 2012, 0693–0698, https://doi.org/10.1109/RADAR.2012.6212227, 2012.
Chapin, E., Flores, S., Harcke, L., Hawkins, B. P., Hensley, S., Michel, T. R., Muellerschoen, R. J., Shimada, J. G., Tung, W. W., and Veeramachaneni, C.: AirMOSS: L1 S-0 Polarimetric Data from AirMOSS P-band SAR, BERMS, Canada, 2012–2015, ORNL DAAC, https://doi.org/10.3334/ORNLDAAC/1406, 2018.
Chen, R. H., Bakian-Dogaheh, K., Tabatabaeenejad, A., and Moghaddam, M.: Modeling and Retrieving Soil Moisture and Organic Matter Profiles in the Active Layer of Permafrost Soils From P-Band Radar Observations, IGARSS 2019 – 2019 IEEE International Geoscience and Remote Sensing Symposium, Yokohama, Japan, 2019, 10095–10098, https://doi.org/10.1109/IGARSS.2019.8899802, 2019a.
Chen, R. H., Tabatabaeenejad, A., and Moghaddam, M.: ABoVE: Active Layer and Soil Moisture Properties from AirMOSS P-band SAR in Alaska, ORNL DAAC [data set], https://doi.org/10.3334/ORNLDAAC/1657, 2019b.
Chen, R. H., Michaelides, R. J., Zhao, Y., Huang, L., Wig, E., Sullivan, T. D., Parsekian, A. D., Zebker, H. A., Moghaddam, M., and Schaefer, K. M.: Permafrost Dynamics Observatory: Retrieval of Active Layer Thickness and Soil Moisture from Airborne Insar and Polsar Data, in: 2021 IEEE International Geoscience and Remote Sensing Symposium IGARSS, Brussels, Belgium, 2021, https://doi.org/10.1109/IGARSS47720.2021.9554288, 1444–1447, 2021.
Chen, R. H., Michaelides, R. J., Zhao, Y., Huang, L., Wig, E., Sullivan, T. D., Parsekian, A. D., Zebker, H. A., Moghaddam, M., and Schaefer, K. M.: Permafrost Dynamics Observatory (PDO): 2. Joint Retrieval of Permafrost Active Layer Thickness and Soil Moisture From L‐Band InSAR and P‐Band PolSAR, Earth and Space Science, 10, e2022EA002453, https://doi.org/10.1029/2022EA002453, 2023.
Clayton, L. K., Schaefer, K., Battaglia, M. J., Bourgeau-Chavez, L., Chen, J., Chen, R. H., Chen, A., Bakian-Dogaheh, K., Grelik, S., Jafarov, E., and Liu, L.: Active layer thickness as a function of soil water content, Environ. Res. Lett., 16, 055028, https://doi.org/10.1088/1748-9326/abfa4c, 2021.
Cook, B. D., Corp, L. W., Nelson, R. F., Middleton, E. M., Morton, D. C., McCorkel, J. T., Masek, J. G., Ranson, K. J., Ly, V., and Montesano, P. M.: NASA Goddard's Lidar, Hyperspectral and Thermal (G-LiHT) airborne imager, Remote Sens.-Basel, 5, 4045–4066, https://doi.org/10.3390/rs5084045, 2013.
Dann, J., Bennett, K. E., Bolton, W. R., and Wilson, C. J.: Factors Controlling a Synthetic Aperture Radar (SAR) Derived Root-Zone Soil Moisture Product over The Seward Peninsula of Alaska, Remote Sens.-Basel, 14, 4927, https://doi.org/10.3390/rs14194927, 2022.
Du, J., Kimball, J. S., and Moghaddam, M.: Theoretical Modeling and Analysis of L- and P-band Radar Backscatter Sensitivity to Soil Active Layer Dielectric Variations, Remote Sens.-Basel, 7, 9450–9472, https://doi.org/10.3390/rs70709450, 2015.
French, N. H. F., Graham, J. A., Bourgeau-Chavez, L. L., and Whitman, E.: ABoVE: Burn Severity of Soil Organic Matter, Northwest Territories, Canada, 2014–2015, ORNL DAAC, https://doi.org/10.3334/ORNLDAAC/1694, 2020.
Goetz, S. J., Miller, C. E., Griffith, P. C., Chatterjee, A., Boelman, N., Bourgeau-Chavez, L., Butman, D., Epstein, H., Fisher, J., French, N., Hoy, E., Kimball, J. S., Larson, E., Loboda, T., Mack, M., Moghaddam, M., Montesano, P., Prugh, L., Rawlins, M., Rocha, A. V., Rogers, B. M., and Schaefer, K.: An overview of NASA’s Arctic Boreal Vulnerability Experiment (ABoVE): An integrated research campaign to assess ecosystem vulnerability and its implications within the Arctic and boreal domain, Environmental Research Letters (ABoVE Special Collection), Manuscript ERL-112259, in review, 2022.
Hensley, S., Oveisgharan, S., Saatchi, S., Simard, M., Ahmed, R., and Haddad, Z.: An error model for biomass estimates derived from polarimetric radar backscatter, IEEE T. Geosci. Remote, 52, 4065–4082, 2014.
Hensley, S., Lou, Y., Michel, T., Muellerschoen, R., Hawkins, B., Lavalle, M., Pinto, N., Reigber, A., and Pardini, M.: UAVSAR PolInSAR and tomographic experiments in Germany, in: 2016 IEEE International Geoscience and Remote Sensing Symposium (IGARSS), Beijing, China, July 2016, 7517–7520, https://doi.org/10.1109/IGARSS.2016.7730960, 2016.
Hensley, S., Chapman, B., Lavalle, M., Hawkins, B., Riel, B., Michel, T., Muellerschoen, R., Lou, Y., and Simard, M.: UAVSAR L-Band and P-Band Tomographic Experiments in Boreal Forests, IGARSS 2018 – 2018 IEEE International Geoscience and Remote Sensing Symposium, Valencia, Spain, 2018, 8679–8682, https://doi.org/10.1109/IGARSS.2018.8518784, 2018.
Hensley, S., Ahmed, R., Chapman, B., Hawkins, B., Lavalle, M., Pinto, N., Pardini, M., Papathanassiou, K., Siqueria, P., and Treuhaft, R.: Boreal Forest Radar Tomography at P, L and S-Bands at Berms and Delta Junction, IGARSS 2020 – 2020 IEEE International Geoscience and Remote Sensing Symposium, Waikoloa, HI, USA, 2020, 96–99, https://doi.org/10.1109/IGARSS39084.2020.9323337, 2020.
Hinzman, L. D., Deal, C. J., McGuire, A. D., Mernild, S. H., Polyakov, I. V., and Walsh, J. E.: Trajectory of the Arctic as an integrated system, Ecol. Appl., 23, 1837–1868, https://doi.org/10.1890/11-1498.1, 2013.
Holloway, J. E., Lewkowicz, A. G., Douglas, T. A., Li, X., Turetsky, M. R., Baltzer, J. L., and Jin, H.: Impact of wildfire on permafrost landscapes: A review of recent advances and future prospects, Permafrost Periglac., 31, 371–382, https://doi.org/10.1002/ppp.2048, 2020.
Hoy, E. E., Griffith, P., Miller, C. E., and ABoVE Science Team: ABoVE: Directory of Field Sites Associated with 2017 ABoVE Airborne Campaign, ORNL DAAC [data set], https://doi.org/10.3334/ORNLDAAC/1582, 2018.
Kokelj, S. V., Lacelle, D., Lantz, T. C., Tunnicliffe, J., Malone, L., Clark, I. D., and Chin, K. S.: Thawing of massive ground ice in mega slumps drives increases in stream sediment and solute flux across a range of watershed scales, J. Geophys. Res.-Earth, 118, 681–692, https://doi.org/10.1002/jgrf.20063, 2013.
Kokelj, S. V., Tunnicliffe, J., Lacelle, D., Lantz, T. C., Chin, K. S., and Fraser, R.: Increased precipitation drives mega slump development and destabilization of ice-rich permafrost terrain, northwestern Canada, Glob. Planet. Change, 129, 56–68, https://doi.org/10.1016/j.gloplacha.2015.02.008, 2015.
Kyzivat, E. D., Smith, L. C., Pitcher, L. H., Fayne, J. V., Cooley, S. W., Cooper, M. G., Topp, S. N., Langhorst, T., Harlan, M. E., Horvat, C., Gleason, C. J., and Pavelsky, T. M.: A High-Resolution Airborne Color-Infrared Camera Water Mask for the NASA ABoVE Campaign, Remote Sens.-Basel, 11, 2163, https://doi.org/10.3390/rs11182163, 2019.
Kyzivat, E. D., Smith, L. C., Pitcher, L. H., Fayne, J. V., Cooley, S. W., Cooper, M. G., Topp, S., Langhorst, T., Harlan, M. E., Gleason, C. J., and Pavelsky, T. M.: ABoVE: AirSWOT Water Masks from Color-Infrared Imagery over Alaska and Canada, 2017, ORNL DAAC, https://doi.org/10.3334/ORNLDAAC/1707, 2020.
Lantz, T. C. and Turner, K. W.: Changes in lake area in response to thermokarst processes and climate in Old Crow Flats, Yukon, J. Geophys. Res.-Biogeo., 120, 513–524, https://doi.org/10.1002/2014JG002744, 2015.
Lathrop, E., Nutt, M., Wilson, C., Bolton, R., Perkins, G., and Harris, R.: Soil moisture, physical and chemical properties coincident with airborne SAR data collections for 2017 and 2019, Seward Peninsula, Alaska, Next Generation Ecosystem Experiments Arctic Data Collection, Oak Ridge National Laboratory, U.S. Department of Energy, Oak Ridge, Tennessee, USA [data set], https://doi.org/10.5440/1854940, 2022.
Le Toan, T., Quegan, S., Davidson, M. W. J., Balzter, H., Paillou, P., Papathanassiou, K., Plummer, S., Rocca, F., Saatchi, S., Shugart, H., and Ulander, L.: The BIOMASS mission: Mapping global forest biomass to better understand the terrestrial carbon cycle, Remote Sens. Environ., 115, 2850–2860, https://doi.org/10.1016/j.rse.2011.03.020, 2011.
Loboda, T. V., Jenkins, L. K., Chen, D., He, J., and Baer, A.: Burned and Unburned Field Site Data, Noatak, Seward, and North Slope, AK, 2016–2018, ORNL DAAC, Oak Ridge, Tennessee, USA, https://doi.org/10.3334/ORNLDAAC/1919, 2022.
Magagi, R., Berg, A. A., Goita, K., Belair, S., Jackson, T. J., Toth, B., Walker, A., McNairn, H., O'Neill, P. E., Moghaddam, M., Gherboudj, I., Colliander, A., Cosh, M. H., Burgin, M., Fisher, J. B., Kim, S.-B., Mladenova, I., Djamai, N., Rousseau, L.-P. B., Belanger, J., Shang, J., and Merzouki, A.: Canadian Experiment for Soil Moisture in 2010 (CanEx-SM10): Overview and Preliminary Results, IEEE T. Geosci. Remote, 51, 347–363, https://doi.org/10.1109/TGRS.2012.2198920, 2013.
McGuire, A. D., Anderson, L. G., Christensen, T. R., Dallimore, S., Guo, L., Hayes, D. J., Heimann, M., Lorenson, T. D., Macdonald, R. W., and Roulet, N.: Sensitivity of the carbon cycle in the Arctic to climate change, Ecol. Monogr., 79, 523–555, https://doi.org/10.1890/08-2025.1, 2009.
Meddens, A. J. H., Vierling, L. A., Eitel, J. U. H., Jennewein, J. S., White, J. C., and Wulder, M. A.: Developing 5 m resolution canopy height and digital terrain models from WorldView and ArcticDEM data, Remote Sens. Environ., 218, 174–188, https://doi.org/10.1016/j.rse.2018.09.010, 2018.
Mehra, R. and Ramanujam, V. M.: L S Band Airborne SAR Data Products Calibration, in: 2019 URSI Asia-Pacific Radio Science Conference (AP-RASC), New Delhi, India, 9–15 March 2019, https://doi.org/10.23919/URSIAP-RASC.2019.8738681, 2019.
Meyer, G., Humphreys, E. R., Melton, J. R., Cannon, A. J., and Lafleur, P. M.: Simulating shrubs and their energy and carbon dioxide fluxes in Canada's Low Arctic with the Canadian Land Surface Scheme Including Biogeochemical Cycles (CLASSIC), Biogeosciences, 18, 3263–3283, https://doi.org/10.5194/bg-18-3263-2021, 2021.
Michaelides, R. J., Chen, R. H., Zhao, Y., Schaefer, K., Parsekian, A. D., Sullivan, T., Moghaddam, M., Zebker, H. A., Liu, L., Xu, X., and Chen, J.: Permafrost Dynamics Observatory – part I: Postprocessing and calibration methods of UAVSAR L-band InSAR data for seasonal subsidence estimation, Earth Space Sci., 8, e2020EA001630, https://doi.org/10.1029/2020EA001630, 2021.
Miller, C. E., Griffith, P. C., Goetz, S. J., Hoy, E. E., Pinto, N., McCubbin, I. B., Thorpe, A. K., Hofton, M., Hodkinson, D., Hansen, C., Woods, J., Larson, E., Kasischke, E. S., and Margolis, H. A.: An overview of ABoVE airborne campaign data acquisitions and science opportunities, Environ. Res. Lett., 14, 080201, https://doi.org/10.1088/1748-9326/ab0d44, 2019.
Miller, C. E., Griffith, P., Hoy, E. E., Pinto, N., Lou, Y., Hensley, S., Chapman, B., Baltzer, J. L., Bakian-Dogaheh, K., Bolton, W. R., Bourgeau-Chavez, L. L., Chen, R. H., Choe, B.-H., Clayton, L. K., Douglas, T. A., French, N. H. F., Holloway, J. E., Hong, G., Huang, L., Iwahana, G., Jenkins, L. K., Kimball, J. S., Loboda, T. V., Mack, M. C., Marsh, P., Michaelides, R. J., Moghaddam, M., Parsekian, A. D., Schaefer, K., Siqueira, P., Singh, D., Tabatabaeenejad, A., Turetsky, M. R., Touzi, R., Wig, E., Wilson, P., Wilson, C. J., Wullschleger, S. D., Yi, Y., Zebker, H. A., Zhang, Y., Zhao, Y., and Goetz, S. J.: Summary of the ABoVE L-band and P-band Airborne SAR Surveys, ORNL DAAC, Oak Ridge, Tennessee, USA [data set], https://doi.org/10.3334/ORNLDAAC/2150, 2023.
Moghaddam, M., Tabatabaeenejad, A., Chen, R. H., Saatchi, S. S., Jaruwatanadilok, S., Burgin, M., Duan, X., and Truong-Loi, M. L.: AirMOSS: L2/3 Volumetric Soil Moisture Profiles Derived From Radar, 2012–2015, ORNL DAAC, https://doi.org/10.3334/ORNLDAAC/1418, 2016.
Montesano, P. M., Sun, G., Dubayah, R. O., and Ranson, K. J.: Spaceborne potential for examining taiga–tundra ecotone form and vulnerability, Biogeosciences, 13, 3847–3861, https://doi.org/10.5194/bg-13-3847-2016, 2016.
National Research Council (NRC): Opportunities to Use Remote Sensing in Understanding Permafrost and Related Ecological Characteristics: Report of a Workshop, The National Academies Press, Washington, DC, https://doi.org/10.17226/18711, 2014.
Pitcher, L. H., Pavelsky, T. M., Smith, L. C., Moller, D. K., Altenau, E. H., Allen, G. H., Lion, C., Butman, D., Cooley, S. W., Fayne, J. V., and Bertram, M.: AirSWOT InSAR Mapping of Surface Water Elevations and Hydraulic Gradients Across the Yukon Flats Basin, Alaska, Water Resour. Res., 55, 937–953, https://doi.org/10.1029/2018WR023274, 2019a.
Pitcher, L. H., Smith, L. C., Pavelsky, T. M., Fayne, J. V., Cooley, S. W., Altenau, E. H., Moller, D. K., and Arvesen, J.: ABoVE: AirSWOT Radar, Orthomosaic, and Water Masks, Yukon Flats Basin, Alaska, 2015, ORNL DAAC, https://doi.org/10.3334/ORNLDAAC/1655, 2019b.
Pitcher, L. H., Smith, L. C., Cooley, S. W., Zaino, A., Carlson, R., Pettit, J., Gleason, C. J., Minear, J. T., Fayne, J. V., Willis, M. J., Hansen, J. S., Easterday, K. J., Harlan, M. E., Langhorst, T., Topp, S. N., Dolan, W., Kyzivat, E. D., Pietroniro, A., Marsh, P., Yang, D., Carter, T., Onclin, C., Hosseini, N., Wilcox, E., Moreira, D., Berge-Nguyen, M., Cretaux, J.-F., and Pavelsky, T. M.: Advancing Field-Based GNSS Surveying for Validation of Remotely Sensed Water Surface Elevation Products, Front. Earth Sci., 8, 278, https://doi.org/10.3389/feart.2020.00278, 2020.
Porter, C., Morin, P., Howat, I., Noh, M.-J., Bates, B., Peterman, K., Keesey, S., Schlenk, M., Gardiner, J., Tomko, K., Willis, M., Kelleher, C., Cloutier, M., Husby, E., Foga, S., Nakamura, H., Platson, M., Wethington, M., Williamson, C., Bauer, G., Enos, J., Arnold, G., Kramer, W., Becker, P., Doshi, A., D'Souza, C., Cummens, P., Laurier, F., and Bojesen, M.: ArcticDEM, https://doi.org/10.7910/DVN/OHHUKH, 2018.
Quegan, S., Le Toan, T., Chave, J., Dall, J., Exbrayat, J.-F., Minh, D. H. T., Lomas, M., D'Alessandro, M. M., Paillou, P., Papathanassiou, K., Rocca, F., Saatchi, S., Scipal, K., Shugart, H., Smallman, T. L., Soja, M. J., Tebaldini, S., Ulander, L., Villard, L., and Williams, M.: The European Space Agency BIOMASS mission: Measuring forest above-ground biomass from space, Remote Sens. Environ., 227, 44–60, https://doi.org/10.1016/j.rse.2019.03.032, 2019.
Quinton, W., Berg, A., Braverman, M., Carpino, O., Chasmer, L., Connon, R., Craig, J., Devoie, É., Hayashi, M., Haynes, K., Olefeldt, D., Pietroniro, A., Rezanezhad, F., Schincariol, R., and Sonnentag, O.: A synthesis of three decades of hydrological research at Scotty Creek, NWT, Canada, Hydrol. Earth Syst. Sci., 23, 2015–2039, https://doi.org/10.5194/hess-23-2015-2019, 2019.
Ramanujam, V. M. and Mehra, R.: L&S Band SAR Data Processing and Products, in: 2019 URSI Asia-Pacific Radio Science Conference (AP-RASC), New Delhi, India, 2019, https://doi.org/10.23919/URSIAP-RASC.2019.8738235, 2019.
Ramanujam, V. M., Suneela, T. J. V. D., and Bhan, R.: ISRO's dual frequency airborne SAR pre-cursor to NISAR, in: Earth Observing Missions and Sensors: Development, Implementation, and Characterization IV, 98810A, https://doi.org/10.1117/12.2228086, 2016.
Reigber, A., Papathanassiou, K., Jger, M., and Scheiber, R.: First results of multispectral polarimetry and single-pass PolInSAR with the F-SAR airborne SAR instrument, in: 2013 IEEE International Geoscience and Remote Sensing Symposium-IGARSS, IEEE, 2305–2308, https://doi.org/10.1109/IGARSS.2013.6723279, 2013.
Rosen, P. A., Kim, Y., Kumar, R., Misra, T., Bhan, R., and Sagi, V. R.: Global persistent SAR sampling with the NASA-ISRO SAR (NISAR) mission, in; 2017 IEEE Radar Conference (RadarConf), Seattle, WA, USA, 2017, 0410–0414, https://doi.org/10.1109/RADAR.2017.7944237, 2017.
Saatchi, S., Xu, L., Yang, Y., and Yu, Y.: Evaluation of NISAR Biomass Algorithm in Temperate and Boreal Forests, IGARSS 2019–2019 IEEE International Geoscience and Remote Sensing Symposium, Yokohama, Japan, 2019, 7363–7366, https://doi.org/10.1109/IGARSS.2019.8898657, 2019.
Saatchi, S. S. and Moghaddam, M.: Estimation of crown and stem water content and biomass of boreal forest using polarimetric SAR imagery, IEEE T. Geosci. Remote, 38, 697–709, https://doi.org/10.1109/36.841999, 2000.
Schaefer, K., Liu, L., Parsekian, A., Jafarov, E., Chen, A., Zhang, T., Gusmeroli, A., Panda, S., Zebker, H. A., and Schaefer, T.: Remotely sensed active layer thickness (ReSALT) at Barrow, Alaska using interferometric synthetic aperture radar, Remote sensing, 7, 3735–3759, https://doi.org/10.3390/rs70403735, 2015.
Schaefer, K., Michaelides, R. J., Chen, R. H., Sullivan, T. D., Parsekian, A. D., Bakian-Dogaheh, K., Tabatabaeenejad, A., Moghaddam, M., Chen, J., Chen, A. C., Liu, L., and Zebker, H. A.: ABoVE: Active Layer Thickness Derived from Airborne L- and P-band SAR, Alaska, 2017, ORNL DAAC [data set], https://doi.org/10.3334/ORNLDAAC/1676, 2019.
Schaefer, K., Clayton, L. K., Battaglia, M. J., Bourgeau-Chavez, L. L., Chen, R. H., Chen, A. C., Chen, J., Bakian-Dogaheh, K., Douglas, T. A., Grelick, S. E., Iwahana, G., Jafarov, E., Liu, L., Ludwig, S., Michaelides, R. J., Moghaddam, M., Natali, S., Panda, S. K., Parsekian, A. D., Rocha, A. V., Schaefer, S. R., Sullivan, T. D., Tabatabaeenejad, A., Wang, K., Wilson, C. J., Zebker, H. A., Zhang, T., and Zhao, Y.: ABoVE: Soil Moisture and Active Layer Thickness in Alaska and NWT, Canada, 2008–2020, ORNL DAAC, Oak Ridge, Tennessee, USA, https://doi.org/10.3334/ORNLDAAC/1903, 2021a.
Schaefer, K., Michaelides, R. J., Chen, R. H., Sullivan, T. D., Parsekian, A. D., Zhao, Y., Bakian-Dogaheh, K., Tabatabaeenejad, A., Moghaddam, M., Chen, J., Chen, A. C., Liu, L., and Zebker, H. A.: ABoVE: Active Layer Thickness Derived from Airborne L- and P-band SAR, Alaska, 2017, ORNL DAAC, Oak Ridge, Tennessee, USA, https://doi.org/10.3334/ORNLDAAC/1796, 2021b.
Sellers, P., Hall, F., Margolis, H., Kelly, B., Baldocchi, D., den Hartog, G., Cihlar, J., Ryan, M. G., Goodison, B., Crill, P., Ranson, K. J., Lettenmaier, D., and Wickland, D. E.: The Boreal Ecosystem–Atmosphere Study (BOREAS): An Overview and Early Results from the 1994 Field Year, B. Am. Meteorol. Soc., 76, 1549–1577, https://doi.org/10.1175/1520-0477(1995)076<1549:TBESAO>2.0.CO;2, 1995.
Sellers, P. J., Hall, F. G., Kelly, R. D., Black, A., Baldocchi, D., Berry, J., Ryan, M., Ranson, K. J., Crill, P. M., Lettenmaier, D. P., Margolis, H., Cihlar, J., Newcomer, J., Fitzjarrald, D., Jarvis, P. G., Gower, S. T., Halliwell, D., Williams, D., Goodison, B., Wickland, D. E., and Guertin, F. E.: BOREAS in 1997: Experiment overview, scientific results, and future directions, J. Geophys. Res.-Atmos., 102, 28731–28769, https://doi.org/10.1029/97JD03300, 1997.
Silva, C. A., Duncanson, L., Hancock, S., Neuenschwander, A., Thomas, N., Hofton, M., Fatoyinbo, L., Simard, M., Marshak, C. Z., Armston, J., Lutchke, S., and Dubayah, R.: Fusing simulated GEDI, ICESat-2 and NISAR data for regional aboveground biomass mapping, Remote Sens. Environ., 253, 112234, https://doi.org/10.1016/j.rse.2020.112234, 2021.
Tabatabaeenejad, A., Burgin, M., and Moghaddam, M.: Potential of L-band radar for retrieval of canopy and subcanopy parameters of boreal forests, IEEE T. Geosci. Remote, 50, 2150–2160, https://doi.org/10.1109/TGRS.2011.2173349, 2011.
Tabatabaeenejad, A., Burgin, M., Duan, X., and Moghaddam, M.: P-Band Radar Retrieval of Subsurface Soil Moisture Profile as a Second-Order Polynomial: First AirMOSS Results, IEEE T. Geosci. Remote, 53, 645–658, https://doi.org/10.1109/TGRS.2014.2326839, 2015.
Tabatabaeenejad, A., Chen, R. H., Burgin, M. S., Duan, X., Cuenca, R. H., Cosh, M. H., Scott, R. L., and Moghaddam, M.: Assessment and Validation of AirMOSS P-Band Root-Zone Soil Moisture Products, IEEE T. Geosci. Remote, 58, 6181–6196, https://doi.org/10.1109/TGRS.2020.2974976, 2020.
Tank, S. E., Olefeldt, D., Quinton, W. L., Spence, C., Dion, N., Ackley, C., Burd, K., Hutchins, R., and Mengistu, S.: Fire in the Arctic: The effect of wildfire across diverse aquatic ecosystems of the Northwest Territories, Polar Knowledge: Aqhaliat, 1, 31–38, 2018.
Vincent, W. F., Callaghan, T. V., Dahl-Jensen, D., Johansson, M., Kovacs, K. M., Michel, C., Prowse, T., Reist, J. D., and Sharp, M.: Ecological Implications of Changes in the Arctic Cryosphere, AMBIO, 40, 87–99, https://doi.org/10.1007/s13280-011-0218-5, 2011.
Walker, X. J., Rogers, B. M., Baltzer, J. L., Cumming, S. G., Day, N. J., Goetz, S. J., Johnstone, J. F., Schuur, E. A. G., Turetsky, M. R., and Mack, M. C.: Cross-scale controls on carbon emissions from boreal forest megafires, Glob. Change Biol., 24, 4251–4265, https://doi.org/10.1111/gcb.14287, 2018a.
Walker, X. J., Rogers, B. M., Baltzer, J. L., Cummings, S. R., Day, N. J., Goetz, S. J., Johnstone, J. F., Turetsky, M. R., and Mack, M. C.: ABoVE: Wildfire Carbon Emissions and Burned Plot Characteristics, NWT, CA, 2014–2016, ORNL DAAC, https://doi.org/10.3334/ORNLDAAC/1561, 2018b.
Walker, X. J., Baltzer, J. L., Cumming, S. G., Day, N. J., Ebert, C., Goetz, S., Johnstone, J. F., Potter, S., Rogers, B. M., Schuur, E. A. G., Turetsky, M. R., and Mack, M. C.: Increasing wildfires threaten historic carbon sink of boreal forest soils, Nature, 572, 520–523, https://doi.org/10.1038/s41586-019-1474-y, 2019a.
Walker, X. J., Baltzer, J. L., Laurier, W., Cumming, S. G., Day, N. J., Goetz, S. J., Johnstone, J. F., Potter, S., Rogers, B. M., Schuur, E. A. G., Turetsky, M. R., and Mack, M. C.: ABoVE: Characterization of Carbon Dynamics in Burned Forest Plots, NWT, Canada, 2014, ORNL DAAC, https://doi.org/10.3334/ORNLDAAC/1664, 2019b.
Wilson, C., Dann, J., Bolton, R., Charsley-Groffman, L., Jafarov, E., Musa, D., and Wullschleger, S.: In Situ Soil Moisture and Thaw Depth Measurements Coincident with Airborne SAR Data Collections, Barrow and Seward Peninsulas, Alaska, 2017, Next Generation Ecosystem Experiments Arctic Data Collection, Oak Ridge National Laboratory, U.S. Department of Energy, Oak Ridge, Tennessee, USA [data set], https://doi.org/10.5440/1423892, 2018.
Wilson, C., Dann, J., Bolton, R., Charsley-Groffman, L., Jafarov, E., Musa, D., and Wullschleger, S.: In Situ Soil Moisture and Thaw Depth Measurements Coincident with Airborne SAR Data Collections, Barrow and Seward Peninsulas, Alaska, 2017, United States, Version 2, U.S. Department of Energy, Oak Ridge, Tennessee, USA [data set], https://www.osti.gov/biblio/1423892 (last access: 19 April 2024), 2021.
Wilson, C., Lathrop, E., Bolton, R., Jin, X., Nutt, M., and Dann, J.: In Situ Soil Moisture and Thaw Depth Measurements Coincident with Airborne SAR Data Collections, Seward Peninsula, Alaska, 2019, Next Generation Ecosystem Experiments Arctic Data Collection, Oak Ridge National Laboratory, U.S. Department of Energy, Oak Ridge, Tennessee, USA [data set], https://doi.org/10.5440/1856042, 2022.
Zhao, Y., Chen, R. H., Bakina-Dogaheh, K., Whitcomb, J., Yi, Y., Kimball, J. S., and Moghaddam, M.: Mapping Boreal Forest Species and Canopy Height using Airborne SAR and Lidar Data in Interior Alaska, IGARSS 2022–2022 IEEE International Geoscience and Remote Sensing Symposium, Kuala Lumpur, Malaysia, 2022, 4955–4958, https://doi.org/10.1109/IGARSS46834.2022.9883311, 2022.
- Abstract
- Copyright statement
- Introduction
- The L-band and P-band airborne SAR instruments and data acquisition
- The ABoVE airborne SAR campaigns
- TomoSAR measurements of boreal forest structure
- ABoVE SAR data products
- Synergy with other airborne sensors
- Data availability
- Summary
- Author contributions
- Competing interests
- Disclaimer
- Acknowledgements
- Financial support
- Review statement
- References
- Supplement