the Creative Commons Attribution 4.0 License.
the Creative Commons Attribution 4.0 License.
 | 07 May 2024
Reanalysis of multi-year high-resolution X-band weather radar observations in Hamburg
Finn Burgemeister
Marco Clemens
Felix Ament
This paper presents an open-access data set of reanalysed radar reflectivities and rainfall rates at sub-kilometre spatial and minute temporal scales. Variability at these scales is a blind spot for both operational rain gauge networks and operational radar networks. In the urban area of Hamburg, precipitation measurements of a single-polarized X-band weather radar operating at high temporal (30 s), range (60 m), and azimuthal sampling (1°) resolutions are made available for a period of more than 8 years.
We describe in detail the reanalysis of the raw radar data, outline the radar performance for the years 2013 to 2021, and discuss open issues and limitations of the data set. Several sources of radar-based errors were adjusted gradually, affecting the radar reflectivity and rainfall measurements, e.g. noise, alignment, non-meteorological echoes, radar calibration, and attenuation. The deployment of additional vertically pointing micro rain radars yields drop size distributions at the radar beam height, which effectively reduces errors concerning the radar calibration and attenuation correction and monitors the radar data quality. A statistical evaluation revealed that X-band radar reflectivities and rainfall rates are in very good agreement with the micro rain radar measurements. Moreover, the analyses of rainfall patterns shown for an event and accumulated rainfall of several months prove the quality of the data set.
The provided radar reflectivities facilitate studies on attenuation correction and the derivation of further weather radar products, like an improved rainfall rate. The rainfall rates themselves can be used for studies on the spatial and temporal scales of precipitation and hydrological research, e.g. input data for high-resolution modelling, in an urban area. The radar reflectivities and rainfall rates are available at https://doi.org/10.26050/WDCC/LAWR_UHH_HHG_v2 (Burgemeister et al., 2024).
- Article
(2370 KB) - Full-text XML
-
Supplement
(3884 KB) - BibTeX
- EndNote


Knowledge of small-scale rainfall variability is needed for several meteorological and hydrological applications, particularly in urban environments due to their water-related sensitivity. For instance, urban hydrological applications demand high-quality radar rainfall data with at least a temporal resolution of 1 min and spatial resolution of 100 m (Einfalt et al., 2004; Berne and Krajewski, 2013; Gires et al., 2013; Ochoa-Rodriguez et al., 2015; Thorndahl et al., 2017). In general, hydrometeorological and fundamental studies on rainfall properties may benefit from long-term measurements at small spatio-temporal scales.
Rain gauge networks provide reliable local precipitation measurements, but due to their limited operational network densities, they are unable to represent rainfall variability for large domains at small temporal scales (e.g. Berne et al., 2004; Villarini et al., 2008; Lengfeld et al., 2019; Maier et al., 2020). Conventional weather radar systems, mostly operating at S- and C-band frequencies, are able to provide radar rainfall measurements over large domains with a temporal resolution of several minutes and spatial resolution of a few hundred metres. Long-term radar-based precipitation climatologies based on these conventional radars are available for Germany with a 5 min temporal resolution and 1 km spatial resolution (Winterrath et al., 2018) and for Europe with an hourly temporal resolution and 2 km spatial resolution (Overeem et al., 2023). Consequently, there is a gap in long-term radar rainfall data sets at the sub-kilometre spatial scale and temporal scales below 5 min. X-band radars are able to refine rainfall estimates at temporal resolutions down to 16 s (van de Beek et al., 2010) and radial resolutions down to 3 m (Mishra et al., 2016), but most of them operate at or below 100 m spatial resolutions and 1 min temporal resolutions in areas of special interest, like urban areas (e.g. Ventura and Russchenberg, 2009; van de Beek et al., 2010; Wang and Chandrasekar, 2010; Maesaka et al., 2011; Berenguer et al., 2012; Allegretti et al., 2012; Lengfeld et al., 2014; Lo Conti et al., 2015; Yoon et al., 2017; Hosseini et al., 2020; Schleiss et al., 2020). However, long-term reanalyses of these radar observations are not available. Therefore, the aim of this paper is to present the data reanalysis of X-band radar observations at the sub-minute and hectometre scale in the urban area of Hamburg for multiple years, which resulted in an open-access data set of radar reflectivities and rainfall estimates (Burgemeister et al., 2024).
The operational, single-polarized X-band weather radar monitors precipitation within a 20 km scan radius around Hamburg's city centre since 2013, operated in synergy with two micro rain radars (MRRs) and rain gauges. The local area weather radar (LAWR) operates at one elevation angle with a high temporal (30 s), range (60 m), and azimuthal sampling (1°) resolutions, refining coarser observations of the German nationwide C-band radars at 250 m spatial and 5 min temporal resolution. Although most of the latest X-band radars have dual-polarimetric capabilities (e.g. Anagnostou et al., 2018; Schleiss et al., 2020; Neely et al., 2021; Pejcic et al., 2022; Cao et al., 2023; Hosseini et al., 2023), where dual-polarimetric quantities improve rainfall estimates, even low-cost, single-polarized X-band radars provide valuable information on the spatio-temporal variability of precipitation (e.g. van de Beek et al., 2010; Lo Conti et al., 2015; Marra and Morin, 2018). The single-polarized X-band radars require extensive post-processing and the deployment of independent additional sensors, like micro rain radars, disdrometers, or rain gauges (Villarini and Krajewski, 2010; Thorndahl et al., 2017). Former studies on short time periods (several months and a case study) show that the LAWR provides detailed information on the structure of precipitation. Lengfeld et al. (2014) deployed a network of four LAWRs and micro rain radars in a rural area of northern Germany. They describe correction algorithms for single and networked LAWRs and discuss the performance of measurements of 5 months. Lengfeld et al. (2016) and Lengfeld et al. (2018) introduce a method to correct reflectivity measurements for attenuation using less attenuated radars, and they compare attenuation correction methods for single-polarized X-band radars using this LAWR network. The LAWR network was dismantled in 2017. However, the LAWR located in Hamburg is still in operation, extending a unique data set. Hoffmann et al. (2018) shows that the LAWR is able to capture the circular pattern in rainfall rates because of its higher resolutions in space and time. In a recent study, a LAWR was deployed to provide rainfall estimates for studies on cold pool events during the Field Experiment on Sub-mesoscale Spatio-Temporal Variability in Lindenberg (FESSTVaL) from June to August 2021 (Burgemeister et al., 2022). The previous studies provide knowledge and algorithms to reanalyse a consistent long-term data set based on LAWR measurements.
Any user of the presented long-term data set of homogeneously reanalysed rainfall estimates from X-band radar observations will need to know the details on data processing, availability, and accuracy. In this paper, we describe the setup of the LAWR in synergy with two MRRs and rain gauges in Hamburg (Sect. 2). We explain the reanalysis of the multi-year measurements, addressing the noise removal, correction of non-meteorological echoes, calibration, attenuation correction, and rainfall estimation (Sect. 3). Finally, we check the performance of the multi-year measurements with MRR observations, present rainfall patterns, and discuss limitations of the data set (Sect. 4).
In the urban area of Hamburg, synergistic precipitation observations of a local area weather radar (LAWR) operating at X-band frequency, a micro rain radar (MRR), and a rain gauge (RG) are available since 2013 (Fig. 1). The measurements can refine the observations of the German nationwide C-band radars and supplement and cover additional rain gauges. The LAWR Hamburg Geomatikum (HHG) is located on the rooftop of the Meteorological Institute of the Universität Hamburg in the centre of Hamburg. The MRR Wettermast Hamburg (WMH) is located at the scientific measuring site of the Meteorological Institute of the Universität Hamburg in the south-eastern part of the city. The MRR Blankenese Bauersberg (BBG) is deployed at a waterworks of the municipal water and wastewater utility Hamburg Wasser in the west of Hamburg since December 2017. The MRR WMH and LAWR HHG are 10.1 km apart. The MRR BBG and LAWR HHG are 12.3 km apart. The closest C-band radar of the German Weather Service (DWD) covering the whole measuring area of the LAWR HHG was in Hamburg Fuhlsbüttel (airport) with a distance of 7.3 km until 2014 and is since then in Boostedt 48.7 km away.
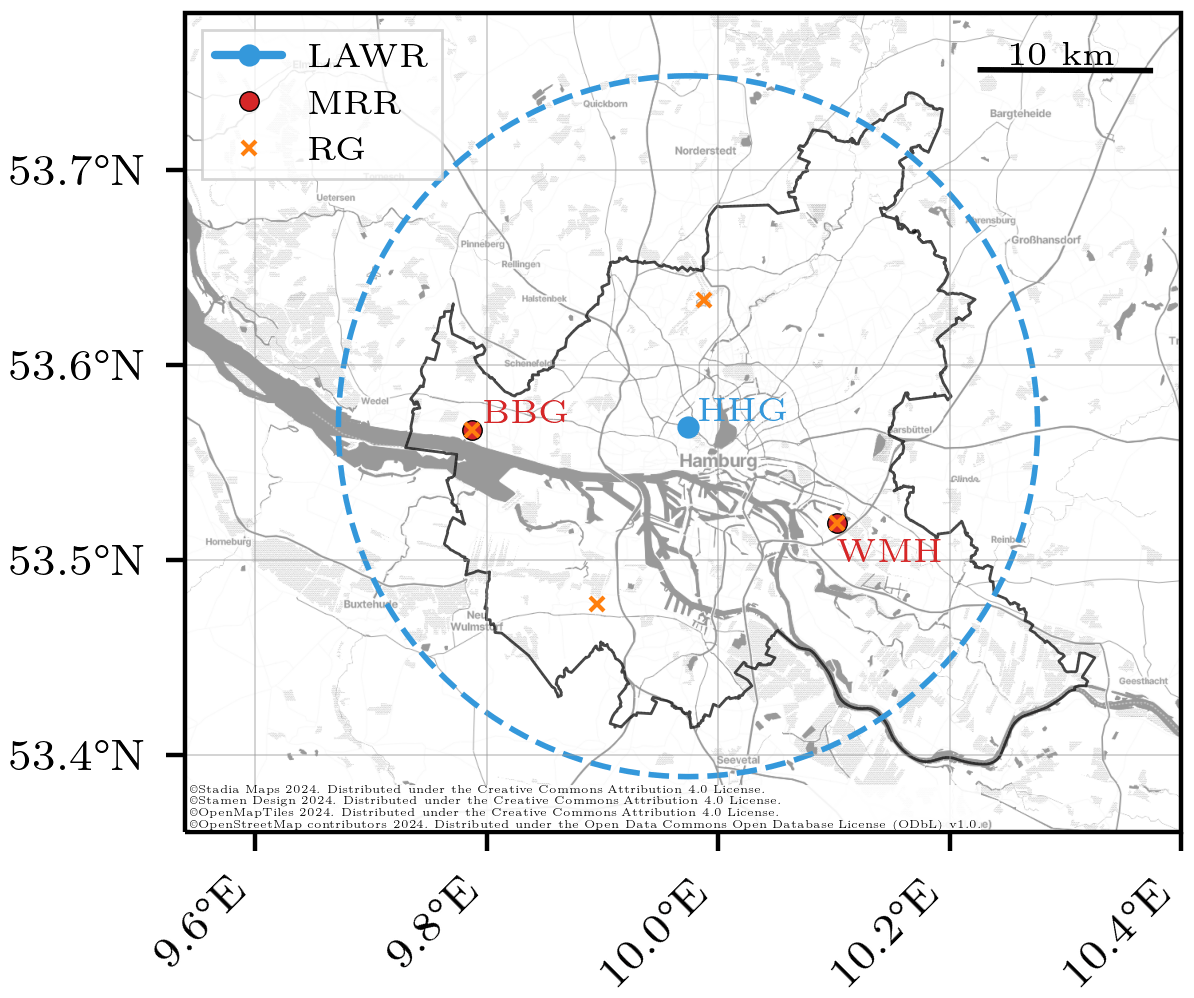
Figure 1Precipitation observations in Hamburg. The location of the local area weather radar (LAWR)/X-band radar (WRX) on the rooftop of the Geomatikum building in Hamburg (HHG) is indicated with a blue point. The dashed blue line shows the coverage with the 20 km scan radius. The locations of two micro rain radars (MRRs, red points) are, by name, Blankenese Bauersberg (BBG) and Wettermast Hamburg (WMH). Rain gauges (RGs, orange crosses) are located next to the MRRs and at sites of the German Weather Service (DWD).
2.1 X-band weather radar
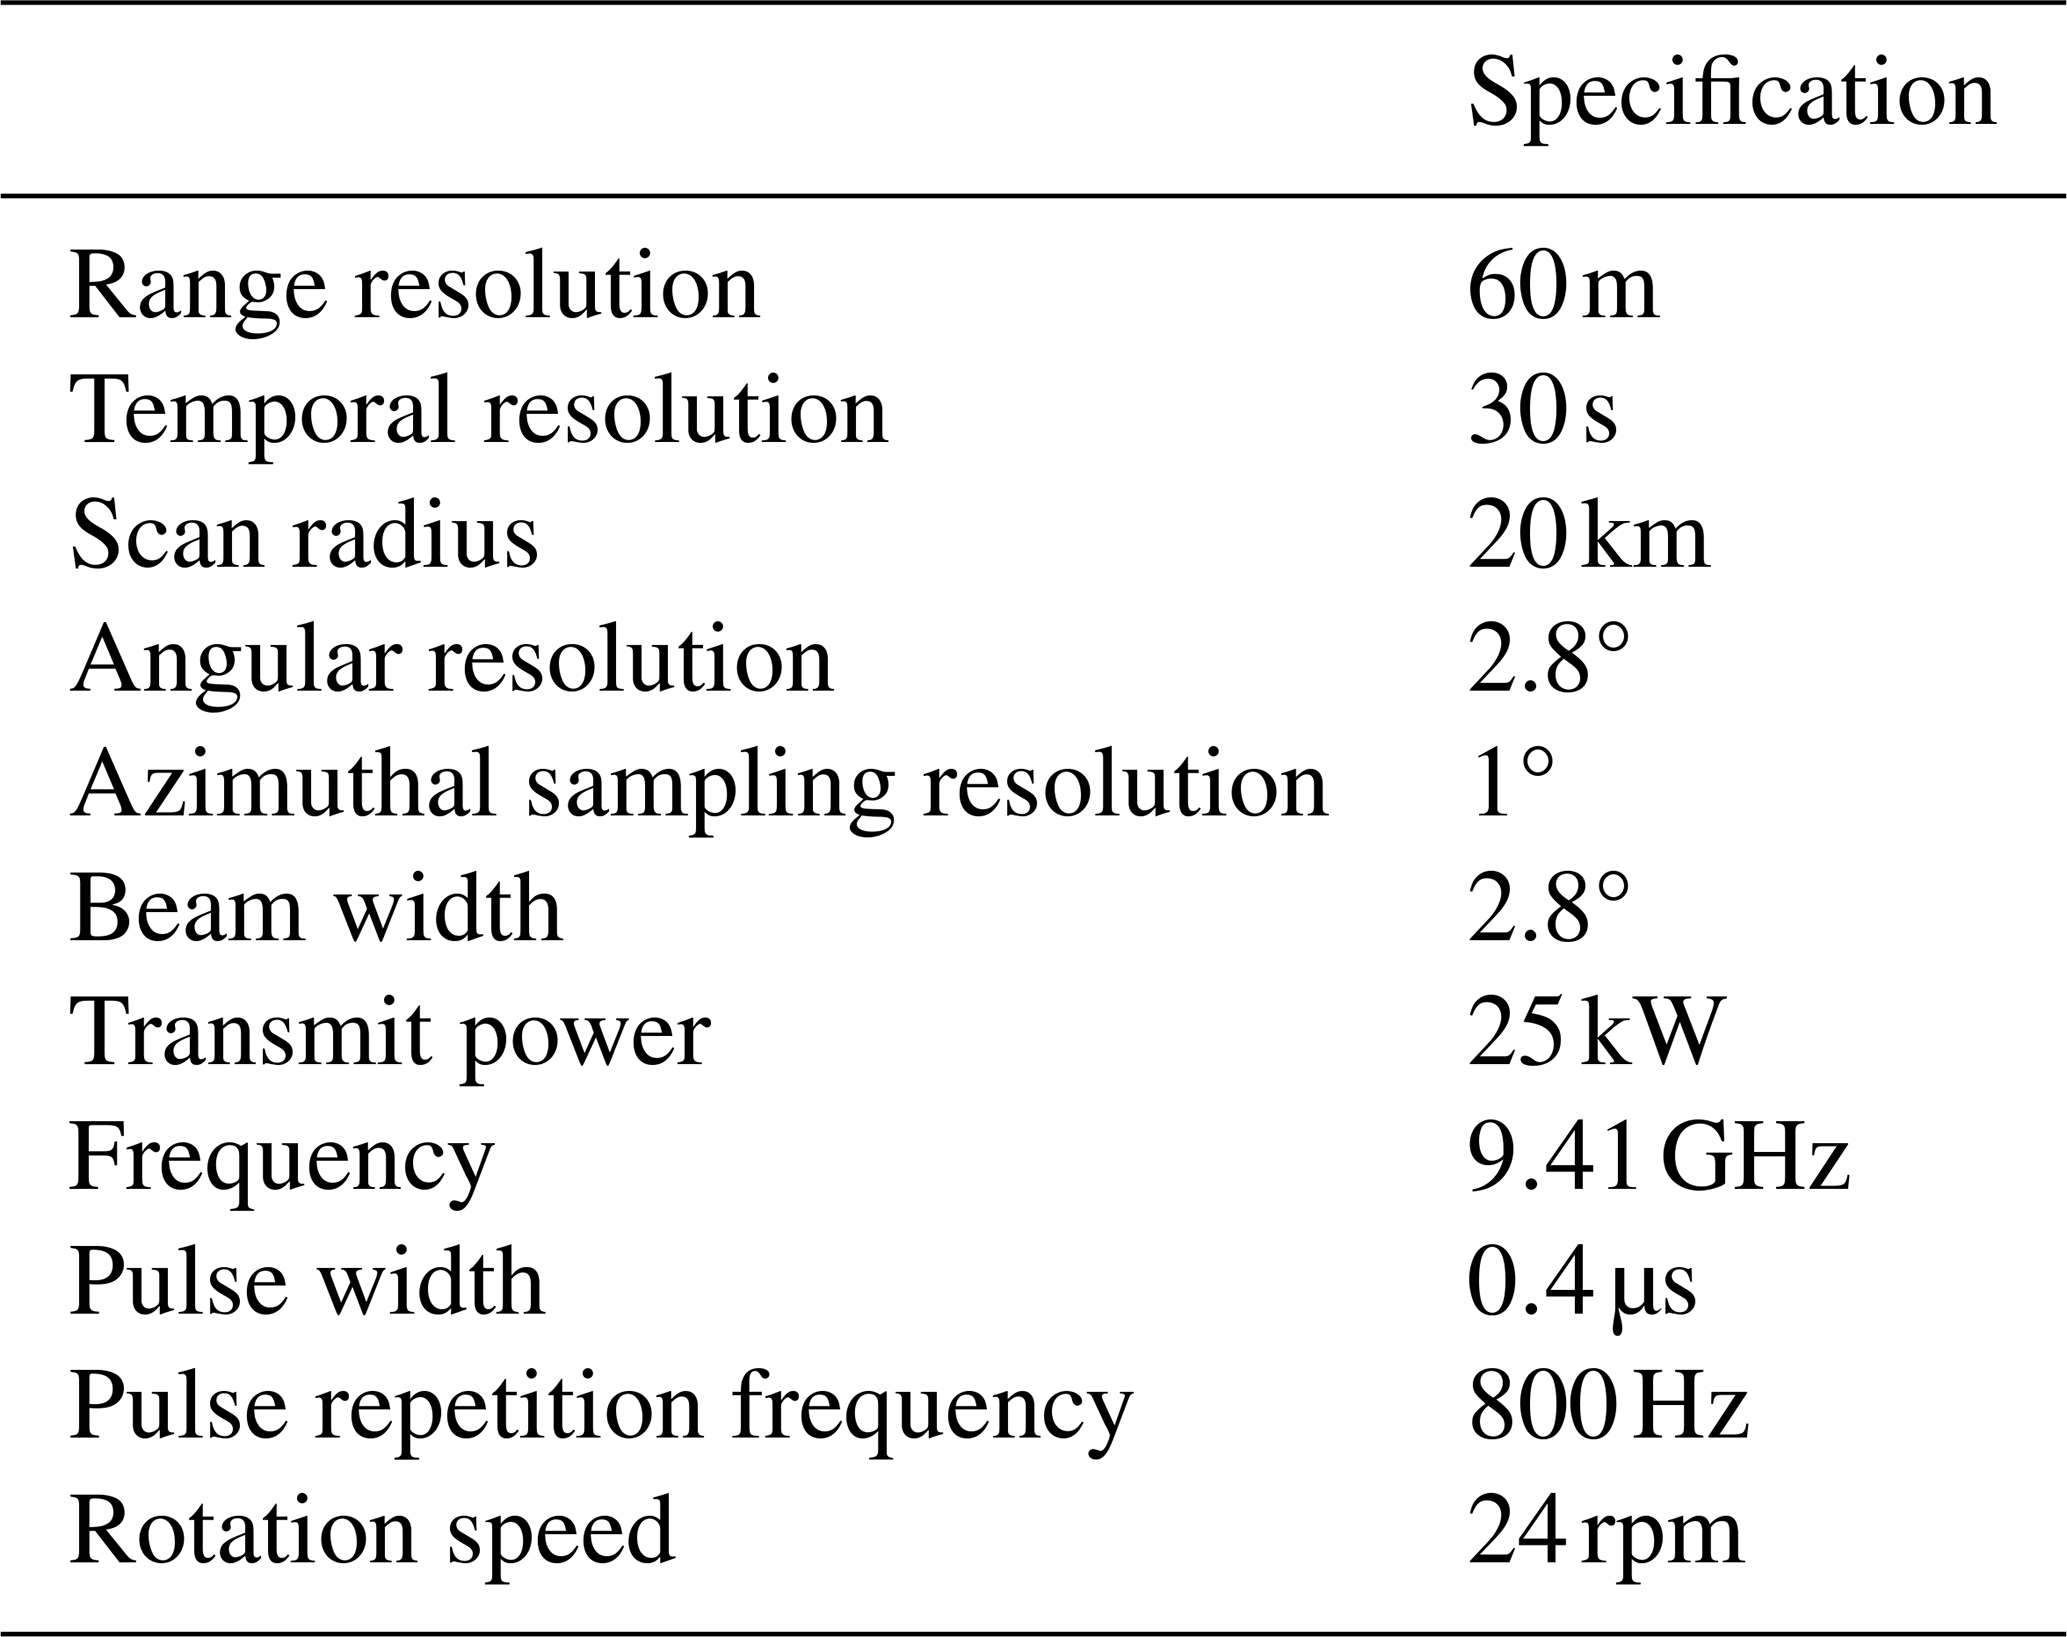
The LAWR is a modified ship navigation radar of type GEM scanner SU70-25E. This single-polarized X-band radar operates at a frequency of 9.41 GHz. The LAWR provides horizontally radar reflectivity measurements at one fixed elevation angle with 30 s temporal, 60 m range, and 1° azimuthal sampling resolutions. The elevation angle was adjusted several times over the years for optimal operation during maintenance to reduce disturbances by non-meteorological echoes. The advantages of the LAWR are its low costs, high spatio-temporal resolution, and scanning strategy (Lengfeld et al., 2014). The LAWR costs less than 20 % of conventional X-band radars. The radar reflectivity represents an 30 s average of approximately 67 pulses per 1° collected during 12 sweeps, whereas conventional weather radars provides instantaneous measurements based on 1 sweep. The LAWR specifications are summarized in Table 1, and we refer to Lengfeld et al. (2014) for technical details on the radar.
2.2 Micro rain radar
The MRR is a vertically pointing frequency-modulated continuous-wave (FM-CW) Doppler radar manufactured by METEK Meteorologische Messtechnik GmbH (Peters et al., 2002). The MRR retrieves drop size distributions (DSDs) from measured Doppler spectra using the terminal fall velocity given by Atlas et al. (1973). Rainfall rates and radar reflectivities are calculated from DSDs (Doviak and Zrnić, 1993). Noise and attenuation corrections are performed by the manufacturer's software (Metek, 2015). The DSD retrieval assumes stagnant air. Vertical wind and turbulence effects are discussed in Peters et al. (2005) and are neglected in this study. The transmit frequency is at 24.23 GHz (K-band). Before November 2014, the MRR WMH measured with a transmit frequency of 24.0 GHz. Both MRRs measure DSD profiles for 31 range gates, with a range resolution of 35 m and a temporal resolution of 10 s. Adjacent rain gauges monitor the MRR's performance.
Precipitation data sets that are generated by operational data processing are prone to inconsistencies and breaks, e.g. introduced by advancement in the processing algorithms or delayed calibration after hardware changes. As a decisive advantage, this reanalysis radar data set is based on a set of consistent, state-of-the-art data processing procedures. To ensure traceability, we document in this section the essential data processing procedures: removal of noise (Sect. 3.1), correction of misalignment (Sect. 3.2), detection of non-meteorological echoes (Sect. 3.3), radar calibration (Sect. 3.4), correction of attenuation (Sect. 3.5), and the conversion to rainfall rates by a Z–R relation (Sect. 3.6). The availability of corrected radar reflectivities and rainfall estimates will finally be summarized in the last section (Sect. 3.7).
3.1 Remove noise
The raw radar reflectivities measured by the LAWR are superimposed by microwave noise that comes from the atmosphere and the radar itself. The radar cannot measure the background noise directly; however, an accurate estimation of the noise is mandatory to also detect weak weather signals. The background noise removal is dynamically fitted for every 30 s time step following Lengfeld et al. (2014). In contrast to the received signal, which is proportional to the squared distance (r2) to the radar, the background noise is range-independent. Therefore, the radar reflectivity factor Z is multiplied by r−2 and an initial guess of the noise level estimated from a rain-free field is subtracted from the radar field . The noise level is multiplied by a factor of 1.03 to remove all noise artefacts. If more than 10 % of the radar bins remain rain-free, the 10th percentile of the original becomes the new noise level estimate; otherwise, the noise level from the prior time step is kept. The estimated noise level is used as an initial guess for the next time step. The 10 recent noise level estimates are averaged to stabilize the algorithm regarding radar artefacts. Finally, the dynamic background noise is subtracted from the radar field, yielding the noise-free radar reflectivity factor after the multiplication by r2.
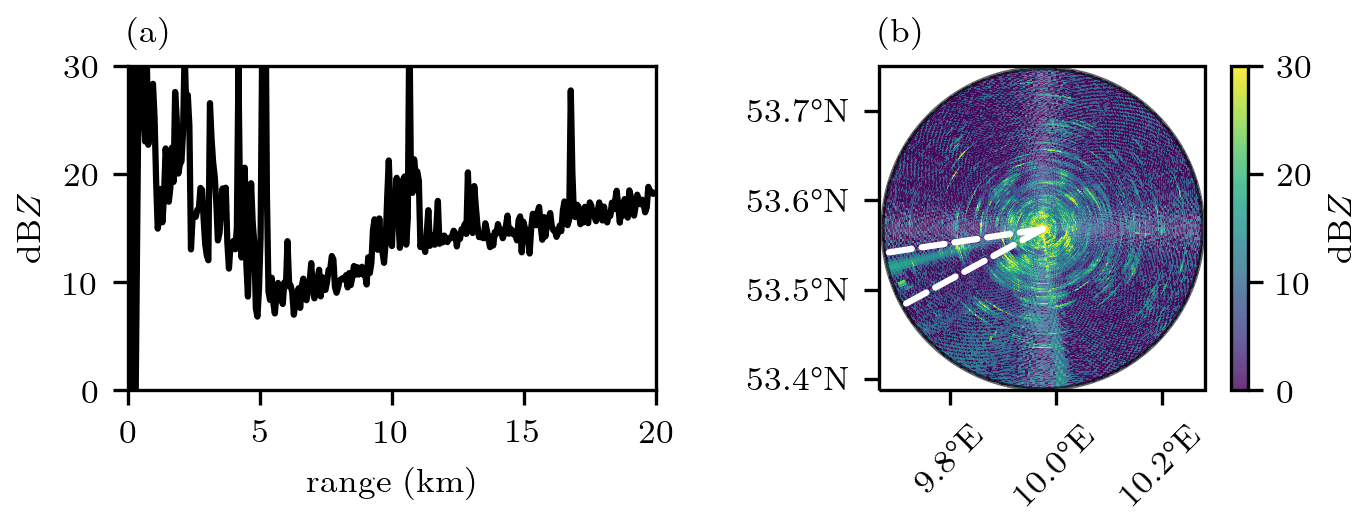
Figure 2Radar reflectivity after noise removal at sunset, 2 March 2020 16:20 UTC. (a) Radar reflectivity at the 255.5° azimuth angle representing the solar signal. (b) Radar reflectivity with continuous signal over range which is visible during the sun set. The white lines indicate a 20° window around the true sun position in the radar azimuth angle.
3.2 Determine radar alignment
The radar alignment of LAWR was adjusted manually at installation and after maintenance, leading to unknown uncertainties in antenna pointing. Since the beginning of operational measurements of the LAWR, spikes in radar reflectivity are observed in the direction of the sun during sunrise and sunset (Fig. 2). These solar signals facilitate the subsequent determination of the antenna azimuth α and the beam elevation angle ε (Huuskonen and Holleman, 2007), using the known position of the sun (Stafford et al., 2021; Reda and Andreas, 2008).
The solar signal in radar reflectivity is the strongest spike in the direction of the sun position and is determined empirically in the radar reflectivity after noise removal during rain-free events. The continuous maximal reflectivity (Fig. 2) is detected at 3658 sunrises and sunsets during 23 min on average. The mean calculated sun elevation angle of one sunrise or sunset is the radar beam elevation angle ε. The mean difference of the sun azimuth angle αsun and the azimuth angle of the detected solar signal αdetect is the azimuth offset:
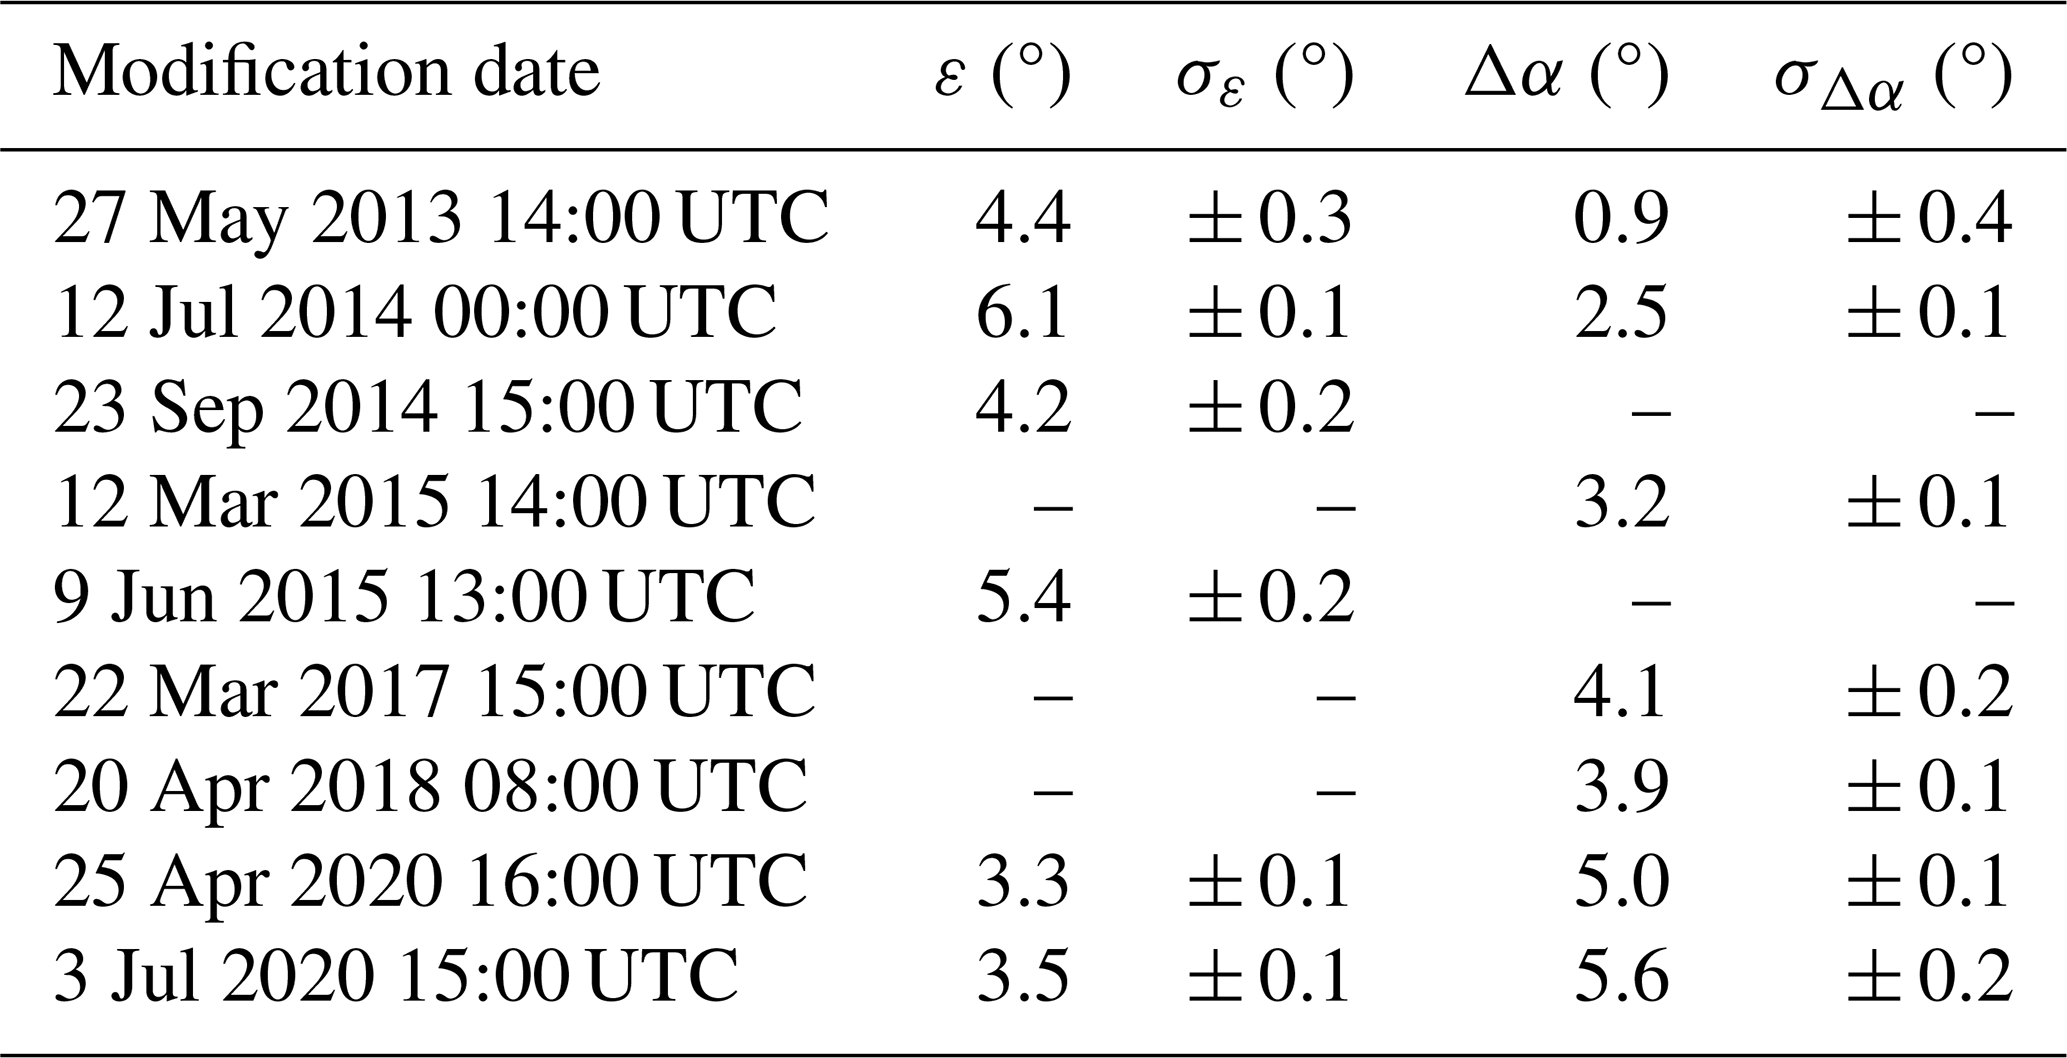
The detection of one sunrise or sunset is constrained to a minimal duration of 15 min and maximal standard deviations of the beam elevation < 1° and the azimuth offset < 1°. The determined ε′ and Δα′ are averaged between maintenance dates, resulting in the final beam elevation angle ε and azimuth offset Δα (Table 2). Between 27 May 2013 and 11 August 2021, the radar alignment is characterized by six ε values, ranging between 3.3 and 6.1°, and seven Δα values with a maximum of 5.6°. The estimates of ε and Δα are stable within periods of at least 2 months up to several years, with a maximal standard deviation of ± 0.4°. The known radar alignment and thus location and height of the measurements allows for comparisons with other measurement devices and hence its calibration after clutter correction.
Table 2X-band radar (LAWR) HHG alignment, defined by the beam elevation angle ε and azimuth offset Δα.
3.3 Detect clutter
The noise-corrected radar reflectivities contain static and dynamic non-meteorological echoes (clutter) characterized by high values and erroneous spatio-temporal gradients. Static clutter is caused by static objects, e.g. trees and buildings. Dynamic clutter is caused by dynamic objects, e.g. planes, birds, and other radars measuring at X-band frequencies. Consequently, measurements in urban areas are more affected by clutter than in rural areas. Additionally, ship navigation radars located at the Hamburg harbour can cause interferences in the form of spikes or rings. All these clutter values cannot be easily detected within the LAWR measurements due to the lack of polarimetric or Doppler quantities. The clutter detection requires the application of several gradient-based and time-dependent correction algorithms.
As a first step of clutter correction, static clutter is removed by subtracting a static clutter field. Radar reflectivities and clutter are assumed to be additive. The static clutter field is estimated from the temporal median of the noise-corrected, rain-free radar reflectivity factor. A stable estimate of the static clutter field requires the measurement's stability, i.e. continuous relative calibration, alignment, and adjustment of the radar receiver, which is valid over multiple weeks, months, or years. Due to computing time, the static clutter field is updated on a roughly monthly basis for periods with similar clutter signals. To restrict the temporal median of the radar reflectivity factor to mainly rain-free cases, a rain threshold based on the rain fraction is introduced, represented by the fraction of radar reflectivities exceeding 5 dBZ for every time step. The radar reflectivity of 5 dBZ represents a rainfall rate R of 0.1 mm h−1 using a standard Z–R relationship. The rain threshold was empirically set to the 75th percentile of the rain fraction, avoiding rain patterns affecting the static clutter field. Furthermore, this threshold of the rain fraction is also dependent on the measurement's stability. Changes in the rain fraction indicate technical maintenance of the radar, which is represented by a change point of the rain fraction based on a different calibration or technical errors of the radar receiver, which is represented by a drift of the rain fraction based on a slow reduction of radar sensitivity. The correction of static clutter using a stable estimate of a static clutter field subtracts clutter leaving the measurement, so there is no need of interpolation.
Dynamic clutter signals are removed by several gradient-based correction algorithms. Five different filter algorithms are applied: the texture of the logarithmic reflectivity (TDBZ) filter (Hubbert et al., 2009), the SPIN filter (Hubbert et al., 2009), a spike filter (Lengfeld et al., 2014), a ring filter (Lengfeld et al., 2014), and a speckle filter. Since isolated clutter signals, spikes, and rings vary in length and width, two variants of the spike filter, two variants of the ring filter, and five variants of the speckle filter are applied, each with different parameters.
The TDBZ filter calculates the TDBZ field as the mean of the squared logarithmic reflectivity difference between adjacent range gates according to (Hubbert et al., 2009):
where dBZ is the reflectivity and N is the number of range gates used. The TDBZ filter labels a range gate as a clutter signal if the TDBZ field exceeds TDBZ>9 dBZ within N=3 consecutive range gates. The filter was modified to computations along range gates following Lengfeld et al. (2014).
The SPIN filter detects clutter based on a measure of how often the reflectivity gradient changes sign along the radial direction according to Hubbert et al. (2009). The reflectivity gradient and sign change is calculated between three consecutive range gates, e.g. dBZi−1, dBZi, and dBZi+1:
and
where spin_thres is a reflectivity threshold, which is set to 3 dBZ. The SPIN filter labels a range gate as a clutter signal if more than two range gates in a centred window of five range gates meet the conditions of the Eqs. (3) and (4).
The spike filter identifies clutter in the form of spikes by calculating the reflectivity gradients for consecutive radar beams. The reflectivity gradient is calculated between the reflectivity dBZi and the reflectivities with a distance of W degrees in azimuth dBZi−W and dBZi+W:
where spike_thres is a reflectivity threshold, which is set to 3 dBZ. Two spike filters are applied: one spike filter is configured with the parameters N=3 and W=1, and the second one is applied with N=11 and W=2. The spike filter labels a range gate as clutter signal if more than 50 % in a window of N consecutive radar beams meet the condition of Eq. (5). The ring filter identifies clutter in the form of rings by calculating reflectivity gradients for consecutive range gates. Consequently, the ring filter is similar to the spike filter but computes the reflectivity gradients using Eq. (5) with a distance of W metres in range and a ring_thres of 3 dBZ. The ring filter labels a range gate as clutter signal if more than 50 % in a surrounding window of N range gates meet the condition of Eq. (5). Two ring filters are applied: one ring filter is configured with the parameters N=11 and W=1, and the second one is configured with N=11 and W=2. The choice of the parameters for the four filters were determined empirically by processing different case studies (not shown).
The application of one TDBZ filter, one SPIN filter, two spike filters, and two ring filters removes dominant clutter patterns, but there remain isolated clutter signals. For this purpose, the speckle filter assumes that rain areas are connected and thus consist of more than a few isolated high reflectivities. This filter counts radar reflectivities of grid cells dBZi,j greater than a rain threshold of 5 dBZ within a two-dimensional window of size k×l:
where for and for . If the sum of Eq. (6) is smaller than the speckle_thres, the centre of the k×l window is identified as clutter. Five speckle filters are applied using different window sizes and thresholds: , , and .
To assess the effectiveness of these five filters, we have analysed exemplarily the clutter detection from May to September 2019: the TDBZ filter is the most effective filter by detecting 66.1 % of all clutter pixels. Many clutter pixels are as well identified by the SPIN filter (25.7 %) and one of the five speckles filters (14.0 % to 31.5 %). In contrast, the detection rate is low for the two spike filters (3.1 % and 0.4 %) and the two ring filters (1.0 % and 1.4 %).
Identified and removed clutter signals yield missing values in the reflectivity field. Missing values are interpolated with ordinary Kriging (Cressie, 1993). The temporal-constant spatial covariance is modelled by a Gaussian semivariance with a length scale of 5 km and stationary random noise, which represents the nugget. For computational efficiency, the Kriging method is spatially localized (Wesson and Pegram, 2004) by using the 20 nearest neighbours to the grid points that should be interpolated. However, it is important to keep in mind that some clutter signals remain within the measurements and may affect the interpolation of missing radar reflectivities.
3.4 Calibrate
The observational synergy of the LAWR, MRR, and RG facilitates calibration and adjustment of the radar measurements. The MRR provides the radar reflectivity factor ZMRR and rainfall rate RMRR derived from drop size distributions. With ZMRR, the LAWR radar reflectivity factor ZLAWR is calibrated directly. The calibration and evaluation with MRR measurements has mainly three advantages. The same variable and the same measuring height are compared at sufficiently large sampling volume sizes. A calibration with a disdrometer would increase errors because of the height difference and different sampling volume sizes. The calibration with a RG would add an error based on uncertainties introduced by Z–R relationships. However, the MRR measurements are adjusted with a RG at the same location. The methodology is described by Lengfeld et al. (2014).
Before calibration, RMRR and consequently ZMRR are adjusted with RG measurements. The logarithmic calibration factor for the MRR CMRR is derived from 3 h averages of RMRR at 105 m height and RG rainfall rate RRG:
with . Wind-induced losses of RRG were corrected using the wind speed of a wind sensor (Rubel and Hantel, 1999). Rainfall rates at temperatures below 5 °C were not included to constrain the adjustment on the liquid phase. The MRR variables, e.g. ZMRR and RMRR, are adjusted at all 31 height levels with CMRR in logarithmic or linear units, respectively. CMRR is sufficiently stable for periods covering multiple months (Table 3) and changes were a result of maintenance.
Table 3Micro rain radar (MRR) logarithmic calibration factor CMRR
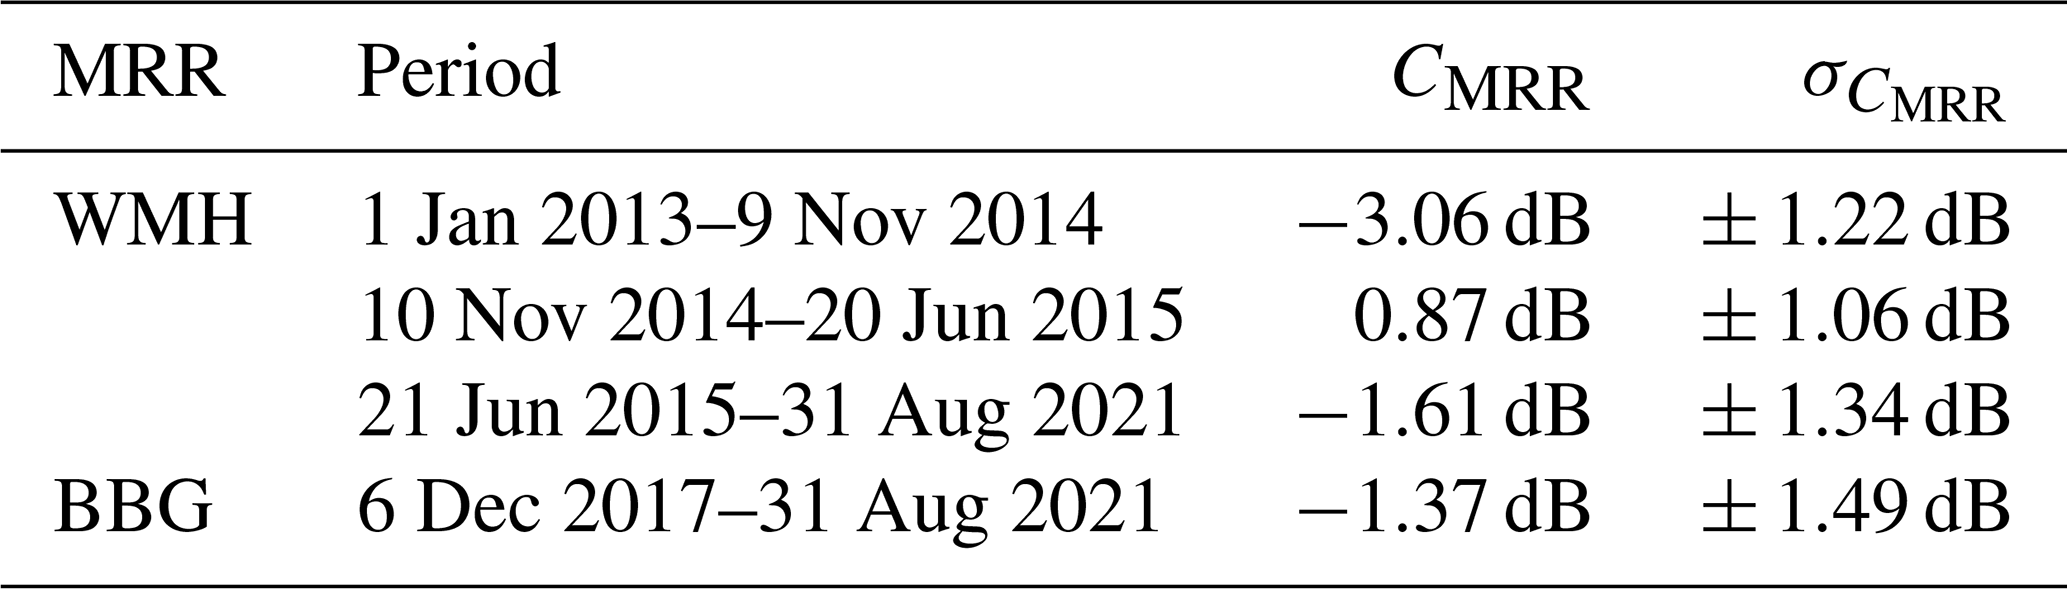
Table 4Calibration parameters for the LAWR with the calibration coefficient cLAWR (Eq. 8), the mean bias, the root-mean-square error (RMSE), the sample size (n), and the Pearson correlation coefficient (r). Measurements are only available in these periods.
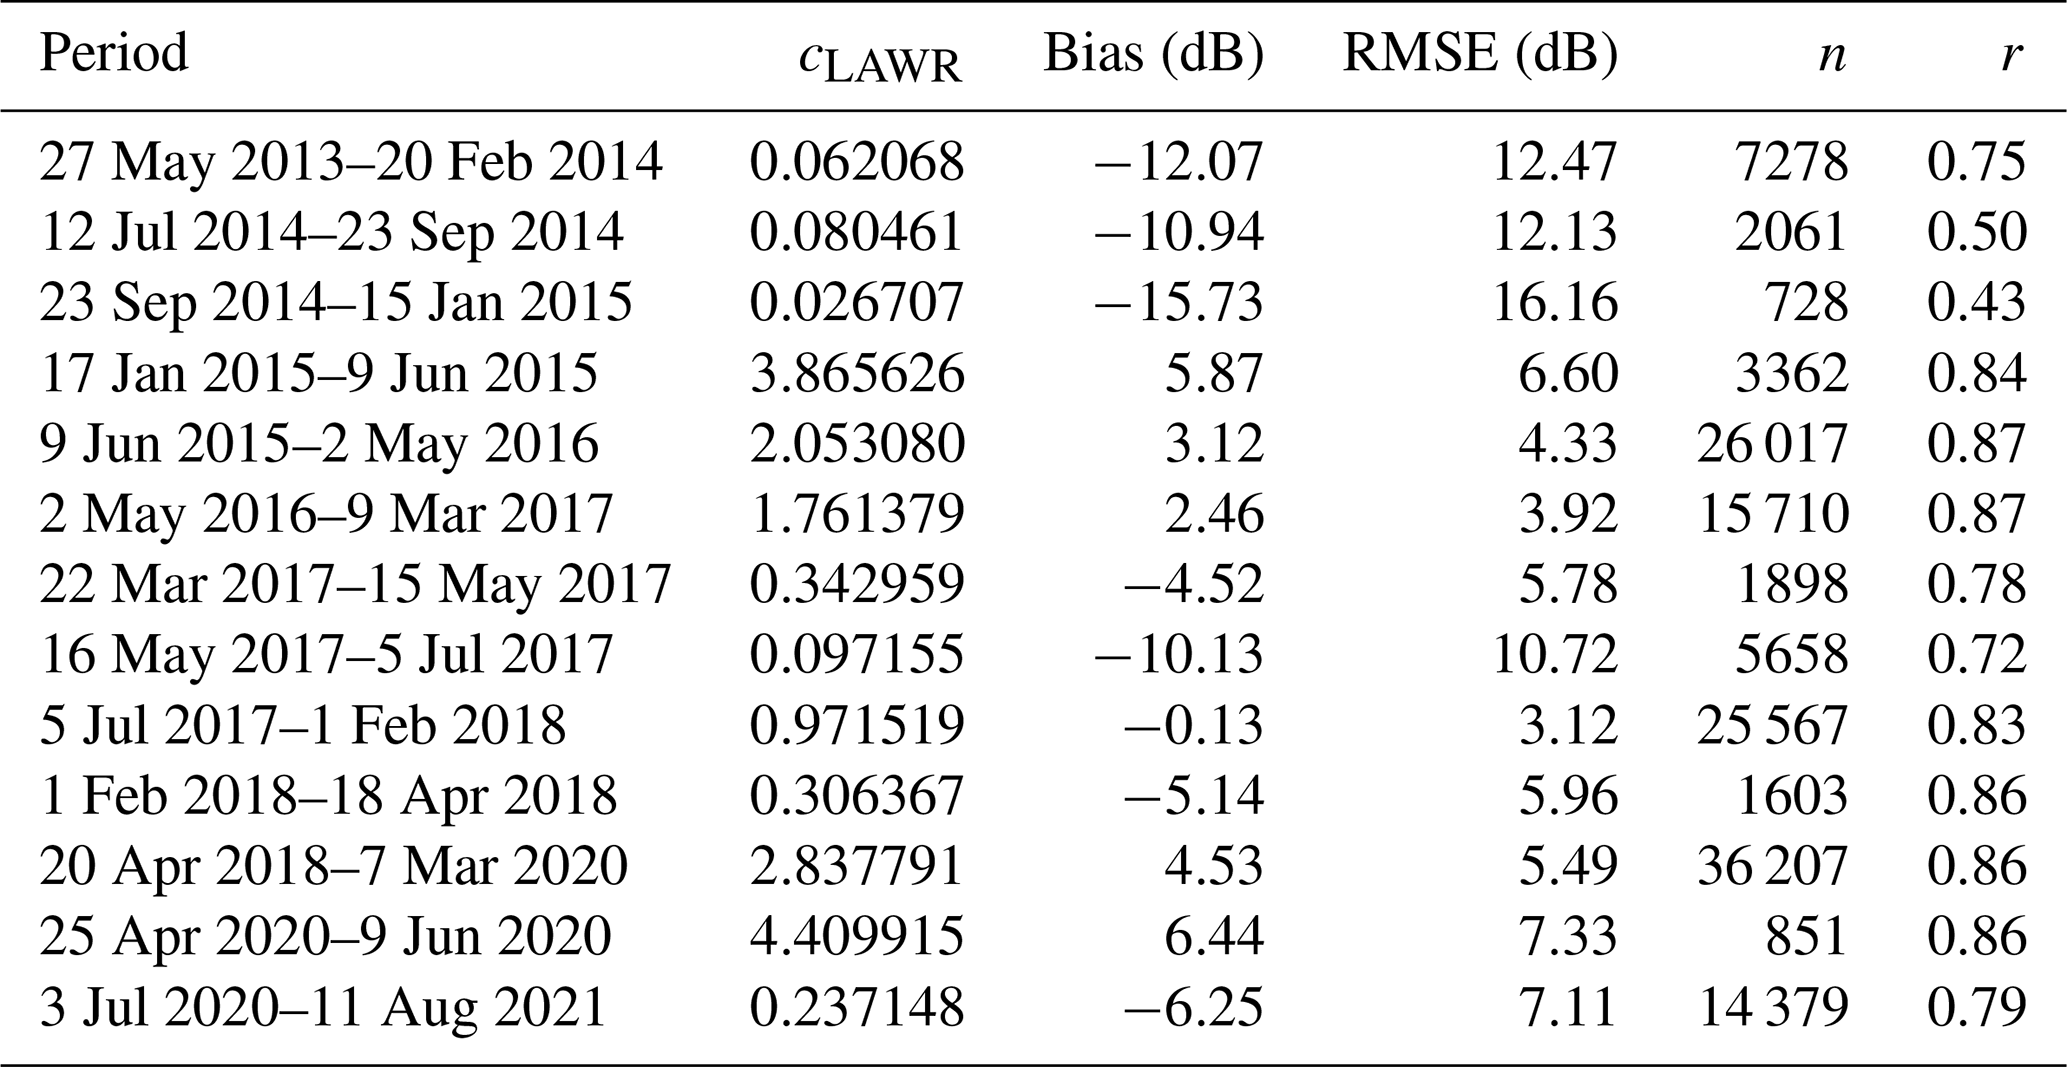
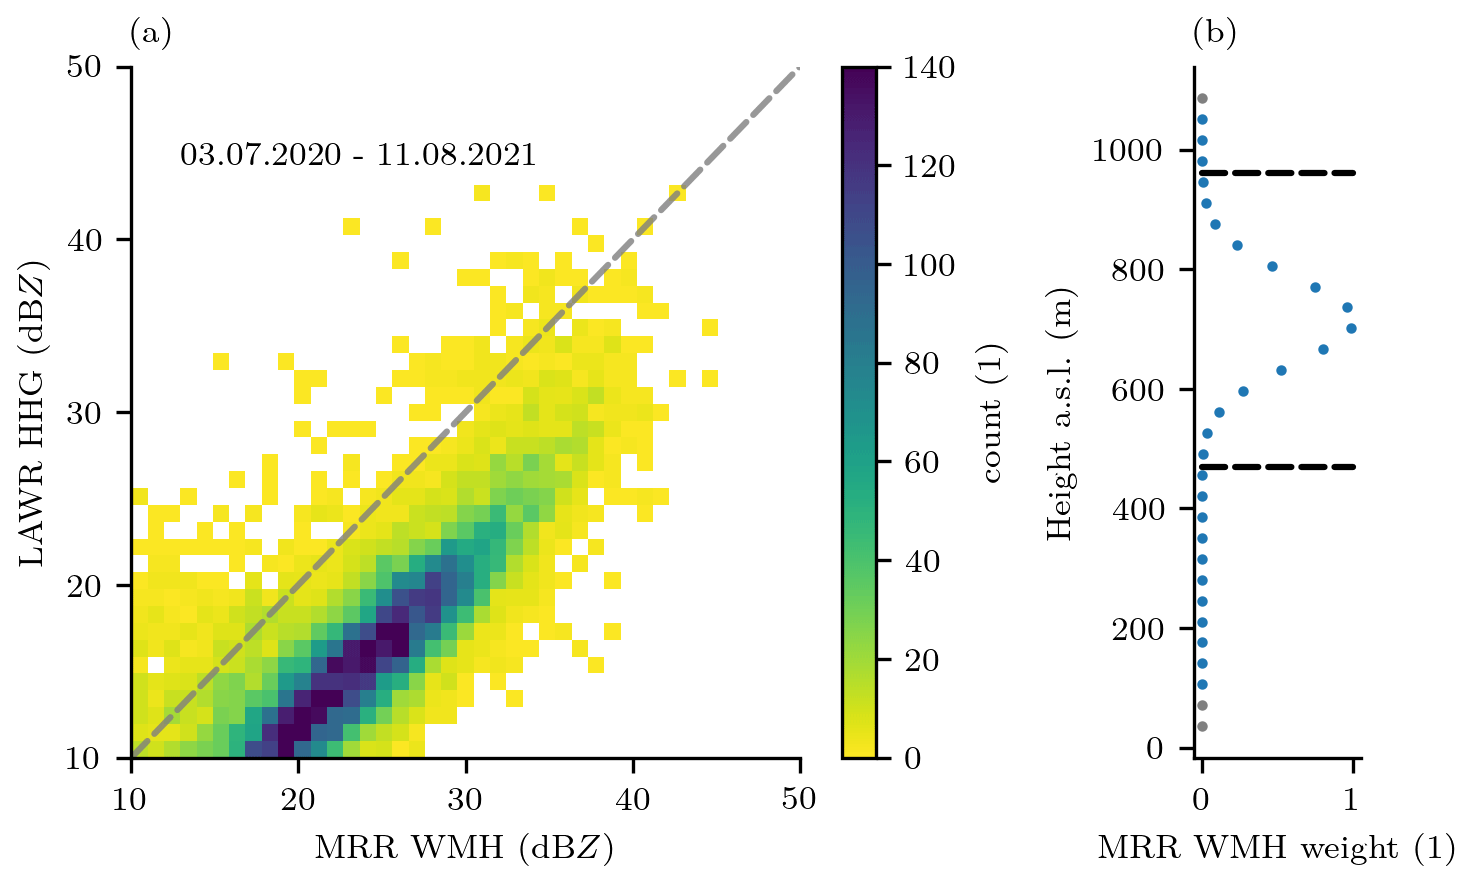
Figure 3Calibration of LAWR radar reflectivities using height averaged MRR radar reflectivities. (a) Comparison of uncalibrated LAWR radar reflectivities to calibrated radar reflectivities of the MRR WMH of the period 3 July 2020 to 11 August 2021 (Table 4). (b) Weights (dots) to average the MRR WMH radar reflectivity profile within the LAWR beam (indicated by black dashed line) measuring at a beam elevation of 3.5°.
The adjusted MRR WMH radar reflectivity is used to calibrate the LAWR radar reflectivity (Fig. 3 a), yielding a consistent calibration, because the MRR WMH and the LAWR are measuring simultaneously since May 2013. The distance between the MRR WMH and the LAWR is 10.07 km. At the MRR WMH location, the LAWR mean radar beam height is between 680 and 1170 m over the years, due to changes in radar alignment (Sect. 3.2), and the radar beam width is 490 m, covering a maximum of 14 range bins of the MRR (Fig. 3b). For radar beam elevation angles above 4.2°, the radar beam exceeds the maximal MRR range gate partly, increasing the volume mismatch. The profile of ZMRR is averaged within the LAWR radar beam using a Gaussian weighting function, with its maximum at the beam centre (Fig. 3b). ZMRR values at 10 s temporal resolution are averaged to the matching 30 s LAWR resolution. Following Lengfeld et al. (2014), the calibration coefficient cLAWR is derived with
with dBZMRR being the radar reflectivity of MRR WMH and dBZLAWR being the radar reflectivity of the LAWR. cLAWR is calculated for radar reflectivities ≥ 10 and < 60 dBZ. The calibration is constrained on the liquid phase; hence, radar reflectivities affected by the melting layer and ice phase are not taken into account. Therefore, the 0 °C isotherm level is estimated using a constant wet adiabatic lapse rate of 5.5 K km−1 and the 2 m temperature measured at the MRR WMH site. Radar reflectivities below the 0 °C isotherm level are used for calibration only. The calibrated radar reflectivity factor is derived from
with the measured radar reflectivity Z. The calibration results in 13 calibration periods with cLAWR between ≈ 0.03 and ≈ 4.4 (Table 4), due to maintenance including technical changes or drifts in signal intensity. The calibrated radar reflectivity is provided as level 1 data set (Burgemeister et al., 2024).
3.5 Correct attenuation
Rain-induced attenuation at X-band frequencies leads to strongly underestimated radar reflectivities and thus rainfall rate estimates. The radar reflectivity factor Z′ at range r suffers from attenuation integrated over the path,
where Z(r) is the unattenuated radar reflectivity factor at range r, and k(s) is the specific attenuation of each range bin. The second term in Eq. (10) is known as the two-way path-integrated attenuation (PIA). Overeem et al. (2021) suggest the modified Kraemer (MK) approach (Jacobi and Heistermann, 2016) to correct the attenuation for single-polarized radars. The MK approach is a forward gate-by-gate attenuation correction (Hitschfeld and Bordan, 1954) based on an iterative scheme to improve empirical parameters of a relationship between k and Z (Krämer and Verworn, 2008), including additional constraints of the PIA and Z (Jacobi and Heistermann, 2016). The attenuation k used in Eq. (10) is estimated from Z (in mm6 m−3) using the power-law relation
with empirical parameters α and β. These empirical parameters are determined iteratively during the attenuation correction procedure. For details of this technique, we refer to the literature (Jacobi and Heistermann, 2016; Overeem et al., 2021) and document here only the specific settings of our implementation: the maximum allowed corrected reflectivity to assume a stable correction scheme is set to 59 dBZ. The PIA is constrained by 10 dB (Delrieu et al., 1999) to avoid numerical instabilities. The number of iterations for α is 100 and for β is 6. The limits of α and β are set to and (Fig. 4). This valid range of α and β is in agreement with estimates of other k–Z relations at X-band frequencies (e.g. Delrieu et al., 1999; Berne and Uijlenhoet, 2006; van de Beek et al., 2010; Diederich et al., 2015; Delrieu et al., 2022).
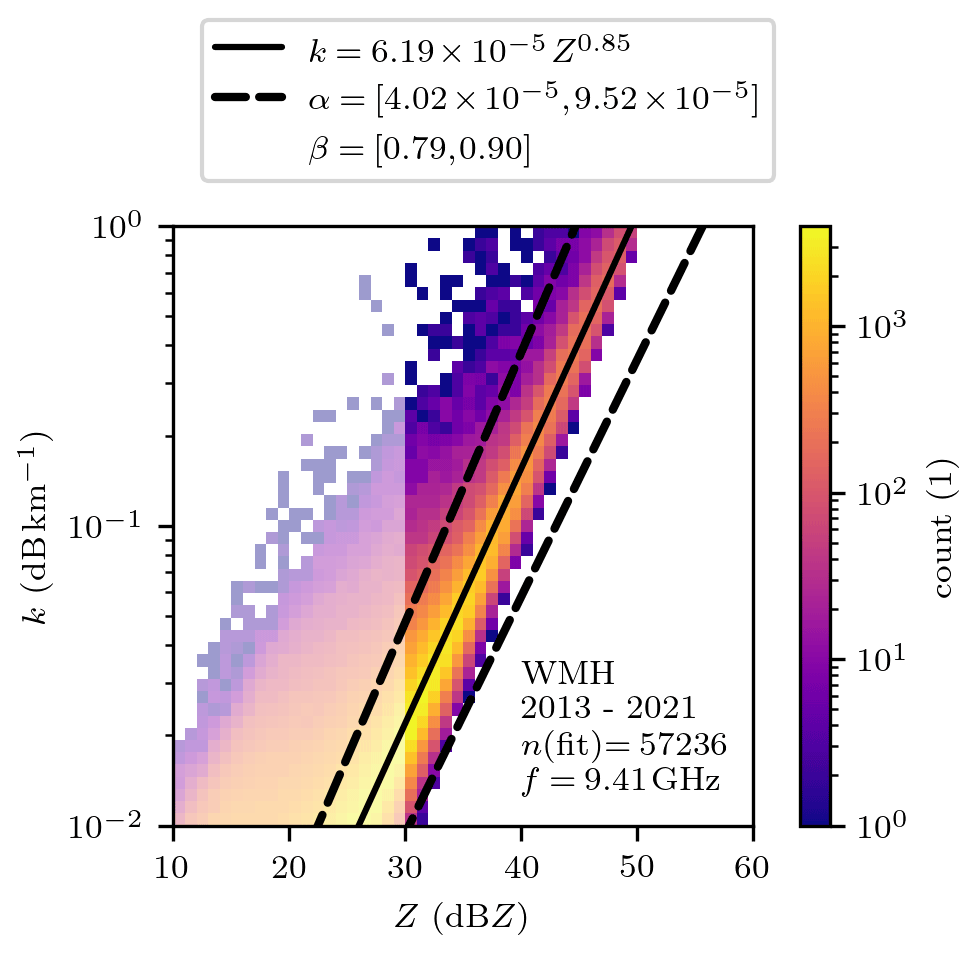
Figure 4Relation between the specific attenuation k and the radar reflectivity dBZ estimated from micro rain radar measurements at 105 m height and 10 s temporal resolution. Only measurements at temperatures above 0 °C are used to exclude ice phase. The radar variables are computed at the X-band frequency from measured drop size distributions with T-matrix calculations (Waterman, 1965) implemented by Leinonen (2014) using raindrop axis ratios from Brandes et al. (2002), a canting angle distribution with zero mean and 10° width, and the complex refractive index of water from Liebe et al. (1991) at a temperature of 15 °C. The power-law fit for the k–Z relation is based on measurements above 30 dBZ (non shaded area) and is shown with a black solid line, including uncertainties indicated as dashed black line.
However, these limits were not available from literature as Jacobi and Heistermann (2016) and Overeem et al. (2021) applied the MK approach only at C-band frequencies. We applied the approach by Overeem et al. (2021) at X-band frequencies. The k–Z relation is estimated from multi-year MRR measurements (Fig. 4). The fit of the k–Z relation (Eq. 11) results in and . The fit is applied only to Z ≥ 30 dBZ to stabilize the solution for relevant values of k affecting the attenuation correction. Overeem et al. (2021) introduced the uncertainties of Eq. (11) based on the errors of k estimates, assuming that the uncertainties in log (α) and β are independent and contributing equally to the total uncertainty in log (k):
The uncertainties result in the aforementioned limits of the empirical parameters and . The standard deviations are estimated from the difference between the 0.16 and 0.84 quantiles of ε (Overeem et al., 2021).
Finally, the MK approach is applied to the radar reflectivity from the level 1 data set, resulting in attenuation-corrected radar reflectivity of the level 2 data set. Additionally, the level 2 data set includes the parameter pia_stability describing the stability of the attenuation correction for every time step. The parameter is 0 for a stable PIA estimate, 1 for a PIA>10 dB, and 2 for a numerically unstable PIA. The attenuation is not corrected if the PIA estimate is numerically unstable. Since the attenuation correction is based on the reflectivity, a prior successful calibration (Sect. 3.4) is mandatory for a stable attenuation correction. The attenuation correction algorithm can be easily applied using the Python package wradlib (Heistermann et al., 2013).
3.6 Estimate rainfall rates
For use in meteorological or hydrological studies, quantitative precipitation estimates are of interest. The attenuation-corrected radar reflectivity factor Z (in mm6 m−3) is converted to a rainfall rate R (in mm h−1) by applying a power-law Z–R relation,
where the multiplicative factor a and the exponent b are empirical constants. This study uses fixed parameters a=200 and b=1.6 proposed by Marshall et al. (1955), keeping in mind that Z and R depend on the drop size distribution, which varies geographically, with rainfall rate, and time (e.g. Doviak and Zrnić, 1993; Villarini and Krajewski, 2010; Berne and Krajewski, 2013). However, the Marshall–Palmer Z–R relation is an appropriate representation of average rainfall conditions in this climate, as investigated with multi-year MRR drop size distributions in Hamburg (not shown) and by Holleman (2006) and Kirsch et al. (2019). The coefficients of the Marshall–Palmer Z–R relation are commonly used for long-term studies in similar climates (e.g. Overeem et al., 2021; Imhoff et al., 2021). Polarimetric rain retrievals cannot be applied due to the lack of polarimetric measurements but would perform better compared to single radar reflectivity methodologies (e.g. Schleiss et al., 2020; Delrieu et al., 2022). The estimated rainfall rate R (Eq. 14) (in mm h−1) is provided as a level 2 data set (Burgemeister et al., 2024).
3.7 Data sets and availability
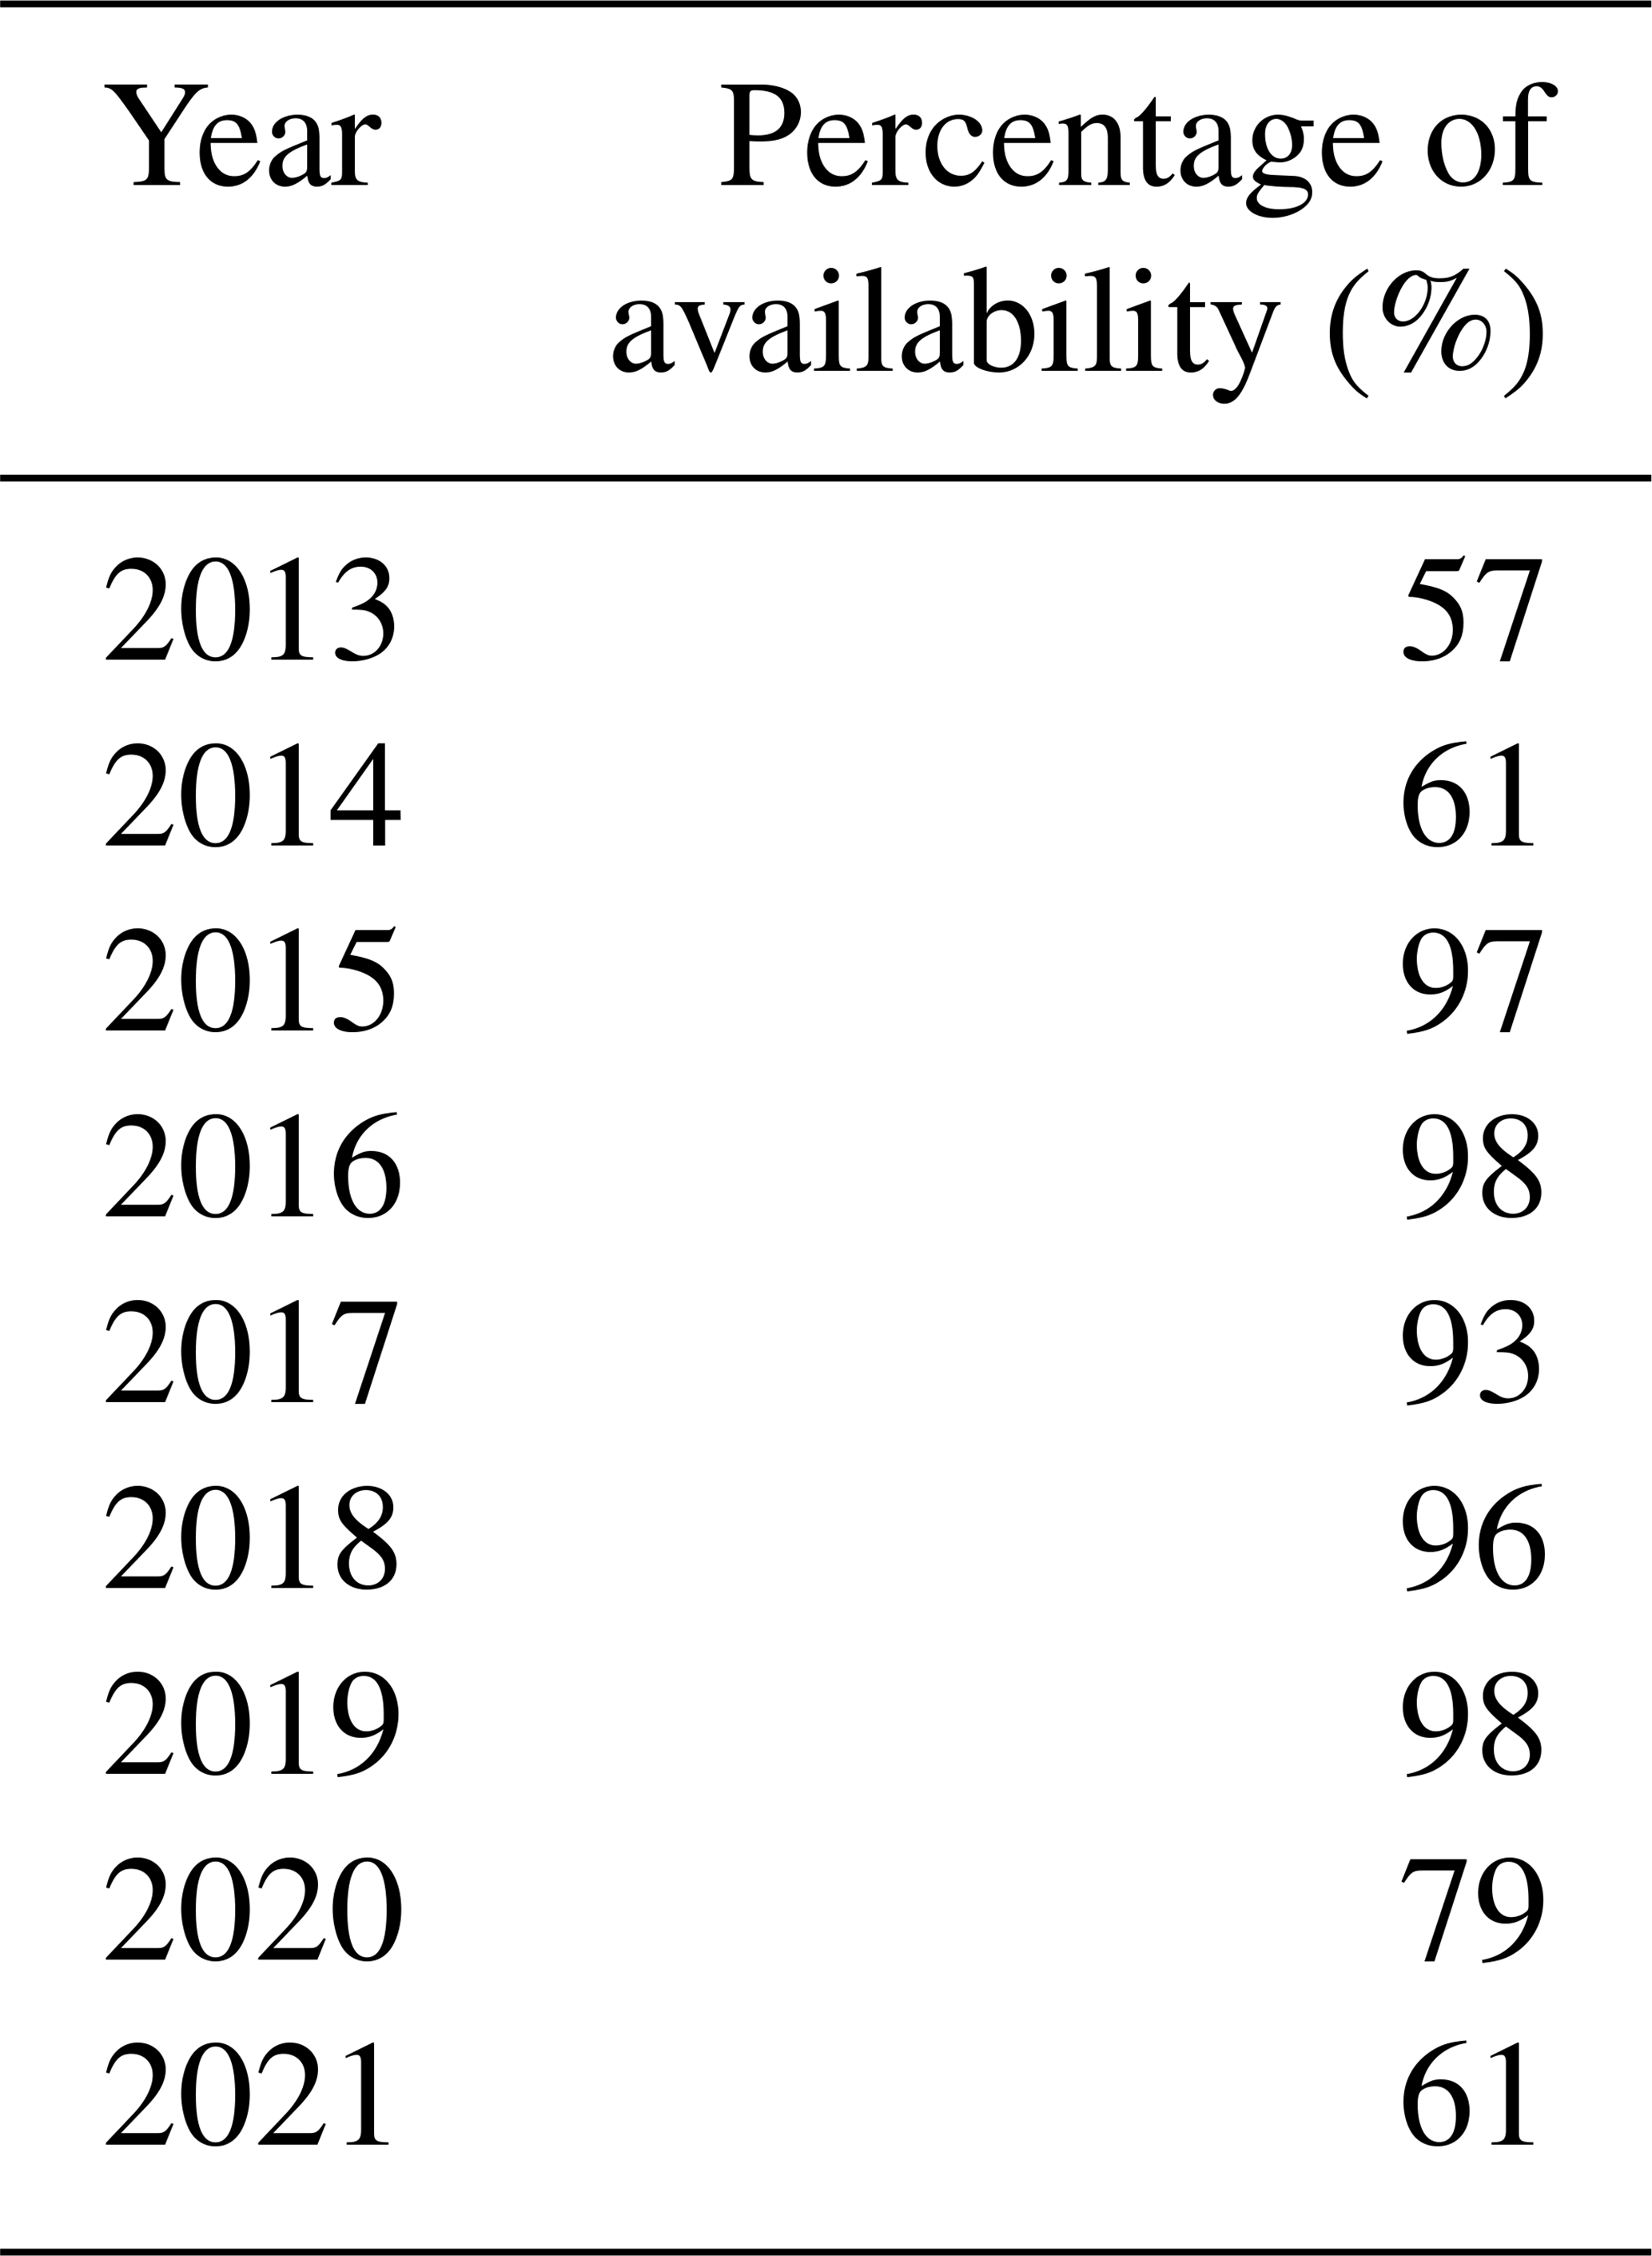
The LAWR is measuring raw radar reflectivities since 27 May 2013 with a yearly data availability of up to 98 % (Table 5). Maintenance, radar errors, or memory errors have reduced the data availability. The LAWR measurements are saved at the listed data levels following the data standard described by Lammert et al. (2018):
-
The raw radar data are the direct radar output saved as hourly binary files.
-
The level 0 data set includes the radar reflectivity dBZ and the standard deviation of the radar reflectivity factor of the averaged single pulses in hourly netCDF files.
-
The level 1 data set includes the calibrated radar reflectivity dBZ (Sect. 3) in daily netCDF files and is freely available (Burgemeister et al., 2024), facilitating studies on attenuation correction and the derivation of further weather radar products, e.g. an improved rainfall rate. Furthermore, new interpolation methods can be tested because interpolated values are tagged with a clutter mask.
-
The level 2 data sets contain the attenuation-corrected radar reflectivity dBZ and rainfall rate R in daily netCDF files. R is provided as an open-access data set (Burgemeister et al., 2024), facilitating refined studies on the spatial and temporal scales of precipitation and further hydrological research, e.g. input data for high-resolution modelling, in an urban area.
Table 5LAWR data availability between the years 2013 and 2021.
All data sets are gridded on the polar observation grid. Additionally, the level 2 data set includes the georeferenced grid information with the latitude, longitude, and height.
Several sources of radar-based errors were adjusted gradually (Sect. 3), aiming to improve the data quality of the radar reflectivity and, consequently, the rainfall rate estimate. This section outlines the performance of the multi-year X-band radar observations and discusses open issues and limitations of the reanalysed data set.
Quantitatively, the reanalysed LAWR measurements are evaluated using MRR measurements at matching heights, following the same procedure as in Sect. 3.4 for the calibration. Therefore, the MRR radar reflectivity factor and rainfall rate are averaged at height levels within the LAWR radar beam using a Gaussian weighting function. The MRR's 10 s temporal resolution is averaged to the matching LAWR's 30 s resolution. The comparison of measurements is constrained to the liquid phase, using the 2 m temperature and a constant wet adiabatic lapse rate, which reduces effects from a bright band.
The LAWR attenuation-corrected radar reflectivity dBZ (level 2 data set) is on average 0.52 dB higher than the MRR WMH reference (Fig. 5). The root-mean-square error (RMSE) equals to 3.93 dB, and the reflectivities are highly correlated with a Pearson correlation coefficient r=0.88. The positive bias is a result of the performed calibration without attenuation correction, because calibrated reflectivities are a prerequisite for stable attenuation correction (Sect. 3.5). Accordingly, all scores improve if only cases with moderate attenuation, below the PIA ≤ 10 dB threshold, are considered: bias of 0.26 dB, a RMSE of 3.52 dB, and r=0.89. Just 8.5 % of the applied attenuation estimates are unstable with . These unstable attenuation estimates appear as a slight visible overestimation of the LAWR measurements at high reflectivities (⪆ 30 dBZ) (Fig. 5), but these measurements are still usable with r=0.79. In the case of a numerically unstable attenuation estimate, radar reflectivities are not corrected (79 times; 0.03 %). Note that only 19.7 % of the LAWR measurements (Fig. 5) are interpolated. The scores depicted in Fig 5 do not change if these measurements are discarded. The independent reflectivity measurements of the MRR BBG (not shown) confirm the data quality: bias of −0.30 dB, RMSE of 3.85 dB, and r=0.88. Hence, the LAWR reflectivity is not biased in total.
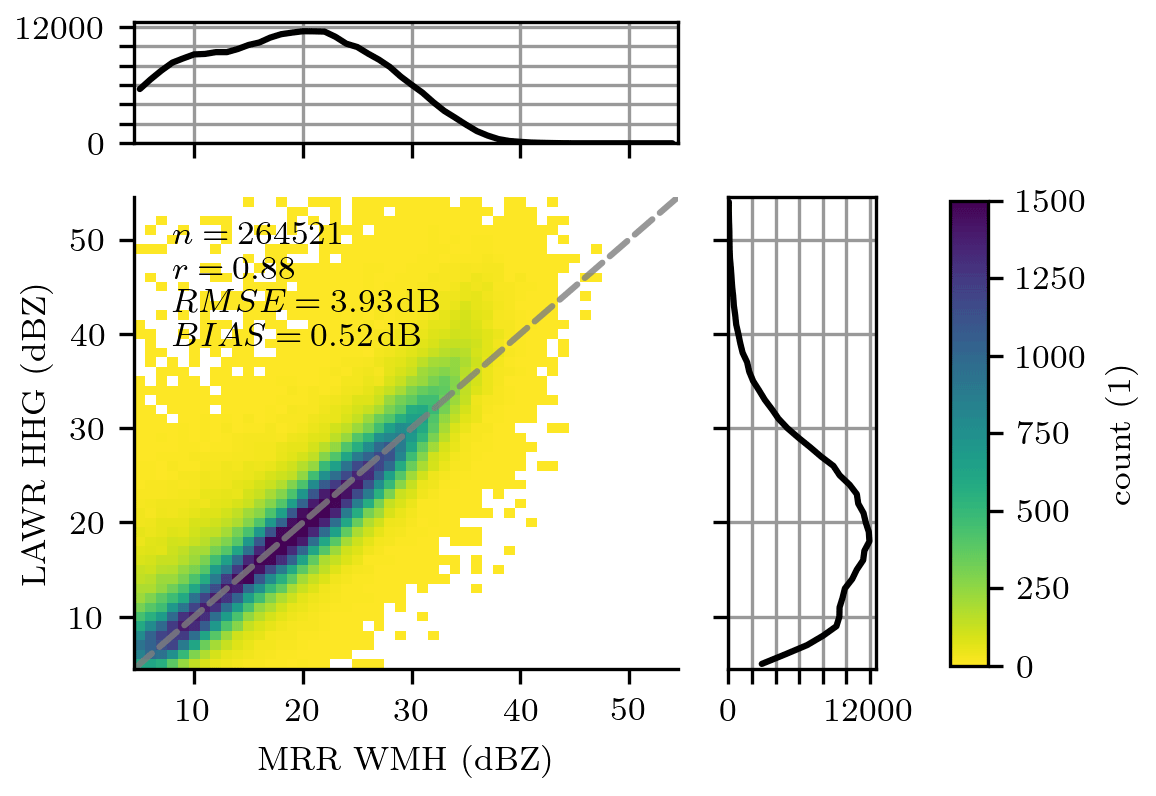
Figure 52D distribution of radar reflectivities estimated from LAWR and MRR WMH based on drop size distributions at common volumes and a temporal resolution of 30 s restricted to dBZ between 4.5 and 59.5dBZ. The measurements are compared for the reanalysed data set covering the years 2013 to 2021.
The LAWR rainfall rate R (level 2 data set) is retrieved from the attenuation-corrected radar reflectivity using the Marshall–Palmer Z–R relation (Sect. 3.6). The LAWR rainfall rate is on average 0.42 mm h−1 lower than the reference (Fig. 6). The RMSE equals to 4.69 mm h−1. The Pearson correlation coefficient for the logarithmic rainfall rate dBR is r=0.74. Since the reflectivities of LAWR and the MRRs are in good agreement, the comparison of the rainfall rates mainly investigates the performance of the Marshall–Palmer Z–R relation. The average underestimation of rainfall rates is in line with Kirsch et al. (2019), who shows that the Marshall–Palmer Z–R relation underestimates rainfall accumulation derived from drop size distributions by between 6.3 % and 17.4 %. The error increases in cases of strong convective precipitation because raindrop size distributions start to deviate from Marshall–Palmer distributions for these cases (Schleiss et al., 2020).
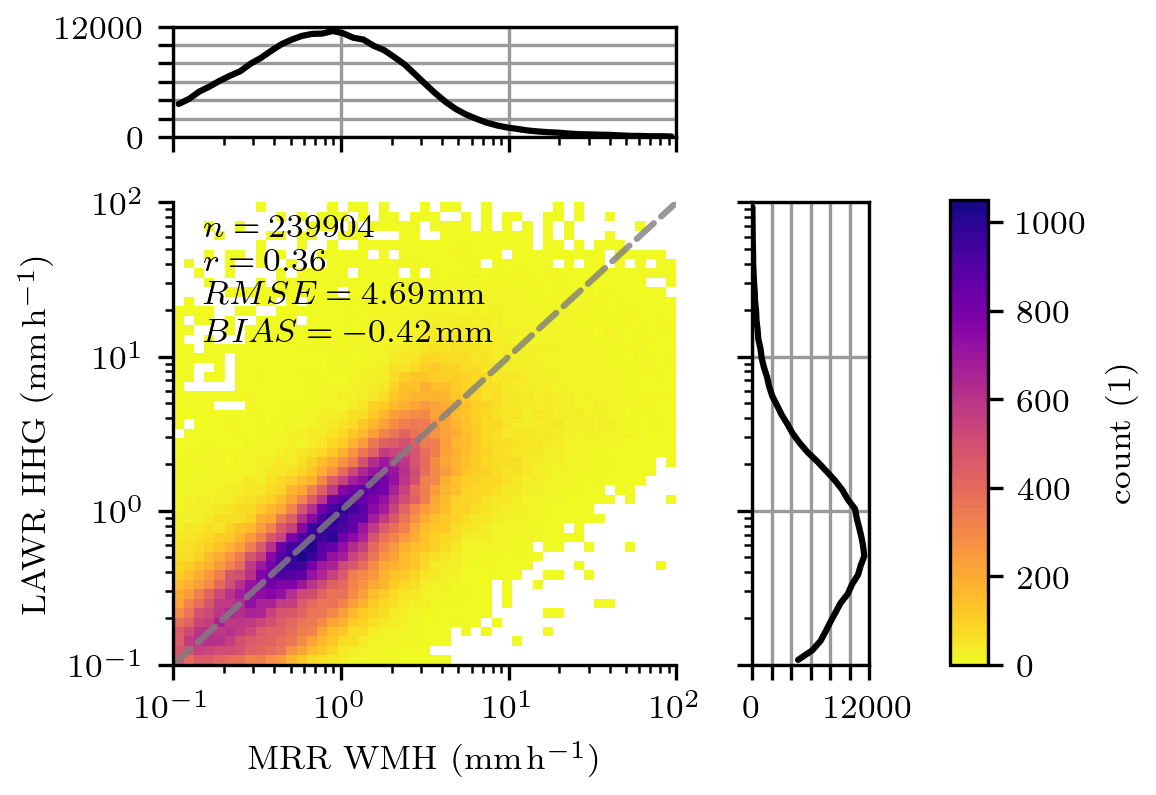
Figure 62D distribution of rainfall rates estimated from LAWR using a standard Z–R relation and MRR WMH based on drop size distributions at a temporal resolution of 30 s and for R between 0.1 and 100 mm h−1.
Although, the rainfall rate estimates can deviate for individual time steps, LAWR measurements reproduce the frequency distribution of rainfall rates as observed by the two MRRs very well (Fig. 7). In particular, the LAWR is able to identify rainy time intervals. The overestimation of low rainfall rates R < 0.2 mm h−1 is probably an issue of the MRR's attenuation correction. The decrease at the lower tail of the frequency distribution of MRR rainfall rate is only observable at high measurement levels (Fig. 8), where the uncertainty of the attenuation correction increases. At near-ground measurement levels, the rainfall rate frequency distributions of MRR and LAWR are equal at low rainfall rates of and high rainfall rates of R > 10 mm h−1. In hydrological applications, accurate rainfall estimates are of interest at ground level (Thorndahl et al., 2017). The vertical variability of rainfall properties, e.g. due to evaporation or wind drift, may limit the application of the provided LAWR rainfall rates at ground level (Villarini and Krajewski, 2010). The evaluation of LAWR rainfall rate at beam height with the MRR WMH measurement at 105 m shows differences in the frequency distribution between 2 and 10 mm h−1 as a possible result of vertical rainfall variability (Fig. 8). Nevertheless, the LAWR measurements yield reliable rainfall rate estimates at beam height and sub-minute temporal scale.
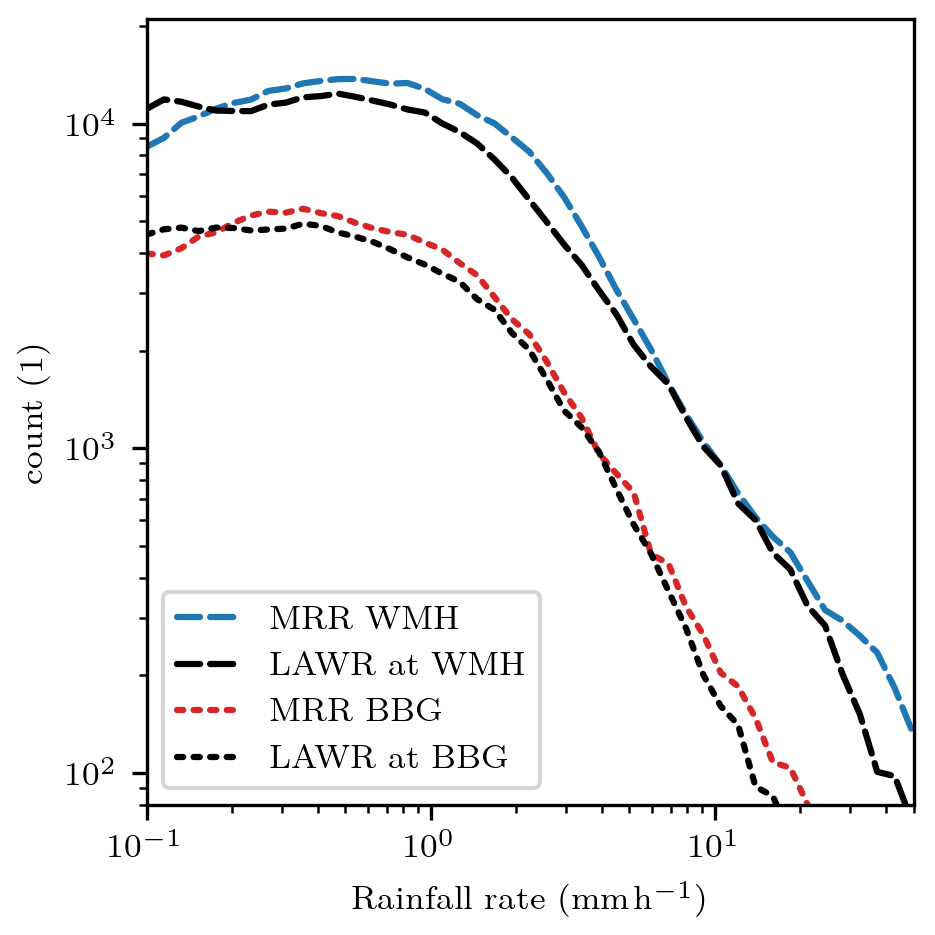
Figure 7Frequency distribution of rainfall rates estimated from LAWR using a Z–R relation and MRR WMH and MRR BBG based on drop size distributions averaged at beam height at a temporal resolution of 30 s.
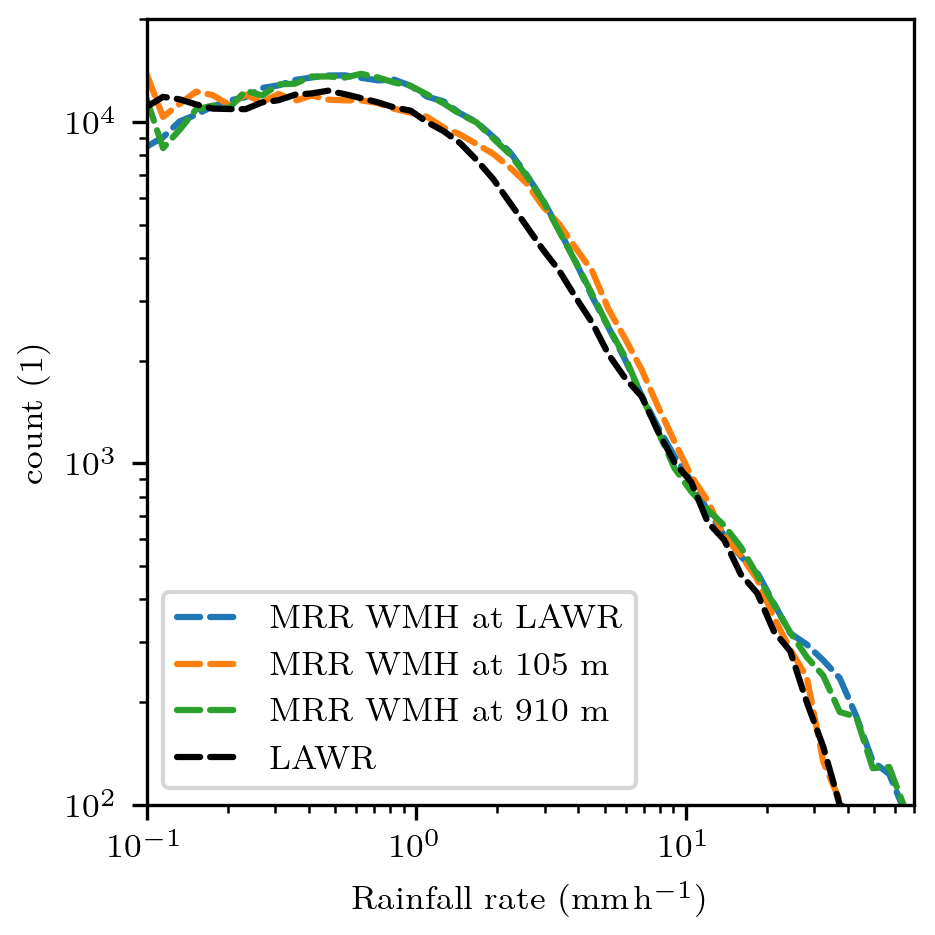
Figure 8Frequency distribution of rainfall rates estimated from LAWR using a Z–R relation and MRR WMH based on drop size distributions at a temporal resolution of 30 s at different height levels and averaged at beam height.
Qualitatively, the LAWR measurements provide continuous spatio-temporal rainfall patterns. The LAWR resolved a characteristic circular hook echo in the 30 s average rainfall rate, demonstrating a rotating rainfall circulation around a tornado (Fig. 9), as discussed by Hoffmann et al. (2018). The provided LAWR rainfall rate R (level 2 data set) shows less remaining clutter compared to the processed rainfall rate by Hoffmann et al. (2018). Differences between the rainfall rates occur due to differences in processing steps, e.g. clutter removal, attenuation correction, and the applied Z–R relationship. However, the qualitative statements remain the same. The hook echo is clearly visible for 8 min, in 16 measurement time steps, accordingly. The German nationwide C-band radars, measuring with 5 min temporal and 250 m range resolutions, show the general rainfall pattern, but the hook echo is only at one measurement time step. As a consequence, this event demonstrates that the LAWR, with its refined spatio-temporal resolution compared to coarser resolved C-band radars, is capable of resolving rainfall patterns with a short duration and relevant gradients at hectometre spatial scales.
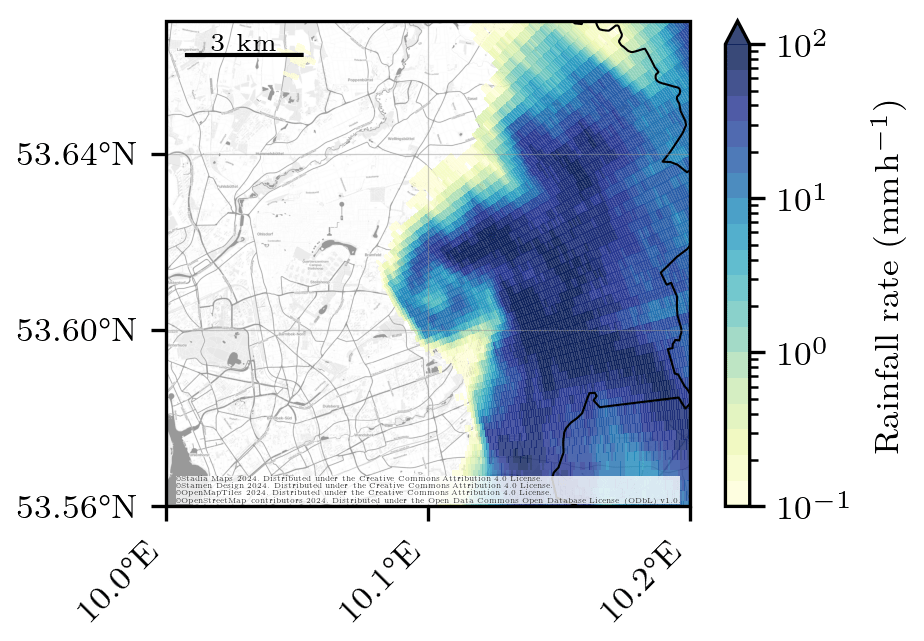
Figure 9Rainfall pattern during a tornado event on 7 June 2016 at 16:20:30 UTC. The rainfall rate is shown for a north-eastern section of the measurement domain in Hamburg. An animation of this event is provided in the Supplement.
The fine-scale structures in rainfall patterns are smoothed by temporal accumulation; nevertheless, spatial differences are still visible in the three-month rainfall accumulation (Fig. 10). The rainfall pattern is mainly driven by convective summer rainfall events. The rainfall accumulations reveal long-term measurement errors, inter alia, remaining clutter close to the radar and three spikes. First, range gates close to the radar are still affected by clutter after the application of correction algorithms, resulting in a small circle of high rainfall accumulations. Approximately 500 m around the radar location, the first 8 of 333 range gates show the overestimated total precipitation. Second, three spikes are characterized by an underestimation of total precipitation affecting multiple azimuth angles over the whole range. Two spikes in the north-east of the radar are a result of metal poles installed at a few metres distance to the radar on the rooftop, reaching into the radar beam. A third spike is in the south of the radar as a result of Hamburg's television tower, which is located 550 m distant from the radar. The spikes affect the azimuth angles roughly from 19 to 30°, 32 to 42°, and 166 to 171°. Note that measurements within these azimuth sectors, comprising 25 of 360 azimuth angles, need to be corrected for beam blockage or rejected for studies using this radar rainfall estimate. Without these errors, the 3-month total precipitation is in general not affected by clutter, noise, or attenuation (Fig. 10). The total precipitation was on average 168.0 mm, and the median is 165.1 mm within the measurement domain in summer 2019. The 3-month rainfall accumulations are spatially variable in Hamburg, with a minimum of 111.6mm and a maximum of 271.3 mm. Note that the rainfall patterns at ground can deviate in comparison to the measured rainfall pattern at beam height because of vertical rainfall variability (Villarini and Krajewski, 2010). Four rain gauges measured 194.8 mm (north), 127.6 mm (east), 134.0 mm (south), and 172.9 mm (west) during the 3 months (Fig. 10). The absolute biases between the radar rainfall accumulations and rain gauge measurements range from 1.9 to 20.1 mm. In general, the rain gauge observations are in agreement with the estimated radar rainfall accumulations during this measurement period. Consequently, the LAWR provides reliable rainfall estimates with accumulation times from 30 s to multiple months.
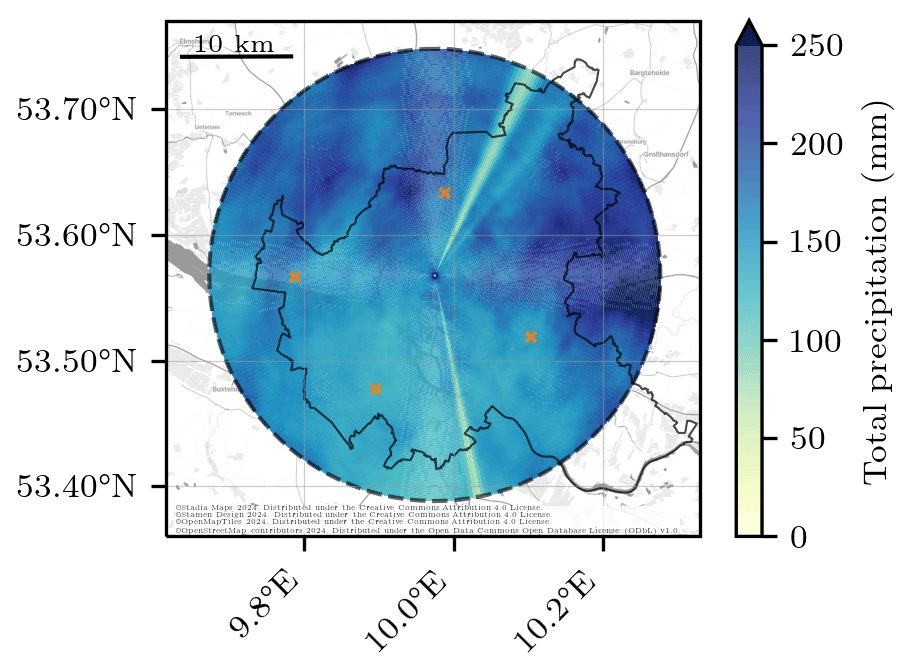
Figure 10Three-month total precipitation measured by the LAWR during June, July, and August 2019. The radar estimates at four rain gauge locations (orange crosses) are 174.7 mm (north), 146.7 mm (east), 132.1 mm (south), and 157.1 mm (west).
All in all, the reanalysed multi-year LAWR measurements give insight into the spatio-temporal structure of rainfall at 30 s temporal scale and hectometre spatial scale in an urban area. The LAWR and MRRs are continuously in good agreement. The reanalysed radar reflectivities and rainfall rates can be used for meteorological and hydrological studies, considering the following limitations:
-
The LAWR data set is constrained to the liquid phase.
-
The attenuation correction can be unstable; thus, radar reflectivities can be overestimated. In rare cases, radar reflectivities are not corrected for a numerically unstable attenuation correction.
-
Differences between the LAWR measurements at beam height and ground observations are a result of vertical variability of rainfall due to wind advection and evaporation of rainfall. Variations between measurement devices arise due to differences in measurement principle and volume mismatches.
-
Remaining clutter and noise may overestimate single measurements. The first range gates can be superimposed by clutter.
-
The LAWR is affected by beam blockage in three directions, resulting in three spikes in range within the measurements.
The pylawr Python package (https://doi.org/10.5281/zenodo.8182628, Burgemeister et al., 2023) provides useful tools to load, process, and plot the LAWR data and was used to process the provided data sets. The LAWR HHG data set of rainfall rates (level 2) and radar reflectivities (level 1) is available at WDCC: https://doi.org/10.26050/WDCC/LAWR_UHH_HHG_v2 (Burgemeister et al., 2024). Further LAWR HHG observational data sets at different processing levels and MRR observations are available upon request. We strongly encourage anyone using the data set to be in contact with the authors.
Firstly, this study describes quality-tested radar reflectivities and rainfall rate estimates with 30 s temporal resolution and hectometre spatial resolution covering the years 2013 to 2021, which are provided as an open-access data set (Burgemeister et al., 2024). Secondly, this study proves the multi-year performance of a local-area X-band weather radar (LAWR) despite the lack of polarization and Doppler information. The LAWR is deployed in combination with a vertically pointing micro rain radar (MRR) and rain gauge in the urban area of Hamburg, Germany, since 2013. The synergy of observations yield reliable LAWR measurements, confirmed by a second MRR.
Several sources of radar-based errors were adjusted gradually, affecting the precipitation estimate, e.g. noise, alignment, non-meteorological echoes, radar calibration, and attenuation. The manually adjusted LAWR alignment was accurately determined, using the solar signal appearing in radar reflectivities during sunrise and sunset, facilitating comparisons with other measurement devices. The deployment of MRRs yields drop size distributions at LAWR beam height. The LAWR reflectivities are calibrated using MRR reflectivities at intersecting volumes. The subsequent calibration of the LAWR is mandatory because of strongly biased measurement periods due to maintenance, shown by the MRR observations. After calibration, the attenuation correction method, the modified Kraemer (MK) approach, is applied. The MRR drop size distributions facilitate the adjustment of parameters based on the relationship between the radar reflectivity and specific attenuation to apply the MK approach at X-band frequencies. This study presents the adjusted parameters and indicates that the MK approach is a reliable attenuation correction method for single-polarized X-band radars, shown with a long-term data set as suggested by Jacobi and Heistermann (2016). The LAWR rainfall rates were estimated from attenuation-corrected reflectivities using the Marshall–Palmer Z–R relationship. The MRR rainfall rates, estimated from drop size distributions, show an on average underestimation of the LAWR rainfall rates estimated. Nevertheless, the retrieved, multi-year LAWR radar reflectivities and rainfall rates are in good agreement with MRR measurements.
Several issues may limit the performance of the LAWR measurements. This study focuses on the liquid phase; hence, solid or mixed-phase precipitation, which is for instance dominant during the winter months, introduces errors within the provided data set, e.g. overestimated radar reflectivities due to the melting layer (Villarini and Krajewski, 2010). Remaining clutter and noise may remain within the reanalysed measurements. Rare unstable attenuation corrections overestimate the LAWR radar reflectivity. Affected radar reflectivities are labelled within the data set. Furthermore, LAWR measurements at beam height can differ from ground observations as a result of vertical rainfall variability due to wind drift and evaporation of rainfall, limiting the application of LAWR rainfall rates at ground level. The largest errors in rainfall rate estimates at individual time steps arise from inherent uncertainties of the Z–R relation, but they do not cause systematic deviation. The frequency distribution of rainfall rates is very well reproduced. Variations between measurement devices arise due to differences in measurement principles and volume mismatches. The assessment of the LAWR alignment identified measurement periods with beam elevation angles up to 6.1°. A high beam elevation angle leads to, inter alia, partial overshooting of MRR measurement volumes, which is a problem of measurement design. The measurement design can be optimized by using lower LAWR beam elevation angles, e.g. 3.5°, or a coarser MRR range resolution, e.g. 50 m. In future, the issue of overshooting will be avoided by using lower beam elevation angles, adding the benefit of measurements at lower altitudes. Measurements at lower beam elevation angles than 3° are not recommended, because the LAWR beam elevation setting is a compromise between measurement altitude and the occurrence of clutter signals. Note that MRR measurements also need quality control (Reinoso-Rondinel and Schleiss, 2021).
This multi-year urban radar rainfall data set is groundwork for further meteorological and hydrological research and is actively used in different meteorological studies (e.g. Kirsch et al., 2022; Schmitt et al., 2023; Ferner et al., 2022). Prospective research may investigate conditional and event-based errors in the multi-year LAWR measurements to quantify limitations of the LAWR. By including comparisons from the LAWR to additional independent sensors, the added value of the spatio-temporal information from low-cost, local-area X-band radars can be investigated. For hydrological research, LAWR rainfall rates should be evaluated with measurements at ground. Future urban precipitation studies will be improved by the extension of networked observations with a second X-band weather radar site and additional micro rain radars in Hamburg, measuring since the beginning of 2021.
The supplement related to this article is available online at: https://doi.org/10.5194/essd-16-2317-2024-supplement.
All authors conceptualized the project and reviewed the draft. FB planned and processed the data sets, performed the evaluation, and wrote and revised the draft. FB and MC maintained the X-band radar. FB and FA edited the draft. MC and FA conceptualized and implemented the measurement network.
The contact author has declared that none of the authors has any competing interests.
Publisher's note: Copernicus Publications remains neutral with regard to jurisdictional claims made in the text, published maps, institutional affiliations, or any other geographical representation in this paper. While Copernicus Publications makes every effort to include appropriate place names, the final responsibility lies with the authors.
Funded by the Deutsche Forschungsgemeinschaft (DFG, German Research Foundation) under Germany's Excellence Strategy – EXC 2037 “CLICCS – Climate, Climatic Change, and Society” – Project Number: 390683824, contribution to the Center for Earth System Research and Sustainability (CEN) of Universität Hamburg. Data from two rain gauges were provided by the German Weather Service (DWD). The X-band radar data are archived at the DKRZ.
This research has been supported by the Deutsche Forschungsgemeinschaft (grant no. 390683824).
This paper was edited by Christof Lorenz and reviewed by two anonymous referees.
Allegretti, M., Bertoldo, S., Prato, A., Lucianaz, C., Rorato, O., Notarpietro, R., and Gabella, M.: X-Band Mini Radar for Observing and Monitoring Rainfall Events, Atmospheric and Climate Sciences, 2, 290–297, https://doi.org/10.4236/acs.2012.23026, number: 3 Publisher: Scientific Research Publishing, 2012. a
Anagnostou, M. N., Nikolopoulos, E. I., Kalogiros, J., Anagnostou, E. N., Marra, F., Mair, E., Bertoldi, G., Tappeiner, U., and Borga, M.: Advancing precipitation estimation and streamflow simulations in complex terrain with X-band dual-polarization radar observations, Remote Sens.-Basel, 10, 1258, https://doi.org/10.3390/rs10081258, 2018. a
Atlas, D., Srivastava, R. C., and Sekhon, R. S.: Doppler radar characteristics of precipitation at vertical incidence, Rev. Geophys., 11, 1–35, https://doi.org/10.1029/RG011i001p00001, 1973. a
Berenguer, M., Park, S., Sempere-Torres, D., Didszun, J., Pool, M., and Pfeifer, M.: RAINSCANNER@Barcelona: an experiment to assess the hydrological value of a portable X-band radar, in: Conference Proceedings of the Seventh European Conference on Radar in Meteorology and Hydrology (ERAD), 25–29 June 2012, Toulouse, France, http://www.meteo.fr/cic/meetings/2012/ERAD/extended_abs/QPE_034_ext_abs.pdf (last access: 16 January 2024), Abstract number: 2 QPE, 2012. a
Berne, A. and Krajewski, W.: Radar for hydrology: Unfulfilled promise or unrecognized potential?, Adv. Water Resour., 51, 357–366, https://doi.org/10.1016/j.advwatres.2012.05.005, 2013. a, b
Berne, A. and Uijlenhoet, R.: Quantitative analysis of X-band weather radar attenuation correction accuracy, Nat. Hazards Earth Syst. Sci., 6, 419–425, https://doi.org/10.5194/nhess-6-419-2006, 2006. a
Berne, A., Delrieu, G., Creutin, J.-D., and Obled, C.: Temporal and spatial resolution of rainfall measurements required for urban hydrology, J. Hydrol., 299, 166–179, https://doi.org/10.1016/j.jhydrol.2004.08.002, 2004. a
Brandes, E. A., Zhang, G., and Vivekanandan, J.: Experiments in rainfall estimation with a polarimetric radar in a subtropical environment, J. Appl. Meteorol., 41, 674–685, https://doi.org/10.1175/1520-0450(2002)041<0674:EIREWA>2.0.CO;2, 2002. a
Burgemeister, F., Clemens, M., and Ament, F.: Rainfall rates estimated from X-Band radar observations during FESSTVaL 2021, Universität Hamburg [data set], https://doi.org/10.25592/uhhfdm.10090, 2022. a
Burgemeister, F., Finn, T., Schaper, M., and Büchau, Y.: pylawr: A Python Package For Processing Local Area Weather Radars, Zenodo [code], https://doi.org/10.5281/zenodo.8182628, 2023. a
Burgemeister, F., Clemens, M., and Ament, F.: Multi-year X-band weather radar observations in Hamburg (LAWR HHG) (Version 2), World Data Center for Climate (WDCC) at DKRZ [data set], https://doi.org/10.26050/WDCC/LAWR_UHH_HHG_v2, 2024. a, b, c, d, e, f, g, h
Cao, X., Qi, Y., and Ni, G.: X-band polarimetric radar QPE for urban hydrology: The increased contribution of high-resolution rainfall capturing, J. Hydrol., 617, 128905, https://doi.org/10.1016/j.jhydrol.2022.128905, 2023. a
Cressie, N.: Statistics for spatial data, John Wiley & Sons, New York, https://doi.org/10.1002/9781119115151, 1993. a
Delrieu, G., Hucke, L., and Creutin, J. D.: Attenuation in rain for X-and C-band weather radar systems: Sensitivity with respect to the drop size distribution, J. Appl. Meteorol., 38, 57–68, 1999. a, b
Delrieu, G., Khanal, A. K., Cazenave, F., and Boudevillain, B.: Sensitivity analysis of attenuation in convective rainfall at X-band frequency using the mountain reference technique, Atmos. Meas. Tech., 15, 3297–3314, https://doi.org/10.5194/amt-15-3297-2022, 2022. a, b
Diederich, M., Ryzhkov, A., Simmer, C., Zhang, P., and Trömel, S.: Use of Specific Attenuation for Rainfall Measurement at X-Band Radar Wavelengths. Part I: Radar Calibration and Partial Beam Blockage Estimation, J. Hydrometeorol., 16, 487–502, https://doi.org/10.1175/JHM-D-14-0066.1, 2015. a
Doviak, R. J. and Zrnić, D. S.: Doppler radar and weather observations, Dover Publications, Mineola, New York, 1993. a, b
Einfalt, T., Arnbjerg-Nielsen, K., Golz, C., Jensen, N.-E., Quirmbach, M., Vaes, G., and Vieux, B.: Towards a roadmap for use of radar rainfall data in urban drainage, J. Hydrol., 299, 186–202, 2004. a
Ferner, K. S., Boettcher, M., and Schlünzen, K. H.: Modelling the heterogeneity of rain in an urban neighbourhood with an obstacle-resolving model, Meteorol. Z., 32, 67–81, https://doi.org/10.1127/metz/2022/1149, 2022. a
Gires, A., Tchiguirinskaia, I., Schertzer, D., and Lovejoy, S.: Multifractal analysis of a semi-distributed urban hydrological model, Urban Water J., 10, 195–208, https://doi.org/10.1080/1573062X.2012.716447, 2013. a
Heistermann, M., Jacobi, S., and Pfaff, T.: Technical Note: An open source library for processing weather radar data (wradlib), Hydrol. Earth Syst. Sci., 17, 863–871, https://doi.org/10.5194/hess-17-863-2013, 2013. a
Hitschfeld, W. and Bordan, J.: Errors inherent in the radar measurement of rainfall at attenuating wavelengths, J. Meteorol., 11, 58–67, 1954. a
Hoffmann, P., Merker, C., Lengfeld, K., and Ament, F.: The Hamburg Tornado (7 June 2016) from the perspective of low-cost high-resolution radar data and weather forecast model, Atmos. Res., 211, 1–11, https://doi.org/10.1016/j.atmosres.2018.04.009, 2018. a, b, c
Holleman, I.: Bias adjustment of radar-based 3-hour precipitation accumulations, Tech. rep., KNMI, De Bilt, the Netherlands, 2006. a
Hosseini, S. H., Hashemi, H., Berndtsson, R., South, N., Aspegren, H., Larsson, R., Olsson, J., Persson, A., and Olsson, L.: Evaluation of a new X-band weather radar for operational use in south Sweden, Water Sci. Technol., 81, 1623–1635, 2020. a
Hosseini, S. H., Hashemi, H., Larsson, R., and Berndtsson, R.: Merging dual-polarization X-band radar network intelligence for improved microscale observation of summer rainfall in south Sweden, J. Hydrol., 617, 129090, https://doi.org/10.1016/j.jhydrol.2023.129090, 2023. a
Hubbert, J. C., Dixon, M., and Ellis, S. M.: Weather Radar Ground Clutter. Part II: Real-Time Identification and Filtering, J. Atmos. Ocean. Tech., 26, 1181–1197, https://doi.org/10.1175/2009JTECHA1160.1, 2009. a, b, c, d
Huuskonen, A. and Holleman, I.: Determining weather radar antenna pointing using signals detected from the sun at low antenna elevations, J. Atmos. Ocean. Tech., 24, 476–483, https://doi.org/10.1175/JTECH1978.1, 2007. a
Imhoff, R., Brauer, C., van Heeringen, K.-J., Leijnse, H., Overeem, A., Weerts, A., and Uijlenhoet, R.: A climatological benchmark for operational radar rainfall bias reduction, Hydrol. Earth Syst. Sci., 25, 4061–4080, https://doi.org/10.5194/hess-25-4061-2021, 2021. a
Jacobi, S. and Heistermann, M.: Benchmarking attenuation correction procedures for six years of single-polarized C-band weather radar observations in South-West Germany, Geomatics, Natural Hazards and Risk, 7, 1785–1799, https://doi.org/10.1080/19475705.2016.1155080, 2016. a, b, c, d, e
Kirsch, B., Clemens, M., and Ament, F.: Stratiform and Convective Radar Reflectivity–Rain Rate Relationships and Their Potential to Improve Radar Rainfall Estimates, J. Appl. Meteorol. Clim., 58, 2259–2271, https://doi.org/10.1175/JAMC-D-19-0077.1, 2019. a, b
Kirsch, B., Hohenegger, C., Klocke, D., Senke, R., Offermann, M., and Ament, F.: Sub-mesoscale observations of convective cold pools with a dense station network in Hamburg, Germany, Earth Syst. Sci. Data, 14, 3531–3548, https://doi.org/10.5194/essd-14-3531-2022, 2022. a
Krämer, S. and Verworn, H.: Improved C-band radar data processing for real time control of urban drainage systems, in: Proceedings of the 11th International Conference on Urban Drainage, 31 August–5 September 2008, Edinburgh, United Kingdom, vol. 31, pp. 1–10, IWA Publ. London, 2008. a
Lammert, A., Grützun, V., and Stamnas, E.: The SAMD Product Standard (Standardized Atmospheric Measurement Data), Zenodo [data set], https://doi.org/10.5281/zenodo.1741364, 2018. a
Leinonen, J.: High-level interface to T-matrix scattering calculations: architecture, capabilities and limitations, Opt. Express, 22, 1655–1660, https://doi.org/10.1364/OE.22.001655, 2014. a
Lengfeld, K., Clemens, M., Münster, H., and Ament, F.: Performance of high-resolution X-band weather radar networks – the PATTERN example, Atmos. Meas. Tech., 7, 4151–4166, https://doi.org/10.5194/amt-7-4151-2014, 2014. a, b, c, d, e, f, g, h, i, j, k
Lengfeld, K., Clemens, M., Merker, C., Münster, H., and Ament, F.: A simple method for attenuation correction in local X-band radar measurements using C-band radar data, J. Atmos. Ocean. Tech., 33, 2315–2329, https://doi.org/10.1175/JTECH-D-15-0091.1, 2016. a
Lengfeld, K., Berenguer, M., and Torres, D. S.: Intercomparison of attenuation correction algorithms for single-polarized X-band radars, Atmos. Res., 201, 116–132, https://doi.org/10.1016/j.atmosres.2017.10.020, 2018. a
Lengfeld, K., Winterrath, T., Junghänel, T., Hafer, M., and Becker, A.: Characteristic spatial extent of hourly and daily precipitation events in Germany derived from 16 years of radar data, Meteorol. Z., 28, 363–378, https://doi.org/10.1127/metz/2019/0964, 2019. a
Liebe, H. J., Hufford, G. A., and Manabe, T.: A model for the complex permittivity of water at frequencies below 1 THz, International Journal of Infrared and Millimeter Waves, 12, 659–675, 1991. a
Lo Conti, F., Francipane, A., Pumo, D., and Noto, L. V.: Exploring single polarization X-band weather radar potentials for local meteorological and hydrological applications, J. Hydrol., 531, 508–522, https://doi.org/10.1016/j.jhydrol.2015.10.071, 2015. a, b
Maesaka, T., Maki, M., and Iwanami, K.: Operational Rainfall Estimation by X-band MP Radar Network in MLIT, Japan, in: In Proceedings of the 35th Conference on Radar Meteorology, Pittsburgh, PA, USA, 26–30 September 2011, p. 8, 2011. a
Maier, R., Krebs, G., Pichler, M., Muschalla, D., and Gruber, G.: Spatial rainfall variability in urban environments–High-density precipitation measurements on a city-scale, Water, 12, 1157, https://doi.org/10.3390/w12041157, 2020. a
Marra, F. and Morin, E.: Autocorrelation structure of convective rainfall in semiarid-arid climate derived from high-resolution X-Band radar estimates, Atmos. Res., 200, 126–138, https://doi.org/10.1016/j.atmosres.2017.09.020, 2018. a
Marshall, J., Hitschfeld, W., and Gunn, K.: Advances in radar weather, in: Advances in geophysics, vol. 2, edited by: Landsberg, H. E., Elsevier, New York, USA, 1–56, https://doi.org/10.1016/S0065-2687(08)60310-6, 1955. a
Metek: MRR Physical Basics, Tech. rep., Metek Meteorologische Messtechnik GmbH, Elmshorn, Germany, 2015. a
Mishra, K. V., Krajewski, W. F., Goska, R., Ceynar, D., Seo, B.-C., Kruger, A., Niemeier, J. J., Galvez, M. B., Thurai, M., Bringi, V. N., Tolstoy, L., Kucera, P. A., Petersen, W. A., Grazioli, J., and Pazmany, A. L.: Deployment and Performance Analyses of High-Resolution Iowa XPOL Radar System during the NASA IFloodS Campaign, J. Hydrometeorol., 17, 455–479, https://doi.org/10.1175/JHM-D-15-0029.1, 2016. a
Neely III, R. R., Parry, L., Dufton, D., Bennett, L., and Collier, C.: Radar Applications in Northern Scotland (RAiNS), J. Hydrometeorol., 22, 483–498, https://doi.org/10.1175/JHM-D-19-0184.1, 2021. a
Ochoa-Rodriguez, S., Wang, L.-P., Gires, A., Pina, R. D., Reinoso-Rondinel, R., Bruni, G., Ichiba, A., Gaitan, S., Cristiano, E., van Assel, J., Kroll, S., Murlà-Tuyls, D., Tisserand, B., Schertzer, D., Tchiguirinskaia, I., Onof, C., Willems, P., and ten Veldhuis, M.-C.: Impact of spatial and temporal resolution of rainfall inputs on urban hydrodynamic modelling outputs: A multi-catchment investigation, J. Hydrol., 531, 389–407, https://doi.org/10.1016/j.jhydrol.2015.05.035, 2015. a
Overeem, A., de Vries, H., Al Sakka, H., Uijlenhoet, R., and Leijnse, H.: Rainfall-induced attenuation correction for two operational dual-polarization C-band radars in the Netherlands, J. Atmos. Ocean. Tech., 38, 1125–1142, https://doi.org/10.1175/JTECH-D-20-0113.1, 2021. a, b, c, d, e, f, g
Overeem, A., van den Besselaar, E., van der Schrier, G., Meirink, J. F., van der Plas, E., and Leijnse, H.: EURADCLIM: the European climatological high-resolution gauge-adjusted radar precipitation dataset, Earth Syst. Sci. Data, 15, 1441–1464, https://doi.org/10.5194/essd-15-1441-2023, 2023. a
Pejcic, V., Soderholm, J., Mühlbauer, K., Louf, V., and Trömel, S.: Five years calibrated observations from the University of Bonn X-band weather radar (BoXPol), Scientific Data, 9, 551, https://doi.org/10.1038/s41597-022-01656-0, 2022. a
Peters, G., Fischer, B., and Andersson, T.: Rain observations with a vertically looking Micro Rain Radar (MRR), Boreal Environ. Res., 7, 353–362, 2002. a
Peters, G., Fischer, B., Münster, H., Clemens, M., and Wagner, A.: Profiles of raindrop size distributions as retrieved by microrain radars, J. Appl. Meteorol., 44, 1930–1949, https://doi.org/10.1175/JAM2316.1, 2005. a
Reda, I. and Andreas, A.: Solar Position Algorithm for Solar Radiation Applications (Revised), Tech. rep., National Renewable Energy Lab. (NREL), Golden, CO, United States, https://doi.org/10.2172/15003974, 2008. a
Reinoso-Rondinel, R. and Schleiss, M.: Quantitative Evaluation of Polarimetric Estimates from Scanning Weather Radars Using a Vertically Pointing Micro Rain Radar, J. Atmos. Ocean. Tech., 38, 481–499, https://doi.org/10.1175/JTECH-D-20-0062.1, 2021. a
Rubel, F. and Hantel, M.: Correction of daily rain gauge measurements in the Baltic Sea drainage basin, Hydrol. Res., 30, 191–208, 1999. a
Schleiss, M., Olsson, J., Berg, P., Niemi, T., Kokkonen, T., Thorndahl, S., Nielsen, R., Ellerbæk Nielsen, J., Bozhinova, D., and Pulkkinen, S.: The accuracy of weather radar in heavy rain: a comparative study for Denmark, the Netherlands, Finland and Sweden, Hydrol. Earth Syst. Sci., 24, 3157–3188, https://doi.org/10.5194/hess-24-3157-2020, 2020. a, b, c, d
Schmitt, A. U., Burgemeister, F., Dorff, H., Finn, T., Hansen, A., Kirsch, B., Lange, I., Radtke, J., and Ament, F.: Assessing the weather conditions for urban cyclists by spatially dense measurements with an agent-based approach, Meteorol. Appl., 30, e2164, https://doi.org/10.1002/met.2164, 2023. a
Stafford, B., Louis, R., Wilson, R., Rejeté, F., Borsetti, M., Bachmann, A., Aronovitch, A., Blennerhassett, E., Hardy, W., steelman, Kiselev, A., Firing, E., Semeniuc, E., Kundert, P., Arron-Walker, T., solarjoe, Wallace, A., bfrobin446, Luiten, C., Rackwitz, C., Maliarik, D., Hasan, Deane, J., van Haarst, J., Heikkilä, J., Maron, J., Leal Contreras, J. L., Buffat, R., Jensen, A. R., and Russo, A.: Pysolar: staring directly at the sun since 2007 (pingswept/pysolar: 0.10), Zenodo [code], https://doi.org/10.5281/zenodo.5518129, 2021. a
Thorndahl, S., Einfalt, T., Willems, P., Nielsen, J. E., ten Veldhuis, M.-C., Arnbjerg-Nielsen, K., Rasmussen, M. R., and Molnar, P.: Weather radar rainfall data in urban hydrology, Hydrol. Earth Syst. Sci., 21, 1359–1380, https://doi.org/10.5194/hess-21-1359-2017, 2017. a, b, c
van de Beek, C. Z., Leijnse, H., Stricker, J. N. M., Uijlenhoet, R., and Russchenberg, H. W. J.: Performance of high-resolution X-band radar for rainfall measurement in The Netherlands, Hydrol. Earth Syst. Sci., 14, 205–221, https://doi.org/10.5194/hess-14-205-2010, 2010. a, b, c, d
Ventura, J. F. i. and Russchenberg, H. W. J.: Towards a better understanding of the impact of anthropogenic aerosols in the hydrological cycle: IDRA, IRCTR drizzle radar, Phys. Chem. Earth Pt. A/B/C, 34, 88–92, https://doi.org/10.1016/j.pce.2008.02.038, 2009. a
Villarini, G. and Krajewski, W. F.: Review of the Different Sources of Uncertainty in Single Polarization Radar-Based Estimates of Rainfall, Surv. Geophys., 31, 107–129, https://doi.org/10.1007/s10712-009-9079-x, 2010. a, b, c, d, e
Villarini, G., Mandapaka, P. V., Krajewski, W. F., and Moore, R. J.: Rainfall and sampling uncertainties: A rain gauge perspective, J. Geophys. Res.-Atmos., 113, https://doi.org/10.1029/2007JD009214, 2008. a
Wang, Y. and Chandrasekar, V.: Quantitative Precipitation Estimation in the CASA X-band Dual-Polarization Radar Network, J. Atmos. Ocean. Tech., 27, 1665–1676, https://doi.org/10.1175/2010JTECHA1419.1, 2010. a
Waterman, P.: Matrix formulation of electromagnetic scattering, P. IEEE, 53, 805–812, 1965. a
Wesson, S. M. and Pegram, G. G. S.: Radar rainfall image repair techniques, Hydrol. Earth Syst. Sci., 8, 220–234, https://doi.org/10.5194/hess-8-220-2004, 2004. a
Winterrath, T., Brendel, T., Junghänel, T., Klameth, A., Lengfeld, K., Walawender, E., Weigl, E., Hafer, M., and Becker, A.: An overview of the new radar-based precipitation climatology of the Deutscher Wetterdienst–data, methods, products, in: Rainfall Monitoring, Modelling and Forecasting in Urban Environment. UrbanRain18: 11th International Workshop on Precipitation in Urban Areas, 5–7 December 2008, Pontresina, Switzerland, Conference Proceedings, ETH Zurich, Institute of Environmental Engineering, pp. 132–137, 2018. a
Yoon, J., Joo, J., Yoo, C., Hwang, S., and Lim, S.: On quality of radar rainfall with respect to temporal and spatial resolution for application to urban areas, Meteorol. Appl., 24, 19–30, 2017. a