the Creative Commons Attribution 4.0 License.
the Creative Commons Attribution 4.0 License.
 | 30 Apr 2024
The annual update GLODAPv2.2023: the global interior ocean biogeochemical data product
Siv K. Lauvset
Nico Lange
Toste Tanhua
Henry C. Bittig
Are Olsen
Alex Kozyr
Marta Álvarez
Kumiko Azetsu-Scott
Peter J. Brown
Brendan R. Carter
Leticia Cotrim da Cunha
Mario Hoppema
Matthew P. Humphreys
Masao Ishii
Emil Jeansson
Akihiko Murata
Jens Daniel Müller
Fiz F. Pérez
Carsten Schirnick
Reiner Steinfeldt
Toru Suzuki
Adam Ulfsbo
Anton Velo
Ryan J. Woosley
Robert M. Key
The Global Ocean Data Analysis Project (GLODAP) is a synthesis effort providing regular compilations of surface to bottom ocean biogeochemical bottle data, with an emphasis on seawater inorganic carbon chemistry and related variables determined through chemical analysis of seawater samples. GLODAPv2.2023 is an update of the previous version, GLODAPv2.2022 (Lauvset et al., 2022). The major changes are as follows: data from 23 new cruises were added. In addition, a number of changes were made to the data included in GLODAPv2.2022. GLODAPv2.2023 includes measurements from more than 1.4 million water samples from the global oceans collected on 1108 cruises. The data for the now 13 GLODAP core variables (salinity, oxygen, nitrate, silicate, phosphate, dissolved inorganic carbon, total alkalinity, pH, chlorofluorocarbon-11 (CFC-11), CFC-12, CFC-113, CCl4, and SF6) have undergone extensive quality control with a focus on the systematic evaluation of bias. The data are available in two formats: (i) as submitted by the data originator but converted to World Ocean Circulation Experiment (WOCE) exchange format and (ii) as a merged data product with adjustments applied to minimize bias. For the present annual update, adjustments for the 23 new cruises were derived by comparing those data with the data from the 1085 quality-controlled cruises in the GLODAPv2.2022 data product using crossover analysis. SF6 data from all cruises were evaluated by comparison with CFC-12 data measured on the same cruises. For nutrients and ocean carbon dioxide (CO2), chemistry comparisons to estimates based on empirical algorithms provided additional context for adjustment decisions. The adjustments that we applied are intended to remove potential biases from errors related to measurement, calibration, and data-handling practices without removing known or likely time trends or variations in the variables evaluated. The compiled and adjusted data product is believed to be consistent to better than 0.005 in salinity, 1 % in oxygen, 2 % in nitrate, 2 % in silicate, 2 % in phosphate, 4 µmol kg−1 in dissolved inorganic carbon, 4 µmol kg−1 in total alkalinity, 0.01–0.02 in pH (depending on region), and 5 % in the halogenated transient tracers. The other variables included in the compilation, such as isotopic tracers and discrete CO2 fugacity (fCO2), were not subjected to bias comparison or adjustments.
The original data, their documentation, and DOI codes are available at the Ocean Carbon and Acidification Data System of NOAA National Centers for Environmental Information (NCEI), which also provides access to the merged data product. This is provided as a single global file and as four regional ones – the Arctic, Atlantic, Indian, and Pacific oceans – under https://doi.org/10.25921/zyrq-ht66 (Lauvset et al., 2023). These bias-adjusted product files also include significant ancillary and approximated data, which were obtained by interpolation of, or calculation from, measured data. This living data update documents the GLODAPv2.2023 methods and provides a broad overview of the secondary quality control procedures and results.


The oceans mitigate climate change by absorbing both atmospheric CO2 corresponding to a significant fraction of anthropogenic CO2 emissions (Friedlingstein et al., 2022; Gruber et al., 2019; Müller et al., 2023) and most of the excess heat in the Earth system caused by the enhanced greenhouse effect (Cheng et al., 2017; Cheng et al., 2020). The objective of GLODAP (Global Ocean Data Analysis Project, https://www.glodap.info, last access: 7 September 2023; GLODAP, 2024b) is to provide high-quality and bias-corrected water column bottle data from the ocean surface to the sea floor. These data should be used to document the state and the evolving changes in physical and chemical ocean properties, e.g., the inventory of anthropogenic CO2 in the ocean, natural oceanic carbon, ocean acidification, ventilation rates, oxygen levels, and vertical nutrient transports (Tanhua et al., 2021). The core quality-controlled and bias-adjusted variables of GLODAP are salinity, dissolved oxygen, inorganic macronutrients (nitrate, silicate, and phosphate), seawater CO2 chemistry variables (dissolved inorganic carbon – TCO2; total alkalinity – TAlk; pH on the total hydrogen ion, or H+, scale), the halogenated transient tracers chlorofluorocarbon-11 (CFC-11), CFC-12, CFC-113, carbon tetrachloride (CCl4), and sulfur hexafluoride (SF6).
Other chemical tracers are measured on many cruises included in GLODAP, such as dissolved organic carbon and nitrogen, as well as stable and radioactive isotope ratios. In many cases, a subset of these data is distributed as part of the GLODAP data product; however, such data have not been extensively quality-controlled or checked for measurement biases in this effort. For some of these variables, better sources of data exist; for example, the product by Jenkins et al. (2019) for helium isotope and tritium data or the dissolved organic matter product by Hansell et al. (2021). GLODAP also includes some common derived variables to facilitate interpretation, such as potential density anomalies and apparent oxygen utilization (AOU). A full list of variables included in the data product is provided in Table 1.
Table 1Variables in the GLODAPv2.2023 comma-separated (csv) product files, their units, short and flag names, and corresponding names in the individual cruise exchange files. In the MATLAB product files that are also supplied, the term “G2” has been added to every variable name (e.g., G2cruise).
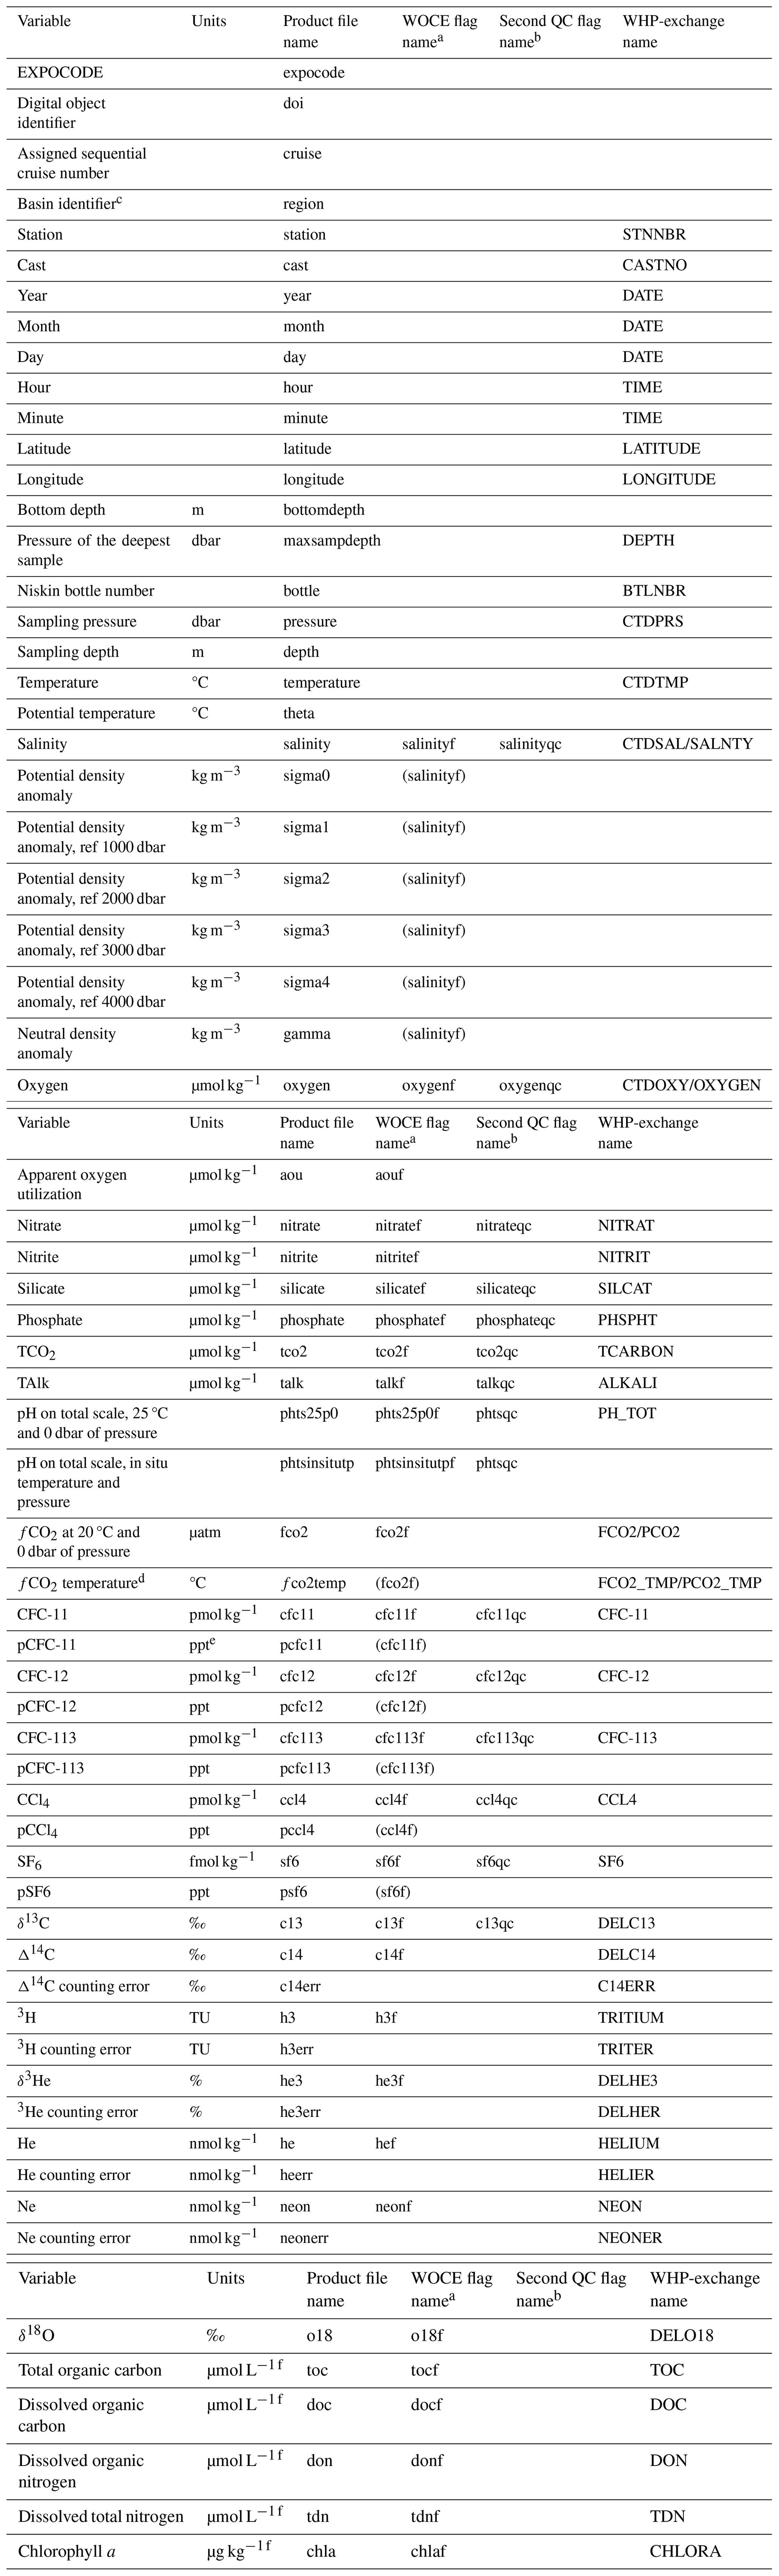
aThe only derived variable assigned a separate WOCE flag is AOU, as it depends strongly on both temperature and oxygen (and less strongly on salinity). For the other derived variables, the applicable WOCE flag is given in parentheses. b Secondary QC flags indicate whether data have been subjected to full secondary QC (1) or not (0), as described in Sect. 3. c 1 is the Atlantic Ocean, 4 is the Arctic Mediterranean Sea (i.e., the Arctic Ocean plus the Nordic Seas), 8 is the Pacific Ocean, and 16 is the Indian Ocean. d Included for clarity is 20 °C for all occurrences. e Note that ppt stands for parts per trillion. f Units have not been checked; some values are in micromoles per kilogram (for TOC, DOC, DON, and TDN) or microgram per liter (for chl a) are probable.
The oceanographic community largely adheres to principles and practices for ensuring open access to research data, such as the FAIR (Findable, Accessible, Interoperable, Reusable) initiative (Wilkinson et al., 2016), but the plethora of file formats and different levels of documentation, combined with the need to retrieve data on a per cruise basis from different access points, limits the realization of their full scientific potential. In addition, the manual data retrieval is time-consuming and prone to data-handling errors (Tanhua et al., 2021). For biogeochemical data, there is the added complexity of different levels of standardization and calibration, and even different units and scales are used for the same variable, such that the comparability between datasets is often poor. Standard operating procedures have been developed for some variables (Dickson et al., 2007; Hood et al., 2010; Becker et al., 2020), certified reference materials (CRMs) exist for seawater TCO2 and TAlk measurements (Dickson et al., 2003), and reference materials for nutrients in seawater (RMNS; certified based on International Organization for Standardization Guide 34; Aoyama et al., 2012; Ota et al., 2010) are also available. Despite all this, biases in data still exist. These can arise from poor sampling and preservation practices, calibration procedures, instrument design and calibration, and inaccurate calculations. The use of CRMs does not by itself ensure accurate measurements of seawater CO2 chemistry (Bockmon and Dickson, 2015), and the RMNS have only become available recently and are not universally used. For salinity and oxygen, the lack of calibration of the data from conductivity–temperature–depth (CTD)-profiler-mounted sensors is an additional and widespread problem, particularly for oxygen (Olsen et al., 2016). For halogenated transient tracers, uncertainties in standard gas composition, extracted water volume, and purge efficiency typically provide the largest sources of uncertainty. In addition to bias, occasional outliers occur. In rare cases poor precision – many multiples worse than that expected with current measurement techniques – can render a set of data to be of limited use. GLODAP deals with these issues by presenting the data in a uniform format, including any metadata either publicly available or submitted by the data originator, and by subjecting the data to rigorous primary and secondary quality control assessments, focusing on precision and consistency, respectively. The secondary quality control focuses on deep data in which natural variability is minimal. Adjustments are applied to the data to minimize cases of bias that could be confidently established relative to the measurement precision for the variables and cruises considered. Key metadata are provided in the header of each data file, and original unadjusted data along with full cruise reports submitted by the data providers (where available) are accessible through the GLODAPv2 cruise summary table hosted by the Ocean Carbon and Acidification Data System (OCADS) at the National Oceanographic and Atmospheric Administration (NOAA) National Centers for Environmental Information (NCEI) (https://www.ncei.noaa.gov/access/ocean-carbon-acidification-data-system/oceans/GLODAPv2_2023/cruise_table_v2023.html, last access: 12 October 2023; GLODAP, 2023).
This most recent GLODAPv2.2023 data product builds on earlier synthesis efforts for biogeochemical data obtained from research cruises, namely GLODAPv1.1 (Key et al., 2004; Sabine et al., 2005), Carbon dioxide In the Atlantic Ocean (CARINA) (Key et al., 2010), PACIFic ocean Interior CArbon (PACIFICA) (Suzuki et al., 2013), and notably GLODAPv2 (Olsen et al., 2016). GLODAPv1.1 combined data from 115 cruises with biogeochemical measurements from the global ocean. The vast majority of these were the sections covered during the World Ocean Circulation Experiment and the Joint Global Ocean Flux Study (WOCE/JGOFS) in the 1990s, but data from important “historical” cruises were also included, such as from the Geochemical Ocean Sections Study (GEOSECS), Transient Traces in the Ocean (TTO), and South Atlantic Ventilation Experiment (SAVE). GLODAPv2, which forms the basis for the update presented here, was released in 2016 with data from 724 scientific cruises, including those from GLODAPv1.1, CARINA, and PACIFICA, as well as data from 168 additional cruises. GLODAPv2 not only combined all previous efforts, but it also created ocean-wide consistency across all cruise data through an inversion analysis. A particularly important source of additional data was the cruises executed within the framework of the “repeat hydrography” program (Talley et al., 2016) instigated in the early 2000s as part of the Climate and Ocean – Variability, Predictability, and Change (CLIVAR) program and which has been organized as the Global Ocean Ship-based Hydrographic Investigations Program (GO-SHIP) since 2007 (Sloyan et al., 2019). GLODAPv2 is updated regularly using the “living data process” of Earth System Science Data to document significant additions and modifications to the data product.
There are two types of GLODAP updates: full and intermediate. Full updates involve a reanalysis, notably crossover and inversion, of the entire dataset (both historical and new cruises) in which all data points are subject to potential adjustment. This was carried out for the creation of GLODAPv2. For intermediate updates, recently available data are added following quality control procedures to ensure their consistency with the cruises included in the latest GLODAP release. Except for obvious outliers and similar types of errors (Sect. 3.3.1), the data from previous releases are not changed or adjusted during intermediate updates. Note that the GLODAP mapped climatologies (Lauvset et al., 2016) are not updated for these intermediate products. A naming convention has been introduced to distinguish intermediate from full product updates. For the latter, the version number will change, while for the former, the year of release is appended. The exact version number and release year (if appended) of the product used should always be reported in studies, rather than making a generic reference to GLODAP.
Creating and interpreting inversions, as well as other checks of the entire dataset needed for full updates, are too demanding in terms of time and resources to be performed every year or every 2 years. The aim is to conduct a full analysis (i.e., including an inversion) again after the third GO-SHIP survey has been completed. This completion is currently scheduled for 2024. Work on GLODAPv3 commences in fall 2023, and we anticipate that GLODAPv3 will become available at the end of 2025. In the interim, the fifth intermediate update is presented here, which adds data from 23 cruises to the last update, GLODAPv2.2022 (Lauvset et al., 2022). Given the anticipated schedule towards producing GLODAPv3, this will be the final intermediate update of GLODAPv2.
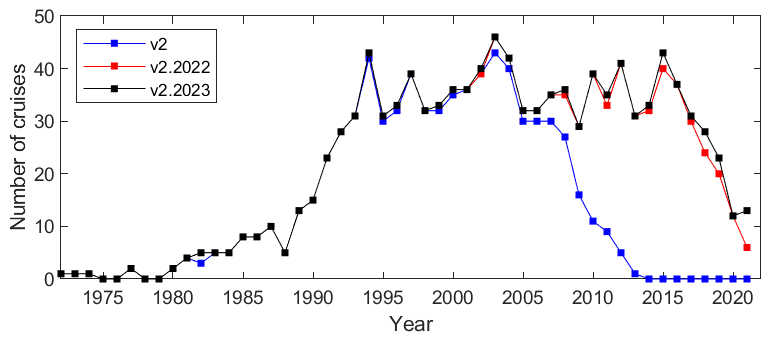
GLODAPv2.2023 contains data from 1108 cruises covering the global ocean from 1972 to 2021, compared to 1085 for the period 1972–2021 for the previous GLODAPv2.2022 (Lauvset et al., 2022). Information about the 23 cruises added to this version is provided in Table A1 in the Appendix. Cruise sampling locations are shown alongside those of GLODAPv2.2023 in Fig. 1, while the coverage in time is shown in Fig. 2. Not all cruises have data for all the abovementioned 13 core variables. For example, cruises with only seawater CO2 chemistry or transient tracer data are still included, even without accompanying nutrient data, due to their value with respect to the computation of carbon inventories. In a few cases, cruises without any of these properties are included because they do contain data for other carbon-related tracers, such as carbon isotopes, with the intention of ensuring their wider availability. The added cruises are from 2002 to 2021, with the majority being more recent than 2018. This update consists of the following:
-
five cruises in the northeastern North Atlantic from Marine Institute, Ireland;
-
three time series datasets in the Arctic Ocean;
-
a dataset from the Greenland–Scotland ridge, including multiple stations in the Irminger and Iceland seas over the years 2002–2006, and the Iceland standard section at 64°20′ N;
-
four Japanese cruises in the northwestern Pacific Ocean;
-
one Chinese National Arctic Research Expedition (CHINARE) cruise from the Arctic (Chukchi Sea) in 2008;
-
an update of the Irminger Sea and Iceland Sea time series, with new data from 2014–2019;
-
one Line P cruise (2015);
-
three coastal cruises out of Iquique from the Coastal Ecosystem and Global Environmental Change lab (ECCA Lab) in Chile;
-
one Discovery cruise in the Southern Ocean;
-
A20 and A22 occupations from 2021; and
-
the 2018 Observatoire de la variabilité interannuelle à décennale en Atlantique Nord (OVIDE) cruise.
All new cruises in GLODAPv2.2023 include seawater CO2 chemistry data, and eight of these also include data on halogenated transient tracers.
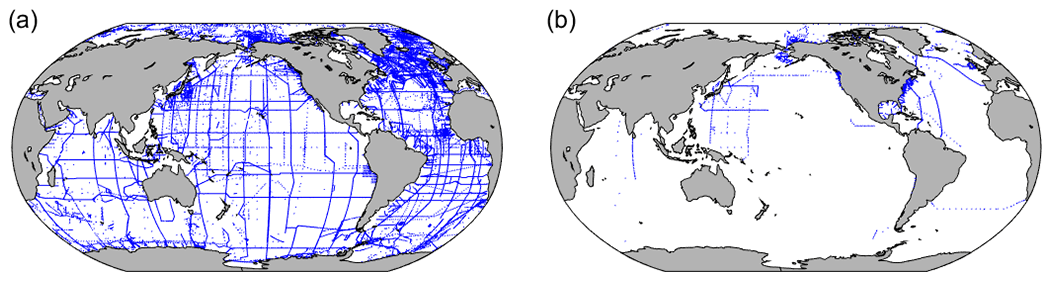
Figure 1Location of stations in (a) GLODAPv2.2022 and for (b) the new data added in this update.
All new cruises were subjected to primary (Sect. 3.1) and secondary (Sect. 3.2) quality control (QC). These procedures are very similar to those used for GLODAPv2.2022 and previous versions, aiming to ensure the consistency of the data from the 23 new cruises with the previous release of the GLODAP data product (in this case, the GLODAPv2.2022 adjusted data product). As for GLODAPv2.2022, we also apply secondary QC routines to SF6 data.
For GLODAPv2.2021, we added a basin identifier to the product files, where 1 is the Atlantic Ocean, 4 the Arctic Mediterranean Sea (i.e., the Arctic Ocean plus the Nordic Seas), 8 the Pacific Ocean, and 16 the Indian Ocean. These regions are abbreviated to AO, AMS, PO, and IO, respectively, in the adjustment table. Data in the Mediterranean Sea, Caribbean Sea, and Gulf of Mexico are classified as belonging to the Atlantic Ocean (1). These basin identifiers were added to the product files, for the first time in GLODAPv2.2022, to make it easier for users to identify which ocean basin an individual cruise belongs to without having to use one of the four regional files. This setting remains in GLODAPv2.2023. Note that there is no overlap between the regional files or for our basin identifiers, and cruises in the Southern Ocean are placed in the basin where most of the data were collected. As in the previous version, GLODAPv2.2022, we include the DOI for each cruise in all product files with the aim of easing user access to the original data and metadata, as well as improving the visibility of data providers.
3.1 Data assembly and primary quality control
Data from the 23 new cruises were submitted directly to us or retrieved from data centers, typically OCADS (https://www.ncei.noaa.gov/products/ocean-carbon-acidification-data-system, last access: 7 September 2023), the CLIVAR and Carbon Hydrographic Data Office (https://cchdo.ucsd.edu, last access: 7 September 2023), and PANGAEA (https://pangaea.de, last access: 7 September 2023). Each cruise is identified by an expedition code (EXPOCODE). The EXPOCODE is guaranteed to be unique and constructed by combining the country code and platform code with the date of departure in the format YYYYMMDD. The country and platform codes were taken from the ICES (International Council for the Exploration of the Sea) library (https://vocab.ices.dk/, last access: 7 September 2023).
The individual cruise data files were converted to the WHP-exchange format, which is a comma-delimited ASCII (American Standard Code for Information Interchange) format for data from hydrographic cruises with different and specific versions for CTD and bottle data. GLODAP only includes WHP-exchange in the bottle format with data and CTD data at bottle trip depths. An overview of the significant points is given below, with full details provided at https://exchange-format.readthedocs.io/ (v1.2.0 as of 22 March 2022, last access: 7 September 2023), as derived from Swift and Diggs (2008). The first line of each exchange file specifies the data type – in the case of GLODAP, this is “BOTTLE” – followed by a creation date time stamp in the ISO8601 (YYYYMMDD) format, as well as the identification of the group and person who prepared the file. The latter follows a convention of including the division/group, the institution, and the initials of the person. The omnipresent “PRINUNIVRMK” label thus acknowledges the enormous effort by Robert M. Key at Princeton University. Next follows the README section, which provides brief, cruise-specific information, such as dates, ship, region, method plus quality notes for each variable measured, citation information, and references to any papers that used or presented the data. The README information is typically assembled from the information contained in the metadata submitted by the data originator. In some cases, issues noted during the primary QC and other information such as file update notes are included. The only rule for the README section is that it must be concise and informative, and each line must start with the comment character (#). The README information is followed by variable names and units on separate lines and then the data. The names and units are standardized and provided in Table 1 for the variables included in GLODAP, with full specifications provided at https://exchange-format.readthedocs.io/en/latest/parameters.html (v1.2.0 as of 22 March 2022, last access: 7 September 2023). For consistency with previous updates, and to ease the use of the existing methods and code, GLODAP still uses the WHP-exchange format instead of adopting the new naming structure outlined in Jiang et al. (2022).
Exchange file preparation required unit conversion in some cases, most frequently from concentrations expressed as milliliters per liter (mL L−1; oxygen) or micromoles per liter (µmol L−1; nutrients) to substance contents expressed as micromoles per kilogram of seawater (µmol kg−1). Procedures, as described in Jiang et al. (2022), were used for these conversions. The default conversion procedure for nutrients was to use seawater density at reported salinity, an assumed measurement temperature of 22 °C, and pressure of 1 atm. For oxygen, the factor 44.66 was used for the “milliliters of oxygen” to “micromoles of oxygen” conversion, while the density required for the “per liter” to “per kilogram” conversion was calculated from the reported salinity and draw temperatures whenever possible. However, potential density was used instead when draw temperature was not reported. The potential errors introduced by any of these procedures are insignificant. Missing numbers are indicated by −999.
Each data column (except temperature and pressure, which are assumed to be “good” if they exist) has an associated column of data flags (Joyce and Corry, 1994). For the original data exchange files, these flags conform to the WOCE definitions for water samples and are listed in Table 2. For the merged and adjusted product files these flags are simplified; questionable (WOCE flag 3) and bad (WOCE flag 4) data are removed, and their flags are set to 9. The same procedure is applied to data flagged 8 (very few such data exist); 1 (data not received) and 5 (data not reported) are also set to 9, while flags of 6 (mean of replicate measurements) and 7 (manual chromatographic peak measurement) are set to 2 if the data appear good. Also, in the merged product files, a flag of 0 is used to indicate a value that could be measured but is approximated. For salinity, oxygen, phosphate, nitrate, and silicate, the approximation is conducted using vertical interpolation; for seawater CO2 chemistry variables (TCO2, TAlk, pH, and fCO2), the approximation is conducted using the calculation from two measured CO2 chemistry variables (Sect. 3.2.2). Importantly, the interpolation of CO2 chemistry variables is never performed, and thus a flag value of 0 has a unique interpretation.
Table 2WOCE flags in GLODAPv2.2023 exchange format original data files (briefly; for full details, see Swift, 2010) and the simplified scheme used in the merged product files.
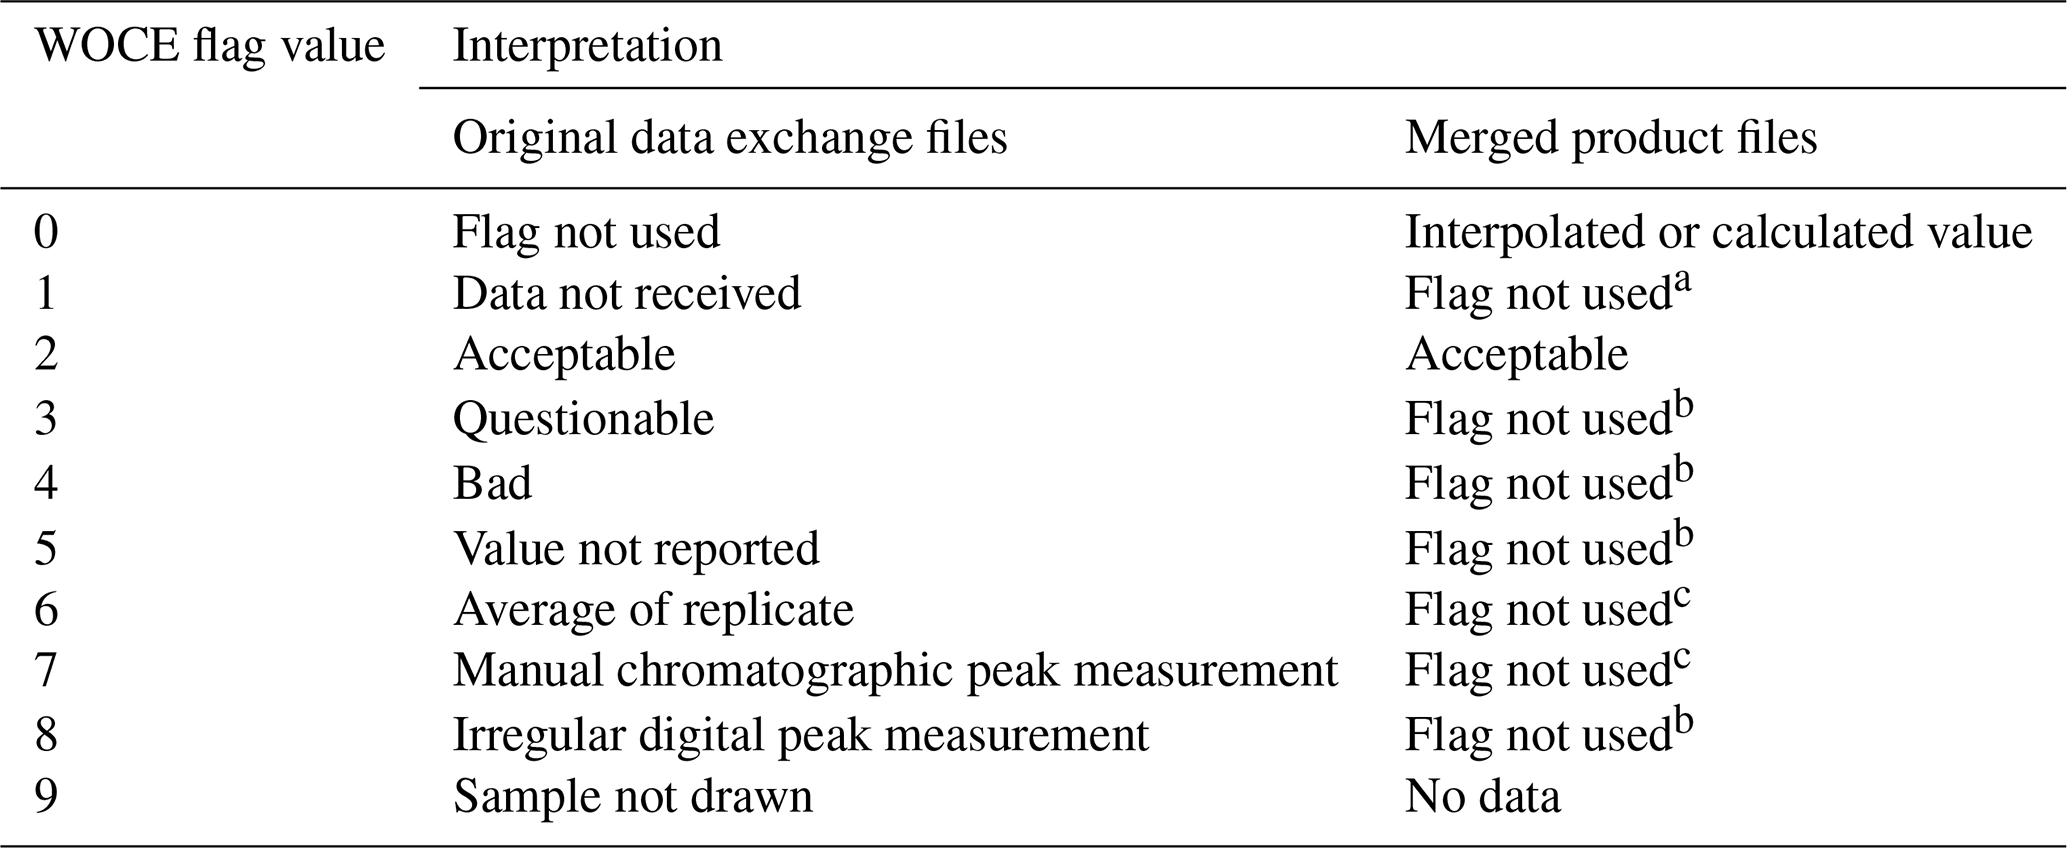
a Flag set to 9 in product files. b Data are not included in the GLODAPv2.2023 product files, and their flags are set to 9. c Data are included, but the flag is set to 2.
If no WOCE flags were submitted with the data, then they were assigned by the GLODAP reference group (https://glodap.info/index.php/group/, last access: 16 October 2023). Regardless, all incoming files were subjected to primary QC to detect questionable or bad data – this was carried out, following Sabine et al. (2005) and Tanhua et al. (2010), primarily by inspecting property–property plots. For this task, the GLODAP primary quality control software (Velo et al., 2021) was used, as it presents a custom, pre-defined schema of property–property plots designed by the consortium to ease the detection of outliers. Outliers showing up in two or more different such plots were generally defined as questionable and flagged. In some cases, outliers were detected during the secondary QC; the consequent flag changes have then also been applied in the GLODAP versions of the original cruise data files in agreement with the data submitter.
3.2 Secondary quality control
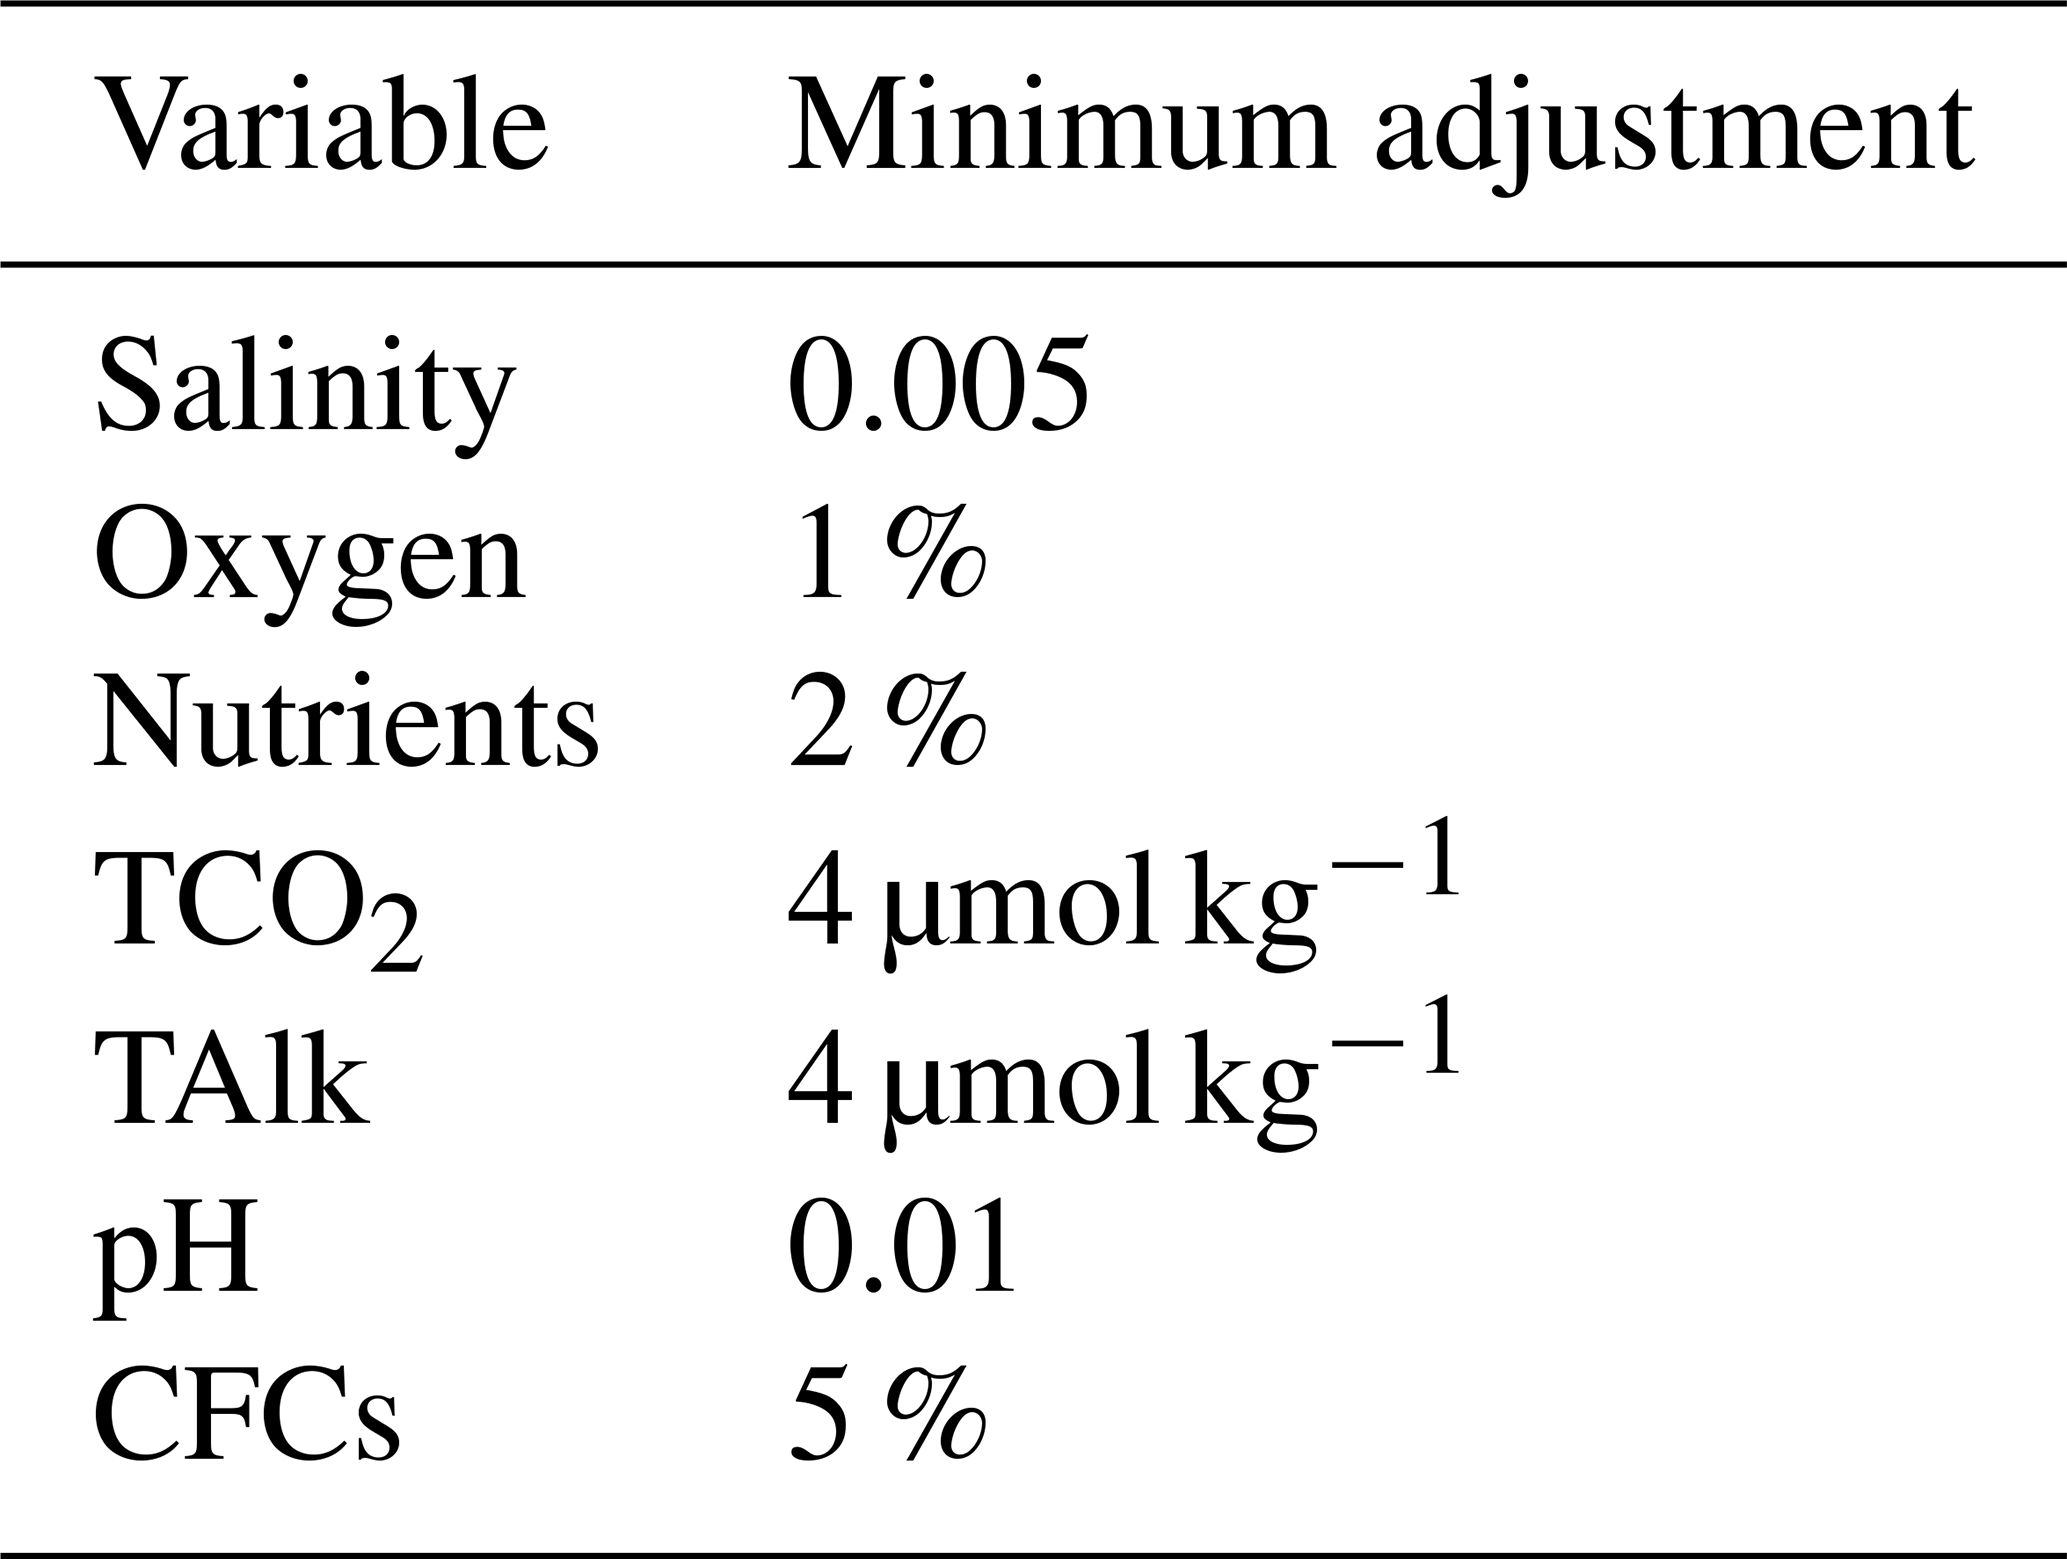
The aim of the secondary QC was to identify and correct any significant biases in the data from the 23 new cruises relative to GLODAPv2.2022 while retaining any signal due to temporal changes. To this end, secondary QC in the form of consistency analyses was conducted to identify offsets in the data. All identified offsets were scrutinized by the GLODAP reference group through a series of teleconferences during May 2023 to decide the adjustments to be applied to reduce the apparent offset (if any). To guide this process, a set of initial minimum adjustment limits was prescribed (Table 3). These represent the minimum bias that can be confidently established relative to the measurement precision for the variables and cruises considered and are the same as those used for GLODAPv2.2022. In addition to the average magnitude of the offsets, factors such as the precision of the offsets, persistence towards the various cruises used in the comparison, regional dynamics, and the occurrence of time trends or other variations were considered. Thus, not all offsets larger than the initial minimum limits have been adjusted. A guiding principle for these considerations was to not apply an adjustment when in doubt. Conversely, in some cases, when data and offsets were very precise and the cruise had been conducted in a region where variability is expected to be small, adjustments lower than the minimum limits were applied. Any adjustment was applied uniformly to all values for a variable and cruise; i.e., an underlying assumption is that cruises suffer from either no or a single and constant measurement bias. Adjustments for salinity, TCO2, TAlk, and pH are always additive, while adjustments for oxygen, nutrients, and the halogenated transient tracers are always multiplicative. Except where explicitly noted (Sect. 3.3.1 and Table A2 in the Appendix), adjustments were not modified for data previously included in GLODAPv2.2022.
Table 3Initial minimum adjustment limits. These limits represent the minimum bias that can be confidently established relative to the measurement precision for the variables and cruises considered. Note that these limits are not uncertainties but rather a priori estimates of global inter-cruise consistency in the data product.
Crossover comparisons were the primary source of information used to identify offsets for salinity, oxygen, nutrients, TCO2, TAlk, and pH (Sect. 3.2.2). As in GLODAPv2.2022, GLODAPv2.2021 and GLODAPv2.2020, but in contrast to GLODAPv2 and GLODAPv2.2019, the evaluation of the internal consistency of the seawater CO2 chemistry variables was not used for the evaluation of pH (Sect. 3.2.3). As in the three previous updates (2020, 2021, and 2022) we made extensive use of two predictions from two empirical algorithms – CArbonate system And Nutrients concentration from hYdrological properties and Oxygen using a Neural network, version B (CANYON-B), and CONsisTency EstimatioN and amounT (CONTENT) (Bittig et al., 2018) – for the evaluation of offsets in nutrients and seawater CO2 chemistry data (Sect. 3.2.4). For previous versions, we have also used multiple linear regression analyses and deep water averages, broadly following Jutterström et al. (2010), for additional information for the secondary QC of salinity, oxygen, nutrients, TCO2, and TAlk data. As in GLODAPv2.2022, we did not have to rely on the results of the multiple linear regression (MLR) analyses to make decisions about adjustments, and in general, we are increasingly moving towards only using CANYON-B and CONTENT estimates (Sect. 3.2.4), as additional information when the crossover analysis conducted is insufficient.
For the halogenated transient tracers, comparisons of surface saturation levels and the relationships among the tracers were used to assess the data consistency (Sect. 3.2.5). For salinity and oxygen, CTD and bottle values were merged into a “hybrid” variable prior to the consistency analyses (Sect. 3.2.1).
3.2.1 Merging of sensor and bottle data
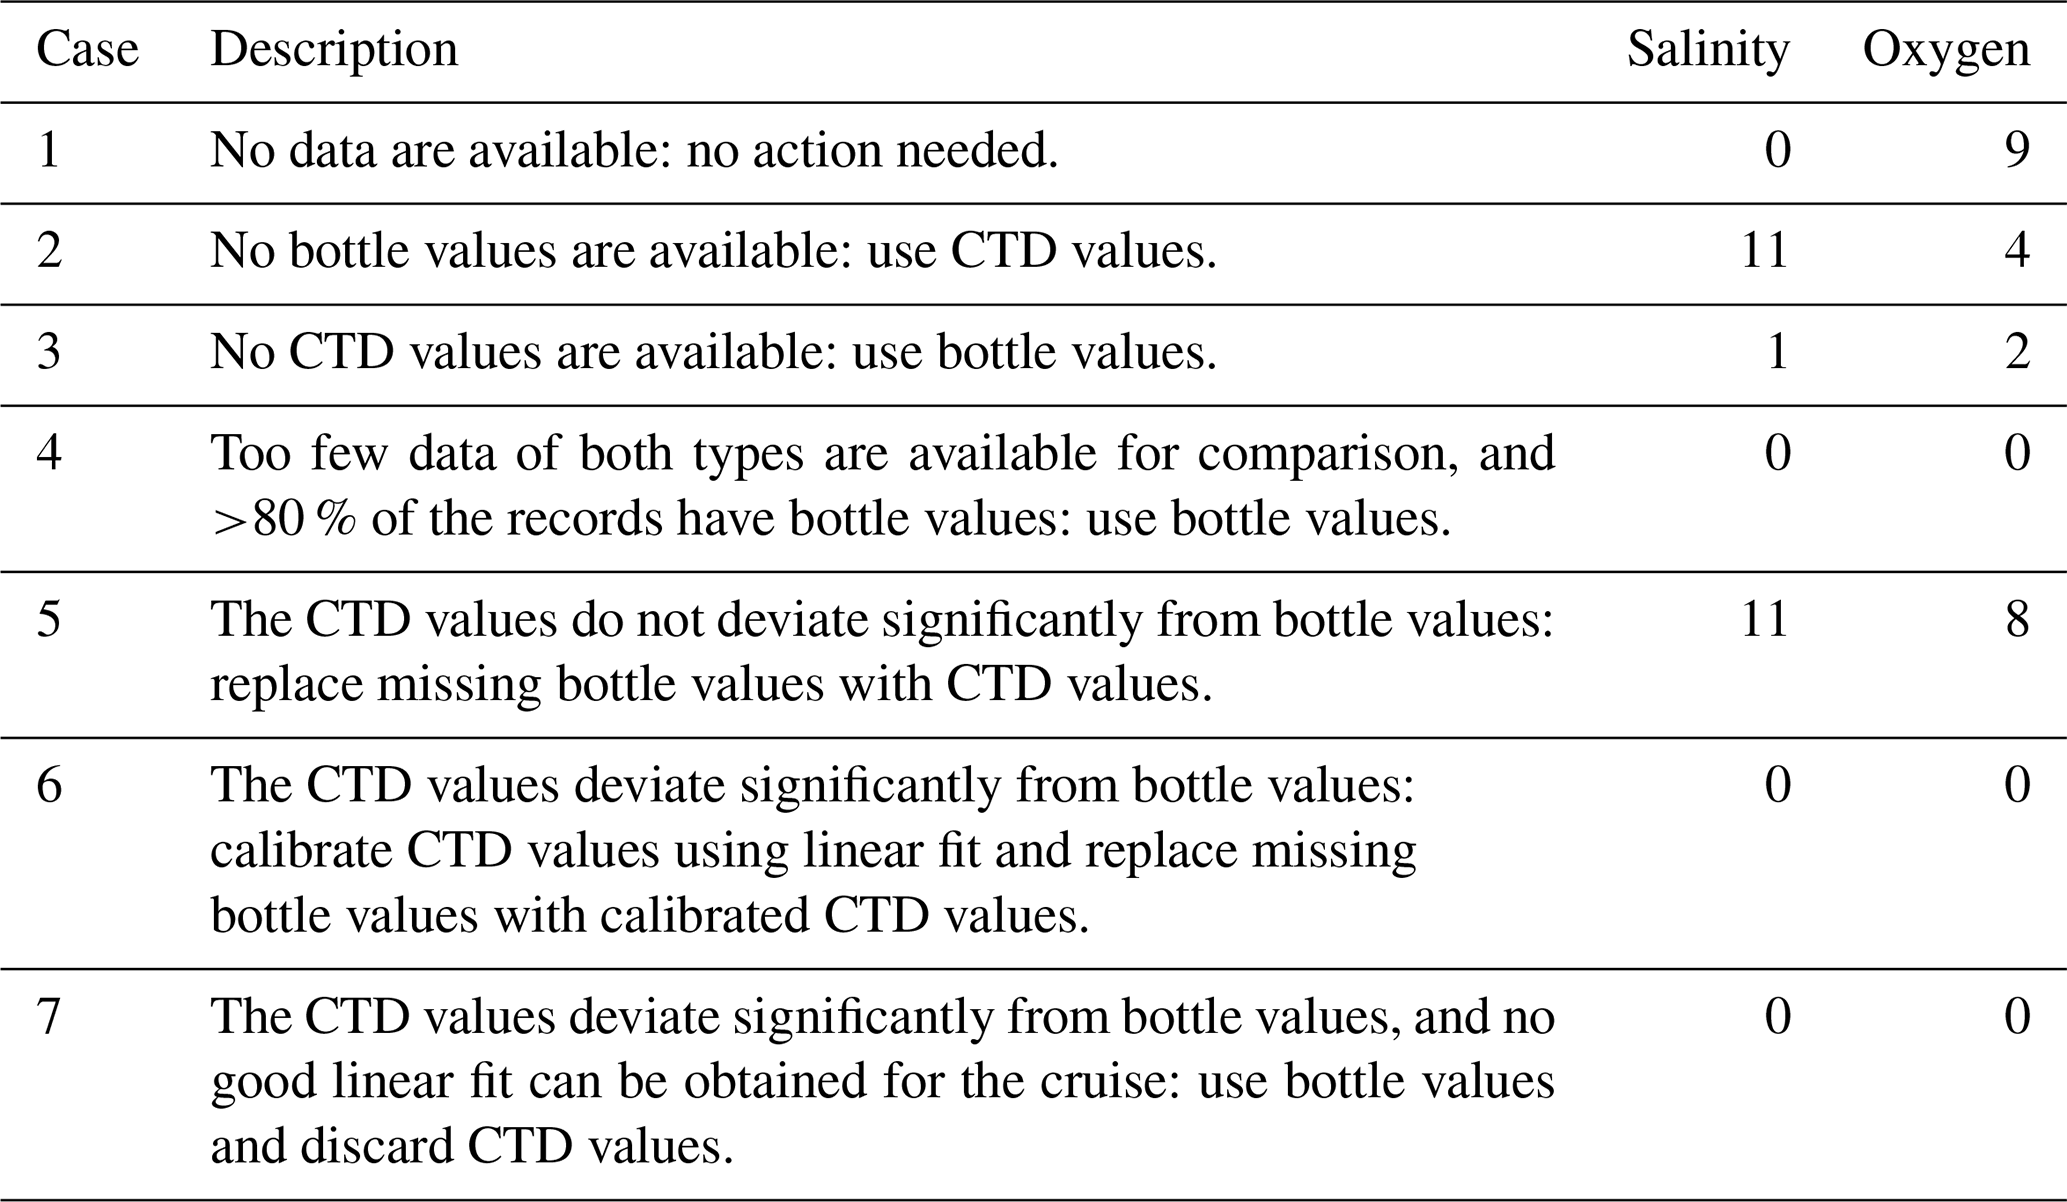
Salinity and oxygen data can be obtained by analysis of water samples (bottle data) and/or directly from the CTD sensor pack. These two measurement types are merged and presented as a single variable in the product. The merging was conducted prior to the consistency checks, ensuring their internal calibration in the product. The merging procedures were only applied to the bottle data files, which commonly include values recorded by the CTD at the pressures where the water samples are collected. Whenever both CTD and bottle data were present in a data file, the merging step considered the deviation between the two and calibrated the CTD values if required and possible. Altogether, seven scenarios (Table 4) are possible for each of the CTD conductivity and oxygen (O2) sensor properties individually, in which the fourth never occurred during our analyses but is included to maintain consistency with GLODAPv2. For salinity, 48 % of the 23 new cruises included both CTD and bottle data in the original cruise files, and for oxygen, 57 % of the new cruises where oxygen was included (14) had both CTD and bottle data (Table 6). For all these cruises, the two data types were found to be consistent for both oxygen and salinity. These new data have a higher proportion of cruises with both bottle and CTD measurements than GLODAPv2.2022 (39 % for both salinity and oxygen). For oxygen, the remaining cruises have only CTD data, while for salinity, 22 % have only CTD data and 30 % have only bottle data. Having both CTD and bottle values in the data files is highly preferred, as the information is valuable for quality control (bottle misfires, leaking Niskin bottles, and oxygen sensor drift are among the issues that can be revealed). The extent to which the bottle data (i.e., OXYGEN in the individual cruise exchange files) are mislabeled CTD data (i.e., should be CTDOXY) is uncertain. Regardless, all CTD and bottle data for salinity and oxygen were consistent and did not need any further calibration.
Table 4Summary of salinity and oxygen calibration needs and actions. The number of cruises with each of the scenarios identified is also given.
3.2.2 Crossover analyses
The crossover analyses were conducted with the MATLAB toolbox prepared by Lauvset and Tanhua (2015) and with GLODAPv2.2022 as the reference data product. The toolbox implements the “running-cluster” crossover analysis first described by Tanhua et al. (2010). This analysis compares data from two cruises on a station-by-station basis and calculates a weighted mean offset between the two and its weighted standard deviation. The weighting is based on the scatter in the data, such that data that have less scatter have a larger influence on the comparison than data with more scatter. Whether the scatter reflects the actual variability or data precision is irrelevant in this context, as increased scatter nevertheless decreases the confidence in the comparison. Stations are compared when they are within 2 arcdeg distance (∼ 200 km) of each other. To minimize the effects of natural variability, only deep data are used. Either the 1500 or 2000 dbar pressure surface was used as the upper bound, depending on the amount of available data, their variation at different depths, and the region in question. Which one to use was determined on a case-by-case basis by comparing crossovers with the two depth limits and using the one that provided the clearest and most robust information. In regions where deep mixing or convection occurs, such as the Nordic, Irminger, and Labrador seas, the upper bound was always placed at 2000 dbar; while winter mixing in the first two regions is normally not deeper than this (Brakstad et al., 2019; Fröb et al., 2016), convection beyond this limit has occasionally been observed in the Labrador Sea (Yashayaev and Loder, 2017). However, using an upper depth limit deeper than 2000 dbar will quickly give too few data for robust analysis. In addition, even below the deepest winter mixed layers, properties do change over the time periods considered (e.g., Falck and Olsen, 2010), so this limit does not guarantee steady conditions. In the Southern Ocean, deep convection beyond 2000 dbar seldom occurs, with an exception being the processes accompanying the formation of the Weddell Polynya in the 1970s (Gordon, 1978). Deep and bottom water formation usually occur along the Antarctic coasts, where relatively thin nascent dense water plumes flow down the continental slope. We avoid such cases, which are easily recognizable. To avoid removing persistent temporal trends, all crossover results are also evaluated as a function of time (see below).
As an example of crossover analysis, the crossover for alkalinity measured on the two cruises 35TH20180611, which is new to this version, and 45CE20170427, which was included in GLODAPv2.2019, is shown in Fig. 3. For alkalinity, the offset is determined as the difference, in accordance with the procedures followed for GLODAPv2. The mean weighted offset shows there is no difference between these cruises.
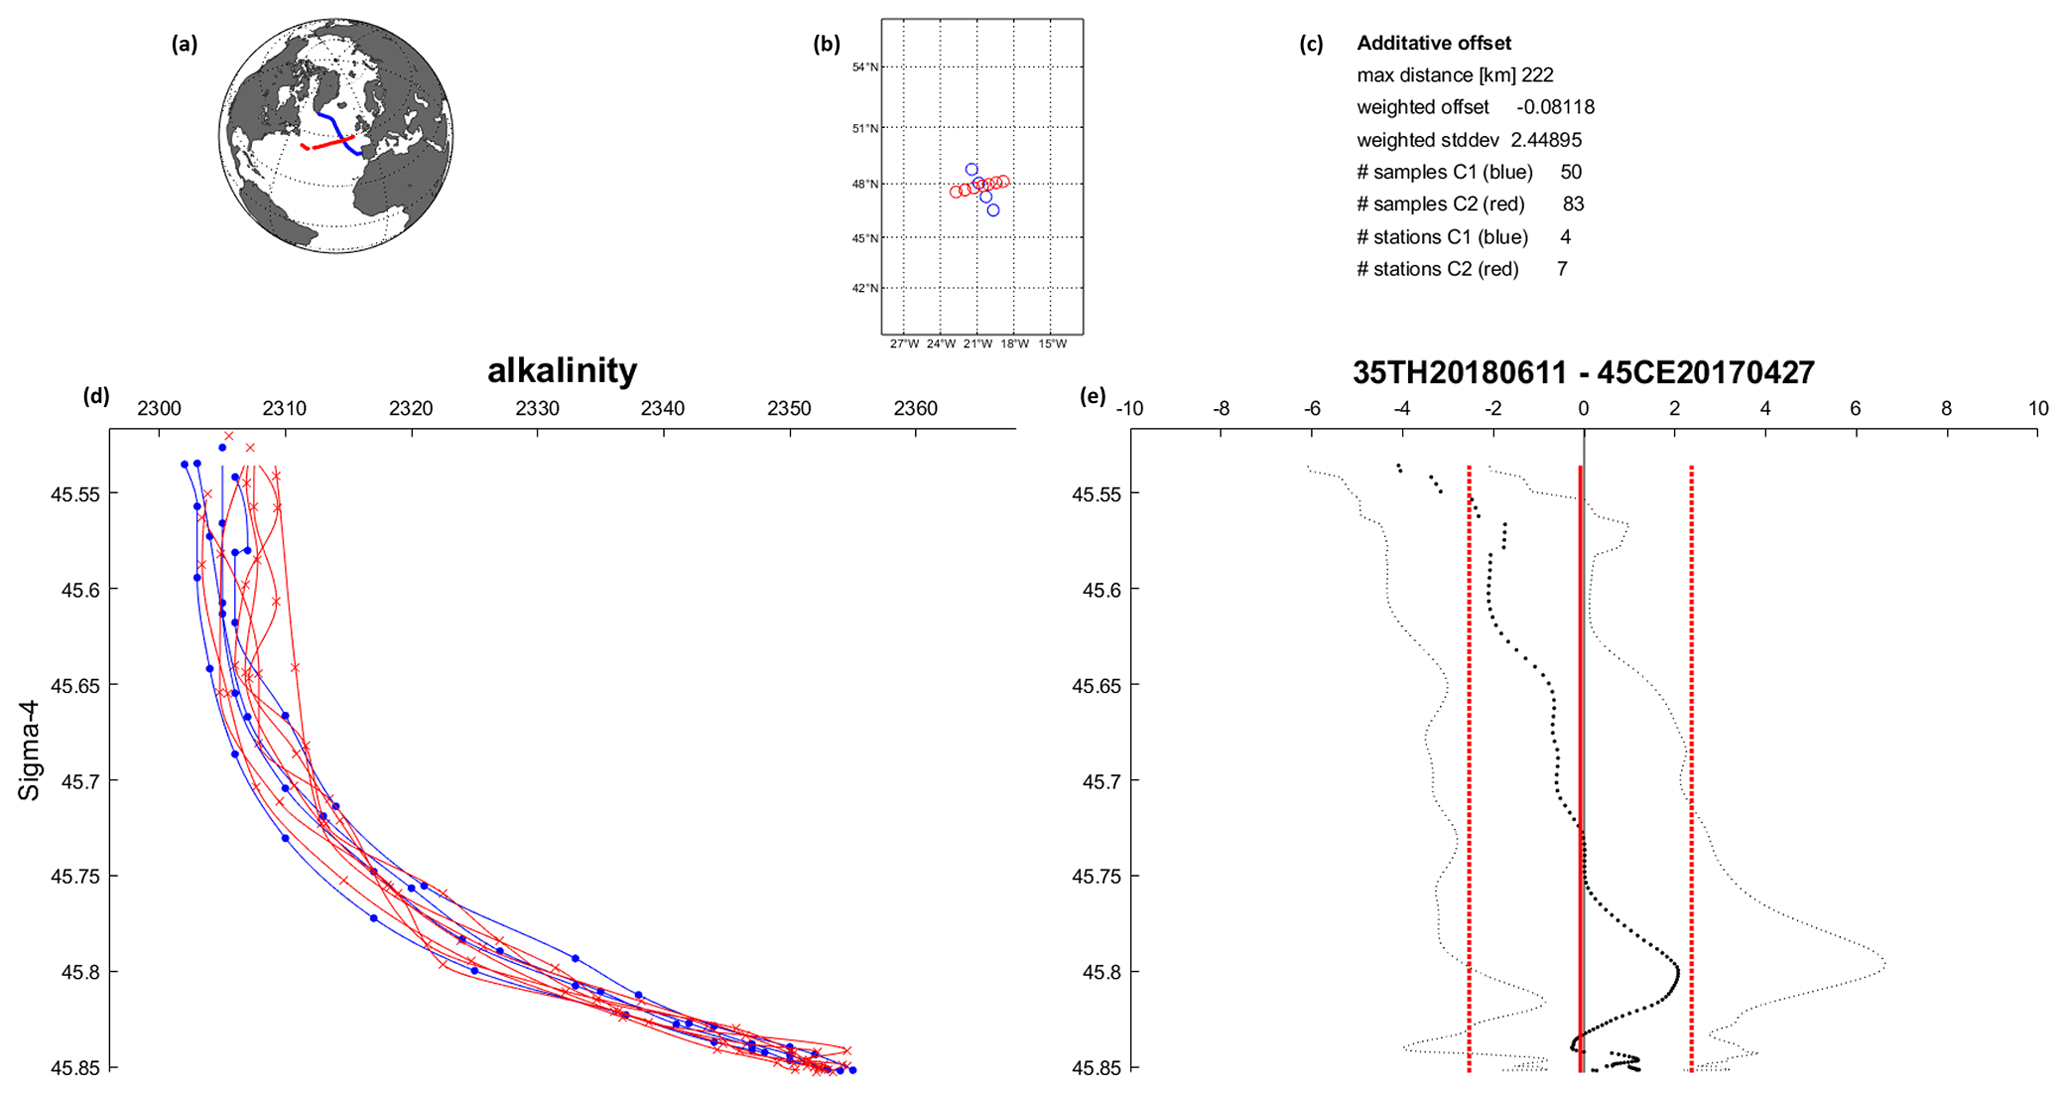
Figure 3Example crossover figure for alkalinity for cruises 35TH20180611 (blue) and 45CE20170427 (red), as was generated during the crossover analysis. Panel (a) shows all station positions for the two cruises, and panel (b) shows the specific stations used for the crossover analysis. Panel (d) shows the data of alkalinity (µmol kg−1) below the upper depth limit (in this case 2000 dbar) versus potential density anomaly referenced to 4000 dbar as points and the interpolated profiles as lines. Non-interpolated data either did not meet minimum depth separation requirements (Table 4 in Key et al., 2010) or are the deepest sampling depth. The interpolation does not extrapolate. Panel (e) shows the mean alkalinity difference profile (black; dots) with its standard deviation, as well as also the weighted mean offset (straight red lines) and weighted standard deviation. Summary statistics are provided in panel (c).
For each of the 23 new cruises, such a crossover comparison was conducted against all possible cruises in GLODAPv2.2021, i.e., all cruises that had stations closer than 2 arcdeg distance to any station for the cruise in question. The summary figure for alkalinity on 35TH20180611 is shown in Fig. 4. The alkalinity data measured on this cruise are on average 1.82 ± 0.40 µmol kg−1 higher when compared to the data measured on nearby cruises included in GLODAPv2.2022. This is smaller than the initial minimum adjustment limit for alkalinity of 4 µmol kg−1 (Table 3) and as such does not lead to an adjustment of the data in the merged data product. Detailed analyses are performed for every new cruise, and every core variable, to detect potential temporal trends in the offsets. Figure 4 further illustrates that the alkalinity offset is nearly zero – also when comparing only with cruises since 2010 – and no thus trend is apparent. All other variables also show very high consistency; thus, no adjustment is given to any other variable on cruise 35TH20180611 in GLODAPv2.2022. This is supported by the CANYON-B and CONTENT results (Sect. 3.2.4). Note that adjustments, when applied, are typically round numbers (e.g., −3 not −3.4 for TCO2 and 0.005 not 0.0047 for pH) to avoid communicating that the ideal adjustments are accurately known.
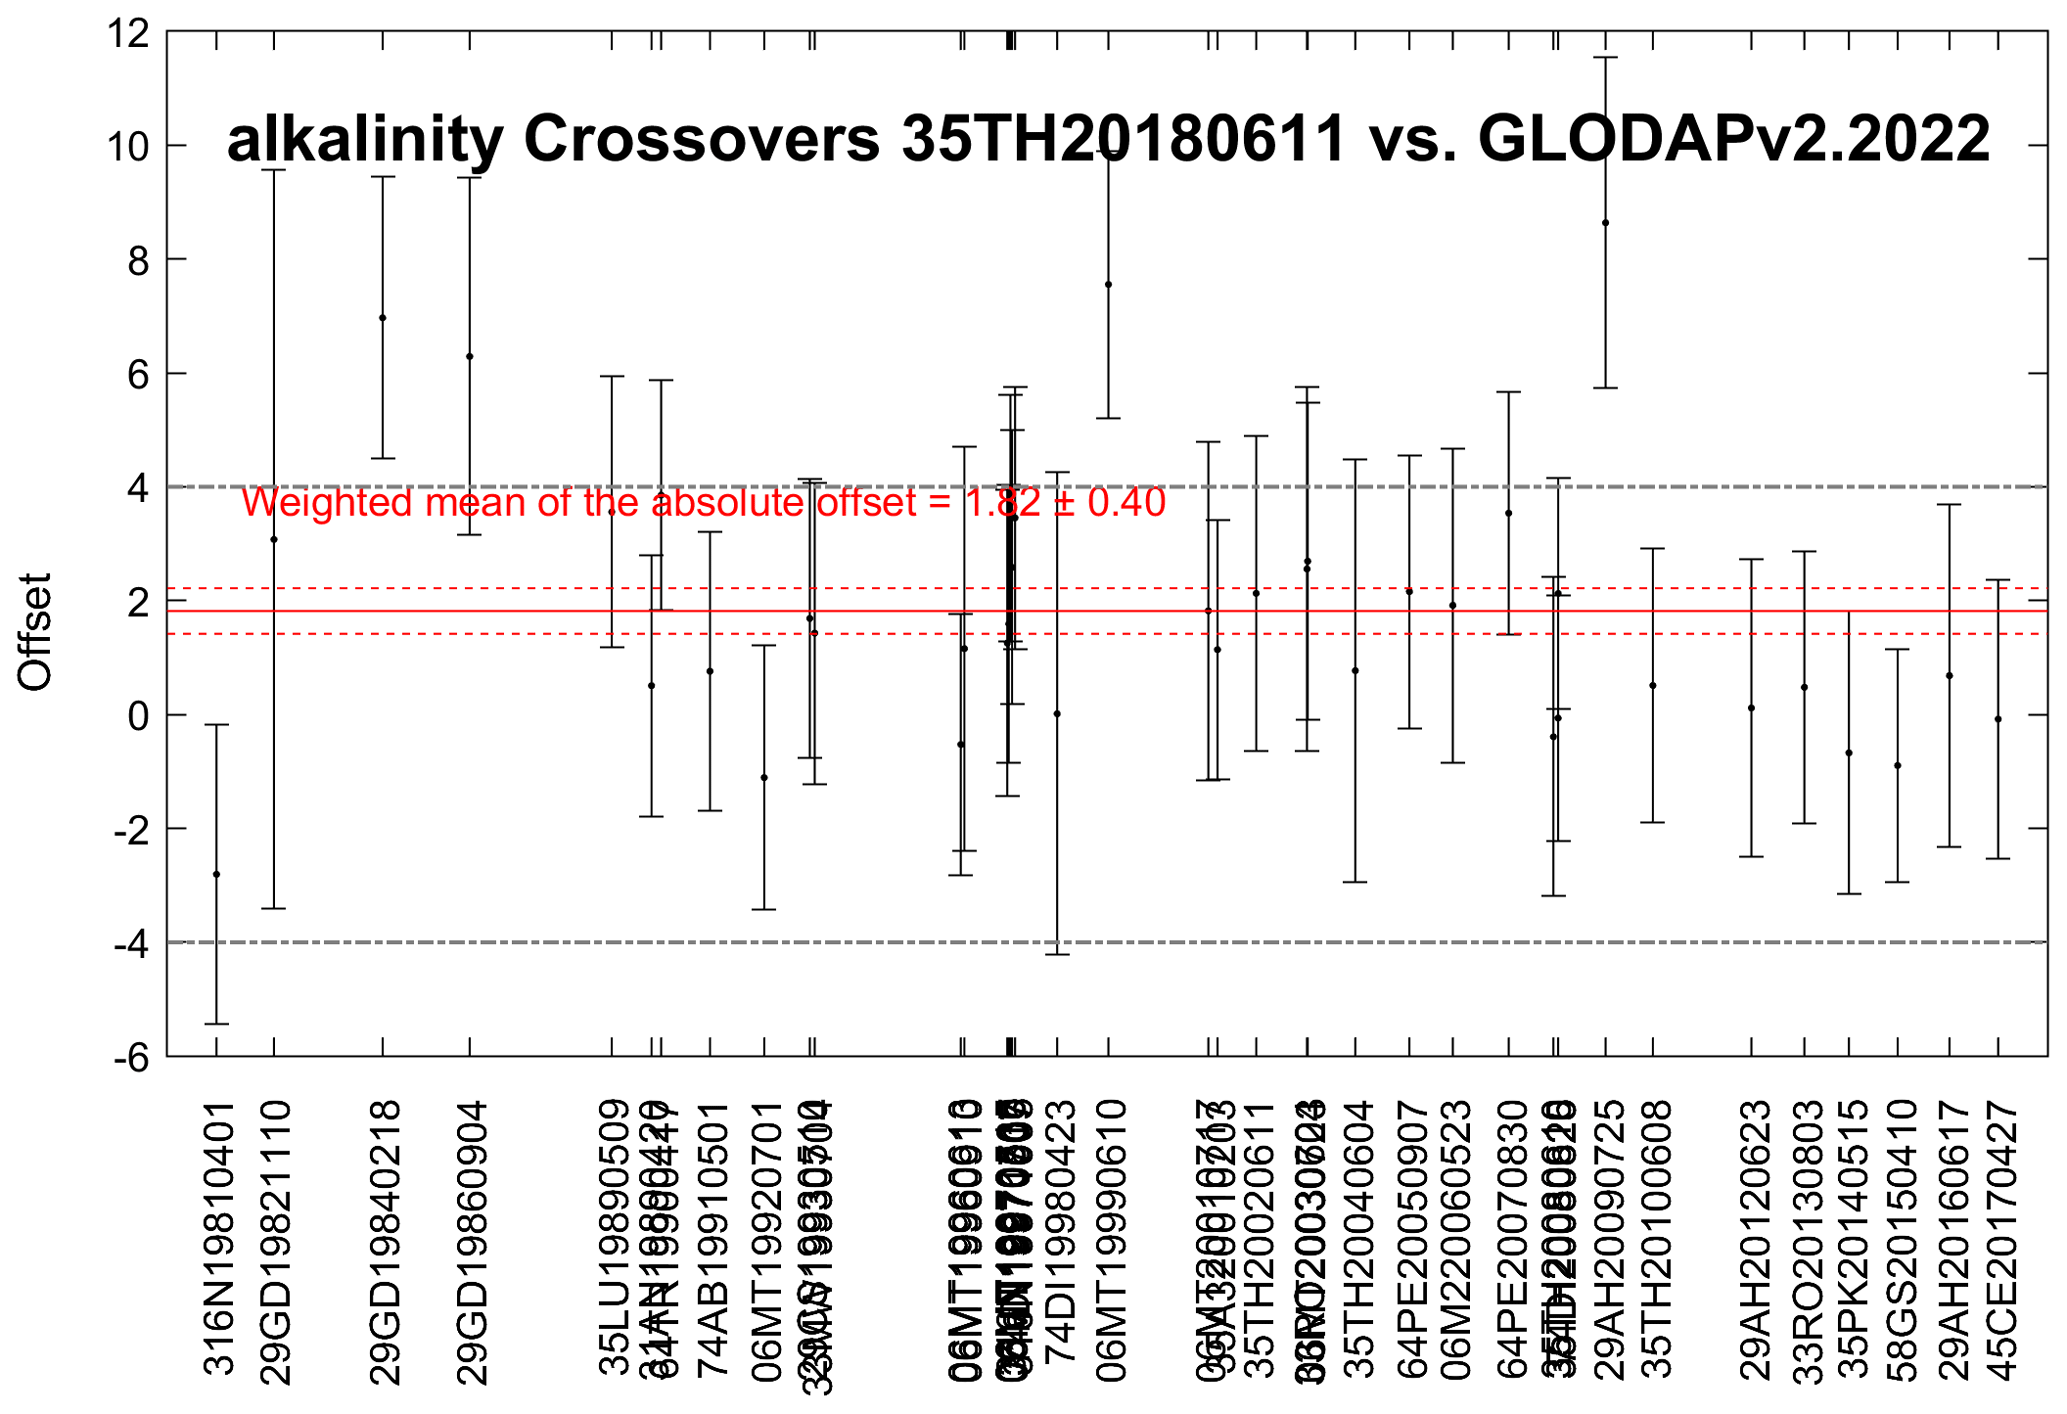
Figure 4Example summary figure for alkalinity crossovers for 35TH20180611 versus the cruises in GLODAPv2.2022 (with cruise EXPOCODE listed on the x axis sorted according to the year the cruise was conducted). The black dots and vertical error bars show the weighted mean offset and standard deviation for each crossover (as a ratio). The weighted mean and standard deviation of all these offsets are shown in the red lines and are 1.82 ± 0.40. The dashed black lines are the reference line for a ±4 µmol kg−1 offset.
3.2.3 pH scale conversion and quality control
Altogether 12 of the 23 new cruises included measured spectrophotometric pH data, and none required an adjustment (Sect. 4). All cruises reported pH data on the total scale and at 25 °C. For the single cruise reporting pH on the seawater scale, the data were converted following established routines (Olsen et al., 2020). For details on scale and temperature conversions in previous versions of GLODAPv2, we refer to Olsen et al. (2020). In contrast to quality control of pH data in GLODAPv2 (Olsen et al., 2016), the evaluation of the internal consistency of CO2 system variables has not been used for the secondary quality control of the pH data in the GLODAPv2 updates of 2020 and onwards. For the 12 new cruises with pH in GLODAPv2.2023, only crossover analysis was used and was supplemented by CONTENT and CANYON-B comparisons (Sect. 3.2.4). Recent literature has demonstrated that internal consistency evaluation procedures are subject to errors owing to an incomplete understanding of the thermodynamic constants, major ion contents, measurement biases, and potential contribution of organic compounds or other unknown protolytes to alkalinity. These complications lead to pH-dependent offsets in calculated pH compared with cruise spectrophotometric pH measurements (Álvarez et al., 2020; Carter et al., 2018; Fong and Dickson, 2019; Takeshita et al., 2020). The pH-dependent offsets may be interpreted as biases and generate false corrections (Álvarez et al., 2020; García-Ibáñez et al., 2022). The offsets are particularly strong at pH levels below 7.7, where calculated and measured pH values are different by between 0.01 and 0.02 on average. For the North Pacific, this is a problem, as pH values below 7.7 can occur at the depths used during the QC (>1500 dbar for this region; Olsen et al., 2016). Since any correction, which may be an artifact, would be applied to the full profiles, we use a minimum adjustment of 0.02 for the North Pacific pH data in the merged product files. Elsewhere, the inconsistencies that may have arisen are smaller, since deep pH is typically higher than 7.7 (Lauvset et al., 2020), and at such levels, the difference between calculated and measured pH is less than 0.01 on average (Álvarez et al., 2020; Carter et al., 2018). Outside the North Pacific, we believe that the pH data are consistent to within 0.01. Avoiding CO2 chemistry internal consistency considerations for these intermediate products helps to reduce the problem, but since the reference dataset (as also used for the generation of the CANYON-B and CONTENT algorithms) may have these issues, a future full re-evaluation, envisioned for GLODAPv3, is needed to address the problem completely.
3.2.4 CANYON-B and CONTENT analyses
CANYON-B and CONTENT (Bittig et al., 2018) were used to support decisions regarding the application of adjustments (or not). CANYON-B is a neural network for estimating nutrients and seawater CO2 chemistry variables from temperature, salinity, and oxygen content. CONTENT additionally considers the consistency among the estimated CO2 chemistry variables to further refine them. These approaches were developed using the data included in the GLODAPv2 data product (i.e., the 2016 version without any more recent updates). Their advantage compared to crossover analyses for evaluating consistency among cruise data is that the effects of water mass changes on ocean properties are represented in the nonlinear relationships in the underlying neural network. For example, if elevated nutrient values measured on a cruise are not due to a measurement bias but rather the actual aging of the water masses that have been sampled and is as such accompanied by a decrease in oxygen content, then the measured values and the CANYON-B estimates are likely to be similar. Conversely, if the nutrient values are biased, then the measured values and CANYON-B predictions will be dissimilar.
Used in the correct way and with caution, this tool is a powerful supplement to the traditional crossover analyses which form the basis of our analyses. Specifically, we gave no weight to comparisons in which the crossover analyses had suggested that the salinity and/or O2 data were biased, as this would lead to error in the predicted values. We also considered the uncertainties in the CANYON-B and CONTENT estimates. These uncertainties are determined for each predicted value, and for each comparison, the ratio of the difference (between measured and predicted values) to the local uncertainty was used to gauge the comparability. As an example, the CANYON-B and CONTENT analyses of the data obtained for 35TH20180611 are presented in Fig. 5. The CANYON-B and CONTENT results confirmed the crossover comparisons for alkalinity discussed in Sect. 3.2.2, showing an inconsistency of only 1.3–1.4. For the other variables, the inconsistencies are low and agree with the crossover results (not shown here but results can be accessed through the adjustment table).
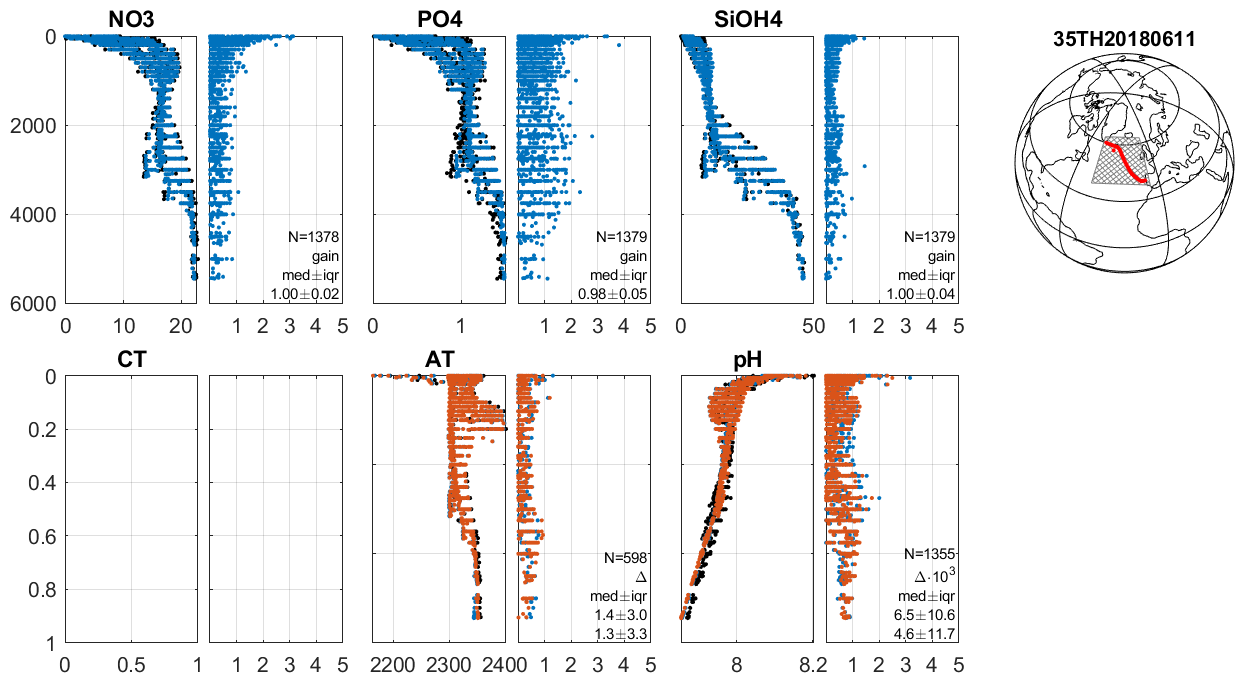
Figure 5Example summary figure for CANYON-B and CONTENT analyses for 35TH20180611. Any data from regions where CONTENT and CANYON-B were not trained are excluded. The top row shows the nutrients and the bottom row the seawater CO2 chemistry variables. All are shown versus sampling pressure (dbar), and the unit is micromoles per kilogram (µmol kg−1) for all except pH, which is on the total scale at in situ temperature and pressure. Black dots (which are to a large extent hidden by the predicted estimates) are the measured data, blue dots are CANYON-B estimates, and red dots are the CONTENT estimates. Each variable has two figure panels. The left shows the depth profile, while the right shows the absolute difference between measured and estimated values divided by the CANYON-B and CONTENT uncertainty estimate, which is determined for each estimated value. These values are used to gauge the comparability; a value below 1 indicates a good match, as it means that the difference between measured and estimated values is less than the uncertainty in the latter. The statistics in each panel are for all data deeper than 500 dbar, and N is the number of samples considered. A multiplicative adjustment and its interquartile range are given for the nutrients. For the seawater CO2 chemistry variables, the numbers in each panel are the median difference between the measured and predicted values for CANYON-B (upper) and CONTENT (lower). Both are given with their interquartile range.
Another advantage of the CANYON-B and CONTENT comparisons is that these procedures provide estimates at the level of individual data points; e.g., pH values are determined for every sampling location and depth where temperature, salinity, and O2 data are available. Cases of strong differences between measured and estimated values are always examined. This has helped us to identify primary QC issues for some cruises and variables; for example, there was a case of an inverted pH profile on cruise 32PO20130829 which was identified and amended in GLODAPv2.2020.
3.2.5 Halogenated transient tracers and SF6
For the halogenated transient tracers (CFC-11, CFC-12, CFC-113, and CCl4; CFCs for short) an inspection of surface saturation levels and an evaluation of relationships between the tracers for each cruise were used to identify biases rather than crossover analyses. Crossover analysis is of limited value for these variables, given their transient nature and low contents at depth. As for GLODAPv2, the procedures were the same as those applied for CARINA (Jeansson et al., 2010; Steinfeldt et al., 2010).
Beginning with GLODAPv2.2022, we have performed secondary quality control for SF6 data, as this tracer is increasingly being measured and has proven a valuable addition to CFCs. The procedure is mainly based on comparisons with the quality-controlled CFC-12 data, which are available for all cruises with SF6 measurements. We compare the surface saturation of SF6 with that of CFC-12 and also consider the correlation between SF6 and CFC-12 in the ocean interior. Typically, this relation shows some scatter and does not follow a distinct curve (Fig. 6). However, for a given CFC-12 value, the SF6 content should fall into a certain range, and this range can be estimated by the transit time distribution (TTD; Hall et al., 2002) method. Note that we are not trying to adjust SF6 to perfectly correlate with CFC-12, as that would severely decrease the value of SF6 as an independent constraint on ocean circulation. We merely confirm that the SF6 content is within an allowable range, and adjustments are only applied if all lines of evidence suggest that it is warranted. In GLODAPv2.2023, as in GLODAPv2.2022, no adjustment smaller than 10 % has been applied.
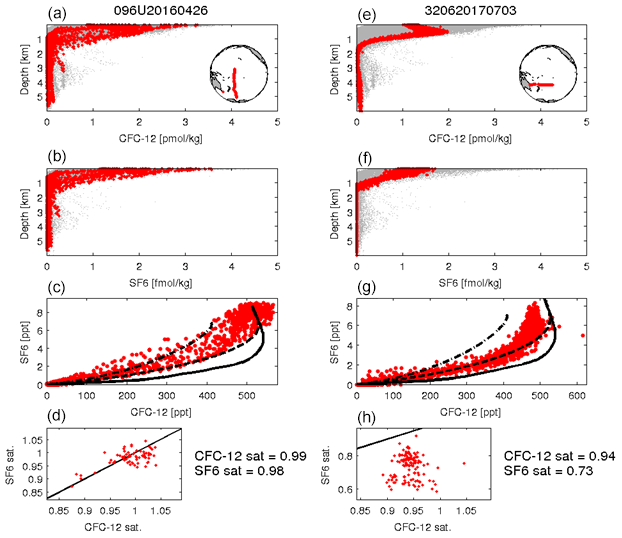
Figure 6Example of plots used as basis for the SF6 QC procedure. Shown are the results for cruises 096U20160426 (left) and 320620170703 (right). (a, e) CFC-12 versus pressure for the specific cruise (red), together with all data from the corresponding GLODAP region (Pacific in this case; gray). (b, f) Same as the upper row but for SF6. (c, g) CFC-12 versus SF6 (red dots). Here the measured contents have been converted into atmospheric mixing ratios. Solid black lines show the atmospheric time history of CFC-12 versus that of SF6. Dotted lines show CFC-12 versus SF6 derived from the TTD method for two different sets of TTD parameters. (d, h) CFC-12 vs. SF6 saturation for the surface layer (P<20 dbar), where the numbers give the mean saturation.
As TTD, we use an inverse Gaussian function, which can be described by two parameters: the mean age (Γ) and the width (Δ) (Hall et al., 2002). Typically, the ratios of are chosen as a fixed parameter, and Γ is varied. Here, we use a range of Γ between 0 and 2000 years and two values for , namely 0.5 and 2. This range of TTD parameters reproduces a simultaneous observation of different tracers, like CFC-12 and SF6, when calculating the tracer contents from the TTD and the atmospheric mixing ratio (Steinfeldt et al., 2009). Typically, for the same CFC-12 value derived from the TTD, the corresponding SF6 value increases with the ratio of the TTD, and it also increases with decreasing saturation (α). As the range for the expected SF6 to CFC-12 relation, we use the TTD with Δ/Γ=0.5 and α=1 as the lower boundary and the TTD with Δ/Γ=0.5 and 80 % saturation as the upper boundary. In some cases, like deep-water formation or an ice-covered region, the tracer saturation might be lower, as the minimum of 65 % from Steinfeldt et al. (2009) indicates, but the majority of the data is actually located between our assumed lower and upper boundaries (see the results for cruise 096U20160426 in Fig. 6). A few exceptions are found for cruises in the Southern Ocean, as has already been shown in Stöven et al. (2015). Note that in 1996, a SF6 release experiment was performed in the Greenland Sea (Watson et al., 1999). This leads to a large excess of SF6 compared to CFC-12 in the Nordic Seas, which is clearly visible in our analyses and hampers the quality control of the SF6 data in this region.
3.3 Merged product generation
The merged product file for GLODAPv2.2023 was created by updating cruises and correcting known issues in the GLODAPv2.2022 merged file and then appending a merged and bias-corrected file containing the 23 new cruises – sorted according to EXPOCODE, station, and pressure – to this updated GLODAPv2.2022 file. GLODAP cruise numbers were assigned consecutively, starting from 5001, so they can be distinguished from the GLODAPv2.2022 cruises, which ended at 4096. The merging was otherwise performed following the procedures used for previous GLODAP versions (Olsen et al., 2019, 2020; Lauvset et al., 2021).
3.3.1 Updates and corrections for GLODAPv2.2022
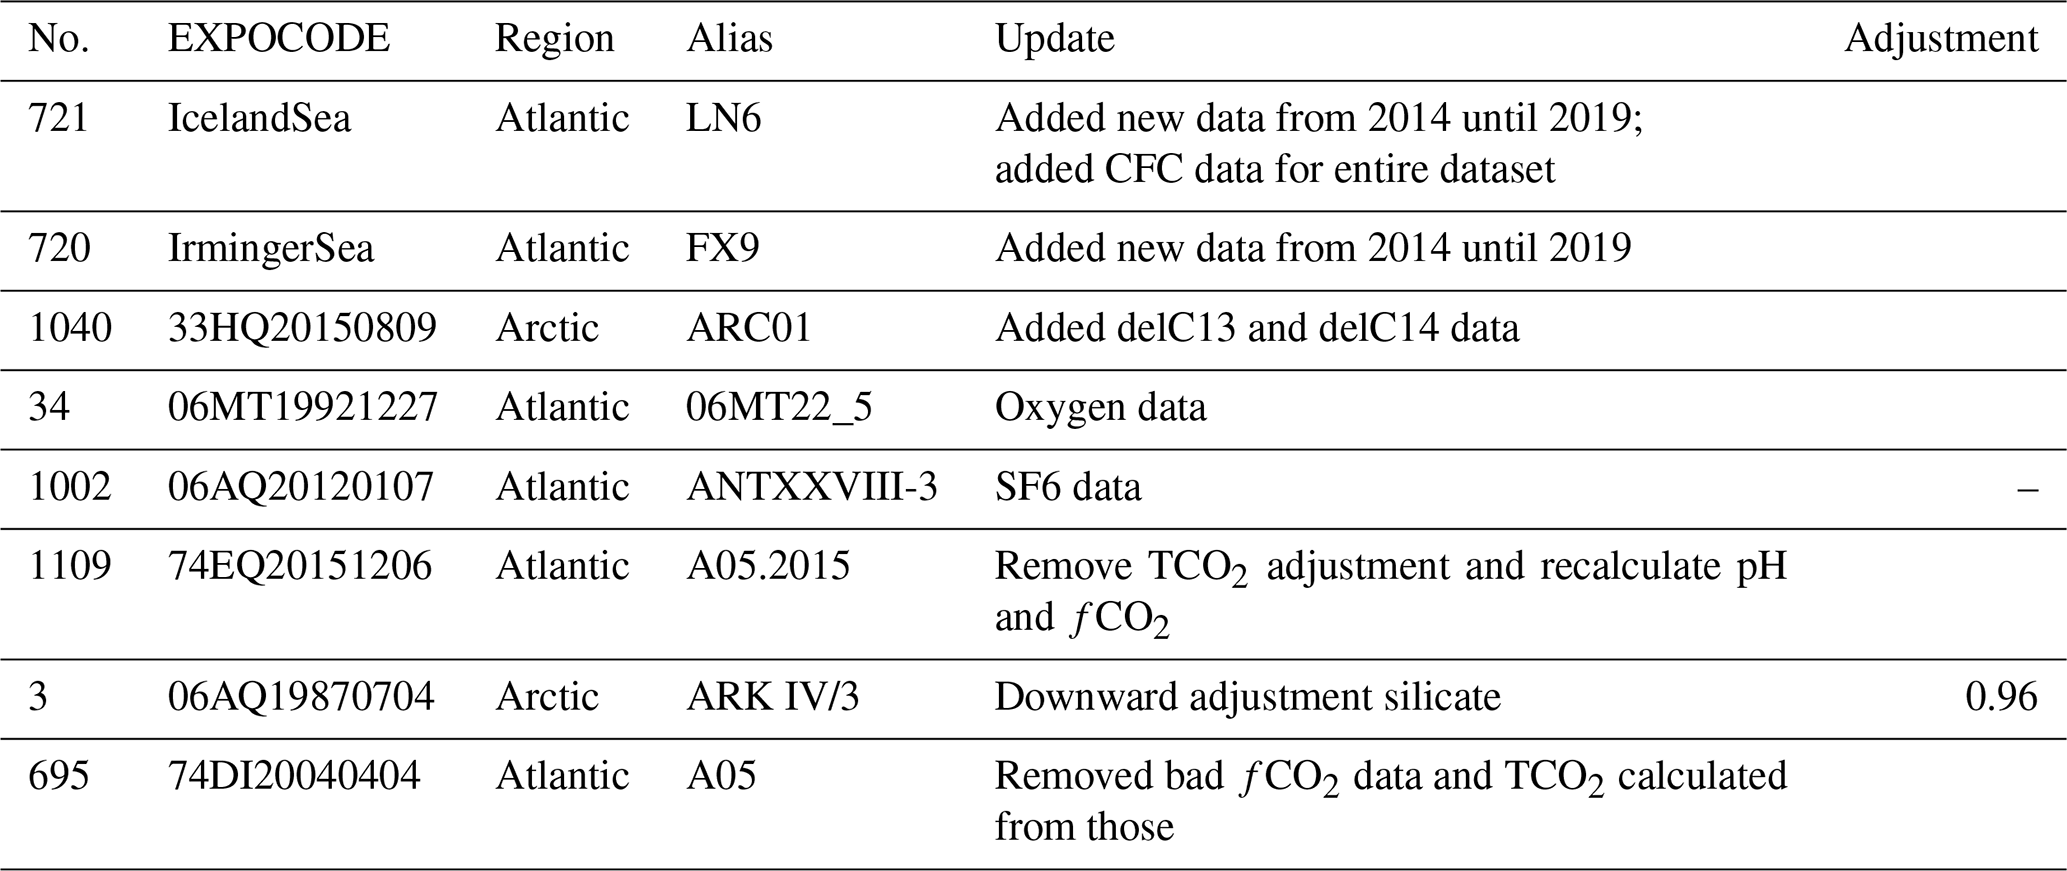
For GLODAPv2.2023 we made some minor updates to cruises included in GLODAPv2.2022 (and earlier versions).
Table A2 in the Appendix shows a list of the cruises that have been updated, as well as what the update consists of. In addition, a small number of duplicate data points were removed, and we fixed some rounding errors which resulted in the combination of station, cast, and bottle numbers not being unique for several cruises.
The secondary QC has five possible outcomes which are summarized in Table 5, along with the corresponding codes that appear in the online adjustment table and that are also occasionally used as shorthand for decisions in the text below. Some cruises were not applicable for full secondary QC. Specifically, in some cases, data were too shallow or geographically too isolated for full and conclusive consistency analyses. In other cases, the results of these analyses were inconclusive, but we have no reason to believe that the data in question are of poor quality. A secondary QC flag has been included in the merged product files to enable their identification, with “0” used for variables and cruises not subjected to full secondary QC (corresponding to code −888 in Table 5) and “1” for variables and cruises that were subjected to full secondary QC. The secondary QC flags are assigned per cruise and variable, not for individual data points, and are independent of – and included in addition to – the primary (WOCE) QC flag on individual measurements. For example, interpolated (salinity, oxygen, and nutrients) or calculated (TCO2, TAlk, and pH) values, which have a primary QC flag of 0, may have a secondary QC flag of 1 if the measured data these values are based on have been subjected to full secondary QC. Conversely, individual data points may have a secondary QC flag of 0, even if their primary QC flag is 2 (good data).
Table 5Possible outcomes of the secondary QC and their codes in the online adjustment table.
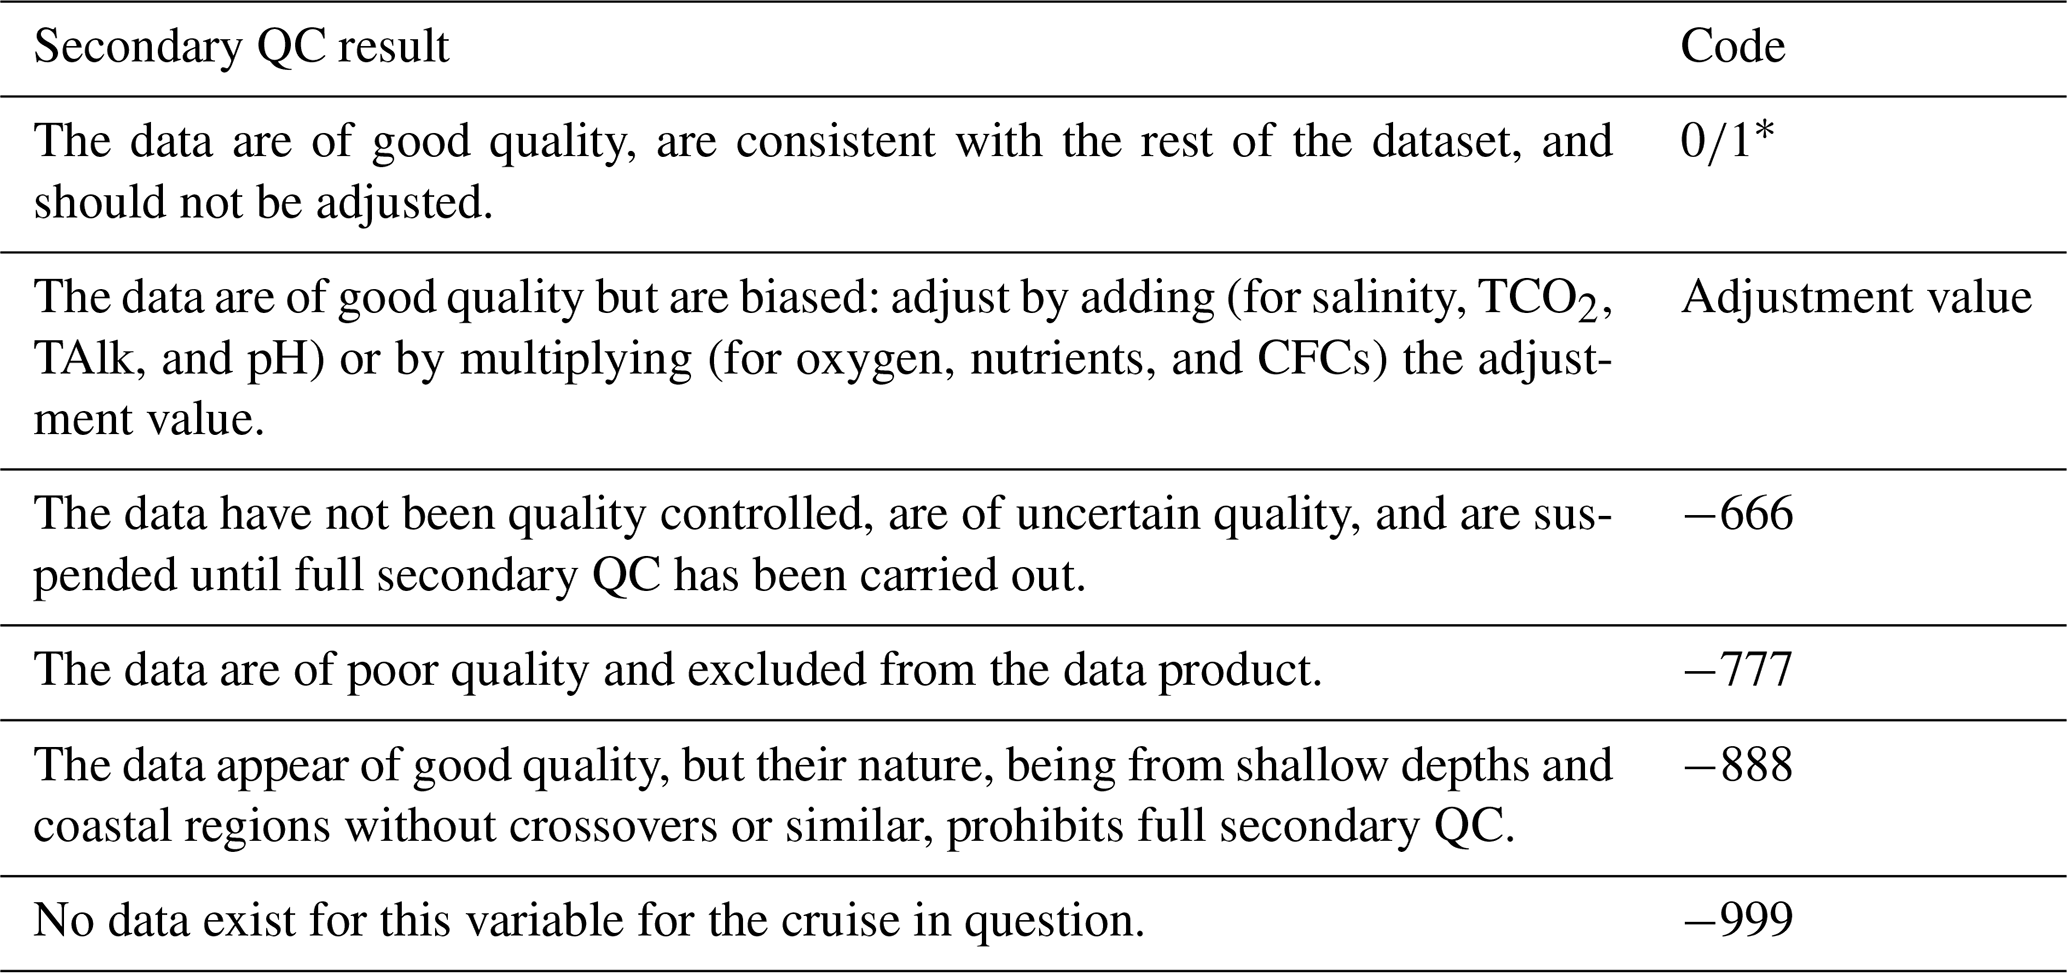
* The value of 0 is used for variables with additive adjustments (salinity, TCO2, TAlk, and pH) and 1 for variables with multiplicative adjustments (for oxygen, nutrients, and CFCs). This is mathematically equivalent to “no adjustment” in both cases.
The secondary QC actions for the 13 core variables and the distribution of adjustments applied on the 23 new cruises are summarized in Table 6 and Fig. 7, respectively. No salinity, oxygen, TCO2, pH, or phosphate data were adjusted. Out of the 22 cruises with TAlk, data from only 1 were adjusted. For nitrate, data from 2 out of 20 cruises were adjusted, and for silicate, 4 out of 17 cruises were adjusted. For the CFCs, no cruises required adjustment. Of the 23 new cruises in GLODAPv2.2022, 7 include SF6, and 1 required an adjustment. Overall, the magnitudes of the various adjustments applied are small, and the tendency observed during the production of the three previous updates remains, namely that the majority of recent cruises are consistent with earlier releases of the GLODAP data product. However, the new crossover and inversion analysis of all pH data in the northwestern Pacific that was planned following the release of GLODAPv2.2020 has not yet been performed. Such an analysis is planned for the next full update of GLODAP, i.e., GLODAPv3. Therefore, the conclusion from GLODAPv2.2020 remains that some caution should be exercised if looking at trends in ocean pH in the northwestern Pacific using GLODAPv2.2023 or earlier versions.
Table 6Summary of secondary QC results for the 23 new cruises (number of cruises per result and per variable).
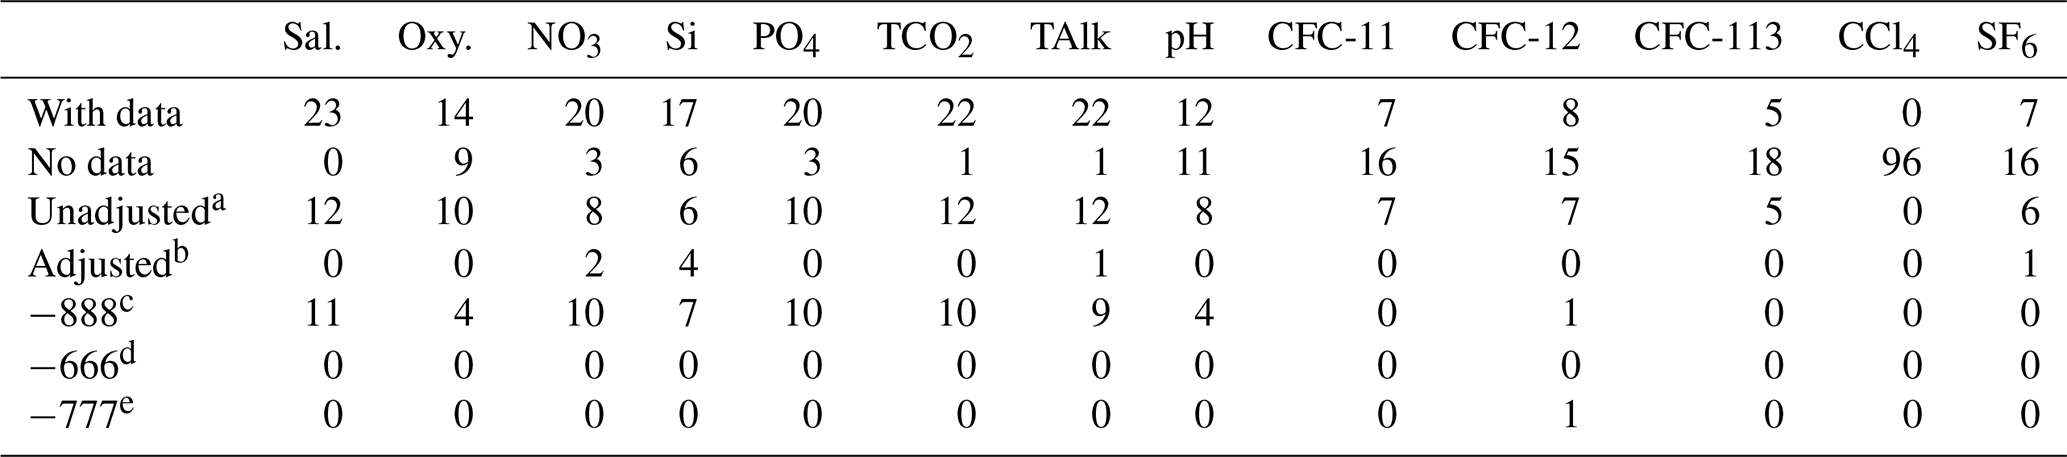
a The data are included in the data product file as captured, with a secondary QC flag of 1. b The adjusted data are included in the data product file with a secondary QC flag of 1. c Data appear to be of good quality but have not been subjected to full secondary QC. They are included in data product with a secondary QC flag of 0. d Data are of uncertain quality and suspended until full secondary QC has been carried out; they are excluded from the data product. e Data are of poor quality and excluded from the data product.
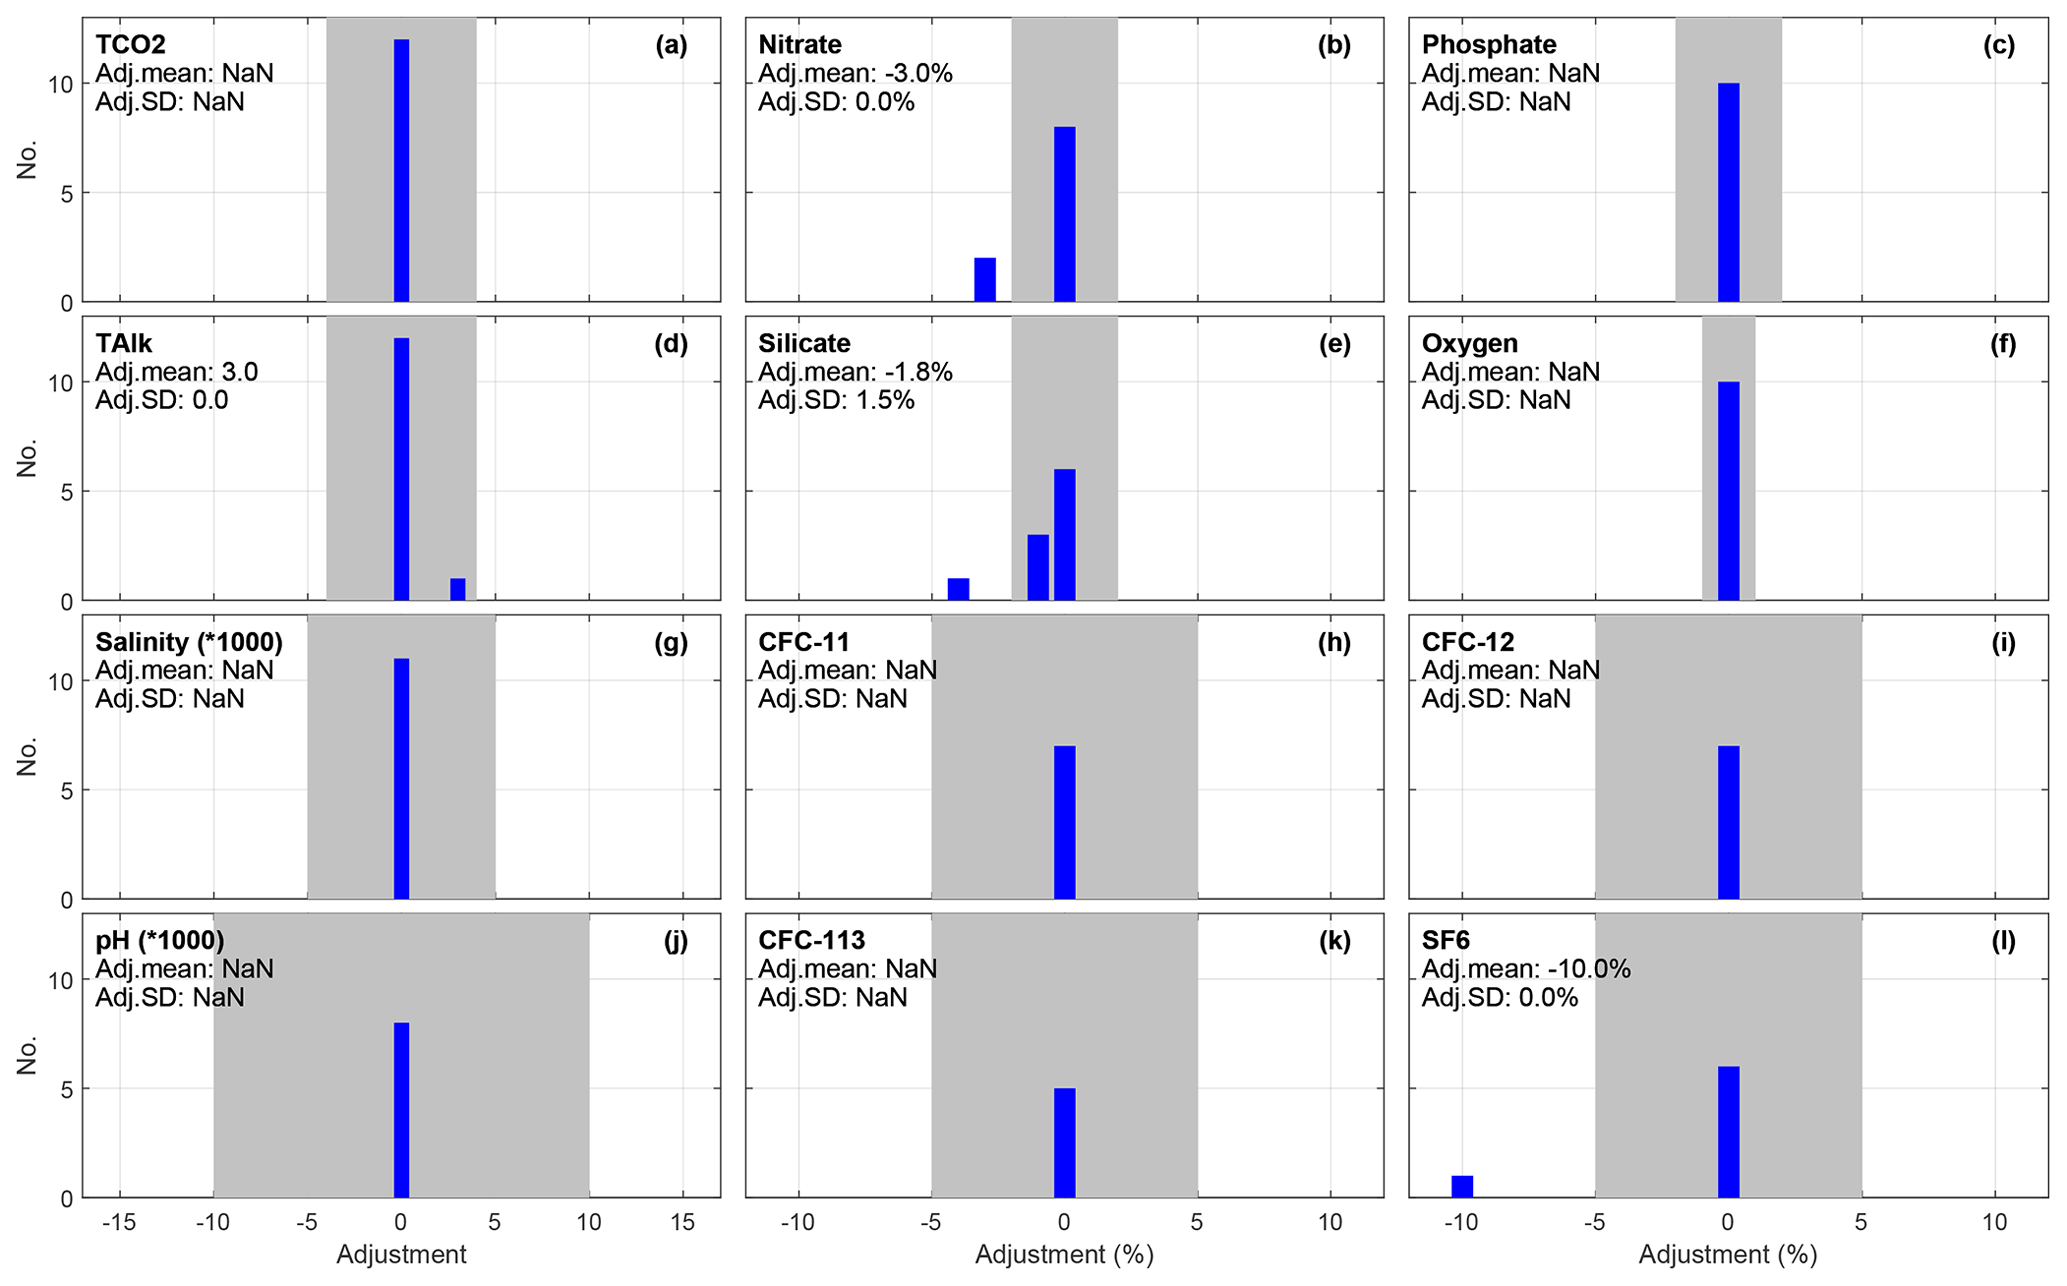
Figure 7Distribution of applied adjustments for each core variable that received secondary QC, in micromoles per kilogram (µmol kg−1) for TCO2 and TAlk and unitless for salinity and pH (but multiplied by 1000 in both cases so a common x axis can be used), while for the other properties adjustments are given in percent ((adjustment ratio −1) ×100). Gray areas depict the initial minimum adjustment limits. The figure includes numbers for data subjected to secondary quality control only. Note also that the y-axis scale is set to render the number of adjustments visible, so the bar showing zero offset (the 0 bar) for each variable is cut off (see Table 6 for these numbers).
For the nutrients, adjustments were applied to maintain consistency with data included in GLODAPv2.2022 and earlier versions. An alternative goal for the adjustments would be maintaining consistency with data from cruises that employed reference materials (RMNS) to ensure the accuracy of nutrient analyses. Such a strategy was adopted by Aoyama (2020) for preparation of the Global Nutrients Dataset 2013 (GND13) and is being considered for GLODAP as well. However, as this would require a re-evaluation of the entire dataset, this will not occur until the next full update of GLODAP. For now, we note the overall agreement between the adjustments applied in these two efforts (Aoyama, 2020) and that most disagreements appear to be related to cases where no adjustments were applied in GLODAP.
The improvement in data consistency resulting from the secondary QC process is evaluated by comparing the weighted mean of the absolute offsets for all crossovers before and after the adjustments have been applied. This “consistency improvement” for core variables is presented in Table 7. The data for CFCs were omitted from these analyses for previously discussed reasons (Sect. 3.2.5). Globally, the improvement is modest. Considering the initial data quality, this result was expected. However, this does not imply that the data were initially consistent everywhere. Rather, for some regions and variables, there can be substantial improvements when the adjustments are applied.
Table 7Improvements resulting from quality control of the 23 new cruises per basin and for the global dataset. The values in the table are the weighted mean of the absolute offset of unadjusted and adjusted data versus GLODAPv2.2022. The total number of valid crossovers in the global ocean for the variable in question is n. The values in this table represent the inter-cruise consistency in the GLODAPv2.2023 product.
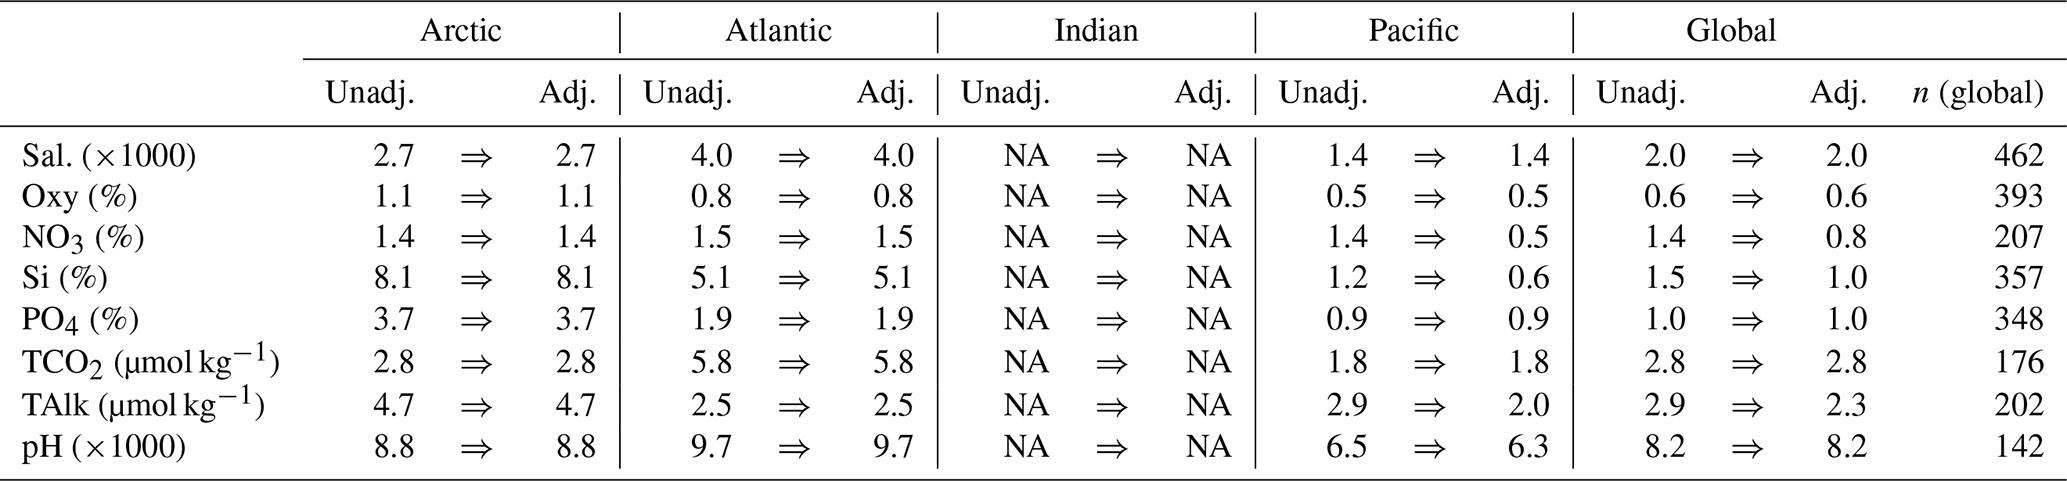
NA stands for not available.
The various iterations of GLODAP provide insight into initial data quality covering more than 4 decades. Figure 8 summarizes the applied absolute adjustment magnitude per decade. These distributions are broadly unchanged compared to GLODAPv2.2022 (Fig. 8 in Lauvset et al., 2022). Most TCO2 and TAlk data from the 1970s needed an adjustment, but this fraction steadily declines until only a small percentage is adjusted in recent years. This is encouraging and demonstrates the value of standardizing sampling and measurement practices (Dickson et al., 2007), the widespread use of CRMs (Dickson et al., 2003), and instrument automation. The pH adjustment frequency also has a downward trend; however, issues remain with the pH adjustments, and this is a topic for future development in GLODAP, with the support from the Ocean Carbon & Biogeochemistry (OCB) Ocean Carbonate System Intercomparison Forum (OCSIF, https://www.us-ocb.org/ocean-carbonate-system-intercomparison-forum/, last access: 7 September 2023) working group (Álvarez et al., 2020). For the nutrients and oxygen, only the phosphate adjustment frequency decreases from decade to decade. However, we do note that the more recent data from the 2010s receive the fewest adjustments. This may reflect the recent increased attention that seawater nutrient measurements have received through an operation manual (Becker et al., 2020; Hydes et al., 2010), the availability of RMNS (Aoyama et al., 2012; Ota et al., 2010), and the Scientific Committee on Oceanic Research (SCOR) working group no. 147 – towards comparability of global oceanic nutrient data (COMPONUT; https://scor-int.org/group/147/, last access: 16 October 2023). For silicate, the fraction of cruises receiving adjustments peaks in the 1990s and 2000s. This is related to the 2 % offset between US and Japanese cruises in the Pacific Ocean that was revealed during production of GLODAPv2 and discussed in Olsen et al. (2016). For salinity and the halogenated transient tracers, the number of adjusted cruises is small in every decade.
Table 8Table listing the number of data points in GLODAPv2.2023, as well as the number of data with various combinations of variables.
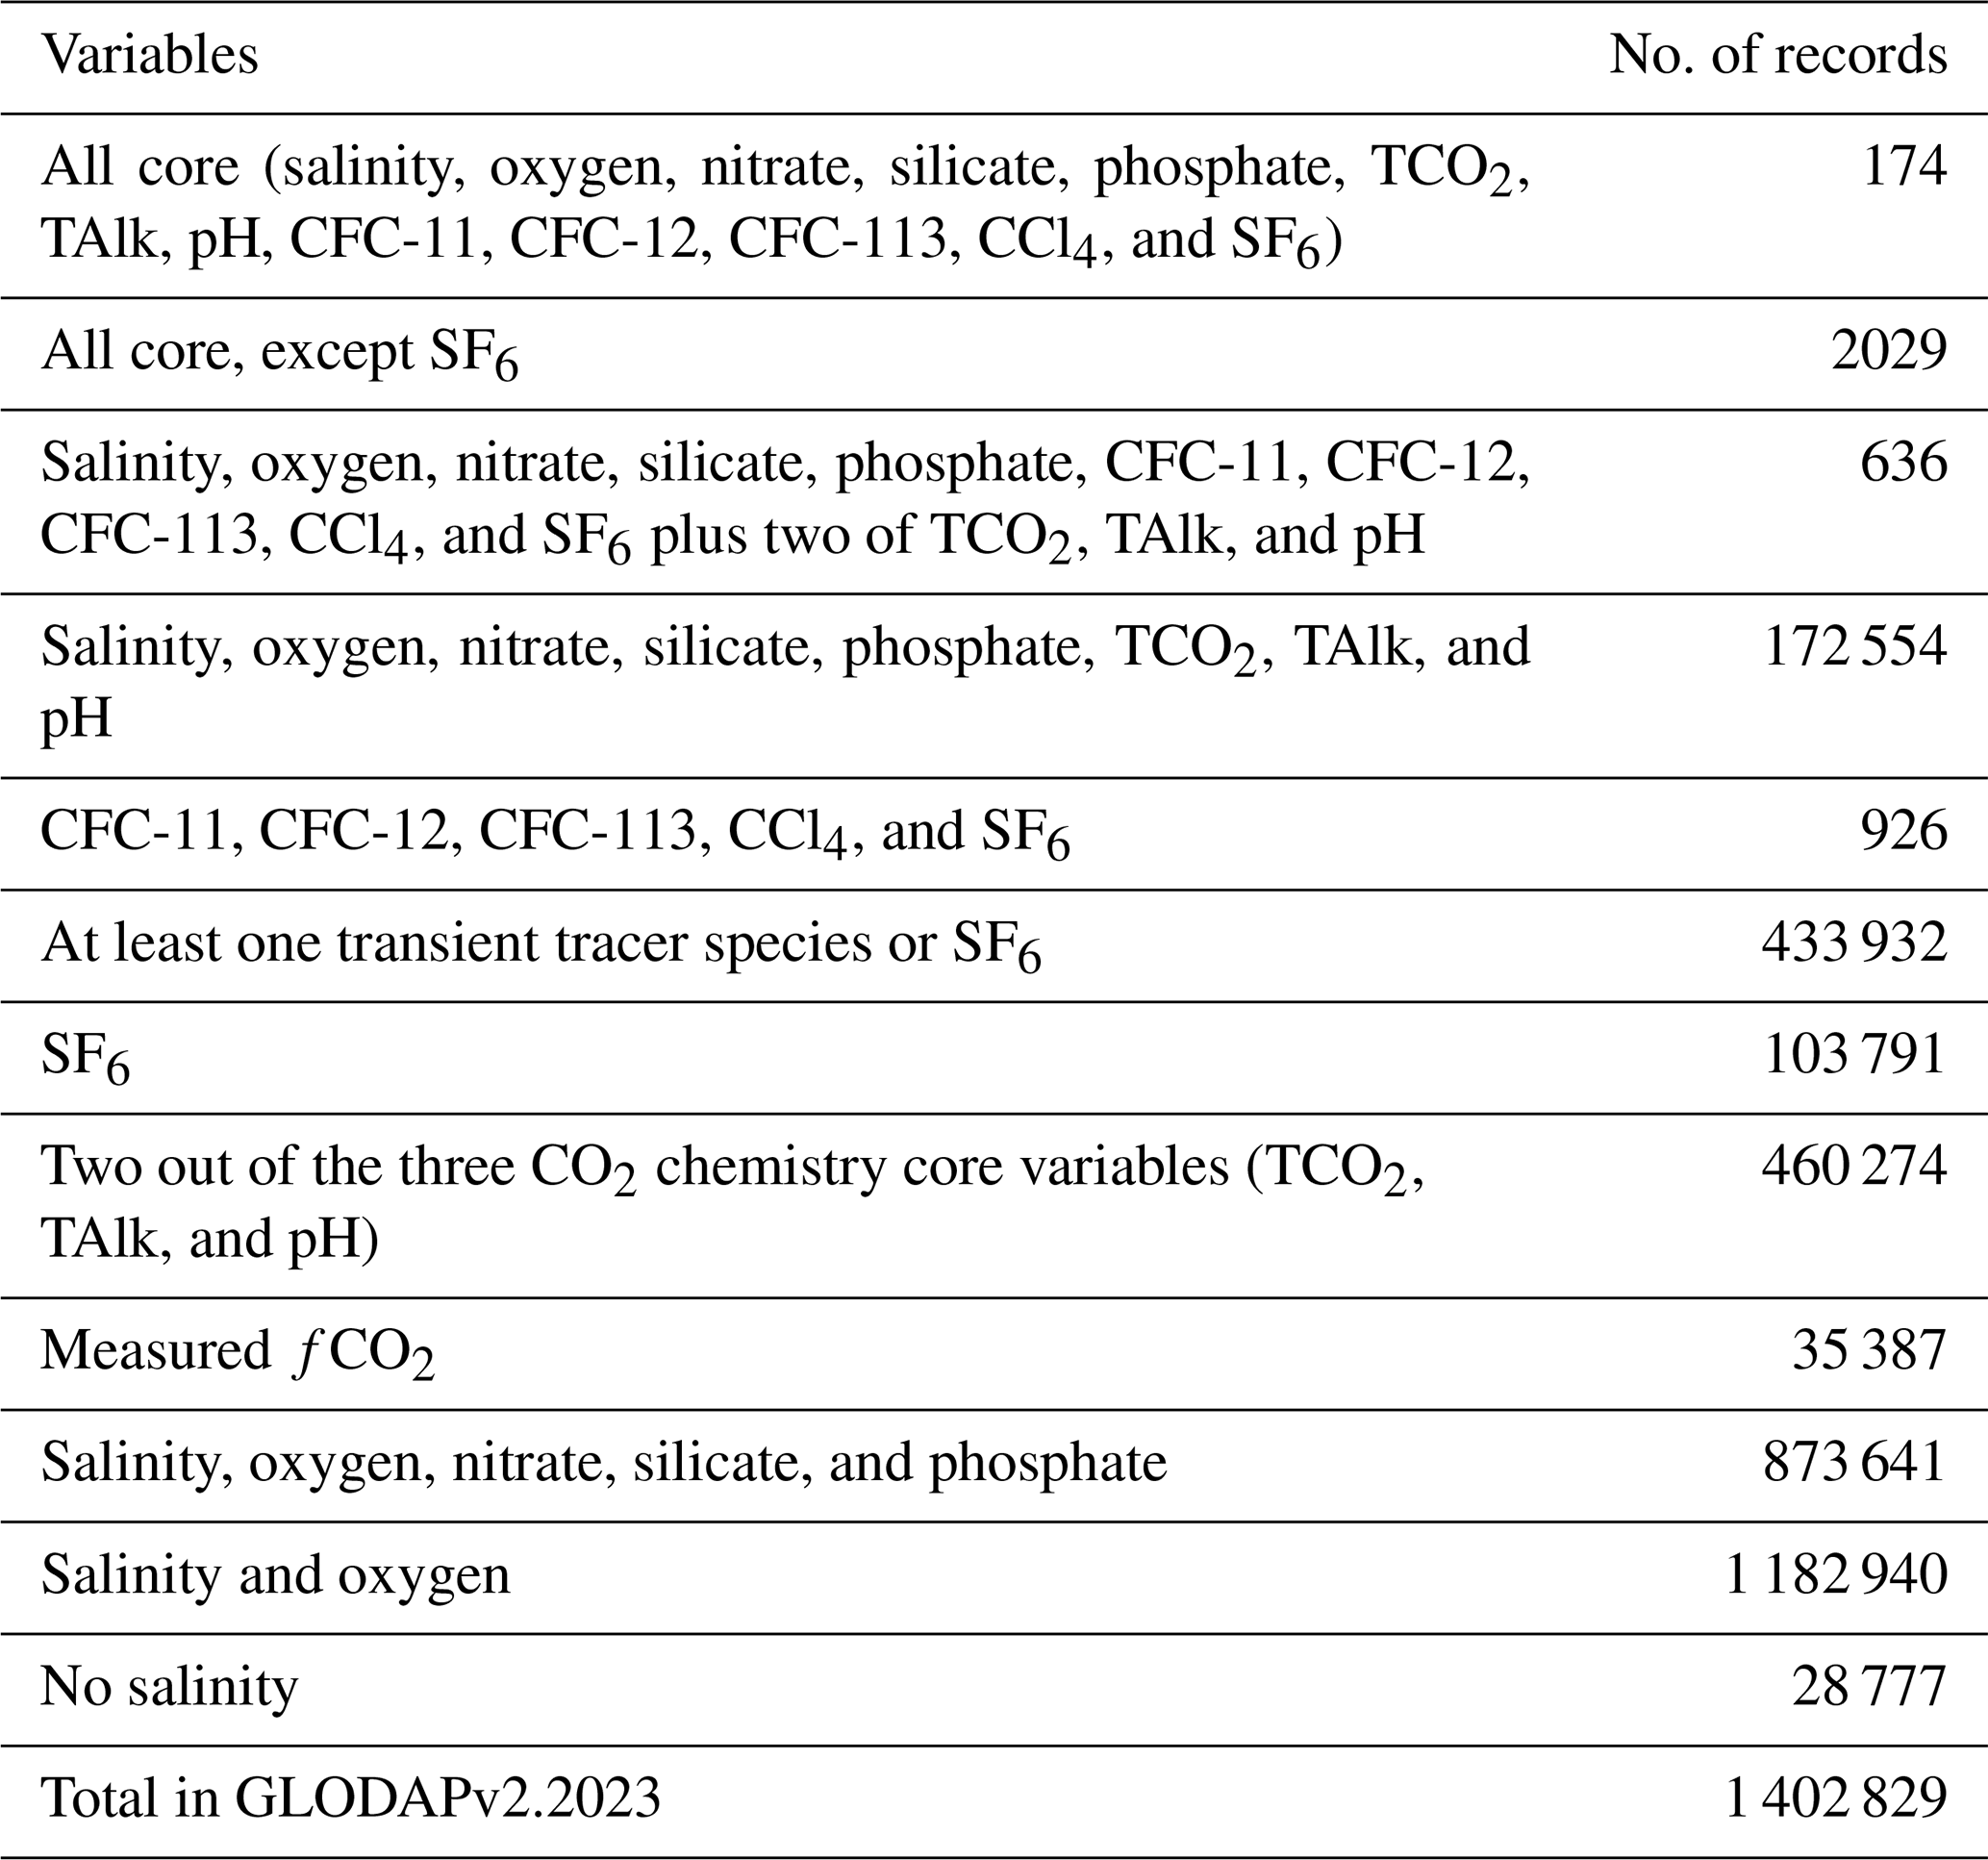
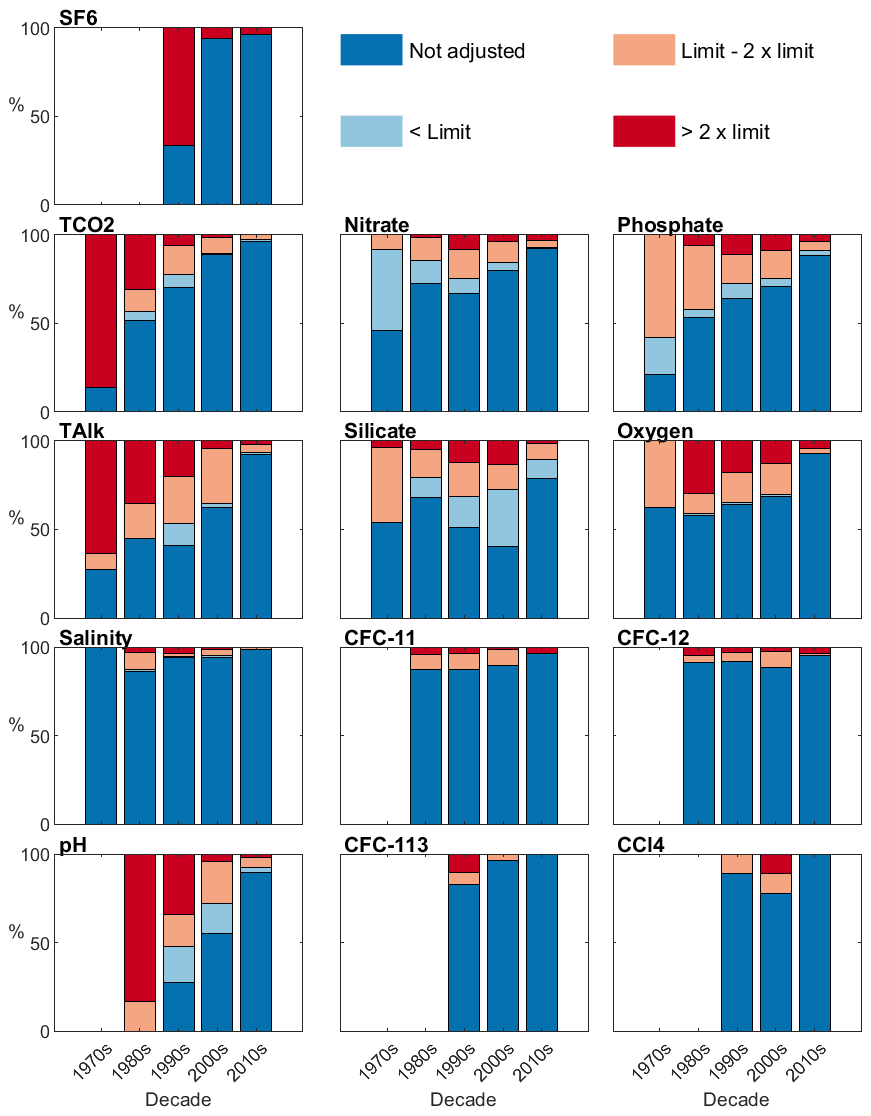
Figure 8Magnitude of applied adjustments relative to minimum adjustment limits (Table 3) per decade for the 1108 cruises included in GLODAPv2.2023.
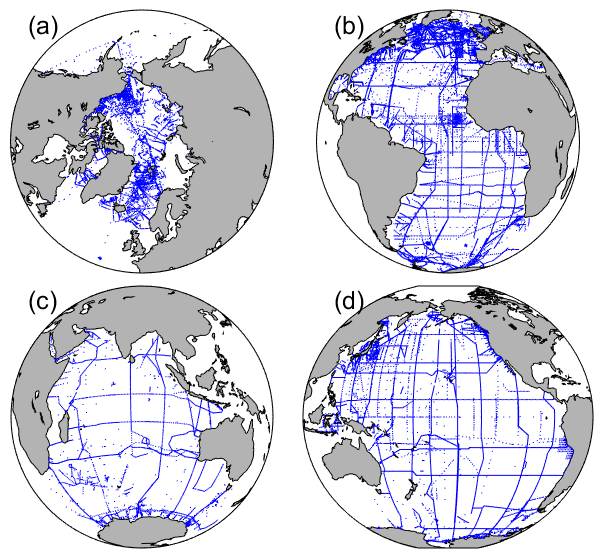
Figure 9Locations of stations included in the (a) Arctic, (b) Atlantic, (c) Indian, and (d) Pacific ocean product files for the complete GLODAPv2.2023 dataset.
The GLODAPv2.2023 merged and adjusted data product is archived at the OCADS of NOAA NCEI (https://doi.org/10.25921/zyrq-ht66, Lauvset et al., 2023). These data and the ancillary information are also available via our web pages and https://www.ncei.noaa.gov/access/ocean-carbon-acidification-data-system/oceans/GLODAPv2_2023/ (last access: 12 October 2023). The data are available as comma-separated ascii files (*.csv) and as binary MATLAB files (*.mat) that use the open-source Hierarchical Data Format, Version 5 (HDF5). The data product is also made available as an Ocean Data View (ODV) file which can be easily explored using the “webODV Explore” online data service (https://explore.webodv.awi.de/, last access: 27 October 2023). Regional subsets are available for the Arctic, Atlantic, Pacific, and Indian oceans. There are no data overlaps between regional subsets, and each cruise exists in only one basin file, even if data from that cruise cross basin boundaries. The station locations in each basin file are shown in Fig. 9. The product file variables are listed in Table 1. As well as being included in the *.csv and *.mat files, lookup tables for matching the EXPOCODE and DOI of a cruise with the GLODAP cruise number are provided with the data files. A “known issues document” accompanies the data files and provides an overview of known errors and omissions in the data product files. It is regularly updated, and users are encouraged to inform us whenever any new issues are identified.
All material produced during the secondary QC is available via the online GLODAP adjustment table hosted by GEOMAR, Kiel, Germany, at https://glodapv2-2023.geomar.de/ (last access: 16 April 2024; GLODAP, 2024a) and can also be accessed through https://www.glodap.info (last access: 7 September 2023). This is similar in form and function to the GLODAPv2 adjustment table (Olsen et al., 2016) and includes a brief written justification for any adjustments applied.
The original cruise files, with updated flags determined during additional primary GLODAP QC, are available through the GLODAPv2.2023 cruise summary table (CST) hosted by OCADS at https://www.ncei.noaa.gov/access/ocean-carbon-acidification-data-system/oceans/GLODAPv2_2023/cruise_table_v2023.html (last access: 12 October 2023; GLODAP, 2023). Each of these files has been assigned a DOI, which is included in the data product files but not listed here. The CST also provides brief information on each cruise and provides access to metadata, cruise reports, and its adjustment table entry.
While GLODAPv2.2023 is made available without any restrictions, users of the data should adhere to the fair data use principles; for investigations that rely on a particular (set of) cruise(s), recognize the contribution of GLODAP data contributors by at least citing both the cruise DOI and any articles where the data are described and, preferably, contacting the principal investigators to explore opportunities for collaboration and co-authorship. To this end, DOIs are provided in the product files, together with relevant articles and principal investigator names in the cruise summary table. Contacting principal investigators comes with the additional benefit that the principal investigators often possess expert insight into the data and/or specific region under investigation. This can improve scientific quality and promote data sharing.
This paper should be cited in any scientific publications that result from usage of the product. Citations provide the most efficient means to track the data use, which is important for attracting funding to enable the preparation of future updates.
GLODAPv2.2023 is an update of GLODAPv2.2022. Data from 23 new cruises have been added to supplement the earlier release. GLODAP now includes 48 years, 1972–2021, of global interior ocean biogeochemical data from 1108 cruises. The total number of data records is 1 402 829 (Table 8). Records with measurements for all 13 core variables (salinity, oxygen, nitrate, silicate, phosphate, TCO2, TAlk, pH, CFC-11, CFC-12, CFC-113, CCl4, and SF6) are very rare (174), and requiring only two out of the three core seawater CO2 chemistry variables, in addition to all the other core variables, is still very rare with only 636 records (Table 8). A major limiting factor to having all core variables together is the simultaneous availability of data for all four transient tracer species and SF6. In GLODAPv2.2023 there are 103 791 records with SF6 data and 433 932 records with at least one transient tracer or SF6. A total of 2 % (28 777) of all data records do not have salinity. There are several reasons for this, with the main one being the inability to vertically interpolate due to a separation between the measured samples that is too large. Other reasons for missing salinity include the salinity not being reported and missing depth or pressure, which leads to all other variables being set to −999 but not the removal of that line in the data product.
As for previous versions, there is a bias toward summertime in the data in both hemispheres; most data are collected during April through November in the Northern Hemisphere, while most data are collected during November through April in the Southern Hemisphere (Fig. 10). These tendencies are strongest for the Arctic and Antarctic regions and reflect the harsh conditions during winter months which make fieldwork difficult. The upper 100 m is the best-sampled part of the global ocean, both in terms of the number (Fig. 11a) and density (Fig. 11b) of observations. The number of observations steadily declines with depth. In part, this is caused by the reduction in ocean volume towards greater depths. Below 1000 m, the density of observations stabilizes and even increases between 5000 and 6000 m; the latter is a zone where the volume of each depth surface decreases sharply (Weatherall et al., 2015). In the deep trenches, i.e., areas deeper than ∼ 6000 m, both the number and density of observations are low.
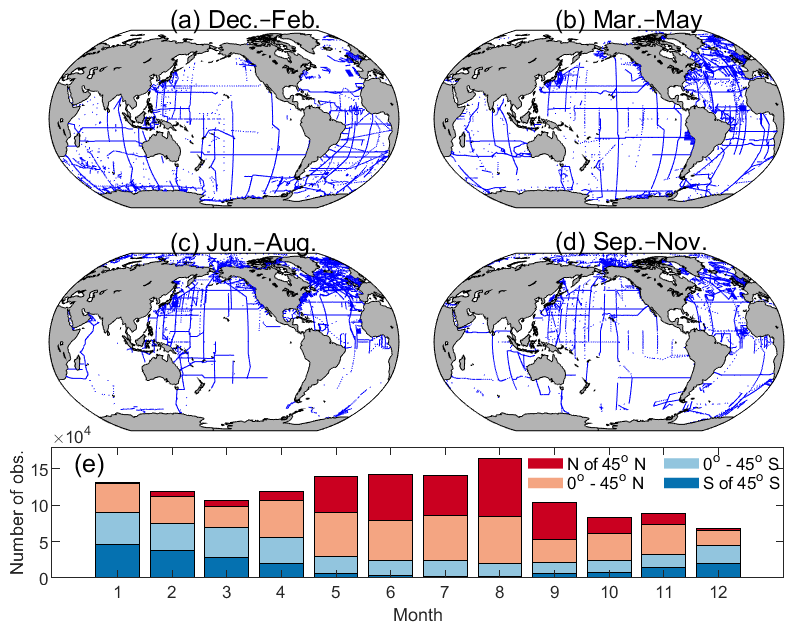
Figure 10Distribution of data in GLODAPv2.2023 in (a) December–February, (b) March–May, (c) June–August, and (d) September–November, as well as (e) the number of observations for each month in four latitude bands.
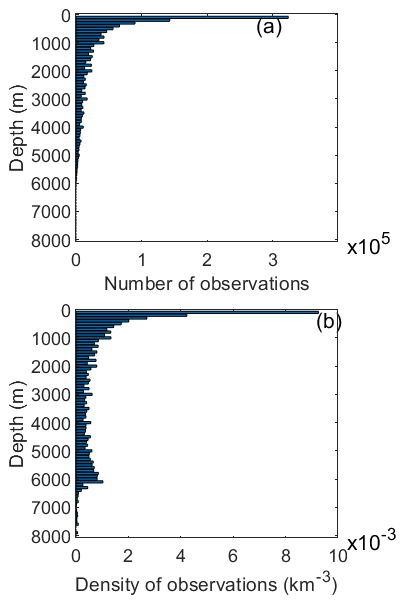
Figure 11Number (a) and density (b) of observations in 100 m depth layers. The latter was calculated by dividing the number of observations in each layer by its global volume calculated from ETOPO2 (National Geophysical Data Center, 2006). For example, in the layer between 0 and 100 m, there are on average 0.0075 observations per cubic kilometer. One observation is one water sampling point and has data for several variables.
Except for salinity and oxygen, the core data were collected exclusively through chemical analyses of collected water samples. The data of the 13 core variables were subjected to primary quality control to identify questionable or bad data points (outliers) and secondary quality control to identify systematic measurement biases. The data are provided in two ways: as a set of individual exchange-formatted original cruise data files with assigned WOCE flags and as globally and regionally merged data product files with adjustments applied to the data according to the outcome of the consistency analyses. Importantly, no adjustments were applied to the data in the individual cruise files while primary QC changes were applied.
The consistency analyses were conducted by comparing the data from the 23 new cruises to the previous data product GLODAPv2.2022. Adjustments were only applied when the offsets were believed to reflect biases relative to the earlier data product release related to measurement calibration and/or data-handling practices and not to natural variability or anthropogenic trends. The adjustment table at https://glodapv2-2023.geomar.de/ (last access: 15 August 2022) lists all applied adjustments and provides a brief justification for each. The consistency analyses rely on deep-ocean data (>1500 or 2000 dbar depending on region), but supplementary CANYON-B and CONTENT analyses consider data below 500 dbar. Data consistency for cruises with exclusively shallow sampling was not examined. All new pH data for this version were comprehensively reviewed using crossover analysis, and only one required adjustment. Regardless, full reanalysis of all available pH data, particularly in the North Pacific, will be conducted for GLODAPv3.
Secondary QC flags are included for the 13 core variables in the product files. These flags indicate whether (1) or not (0) the data successfully received secondary QC. A secondary QC flag of 0 does not by itself imply that the data are of lower quality than those with a flag of 1. It means these data have not been as thoroughly checked. For δ13C, the QC results by Becker et al. (2016) for the North Atlantic were applied, and a secondary QC flag was therefore added to this variable.
The primary WOCE QC flags in the product files are simplified (e.g., all questionable and bad data were removed). For salinity, oxygen, and the nutrients, any data flagged 0 are interpolated rather than measured. For TCO2, TAlk, pH, and fCO2, any data flags of 0 indicate that the values were calculated from two other measured seawater CO2 variables. Finally, while questionable (WOCE flag = 3) and bad (WOCE flag = 4) data have been excluded from the product files, some may have gone unnoticed through our analyses. Users of the data product are encouraged to report on any data that appear suspicious.
Based on the initial minimum adjustment limits and the improvement in the consistency resulting from the adjustments (Table 7), the data subjected to consistency analyses are believed to be consistent with to better than 0.005 in salinity, 1 % in oxygen, 2 % in nitrate, 2 % in silicate, 2 % in phosphate, 4 µmol kg−1 in TCO2, 4 µmol kg−1 in TAlk, and 5 % for the halogenated transient tracers and SF6. For pH, the consistency among all data is estimated as 0.01–0.02, depending on the region. As mentioned above, the included fCO2 data have not been subjected to quality control; therefore no consistency estimate is given for this variable. This should be conducted in future efforts.
Table A1Cruises included in GLODAPv2.2023 that did not appear in GLODAPv2.2022. Complete information on each cruise, such as variables included and chief scientist and principal investigator names, is provided in the cruise summary table at https://www.ncei.noaa.gov/access/ocean-carbon-acidification-data-system/oceans/GLODAPv2_2023/cruise_table_v2023.html (last access: 12 October 2023; GLODAP, 2023).
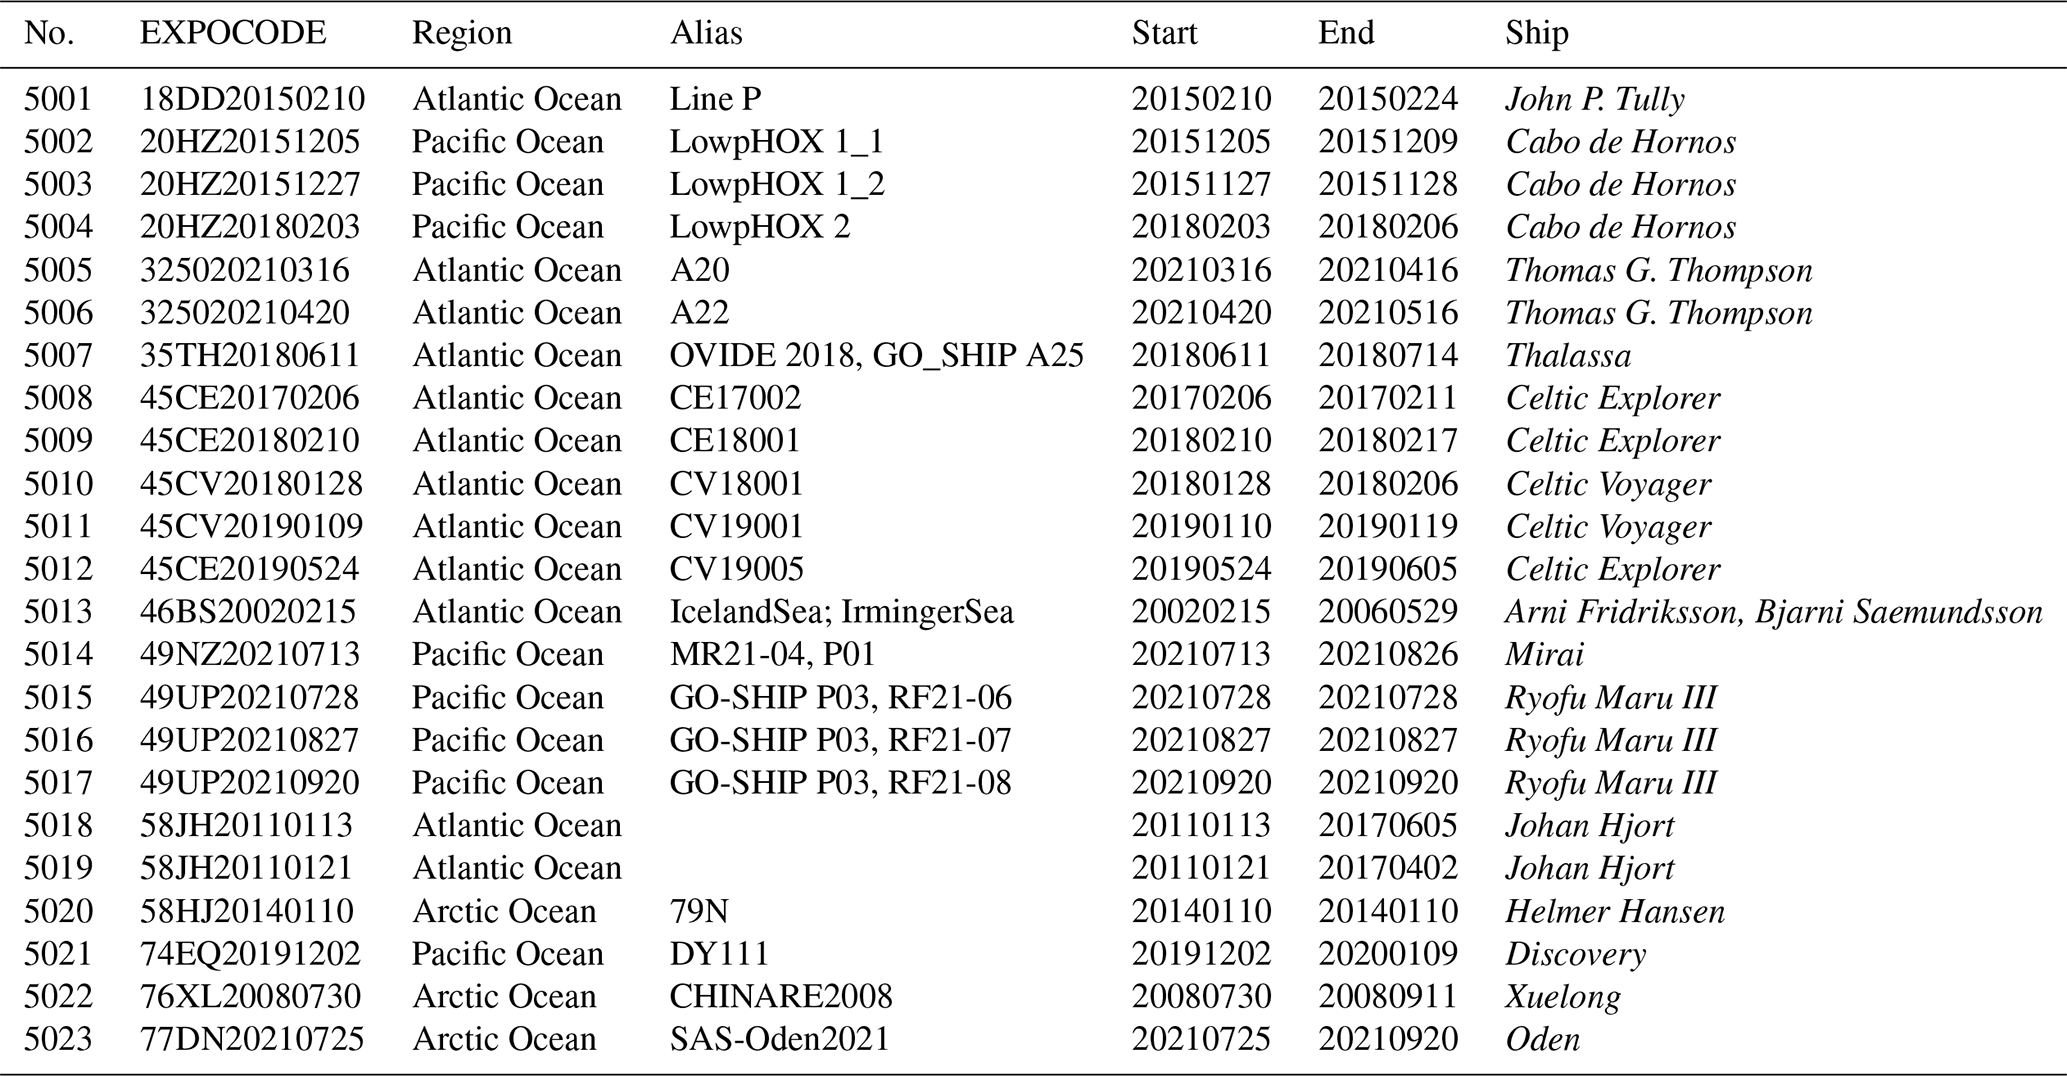
Table A2List of cruises included in GLODAPv2.2022 which have been updated as part of GLODAPv2.2023. Complete information on each cruise, such as variables included and chief scientist and principal investigator names, is provided in the cruise summary table at https://www.ncei.noaa.gov/access/ocean-carbon-acidification-data-system/oceans/GLODAPv2_2023/cruise_table_v2023.html (last access: 12 October 2023; GLODAP, 2023).
A former version of this article was published on 16 December 2022 and is available at https://doi.org/10.5194/essd-14-5543-2022.
SKL and TT led the team that produced this update. AK compiled the original data files and maintains the GLODAPv2 web pages at NCEI/OCADS. NL conducted the primary and secondary QC analyses. HCB conducted the CANYON-B and CONTENT analyses. CS manages the adjustment table e-infrastructure. TT, RS, and EJ performed the secondary QC on all transient tracers. All authors contributed to the interpretation of the secondary QC results and made decisions on whether to apply adjustments. NL, SKL, HCB, JDM, and MPH performed final checks of the data product. Many authors conducted ancillary QC analyses. SKL and NL updated the living data compilation with contributions from all authors.
At least one of the (co-)authors is a member of the editorial board of Earth System Science Data. The peer-review process was guided by an independent editor, and the authors also have no other competing interests to declare.
Publisher’s note: Copernicus Publications remains neutral with regard to jurisdictional claims made in the text, published maps, institutional affiliations, or any other geographical representation in this paper. While Copernicus Publications makes every effort to include appropriate place names, the final responsibility lies with the authors.
GLODAPv2.2023 would not have been possible without the effort of the many scientists who secured funding, dedicated time to collect data, and shared the data that are included. Chief scientists on the various cruises and principal investigators for specific variables are listed in the online cruise summary table. The author team also want to thank the large GLODAP user community for useful input and notifications about potential issues in the data products. Such input is invaluable and helps ensure that GLODAP maintains its high quality and consistency over time. The author team thanks all members of the GLODAP reference group who were unable to participate in the product development this year. GLODAP is a largely unfunded volunteer effort, and we acknowledge that it is sometimes not possible to prioritize this work. GLODAP is, regardless, a team effort, and the entire group contributes to the continued success of GLODAP. This work is CICOES and PMEL contribution nos. 2023-1321 and 5563, respectively. This activity has been supported by the International Ocean Carbon Coordination Project (IOCCP), and the author team acknowledges funding to IOCCP provided by a grant to SCOR from the U.S. National Science Foundation (grant no. OCE-2140395).
Nico Lange has been funded by EU Horizon 2020 through the EuroSea action (grant no. 862626). Siv K. Lauvset has received internal strategic funding from NORCE Climate. Are Olsen, Nico Lange, and Siv K. Lauvset have received funding from the EU Horizon Europe project OceanICU (grant no. 101083922). Leticia Cotrim da Cunha has been supported by the Prociencia 2022–2024 grant from Universidade do Estado do Rio de Janeiro (UERJ, Brazil) and the PQ2 309708/2021-4 grant from the National Council for Scientific and Technological Development (CNPq, Brazil). Marta Álvarez has been supported by an Instituto Español de Oceanografía (IEO) RADPROF project. Peter J. Brown has received partial funding from the UK Climate Linked Atlantic Sector Science (CLASS) NERC National Capability Long-term Single Centre Science Programme (grant no. NE/R015953/1). Anton Velo and Fiz F. Perez have been supported by the BOCATS2 (grant no. PID2019-104279GB-C21) project funded by MCIN/AEI/10.13039/501100011033 and the Horizon Europe project EuroGO-SHIP (grant no. 101094690). Brendan R. Carter has received funding from the Global Ocean Monitoring and Observing (GOMO) program of the National Oceanic and Atmospheric Administration (NOAA) through contributions (project no. 100007298) via the Cooperative Institute for Climate, Ocean, and Ecosystem Studies (CIOCES) under a NOAA Cooperative Agreement (grant no. NA20OAR4320271; contribution no. 2022–2012). Mario Hoppema has received funding from the EU Horizon 2020 Action SO-CHIC (grant no. 821001). Adam Ulfsbo has been supported by the Swedish Research Council Formas (grant no. 2018-01398). Jens Daniel Müller has received support from the European Union's Horizion 2020 research and innovation program for project 4C (grant no. 821003). Alex Kozyr has been supported by NOAA (grant no. NA19NES4320002; Cooperative Institute for Satellite Earth System Studies – CISESS) at the University of Maryland/ESSIC. Ryan J. Woosley has been supported by NSF grants (grant nos. OCE-1923312 and OCE-2148468). Masao Ishii has been supported by the Environment Research and Technology Development Fund of the Environmental Restoration and Conservation Agency of Japan (grant no. JPMEERF21S20810). GLODAP also acknowledges funding from the Initiative and Networking Fund of the Helmholtz Association through the project “Digital Earth” (grant no. ZT-0025).
This paper was edited by François G. Schmitt and reviewed by Sebastien Petton and one anonymous referee.
Álvarez, M., Fajar, N. M., Carter, B. R., Guallart, E. F., Pérez, F. F., Woosley, R. J., and Murata, A.: Global ocean spectrophotometric pH assessment: consistent inconsistencies, Environ. Sci. Technol., 54, 10977–10988, https://doi.org/10.1021/acs.est.9b06932, 2020.
Aoyama, M.: Global certified-reference-material- or reference-material-scaled nutrient gridded dataset GND13, Earth Syst. Sci. Data, 12, 487–499, https://doi.org/10.5194/essd-12-487-2020, 2020.
Aoyama, M., Ota, H., Kimura, M., Kitao, T., Mitsuda, H., Murata, A., and Sato, K.: Current status of homogeneity and stability of the reference materials for nutrients in Seawater, Anal. Sci., 28, 911–916, https://doi.org/10.2116/analsci.28.911, 2012.
Becker, M., Andersen, N., Erlenkeuser, H., Humphreys, M. P., Tanhua, T., and Körtzinger, A.: An internally consistent dataset of δ13C-DIC in the North Atlantic Ocean – NAC13v1, Earth Syst. Sci. Data, 8, 559–570, https://doi.org/10.5194/essd-8-559-2016, 2016.
Becker, S., Aoyama, M., Woodward, E. M. S., Bakker, K., Coverly, S., Mahaffey, C., and Tanhua, T.: GO-SHIP Repeat Hydrography Nutrient Manual: The Precise and Accurate Determination of Dissolved Inorganic Nutrients in Seawater, Using Continuous Flow Analysis Methods, Frontiers in Marine Science, 7, 908, https://doi.org/10.3389/fmars.2020.581790, 2020.
Bittig, H. C., Steinhoff, T., Claustre, H., Fiedler, B., Williams, N. L., Sauzède, R., Körtzinger, A., and Gattuso, J.-P.: An alternative to static climatologies: Robust estimation of open ocean CO2 variables and nutrient concentrations from T, S, and O2 data using Bayesian Neural Networks, Frontiers in Marine Science, 5, 328, https://doi.org/10.3389/fmars.2018.00328, 2018.
Bockmon, E. E. and Dickson, A. G.: An inter-laboratory comparison assessing the quality of seawater carbon dioxide measurements, Mar. Chem., 171, 36–43, https://doi.org/10.1016/j.marchem.2015.02.002, 2015.
Brakstad, A., Våge, K., Håvik, L., and Moore, G. W. K.: Water Mass Transformation in the Greenland Sea during the Period 1986–2016, J. Phys. Oceanogr., 49, 121–140, https://doi.org/10.1175/JPO-D-17-0273.1, 2019.
Carter, B. R., Feely, R. A., Williams, N. L., Dickson, A. G., Fong, M. B., and Takeshita, Y.: Updated methods for global locally interpolated estimation of alkalinity, pH, and nitrate, Limnol. Oceanogr.-Meth., 16, 119–131, https://doi.org/10.1002/lom3.10232, 2018.
Cheng, L. J., Trenberth, K. E., Fasullo, J., Boyer, T., Abraham, J., and Zhu, J.: Improved estimates of ocean heat content from 1960 to 2015, Sci. Adv., 3, e1601545, https://doi.org/10.1126/sciadv.1601545, 2017.
Cheng, L. J., Abraham, J., Zhu, J., Trenberth, K. E., Fasullo, J., Boyer, T., Locarnini, R., Zhang, B., Yu, F. J., Wan, L. Y., Chen, X. R., Song, X. Z., Liu, Y. L., and Mann, M. E.: Record-setting ocean warmth continued in 2019, Adv. Atmos. Sci, 37, 137–142, https://doi.org/10.1007/s00376-020-9283-7, 2020.
Dickson, A. G., Afghan, J. D., and Anderson, G. C.: Reference materials for oceanic CO2 analysis: a method for the certification of total alkalinity, Mar. Chem., 80, 185–197, https://doi.org/10.1016/S0304-4203(02)00133-0, 2003.
Dickson, A. G., Sabine, C. L., and Christian, J. R.: Guide to Best Practices for Ocean CO2 measurements, PICES Special Publication 3, North Pacific Marine Science Organization, 191 pp., 2007.
Falck, E. and Olsen, A.: Nordic Seas dissolved oxygen data in CARINA, Earth Syst. Sci. Data, 2, 123–131, https://doi.org/10.5194/essd-2-123-2010, 2010.
Fong, M. B., and Dickson, A. G.: Insights from GO-SHIP hydrography data into the thermodynamic consistency of CO2 system measurements in seawater, Mar. Chem., 211, 52–63, https://doi.org/10.1016/j.marchem.2019.03.006, 2019.
Friedlingstein, P., O'Sullivan, M., Jones, M. W., Andrew, R. M., Gregor, L., Hauck, J., Le Quéré, C., Luijkx, I. T., Olsen, A., Peters, G. P., Peters, W., Pongratz, J., Schwingshackl, C., Sitch, S., Canadell, J. G., Ciais, P., Jackson, R. B., Alin, S. R., Alkama, R., Arneth, A., Arora, V. K., Bates, N. R., Becker, M., Bellouin, N., Bittig, H. C., Bopp, L., Chevallier, F., Chini, L. P., Cronin, M., Evans, W., Falk, S., Feely, R. A., Gasser, T., Gehlen, M., Gkritzalis, T., Gloege, L., Grassi, G., Gruber, N., Gürses, Ö., Harris, I., Hefner, M., Houghton, R. A., Hurtt, G. C., Iida, Y., Ilyina, T., Jain, A. K., Jersild, A., Kadono, K., Kato, E., Kennedy, D., Klein Goldewijk, K., Knauer, J., Korsbakken, J. I., Landschützer, P., Lefèvre, N., Lindsay, K., Liu, J., Liu, Z., Marland, G., Mayot, N., McGrath, M. J., Metzl, N., Monacci, N. M., Munro, D. R., Nakaoka, S.-I., Niwa, Y., O'Brien, K., Ono, T., Palmer, P. I., Pan, N., Pierrot, D., Pocock, K., Poulter, B., Resplandy, L., Robertson, E., Rödenbeck, C., Rodriguez, C., Rosan, T. M., Schwinger, J., Séférian, R., Shutler, J. D., Skjelvan, I., Steinhoff, T., Sun, Q., Sutton, A. J., Sweeney, C., Takao, S., Tanhua, T., Tans, P. P., Tian, X., Tian, H., Tilbrook, B., Tsujino, H., Tubiello, F., van der Werf, G. R., Walker, A. P., Wanninkhof, R., Whitehead, C., Willstrand Wranne, A., Wright, R., Yuan, W., Yue, C., Yue, X., Zaehle, S., Zeng, J., and Zheng, B.: Global Carbon Budget 2022, Earth Syst. Sci. Data, 14, 4811–4900, https://doi.org/10.5194/essd-14-4811-2022, 2022.
Fröb, F., Olsen, A., Våge, K., Moore, G. W. K., Yashayaev, I., Jeansson, E., and Rajasakaren, B.: Irminger Sea deep convection injects oxygen and anthropogenic carbon to the ocean interior, Nat. Commun., 7, 13244, https://doi.org/10.1038/ncomms13244, 2016.
García-Ibáñez, M. I., Takeshita, Y., Guallart, E. F., Fajar, N. M., Pierrot, D., Pérez, F. F., Cai, W.-J., and Álvarez, M.: Gaining insights into the seawater carbonate system using discrete fCO2 measurements, Mar. Chem., 245, 104150, https://doi.org/10.1016/j.marchem.2022.104150, 2022.
GLODAP: Original Cruise Information and Data Table for GLODAPv2.2023, GLODAP [data set], https://www.ncei.noaa.gov/access/ocean-carbon-acidification-data-system/oceans/GLODAPv2_2023/cruise_table_v2023.html, last access: 12 October 2023.
GLODAP: GLODAPv2.2023 Adjustments, GLODAP [data set], https://glodapv2-2023.geomar.de/, last access: 16 April 2024a.
GLODAP: A uniformly calibrated open ocean data product of inorganic and carbon-relevant variables, http://www.glodap.info, last access: 16 April 2024b.
Gordon, A. L.: Deep Antarctic covection west of Maud Rise, J. Phys. Oceanogr., 8, 600–612, https://doi.org/10.1175/1520-0485(1978)008<0600:DACWOM>2.0.CO;2, 1978.
Gruber, N., Clement, D., Carter, B. R., Feely, R. A., van Heuven, S., Hoppema, M., Ishii, M., Key, R. M., Kozyr, A., Lauvset, S. K., Lo Monaco, C., Mathis, J. T., Murata, A., Olsen, A., Perez, F. F., Sabine, C. L., Tanhua, T., and Wanninkhof, R.: The oceanic sink for anthropogenic CO2 from 1994 to 2007, Science, 363, 1193–1199, https://doi.org/10.1126/science.aau5153, 2019.
Hall, T. M., Haine, T. W. N., and Waugh, D. W.: Inferring the concentration of anthropogenic carbon in the ocean from tracers, Global Biogeochem. Cy., 16, GB1131, https://doi.org/10.1029/2001GB001835, 2002.
Hansell, D. A., Carlson, C. A., Amon, R. M. W., Álvarez-Salgado, X. A., Yamashita, Y., Romera-Castillo, C., and Bif, M. B.: Compilation of dissolved organic matter (DOM) data obtained from global ocean observations from 1994 to 2021. Version 2 (NCEI Accession 0227166), NOAA National Centers for Environmental Information [data set], https://doi.org/10.25921/s4f4-ye35, 2021.
Hood, E. M., Sabine, C. L., and Sloyan, B. M. (Eds.): The GO-SHIP hydrography manual: A collection of expert reports and guidelines, IOCCP Report Number 14, ICPO Publication Series Number 134, http://www.go-ship.org/HydroMan.html (last access: 1 July 2022), 2010.
Hydes, D. J., Aoyama, A., Aminot, A., Bakker, K., Becker, S., Coverly, S., Daniel, A., Dickson, A. G., Grosso, O., Kerouel, R., van Ooijen, J., Sato, K., Tanhua, T., Woodward, E. M. S., and Zhang, J.-Z.: Determination of dissolved nutrients in seawater with high precision and intercomparability using gas-segmented continuous flow analysers, in: The GO SHIP Repeat Hydrography Manual: A Collection of Expert Reports and Guidelines, edited by: Hood, E. M., Sabine, C., and Sloyan, B. M., IOCCP Report Number 14, ICPO Publication Series Number 134, ICPO, http://www.go-ship.org/HydroMan.html (last access: 1 July 2022), 2010.
Jeansson, E., Olsson, K. A., Tanhua, T., and Bullister, J. L.: Nordic Seas and Arctic Ocean CFC data in CARINA, Earth Syst. Sci. Data, 2, 79–97, https://doi.org/10.5194/essd-2-79-2010, 2010.
Jenkins, W. J., Doney, S. C., Fendrock, M., Fine, R., Gamo, T., Jean-Baptiste, P., Key, R., Klein, B., Lupton, J. E., Newton, R., Rhein, M., Roether, W., Sano, Y., Schlitzer, R., Schlosser, P., and Swift, J.: A comprehensive global oceanic dataset of helium isotope and tritium measurements, Earth Syst. Sci. Data, 11, 441–454, https://doi.org/10.5194/essd-11-441-2019, 2019.
Jiang, L.-Q., Pierrot, D., Wanninkhof, R., Feely, R. A., Tilbrook, B., Alin, S., Barbero, L., Byrne, R. H., Carter, B. R., Dickson, A. G., Gattuso, J.-P., Greeley, D., Hoppema, M., Humphreys, M. P., Karstensen, J., Lange, N., Lauvset, S. K., Lewis, E. R., Olsen, A., Pérez, F. F., Sabine, C., Sharp, J. D., Tanhua, T., Trull, T. W., Velo, A., Allegra, A. J., Barker, P., Burger, E., Cai, W.-J., Chen, C.-T. A., Cross, J., Garcia, H., Hernandez-Ayon, J. M., Hu, X., Kozyr, A., Langdon, C., Lee, K., Salisbury, J., Wang, Z. A., and Xue, L.: Best Practice Data Standards for Discrete Chemical Oceanographic Observations, Frontiers in Marine Science, 8, 705638, https://doi.org/10.3389/fmars.2021.705638, 2022.
Joyce, T. and Corry, C.: Chapter 4. Hydrographic Data Formats, in Requirements for WOCE Hydrographic Programme Data Reporting, WOCE Hydrographic Programme Office, Woods Hole Oceanographic Institution, Woods Hole, MA, 1994.
Jutterström, S., Anderson, L. G., Bates, N. R., Bellerby, R., Johannessen, T., Jones, E. P., Key, R. M., Lin, X., Olsen, A., and Omar, A. M.: Arctic Ocean data in CARINA, Earth Syst. Sci. Data, 2, 71–78, https://doi.org/10.5194/essd-2-71-2010, 2010.
Key, R. M., Kozyr, A., Sabine, C. L., Lee, K., Wanninkhof, R., Bullister, J. L., Feely, R. A., Millero, F. J., Mordy, C., and Peng, T. H.: A global ocean carbon climatology: Results from Global Data Analysis Project (GLODAP), Global Biogeochem. Cy., 18, GB4031, https://doi.org/10.1029/2004GB002247, 2004.
Key, R. M., Tanhua, T., Olsen, A., Hoppema, M., Jutterström, S., Schirnick, C., van Heuven, S., Kozyr, A., Lin, X., Velo, A., Wallace, D. W. R., and Mintrop, L.: The CARINA data synthesis project: introduction and overview, Earth Syst. Sci. Data, 2, 105–121, https://doi.org/10.5194/essd-2-105-2010, 2010.
Lauvset, S. K. and Tanhua, T.: A toolbox for secondary quality control on ocean chemistry and hydrographic data, Limnol. Oceanogr.-Meth., 13, 601–608, https://doi.org/10.1002/lom3.10050, 2015.
Lauvset, S. K., Key, R. M., Olsen, A., van Heuven, S., Velo, A., Lin, X., Schirnick, C., Kozyr, A., Tanhua, T., Hoppema, M., Jutterström, S., Steinfeldt, R., Jeansson, E., Ishii, M., Perez, F. F., Suzuki, T., and Watelet, S.: A new global interior ocean mapped climatology: the 1° × 1° GLODAP version 2, Earth Syst. Sci. Data, 8, 325–340, https://doi.org/10.5194/essd-8-325-2016, 2016.
Lauvset, S. K., Carter, B. R., Perez, F. F., Jiang, L.-Q., Feely, R. A., Velo, A., and Olsen, A.: Processes Driving Global Interior Ocean pH Distribution, Global Biogeochem. Cy., 34, e2019GB006229, https://doi.org/10.1029/2019gb006229, 2020.
Lauvset, S. K., Lange, N., Tanhua, T., Bittig, H. C., Olsen, A., Kozyr, A., Álvarez, M., Becker, S., Brown, P. J., Carter, B. R., Cotrim da Cunha, L., Feely, R. A., van Heuven, S., Hoppema, M., Ishii, M., Jeansson, E., Jutterström, S., Jones, S. D., Karlsen, M. K., Lo Monaco, C., Michaelis, P., Murata, A., Pérez, F. F., Pfeil, B., Schirnick, C., Steinfeldt, R., Suzuki, T., Tilbrook, B., Velo, A., Wanninkhof, R., Woosley, R. J., and Key, R. M.: An updated version of the global interior ocean biogeochemical data product, GLODAPv2.2021, Earth Syst. Sci. Data, 13, 5565–5589, https://doi.org/10.5194/essd-13-5565-2021, 2021.
Lauvset, S. K., Lange, N., Tanhua, T., Bittig, H. C., Olsen, A., Kozyr, A., Alin, S., Álvarez, M., Azetsu-Scott, K., Barbero, L., Becker, S., Brown, P. J., Carter, B. R., da Cunha, L. C., Feely, R. A., Hoppema, M., Humphreys, M. P., Ishii, M., Jeansson, E., Jiang, L.-Q., Jones, S. D., Lo Monaco, C., Murata, A., Müller, J. D., Pérez, F. F., Pfeil, B., Schirnick, C., Steinfeldt, R., Suzuki, T., Tilbrook, B., Ulfsbo, A., Velo, A., Woosley, R. J., and Key, R. M.: GLODAPv2.2022: the latest version of the global interior ocean biogeochemical data product, Earth Syst. Sci. Data, 14, 5543–5572, https://doi.org/10.5194/essd-14-5543-2022, 2022.
Lauvset, S. K., Lange, N., Tanhua, T., Bittig, H. C., Olsen, A., Kozyr, A., Álvarez, M., Azetsu-Scott, K., Barbero, L., Becker, S., Brown, P. J., Carter, B. R., Cotrim da Cunha, L., Feely, R. A., Hoppema, M., Humphreys, M. P., Ishii, M., Jeansson, E., Jones, S. D., Lo Monaco, C., Murata, A., Müller, J. D., Pérez, F. F., Schirnick, C., Steinfeldt, R., Suzuki, T., Tilbrook, B., Ulfsbo, A., Velo, A., Woosley, R. J., and Key, R. M.: The annual update GLODAPv2.2023: the global interior ocean biogeochemical data product (NCEI Accession 0283442), NOAA National Centers for Environmental Information [data set], https://doi.org/10.25921/zyrq-ht66, 2023.
Müller, J. D., Gruber, N., Carter, B., Feely, R., Ishii, M., Lange, N., Lauvset, S. K., Murata, A., Olsen, A., Pérez, F. F., Sabine, C., Tanhua, T., Wanninkhof, R., and Zhu, D.: Decadal Trends in the Oceanic Storage of Anthropogenic Carbon From 1994 to 2014, AGU Advances, 4, e2023AV000875, https://doi.org/10.1029/2023AV000875, 2023.
National Geophysical Data Center/NESDIS/NOAA/U.S. Department of Commerce: ETOPO2, Global 2 Arc-minute Ocean Depth and Land Elevation from the US National Geophysical Data Center (NGDC), Research Data Archive at the National Center for Atmospheric Research, Computational and Information Systems Laboratory [data set], https://doi.org/10.5065/D6668B75, 2006.
Olsen, A., Key, R. M., van Heuven, S., Lauvset, S. K., Velo, A., Lin, X., Schirnick, C., Kozyr, A., Tanhua, T., Hoppema, M., Jutterström, S., Steinfeldt, R., Jeansson, E., Ishii, M., Pérez, F. F., and Suzuki, T.: The Global Ocean Data Analysis Project version 2 (GLODAPv2) – an internally consistent data product for the world ocean, Earth Syst. Sci. Data, 8, 297–323, https://doi.org/10.5194/essd-8-297-2016, 2016.
Olsen, A., Lange, N., Key, R. M., Tanhua, T., Álvarez, M., Becker, S., Bittig, H. C., Carter, B. R., Cotrim da Cunha, L., Feely, R. A., van Heuven, S., Hoppema, M., Ishii, M., Jeansson, E., Jones, S. D., Jutterström, S., Karlsen, M. K., Kozyr, A., Lauvset, S. K., Lo Monaco, C., Murata, A., Pérez, F. F., Pfeil, B., Schirnick, C., Steinfeldt, R., Suzuki, T., Telszewski, M., Tilbrook, B., Velo, A., and Wanninkhof, R.: GLODAPv2.2019 – an update of GLODAPv2, Earth Syst. Sci. Data, 11, 1437–1461, https://doi.org/10.5194/essd-11-1437-2019, 2019.
Olsen, A., Lange, N., Key, R. M., Tanhua, T., Bittig, H. C., Kozyr, A., Álvarez, M., Azetsu-Scott, K., Becker, S., Brown, P. J., Carter, B. R., Cotrim da Cunha, L., Feely, R. A., van Heuven, S., Hoppema, M., Ishii, M., Jeansson, E., Jutterström, S., Landa, C. S., Lauvset, S. K., Michaelis, P., Murata, A., Pérez, F. F., Pfeil, B., Schirnick, C., Steinfeldt, R., Suzuki, T., Tilbrook, B., Velo, A., Wanninkhof, R., and Woosley, R. J.: An updated version of the global interior ocean biogeochemical data product, GLODAPv2.2020, Earth Syst. Sci. Data, 12, 3653–3678, https://doi.org/10.5194/essd-12-3653-2020, 2020.
Ota, H., Mitsuda, H., Kimura, M., and Kitao, T.: Reference materials for nutrients in seawater: Their development and present homogenity and stability, in: Comparability of nutrients in the world's oceans, edited by: Aoyama, A., Dickson, A. G., Hydes, D. J., Murata, A., Oh, J. R., Roose, P., and Woodward, E. M. S., Mother Tank, Tsukuba, Japan, 2010.
Sabine, C., Key, R. M., Kozyr, A., Feely, R. A., Wanninkhof, R., Millero, F. J., Peng, T.-H., Bullister, J. L., and Lee, K.: Global Ocean Data Analysis Project (GLODAP): Results and Data, ORNL/CDIAC-145, NDP-083, Carbon Dioxide Information Analysis Center, Oak Ridge National Laboratory, U.S. Department of Energy, Oak Ridge, TN, USA, https://www.pmel.noaa.gov/co2/files/ndp083.pdf (last access: 29 April 2024), 2005.
Sloyan, B. M., Wanninkhof, R., Kramp, M., Johnson, G. C., Talley, L. D., Tanhua, T., McDonagh, E., Cusack, C., O'Rourke, E., McGovern, E., Katsumata, K., Diggs, S., Hummon, J., Ishii, M., Azetsu-Scott, K., Boss, E., Ansorge, I., Perez, F. F., Mercier, H., Williams, M. J. M., Anderson, L., Lee, J. H., Murata, A., Kouketsu, S., Jeansson, E., Hoppema, M., and Campos, E.: The Global Ocean Ship-Based Hydrographic Investigations Program (GO-SHIP): A Platform for Integrated Multidisciplinary Ocean Science, Frontiers in Marine Science, 6, 445, https://doi.org/10.3389/fmars.2019.00445, 2019.
Steinfeldt, R., Rhein, M., Bullister, J. L., and Tanhua, T.: Inventory changes in anthropogenic carbon from 1997–2003 in the Atlantic Ocean between 20° S and 65° N, Global Biogeochem. Cy., 23, GB3010, https://doi.org/10.1029/2008GB003311, 2009.
Steinfeldt, R., Tanhua, T., Bullister, J. L., Key, R. M., Rhein, M., and Köhler, J.: Atlantic CFC data in CARINA, Earth Syst. Sci. Data, 2, 1–15, https://doi.org/10.5194/essd-2-1-2010, 2010.
Stöven, T., Tanhua, T., Hoppema, M., and Bullister, J. L.: Perspectives of transient tracer applications and limiting cases, Ocean Sci., 11, 699–718, https://doi.org/10.5194/os-11-699-2015, 2015.
Suzuki, T., Ishii, M., Aoyama, A., Christian, J. R., Enyo, K., Kawano, T., Key, R. M., Kosugi, N., Kozyr, A., Miller, L. A., Murata, A., Nakano, T., Ono, T., Saino, T., Sasaki, K., Sasano, D., Takatani, Y., Wakita, M., and Sabine, C.: The Pacific Ocean Interior Carbon (PACIFICA) Database (NCEI Accession 0110865), NOAA National Centers for Environmental Information [data set], https://doi.org/10.25921/n9nn-8324, 2013.
Swift, J.: Reference-quality water sample data: Notes on aquisition, record keeping, and evaluation, in: The GO-SHIP Repeat Hydrography Manual: A Collection of Expert Reports and Guidelines, edited by: Hood, E. M., Sabine, C., and Sloyan, B. M., IOCCP Report Number 14, ICPO Publication Series Number 134, 2010.
Swift, J. and Diggs, S. C.: Description of WHP exchange format for CTD/Hydrographic data, CLIVAR and Carbon Hydrographic Data Office, UCSD Scripps Institution of Oceanography, San Diego, CA, US, https://cchdo.github.io/hdo-assets/documentation/WHP_Exchange_Description.pdf (last access: 29 April 2024), 2008.
Takeshita, Y., Johnson, K. S., Coletti, L. J., Jannasch, H. W., Walz, P. M., and Warren, J. K.: Assessment of pH dependent errors in spectrophotometric pH measurements of seawater, Mar. Chem., 223, 103801, https://doi.org/10.1016/j.marchem.2020.103801, 2020.
Talley, L. D., Feely, R. A., Sloyan, B. M., Wanninkhof, R., Baringer, M. O., Bullister, J. L., Carlson, C. A., Doney, S. C., Fine, R. A., Firing, E., Gruber, N., Hansell, D. A., Ishii, M., Johnson, G. C., Katsumata, K., Key, R. M., Kramp, M., Langdon, C., Macdonald, A. M., Mathis, J. T., McDonagh, E. L., Mecking, S., Millero, F. J., Mordy, C. W., Nakano, T., Sabine, C. L., Smethie, W. M., Swift, J. H., Tanhua, T., Thurnherr, A. M., Warner, M. J., and Zhang, J. Z.: Changes in ocean heat, carbon content, and ventilation: A review of the first decade of GO-SHIP global repeat hydrography, Annu. Rev. Mar. Sci., 8, 185–215, https://doi.org/10.1146/annurev-marine-052915-100829, 2016.
Tanhua, T., van Heuven, S., Key, R. M., Velo, A., Olsen, A., and Schirnick, C.: Quality control procedures and methods of the CARINA database, Earth Syst. Sci. Data, 2, 35–49, https://doi.org/10.5194/essd-2-35-2010, 2010.
Tanhua, T., Lauvset, S. K., Lange, N., Olsen, A., Álvarez, M., Diggs, S., Bittig, H. C., Brown, P. J., Carter, B. R., da Cunha, L. C., Feely, R. A., Hoppema, M., Ishii, M., Jeansson, E., Kozyr, A., Murata, A., Pérez, F. F., Pfeil, B., Schirnick, C., Steinfeldt, R., Telszewski, M., Tilbrook, B., Velo, A., Wanninkhof, R., Burger, E., O'Brien, K., and Key, R. M.: A vision for FAIR ocean data products, Communications Earth & Environment, 2, 136, https://doi.org/10.1038/s43247-021-00209-4, 2021.
Velo, A., Cacabelos, J., Lange, N., Perez, F. F., and Tanhua, T.: Ocean Data QC: Software package for quality control of hydrographic sections (v1.4.0), Zenodo [code], https://doi.org/10.5281/zenodo.4532402, 2021.
Watson, A. J., Messias, M. J., Fogelqvist, E., Van Scoy, K. A., Johannessen, T., Oliver, K. I. C., Stevens, D. P., Rey, F., Tanhua, T., and Olsson, K. A.: Mixing and convection in the Greenland Sea from a tracer-release experiment, Nature, 401, 902–904, https://doi.org/10.1038/44807, 1999.
Weatherall, P., Marks, K. M., Jakobsson, M., Schmitt, T., Tani, S., Arndt, J. E., Rovere, M., Chayes, D., Ferrini, V., and Wigley, R.: A new digital bathymetric model of the world's oceans, Earth Space Sci., 2, 331–345, https://doi.org/10.1002/2015EA000107, 2015.
Wilkinson, M. D., Dumontier, M., Aalbersberg, I. J., Appleton, G., Axton, M., Baak, A., Blomberg, N., Boiten, J.-W., da Silva Santos, L. B., Bourne, P. E., Bouwman, J., Brookes, A. J., Clark, T., Crosas, M., Dillo, I., Dumon, O., Edmunds, S., Evelo, C. T., Finkers, R., Gonzalez-Beltran, A., Gray, A. J. G., Groth, P., Goble, C., Grethe, J. S., Heringa, J., 't Hoen, P. A. C., Hooft, R., Kuhn, T., Kok, R., Kok, J., Lusher, S. J., Martone, M. E., Mons, A., Packer, A. L., Persson, B., Rocca-Serra, P., Roos, M., van Schaik, R., Sansone, S.-A., Schultes, E., Sengstag, T., Slater, T., Strawn, G., Swertz, M. A., Thompson, M., van der Lei, J., van Mulligen, E., Velterop, J., Waagmeester, A., Wittenburg, P., Wolstencroft, K., Zhao, J., and Mons, B.: The FAIR Guiding Principles for scientific data management and stewardship, Scientific Data, 3, 160018, https://doi.org/10.1038/sdata.2016.18, 2016.
Yashayaev, I. and Loder, J. W.: Further intensification of deep convection in the Labrador Sea in 2017, Geophys. Res. Lett., 44, 1429–1438, https://doi.org/10.1002/2016GL071668, 2017.
- Abstract
- Introduction
- Key features of the update
- Methods
- Secondary quality control results and adjustments
- Data availability
- Summary
- Appendix A: Supplementary tables
- Note on former version
- Author contributions
- Competing interests
- Disclaimer
- Acknowledgements
- Financial support
- Review statement
- References
- Article
(1955 KB) - Full-text XML
- Abstract
- Introduction
- Key features of the update
- Methods
- Secondary quality control results and adjustments
- Data availability
- Summary
- Appendix A: Supplementary tables
- Note on former version
- Author contributions
- Competing interests
- Disclaimer
- Acknowledgements
- Financial support
- Review statement
- References