the Creative Commons Attribution 4.0 License.
the Creative Commons Attribution 4.0 License.
 | 15 Apr 2024
High temporal resolution records of the velocity of Hansbreen, a tidewater glacier in Svalbard
Małgorzata Błaszczyk
Bartłomiej Luks
Michał Pętlicki
Dariusz Puczko
Dariusz Ignatiuk
Michał Laska
Jacek Jania
Piotr Głowacki
Monitoring changes in glacial dynamics is essential for understanding the environmental response to accelerated climate warming in the Arctic. However, geodetic surveys in polar regions continue to present considerable challenges because of the harsh environmental conditions and the polar night. This study records a 14-year-long time series (2006–2019) of global navigation satellite system (GNSS) surveys of the positions of 16 ablation stakes distributed across Hansbreen, a tidewater glacier in southern Svalbard. The measurements were conducted with an exceptionally high temporal resolution, from about 1 week to about 1 month, and covering altitudes ranging from 20 to 490 m a.s.l. The position of one stake was surveyed every day. The primary data products consist of the stake coordinates and velocities. Time series of annual and seasonal velocities are also provided. This dataset may be a subject of further studies of glacier dynamics in relation to the long-term and seasonal impact of climate change on ice flow in the region. It also offers unique material for tuning numerical models of glacier dynamics and for validating satellite-derived products such as velocity and digital elevation models. The dataset described here has been made publicly available through the Zenodo repository: https://doi.org/10.5281/zenodo.8289380 (Błaszczyk et al., 2023).
- Article
(6269 KB) - Full-text XML
- BibTeX
- EndNote


The study of ice mass dynamics in light of climate changes is a major research topic (Benn and Evans, 1998; Lemke et al., 2007; Strozzi et al., 2017; Meredith et al., 2019; Van Wychen et al., 2016). For more than 2 decades, in situ measurements of glacier surface velocities with GNSS (global navigation satellite system; Vieli et al., 2000, 2004; Stober and Hepperle, 2007; Machío et al., 2017) have been among the most valuable sources of information for the study of glacier dynamics. The surface velocity is the sum of two components – ice deformation and basal slip (Nye, 1952; Weertman, 1957). The forces governing flow depend on several factors, such as ice temperature, the debris content of the ice, bed roughness, and water pressure (Benn and Evans, 1998). As there are still few data on flow rates at depth, the surface velocity, the easiest component of flow to measure (Cuffey and Paterson, 2010), is used for constructing numerical models of glaciers (Vieli et al., 2004; Rückamp et al., 2010; Otero et al., 2017; Vallot et al., 2017; Koziol and Arnold, 2018; Klein et al., 2020; Rosier and Gudmundsson, 2020).
Few sets of long-term in situ measurements of glacier velocities in polar regions are available, as geodetic measurements are time-consuming, logistically difficult to perform, and expensive (Stober and Hepperle, 2019). Nonetheless, they are especially important for acquiring knowledge and an understanding of the mechanism of mass circulation in the glacier system. They are also useful for determining the volume of ice lost by glaciers flowing into the sea as a result of frontal ablation (Kochtitzky et al., 2022). Svalbard glaciers where long-term velocity measurements have been studied are Kongsvegen (Voigt, 1965; Vivet and Lliboutry, 1978; Lefauconnier, 1987; Lefauconnier et al., 1994; Hagen et al., 2005), Kronebreen (Schellenberger et al., 2015; Vallot et al., 2017), and Nordenskiöldbreen (den Ouden et al., 2010; van Pelt et al., 2018). Other in situ velocity measurements of tidewater glaciers in Svalbard have usually been limited to just a few years, e.g. 5 years on Austfonna (Dunse et al., 2015), and 2 years on Holtedahlfonna (Bahr, 2015).
This study aims to present a dataset of in situ glacier surface velocities of Hansbreen (Svalbard), collected for the 14-year period 2006–2019, obtained from the mass balance stakes network surveyed using GNSS. This continuous measurement record presents velocity of an Arctic glacier with unique and exceptionally high temporal resolution, around 1 week for 5 stakes and around 1 month for 11 stakes. To our knowledge, Hansbreen was the first Svalbard tidewater glacier for which ice flow velocity was measured with dual-frequency GPS on a regular basis, resulting in exceptionally high measurement accuracy. The presented data also fill the gap in discontinuous satellite-derived glacier flow velocities before the beginning of the Sentinel-1 mission in 2014. Hansbreen is one of the few well-studied tidewater glaciers in Svalbard. The Polish Polar Station, Hornsund, located in the vicinity of the glacier, provides the logistics for permanent measurements. Hansbreen is also one of the key glaciers in the World Glacier Monitoring Service (WGMS, 2021; https://wgms.ch, last access: 30 June 2023), and its annual mass balance has been measured since 1989. Additionally, the surface velocity near the terminus of Hansbreen was measured by terrestrial photogrammetry from 1982 to 1991 (Jania and Kolondra, 1982; Vieli et al., 2000) and GNSS surveying (Vieli et al., 2004). Therefore, as a well-studied, polythermal, non-surging tidewater glacier of medium size, Hansbreen can be representative for the entire Svalbard Archipelago. The presented velocity dataset can serve as input data for numerical models of glacier dynamics and processes at glacier termini (see Otero et al., 2017; de Andrés et al., 2018). In situ measurements are invaluable for validating satellite-derived velocities obtained with methods like differential interferometric synthetic aperture radar (SAR) and SAR offset tracking (Schellenberger et al., 2015; Błaszczyk et al., 2019b; Solgaard et al., 2021). The height of the glacier can be used for validating numerous digital elevation models derived from different remote sensing techniques (Jawak and Luis, 2012; Berthier et al., 2014; Schröder et al., 2017; Błaszczyk et al., 2019a). As climate warming in Hornsund took place more than six times as fast as the global average in the period 1979–2018 (Wawrzyniak and Osuch, 2020), such long-term observations permit a better insight into glacier dynamics in a rapidly changing environment. Our understanding of the physics of glacier motion is still incomplete (Benn and Evans, 1998), especially regarding connection between ice flow and surface runoff. This study provides datasets that enable a detailed assessment of spatial and temporal changes in flow of a Svalbard tidewater glacier in the context of surface runoff, both in short-term and interannual timescales.
Hansbreen (77°05′ N, 15°37′ E) is a polythermal tidewater glacier terminating in the Hornsund fjord, southern Svalbard (Fig. 1). In 2015, the glacier covered an area of 51.3 km2 and had an active calving front that was 1.7 km wide (Błaszczyk et al., 2019b). The Hansbreen system was described in detail by Grabiec et al. (2012). It consists of a main glacier trunk and four major western tributary glaciers: Staszelisen, Deileggbreen, Tuvbreen, and Fuglebreen. The surface slope is 1.8° along the centreline of Hansbreen and up to 5.6° along the centrelines of the tributary glaciers. The ice divide between Hansbreen and Vrangpeisbreen is well defined and located at around 490 m a.s.l., the highest part of the main trunk. However, the boundary between Hansbreen and its eastern neighbour Paierlbreen is more difficult to define, owing to the transfluence of ice from the accumulation field to Kvitungisen, a tributary of Paierlbreen. The terminus retreat has been studied by Błaszczyk et al. (2013, 2021). The terminus of Hansbreen has been retreating since 1899, although there have been sporadic episodes of advance. From 1991 to 2015, the front retreated 917 m.
Hansbreen is the westernmost glacier in Hornsund, the southernmost fjord of Svalbard Archipelago. The hydrographic conditions along the west coast of Spitsbergen are defined by the cold water of the Spitsbergen Current and warmer water of the West Spitsbergen Current (Promińska et al., 2018). According to Nilsen et al. (2016), in recent years warm water from the West Spitsbergen Current flows more often into the western fjords, even in winter. Further, the glaciers of southern and central Spitsbergen have the most negative climate mass balance on Svalbard (Schmidt et al., 2023; van Pelt et al., 2019), and models predict the greatest glacier mass loss in the southern part of the archipelago also in the 2019–2060 period (van Pelt et al., 2021). Furthermore, global mass balance models (excluding the Greenland and Antarctic ice sheets) point to Svalbard as the region with the greatest negative mass balance by the end of the 21st century (Huss and Hock, 2015). In light of these studies, understanding a response of Hansbreen dynamics to climate warming is important for predicting glacial dynamic processes in the rest of the archipelago, as well as for other Arctic areas.
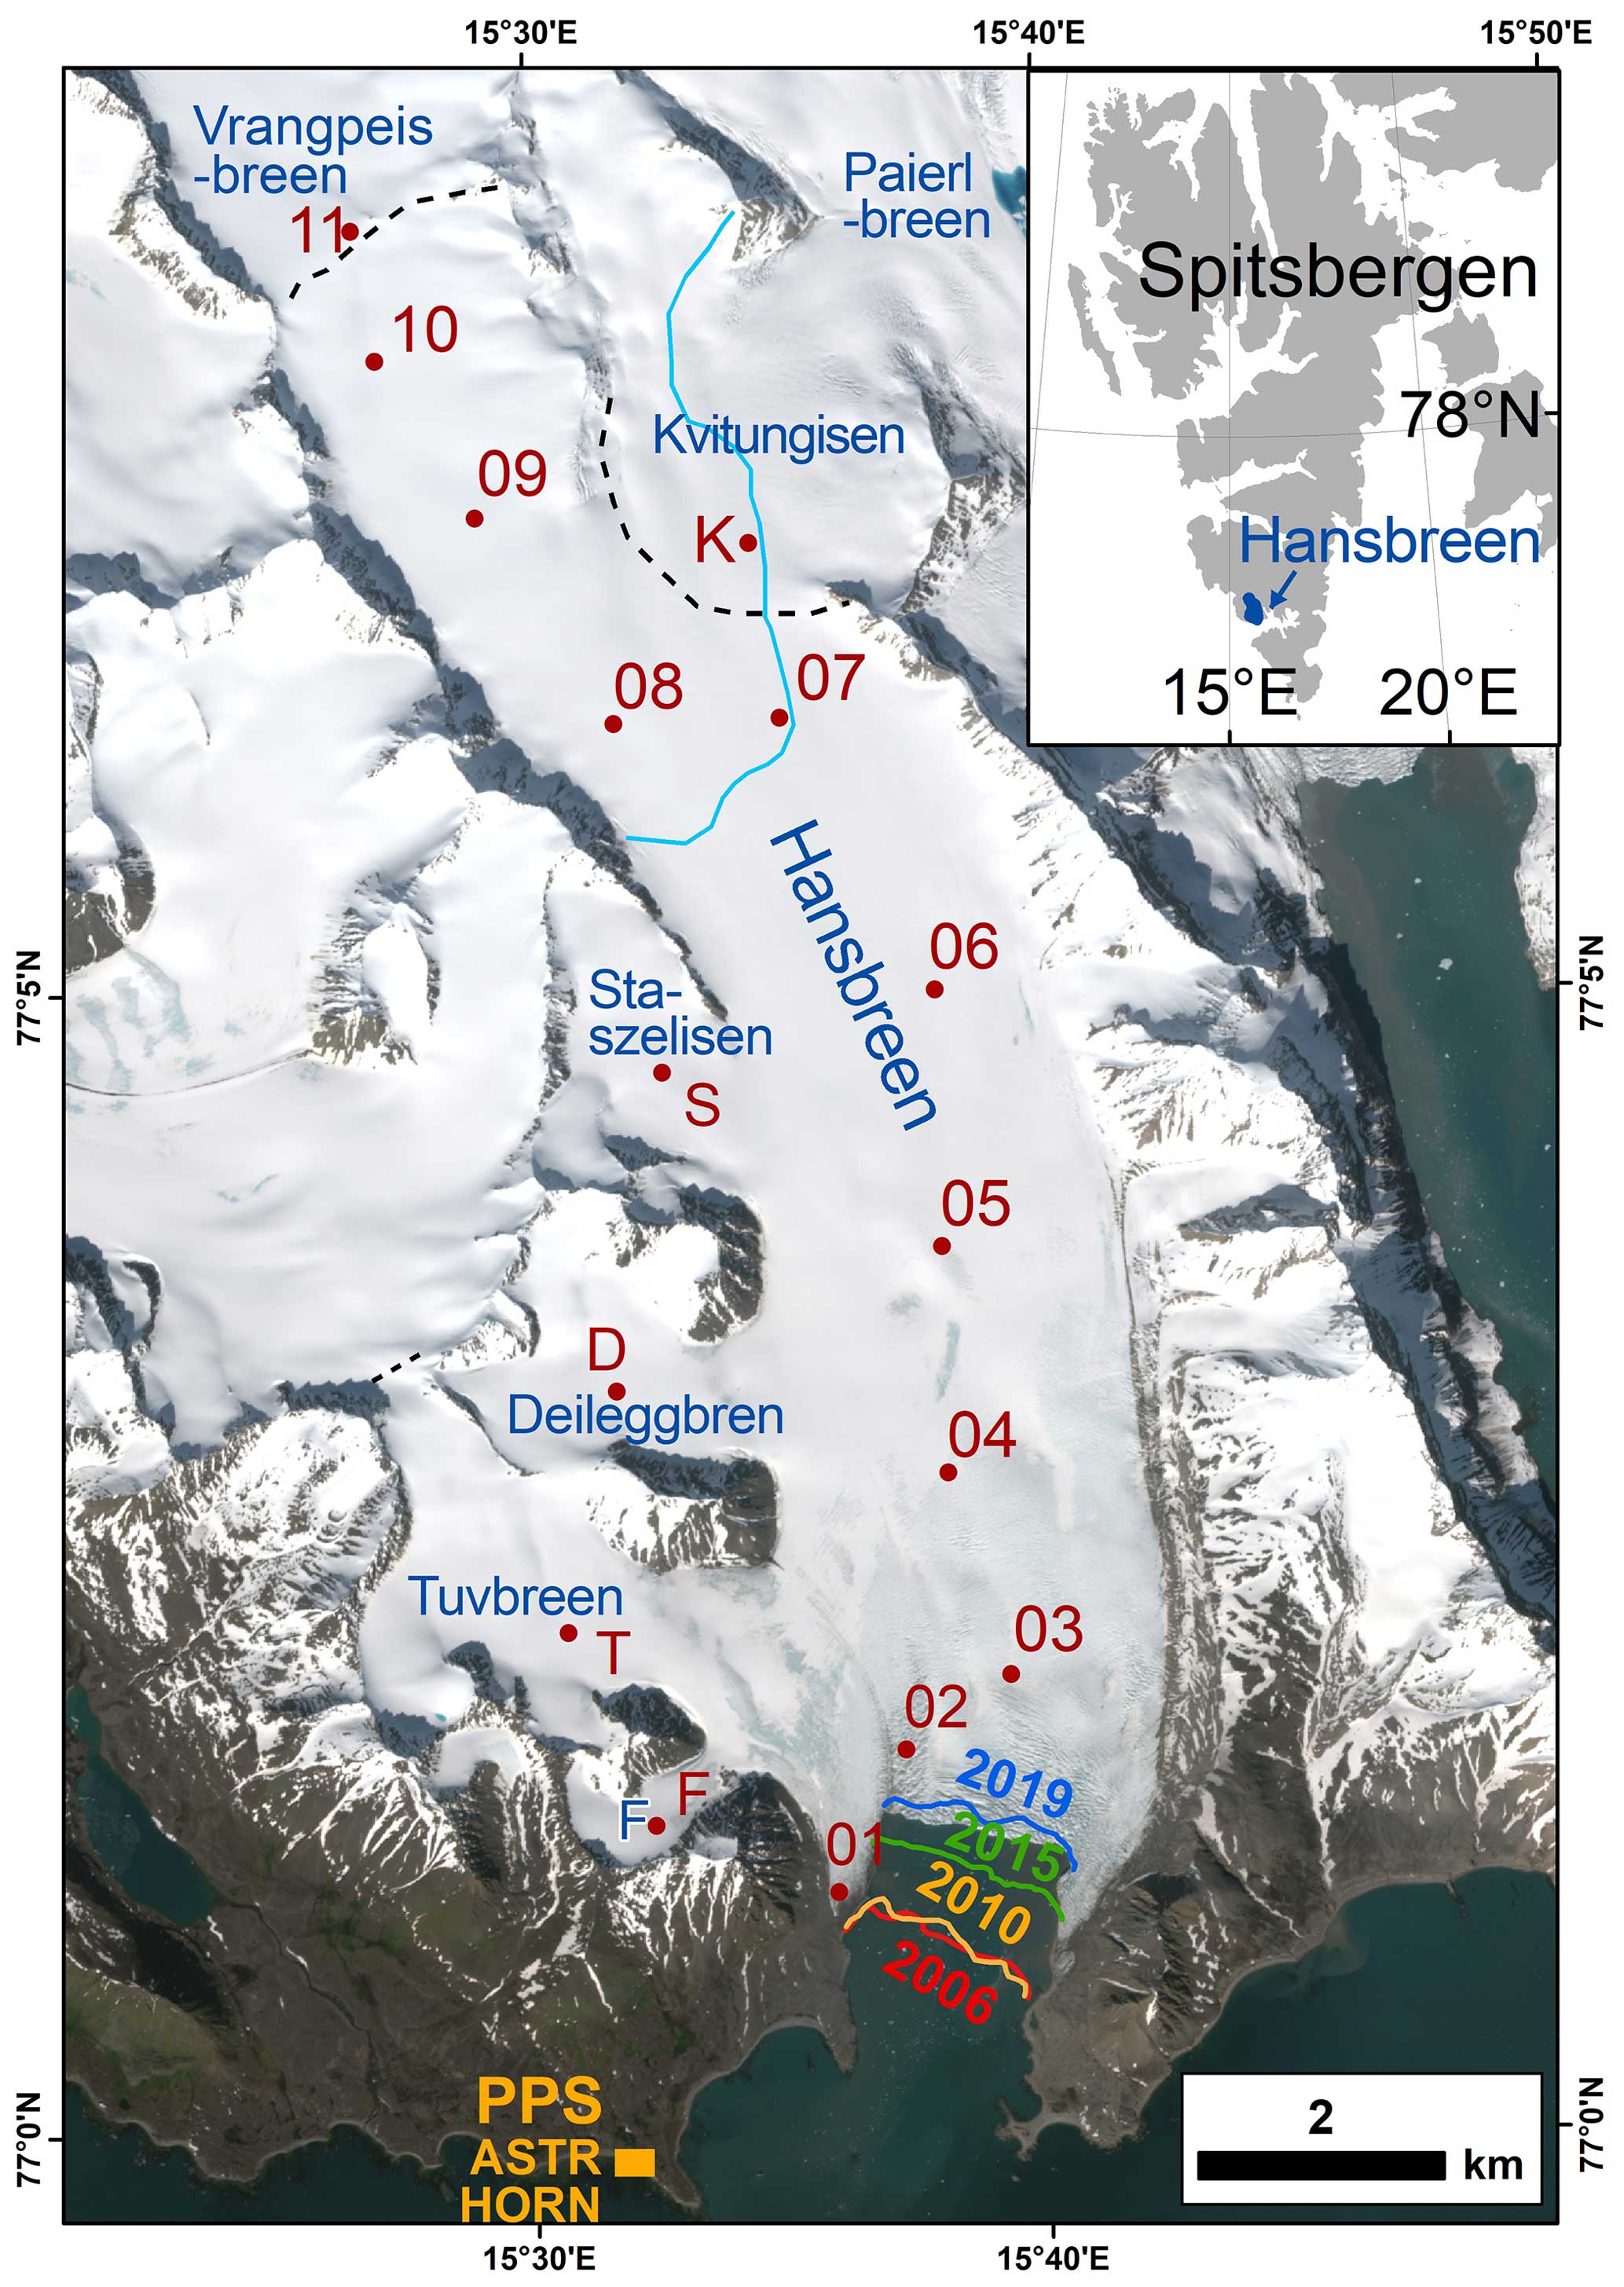
Figure 1Location of Hansbreen. Red dots show positions of the stakes. PPS denotes the location of the Polish Polar Station. ASTR and HORN stand for GPS reference stations, F stands for Fuglebreen. Dashed black lines indicate ice divides separating Hansbreen from other ice masses. Blue line represents the average equilibrium-line altitude of Hansbreen in 2014 (after Laska et al., 2017). Terminus extent in 2006, 2010, 2015, and 2019 is determined from Błaszczyk et al. (2021). Background: Sentinel 2 (6 July 2018).
3.1 Stake network
The datasets of ice surface velocities were derived from repeated GNSS measurements of 16 aluminium stakes deployed on Hansbreen and its tributary and neighbouring glaciers (Fig. 1). The stakes were embedded up to 8 m deep in the glacier with a steam drill or Kovacs ice drill. The positioning of the stakes was selected to cover the entire elevation range of the glacier. Stakes 01–10 represent the velocity along the main trunk of Hansbreen, whereas the labelling of stakes F, T, D, and S is based on the names of the tributary glaciers, i.e. Fuglebreen, Tuvbreen, Deileggbreen, and Staszelisen, respectively. The positions of stake 11 on the glacier divide and stake K on Kvitungisen lie beyond the current border of Hansbreen. However, we have included the data pertaining to them, as they may be crucial for better constraining numerical models of glacier dynamics or studies of ice elevation changes. The positions of the stakes were measured from summer 2006 to summer/autumn 2019.
The speed of several grounded calving glaciers tends to increase as ice thins towards the terminus (Benn and Evans, 1998). This process has been observed on several Svalbard glaciers, e.g. Hansbreen (Vieli et al., 2000), Nordenskiöldbreen (van Pelt et al., 2018), and Kronebreen (Schellenberger et al., 2015; Vallot et al., 2017). Due to difficult polar conditions, the frequency of measurements of individual stakes varied depending on the distance from the glacier front. The stakes were surveyed in three different time intervals:
-
Stakes 01, 02, 03, and 05 were normally surveyed at 7–10 d intervals, although these intervals were sometimes longer or shorter, as the measurements depended on the weather conditions. All these stakes were located in the ablation zone. Weekly intervals allowed us to highlight detailed variation in the glacier velocity. The stakes 01 and 02 were installed outside the main flow line of the glacier, due to the high crevassing of the frontal part.
-
Stake 04 was measured once a day in order to acquire a fuller picture of the glacier's dynamics. Seasonal changes in velocities at this point are representative of the glacier's ablation zone (3.7 km from the front of the glacier in 2006, at an altitude of 192 m a.s.l.), and daily intervals allowed us to highlight very short variations in glacier velocity, e.g. speed events.
-
Stakes 06–11, F, T, D, S, and K were surveyed roughly once a month, generally at 25–30 d intervals, although these intervals could have been longer or shorter. For these stakes, monthly velocity significantly exceeded the estimated errors (see Sect. 3.3, “Data and accuracy”), which allowed for seasonal insight into the glacier flow.
Hansbreen is a glacier with a negative climatic mass balance (−0.35 m a−1) for the studied period of 2006–2019 (WGMS – https://wgms.ch/, last access: 30 June 2023). The thinning rate estimated from differentiation of digital elevation models for the period 2011–2017 was around 1 m a−1 in the upper parts the glacier and up to 10 m a−1 at the glacier front (Błaszczyk et al., 2019a). Because of the lowering of the glacier surface caused by negative mass balance and the advection of the stakes towards the terminus, some stakes needed to be reinstalled. In such cases, the position of the stake was shifted tens to hundreds of metres. This shift was especially common for stakes 02 and 03, which were deployed in a heavily crevassed frontal area. Moreover, some stakes were lost (broken by the wind or polar bears or buried under heavy snowfall) and had to be replaced. Every change in the position of the stake is marked according to nomenclature described below. We differentiate each change in a stake's position using additional designations as follows:
-
A, B, C – the consecutive positions of a reinstalled stake that was significantly shifted with respect to the glacier elevation and/or its position relative to the centreline;
-
1, 2, 3 – the consecutive positions of a reinstalled stake where the shift was small in comparison with the size of the glacier and the centreline (from decimetres to 290 m).
3.2 GNSS processing
Up to and including 2016, dual-frequency (L1/L2) GNSS receivers (Leica GX1230) were used to measure the positions of the stakes in static mode. After 2016, a Leica GS14 with both GPS and GLONASS (GLObalnaya NAvigatsionnaya Sputnikovaya Sistema) constellations was used for the measurements. During the measurements, the antenna of the GNSS instrument was placed on the top of the stake. Static GNSS surveys (15–30 min, but mostly 30 min with only a small portion being shorter) were further post-processed in Leica GeoOffice software. The two reference points used in the post-processing were the ASTR (July 2006 to August 2009) and HORN (September 2009 to September 2019) permanent GNSS stations in the vicinity of the Polish Polar Station, Hornsund (Fig. 1; Węzka et al., 2010; Rajner, 2018). The baseline distance from the reference station to the stakes on the glacier ranged between 2.4 and 15.5 km. The coordinates in the WGS84 system were reprojected to UTM zone 33X. The ellipsoidal heights of the antenna were converted to geoidal heights using the EGM96 geoid and reduced to the glacier surface using field measurements of the stake height. When the tip of the stake had frozen so that the antenna could not be placed on top, the antenna was placed at the side of the stake, and the offset was measured and compensated for by the observer in a pre-processing procedure. In the final step, artefacts were identified manually and removed from the dataset.
One GNSS receiver (Leica GX1230) was permanently deployed on stake 04, working in wake-up mode. This GNSS instrument was continuously battery-powered and recorded data during most of the study period with some gaps of several days (128 data gaps of 4 d or longer) due to a lack of power or poor positional accuracy after post-processing. Stake 04 was located in the main flow line of the glacier and outside the highly crevassed zone, which allowed for a safe maintenance and replacement of the battery, ensuring a continuous measurements of the stake position. The position of stake 04 was surveyed daily for 30 min at midnight (00:00 UTC), although in 2010, 2017, and 2018 these measurements were also made at 22:00, 23:00, or 01:00 UTC. As mentioned above, daily measurements enabled observation of very short changes in glacier velocity.
3.3 Data and accuracy
The accuracy of the geodetically determined position of a stake is influenced by the accuracy of the static DGPS (Differential Global Positioning System) measurement (horizontal component 0.02–0.03 m; Stober and Hepperle, 2007; Bahr, 2015) and the accuracy of the survey. The survey accuracy includes slight changes in the method of measuring a given stake, related to the frozen tip of the stake, as described above. Contrary to Rückamp et al. (2010) or Machío et al. (2017), we made no correction for the tilt of the stakes. Our measurements were much more frequent; therefore, tilt of the stake could be neglected. Following Stocker-Waldhuber et al. (2019) and Anderson et al. (2018), we used the measurement accuracy of a stake's position ex=0.12 m. The error ex of stake 04 was assumed to be 0.03 m, as the antenna was not removed between measurements.
The displacement error, Δx, was estimated as
where and are the positioning errors of two stake positions.
The relative error of the measured short-term ice surface velocity was estimated using the method of Rückamp et al. (2010) to be the sum of the relative error of the displacement and time:
where is the relative error of the velocity V, Δx is the error of the displacement, x is the calculated displacement of the aluminium stake, Δt is the precision of the time observation, and t is the time between stake measurements. The time accuracy is 6 h, as the observer did not always measure the stakes in the same order. In the case of stake 04, the time is accurate to the nearest second, so is negligible here.
In addition to the horizontal velocity, we estimated the geoidal heights of the glacier surface at the position of each stake. The accuracy of the vertical component of static DGPS measurements is 0.03 m (Stober and Hepperle, 2007). However, there may be additional errors in the height reduction from the top of the stake, where the antenna was mounted, to the snow or ice horizon. As the ice horizon is difficult to define during the ablation season, we assessed the height accuracy to 0.1 m.
Apart from estimated horizontal velocities of the stakes between GNSS measurements, we provide annual and seasonal ice velocity records. These records are based on the hydrological year, here defined as the period from 1 October to 30 September the following year (Cogley et al., 2011), with summer identified as the period from 1 June to 30 September and winter from 1 October to 31 May.
4.1 Horizontal velocities
Figure 2 shows the locations of each stake and the field observations. The time series of the horizontal velocity calculated for each stake, together with the estimated accuracy of measurements, are given in Fig. 3. The measurements of the stakes started between 3 July and 2 August 2006. The continuous measurements of the stake positions ended at different times between June and October 2019. Stakes 02 and 03 were surveyed only until November 2018, as they were approaching the terminus of the glacier, and the ice surface was too heavily crevassed for measurements to be conducted safely. There are some gaps in the datasets because a stake was lost or inaccessible or the accuracy of the GNSS measurement was poor. Therefore, some velocities were estimated for periods longer than described above (i.e. longer than daily, weekly, or monthly). The longest data gaps were 330 d for stake 02 and 304 d for stake 11. Although the longer observation period assures higher accuracy of measurements (see Eq. 2), it can cause some short speed changes to remain unnoticed in the observation.
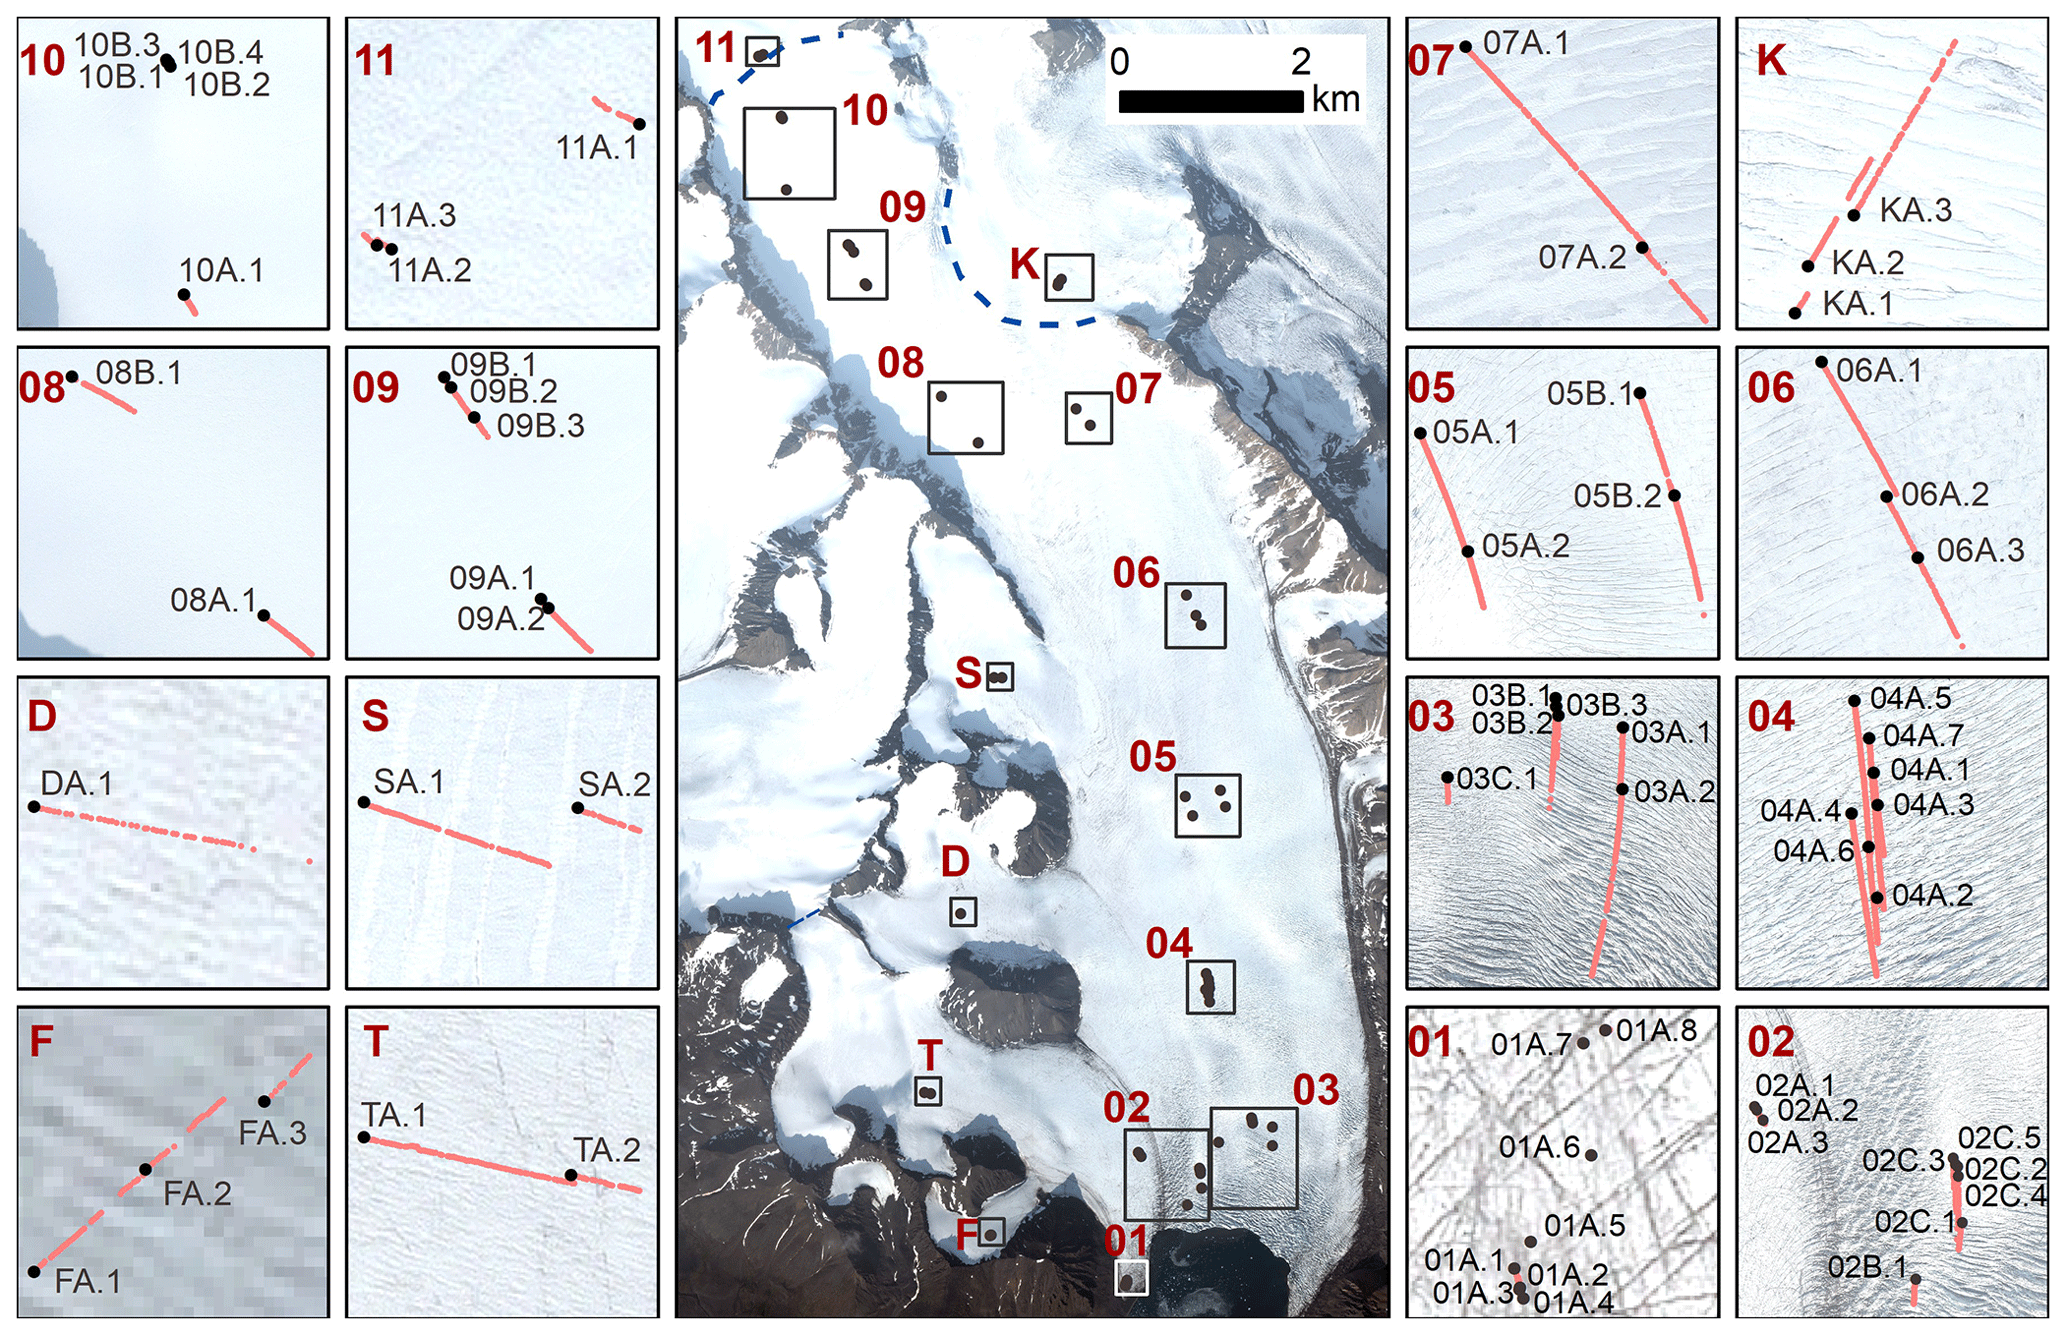
Figure 2Location of all surveyed stakes. Black dots represent the first position of each new dataset and light red dots show all measurements. Dashed navy blue lines indicate ice divides separating Hansbreen from other ice masses. Background: Pléiades (20 August 2017; Błaszczyk et al., 2019a).
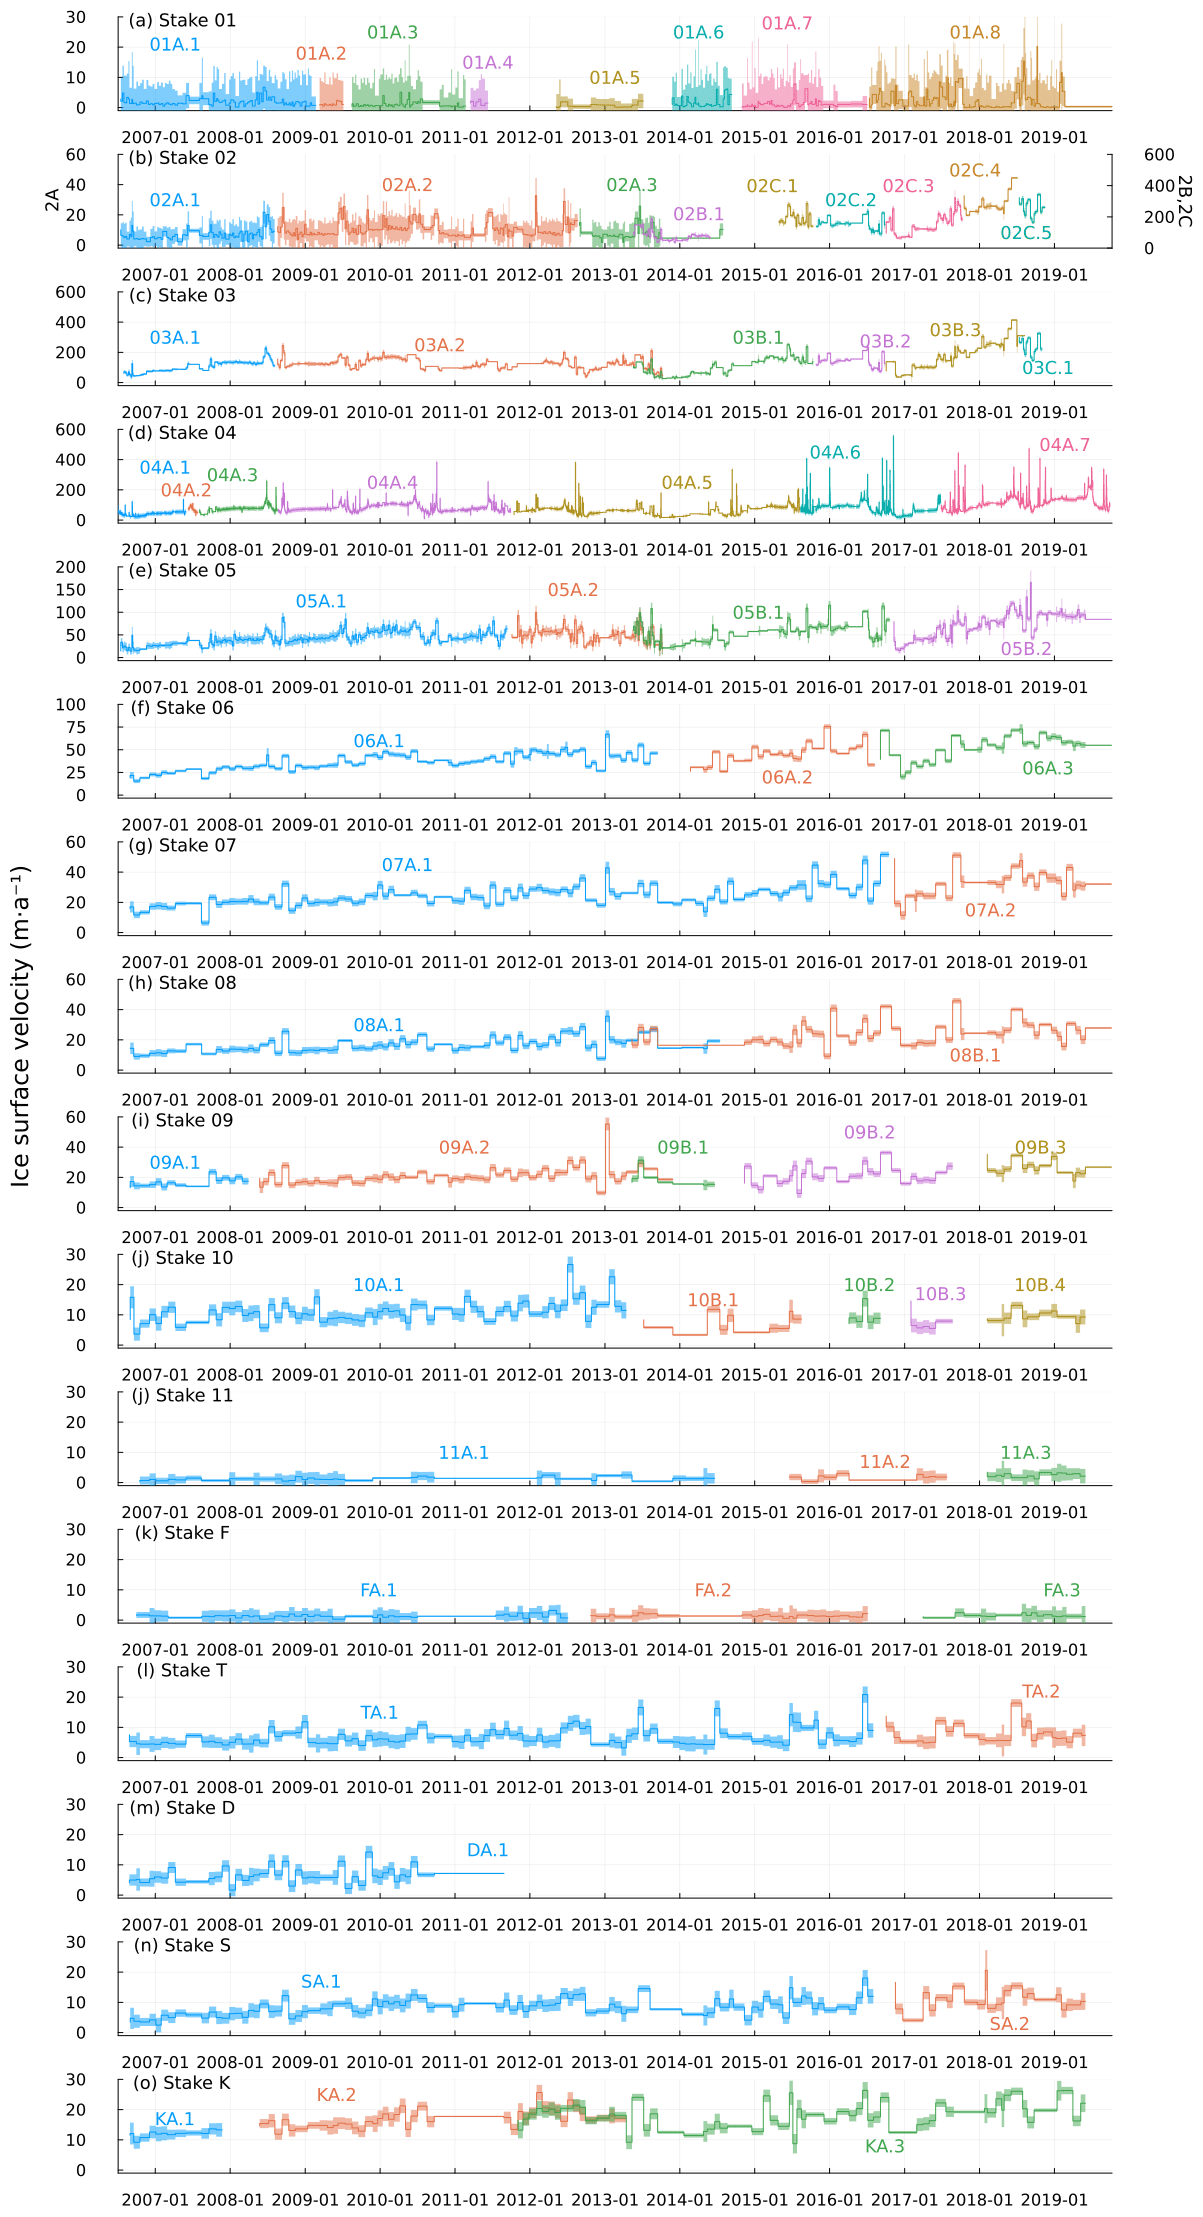
Figure 3Time series of horizontal velocities for all stakes from 2006 to 2019. Shaded areas indicate accuracy ranges. Note different y axis for stake 02.
The median values of velocities estimated from all the observations on each stake are listed in Fig. 4. Stake 01 was situated near the glacier terminus, on stagnant ice, i.e. part of a glacier that does not flow at a detectable rate (Cogley et al., 2011). This stake moved very slowly towards the front until 2013 (stakes 01A.1–01A.5). Since the end of 2013, this stake has been almost stationary, strongly influenced by the retreating ice front. Surveys repeated every few days yielded distances between consecutive measurements of the order of 1 cm to a few centimetres, which is well below the accuracy of the measurements (Fig. 3). Owing to the small displacements and the short times between the measurements, the relative velocity error at stake 01 could have been as high as ±2600 %. Similarly, the velocities of stakes 02A (up to 2013), 11, and F are lower than the accuracy of surveys. The relative velocity error for these stakes was as high as 200 %, and those stakes were mostly surveyed every few days. Therefore, we wish to stress that these data should be used with a monthly or annual temporal resolution.
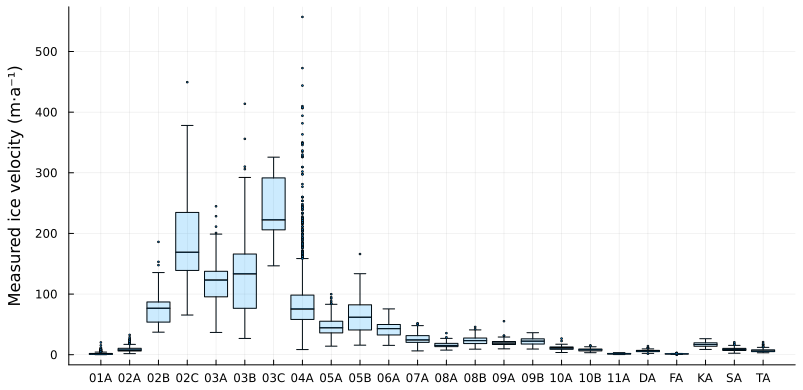
Figure 4A box-and-whisker plot of measured ice velocities at Hansbreen in 2006–2019: a horizontal line is the median ice velocity, box edges represent the first and third quartiles, the whiskers correspond to minimum and maximum velocity excluding outliers, and the outliers are presented as dots.
The highest velocity was recorded for stakes 02C, 03A, 03B, and 03C (Fig. 4). The variability of the velocity was also the highest at these stakes. Their positions changed significantly a few times after reinstallation. Additionally, the terminus of Hansbreen retreated by ca. 1 km during the study period. Hence we stress here that, especially in the case of those stakes close to the front, caution is advised when drawing long-term conclusions, which should be analysed in relation to increasing surface flow velocities towards the calving front (Pillewizer, 1939; Krimmel, 1992; Vieli et al., 2000).
The velocities of stake 04 represent a unique dataset with a very high temporal resolution (Fig. 3d). The time series capture several short speed-up events, representing a considerable increase in glacier velocity (Kamb et al., 1994; Meier et al., 1994; Vieli et al., 2004). Such speed-up events were apparent not only at stake 04 measured every 24 h, but also at the other stakes measured every few days (stakes 02, 03, and 05) and even at monthly intervals when the acceleration was higher than the accuracy of the measurements (stakes 06 to 09). However, there are some gaps in the dataset due to the poor accuracy of GNSS measurements, the lack of power, or instrument failure. Continuous monitoring of stake 04 started on 3 July 2006 and ended on 29 September 2019. There are no observations for a total of 1256 d, i.e. 26 % of the entire period. In the majority of cases, the data gaps are no longer than 1 d to a few days. There are 50 data gaps of 6 d or longer, mainly in 2013 and 2014. The longest interruptions in the data measurements were 38 d in October–November 2013 and 48 d in March–April 2014. Owing to terminus retreat and glacier movement, the distance of stake 04 from the front decreased from ca. 3.7 km in 2006 to ca. 2.7 km in 2019. Hence, as in the case of stakes 02 and 03, long-term conclusions should be analysed in the light of the increase of surface flow velocities towards the calving front.
4.2 Accuracy assessment at stake 01
Stake 01 was deployed on stagnant ice (Cogley et al., 2011) that had terminated on the land and remained almost motionless since the end of 2013; hence, velocity measurements provide an excellent source for assessing the accuracy of measurements of stake positions (Fig. 5). Stake 01A.6 moved very slowly to the east, shifting 0.23 m between November 2013 and September 2014. Stake 01A.7 moved northwards, in the opposite direction to that of the glacier, shifting 0.46 m between October 2014 and July 2016. It is difficult to separate the slow movement of a stake from its tilting over a longer period or from the influence of the direct vicinity of the steep front of the glacier, and therefore from the influence of tensions due to intensive surface melting, dry calving (Cogley et al., 2011), and surface cracking. The distribution of measurements of stakes 01A.6 and 01A.7 (Fig. 5) shows that the distances between consecutive measurements, usually carried out every few days, were within the measurement error assessed in this paper. This confirms the accuracy of the positional measurements used here (0.12 m). The accuracy includes the accuracy of the GNSS measurements (0.02–0.03 m; Stober and Hepperle, 2007; Bahr, 2015) together with all the other uncertainties related to the antenna offset compensation and stake tilting over a short time period. The data for stake 01A.8 cannot be used for such a quality assessment, as the glacier front melted and retreated considerably from 2016 to 2019, so the distance from the stake to the front decreased from about 200 to 100 m, and the exceptionally high velocity (Fig. 3a) was due to the noise caused by surface melt, opening of crevasses, and dry calving of the glacier (Cogley et al., 2011).
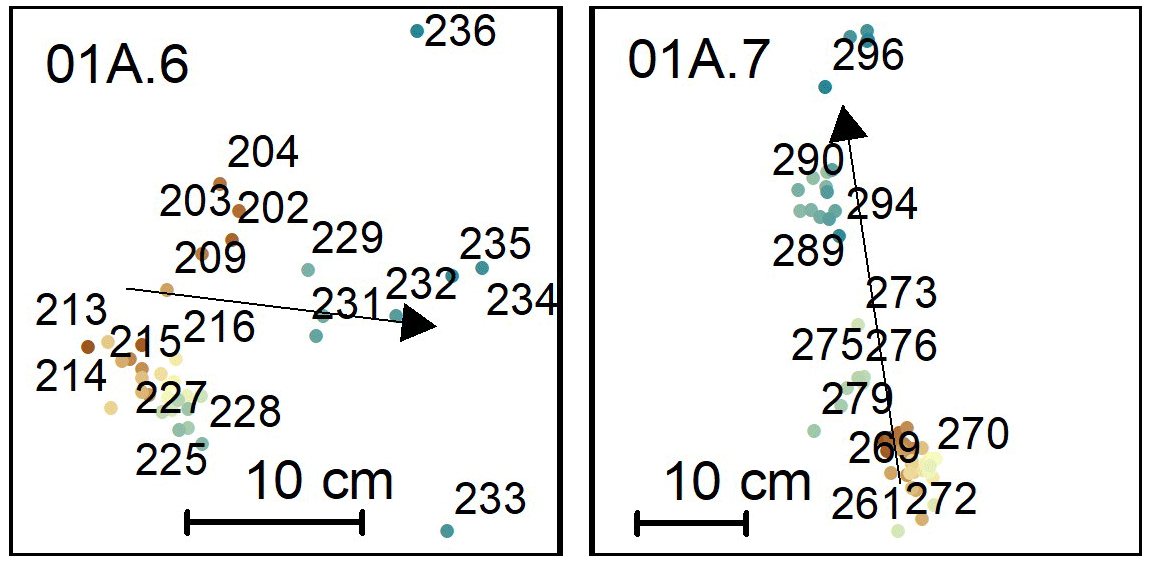
Figure 5Position changes of stakes 01A.6 and 01A.7. The numbers and colours (from red to dark green) indicate subsequent measurements.
4.3 Annual and seasonal velocities
In order to encourage the wider use of the data presented in this paper, we also give the annual (hydrological year) and seasonal velocities derived from continuous measurements. These velocities were estimated as the weighted average of all measurements, with the weights being proportional to the duration of the measurement interval. The most common problems experienced were discontinuities in the stake position surveys, due to instrument failure or logistical problems with reaching the stake (e.g. safety reasons related to crevasses, insufficient light during the polar night, or harsh weather conditions). We therefore estimated the annual and seasonal velocities only for periods with continuous datasets. The timing of a season was established according to calendar dates, whereas conducting field measurements was limited by the weather and snow conditions. Therefore, if the beginning/end of the year or if the season fell in between two field measurements, the velocity was calculated as weighted in proportion to the length of the period falling within a particular season.
Data series prepared in this way can be used to assess the spatiotemporal pattern of the Hansbreen flow. The spatial pattern of the Hansbreen velocity and the increase in velocity towards the calving front has been the subject of previous studies (Pillewizer, 1939; Jania, 1988; Vieli et al., 2004). Here, to exemplify the dataset, we show the mean annual horizontal velocities for all the stakes in the hydrological year 2006–2007 (Fig. 6). The velocity increases from the upper parts of Hansbreen (stakes 09A and 10A) towards the terminus. The highest annual velocity (in 2006/2007) was recorded at stakes 03A and 04A, i.e. those nearest to the front. The stakes deployed on the tributary glaciers revealed very slow movement, typically of the order of just a few metres per year. A similar velocity was calculated for stake 11, which flows in the opposite direction, away from the main tongue of Hansbreen, i.e. towards Vrangpeisbreen. The ice at stake K flows towards Kvitungisen into the neighbouring Paierlbreen glacier system. Although stakes 11 and K are located outside the Hansbreen basin, they can help in a broader understanding of changes in glacier dynamics and the surface height at the catchment divide, particularly the possible ice flow piracy (McCormack et al., 2023) between Hansbreen and Paierlbreen.
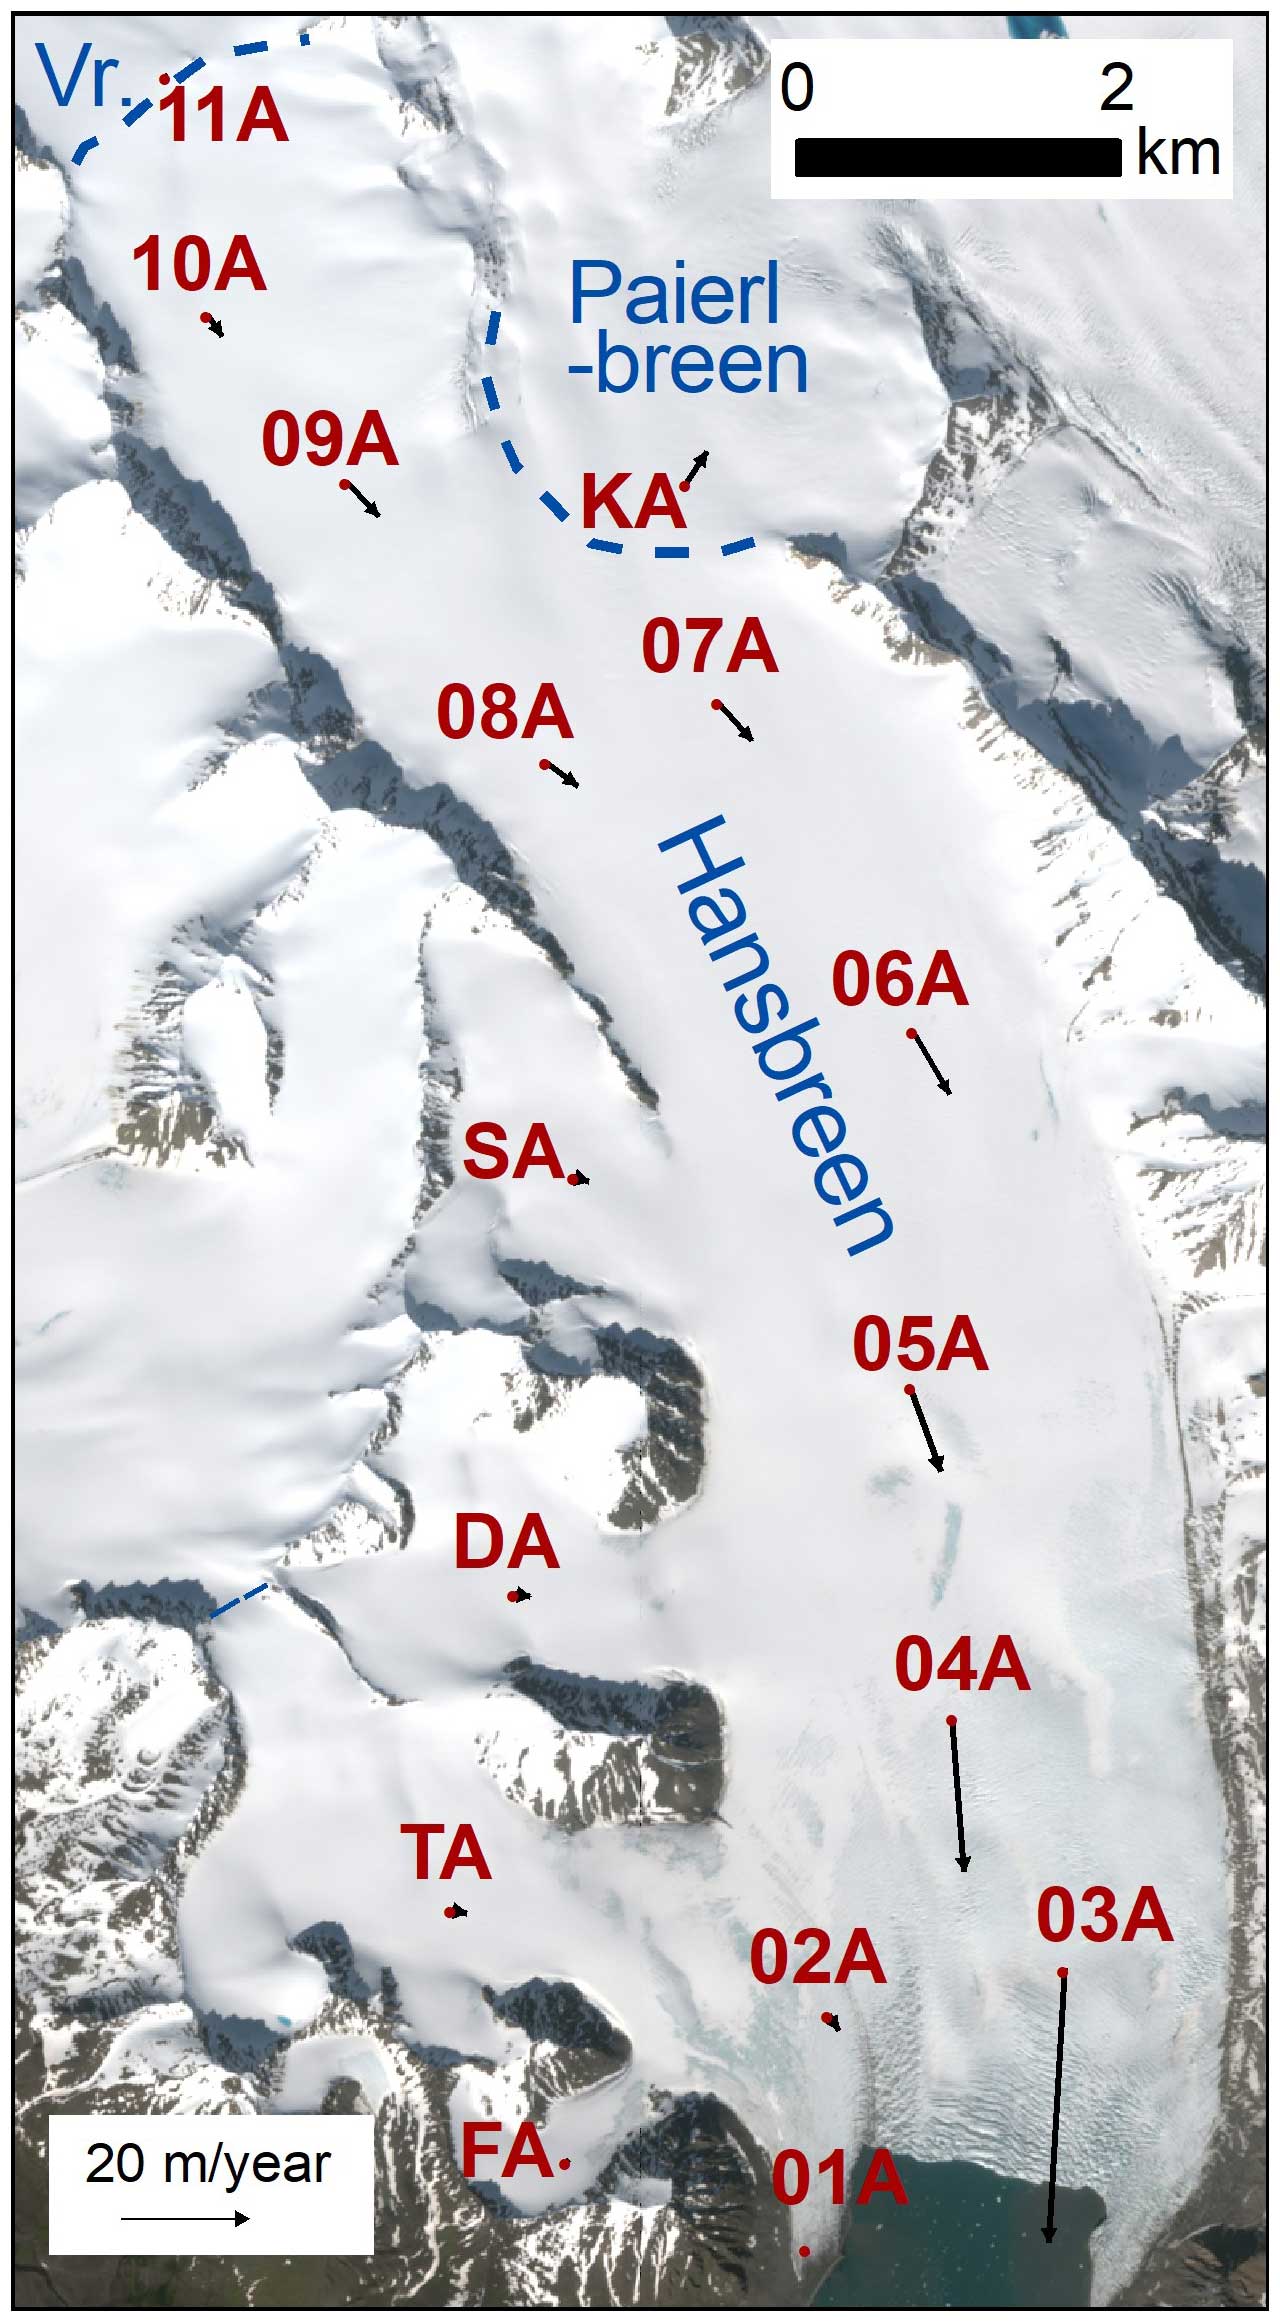
Figure 6Mean annual horizontal velocities for the hydrological year 2006–2007, as an example of the spatial pattern of Hansbreen velocity. The stakes 11 and K flow into other ice masses. Vr. stands for Vrangpeisbreen. Background: Sentinel 2 (6 July 2018).
The data show a homogeneous pattern of annual and seasonal increases and decreases in velocities recorded at all the stakes, although the maximum and minimum velocities at particular stakes were noted in different years (Fig. 7). For example, the largest annual velocity was recorded in 2009 and 2017–2018 (stakes 04–08) and in 2011 and 2017 (stakes 10, K, SA, TA – no data for 2018). The lowest annual velocities were noted in 2006/2007 and 2013/2014 at stakes 04 and 05. The lowest velocities at stakes farther up the glacier were in 2006/2007–2008/2009 and 2013/2014. The highest summer velocities were generally recorded in the 2013/2014 and 2017/2018–2018/2019. A positive trend in velocities at both the annual and seasonal scales (Fig. 7) can be inferred for stakes that did not shift significantly during the measurement period (see Fig. 2). There was a similar positive trend in velocities at stake K, which is beyond the current border of Hansbreen where the ice flows into the Paierlbreen glacier.
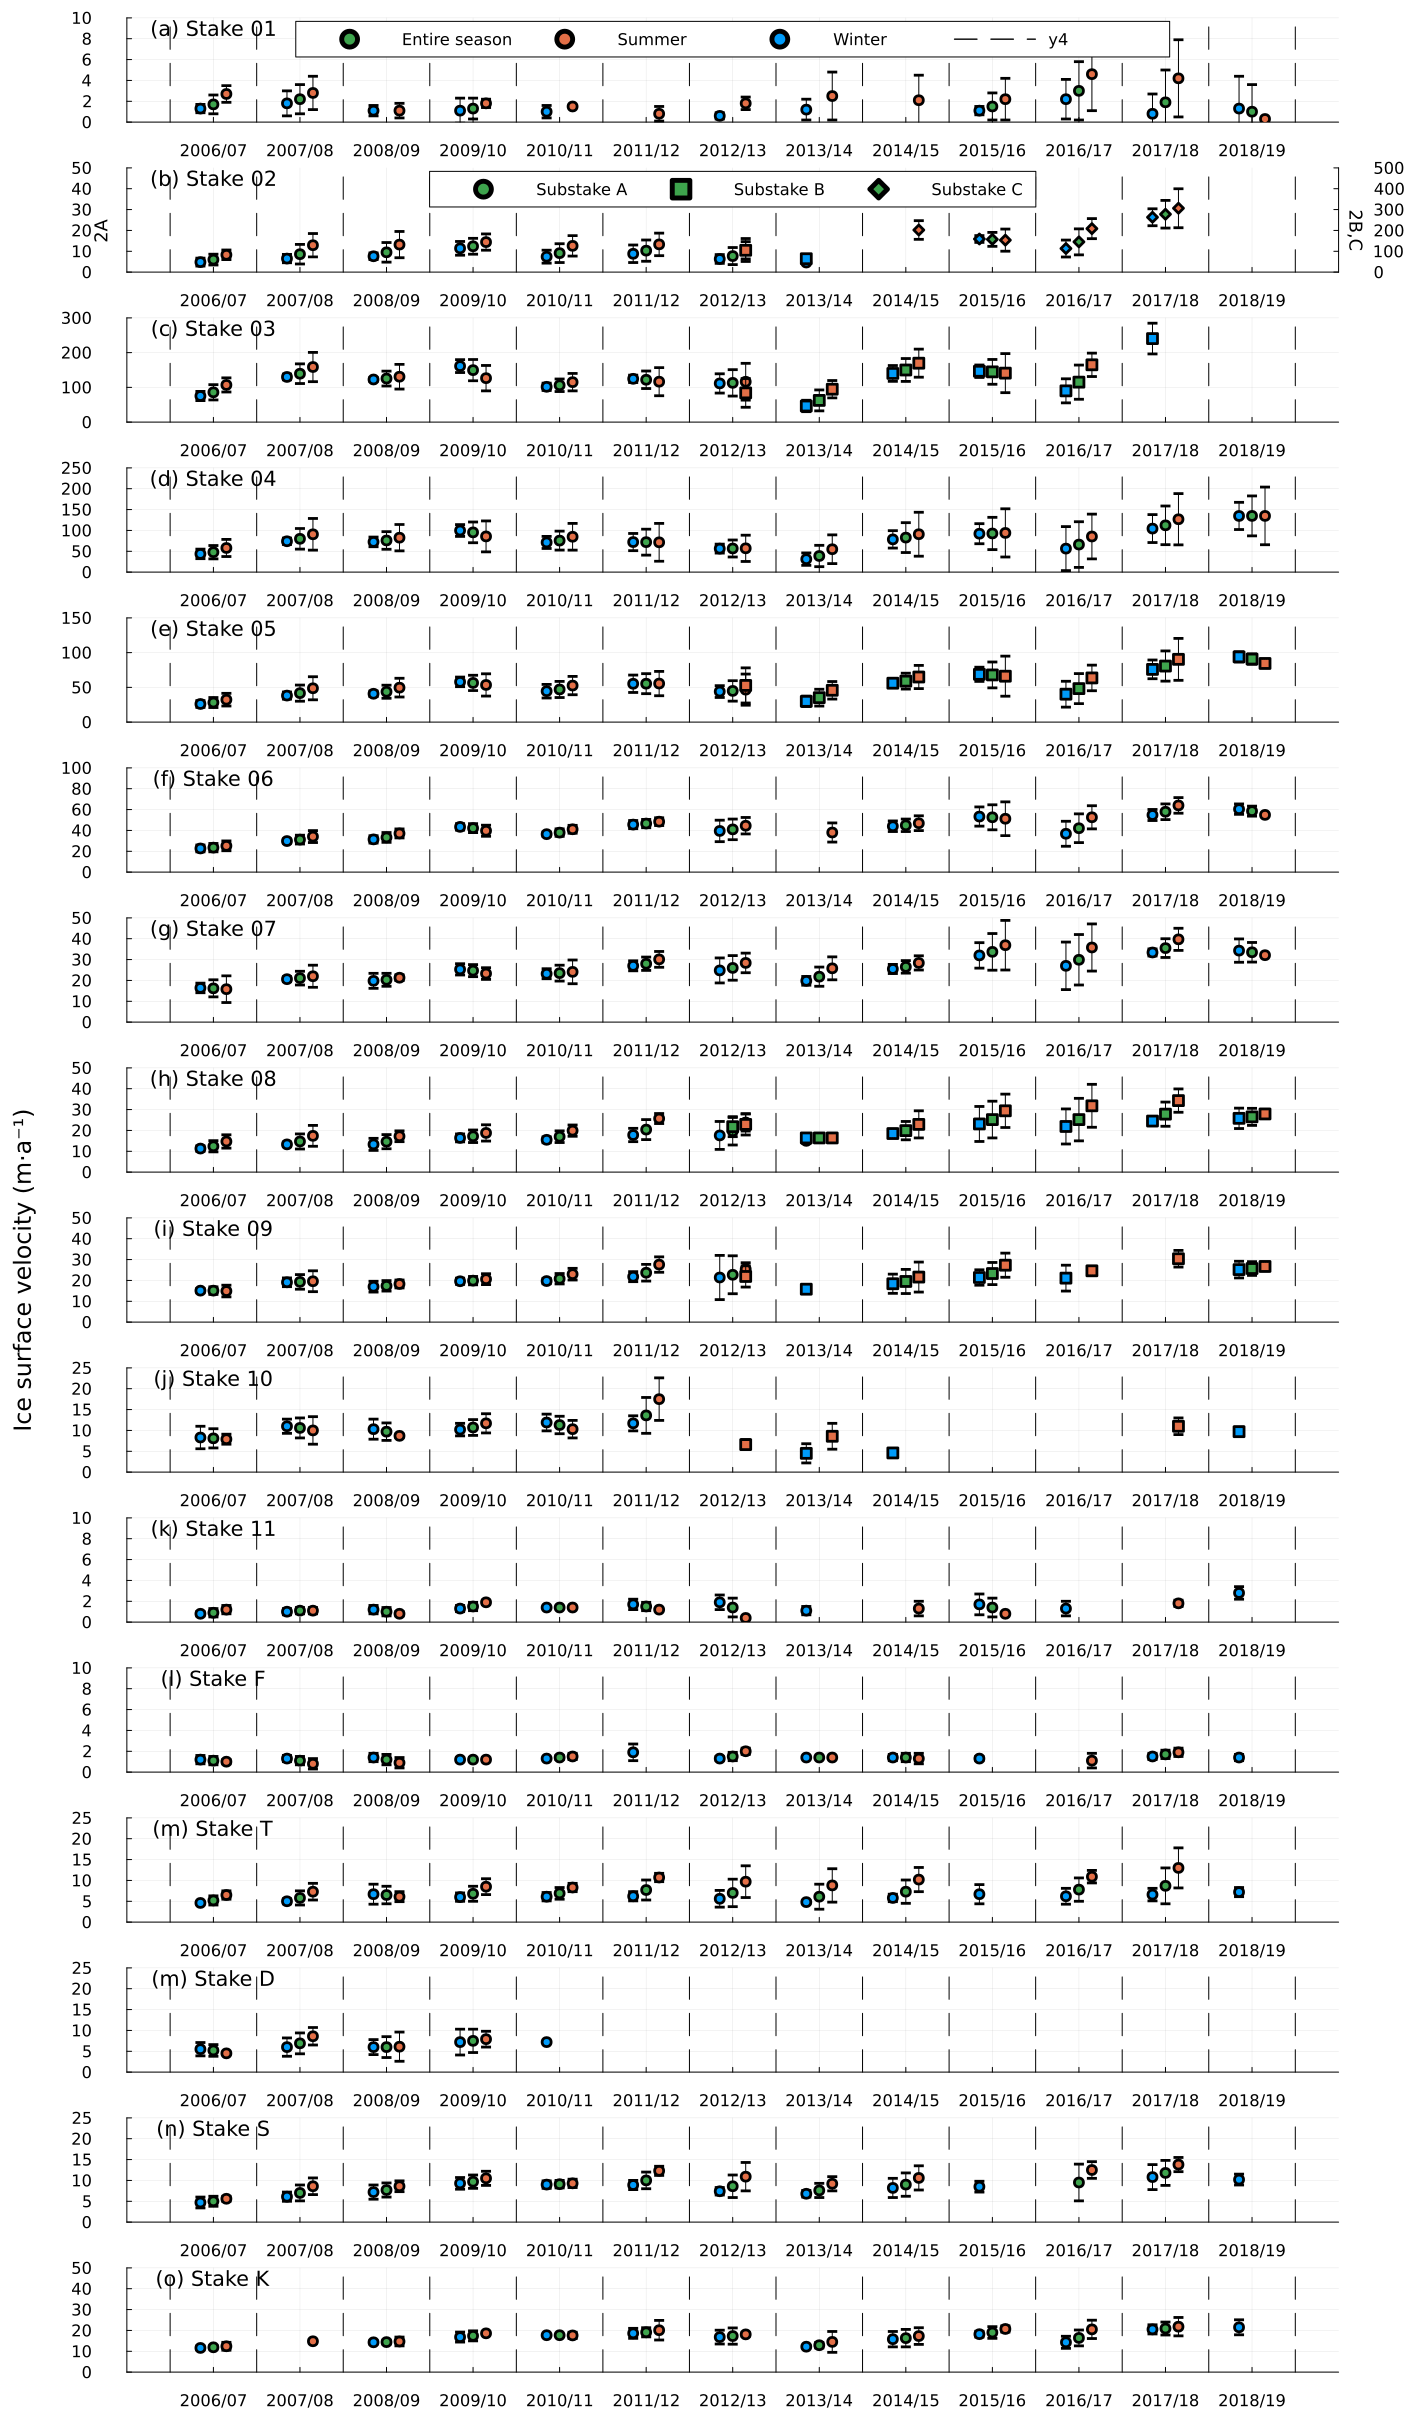
Figure 7Annual and seasonal velocities determined for hydrological years, together with standard deviations.
There was high variability in both the annual and seasonal velocities of all the stakes between the years. At particular stakes, the velocities between the fastest and slowest years differed by a factor of 2 or even 3 in some cases. The data also show the differences between the annual, summer, and winter velocities in particular years. Generally, the glacier speed exhibits a clear annual cycle, and the velocity is the highest in summer and the lowest in winter (Meier et al., 1985; Van der Veen, 1995). In some cases, however, the winter velocities are either higher (e.g. stakes 03A, 04A, 05A, 06A, 07A in 2010) or very similar to the summer and annual velocities (e.g. stakes 08A, 09A, KA, SA in 2010). Relatively small variations between the annual and seasonal velocities are also apparent in 2014 and 2015 for the majority of stakes and also in other years at particular stakes. Importantly, the dates of the seasons were established according to calendar dates. As glacier acceleration can also occur after the summer period, seasonal velocities should be analysed in light of such events, and the meteorological and hydrological conditions (Krimmel and Vaughn, 1987; Walters and Dunlap, 1987). The largest variations between the annual and seasonal velocities were recorded at stakes 02 and 03, i.e. those nearest to the front. But, as already mentioned, the positions of stakes shifted a few times, and fluctuations of velocities are affected by their changing distance to the glacier front (Pillewizer, 1939; Vieli et al., 2004).
4.4 Glacier elevation
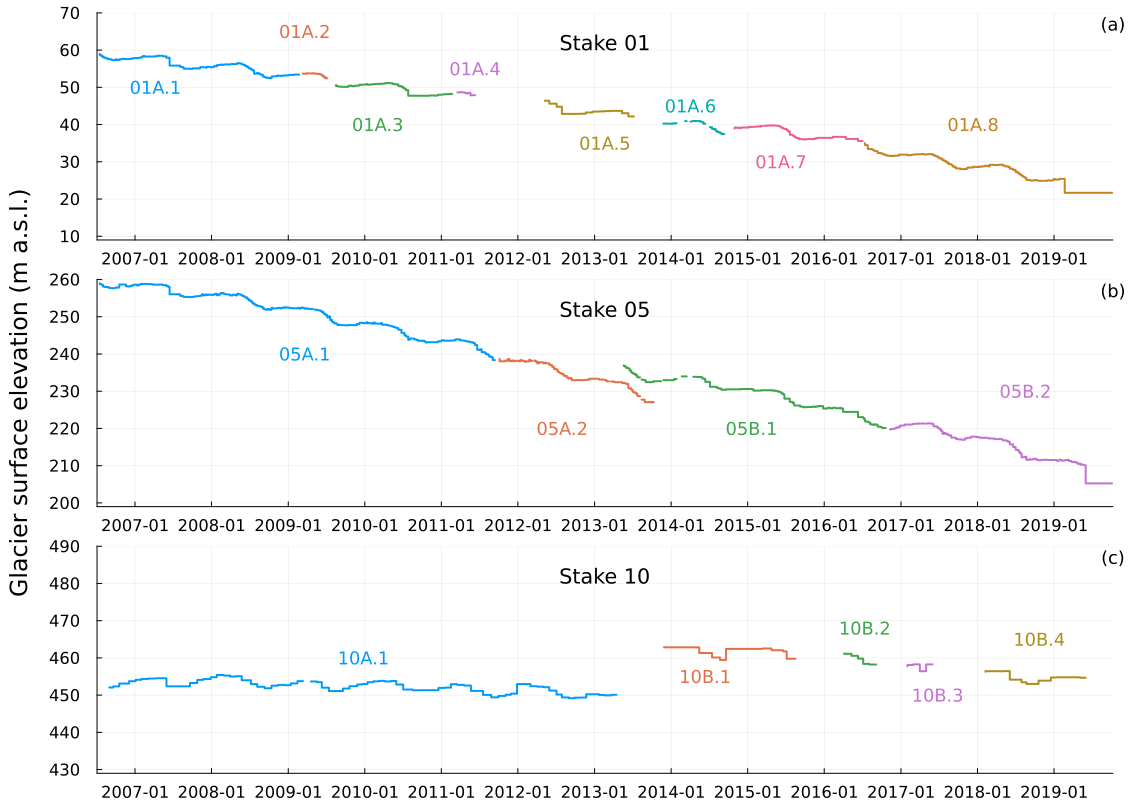
Besides the horizontal position and velocity, the datasets include the elevation of the glacier surface. Representative datasets of glacier surface elevation measurements at stakes 01, 05, and 10 are shown in Fig. 8, which depicts the change in surface elevation of different parts of the glacier over time. Note that these data correspond not only with emerging or submerging ice flow, but also take account of changes resulting from snow accumulation and glacier ablation. This time series is not continuous, as outliers due to incorrect field measurements of the stake height were filtered from the datasets.
All the data and code have been made publicly available through the Zenodo repository: https://doi.org/10.5281/zenodo.8289380 (Błaszczyk et al., 2023). There are two *.csv files for each of the 16 ablation stakes (01–11, F, T, D, S, and K). The first one (e.g. Stake_01_position.csv) contains a time series of GNSS-derived position measurements in the UTM (zone 33X) coordinate system. This file has the following columns: sub-stake label, date of measurements, easting, northing, geoidal height (EGM96). The second one (e.g. Stake_01_velocity.csv) is a time series of surface ice flow velocity and is divided into the following columns: sub-stake label, date of the first measurement, date of the second measurement, surface ice flow velocity, and accuracy of the surface ice flow velocity measurement. Additionally, we provide three files with annual, summer, and winter velocities estimated for a hydrological year (Stakes_annual_velocity.csv, Stakes_summer_velocity.csv and Stakes_winter_velocity.csv, respectively). These files are divided into the following columns: hydrological year, velocity for each consecutive sub-stake, and standard deviation of velocity for each sub-stake. The file Hansbreen_preprocessing_code_stakes.zip includes the code used for velocity estimation and data pre-processing. This code was written in the Bash and Julia programming languages.
This paper presents the velocity datasets resulting from an in situ monitoring survey of the Hansbreen glacier (Svalbard) during the period 2006–2019 using GNSS. The dataset includes high-temporal-resolution velocities at 16 stakes with accuracy assessments, as well as mean annual and seasonal velocities. This dataset is one of the longest datasets documenting glacier movement on Svalbard. The data exhibit a pattern of velocities characteristic of tidewater glaciers (Pillewizer, 1939; Krimmel, 1992; O'Neel et al., 2001), where an ice flow increases from the ice divides towards the calving terminus. Further, the glacier typically accelerates during the summer months (Kamb et al., 1994; Meier et al., 1994), although higher velocities were occasionally also recorded in autumn and winter.
The shortcoming of this dataset is that it does not allow for an easy analysis of dynamic responses to climate changes, as the velocities were measured at stakes that change their position with time and represent a Lagrangian velocity field (Machío et al., 2017). Furthermore, the glacier terminus retreated about 1 km during the study period. Thus, to investigate the relation between intraseasonal or interannual velocities and climate forcing, stake velocity should be corrected to the same position in space, and to the same distance from the glacier termini. Nevertheless, after such correction, these data might be further investigated with regard to changes in the glacier dynamics in light of climate change in the region (Wawrzyniak and Osuch, 2020), together with changes in the terminus position at different timescales (Ultee et al., 2022). Overall, these in situ ice flow velocity datasets can be used for tuning numerical models of glacier dynamics, e.g. modelling of flow of a grounded calving glacier (Vieli et al., 2000), developing glacier–plume and glacier–fjord circulation coupled models to simulate a glacier–ocean system (De Andrés et al., 2021), numerical simulation of the ice flow velocity in the future (e.g. Ai et al., 2019a), and changes of strain rate between neighbouring stakes (Ai et al., 2019b). Further, the dataset is an invaluable source of information on short-term processes such as speed events and seasonal velocity changes (van Pelt et al., 2018). Moreover, such a dataset can be of great importance for validating satellite-derived ice flow fields with in situ velocity measurements (Schellenberger et al., 2015; Fahnestock et al., 2016; Friedl et al., 2021) and digital elevation models derived from different remote sensing techniques, as previously used by Błaszczyk et al. (2019a).
JJ, DP, and PG conceived the project. DP, MP, MB, BL, DI, and ML maintained the stake network and the instrumentation. Data curation was provided by MB, BL, and MP. Conceptualization of the paper was performed by MB, MP, JJ, and BL. MB, DP, and MP led the data processing and analysis. MB and MP wrote the original draft, and all co-authors contributed text and edits. Funding acquisition was performed by PG, BL, MP, and JJ.
The contact author has declared that none of the authors has any competing interests.
Publisher's note: Copernicus Publications remains neutral with regard to jurisdictional claims made in the text, published maps, institutional affiliations, or any other geographical representation in this paper. While Copernicus Publications makes every effort to include appropriate place names, the final responsibility lies with the authors.
Special thanks are due to the staff of the Institute of Geophysics, PAS; the Polish Polar Station, Hornsund; and the participants of the University of Silesia's expeditions to Spitsbergen for maintaining the glaciological monitoring and conducting the fieldwork. The Pléiades imagery used in the figures was provided by the Pléiades Glacier Observatory (PGO) programme of the French Space Agency (CNES), and Sentinel-2 imagery was obtained from Copernicus Sentinel data (2018). The research and logistical equipment of the Polar Laboratory of the University of Silesia in Katowice was used during the fieldwork.
The data were collected within the framework of the glaciological monitoring of the Polish Polar Station, Hornsund, managed by the Institute of the Geophysics, Polish Academy of Sciences, subsidized by the Polish Ministry of Education and Science (decision no. 3/524698/SPUB/SP/2022). The publication was created as part of a project co-financed by the Ministry of Education and Science under contract no. 2023/WK/02. Bartłomiej Luks was supported by a subsidy from the Polish Ministry of Education and Science for the Institute of Geophysics, Polish Academy of Sciences. Michał Pętlicki was supported by a grant from the Priority Research Area (Anthropocene) under the Strategic Programme Excellence Initiative at the Jagiellonian University. The publication was co-financed by funds allocated under the Research Excellence Initiative of the University of Silesia in Katowice. The research leading to these results has received funding from the EEA Financial Mechanism 2014-2021, predefined project no: 2022/43/7/ST10/00001.
This paper was edited by Katrin Lindbäck and reviewed by Songtao Ai and one anonymous referee.
Ai, S., Ding, X., An, J., Lin, G., Wang, Z., and Yan, M.: Discovery of the Fastest Ice Flow along the Central Flow Line of Austre Lovénbreen, a Poly-thermal Valley Glacier in Svalbard, Remote Sens., 11, 1488, https://doi.org/10.3390/rs11121488, 2019a.
Ai, S., Yan, B., Wang, Z., and Yan, M.: A decadal record of inter-annual surface ice flow from Pedersenbreen, Svalbard (2005–15), Polar Science, 22, 100485, https://doi.org/10.1016/j.polar.2019.100485, 2019b.
Anderson, B., Willis, I., Goodsell, B., Banwell, A., Owens, I., Mackintosh A., and Lawson W.: Annual to Daily Ice Velocity and Water Pressure Variations on Ka Roimata o Hine Hukatere (Franz Josef Glacier), New Zealand, Arct. Antarct. Alp. Res., 46, 919–932, https://doi.org/10.1657/1938-4246-46.4.919, 2018.
Bahr, K.: High resolution glacier dynamics from GNSS measurements on Holtedahlfonna, NW Svalbard, Master Thesis in Geosciences, University of Oslo, 2015.
Benn, D. I. and Evans, D. J. A.: Glaciers and glaciation, Arnold, London, ISBN 0-340-65303-5, 1998.
Berthier, E., Vincent, C., Magnússon, E., Gunnlaugsson, Á. Þ., Pitte, P., Le Meur, E., Masiokas, M., Ruiz, L., Pálsson, F., Belart, J. M. C., and Wagnon, P.: Glacier topography and elevation changes derived from Pléiades sub-meter stereo images, The Cryosphere, 8, 2275–2291, https://doi.org/10.5194/tc-8-2275-2014, 2014.
Błaszczyk, M., Jania, J. A., and Kolondra, L.: Fluctuations of tidewater glaciers in Hornsund fjord (southern Svalbard) since the beginning of the 20th century, Polish Polar Res., 34, 327–352, https://doi.org/10.2478/popore-2013-0024, 2013.
Błaszczyk, M., Ignatiuk, D., Grabiec, M., Kolondra, L., Laska, M., Decaux, L., Jania, J., Berthier, E., Luks, B., Barzycka, B., and Czapla, M.: Quality assessment and glaciological applications of digital elevation models derived from space-borne and aerial images over two tidewater glaciers of southern Spitsbergen, Remote Sens., 11, 1121, https://doi.org/10.3390/rs11091121, 2019a.
Błaszczyk, M., Ignatiuk, D., Uszczyk, A., Cielecka-Nowak, K., Grabiec, M., Jania, J. A., and Walczowski, W.: Freshwater input to the Arctic fjord Hornsund (Svalbard), Polar Res., 38, 3506, https://doi.org/10.33265/polar.v38.3506, 2019b.
Błaszczyk, M., Jania, J. A., Ciepły, M., Grabiec, M., Ignatiuk, D., Kolondra, L., Kruss, A., Luks, B., Moskalik, M., Pastusiak, T., Strzelewicz, A., Walczowski, W., and Wawrzyniak, T.: Factors controlling terminus position of Hansbreen, a tidewater glacier in Svalbard, J. Geophys. Res.-Earth Surf., 126, e2020JF005763, https://doi.org/10.1029/2020JF005763, 2021.
Błaszczyk, M., Luks, B., Petlicki, M., Puczko, D., Ignatiuk, D., Laska, M., Jania, J., and Głowacki P.: High Temporal Resolution Records of Hansbreen Ice Flow Velocity for Years 2006-2019 (Version 02), Zenodo [code and data set], https://doi.org/10.5281/zenodo.8289380, 2023.
Cogley, J. G., Hock, R., Rasmussen, L. A., Arendt, A. A., Bauder, A., Jansson, P., Braithwaite, R. J., Kaser, G., Möller, M., Nicholson, L., and Zemp, M.: Glossary of glacier mass balance and related terms, IHP-VII Te., UNESCO-IHP, Paris, https://unesdoc.unesco.org/ark:/48223/pf0000192525 (last access: 31 June 2023), 2011.
Cuffey, K. M. and Paterson, W. S. B.: The physics of glaciers, Academic Press, Amsterdam, 2010.
De Andrés, E., Otero, J., Navarro, F., Promińska, A., Lapazaran, J., and Walczowski, W.: A two-dimensional glacier–fjord coupled model applied to estimate submarine melt rates and front position changes of Hansbreen, Svalbard, J. Glaciol., 64, 745–758, https://doi.org/10.1017/jog.2018.61, 2018.
De Andrés, E., Otero, J., Navarro, F. J., and Walczowski, W.: Glacier–plume or glacier–fjord circulation models? A 2-D comparison for Hansbreen–Hansbukta system, Svalbard, J. Glaciol., 67, 797–810, 2021.
den Ouden, M. A. G., Reijmer, C. H., Pohjola, V., van de Wal, R. S. W., Oerlemans, J., and Boot, W.: Stand-alone single-frequency GPS ice velocity observations on Nordenskiöldbreen, Svalbard, The Cryosphere, 4, 593–604, https://doi.org/10.5194/tc-4-593-2010, 2010.
Dunse, T., Schellenberger, T., Hagen, J. O., Kääb, A., Schuler, T. V., and Reijmer, C. H.: Glacier-surge mechanisms promoted by a hydro-thermodynamic feedback to summer melt, The Cryosphere, 9, 197–215, https://doi.org/10.5194/tc-9-197-2015, 2015.
Fahnestock, M., Scambos, T., Moon, T., Gardner, A., Haran, T., and Klinger, M.: Rapid large-area mapping of ice flow using Landsat 8, Remote Sens. Environ., 185, 84–94, 2016.
Friedl, P., Seehaus, T., and Braun, M.: Global time series and temporal mosaics of glacier surface velocities derived from Sentinel-1 data, Earth Syst. Sci. Data, 13, 4653–4675, https://doi.org/10.5194/essd-13-4653-2021, 2021.
Grabiec, M., Jania, J. A., Puczko, D., Kolondra, L., and Budzik, T.: Surface and bed morphology of Hansbreen, a tidewater glacier in Spitsbergen, Polish Polar Res., 33, 111–138, https://doi.org/10.2478/v10183-012-0010-7, 2012.
Hagen, J., Eiken, T., Kohler, J., and Melvold, K.: Geometry changes on Svalbard glaciers: Mass-balance or dynamic response?, Ann. Glaciol., 42, 255–261, https://doi.org/10.3189/172756405781812763, 2005.
Huss, M. and Hock, R.: A new model for global glacier change and sea-level rise, Front. Earth Sci., 3, 54, https://doi.org/10.3389/feart.2015.00054, 2015.
Jania, J.: Dynamiczne procesy glacjalne na poludniowym Spitsbergenie w swietle badan fotointerpretacyjnych i fotogrametrycznych, (Dynamic glacial processes in south Spitsbergen in the light of phtointerpretation and photogrammetric research), Katowice, Uniwersytet Slaski, Prace Naukowe Uniwersytetu Slaskiego w Katowicach, 1988.
Jania, J. and Kolondra, L.: Field investigations performed during the glaciological Spitsbergen expedition in the summer of 1982: interim report, Sosnowiec, Uniwersytet Slaski, 1982.
Jawak, S. D. and Luis, A. J.: Synergistic use of multitemporal RAMP, ICESat and GPS to construct an accurate DEM of the Larsemann Hills region, Antarctica, Adv. Space Res., 50, 457–470, https://doi.org/10.1016/j.asr.2012.05.004, 2012.
Kamb, B., Engelhardt, H., Fahnestock, M. A., Humphrey, N., Meier, M., and Stone, D.: Mechanical and hydrologic basis for the rapid motion of a large tidewater glacier: 2. Interpretation, J. Geophys. Res.-Sol. Ea., 99, 15231–15244, 1994.
Klein, E., Mosbeux, C., Bromirski, P., Padman, L., Bock, Y., Springer, S., and Fricker, H.: Annual cycle in flow of Ross Ice Shelf, Antarctica: Contribution of variable basal melting, J. Glaciol., 66, 861–875, https://doi.org/10.1017/jog.2020.61, 2020.
Kochtitzky, W., Copland, L., Van Wychen, W., Hugonnet, R., Hock, R., Dowdeswell, J., Benham, T., Strozz, T., Glazovsky, A., Lavrientev, I., Rounce, D., Millan, R., Cook, A., Dalton, A., Jiskoot, H., Cooley, J., Jania, J., and Navarro, F.: The unquantified mass loss of Northern Hemisphere marine-terminating glaciers from 2000–2020, Nat. Commun., 13, 5835, https://doi.org/10.1038/s41467-022-33231-x, 2022.
Koziol, C. P. and Arnold, N.: Modelling seasonal meltwater forcing of the velocity of land-terminating margins of the Greenland Ice Sheet, The Cryosphere, 12, 971–991, https://doi.org/10.5194/tc-12-971-2018, 2018.
Krimmel, R. M.: Photogrammetric determinations of surface altitude, velocity, and calving rate of Columbia Glacier, Alaska, 1983–91, U.S. Geol. Surv. Open File Rep., 92–104, https://doi.org/10.3133/ofr92104, 1992.
Krimmel, R. M. and Vaughn, B. H.: Columbia Glacier, Alaska: changes in velocity 1977–1986, J. Geophys, Res., 92, 8961–8968, https://doi.org/10.1029/JB092iB09p08961, 1987.
Laska, M., Barzycka, B., and Luks, B.: Melting Characteristics of Snow Cover on Tidewater Glaciers in Hornsund Fjord, Svalbard, Water, 9, 804, https://doi.org/10.3390/w9100804, 2017.
Lefauconnier, B.: Fluctuations glaciaires dans le Kongsfjord, bai du Roi, 790 N, Spitsbergen, analyses et conséquences, Thèse de doctorat, Université de Grenoble, 1987.
Lefauconnier, B., Hagen, J. O., and Rudant, J.-P.: Flow speed and calving rate of Kongsbreen glacier, Svalbard, using SPOT images, Polar Res., 13, 59–65, 1994.
Lemke, P., Ren, J., Alley, R. B., Allison, I., Carrasco, J., Flato, G., Fujii, Y., Kaser, G., Mote, P., Thomas, R. H., and Zhang, T.: Observations: Changes in Snow, Ice and Frozen Ground, In: Climate Change 2007: The Physical Science Basis. Contribution of Working Group I to the Fourth Assessment Report of the Intergovernmental Panel on Climate Change, edited by: Solomon, S., Qin, D. M., Manning, Z., Chen, M., Marquis, K. B., Averyt, M. Tignor, and Miller, H. L., Cambridge University Press, Cambridge, United Kingdom and New York, NY, USA, 2007.
Machío, F., Rodríguez-Cielos, R., Navarro, F., Lapazaran, J., and Otero, J.: A 14-year dataset of in situ glacier surface velocities for a tidewater and a land-terminating glacier in Livingston Island, Antarctica, Earth Syst. Sci. Data, 9, 751–764, https://doi.org/10.5194/essd-9-751-2017, 2017.
McCormack, F. S., Roberts, J. L., Kulessa, B., Aitken, A., Dow, C. F., Bird, L., Galton-Fenzi, B. K., Hochmuth, K., Jones, R. S., Mackintosh, A. N., and McArthur, K.: Assessing the potential for ice flow piracy between the Totten and Vanderford glaciers, East Antarctica, The Cryosphere, 17, 4549–4569, https://doi.org/10.5194/tc-17-4549-2023, 2023.
Meier, M., Lundstrom, S., Stone, D., Kamb, B., Engelhardt, H., Humphrey, N., Dunlap, W. W., Fahnestock, M., Krimmel, R. M., and Walters, R.: Mechanical and hydrologic basis for the rapid motion of a large tidewater glacier: 1. Observations, J. Geophys. Res.-Sol. Ea., 99, 15219–15229, https://doi.org/10.1029/94JB00237, 1994.
Meier, M. F., Rasmussen, L. A., Krimmel, R. M., Olsen, R. W., and Frank, D.: Photogrammetric determination of surface altitude, terminus position, and ice velocity of Columbia Glacier, Alaska, U.S. Geol. Surv. Prof. Pap., 1258-F, 41 pp., 1985.
Meredith, M., Sommerkorn, M., Cassotta, S., Derksen, C., Ekaykin, A., Hollowed, A., Kofinas, G., Mackintosh, A., Melbourne-Thomas, J., Muelbert, M. M. C., Ottersen, G., Pritchard, H., and Schuur, E. A. G.: Polar Regions, in: IPCC Special Report on the Ocean and Cryosphere in a Changing Climate, edited by: Pörtner, H.-O., Roberts, D. C., Masson-Delmotte, V., Zhai, P., Tignor, M., Poloczanska, E., Mintenbeck, K., Alegría, A., Nicolai, M., Okem, A., Petzold, J., Rama, B., and Weyer, N. M., Cambridge University Press, Cambridge, UK and New York, NY, USA, 203–320, https://doi.org/10.1017/9781009157964.005, 2019.
Nilsen, F., Skogseth, R., Vaardal-Lunde, J., and Inall, M.: A simple shelf circulation model: Intrusion of Atlantic water on the West Spitsbergen shelf, J. Phys. Oceanogr., 46, 1209–1230, https://doi.org/10.1175/JPO-D-15-0058.1, 2016.
Nye, J.: The Mechanics of Glacier Flow, J. Glaciol., 2, 82–93, https://doi.org/10.3189/S0022143000033967, 1952.
O'Neel, S., Echelmeyer, K. A., and Motyka, R. J.: Short-term flow dynamics of a retreating tidewater glacier: LeConte Glacier, Alaska, USA, J. Glaciol., 47, 567–578, https://doi.org/10.3189/172756501781831855, 2001.
Otero, J., Navarro, F. J., Lapazaran, J. J., Welty, E., Puczko, D., and Finkelnburg, R.: Modeling the Controls on the Front Position of a Tidewater Glacier in Svalbard, Front. Earth Sci., 5, 29, https://doi.org/10.3389/feart.2017.00029, 2017.
Pillewizer, W.: Die kartographischen und gletscherkundlichen Ergebnisse der deutschen Spitzbergen-Expedition 1938, Perthes/Gotha, 46 p., 1939.
Promińska, A., Falck, E., and Walczowski, W.: Interannual variability in hydrography and water mass distribution in Hornsund, an Arctic fjord in Svalbard, Polar Res., 37, 1495546, https://doi.org/10.1080/17518369.2018.1495546, 2018.
Rajner, M.: Detection of ice mass variation using gnss measurements at Svalbard, J. Geodynam., 121, 20–25, https://doi.org/10.1016/j.jog.2018.06.001, 2018.
Rosier, S. H. R. and Gudmundsson, G. H.: Exploring mechanisms responsible for tidal modulation in flow of the Filchner–Ronne Ice Shelf, The Cryosphere, 14, 17–37, https://doi.org/10.5194/tc-14-17-2020, 2020.
Rückamp, M., Blindow, N., Suckro, S., Braun, M., and Humbert, A.: Dynamics of the ice cap on King George Island, Antarctica: Field measurements and numerical simulations, Ann. Glaciol., 51, 80–90, https://doi.org/10.3189/172756410791392817, 2010.
Schellenberger, T., Dunse, T., Kääb, A., Kohler, J., and Reijmer, C. H.: Surface speed and frontal ablation of Kronebreen and Kongsbreen, NW Svalbard, from SAR offset tracking, The Cryosphere, 9, 2339–2355, https://doi.org/10.5194/tc-9-2339-2015, 2015.
Schmidt, L. S., Schuler, T. V., Thomas, E. E., and Westermann, S.: Meltwater runoff and glacier mass balance in the high Arctic: 1991–2022 simulations for Svalbard, The Cryosphere, 17, 2941–2963, https://doi.org/10.5194/tc-17-2941-2023, 2023.
Schröder, L., Richter, A., Fedorov, D. V., Eberlein, L., Brovkov, E. V., Popov, S. V., Knöfel, C., Horwath, M., Dietrich, R., Matveev, A. Y., Scheinert, M., and Lukin, V. V.: Validation of satellite altimetry by kinematic GNSS in central East Antarctica, The Cryosphere, 11, 1111–1130, https://doi.org/10.5194/tc-11-1111-2017, 2017.
Solgaard, A., Kusk, A., Merryman Boncori, J. P., Dall, J., Mankoff, K. D., Ahlstrøm, A. P., Andersen, S. B., Citterio, M., Karlsson, N. B., Kjeldsen, K. K., Korsgaard, N. J., Larsen, S. H., and Fausto, R. S.: Greenland ice velocity maps from the PROMICE project, Earth Syst. Sci. Data, 13, 3491–3512, https://doi.org/10.5194/essd-13-3491-2021, 2021.
Stober, M. and Hepperle, J.: Changes in Ice Elevation and Ice Flow-Velocity in the Swiss Camp Area (West Greenland) between 1991 and 2006, Polarforschung, 76, 109-118, 2007.
Stober, M. and Hepperle, J.: Glacial-geodetic long-term study on mass balance and ice dynamics near the equilibrium line of the Greenland ice sheet, Polarforschung, Bremerhaven, Alfred Wegener Institute for Polar and Marine Research and German Society of Polar Research, 88, 99–123, https://doi.org/10.2312/polarforschung.88.2.99, 2019.
Stocker-Waldhuber, M., Fischer, A., Helfricht, K., and Kuhn, M.: Long-term records of glacier surface velocities in the Ötztal Alps (Austria), Earth Syst. Sci. Data, 11, 705–715, https://doi.org/10.5194/essd-11-705-2019, 2019.
Strozzi, T., Paul, F., Wiesmann, A., Schellenberger, T., and Kääb, A.: Circum-Arctic Changes in the Flow of Glaciers and Ice Caps from Satellite SAR Data between the 1990s and 2017, Remote Sens., 9, 947, https://doi.org/10.3390/rs9090947, 2017.
Ultee, L., Felikson, D., Minchew, B. Stearns, L. A., and Riel, B.: Helheim Glacier ice velocity variability responds to runoff and terminus position change at different timescales. Nat Commun., 13, 6022, https://doi.org/10.1038/s41467-022-33292-y, 2022.
Vallot, D., Pettersson, R., Luckman, A., Benn, D. I., Zwinger, T., Van Pelt, W. J., Kohler, J., Schäfer, M., Claremar, B., and Hulton, N. R.: Basal dynamics of Kronebreen, a fast-flowing tidewater glacier in Svalbard: non-local spatio-temporal response to water input, J. Glaciol., 63, 1012–1024, https://doi.org/10.1017/jog.2017.69, 2017.
Van der Veen, C. J.: Controls on calving rate and basal sliding: observations from Columbia Glacier, Alaska, prior to and during its rapid retreat, 1976–1993, Report (Byrd Polar Research Center); 11, The Ohio State University, 1995.
van Pelt, W. J. J., Pohjola, V. A., Pettersson, R., Ehwald, L. E., Reijmer, C. H., Boot, W., and Jakobs, C. L.: Dynamic response of a High Arctic glacier to melt and runoff variations, Geophys. Res. Lett., 45, 4917–4926, https://doi.org/10.1029/2018GL077252, 2018.
van Pelt, W., Pohjola, V., Pettersson, R., Marchenko, S., Kohler, J., Luks, B., Hagen, J. O., Schuler, T. V., Dunse, T., Noël, B., and Reijmer, C.: A long-term dataset of climatic mass balance, snow conditions, and runoff in Svalbard (1957–2018), The Cryosphere, 13, 2259–2280, https://doi.org/10.5194/tc-13-2259-2019, 2019.
van Pelt, W. J. J., Schuler T.V., Pohjola V., and Pettersson R.: Accelerating future mass loss of Svalbard glaciers from a multi-model ensemble, J. Glaciol., 67, 485–499, https://doi.org/10.1017/jog.2021.2, 2021.
Van Wychen, W., Davis, J., Burgess, D. O., Copland, L., Gray, L., Sharp, M., and Mortimer, C.: Characterizing interannual variability of glacier dynamics and dynamic discharge (1999–2015) for the ice masses of Ellesmere and Axel Heiberg Islands, Nunavut, Canada, J. Geophys. Res.-Earth Surf., 121, 39–63, https://doi.org/10.1002/2015JF003708, 2016.
Vieli, A., Funk, M., and Blatter, H.: Tidewater glaciers: Frontal flow acceleration and basal sliding, Ann. Glaciol., 31, 217–221, https://doi.org/10.3189/172756400781820417, 2000.
Vieli, A., Jania, J., Blatter, H., and Funk, M.: Short-term velocity variations on Hansbreen, a tidewater glacier in Spitsbergen, J. Glaciol., 50, 389–398, https://doi.org/10.3189/172756504781829963, 2004.
Vivet, R. and Lliboutry, L. A.: Vitesses et intensité du vêlage au front du Kongsbre, vers le 1er août 1963, Z. Gletscherkd. Glazialgeol., 14, 27–34, 1978.
Voigt, U.: Die Bewegung der Gletscherzunge des Kongsvegen (Kingsbay, Westspitzbergen), Petermanns Ceogr Mitt., 109, 1–8, 1965.
Walters, R. A. and Dunlap, W. W.: Analysis of time series of glacier speed: Columbia Glacier, Alaska, J. Geophys. Res.-Sol. Ea., 92, 8969–8975, 1987.
Wawrzyniak, T. and Osuch, M.: A 40-year High Arctic climatological dataset of the Polish Polar Station Hornsund (SW Spitsbergen, Svalbard), Earth Syst. Sci. Data, 12, 805–815, https://doi.org/10.5194/essd-12-805-2020, 2020.
Weertman, J.: On the Sliding of Glaciers, J. Glaciol., 3, 33–38, https://doi.org/10.3189/S0022143000024709, 1957.
Węzka, K., Paśnikowski, M., and Walo, J.: A reference station in Hornsund (Spitsbergen): determination of its location, future development, and usage (in Polish), Biuletyn Wojskowej Akademii Technicznej, 59, 179–195, 2010.
WGMS: Fluctuations of Glaciers Database, World Glacier Monitoring Service, Zurich, Switzerland [data set], https://doi.org/10.5904/wgms-fog-2021-05, 2021.