the Creative Commons Attribution 4.0 License.
the Creative Commons Attribution 4.0 License.
 | 04 Apr 2024
French coastal network for carbonate system monitoring: the CocoriCO2 dataset
Sébastien Petton
Fabrice Pernet
Valérian Le Roy
Matthias Huber
Sophie Martin
Éric Macé
Yann Bozec
Stéphane Loisel
Peggy Rimmelin-Maury
Émilie Grossteffan
Michel Repecaud
Loïc Quemener
Michael Retho
Soazig Manac'h
Mathias Papin
Philippe Pineau
Thomas Lacoue-Labarthe
Jonathan Deborde
Louis Costes
Pierre Polsenaere
Loïc Rigouin
Jérémy Benhamou
Laure Gouriou
Joséphine Lequeux
Nathalie Labourdette
Nicolas Savoye
Grégory Messiaen
Elodie Foucault
Vincent Ouisse
Marion Richard
Franck Lagarde
Florian Voron
Valentin Kempf
Sébastien Mas
Léa Giannecchini
Francesca Vidussi
Behzad Mostajir
Yann Leredde
Samir Alliouane
Jean-Pierre Gattuso
Frédéric Gazeau
Since the beginning of the industrial revolution, atmospheric carbon dioxide (CO2) concentrations have risen steadily and have induced a decrease of the averaged surface ocean pH by 0.1 units, corresponding to an increase in ocean acidity of about 30 %. In addition to ocean warming, ocean acidification poses a tremendous challenge to some marine organisms, especially calcifiers. The need for long-term oceanic observations of pH and temperature is a key element to assess the vulnerability of marine communities and ecosystems to these pressures. Nearshore productive environments, where a large majority of shellfish farming activities are conducted, are known to present pH levels as well as amplitudes of daily and seasonal variations that are much larger than those observed in the open ocean. Yet, to date, there are very few coastal observation sites where these parameters are measured simultaneously and at high frequency.
To bridge this gap, an observation network was initiated in 2021 in the framework of the CocoriCO2 project. Six sites were selected along the French Atlantic and Mediterranean coastlines based on their importance in terms of shellfish production and the presence of high- and low-frequency monitoring activities. At each site, autonomous pH sensors were deployed, both inside and outside shellfish production areas, next to high-frequency CTD (conductivity–temperature–depth) probes operated through two operating monitoring networks. pH sensors were set to an acquisition rate of 15 min, and discrete seawater samples were collected biweekly in order to control the quality of pH data (laboratory spectrophotometric measurements) as well as to measure total alkalinity and dissolved inorganic carbon concentrations for full characterization of the carbonate system. While this network has been up and running for more than 2 years, the acquired dataset has already revealed important differences in terms of pH variations between monitored sites related to the influence of diverse processes (freshwater inputs, tides, temperature, biological processes). Data are available at https://doi.org/10.17882/96982 (Petton et al., 2023a).
- Article
(7508 KB) - Full-text XML
- BibTeX
- EndNote


In the last centuries, the industrial revolution has resulted in a continuous increase in the concentration of carbon dioxide (CO2) in the atmosphere (IPCC, 2023). A significant part of this anthropogenic CO2 (26 %) has been absorbed by the ocean (Friedlingstein et al., 2022), resulting in a decline of the global average surface pH by 0.1 units. The decline in seawater pH and associated carbonate ion concentrations, a process referred to as ocean acidification (OA; Caldeira and Wickett, 2003), has potential impacts on marine organisms, particularly those that rely on calcification. Indeed, marine calcifiers, such as shallow-water tropical corals, shellfish, and calcareous plankton, are examples of ecologically and economically important organisms that may be affected by OA in the coming decades. (Gazeau et al., 2013; Gattuso et al., 2014; Lutier et al., 2022). The carbonate chemistry of the ocean surface layer is subject to notable temporal and spatial variations that arise from a combination of local physical conditions (e.g., temperature, salinity); biological processes (e.g., primary production, dissolution and precipitation of calcium carbonate); basin-scale circulation patterns; and exchanges between the ocean, land, and atmosphere. The resulting changes in pH, carbonate ion concentrations, and saturation states with respect to calcium carbonate minerals have important implications for ecosystem function and global or local biogeochemical cycling. To assess the future effects of OA on marine organisms in the coming decades, there is a growing need, driven by both scientific and societal demands, for high-quality data on the status and trends of OA worldwide. This is evidenced by various initiatives such as the United Nations Sustainable Development Goal (UN SDG) 14.3.1, which calls for annual reporting on global seawater pH observations.
Coastal areas, where a large majority of shellfish farming activities take place, are particularly important to monitor because of their high biological productivity and economic significance. In these areas, pH levels and variations differ from those observed in the open ocean (Takeshita et al., 2015; Fassbender et al., 2016; Feely et al., 2016). Long-term high-resolution observations that capture diurnal to seasonal variations are critical for characterizing natural variability and understanding carbonate parameters (Rosenau et al., 2021; Sutton et al., 2022), indicating a critical need for increasing monitoring efforts in nearshore environments. This knowledge is crucial to develop a comprehensive understanding of the impacts of OA on marine ecosystems and to develop effective management strategies to mitigate the adverse effects on these areas (Riebesell and Gattuso, 2015). Moreover, fixed time-series observations also play a unique role in ocean monitoring, as they can support multidisciplinary observations and process studies and serve as high-quality reference stations for validating satellite measurements and Earth system models (Kwiatkowski et al., 2020). These observations can also be used as critical climate records if they are of sufficient duration and measurement quality to detect the anthropogenic signal above the natural variability of the ocean carbon system.
Over the French coastline, two study sites benefit from rather long historical records of ocean carbonate chemistry. Kapsenberg et al. (2017) showed, thanks to a discrete (weekly) sampling strategy, that the rate of pH change was −0.0028 ± 0.0003 units pH per year in a coastal Mediterranean site (Bay of Villefranche-sur-Mer) between 2007 and 2015. Gac et al. (2020) also provided a robust multi-annual dataset from 2015 to 2019 based on hourly measurements deployed on a buoy in the southwestern English Channel. They demonstrated that the tidal transport of coastal and offshore water masses strongly impacted the daily and seasonal variability of the partial pressure of CO2 (pCO2), although biological productivity was the main driver of pCO2 dynamics with large interannual variability.
Generally, rapid fluctuations of pH in coastal areas due to processes mentioned above frequently largely surpass the long-term pH trend. Consequently, the signal indicating the acidification of coastal seawater caused by anthropogenic CO2 uptake can be partially masked and less discernible if the sampling strategy is not adapted. High-frequency pH measurements are therefore needed to properly understand both the current state and the underlying mechanisms that drive short-term pH variations as well as better evaluating interannual variability.
In the present paper, we introduce a new monitoring network of carbonate chemistry that includes high-frequency pH measurements and low-frequency measurements of dissolved inorganic carbon and total alkalinity. The CocoriCO2 network was initiated in 2021 at six nearshore areas. It includes multiple monitoring stations equipped with pH probes and conductivity–temperature–depth (CTD) sensors and a similar discrete sampling strategy between stations, which enable uniform data acquisition and processing. We demonstrate the capabilities of this network by analyzing the temporal and spatial variability of pH, total alkalinity, and dissolved inorganic carbon in these coastal systems. The network provides a deeper understanding of OA in representative coastal ecosystems and the impact of pH variations on the oyster vulnerability.
2.1 Study sites and observation strategy
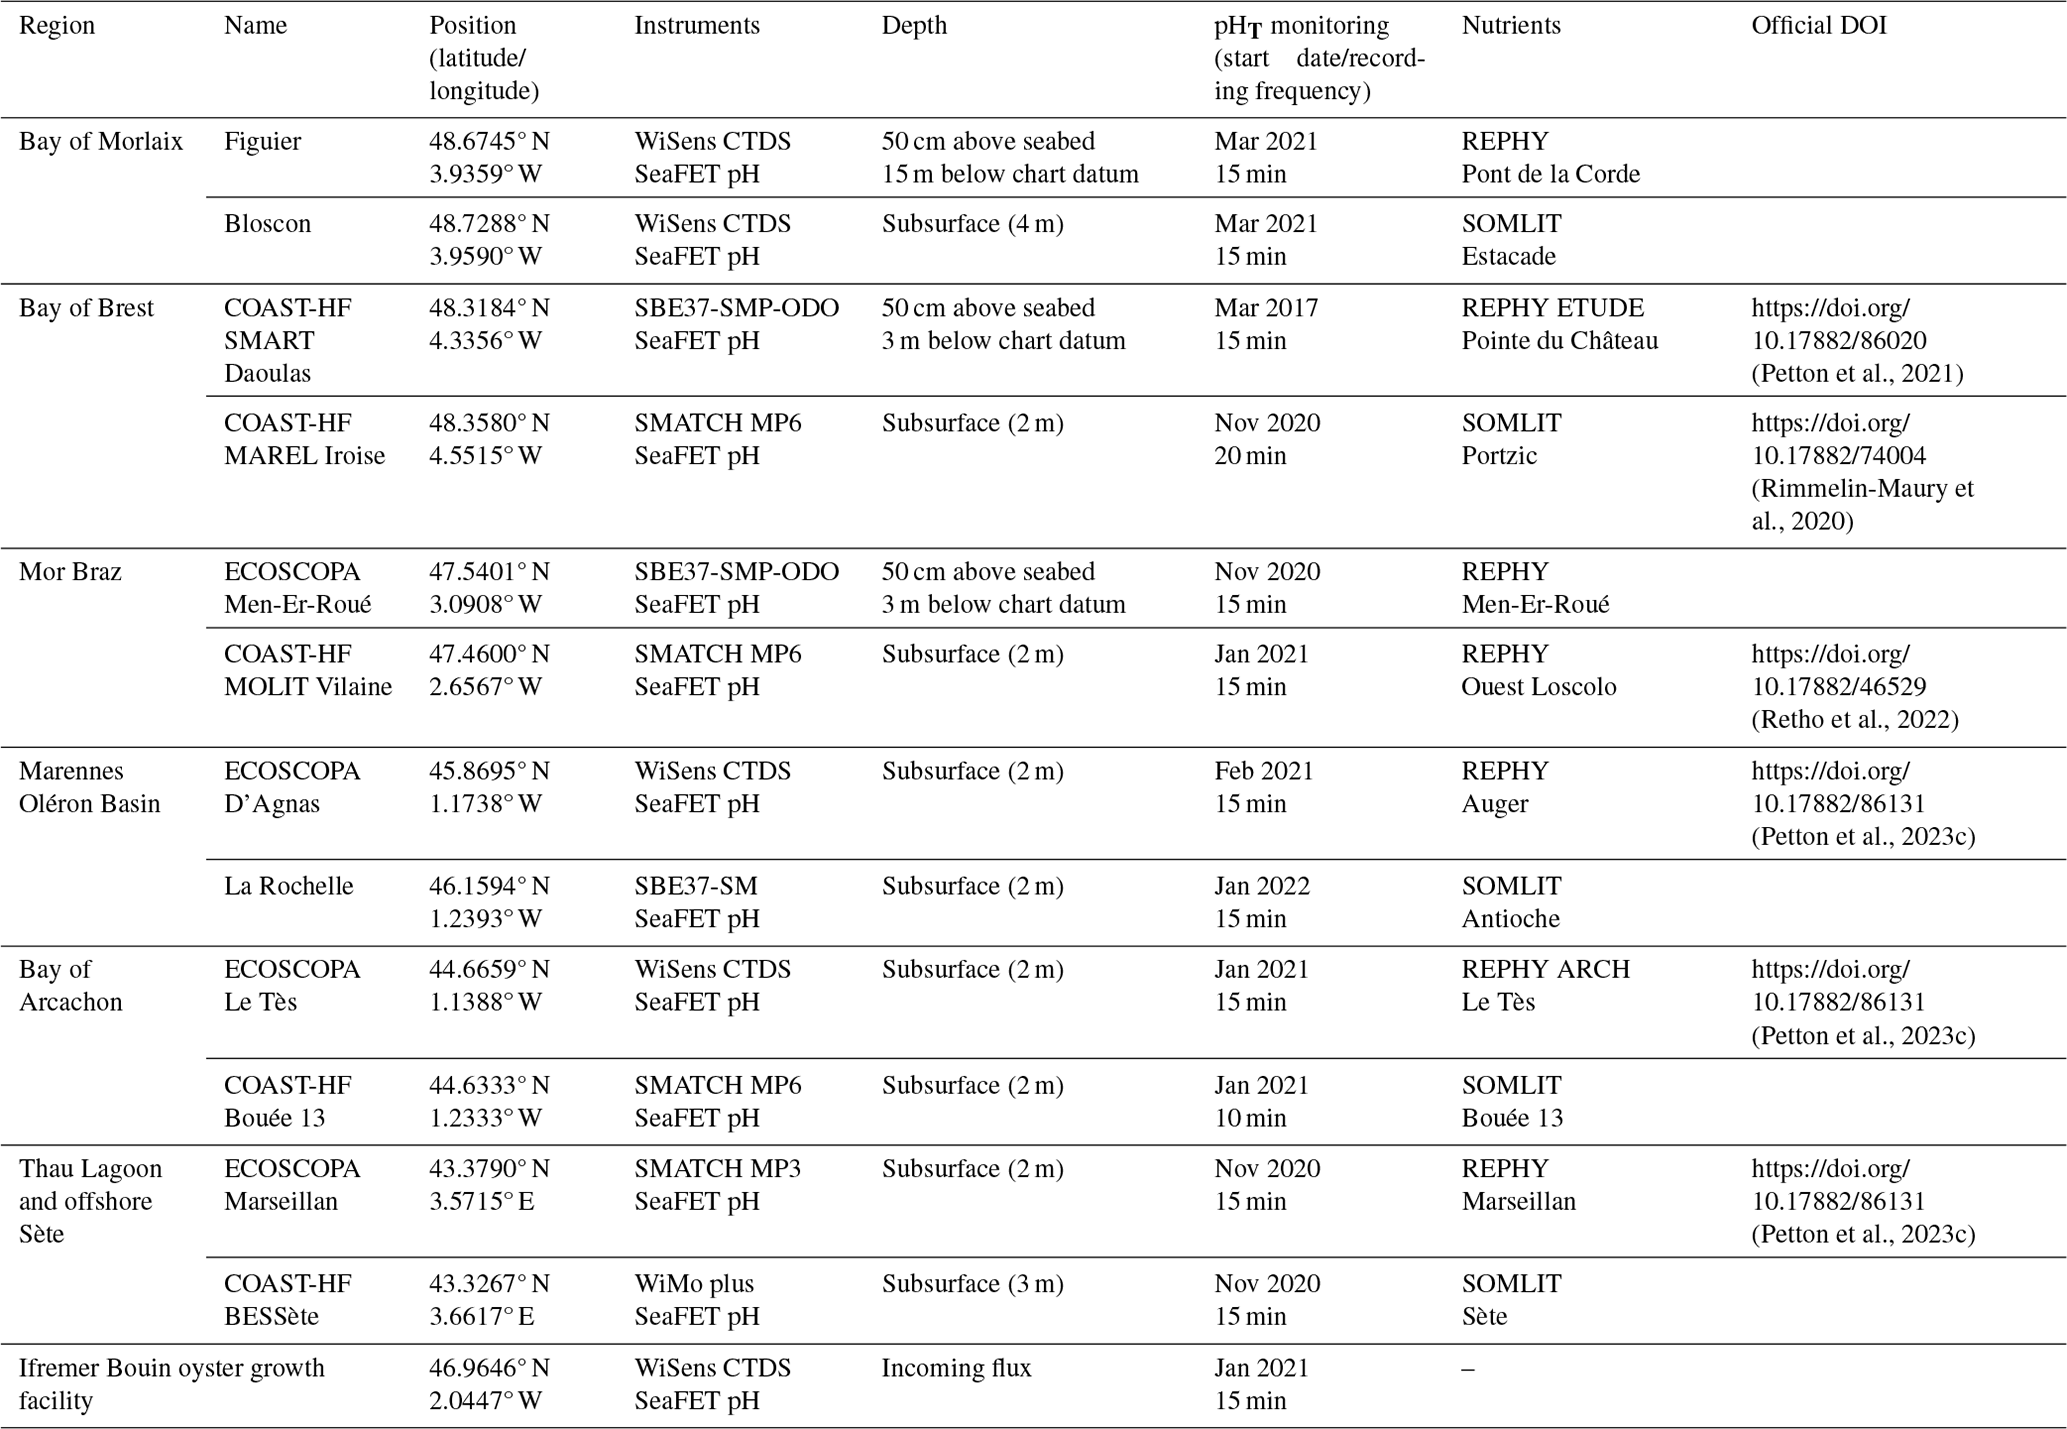
The objective of the network relies on monitoring carbonate parameters along the French coastal systems. Six different areas have been chosen based on the presence of oyster farming activity and existing monitoring efforts to facilitate maintenance of the sensors and seawater sampling on a regular basis (see following sections). In each area, we aimed at monitoring one site located next to oyster farms and another one outside shellfish production areas that are more subjected to oceanic conditions. Four oceanic sites have been selected among the national program COAST-HF (Coastal Ocean Observing System High-frequency, https://www.coast-hf.fr, last access: 2 April 2024). It gathers from 14 French coastal stations with essential oceanographic parameters at a sub-hourly frequency: temperature (±0.1 °C), conductivity (±0.3 mS cm−1), in vivo fluorescence (±10 %), and turbidity (±10 %). In contrast, nearly all farming sites are part of the Ifremer observatory network ECOSCOPA (https://ecoscopa-donnees.ifremer.fr, last access: 2 April 2024). Within this network, temperature (±0.1 °C) and salinity (±0.5) have been recorded at a 15 min frequency since 2010. In the framework of these two networks, all sites are visited on a bimonthly to monthly basis, allowing us to download recorded pHT data (pH on total scale), clean sensors, and perform low-frequency sampling (see Sect. 2.2.2).
Except for the Bay of Morlaix, the chosen study sites also belong to two existing low-frequency environmental networks (Fig. 1): the SOMLIT (Service d'Observation en Milieu LITtoral, INSU-CNRS; https://www.somlit.fr/, last access: 2 April 2024) and the Ifremer REPHY (Observation and Surveillance Network for Phytoplankton and Hydrology in coastal water; Belin et al., 2021), which have been contributing to long-term time series for more than 20 years (Lheureux et al., 2023) and providing crucial parameters (e.g., nutrient concentrations) necessary for data processing (see Sect. 2.3.1).
All monitoring sites are shown in Fig. 1, and a brief description of each area is given hereafter following a latitudinal gradient from north to south. The Ifremer Bouin oyster growth facility has been chosen as an additional site because it has a significant interest in monitoring seawater pHT evolution during the early stages of oyster growth, as it is a critical period for their development. The data obtained from this site will provide us with a deeper understanding of the impact of pHT levels on the growth of oysters and their capacity to survive in their natural habitat.
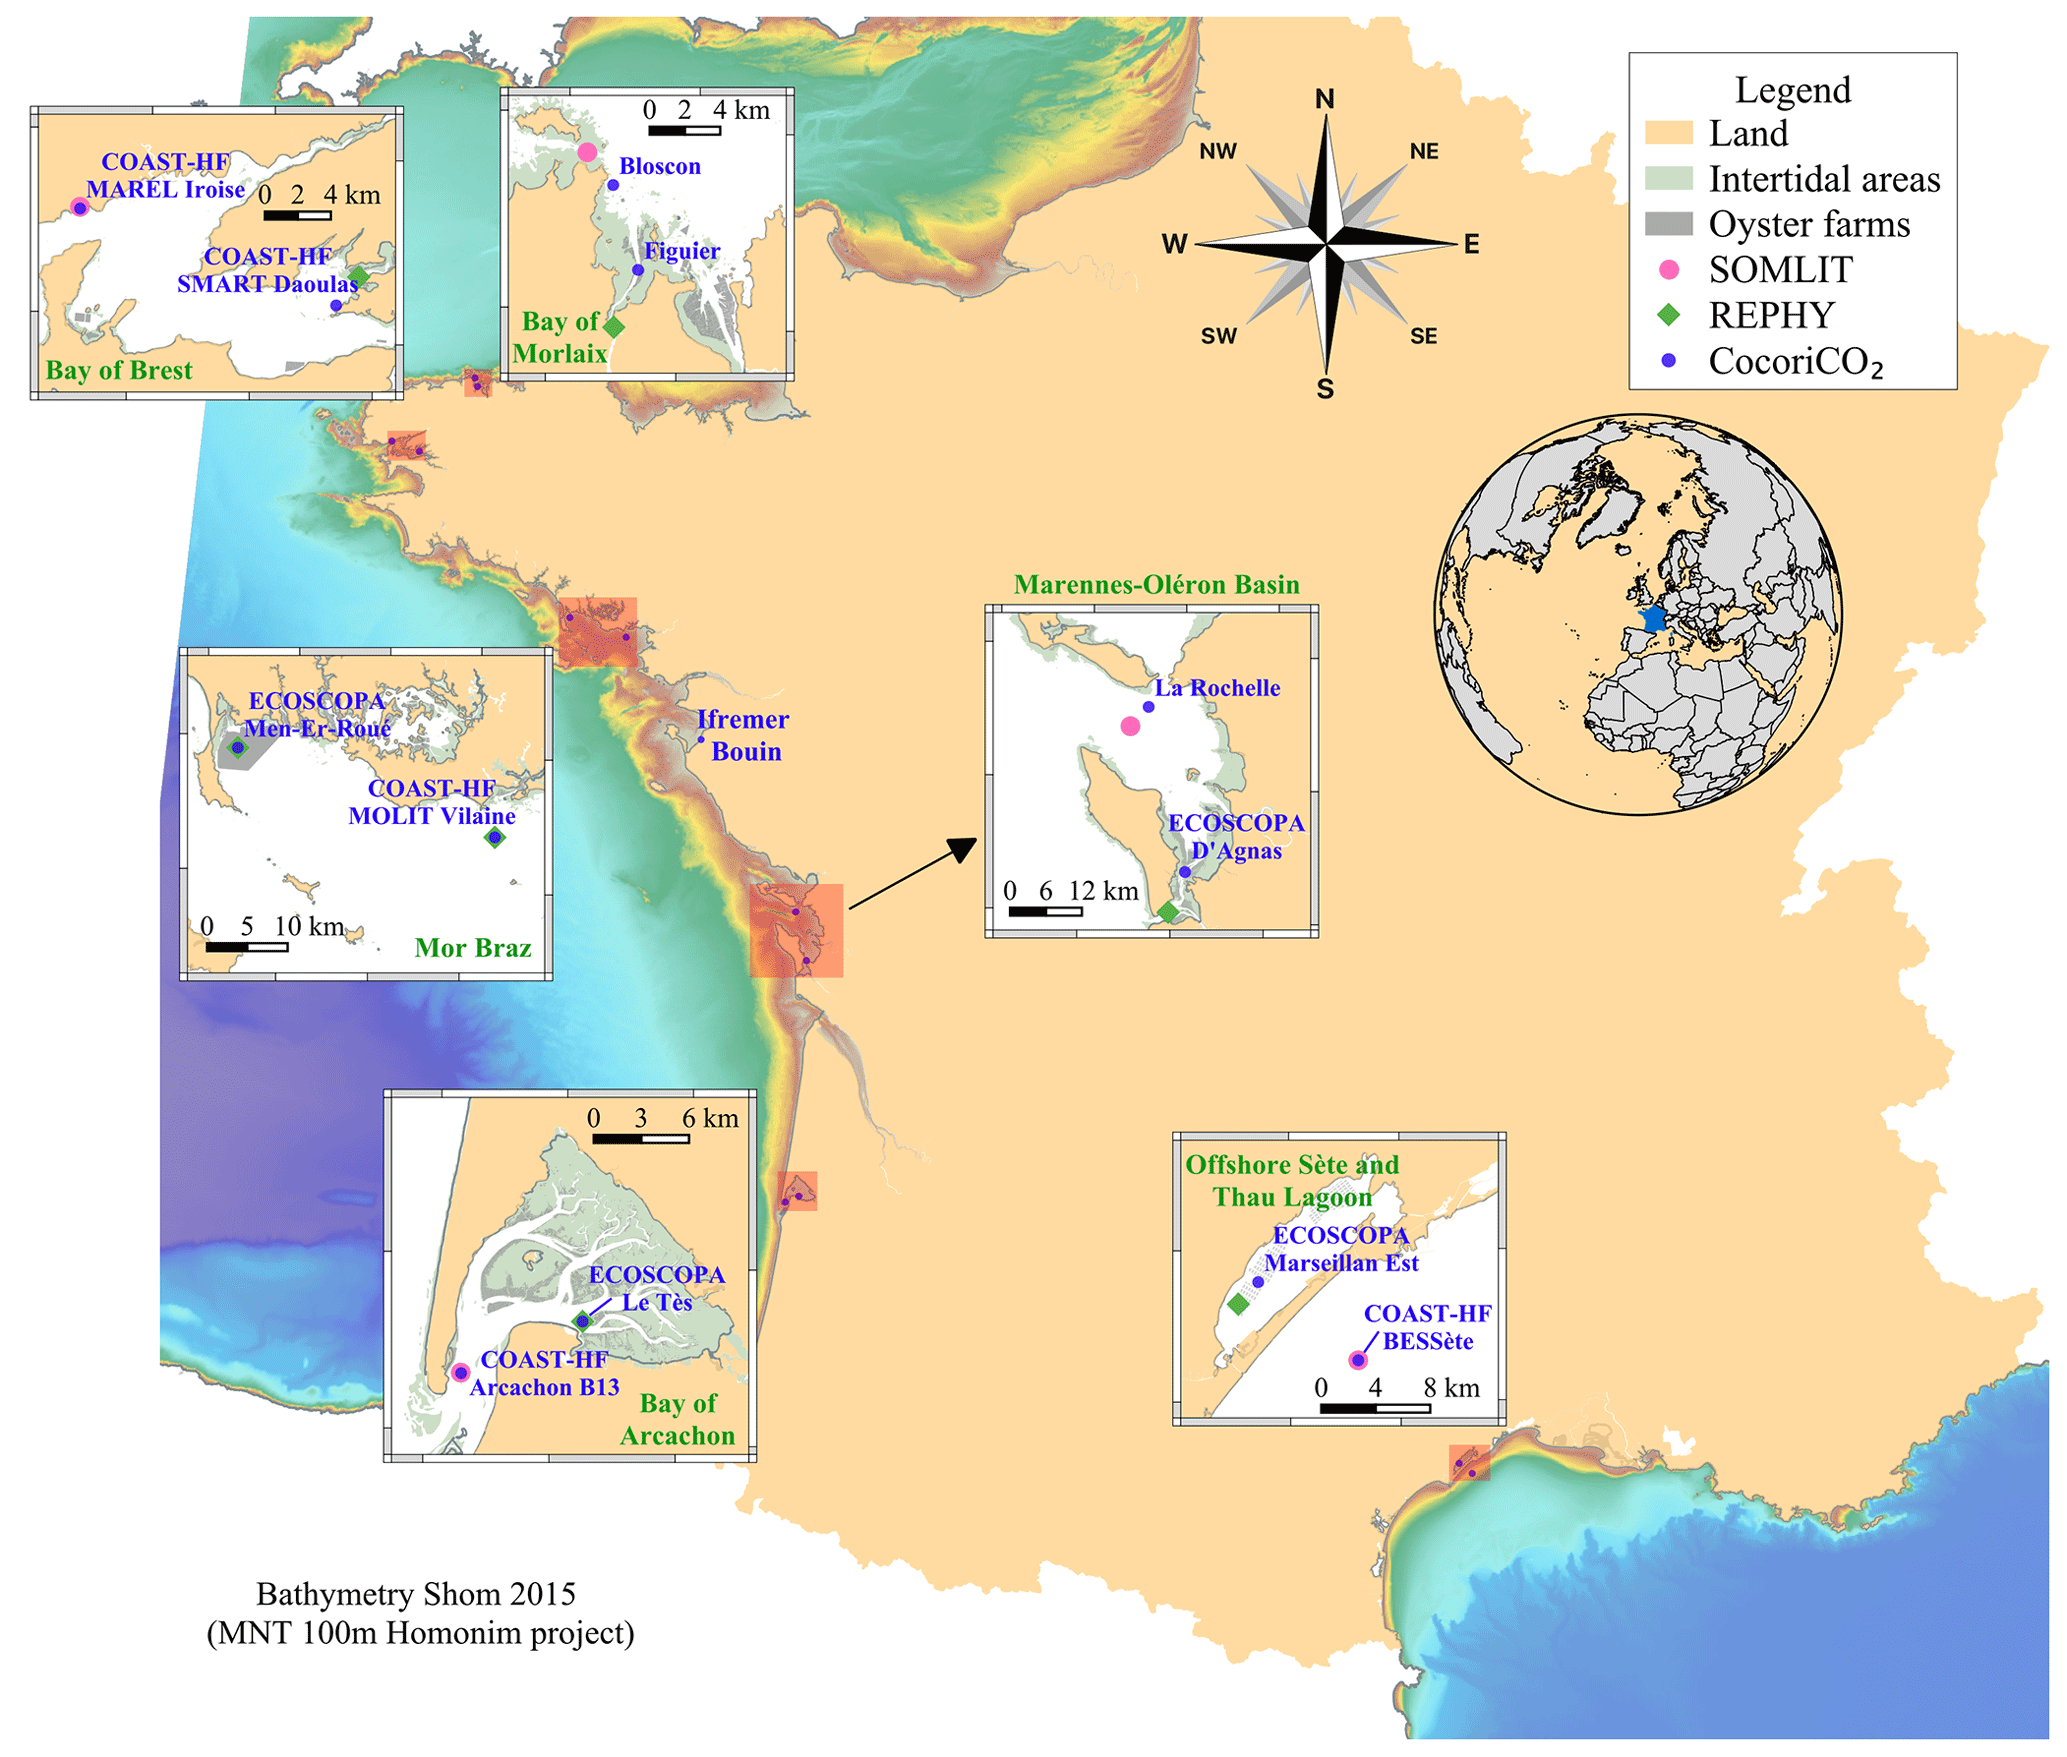
Figure 1Location of the high-frequency monitoring sites (blue dots) from the CocoriCO2 network. The pink and green dots indicate SOMLIT and REPHY low-frequency stations, respectively, from which nutrient data were acquired.
2.1.1 Bloscon and Figuier sites in the Bay of Morlaix
The Bay of Morlaix is located in the southwestern English Channel and forms a wide indentation in the north of Finistère. The hydrodynamics are governed by a strong semi-diurnal tidal cycle whose maximal range reaches 8 m. The bathymetry is characterized by shallow areas (roughly 10 m depth) and intertidal flats. It is influenced by continental freshwater inputs from two small rivers, the Morlaix and the Penzé rivers, with average flows of 4.3 and 2.8 m3 s−1, respectively (Gac et al., 2020).
The oceanic site is located at the north cardinal buoy Basse de Bloscon (48.7288° N, 3.9590° W) next to the Bloscon harbor. The probes are fixed at 4 m depth onto a stainless-steel frame attached to the mooring. The farming site is set next to the isolated hazard mark Figuier (48.6745° N, 3.9359° W) in the Penzé strait. The probes are fixed at 50 cm above the seabed onto a stainless-steel frame.
As these two sites were not part of pre-existing monitoring networks, we do not have access to any historical data that could provide us with valuable insights.
2.1.2 MAREL and SMART sites in the Bay of Brest
The Bay of Brest is a semi-enclosed macrotidal system located at the western end of Brittany. It is connected to the Iroise Sea through a 1.8 km wide by 6 km long and roughly 50 m deep inlet (called the Goulet de Brest). It undergoes strong currents due to its complex geometry and topography and is characterized by a dominant semi-diurnal tide whose maximal range reaches 7.3 m (Petton et al., 2020). As its average depth is only 8 m, the back-and-forth flow at each tide prevents stratification nearly everywhere (Le Pape and Menesguen, 1997). The hydrology is dominated by freshwater runoffs coming mostly from the Aulne, Elorn, and Mignonne rivers, with average winter flows of 54, 10, and 3 m3 s−1, respectively (Frère et al., 2017; Petton et al., 2023b).
Located at the entrance of the Bay of Brest, the oceanic site corresponds to the COAST-HF MAREL Iroise buoy (48.3580° N, 4.5515° W), which records data every 20 min at 2 m depth since 2000 (Rimmelin-Maury et al., 2020). Next to the Mignonne river mouth, the farming site is located over a native flat oyster bed on the COAST-HF SMART Daoulas buoy (48.3184° N, 4.3356° W), where parameters are monitored 50 cm over the seabed at a 15 min frequency since 2016 (Petton et al., 2021).
2.1.3 MOLIT and Men-Er-Roué sites in the Mor Braz area
This area encompasses Quiberon Bay to the west and Vilaine Bay to the east in the southern part of Brittany. The whole area is characterized by weak semi-diurnal tidal currents (average tidal range of 5 m) and is therefore subjected to stratification processes. Vilaine Bay is a shallow area (15 m) directly influenced by the Vilaine and Loire rivers with an average flow of 70 and 850 m3 s−1, respectively (Lazure et al., 2009). The Vilaine Bay has undergone eutrophication for several decades, mainly due to the high nutrient inputs from the Vilaine and Loire rivers (Ratmaya et al., 2019). Quiberon Bay is also a shallow area (10 m) exposed to the indirect freshwater inputs of the Loire and Vilaine river plumes, which generally spread on a northwestward course along the coast, particularly during early spring (Lazure and Jegou, 1998). The weak vertical mixing causes strong haline stratification (Planque et al., 2004). During thermal stratification in spring and summer, northwestern winds may induce local upwelling (Lazure and Jegou, 1998; Puillat et al., 2004).
Located at the river mouth of the Vilaine river, the oceanic site is set at the COAST-HF MOLIT-Vilaine buoy (47.4600° N, 2.6567° W), which has recorded hourly data since 2011 at surface and bottom thanks to a pumping system (Retho et al., 2022). The pH probe is deployed independently at surface level and records data at a 15 min frequency. The farming site is located next to flat oyster-farming beds, where probes are deployed over the former ECOSCOPA Men-Er-Roué site (47.5401° N, 3.0908° W) in the western part of Quiberon Bay and record data at 50 cm over the seabed at a 15 min frequency.
2.1.4 Rochelle and D'Agnas sites in the Marennes-Oléron Basin
The Marennes-Oléron Basin is the marine region of the Charente Maritime in southwestern France. It is a semi-closed shallow basin with a mean depth of 8 m. Characterized by an average tidal range of 4 m and the presence of more than 58 % of intertidal areas, the basin hosts the largest oyster production in France, covering one-third of its intertidal areas (Goulletquer and Le Moine, 2002). The basin is mainly connected to the Atlantic Ocean in the north by the Pertuis d'Antioche, a strait contained between two islands (Ile de Ré in the north and Ile d'Oléron in the southwest). The hydrology is dominated by freshwater runoffs coming from the Charente and the Seudre rivers with an average flow of 51 and 3 m3 s−1, respectively (Soletchnik et al., 1998).
Initially, the oceanic site should have been deployed in the center of Pertuis d'Antioche. However, due to the intense marine traffic and professional fishing activities, getting the authorization for a mooring buoy was delayed. It was then decided to deploy the pH probe in the La Rochelle cargo harbor (46.1594° N, 1.2393° W) at 3 m depth with a 15 min acquisition frequency. Among oyster-farming beds, probes are deployed at subsurface level with a 15 min acquisition frequency on the ECOSCOPA D'Agnas buoy at the southern part of the basin (45.8695° N, 1.1738° W).
2.1.5 BOUEE 13 and Le Tès sites in the Bay of Arcachon
The Bay of Arcachon is a semi-enclosed lagoon on the southwestern coast of France connected to the Atlantic Ocean. It has a distinctive triangular shape that encompasses a complex network of channels and intertidal flats in the inner bay (Cayocca, 2001). Intense tidal exchange occurs at the interface between the ocean and the bay, whereas the hydrodynamic exchange is weak over the intertidal areas. The tide cycle is semi-diurnal, whose maximum range reaches 4.6 m, and the mean tidal prism constitutes two-thirds of the inner volume (Plus et al., 2009). The main freshwater runoff comes from the Leyre (L'Eyre) river with a mean annual flow of 17.1 m3 s−1. The bay is an important area for oyster farming, characterized by having the most abundant larval oyster recruitment in France.
Located in the inlet, the oceanic site is set at the COAST-HF BOUEE 13 (44.6333° N, 1.2333° W), a fairway marine buoy, which has recorded data since 2017 at a 10 min frequency at subsurface level. The probes are fixed onto a stainless-steel frame attached to the buoy itself. Situated among oyster-farming beds, probes are deployed in the study site ECOSCOPA Le Tès (44.6659° N, 1.1388° W) in the eastern part of the bay and record data at 50 cm over the seabed at a 15 min frequency.
2.1.6 Thau Lagoon and offshore Sète in the Mediterranean Sea
Thau Lagoon is located on the Mediterranean coast of France and is characterized by a total area of 75 km2 and an average depth of 4 m (Fiandrino et al., 2017). The lagoon has two inlets, namely, the Sète channel to the east (responsible for 90 % of the water exchange with the Mediterranean Sea) and the Grau de Pisse-Saumes inlet to the west, which connects it to the sea. Due to the low amount of water coming from rivers and hydro-morphological profile, the process of water renewal in the lagoon is slow, taking around 133 d (Fiandrino et al., 2017). The hydrodynamics of the Gulf of Lion continental shelf located offshore is primarily influenced by wind. The farming site is located on a shellfish farming structure, and probes are deployed in the experimental breeding fixed table of the study site ECOSCOPA Marseillan (43.3790° N, 3.5715° E), in the western part of the lagoon. The data were recorded at a fixed 2 m depth below the surface at a 15 min frequency since 2012.
Located to the southeast of Thau Lagoon, the oceanic site is set at the COAST-HF BESSète (Bottom Experimental Station of Sète; 43.3267° N, 3.6617° E), which initially recorded currents and wave data to characterize storm impacts (Michaud et al., 2013). A subsurface buoy was then deployed in 2017 to survey coastal river plumes with a 15 min recording frequency. Both sites are subject to a weak tidal range (<1 m).
2.1.7 Ifremer Bouin facility
As one goal of the CocoriCO2 project is to determine the ocean acidification's effect on oyster spat, this site is equipped to allow for carbonate system estimation over the largest area of spat production in France. Environmental monitoring is set at the Ifremer Bouin Marine Mollusks Platform (46.9646° N, 2.0447° W), located on a polder next to the Bay of Bourgneuf in Vendée. It provides Ifremer laboratories with pre-grown marine mollusks for scheduled experiments in research projects. The probes are deployed at the inlet of the seawater pumping circulation system and record data at a 15 min frequency.
The polder, connected to the sea by multiple inlets, functions as a network of interconnected basins, and its water levels are influenced by tide and watershed conditions. Notably, during low-water conditions, certain basins may not experience sufficient renewal even during low tides. To address this challenge, the facility manages water levels in each basin through different bypass communications. This ensures a continuous influx of water into the facility, although seawater renewal may occur only after several tidal cycles. To prevent the SeaFET from drying, the probes are deployed in a tank situated at the entrance of the seawater pumping circulation, and they record data at a 15 min frequency.
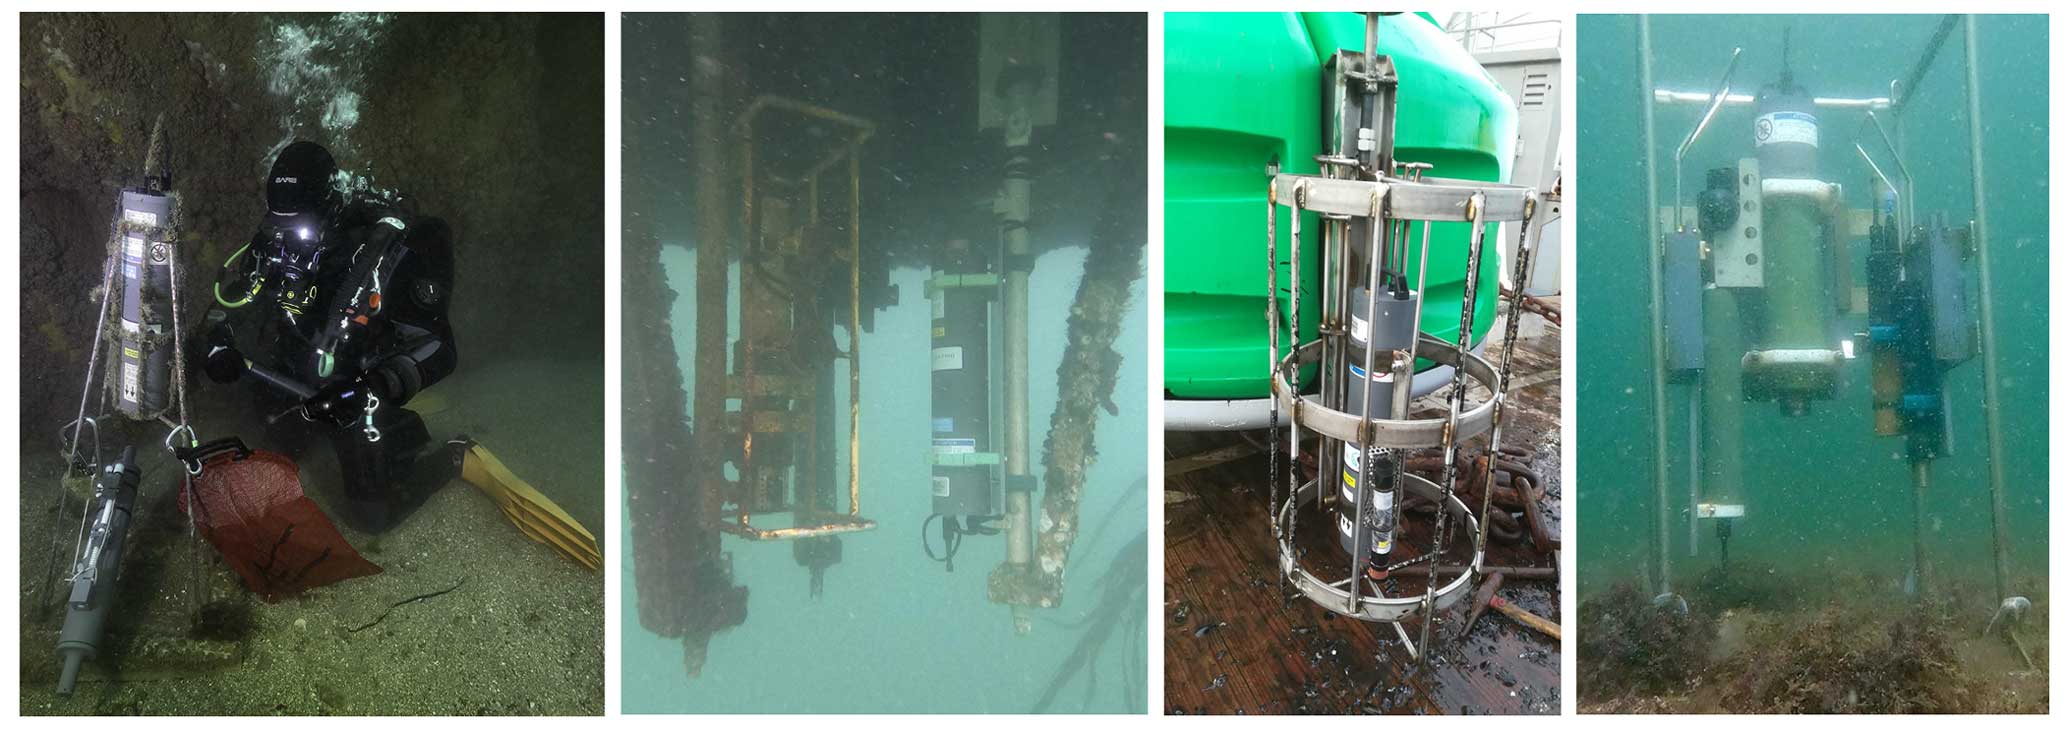
Figure 2Pictures of different setups from left to right: submarine site Figuier in the Bay of Morlaix (Wilfried Thomas, CNRS), subsurface mooring COAST-HF MAREL Iroise in the Bay of Brest (Sébastien Petton, Ifremer), subsurface buoy in ECOSCOPA D'Agnas site in the Marennes-Oléron Basin (Jonathan Deborde, Ifremer), and submarine site ECOSCOPA Men-Er-Roué in the Mor Braz area (Sébastien Petton, Ifremer).
2.2 Instrument deployments, sampling, and analytical methods
In order to assess the whole carbonate system, two of the following parameters have to be recorded: pH on the total scale (pHT), pCO2, total alkalinity (AT), and/or dissolved inorganic carbon (CT). Temperature, salinity, and pressure (in case of deep acquisition) as well as nutrient concentrations are also mandatory. The pair of AT and CT is usually considered in marine environments to reduce the overall uncertainties of the propagated parameters (Orr et al., 2018). Currently, a significant challenge lies in the absence of available in situ instruments that can measure AT or CT at high frequency. By combining high-frequency pHT and pCO2 sensors that are commercially available, it is theoretically possible to compute the whole carbonate system. However, in addition to inducing important purchase and maintenance costs, using this pair of variables leads to important propagated errors in the calculations of the other carbonate variables (Gattuso et al., 2014). Instead, as high-frequency salinity data are available at all study sites, it is possible to reconstruct high-frequency AT values from salinity–AT relationships obtained for each site and based on discrete (biweekly) sampling for both parameters. Although this workaround may require additional computation and processing, the assessment of carbonate chemistry dynamics based on pHT–AT offers an interesting solution for obtaining accurate data in the absence of AT or CT high-frequency sensors.
2.2.1 High-frequency monitoring
When the project started, only a few high-frequency probes were available to record either pHT or pCO2. They relied on either spectrophotometric measurements (SAMI-pH or SAMI-pCO2, Sunburst Sensors®) or potentiometric sensors (SeaFET V2 pH, Sea-Bird Scientific®). As the filtration system used by SAMI sensors is subjected to clogging by suspended matter and as we already had experience with SeaFET V1 (Satlantic®), the SeaFET V2 pH was chosen for monitoring pHT at high frequency for this network. Principally based on an ion-sensitive field-effect transistor (ISFET) sensor, it combines a commercially available pH DuraFET electrode (Honeywell®) and two different reference electrodes (Martz et al., 2010), referred to as internal and external. The key element is that the external electrode is sensitive to salinity and more stable than the internal one (Bresnahan et al., 2014).
Each SeaFET of the network is deployed in an autonomous mode next to a CTD probe, which is part of the following list: SMATCH MP3 or MP6 (NKE®), WiMo (NKE®), STPS (NKE®), WiSens CTD (NKE®), SBE37-SM (Sea-Bird Scientific®), and SBE37-SMP-ODO (Sea-Bird Electronics®). The acquisition frequency at each site depends on the local environmental conditions but is generally 15 min, except for COAST-HF MAREL Iroise (20 min) and COAST-HF ARCACHON Bouée 13 (10 min). A summary of the sensors used at each site, their deployment depth, acquisition frequency, the starting date of pHT measurements, and the DOI associated with the publicly available datasets are provided in Table 1. Pictures of different setups are given in Fig. 2. In most sites, instruments are deployed in a subsurface mooring mode thanks to pre-existing navigation channels or oceanographic buoys. For three of them (Figuier, COAST-HF SMART Daoulas, ECOSCOPA Men-Er-Roué), SeaFET and CTD probes are deployed on benthic metallic structures with sensors at 50 cm above seabed (Table 1).
The DuraFET component of the SeaFET sensors needs to be replaced at a frequency that varies upon the chemical composition of seawater, generally 1 year. Another drawback of this sensor is the time required for conditioning the probe when deploying at a new site. It could reach up to 5 d for the internal electrode and more than 15 d for the external one. To avoid gaps in datasets, a pre-conditioning of the sensors is done with filtered seawater taken in the field site prior to the deployment. All the technical field maintenance (sensors cleaning, data upload, SeaFET swap) is recorded in an Excel monitoring sheet for each site. The general recommendations that framed this network are detailed in Bresnahan et al. (2014).
2.2.2 Sensor maintenance and seawater sampling
Maintenance as well as in situ calibration/validation are required regularly to achieve a good quality standard for carbonate chemistry, especially in coastal areas where biofouling processes might deteriorate the signal of high-frequency probes. Only mounted with a copper guard, the SeaFET V2 pH is not sold with an active biofouling cleaning system. Each site is visited on a bimonthly to monthly basis (mainly depending on meteorological conditions) in the framework of the COAST-HF and ECOSCOPA monitoring efforts. During these visits, before cleaning the SeaFET sensor for removing biofouling and uploading data, a discrete sampling is realized next to the probe within 5 min of the programmed acquisition time. This time synchronization accuracy is needed especially for the Atlantic sites due to macrotidal forcing. Sampling is performed with Niskin bottles, and seawater is stored in two replicate 500 mL borosilicate bottles following the “Standard Operating Procedure 1” of Dickson et al. (2007). A volume of 200 µL of saturated mercuric chloride (HgCl2) is added when the sample is not analyzed within 3 h in order to limit biological activity, and bottles are sealed with Apiezon L grease. These samples are used to determine in situ pHT with an accurate spectrophotometric method in order to correct high-frequency pHT signals (see Sect. 2.3.2) and for additional AT and CT analyses (see Sect. 2.2.3). These discrete measurements are saved in an Excel monitoring sheet.
Depending on instrumentation resources of the different partners, CTD casts are performed next to the field site with other probes to check for the accuracy of temperature and salinity of the long-term deployment.
2.2.3 Laboratory analyses
The first sampling bottle is used for determining in situ pHT with a spectrophotometric method and the use of purified m-cresol purple (purchased from Robert H. Byrne's laboratory, University of South Florida), according to “Standard Operating Procedure 6b” of Dickson et al. (2007). The dye solution is prepared in high-purity deionized water at a concentration of 2 mmol L−1. Whenever possible, the analysis is performed within a few hours to limit biological activity, which could degrade measurement precision. For each sample, a minimum of three repeatability pHT measurements is realized. To check for the accuracy of spectrophotometric measurements, a Tris buffer (provided by Andrew Dickson's laboratory, Scripps University, USA, or the French National Metrology Laboratory) is used on a regular basis, and each laboratory participates in annual inter-comparison exercises (Capitaine et al., 2023). Whatever the laboratory temperature measurement is, each final result is expressed at 25 °C (pH) thanks to a numerical correction based on AT (initial estimation of the carbonate system at laboratory temperature followed by a conversion from the spectrophotometric measurement temperature to 25 °C) and saved in an Excel monitoring sheet.
The second sampling bottle is stored in the dark, at 4 °C. Then, batches of bottles collected within 6 months are sent to the SNAPO-CO2 (Service National d'Analyse des Paramètres Océaniques du CO2) at Sorbonne University in Paris, France. This laboratory is specialized in AT and CT analyses with potentiometric titration based on that of Edmond (1970) and uses the program of Dickson and Goyet (1994) for the calculation of the equivalence points. Its precision expressed by the standard deviation of triplicate measurements is less than 3 µmol kg−1 for both parameters, and its accuracy is always compared to seawater certified reference material purchased from Andrew Dickson's laboratory (Scripps University, USA). The analysis results for each sample are eventually kept depending on the SNAPO-CO2 quality flag (2: Acceptable, 3: Questionable)
Table 1Localization of the sites monitored in the CocoriCO2 network. Additional deployment information is also indicated. Low-frequency (bimonthly) nutrient data were obtained from nearby monitoring stations as part of the SOMLIT (Service d'Observation en Milieu LITtoral, INSU-CNRS) and the REPHY (Observation and Surveillance Network for Phytoplankton and Hydrology in coastal water) networks. For submarine bottom sites, “chart datum” is the lowest astronomical tide.
2.3 Data processing
2.3.1 Temperature, salinity, and nutrient databases
For COAST-HF stations, high-frequency temperature and salinity are recovered in different ways as this network does not have a unified data assembly and quality control process. The first step consists of gathering files of different sources, official CORIOLIS database (https://www.coriolis.eu.org, last access: 2 April 2024) and local files from additional spare probes, into a single one for each station. Then, based on low-frequency measurements available within REPHY and SOMLIT networks, questionable data are identified by flagging them. This last step mainly concerns salinity data. For ECOSCOPA sites and both sites located in the Bay of Morlaix, a similar approach is realized where the data acquisition relies on alternating deployment of instruments for short periods between 15 and 30 d. CTD probes are regularly calibrated either at the Ifremer Metrology Laboratory or directly at the manufacturer throughout annual maintenance. The Bouin facility processes their data and only transmits validated data.
Total concentrations of silicate, phosphorus, and ammonium are estimated upon samples taken at the nearest sampling point from either REPHY or SOMLIT networks. First, monthly climatological means are estimated for each site based on the overall dataset, and a daily climatology is created. Then, as the frequency of these data varies across sites, nutrients are linearly interpolated into the high-frequency dataset with a threshold of 30 d. If there is more than 30 d between two consecutive nutrient sampling, the daily climatology estimation is used to fill the gap.
2.3.2 Correction of the high-frequency pHT signal
The post-processing of the pH SeaFET data is directly based on discrete measurements of pHT using the spectrophotometric method (see Sect. 2.2.3) and has been well documented since the integration of the DuraFET sensor in oceanic probes (Bresnahan et al., 2014; McLaughlin et al., 2017). Briefly, the operation consists of estimating the reference potential of both internal and external electrodes at a fixed temperature (25 °C). First, temperature and salinity from the external CTD is linearly interpolated at the SeaFET data acquisition time step without temporal extrapolation. If no CTD data are available within a 6 h interval, the internal DuraFET temperature values are used and salinity is set to missing (which will result in no coherent external pH signal).
Then, the combination of corresponding raw voltage signals and spectrophotometric pHT data is used over a specific deployment period. This period should correspond to the time span when the SeaFET sensors are deployed. However, it could be shortened by the operator and depends on the in situ calibration primarily controlled by the biofouling development. If an offset appears between the SeaFET and the discrete sample, an in-depth cleaning of both sensors is required as specified by the manufacturer. This physical, sometimes chemical, operation may modify the reference potentials and therefore induce a new deployment number. In case of no available discrete sample, the Sea-Bird factory coefficients are used to estimate pHT values. This last case is rare in our dataset and happened only on a few occasions, especially at the early stage of the network. The deployment matching between SeaFET data and discrete pHT values is saved in the Excel monitoring sheet.
The last step involves the choice of the most accurate electrode according to in situ calibration. A first check is completed by focusing on the disparity in signal between both reference electrodes, which generally is the sign of biofouling development. Afterwards, it is quite simple to select the best signal over a deployment period. The last data processing step is attributing a quality flag to each pHT measurement (0: Interpolated or calculated, 1: Not evaluated, 2: Acceptable, 3: Questionable, 4: Known bad, 9: Missing value) following latest recommendations from Jiang et al. (2022).
2.3.3 Low-frequency carbonate chemistry
Based on low-frequency (bimonthly) AT and CT measurements as well as temperature, salinity, and nutrient data, computation of carbonate chemistry variables is performed using Python scripts based on the Pandas library (McKinney, 2010) with an import of the PyCO2SYS package v1.8.1 (Humphreys et al., 2022). According to the community's current best practices (Dickson et al., 2007; Orr et al., 2018), the following constants are used: carbonic acid dissociation constants K1 and K2 from Lueker et al. (2000), fluoride dissociation constant KF from Perez and Fraga (1987), and bisulfate dissociation KS from Dickson (1990). Total boron concentration is estimated from salinity using the global ratio of Lee et al. (2010). Among the output variables, computed pHT data (pHComp) are compared to direct pHT measurements using the spectrophotometric method (pHSpectro). The same flagging scheme from Jiang et al. (2022) is used.
2.3.4 High-frequency carbonate chemistry
To obtain high-frequency AT evolution, multiple regression models are used to examine the relationship between AT and temperature, salinity, ammonium, phosphorus, and silicate for each site based on discrete sampling. For each model, explanatory variables are selected based on the Bayesian information criterion (BIC) in a stepwise method. This means that explanatory variables were added into the model one by one by selecting at each step the one that minimizes the R2 and BIC. While stepwise regression may incorporate variables that appear non-significant due to its emphasis on incremental improvements in R2, alternative methods such as the LASSO (least absolute shrinkage and selection operator) technique can yield inconsistent results with our dataset. In our approach, we chose the simplest and most intuitive method. These statistical analyses are conducted using the GLMSELECT procedures of the SAS software package (SAS 9.3, SAS Institute, Carry, USA).
3.1 Data availability and quality assessments
3.1.1 Data availability
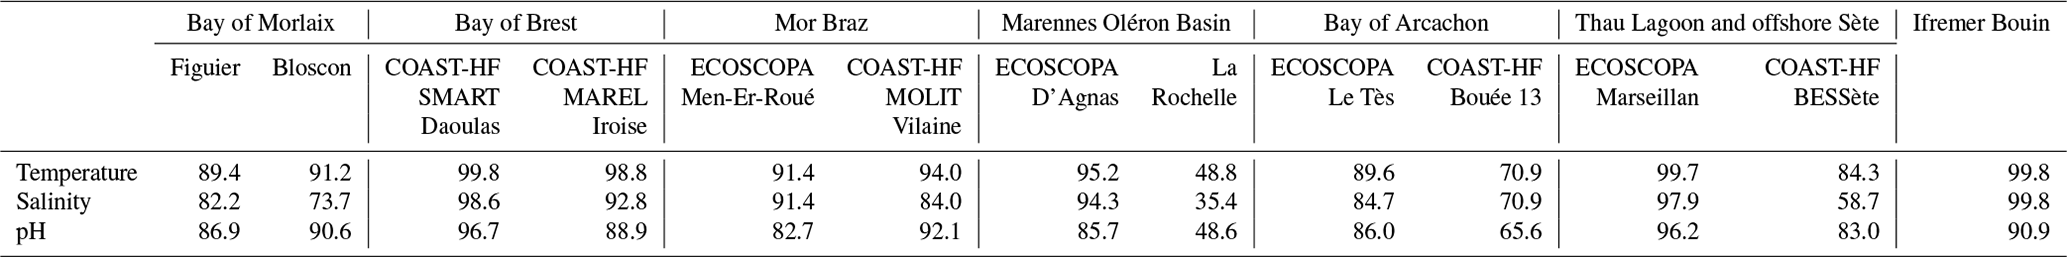
Despite the COVID-19 crisis, all sites were instrumented in early 2021 (see Table 1). Table 2 gives the ratio of available and qualified data for each site from 1 January 2021 until 31 December 2022. For the sites in the Bay of Morlaix, the installation of structures on pre-existing channel buoys delayed the start of monitoring until March 2021 (10 % data lost). Similarly, for the site offshore of La Rochelle, authorization requests proved to be complex due to various maritime concerns (ferry and cargo navigation, trawler fishing zone, etc.), resulting in a 1-year delay (50 % data lost). An additional constraint of coastal environmental monitoring is the professional and recreational maritime traffic. The two buoys in the Bay of Arcachon have directly experienced these issues, with several collision events causing, in the worst cases, disruptions to the moorings and destruction of the high-frequency sensors.
Otherwise, the main issue leading to data invalidation remains the development of biological fouling. Since the SeaFET is only equipped with a passive protective system using a perforated copper cap, degradation in both electrode signals were observed during the first 15 d, and a bimonthly manual cleaning frequency was not sufficient. The rate of data loss demonstrates random fluctuations depending on sites and encountered environmental conditions, with a variability that differs from year to year. In order to alleviate these biofouling problems, the SeapHOx (Sea-Bird®) system (SeaFET connected to an CTD SBE37) was tested in the Bay of Quiberon farming area, but its pumping system clogs during events of slightly turbid water. Nevertheless, it is worth noting that percentages of available and qualified data (flag 2) are comparable to those of temperature and salinity measurements in the different sites.
Table 2Percentage of available and validated high-frequency data for each station between 1 January 2021 and 31 December 2022.
3.1.2 Low-frequency data quality
Following the Global Ocean Acidification Observing Network (GOA-ON; http://www.goa-on.org/, last access: 2 April 2024) requirements and governance plan (Newton et al., 2015), measurements of carbonate chemistry parameters must be associated with maximal uncertainties in order to reach a “weather” or a “climate” goal. The former implies an uncertainty of ∼ 10 µmol kg−1 in AT and CT and 0.02 in pHT. It is defined as a set of measurements of a quality that is sufficient to identify relative spatial patterns and short-term variations, supporting mechanistic responses to the impact on local, immediate ocean acidification dynamics. The climate goal is more ambitious and is defined as a set of measurements of a quality that is enough to assess long-term trends with a defined level of confidence, supporting detection of the long-term anthropogenically driven changes. It implies an uncertainty of ∼ 2 µmol kg−1 in measurements of AT and CT (∼ 0.1 %) and 0.003 units in pHT.
Direct pHT measurements using the spectrophotometric method provide results associated with uncertainties ranging between 0.001 and 0.01 (minimum of three analytical replicates), depending on the laboratory in charge of the measurements and the period of analysis. The maximum repeatability of AT and CT measurements from the SNAPO-CO2, flagged as “2: Acceptable”, remains below the uncertainty level of 0.15 %. Based on these considerations, our collected data based on direct measurements meet the weather quality objective.
Following Orr et al. (2018), the average uncertainties of the derived carbonate parameters are estimated with PyCO2SYS using forward finite-differences for the discrete samples. With overall accuracies of 0.1 °C and 0.5 for temperature and salinity (COAST-HF and ECOSCOPA validated accuracy), respectively, as well as 4 µmol kg−1 for silicate, 0.1 µmol kg−1 for phosphorus, and 0.1 µmol kg−1 for ammonia (provided by REPHY and SOMLIT networks), the uncertainties associated with the use of the low-frequency AT–CT pair (uncertainties of 2 µmol kg−1 for both variables) are 2.75 × 10⁻¹⁰ mol H+ (about 0.013 units pHT), 15 µatm pCO2, 0.12 unit for the aragonite saturation state, and 0.18 for the calcite saturation state. Propagation of uncertainties was performed using the standard uncertainties in the equilibrium constants and total borate concentrations (Orr et al., 2018). Again, the propagated uncertainties for pHT meet the weather quality objective.
Another way to check the quality of low-frequency carbonate chemistry assessments is to compare pHT analyzed using the spectrophotometric method (pHSpectro), and computed from AT–CT measurements (pHComp), both based on synchronized sampling on each site. Figure 3 shows these comparisons and the linear relationships established from aggregated farming and oceanic sites at each site. Analyzed and computed pHT data from the Bay of Brest, Mor Braz and Mediterranean sites exhibit very good agreement (r2>0.98, p<0.001). In contrast, samples from the Bay of Morlaix present poor correlation with large differences that can reach up to 0.1 pHT unit. The laboratory involved in this site has also directly measured AT within 2 weeks of sampling in order to compare with measurements obtained from the SNAPO-CO2. The difference between these measurements ranges between −41.9 and 48.7 µmol kg−1. These proven inconsistencies highlight conservation issues due to a lengthy storage period (more than 1 year for all samples; flagged as “3: questionable”), however this issue is still under investigation. Samples from the last two regions (Marennes-Oléron basin and Bay of Arcachon) reveal differences only for specific dates. Because of its random nature, we clearly suspect a discrepancy in numerical estimation due to the lack of consideration of organic alkalinity in these mesotrophic sites but, again, this requires more investigation.
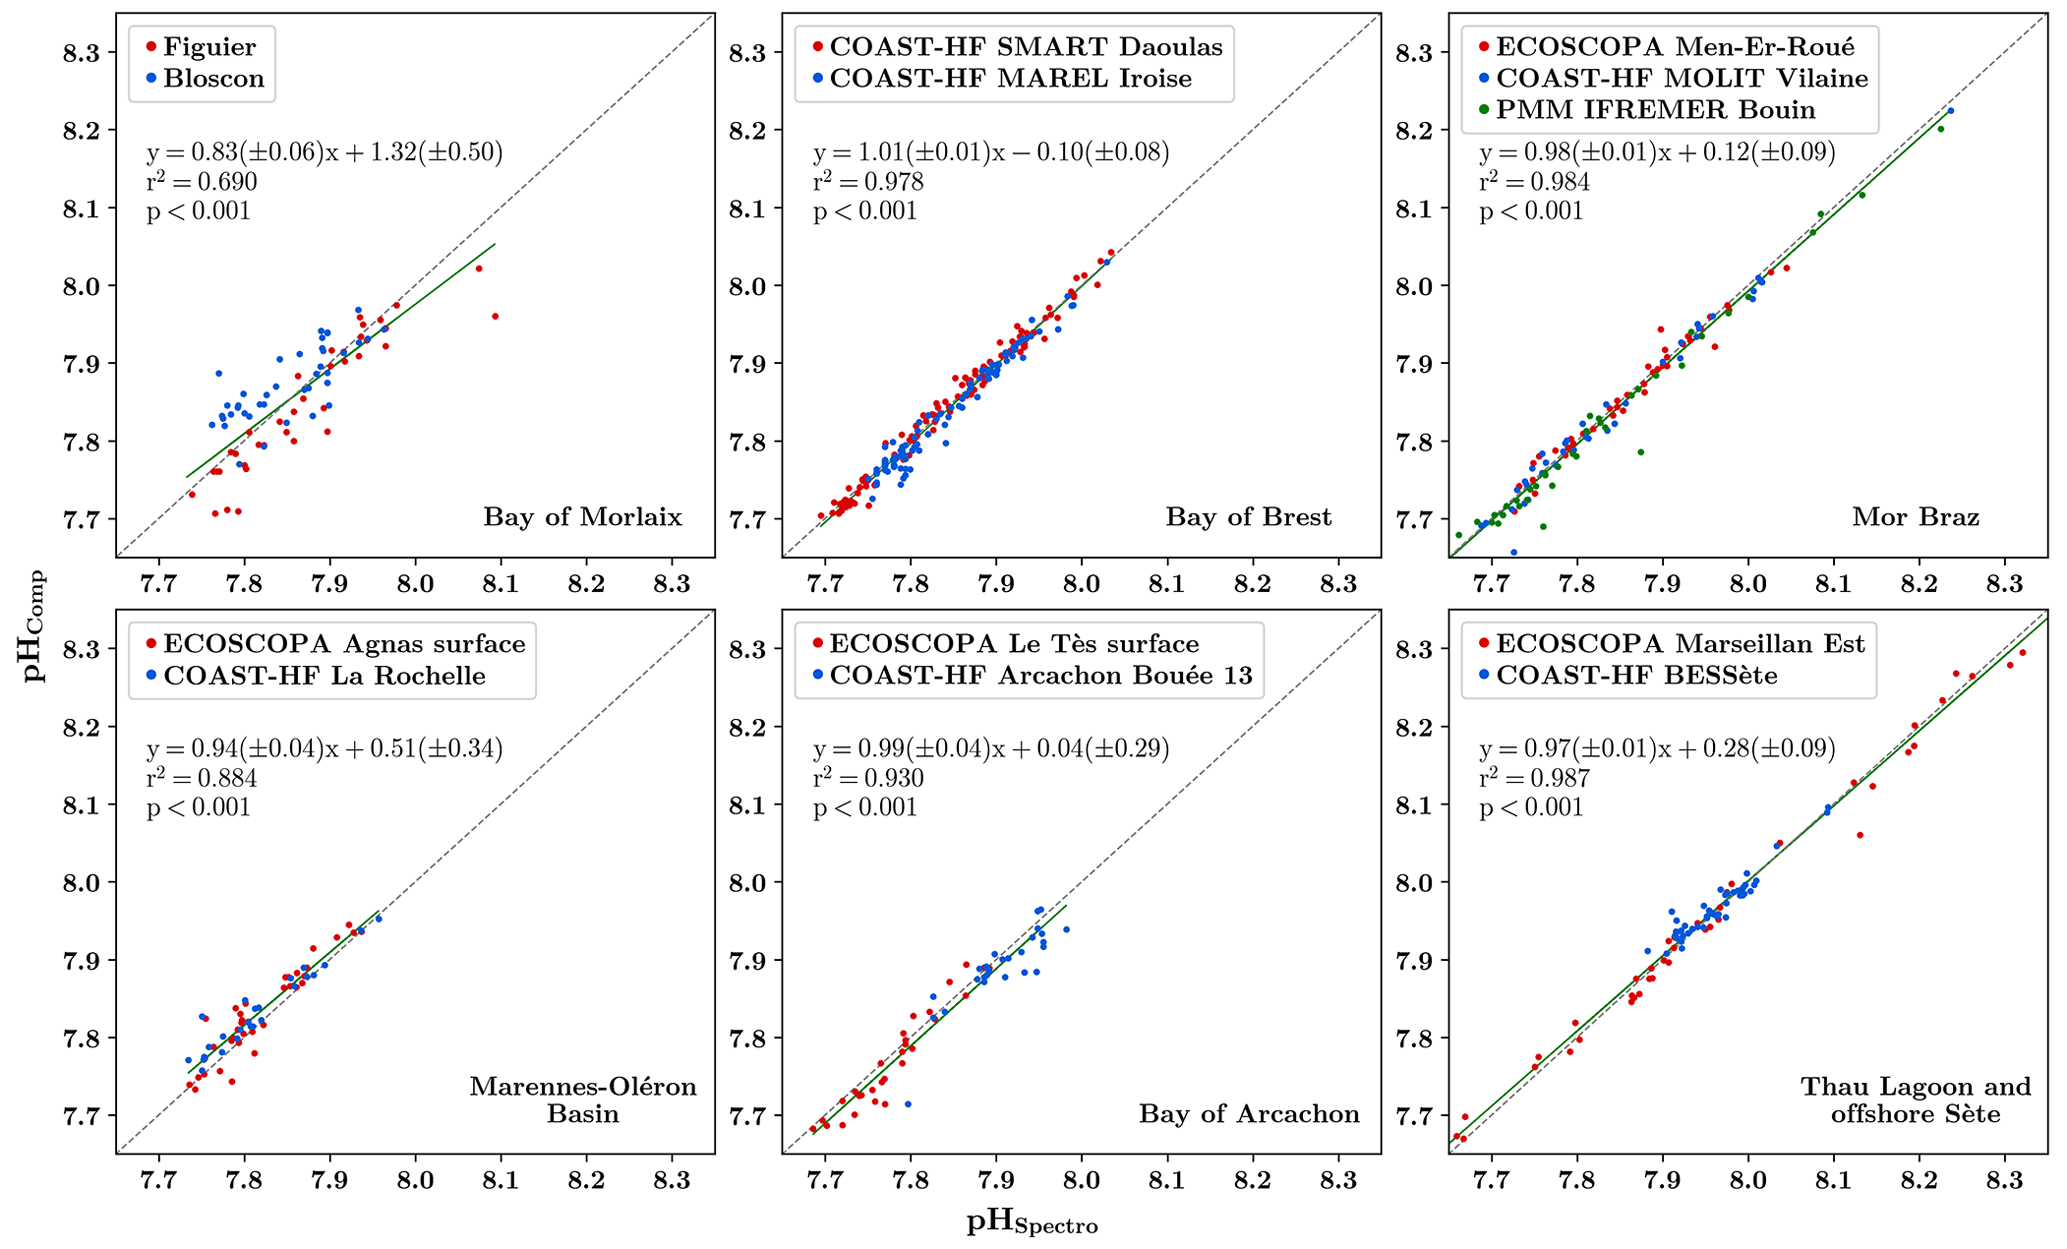
Figure 3Comparison of spectrophotometric pHT (pH on the total scale) measurements (pHSpectro) with numerical pH estimation based on total alkalinity and dissolved inorganic carbon measurements (pHComp) in the six different regions (red dots refer to farmed sites and blue dots to oceanic sites). The obtained linear relationship is represented by a solid green line, and the regression coefficient (r2) is indicated and the p value are indicated. The dashed black line represents the 1:1 relationship.
3.1.3 High-frequency data quality
As prescribed by McLaughlin et al. (2017), the typical offset between spectrophotometric reference samples and the corrected SeaFET pHT time series must range between −0.02 and 0.02 pHT units. The corrected SeaFET data demonstrate strong agreement with the discrete spectrophotometric measurements, as illustrated in Fig. 4. The relationships between spectrophotometric pHT and SeaFET pH, both at in situ temperature and at 25 °C, are highly significant, exhibiting r2 values greater than 0.99 (p value <0.001). Due to the complexity of high-frequency monitoring and the multiple possible biases (temperature and conductivity sensors, time synchronizing error, numerical uncertainties in correction method, biofouling development, etc.), the final processed pHT signal fulfills the weather quality objective with an uncertainty of 0.02.
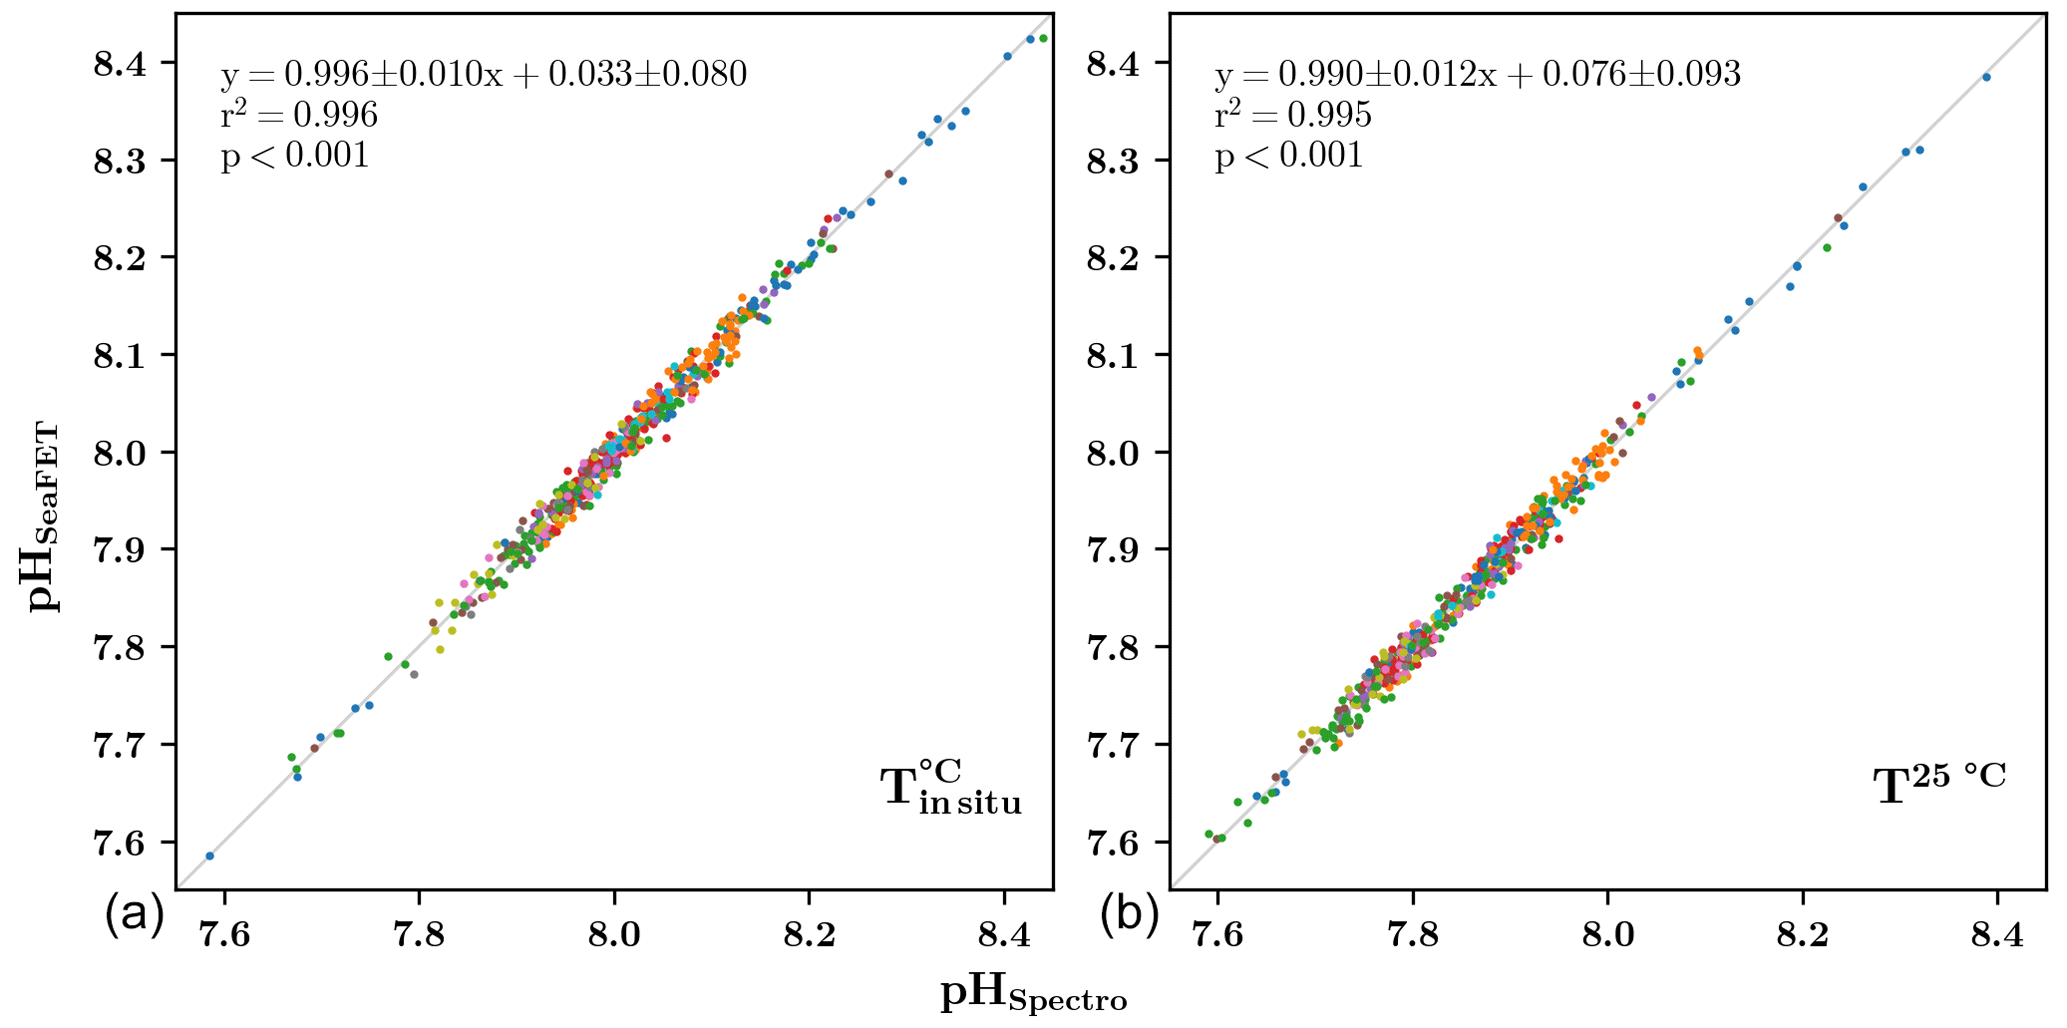
Figure 4Comparison of chosen pHT (pH on the total scale) corrected SeaFET signal (pHSeaFET) versus spectrophotometric measurements (pHSpectro) at in situ temperature (a) and at 25 °C (b). The color represents a unique site and the grey line represents the 1:1 relationship.
3.2 Low-frequency total alkalinity and dissolved inorganic carbon variations in the different study sites
AT and CT data from discrete samples analyzed at the SNAPO-CO2 analytical platform are shown in Fig. 5 (n=641). Across regions, they exhibit various levels and seasonal ranges. Atlantic offshore sites present roughly similar AT and CT values with an overall means of 2322 ± 330 and 2127 ± 315 µmol kg−1. The largest seasonal variations for Atlantic offshore sites are observed on the COAST-HF MOLIT Vilaine site (Mor Braz) as a consequence of the seasonal strong runoff from the Vilaine and Loire rivers at this site (salinity range of 15). Among offshore areas, the Mediterranean site presents the highest level of AT and CT (2581 ± 81 and 2288 ± 87 µmol kg−1, respectively) as a consequence of higher salinity levels than in the Atlantic (37.2 ± 1.5 vs. 33.6 ± 1.5). With the exception of the Mor Braz area (i.e., strong influence of the Vilaine and Loire rivers on the salinity of the offshore site), farming sites generally present lower levels of both AT and CT compared to oceanic sites, generally related to lower salinity levels.
Regarding seasonal variations, the highest ranges in both AT and CT are found in the most enclosed areas of the network, the Bay of Arcachon and Thau Lagoon. While the influence of freshwater runoff explains the wide ranges of salinity as well as AT and CT changes in the Bay of Arcachon, the situation is opposite in Thau Lagoon where summer evaporation engenders the maximum salinity of 41, driving strong increases in both AT and CT in this area. It is worth noting that larger ranges in CT than in AT in Thau Lagoon suggest a significant additional impact of biology (photosynthesis or respiration) on carbonate chemistry (see Sect. 3.3).
The shore-based Bouin site also presents among the highest values of the dataset with large seasonal variations both for AT and CT (2367 ± 489 and 2182 ± 472 µmol kg−1, respectively). The calcium concentration observed in the soil composition in Vendée (Hájek et al., 2021) is a plausible explanation for these data patterns.
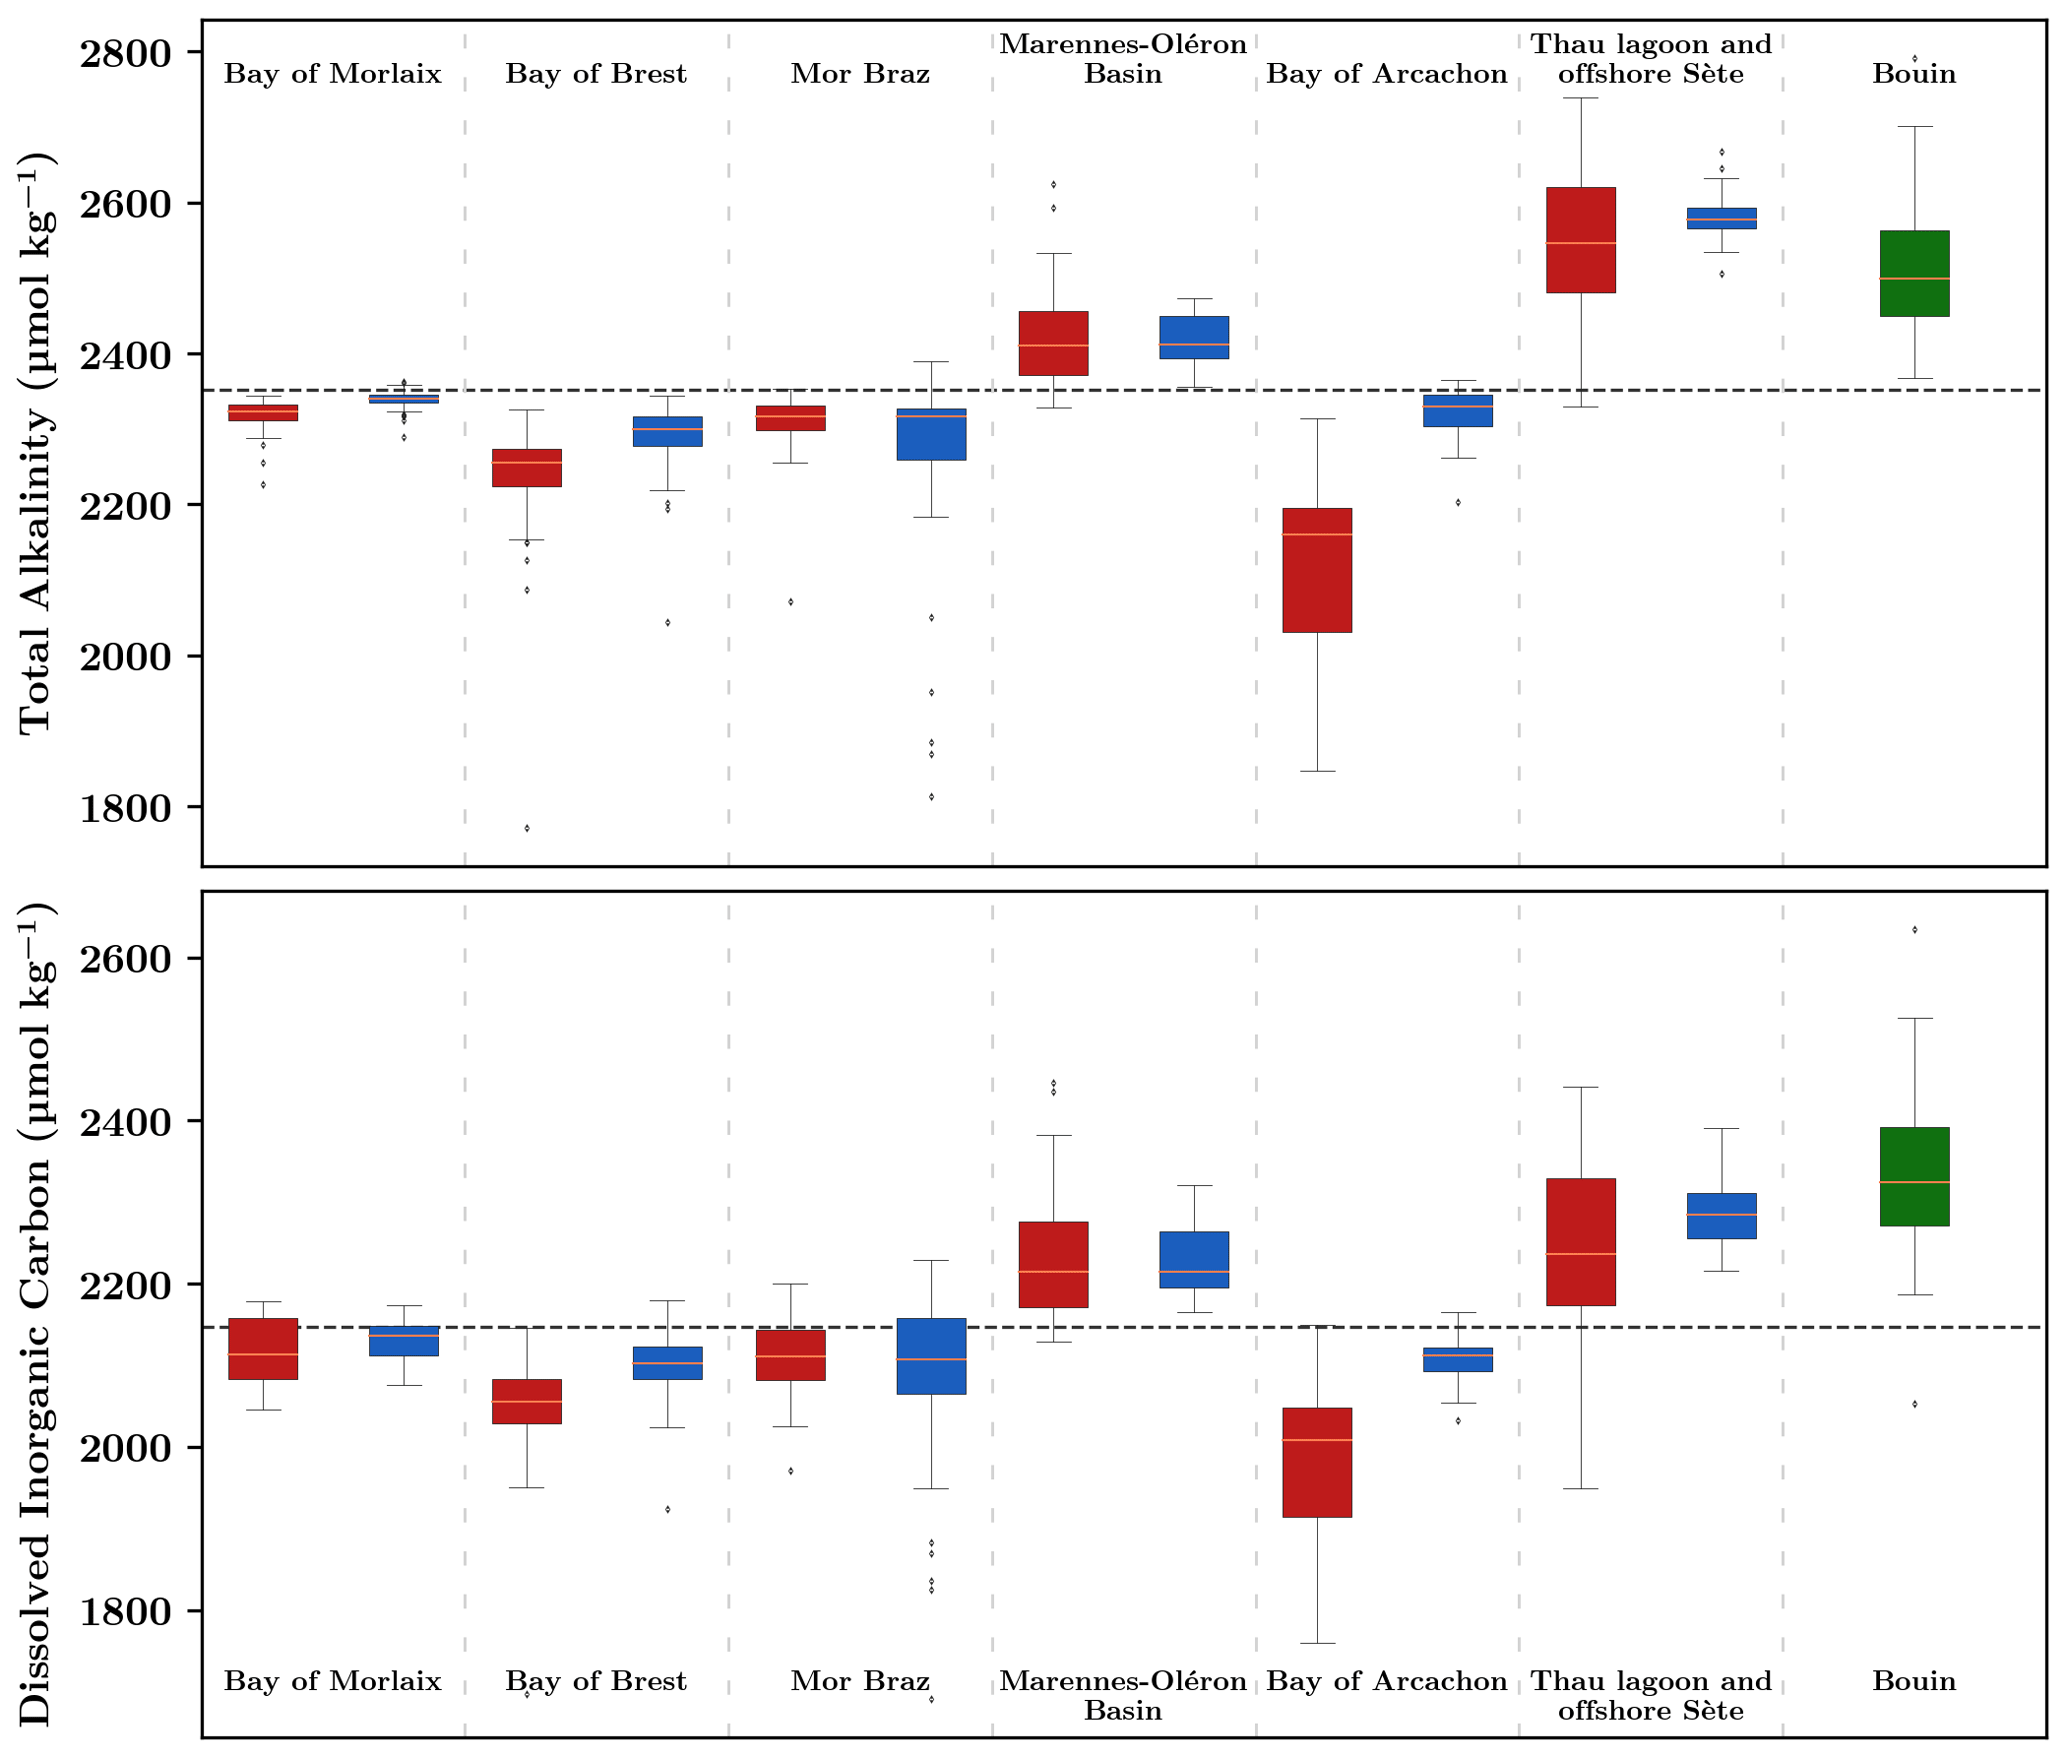
Figure 5Distribution of total alkalinity (AT) and dissolved inorganic carbon (CT) concentrations obtained from discrete sampling in farming (red) and oceanic sites (blue). The Ifremer Bouin oyster growth facility is shown in green. The dashed horizontal black line corresponds to the average value of the whole dataset ( µmol kg−1 and µmol kg−1). Each box displays the quartiles (25 % and 75 %) of the dataset, with the median indicated by an orange line. The whiskers extend to illustrate the remaining distribution, reaching 1.5 times the inter-quartile range, with the exceptions for points identified as outliers. Regions are arranged from north to south except for the Bouin site.
3.3 High-frequency pHT variations in the different study sites
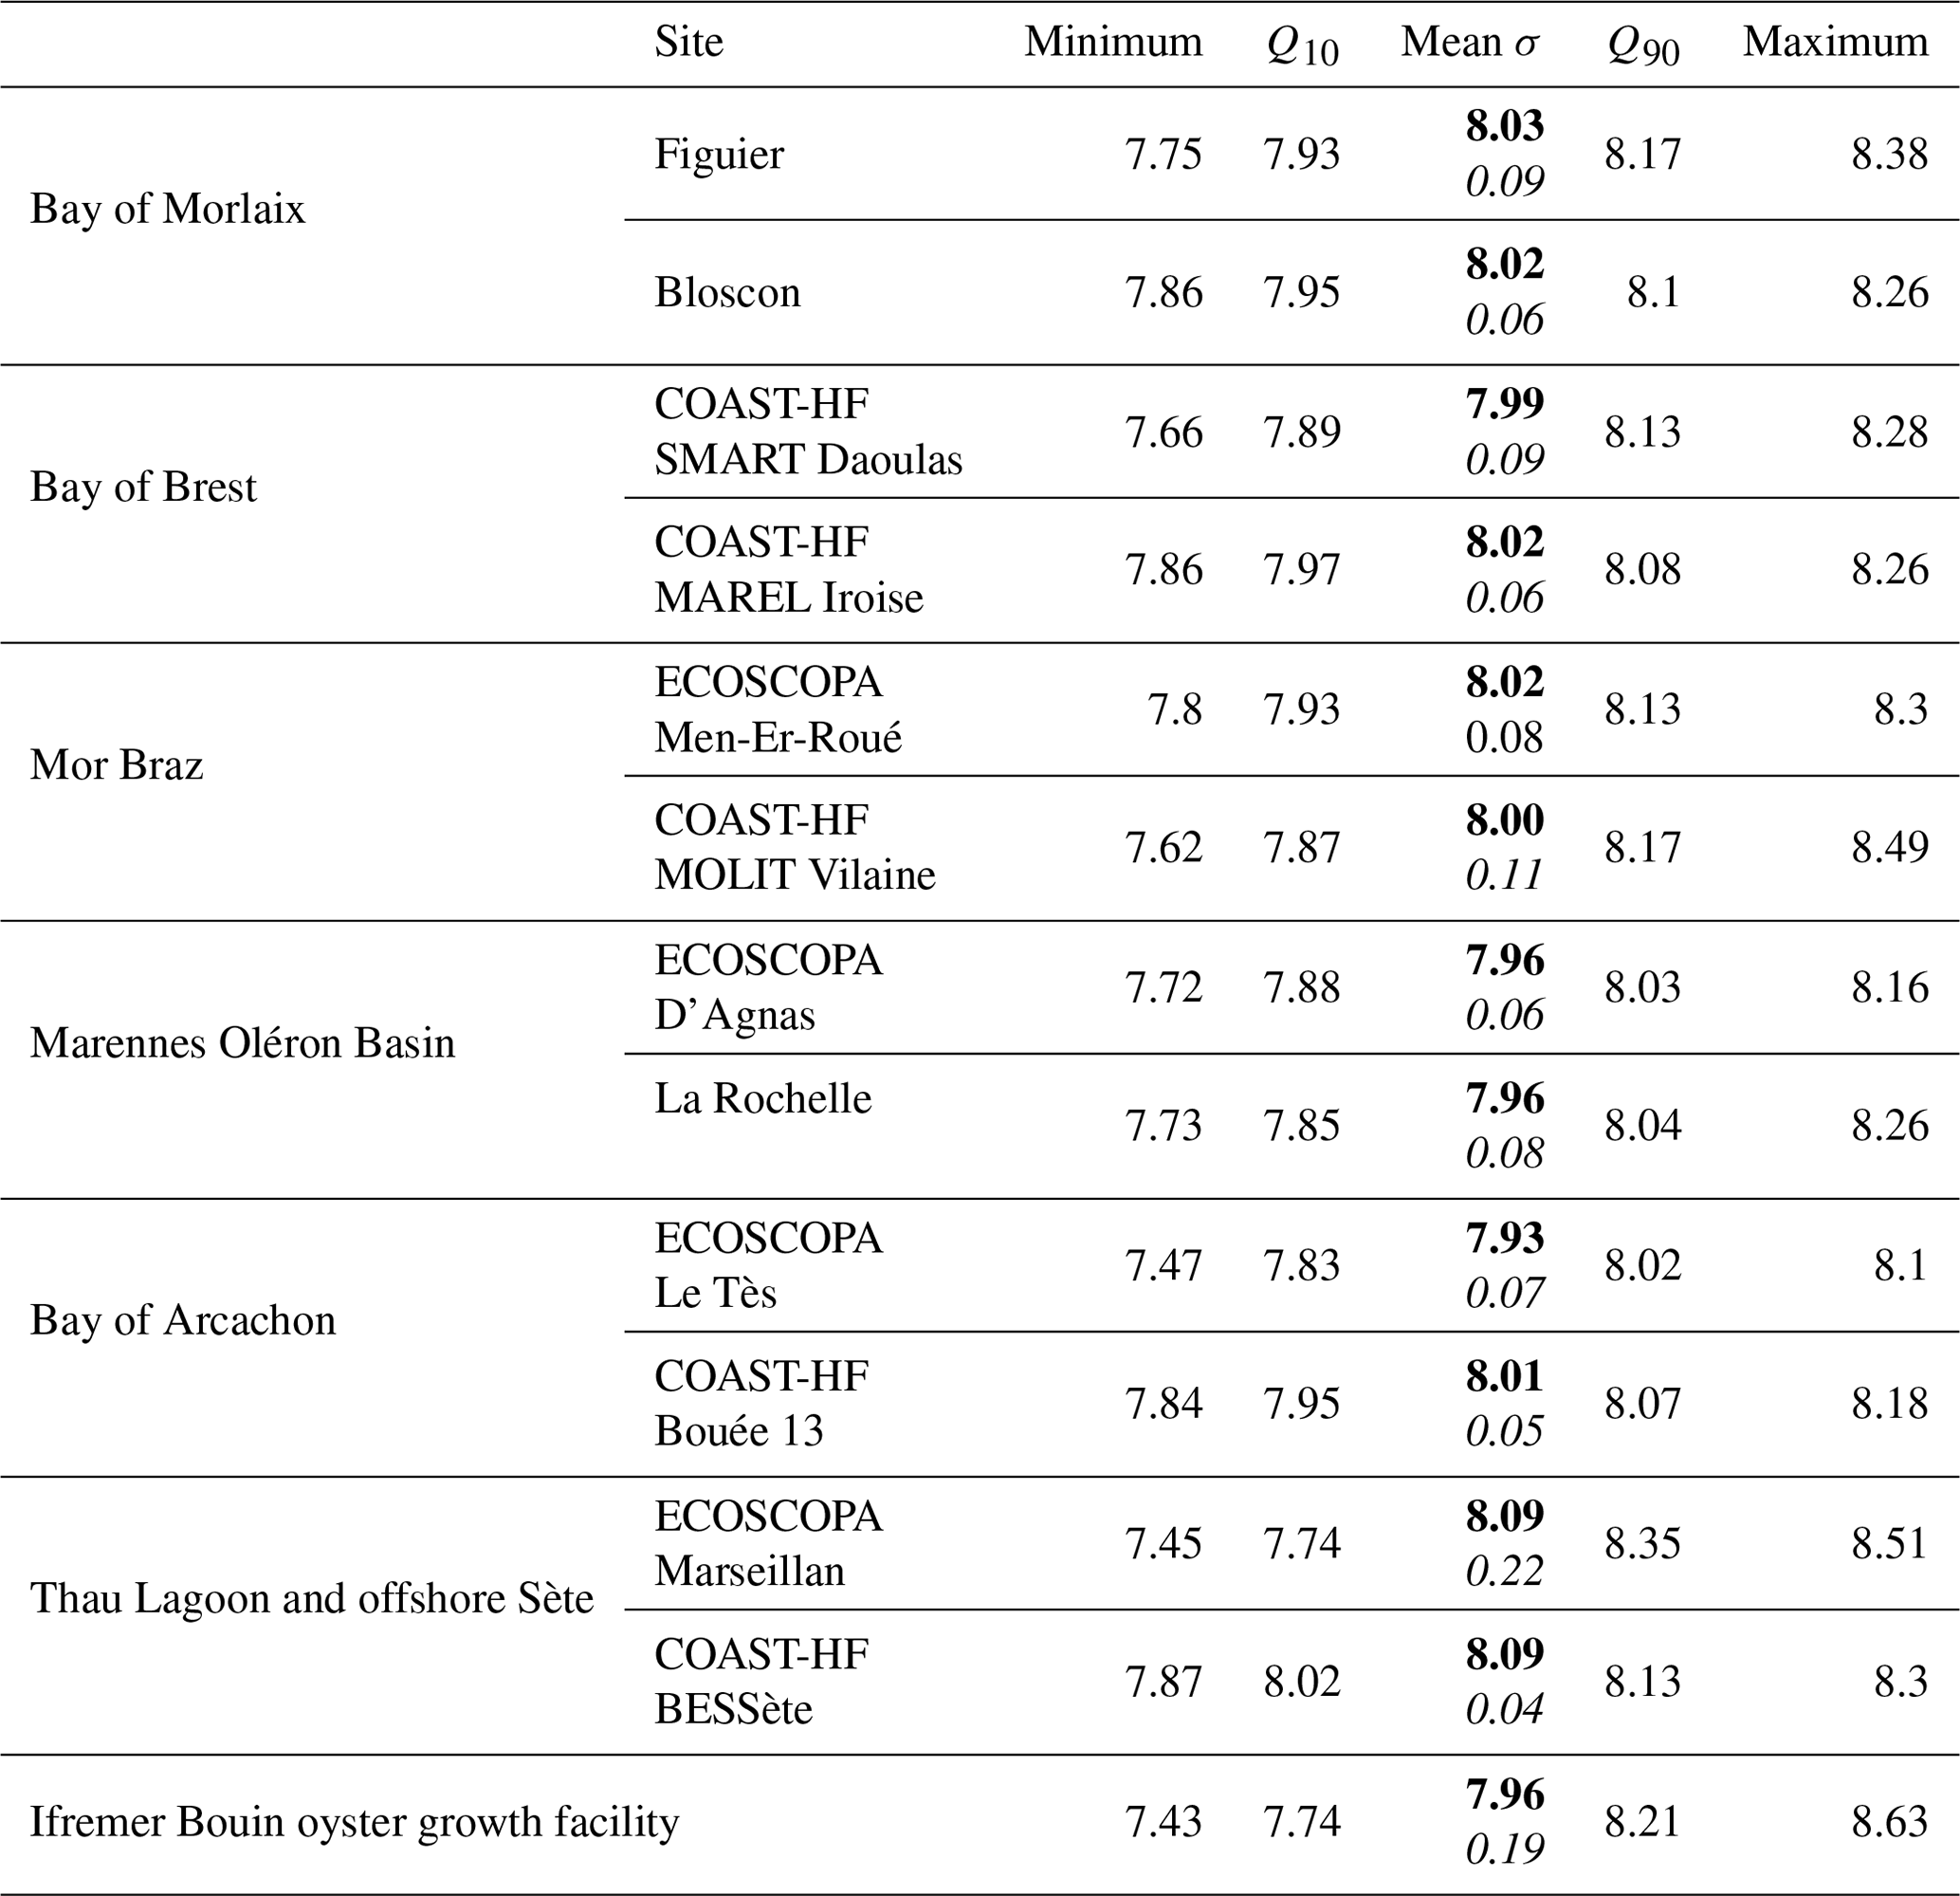
High-frequency pHT measurements together with discrete (spectrophotometric) pHT measurements acquired from January 2021 to December 2022 at all sites are shown in Fig. 6. Offering an insightful statistical summary, Table 3 provides a site-specific analysis based on data acquired during this period. The differences observed among regions can be attributed to their unique hydrological and geographical characteristics. The highest average pHT levels are measured on both sites (farming and offshore) located in the Mediterranean Sea (pHT∼ 8.09), while the lowest is measured inside the Bay of Arcachon, presenting the highest difference in mean pHT between the farming and the oceanic sites in our network (pHT 7.93 vs. 8.01, respectively). At the exception of the Bay of Arcachon, farming and oceanic sites do not present strong differences in their overall mean pHT level, but farming sites generally present a larger seasonal amplitude (Table 3). The largest differences in seasonal amplitude between farming and oceanic sites are observed in the Mor Braz, the Bay of Arcachon, and the offshore Sète in the Mediterranean area. It was already mentioned that the oceanic site in the Mor Braz is much more influenced by the Vilaine and Loire rivers than the farming site, resulting in overall lower salinity and pHT levels as well as stronger seasonal changes in these variables due to freshwater runoff. In contrast, in the Bay of Arcachon, lower levels and amplitude of pHT variations are observed inside the bay at the farming site. Thau Lagoon is by far the site experiencing the largest seasonal pHT variations, with a maximum reached in April (pHT∼ 8.51) and a minimum in September (pHT ∼ 7.45). In this region, differences between the farming and offshore sites can be explained by the location of the farming site within Thau Lagoon, exhibiting weak eutrophic to oligotrophic conditions, in contrast to the BESSète site subjected to oligotrophic conditions in the Mediterranean offshore waters although transient changes in pHT can be observed as a consequence of the influence from the Rhône and Hérault rivers. The Bouin facility undergoes two different annual cycles shaped by the specific demands of the nursery. Water introduced through pumping into various basins experiences renewal time within different periods ranging from days to months, contingent on hydrological watershed conditions. In all sites, pHT normalized at 25 °C (pH; data not shown) reveals that most of the observed seasonal variations are independent of temperature but more likely reflect changes in water masses and in the biological balance between autotrophy and heterotrophy.
Farming sites generally show more pronounced daily (24 h) variations, which also include tidal variations. This phenomenon is attributed to stronger terrestrial runoff impacts and/or more intense biological activities (i.e., net community production and/or net calcification) in these locations. It is interesting to note that regions such as the Bay of Morlaix, the Bay of Brest, and the Marennes-Oléron Basin (characterized by low freshwater runoff) display comparable daily average pHT levels between the oceanic and farming sites, except during summer when biological activities are more intense. For instance, the farming site Figuier (Bay of Morlaix) displays a maximum daily variation of 0.15 pHT in July, a value 2 times larger than that observed at the offshore Bloscon site (0.07 pHT). Similarly, the Bay of Brest shows greater daily variations during the biologically productive periods, particularly from spring to autumn. The farming site SMART Daoulas shows an average daily pHT variation of 0.11 unit during this period, while the offshore MAREL Iroise site records a lower maximum variation of 0.06 pHT during the springtime. In the Mediterranean Sea, daily variations within the lagoon remain relatively modest, peaking only at 0.09 in September, just after intense phytoplankton bloom events. Again, the Mor Braz case stands out due to the influence of the Loire river, which brings large amounts of nutrients and thus induces phytoplankton blooms, at the oceanic site MOLIT Vilaine. It results in significant pHT variations, particularly noticeable over 15 d periods in July 2021 and June 2022, reaching up to 0.14 units. Conversely, the farming site in the Bay of Quiberon displays varying hydrological conditions depending on climatic patterns, with major daily variations reaching up to 0.08 pHT in summer. In the Bay of Arcachon, the disparities between the farming and offshore sites can be attributed to the existing salinity gradient from the coast to the offshore, alongside a noticeable dependency on the semi-diurnal tidal cycle. The average pHT at the farming site consistently remains slightly lower than the offshore counterpart (−0.08 pHT), with the most significant daily variations recorded across the network, reaching 0.17 pHT during biologically productive periods. Finally, as a consequence of the longer water renewal time, at the Bouin hatching facilities, the daily variations in pHT are high all year round with a peak in August during the biologically productive period (0.15 pHT).
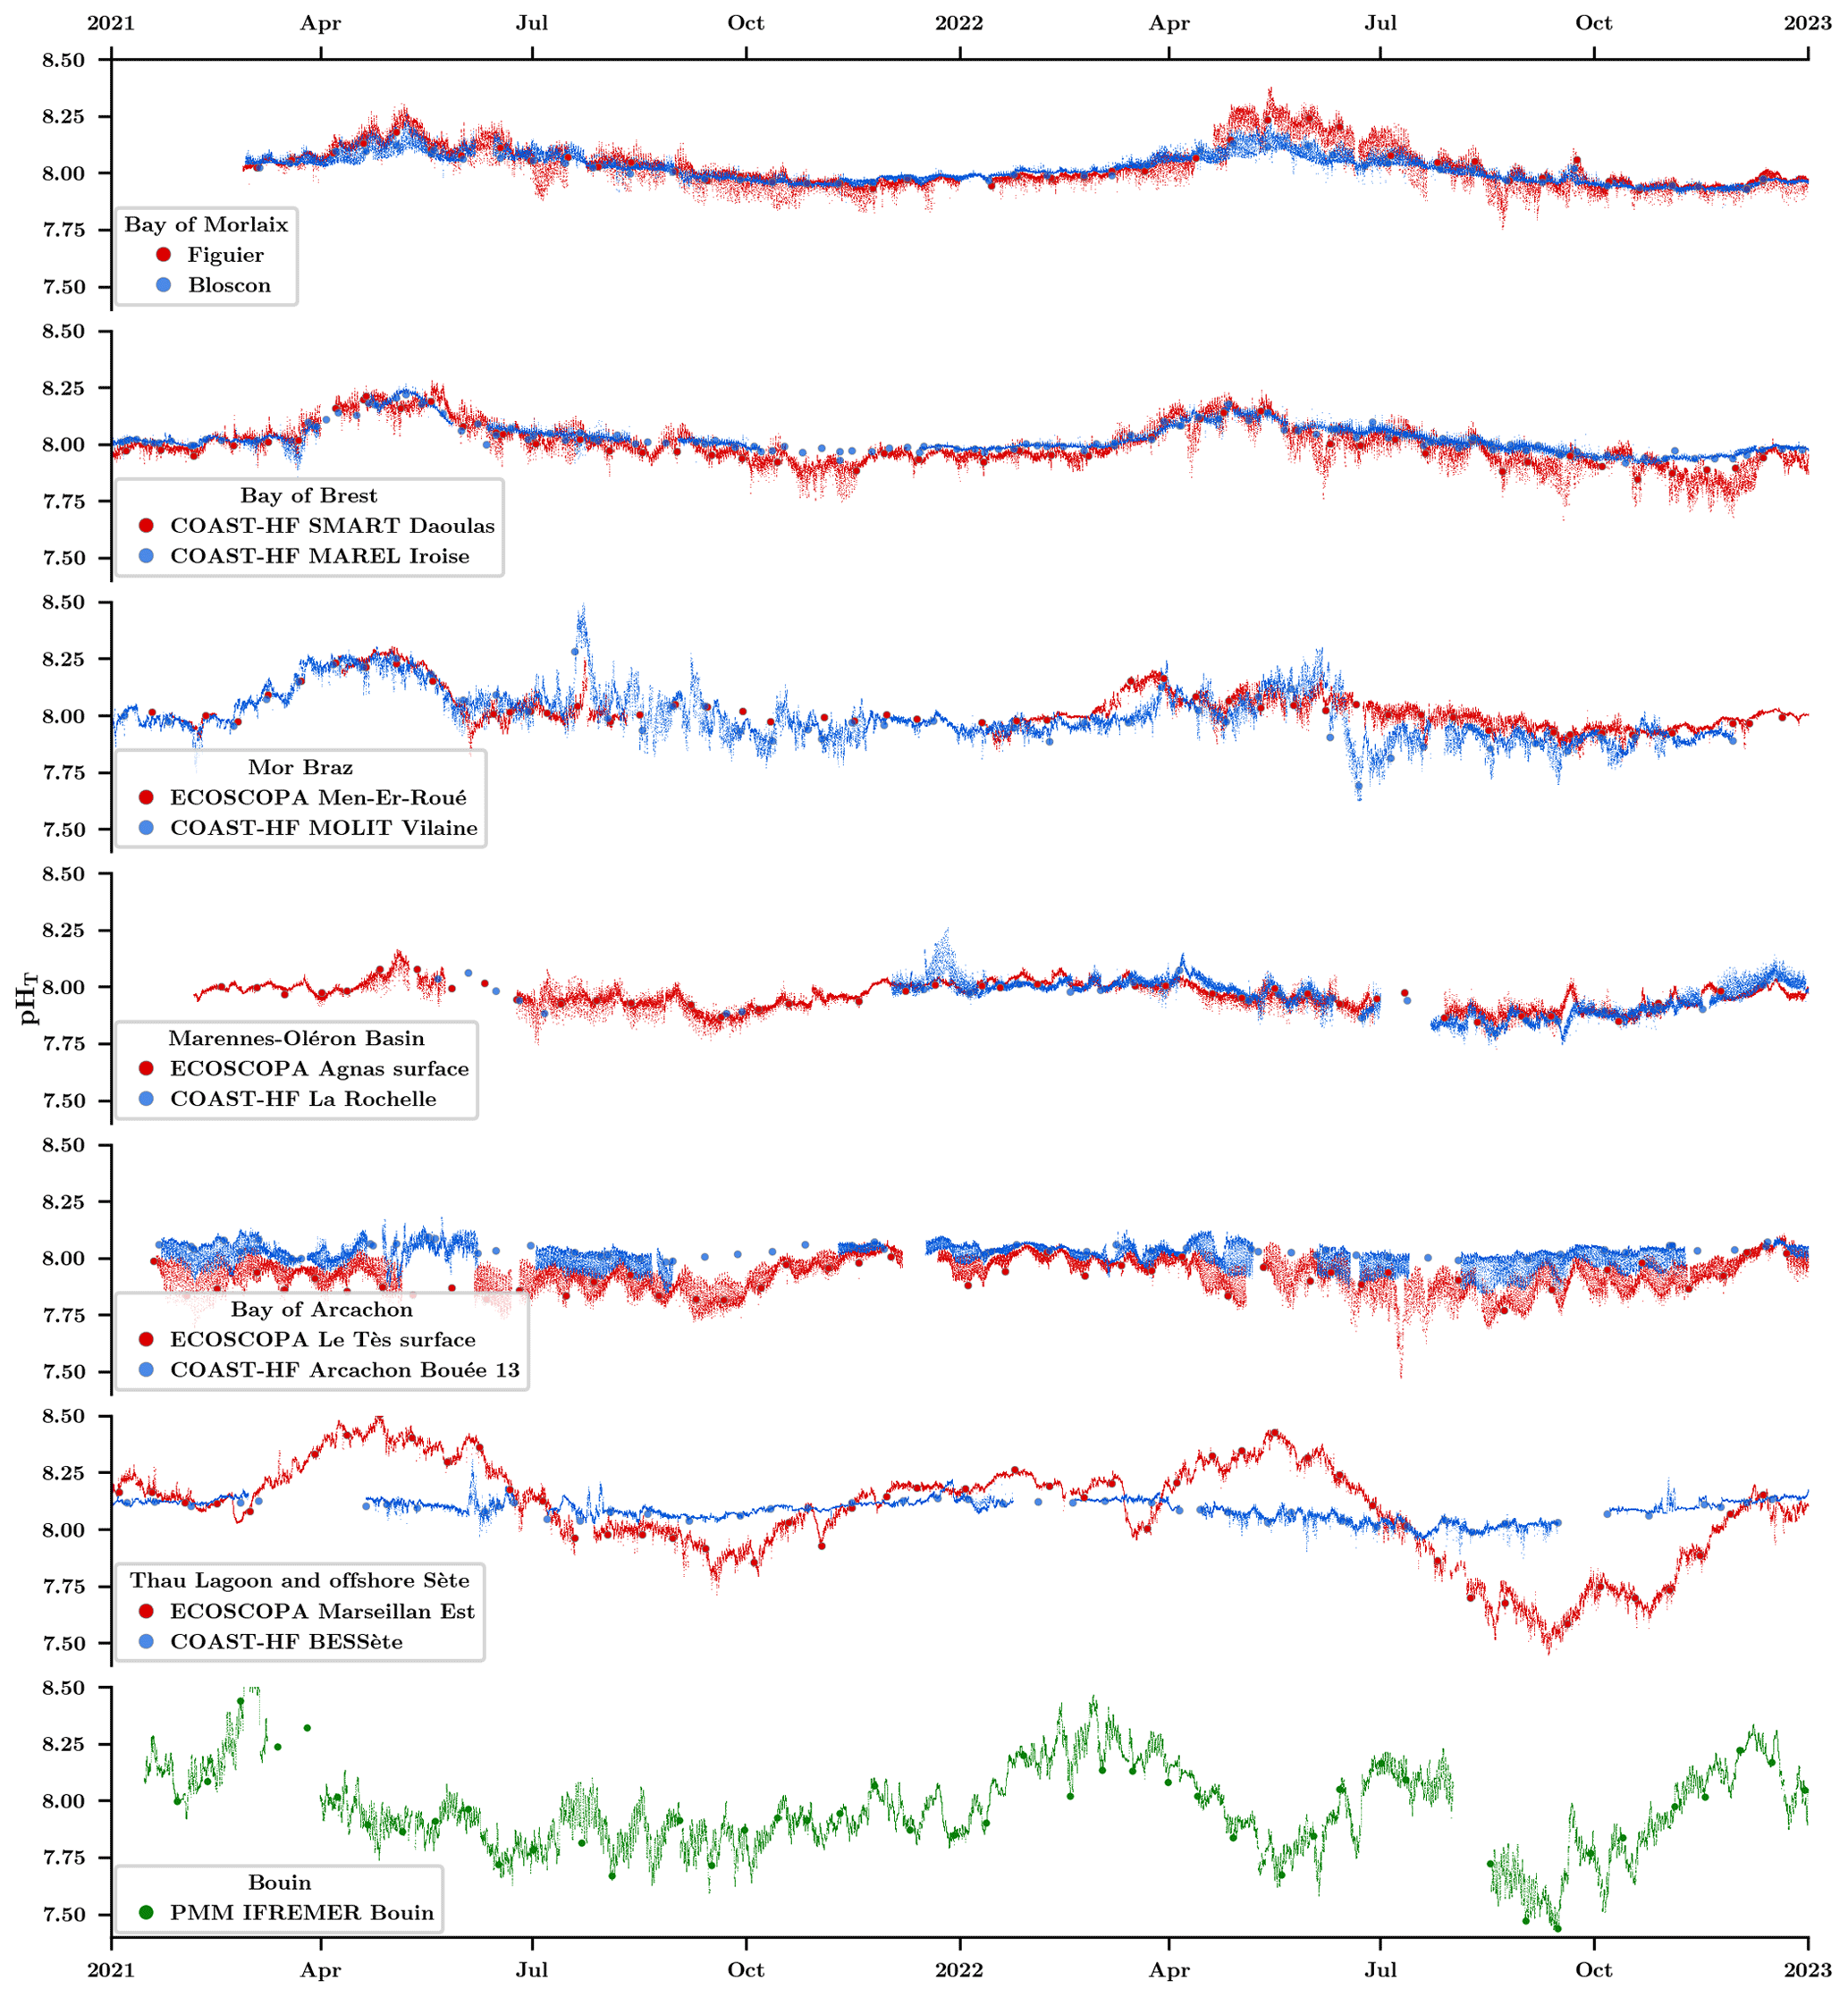
Figure 6High-frequency pHT (pH on the total scale) evolution in farming (red) and oceanic sites (blue) at in situ temperature. The larger red and blue dots show discrete pHT values obtained using a spectrophotometric method in farming and oceanic sites, respectively. The lower plot (in green) shows the pHT evolutions inside the Bouin oyster growth facility at Ifremer.
Table 3General statistics for each site based on pHT (pH on the total scale) data acquired between January 2021 and December 2022. Q10 and Q90 denote the 10th and 90th quantiles, respectively. In the “Mean” column, the average value is highlighted in bold, while the standard deviation is presented in italic.
3.4 High-frequency assessment of carbonate chemistry in the different sites
The determination of the carbonate system at high frequency is achieved based on high-frequency pHT; reconstructed high-frequency AT data (see Sect. 2.3.4); and temperature, salinity, and nutrient data. Results of the multiple regression analyses allowing for the reconstruction of high-frequency AT data based on temperature, salinity, ammonium, phosphorus, and silicate are presented in Table 4. For both sites located in the Bay of Morlaix, no significant linear relationship was found with salinity. This is most certainly due to the data covering a short salinity range at these sites (33.0 < salinity <35.3). Gac et al. (2020) analyzed several seasonal surveys performed in this bay, covering a much larger salinity gradient. They found a robust linear relationship between AT and salinity (, n=236, r2=0.98), which we used in our study. For other sites, salinity is the major driver with a positive effect except for the Marennes-Oléron basin. Depending on the site, the relationship takes into account nutrient data, which indicates the influence of runoff. ECOSCOPA farming sites in the Bay of Arcachon and Bay of Brest are typical examples with r2 values greater than 0.8 (p<0.001). Overall, simulated AT was strongly correlated with measured values (r2=0.93, p<0.001, n=641).
Table 4Summary of stepwise multiple regression analyses using seawater temperature; salinity; and ammonium, phosphorus, and silicate concentrations as explanatory variables and alkalinity as a response variable for each site.
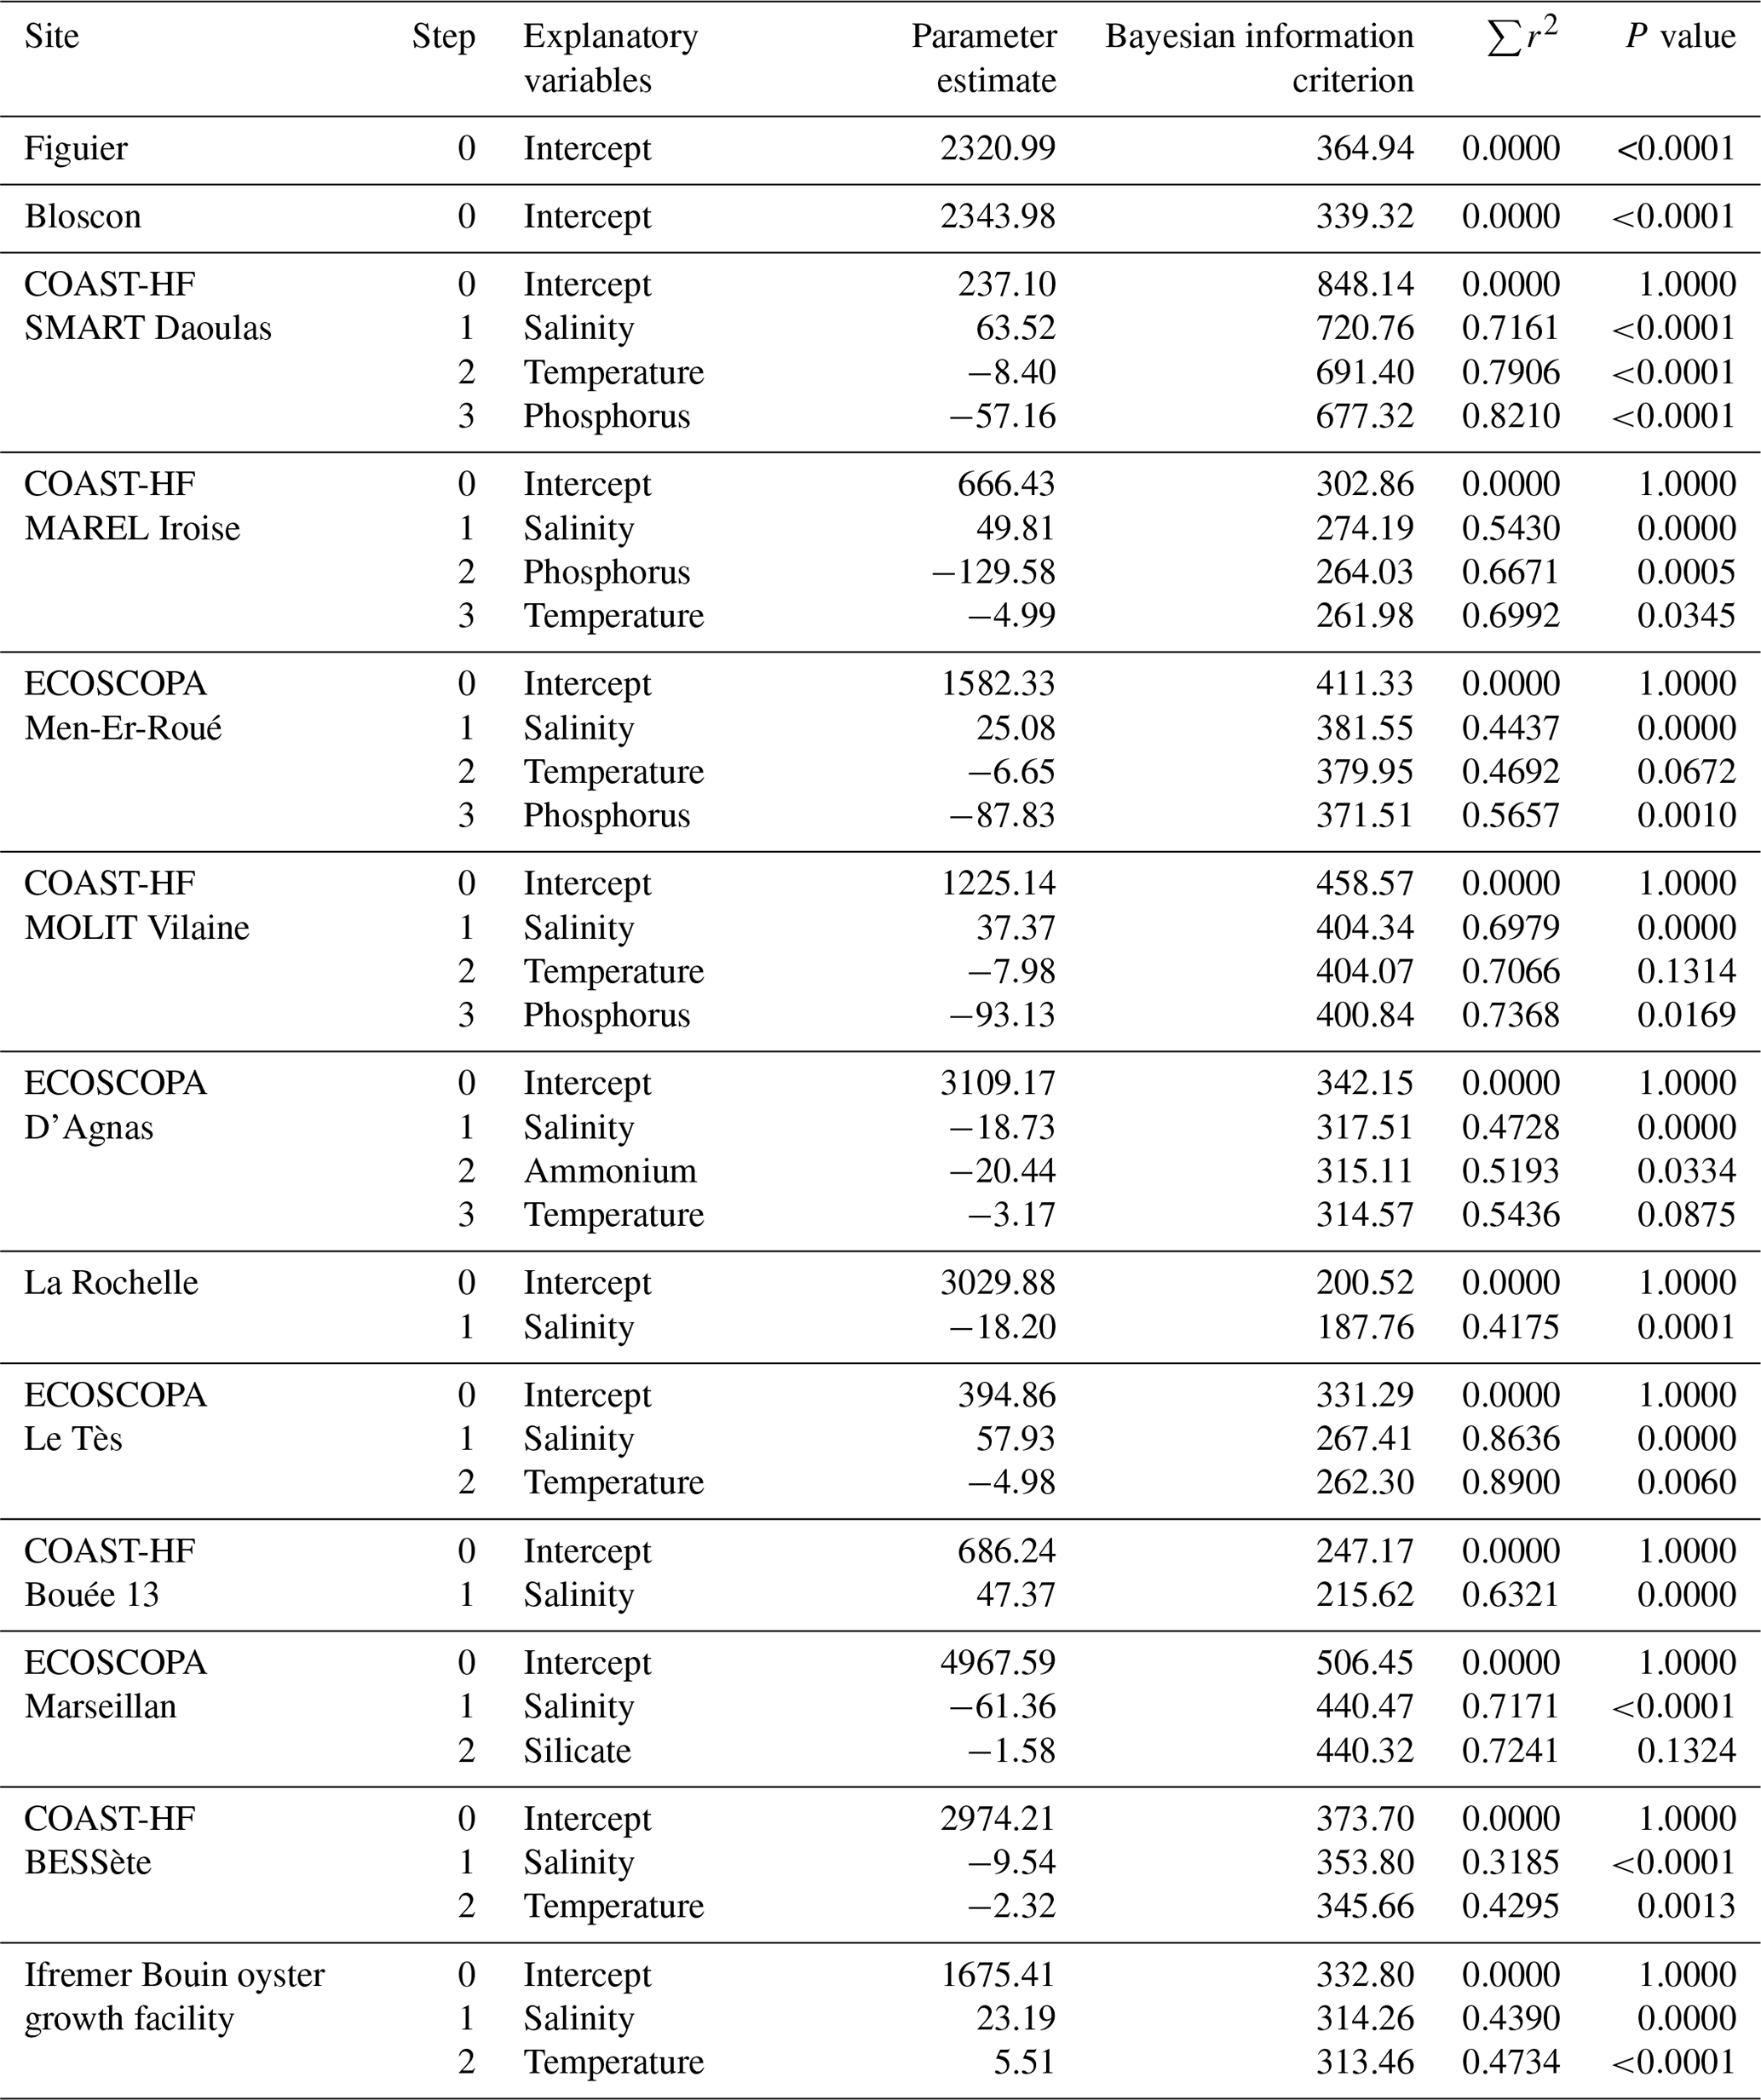
Figure 7 illustrates the time series of estimated total alkalinity, AT, based on multiple regression analyses, compared to analytical measurements conducted by the SNAPO-CO2 laboratory. At first sight, it is important to consider the importance of valid high-frequency salinity data, which induce directly a lack of estimated AT. Subsequently, similar to the observations made for low-frequency data quality (Sect. 3.1.2), the computed data from the Bay of Brest, Mor Braz, and Mediterranean sites demonstrate robust agreements, with minor discrepancies emerging during the summer in Thau Lagoon. In contrast, samples from the Bay of Morlaix present poor correlation with large differences, particularly in the year 2021 (attributed to conservation issues). Similarly, samples from the last two regions (Marennes-Oléron basin and Bay of Arcachon) reveal differences only on specific dates, necessitating further investigations.
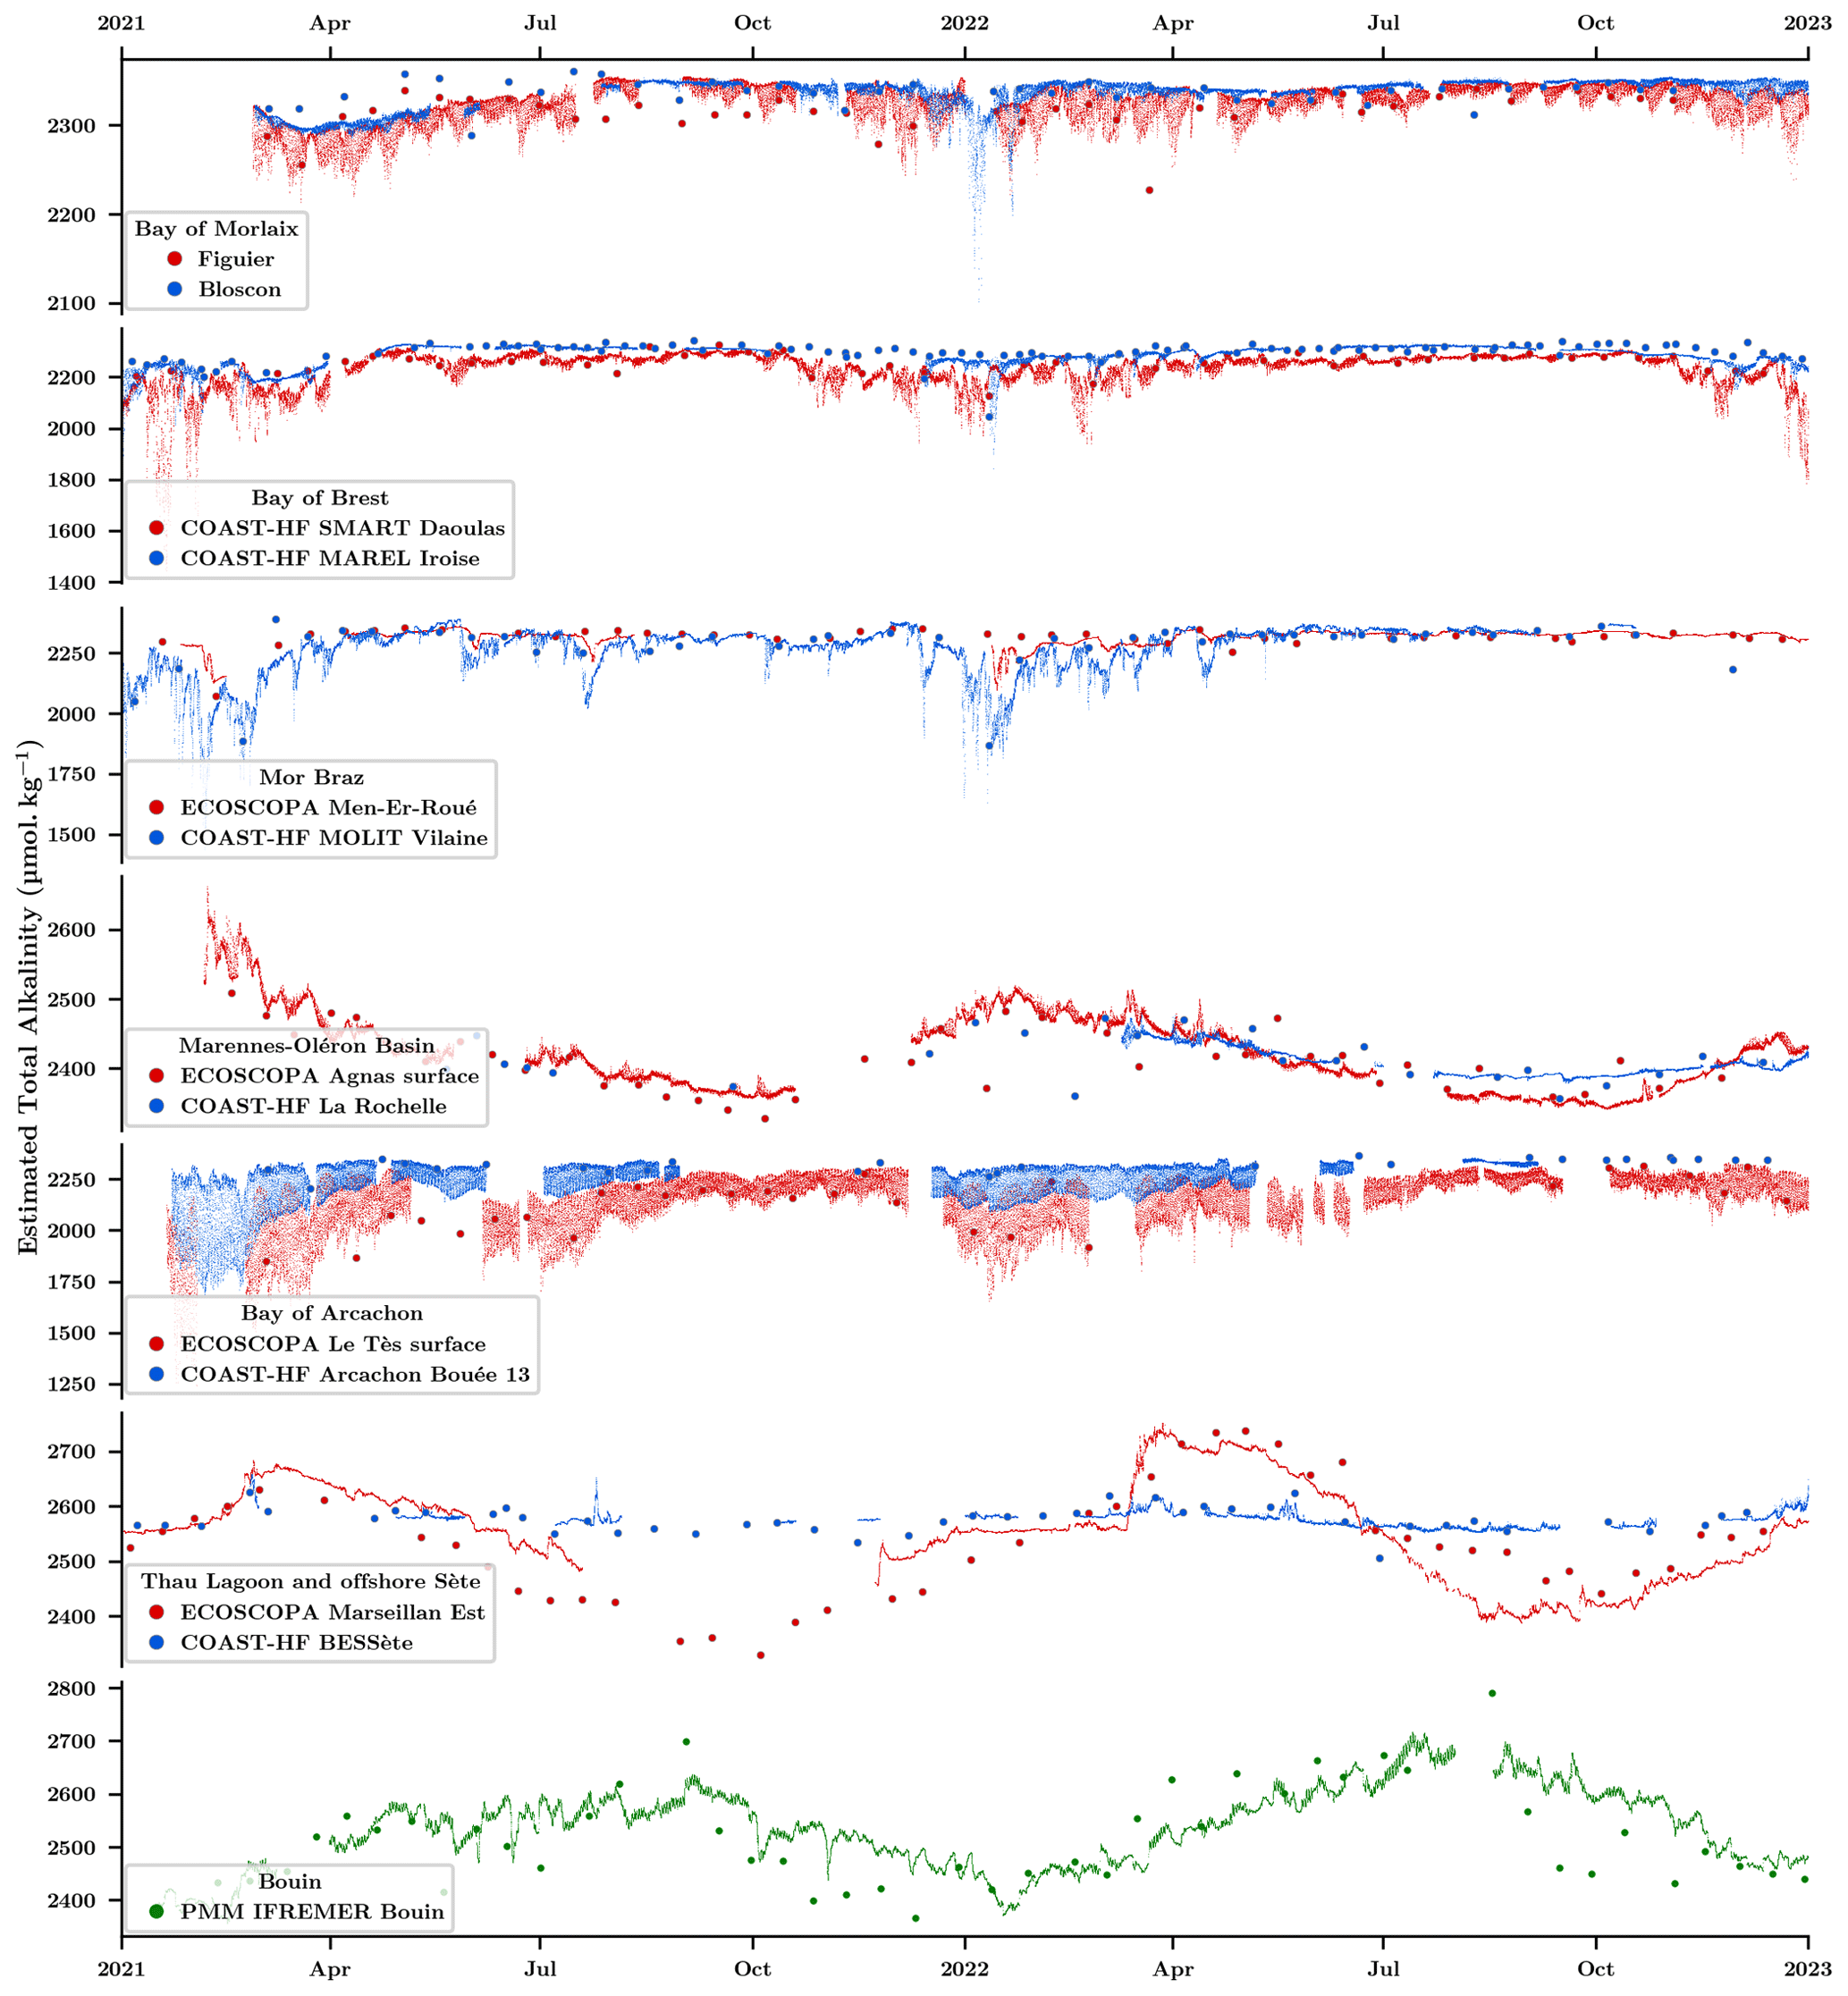
Figure 7Estimated total alkalinity AT time series for farming (red) and oceanic sites (blue) based on multiple regression analyses using seawater temperature, salinity, and nutrient data. The larger red and blue dots show discrete AT values measured by the SNAPO-CO2 laboratory. The lower plot (in green) shows the AT evolutions inside the Bouin oyster growth facility at Ifremer.
Calculations based on measured pHT and estimated high-frequency AT (using temperature, salinity, and interpolated nutrients) yielded monthly distributions of seawater aragonite saturation state (ΩAragonite) for all farming and oceanic sites (Fig. 8). The annual cycle varies among Atlantic areas, with the maximum value being reached between early spring and late autumn. Here again, Thau Lagoon exhibits a unique cycle, with highly favorable conditions in spring and extremely low saturation state values in autumn. To evaluate the risk for shellfish production, pie charts illustrate the ratio of time spent below 1.5. This threshold has been chosen based on experimental data acquired by Ries et al. (2009) and Waldbusser et al. (2015) reporting, respectively, negative growth for several adult mollusk species and strong impacts (lower size, abnormal shape) on oyster and mussel larvae below this value. For now, based on the limited database, there are only a few periods in winter in the Bay of Arcachon and next to the Loire river mouth where the availability of carbonate ions could be of concern.
Examining analogous studies worldwide provides valuable context. Simpson et al. (2024) assessed daily and seasonal variability in carbonate chemistry conditions along the Canadian Pacific coast through spatial low-frequency campaigns spanning four years. Their investigation involved estimating the contribution of drivers to seasonal and daily changes in pH and Ω. Similar to our dataset, nearshore locations exhibited a more pronounced range of variability changes in pH and Ω than open waters, at both seasonal and daily scales. In a parallel context, Fujii et al. (2023) also identified critical levels of acidification for Pacific oyster larvae on the Japanese coast thanks to continuous pH monitoring.
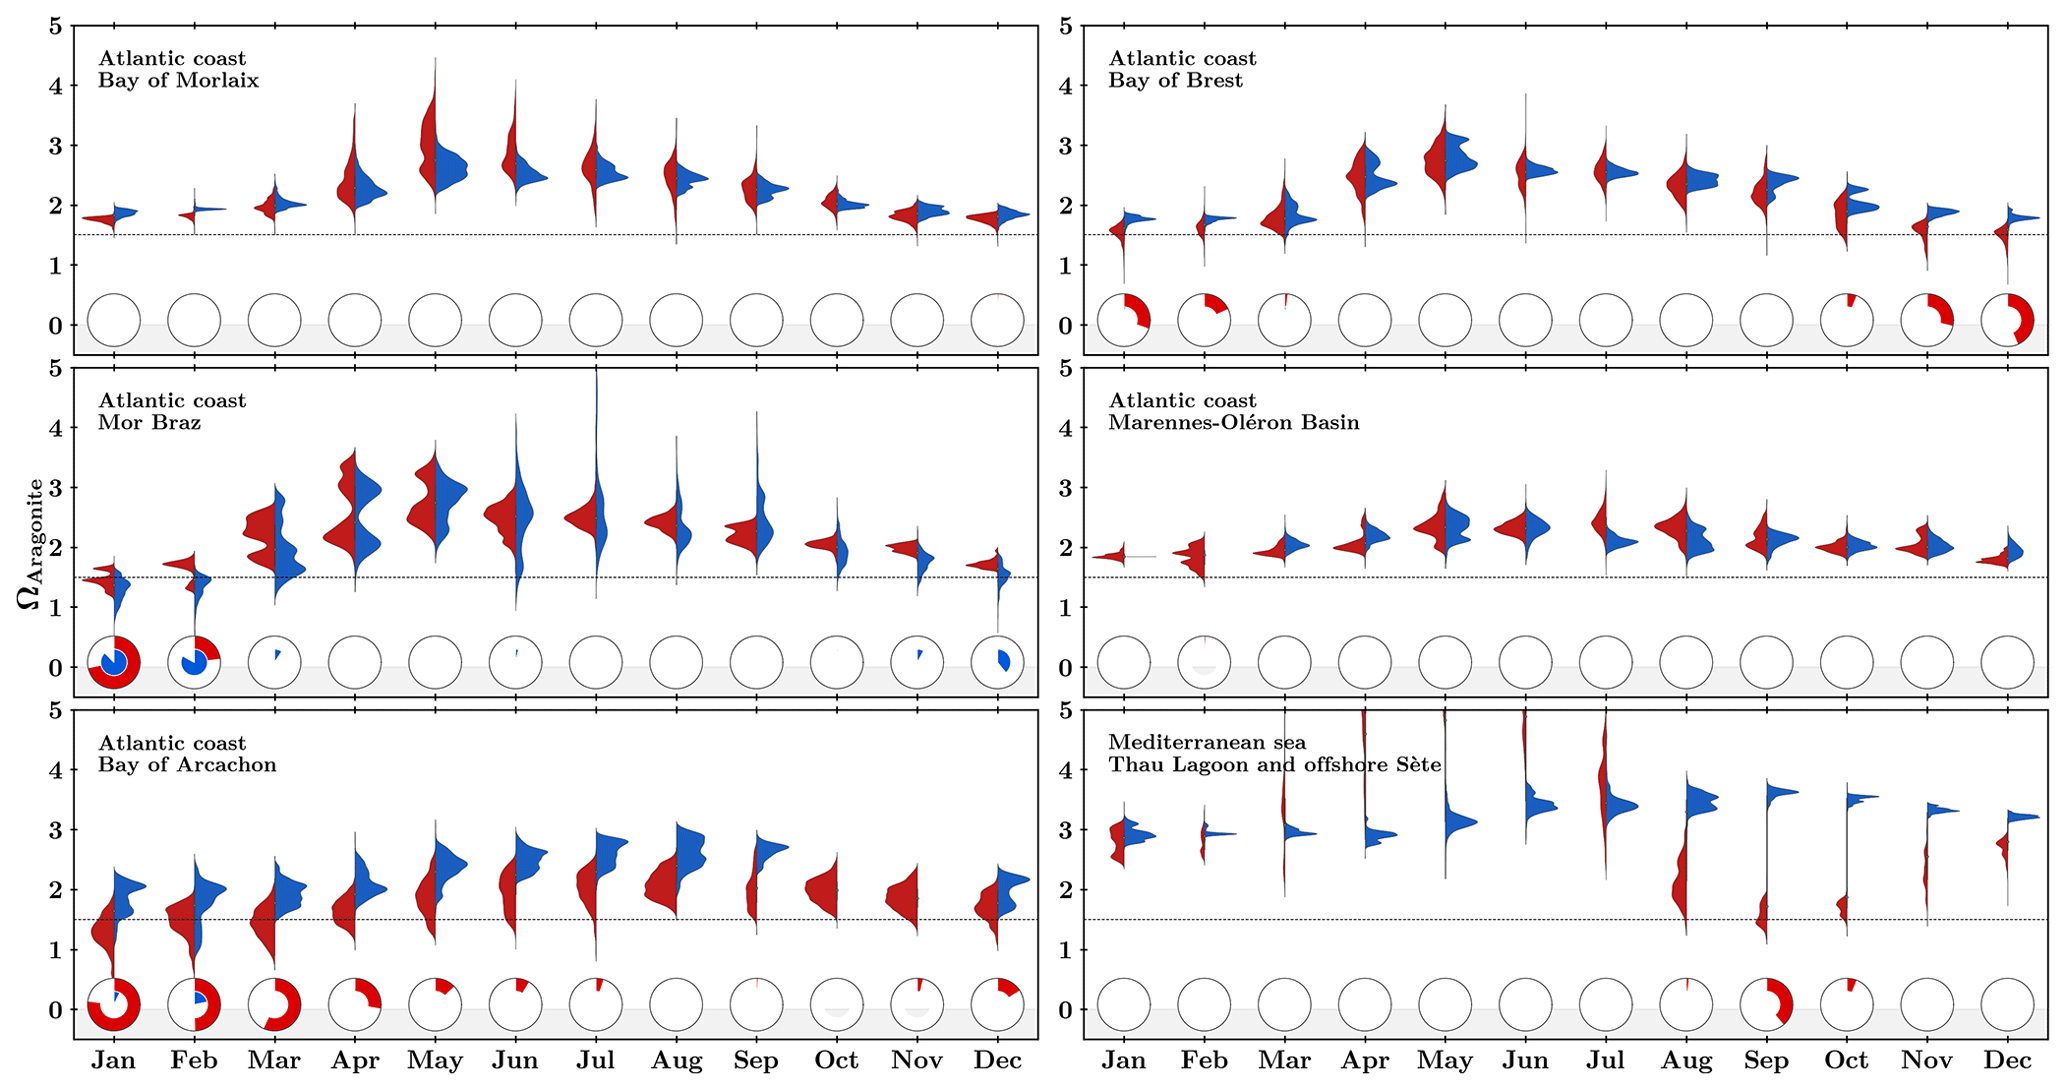
Figure 8Monthly distribution of seawater saturation state with respect to aragonite (ΩAragonite) in the six study sites for farming (red) and oceanic (blue) areas. Pie charts represent the fraction of time spent below threshold 1.5 (represented as a horizontal dotted line).
To fully understand when these acidification events occur, Fig. 9 presents the distribution of aragonite saturation state for each region according to high-frequency temperature and salinity data. All Atlantic sites show a similar pattern with higher saturation states during summer, with acidification events only occurring during periods of freshwater runoff (salinity threshold between 28 and 32 depending on the area). In contrast, acidification events in Thau Lagoon in the Mediterranean Sea are correlated to high-salinity events at the end of summer.
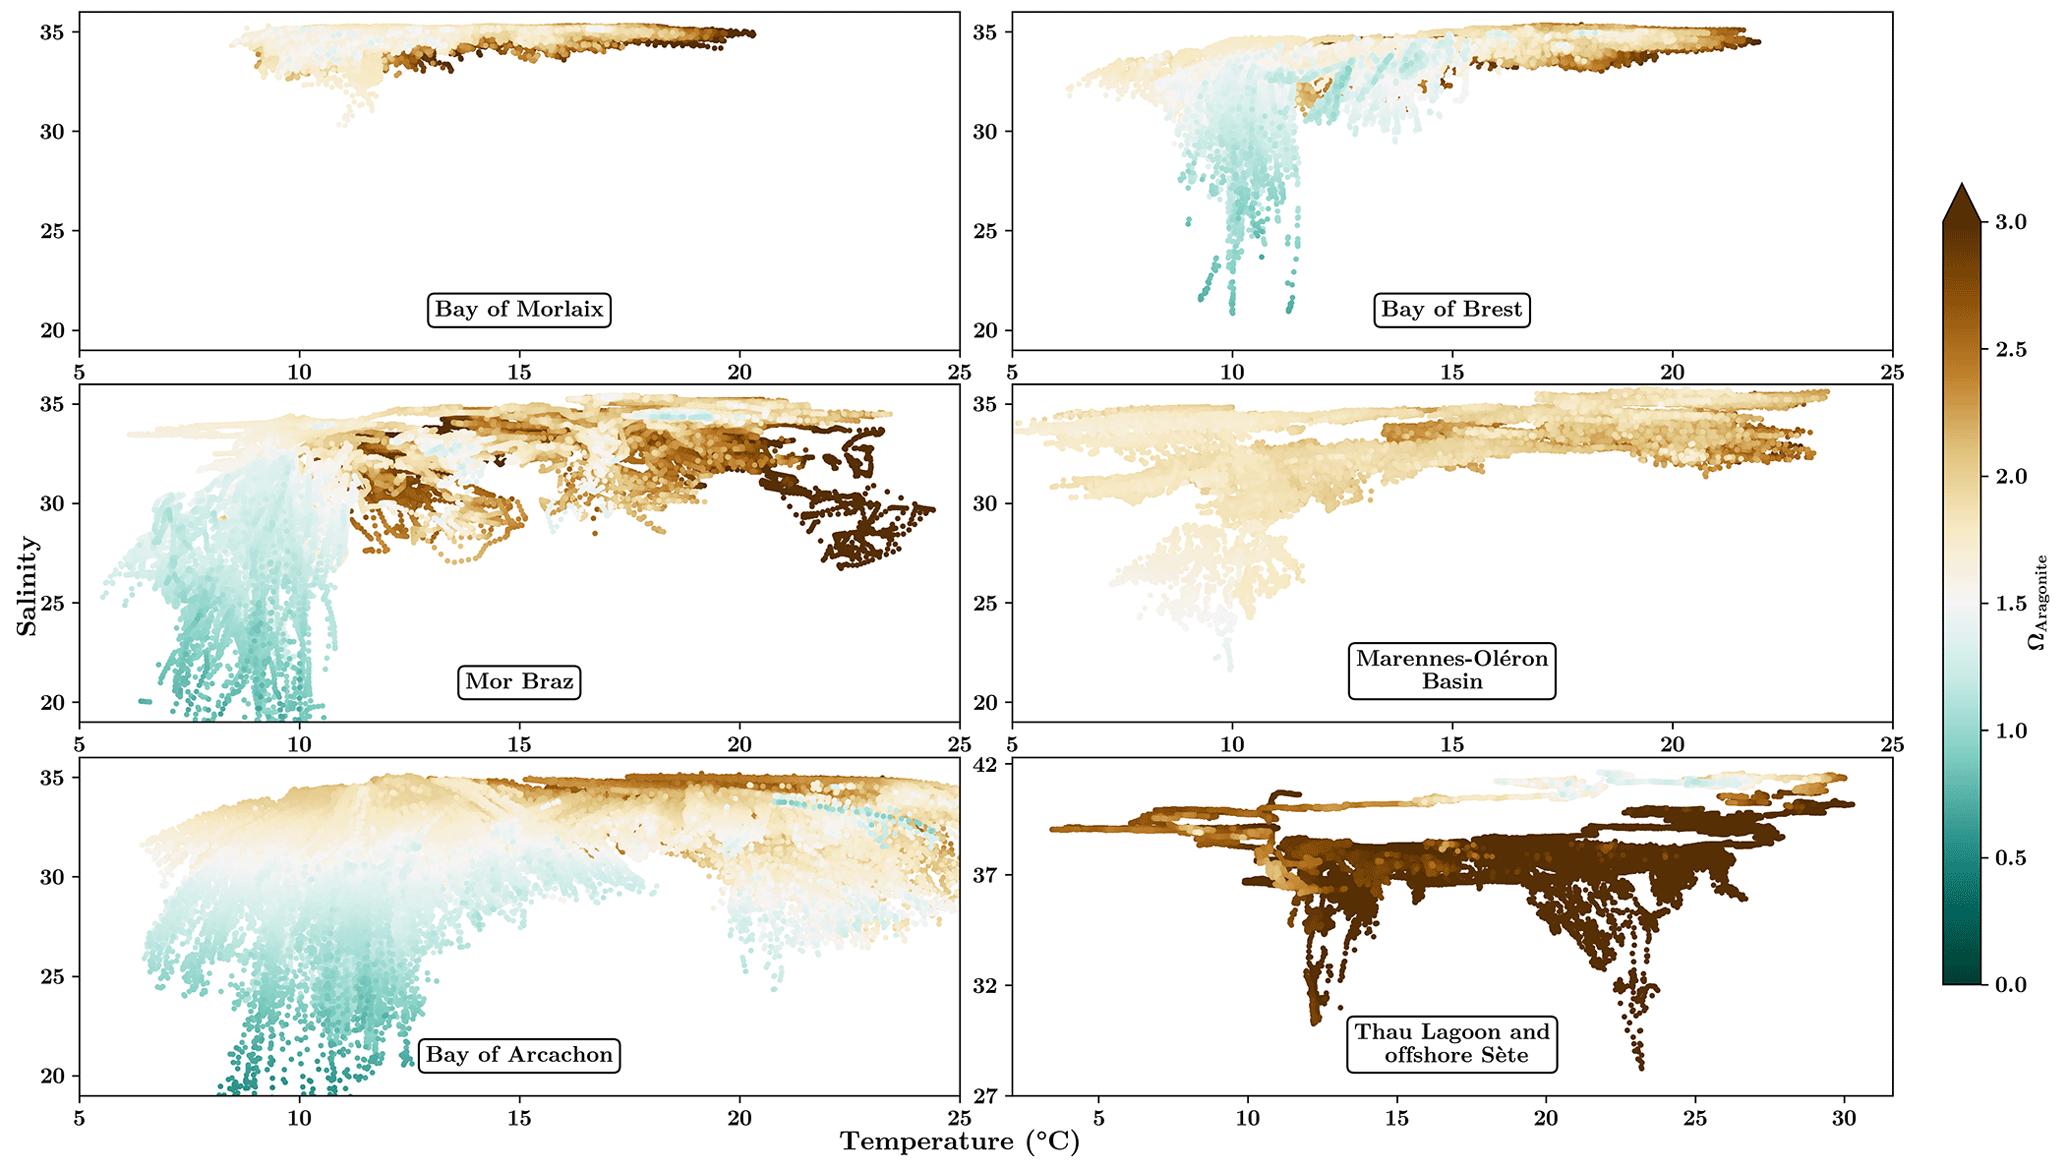
Figure 9Distribution of aragonite saturation state (ΩAragonite) in seawater for each region as a function of temperature and salinity.
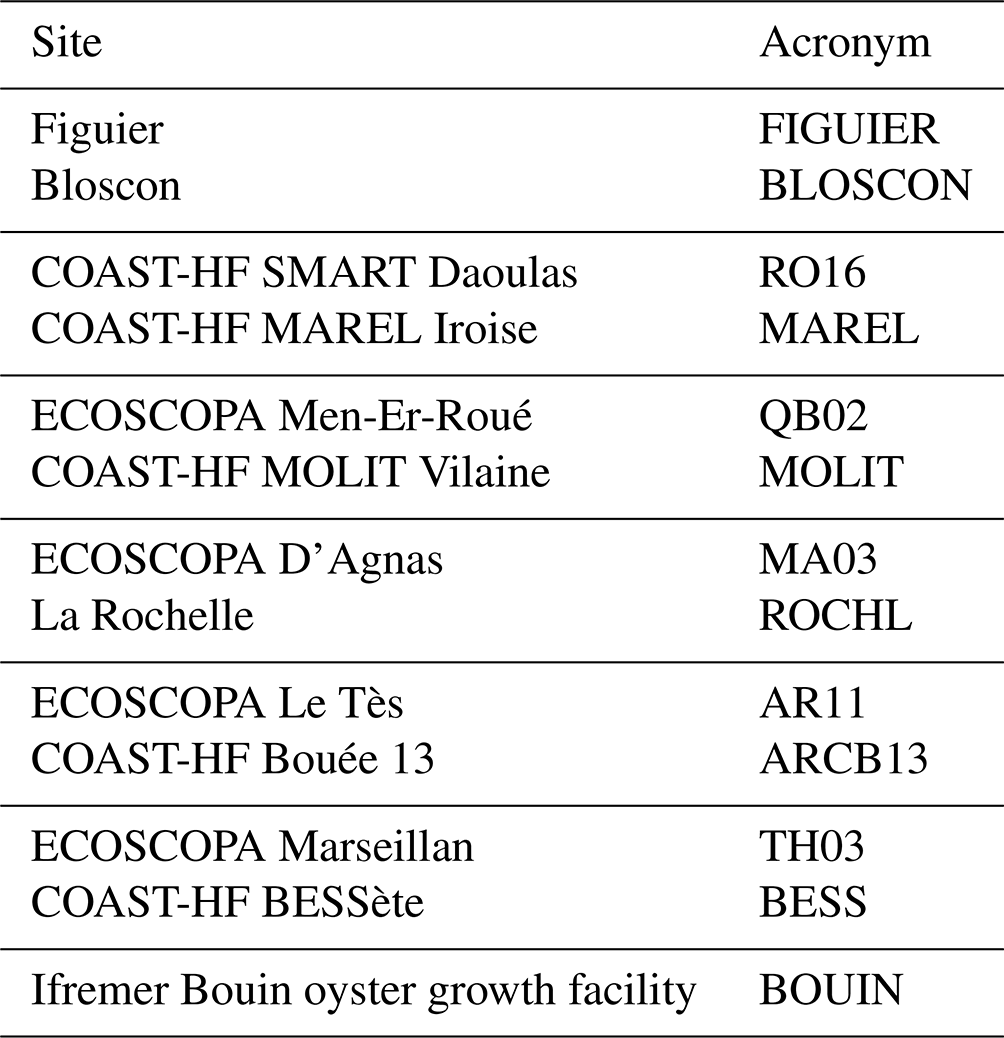
In order to facilitate file organization, each site is assigned an acronym in the list given in Table 5. External high-frequency temperature and salinity data are given in a CSV (comma separated values) file called CTD_{site}.csv containing raw data with an appropriate quality flag to filter validated data (flag 2: Acceptable). Another CSV file called pH_{site}.csv contains validated pHT data and estimated AT together with temperature and salinity (interpolated when necessary). The history deployment information is given in another file named deployment_{site}.csv including detailed maintenance operations and noticeable remarks concerning the SeaFET electrodes. Eventually, the discrete sample measurements are gathered in samples.csv with result from PyCO2SYS at in situ temperature and nutrient data from the SOMLIT and REPHY databases.
High-frequency data and discrete sampling data are available in this repository at https://doi.org/10.17882/96982 (Petton et al., 2023a). The data are being provided free of charge to the public and scientific community, with the expectation that its broad distribution will result in increased comprehension and the emergence of novel scientific perspectives.
The network initiated in 2021 along the French coast area has provided essential data for the assessment of carbonate chemistry dynamics at various temporal scales and in contrasted coastal sites (shellfish farms located close to the shore vs. sites with no shellfish farming more subjected to oceanic conditions). The large number of sites and geographical coverage of the network has already allowed us to evaluate the influence of diverse physical, chemical, and biological processes (freshwater inputs, tides, temperature, biological processes), which we briefly presented in the present paper. The acquired dataset will undoubtedly be of great interest to the public and scientific communities in the future as our choice to base our network on existing monitoring activities not only allowed for providing reliable data at a very high acquisition rate and at a lower financial cost, but also allows for the possibility to rely on existing low-frequency datasets (chlorophyll, nutrients, organic matter concentrations, etc.) for assessing the interplay between biology and the chemical environment. However, autonomous time-series acquisition close to shellfish farming involves a number of challenges mostly related to intense biofouling pressure. It explained most invalidated data even when employing fortnightly manual cleaning protocols, which will require in the future the development of active and efficient antifouling solutions that are currently in development (localized chlorination, adapted wiper) in the framework of our project. Furthermore, the SeaFET technology is relatively novel when compared to more conventional temperature or conductivity sensors. We encountered disparities within the whole set of probes acquired with specific electrodes malfunctioning within just a few months of deployment, despite the manufacturer Sea-Bird indicating a minimum of 1-year service life. Adding complexity, a further issue emerged from June 2022 onwards: the SeaFET maintenance service has been suspended due to a lack of the DuraFET component. While the service will apparently resume by late 2023, this disruption has already resulted in temporal gaps within the time-series data. Additionally, evaluation of new sensors is underway with the objective of obtaining the reliability and accuracy of the already collected data.
SP, FP, and FG designed the network and wrote the first draft of the manuscript. All co-authors actively participated in the process of acquiring data and amended the manuscript.
At least one of the (co-)authors is a member of the editorial board of Earth System Science Data. The peer-review process was guided by an independent editor, and the authors also have no other competing interests to declare.
Publisher’s note: Copernicus Publications remains neutral with regard to jurisdictional claims made in the text, published maps, institutional affiliations, or any other geographical representation in this paper. While Copernicus Publications makes every effort to include appropriate place names, the final responsibility lies with the authors.
We would like to thank all the personnel involved in the various stages of the network, built on the existing architecture of the ECOSCOPA and REPHY networks, as well as the SNO SOMLIT and COAST-HF from the Research Infrastructure ILICO (https://www.ir-ilico.fr). We also thank the SNAPO-CO2 analytical platform for the different analyses realized during this project.
This network was funded by the CocoriCO2 project (European Maritime and Fisheries Fund, grant no. 344, 2020–2023). It also benefited from a subsidy from the Adour-Garonne water agency.
This paper was edited by François G. Schmitt and reviewed by Michele Giani and one anonymous referee.
Belin, C., Soudant, D., and Amzil, Z.: Three decades of data on phytoplankton and phycotoxins on the French coast: Lessons from REPHY and REPHYTOX, Harmful Algae, 102, 101733, https://doi.org/10.1016/j.hal.2019.101733, 2021.
Bresnahan, P. J., Martz, T. R., Takeshita, Y., Johnson, K. S., and LaShomb, M.: Best practices for autonomous measurement of seawater pH with the Honeywell Durafet, Methods in Oceanography, 9, 44–60, https://doi.org/10.1016/j.mio.2014.08.003, 2014.
Caldeira, K. and Wickett, M. E.: Anthropogenic carbon and ocean pH, Nature, 425, 365, https://doi.org/10.1038/425365a, 2003.
Capitaine, G., Demeyer, S., Stoica, D., Alliouane, S., Petton, S., Rimmelin-Maury, P., Savoye, N., Wagener, T., and Fisicaro, P.: Inter-laboratory comparison on a reference material for seawater spectrophotometric pHT measurements, 2023 IEEE International Workshop on Metrology for the Sea, Learning to Measure Sea Health Parameters (MetroSea), 4–6 October 2023, La Valletta, Malta, 2023, 11–15, https://doi.org/10.1109/MetroSea58055.2023.10317274, 2023.
Cayocca, F.: Long-term morphological modeling of a tidal inlet: the Arcachon Basin, France, Coast. Eng., 42, 115–142, https://doi.org/10.1016/S0378-3839(00)00053-3, 2001.
Dickson, A. G.: Standard potential of the reaction: , and and the standard acidity constant of the ion HSO in synthetic sea water from 273.15 to 318.15 K, J. Chem. Thermodyn., 22, 113–127, https://doi.org/10.1016/0021-9614(90)90074-Z, 1990.
Dickson, A. G. and Goyet, C.: Handbook of methods for the analysis of the various parameters of the carbon dioxide system in sea water. Version 2, ORNL/CDIAC-74, https://doi.org/10.2172/10107773, 1994.
Dickson, A. G., Sabine, C. L., and Christian, J. R.: Guide to best practices for ocean CO2 measurements, PICES, Sydney, 191 pp., ISBN is 1-897176-07-4, 2007.
Edmond, J. M.: High precision determination of titration alkalinity and total carbon dioxide content of sea water by potentiometric titration, Deep Sea Research and Oceanographic Abstracts, 17, 737–750, https://doi.org/10.1016/0011-7471(70)90038-0, 1970.
Fassbender, A. J., Sabine, C. L., and Feifel, K. M.: Consideration of coastal carbonate chemistry in understanding biological calcification, Geophys. Res. Lett., 43, 4467–4476, https://doi.org/10.1002/2016GL068860, 2016.
Feely, R. A., Alin, S. R., Carter, B., Bednaršek, N., Hales, B., Chan, F., Hill, T. M., Gaylord, B., Sanford, E., Byrne, R. H., Sabine, C. L., Greeley, D., and Juranek, L.: Chemical and biological impacts of ocean acidification along the west coast of North America, Estuarine, Coastal and Shelf Science, 183, 260–270, https://doi.org/10.1016/j.ecss.2016.08.043, 2016.
Fiandrino, A., Ouisse, V., Dumas, F., Lagarde, F., Pete, R., Malet, N., Le Noc, S., and de Wit, R.: Spatial patterns in coastal lagoons related to the hydrodynamics of seawater intrusion, Mar. Pollut. Bull., 119, 132–144, https://doi.org/10.1016/j.marpolbul.2017.03.006, 2017.
Frère, L., Paul-Pont, I., Rinnert, E., Petton, S., Jaffré, J., Bihannic, I., Soudant, P., Lambert, C., and Huvet, A.: Influence of environmental and anthropogenic factors on the composition, concentration and spatial distribution of microplastics: A case study of the Bay of Brest (Brittany, France), Environ. Pollut., 225, 211–222, https://doi.org/10.1016/j.envpol.2017.03.023, 2017.
Friedlingstein, P., O'Sullivan, M., Jones, M. W., Andrew, R. M., Gregor, L., Hauck, J., Le Quéré, C., Luijkx, I. T., Olsen, A., Peters, G. P., Peters, W., Pongratz, J., Schwingshackl, C., Sitch, S., Canadell, J. G., Ciais, P., Jackson, R. B., Alin, S. R., Alkama, R., Arneth, A., Arora, V. K., Bates, N. R., Becker, M., Bellouin, N., Bittig, H. C., Bopp, L., Chevallier, F., Chini, L. P., Cronin, M., Evans, W., Falk, S., Feely, R. A., Gasser, T., Gehlen, M., Gkritzalis, T., Gloege, L., Grassi, G., Gruber, N., Gürses, Ö., Harris, I., Hefner, M., Houghton, R. A., Hurtt, G. C., Iida, Y., Ilyina, T., Jain, A. K., Jersild, A., Kadono, K., Kato, E., Kennedy, D., Klein Goldewijk, K., Knauer, J., Korsbakken, J. I., Landschützer, P., Lefèvre, N., Lindsay, K., Liu, J., Liu, Z., Marland, G., Mayot, N., McGrath, M. J., Metzl, N., Monacci, N. M., Munro, D. R., Nakaoka, S.-I., Niwa, Y., O'Brien, K., Ono, T., Palmer, P. I., Pan, N., Pierrot, D., Pocock, K., Poulter, B., Resplandy, L., Robertson, E., Rödenbeck, C., Rodriguez, C., Rosan, T. M., Schwinger, J., Séférian, R., Shutler, J. D., Skjelvan, I., Steinhoff, T., Sun, Q., Sutton, A. J., Sweeney, C., Takao, S., Tanhua, T., Tans, P. P., Tian, X., Tian, H., Tilbrook, B., Tsujino, H., Tubiello, F., van der Werf, G. R., Walker, A. P., Wanninkhof, R., Whitehead, C., Willstrand Wranne, A., Wright, R., Yuan, W., Yue, C., Yue, X., Zaehle, S., Zeng, J., and Zheng, B.: Global Carbon Budget 2022, Earth Syst. Sci. Data, 14, 4811–4900, https://doi.org/10.5194/essd-14-4811-2022, 2022.
Fujii, M., Hamanoue, R., Bernardo, L. P. C., Ono, T., Dazai, A., Oomoto, S., Wakita, M., and Tanaka, T.: Assessing impacts of coastal warming, acidification, and deoxygenation on Pacific oyster (Crassostrea gigas) farming: a case study in the Hinase area, Okayama Prefecture, and Shizugawa Bay, Miyagi Prefecture, Japan, Biogeosciences, 20, 4527–4549, https://doi.org/10.5194/bg-20-4527-2023, 2023.
Gac, J.-P., Marrec, P., Cariou, T., Guillerm, C., Macé, É., Vernet, M., and Bozec, Y.: Cardinal Buoys: An Opportunity for the Study of Air-Sea CO2 Fluxes in Coastal Ecosystems, Frontiers in Marine Science, 7, 712, https://doi.org/10.3389/fmars.2020.00712, 2020.
Gattuso, J.-P., Brewer, P. G., Hoegh-Guldberg, O., Kleypas, J. A., Pörtner, H.-O., and Schmidt, D. N.: Cross-chapter box on ocean acidification, in: Climate Change 2014: Impacts, Adaptation, and Vulnerability. Part A: Global and Sectoral Aspects. Contribution of Working Group II to the Fifth Assessment Report of the Intergovernmental Panel on Climate Change, edited by: Field, C. B., Barros, V. R., Dokken, D. J., Mach, K. J., Mastrandrea, M. D., Bilir, T. E., Chatterjee, M., Ebi, K. L., Estrada, Y. O., Genova, R. C., Girma, B., Kissel, E. S., Levy, A. N., MacCracken, S., Mastrandrea, P. R., and White, L. L., Cambridge University Press, Cambridge, United Kingdom and New York, NY, USA, 129–131, 2014.
Gazeau, F., Parker, L. M., Comeau, S., Gattuso, J.-P., O'Connor, W. A., Martin, S., Pörtner, H.-O., and Ross, P. M.: Impacts of ocean acidification on marine shelled molluscs, Mar. Biol., 160, 2207–2245, https://doi.org/10.1007/s00227-013-2219-3, 2013.
Goulletquer, P. and Le Moine, O.: Shellfish farming and Coastal Zone Management (CZM) development in the Marennes-Oléron Bay and Charentais Sounds (Charente Maritime, France): A review of recent developments, Aquacult. Int., 10, 507–525, https://doi.org/10.1023/A:1023975418669, 2002.
Hájek, M., Jiménez-Alfaro, B., Hájek, O., Brancaleoni, L., Cantonati, M., Carbognani, M., Dedić, A., Dítě, D., Gerdol, R., Hájková, P., Horsáková, V., Jansen, F., Kamberović, J., Kapfer, J., Kolari, T. H. M., Lamentowicz, M., Lazarević, P., Mašić, E., Moeslund, J. E., Pérez-Haase, A., Peterka, T., Petraglia, A., Pladevall-Izard, E., Plesková, Z., Segadelli, S., Semeniuk, Y., Singh, P., Šímová, A., Šmerdová, E., Tahvanainen, T., Tomaselli, M., Vystavna, Y., Biţă-Nicolae, C., and Horsák, M.: A European map of groundwater pH and calcium, Earth Syst. Sci. Data, 13, 1089–1105, https://doi.org/10.5194/essd-13-1089-2021, 2021.
Humphreys, M. P., Schiller, A. J., Sandborn, D., Gregor, L., Pierrot, D., van Heuven, S. M. A. C., Lewis, E. R., and Wallace, D. W. R.: PyCO2SYS: marine carbonate system calculations in Python, Zenodo [code], https://doi.org/10.5281/zenodo.6560756, 2022.
IPCC: Climate Change 2023: Synthesis Report. Contribution of Working Groups I, II and III to the Sixth Assessment Report of the Intergovernmental Panel on Climate Change, edited by: Core Writing Team, Lee, H., and Romero, J., IPCC, Geneva, Switzerland, 184 pp., https://doi.org/10.59327/IPCC/AR6-9789291691647, 2023.
Jiang, L.-Q., Pierrot, D., Wanninkhof, R., Feely, R. A., Tilbrook, B., Alin, S., Barbero, L., Byrne, R. H., Carter, B. R., Dickson, A. G., Gattuso, J.-P., Greeley, D., Hoppema, M., Humphreys, M. P., Karstensen, J., Lange, N., Lauvset, S. K., Lewis, E. R., Olsen, A., Pérez, F. F., Sabine, C., Sharp, J. D., Tanhua, T., Trull, T. W., Velo, A., Allegra, A. J., Barker, P., Burger, E., Cai, W.-J., Chen, C.-T. A., Cross, J., Garcia, H., Hernandez-Ayon, J. M., Hu, X., Kozyr, A., Langdon, C., Lee, K., Salisbury, J., Wang, Z. A., and Xue, L.: Best Practice Data Standards for Discrete Chemical Oceanographic Observations, Front. Mar. Sci., 8, 705638, https://doi.org/10.3389/fmars.2021.705638, 2022.
Kapsenberg, L., Alliouane, S., Gazeau, F., Mousseau, L., and Gattuso, J.-P.: Coastal ocean acidification and increasing total alkalinity in the northwestern Mediterranean Sea, Ocean Sci., 13, 411–426, https://doi.org/10.5194/os-13-411-2017, 2017.
Kwiatkowski, L., Torres, O., Bopp, L., Aumont, O., Chamberlain, M., Christian, J. R., Dunne, J. P., Gehlen, M., Ilyina, T., John, J. G., Lenton, A., Li, H., Lovenduski, N. S., Orr, J. C., Palmieri, J., Santana-Falcón, Y., Schwinger, J., Séférian, R., Stock, C. A., Tagliabue, A., Takano, Y., Tjiputra, J., Toyama, K., Tsujino, H., Watanabe, M., Yamamoto, A., Yool, A., and Ziehn, T.: Twenty-first century ocean warming, acidification, deoxygenation, and upper-ocean nutrient and primary production decline from CMIP6 model projections, Biogeosciences, 17, 3439–3470, https://doi.org/10.5194/bg-17-3439-2020, 2020.
Lazure, P. and Jegou, A.-M.: 3D modelling of seasonal evolution of Loire and Gironde plumes on Biscay Bay continental shelf, Oceanol. Acta, 21, 165–177, https://doi.org/10.1016/S0399-1784(98)80006-6, 1998.
Lazure, P., Garnier, V., Dumas, F., Herry, C., and Chifflet, M.: Development of a hydrodynamic model of the Bay of Biscay. Validation of hydrology, Cont. Shelf Res., 29, 985–997, https://doi.org/10.1016/j.csr.2008.12.017, 2009.
Le Pape, O. and Menesguen, A.: Hydrodynamic prevention of eutrophication in the Bay of Brest (France), a modelling approach, J. Marine Syst., 12, 171–186, https://doi.org/10.1016/S0924-7963(96)00096-6, 1997.
Lee, K., Kim, T.-W., Byrne, R. H., Millero, F. J., Feely, R. A., and Liu, Y.-M.: The universal ratio of boron to chlorinity for the North Pacific and North Atlantic oceans, Geochim. Cosmochim. Ac., 74, 1801–1811, https://doi.org/10.1016/j.gca.2009.12.027, 2010.
Lheureux, A., David, V., Del Amo, Y., Soudant, D., Auby, I., Bozec, Y., Conan, P., Ganthy, F., Grégori, G., Lefebvre, A., Leynart, A., Rimmelin-Maury, P., Souchu, P., Vantrepote, V., Blondel, C., Cariou, T., Crispi, O., Cordier, M.-A., Crouvoisier, M., Duquesne, V., Ferreira, S., Garcia, N., Gouriou, L., Grosteffan, E., Le Merrer, Y., Meteigner, C., Retho, M., Tournaire, M.-P., and Savoye, N.: Trajectories of nutrients concentrations and ratios in the French coastal ecosystems: 20 years of changes in relation with large-scale and local drivers, Sci. Total Environ., 857, 159619, https://doi.org/10.1016/j.scitotenv.2022.159619, 2023.
Lueker, T. J., Dickson, A. G., and Keeling, C. D.: Ocean pCO2 calculated from dissolved inorganic carbon, alkalinity, and equations for K1 and K2: validation based on laboratory measurements of CO2 in gas and seawater at equilibrium, Mar. Chem., 70, 105–119, https://doi.org/10.1016/S0304-4203(00)00022-0, 2000.
Lutier, M., Di Poi, C., Gazeau, F., Appolis, A., Le Luyer, J., and Pernet, F.: Revisiting tolerance to ocean acidification: Insights from a new framework combining physiological and molecular tipping points of Pacific oyster, Glob. Change Biol., 28, 3333–3348, https://doi.org/10.1111/gcb.16101, 2022.
Martz, T. R., Connery, J. G., and Johnson, K. S.: Testing the Honeywell Durafet® for seawater pH applications, Limnol. Oceanogr.-Meth., 8, 172–184, https://doi.org/10.4319/lom.2010.8.172, 2010.
McKinney, W.: Data Structures for Statistical Computing in Python, Python in Science Conference, 28–30 2010 June, Austin, Texas, 56–61, https://doi.org/10.25080/Majora-92bf1922-00a, 2010.
McLaughlin, K., Dickson, A., Weisberg, S. B., Coale, K., Elrod, V., Hunter, C., Johnson, K. S., Kram, S., Kudela, R., Martz, T., Negrey, K., Passow, U., Shaughnessy, F., Smith, J. E., Tadesse, D., Washburn, L., and Weis, K. R.: An evaluation of ISFET sensors for coastal pH monitoring applications, Regional Studies in Marine Science, 12, 11–18, https://doi.org/10.1016/j.rsma.2017.02.008, 2017.
Michaud, H., Leredde, Y., Estournel, C., Berthebaud, É., and Marsaleix, P.: Modelling and in-situ measurements of intense currents during a winter storm in the Gulf of Aigues-Mortes (NW Mediterranean Sea), C. R. Geosci., 345, 361–372, https://doi.org/10.1016/j.crte.2013.07.001, 2013.
Newton, J. A., Feely, R. A., Jewett, E. B., Williamson, P., and Mathis, J.: Global ocean acidification observing network: requirements and governance plan, GOA-ON, Washington, 61 pp., http://www.goa-on.org/documents/general/GOA-ON_2nd_edition_final.pdf (last access: 3 April 2024), 2015.
Orr, J. C., Epitalon, J.-M., Dickson, A. G., and Gattuso, J.-P.: Routine uncertainty propagation for the marine carbon dioxide system, Mar. Chem., 207, 84–107, https://doi.org/10.1016/j.marchem.2018.10.006, 2018.
Perez, F. F. and Fraga, F.: Association constant of fluoride and hydrogen ions in seawater, Mar. Chem., 21, 161–168, https://doi.org/10.1016/0304-4203(87)90036-3, 1987.
Petton, S., Pouvreau, S., and Dumas, F.: Intensive use of Lagrangian trajectories to quantify coastal area dispersion, Ocean Dynam., 70, 541–559, https://doi.org/10.1007/s10236-019-01343-6, 2020.
Petton, S., Le Roy, V., and Pouvreau, S.: SMART Daoulas data from coriolis Data Centre in the Bay of Brest, SEANOE [data set], https://doi.org/10.17882/86020, 2021.
Petton, S., Pernet, F., Le Roy, V., Huber, M., Martin, S., Mace, E., Bozec, Y., Loisel, S., Rimmelin-Maury, P., Grossteffan, E., Repecaud, M., Quéméner, L., Retho, M., Manach, S., Papin, M., Pineau, P., Lacoue-Labarthe, T., Deborde, J., Costes, L., Polsenaere, P., Rigouin, L., Benhamou, J., Gouriou, L., Lequeux, J., Labourdette, N., Savoye, N., Messiaen, G., Foucault, E., Lagarde, F., Richard, M., Ouisse, V., Voron, F., Mas, S., Giannecchini, L., Vidussi, F., Mostajir, B., Leredde, Y., Kempf, V., Alliouane, S., Gattuso, J.-P., and Gazeau, F.: French coastal carbonate dataset from the CocoriCO2 project, SEANOE [data set], https://doi.org/10.17882/96982, 2023a.
Petton, S., Garnier, V., Caillaud, M., Debreu, L., and Dumas, F.: Using the two-way nesting technique AGRIF with MARS3D V11.2 to improve hydrodynamics and estimate environmental indicators, Geosci. Model Dev., 16, 1191–1211, https://doi.org/10.5194/gmd-16-1191-2023, 2023b.
Petton, S., Pouvreau, S., and Fleury, E.: ECOSCOPA network: high frequency environmental database, SEANOE [data set], https://doi.org/10.17882/86131, 2023c.
Planque, B., Lazure, P., and Jégou, A.: Detecting hydrological landscapes over the Bay of Biscay continental shelf in spring, Clim. Res., 28, 41–52, https://doi.org/10.3354/cr028041, 2004.
Plus, M., Dumas, F., Stanisière, J. Y., and Maurer, D.: Hydrodynamic characterization of the Arcachon Bay, using model-derived descriptors, Cont. Shelf Res., 29, 1008–1013, https://doi.org/10.1016/j.csr.2008.12.016, 2009.
Puillat, I., Lazure, P., Jégou, A. M., Lampert, L., and Miller, P. I.: Hydrographical variability on the French continental shelf in the Bay of Biscay, during the 1990s, Cont. Shelf Res., 24, 1143–1163, https://doi.org/10.1016/j.csr.2004.02.008, 2004.
Ratmaya, W., Soudant, D., Salmon-Monviola, J., Plus, M., Cochennec-Laureau, N., Goubert, E., Andrieux-Loyer, F., Barillé, L., and Souchu, P.: Reduced phosphorus loads from the Loire and Vilaine rivers were accompanied by increasing eutrophication in the Vilaine Bay (south Brittany, France), Biogeosciences, 16, 1361–1380, https://doi.org/10.5194/bg-16-1361-2019, 2019.
Retho, M., Quemener, L., Le Gall, C., Repecaud, M., Souchu, P., Gabellec, R., and Manach, S.: COAST-HF – data and metadata from the MOLIT buoy in the Vilaine Bay, SEANOE [data set], https://doi.org/10.17882/46529, 2022.
Riebesell, U. and Gattuso, J.-P.: Lessons learned from ocean acidification research, Nat. Clim. Change, 5, 12–14, https://doi.org/10.1038/nclimate2456, 2015.
Ries, J. B., Cohen, A. L., and McCorkle, D. C.: Marine calcifiers exhibit mixed responses to CO2-induced ocean acidification, Geology, 37, 1131–1134, https://doi.org/10.1130/G30210A.1, 2009.
Rimmelin-Maury, P., Charria, G., Repecaud, M., Quemener, L., Beaumont, L., Guillot, A., Gautier, L., Prigent, S., Le Becque, T., Bihannic, I., Bonnat, A., Le Roux, J.-F., Grossteffan, E., Devesa, J., and Bozec, Y.: Iroise buoy data from Coriolis data center as core parameter support for Brest Bay and Iroise sea studies, SEANOE [data set], https://doi.org/10.17882/74004, 2020.
Rosenau, N. A., Galavotti, H., Yates, K. K., Bohlen, C. C., Hunt, C. W., Liebman, M., Brown, C. A., Pacella, S. R., Largier, J. L., and Nielsen, K.: Integrating high-resolution coastal acidification monitoring data across seven United States estuaries, Front. Marine Sci., 8, https://doi.org/10.3389/fmars.2021.679913, 2021.
Simpson, E., Ianson, D., Kohfeld, K. E., Franco, A. C., Covert, P. A., Davelaar, M., and Perreault, Y.: Variability and drivers of carbonate chemistry at shellfish aquaculture sites in the Salish Sea, British Columbia, Biogeosciences, 21, 1323–1353, https://doi.org/10.5194/bg-21-1323-2024, 2024.
Soletchnik, P., Faury, N., Razet, D., and Goulletquer, P.: Hydrobiology of the Marennes-Oléron bay. Seasonal indices and analysis of trends from 1978 to 1995, Hydrobiologia, 386, 131–146, https://doi.org/10.1023/A:1003511815728, 1998.
Sutton, A. J., Battisti, R., Carter, B., Evans, W., Newton, J., Alin, S., Bates, N. R., Cai, W.-J., Currie, K., Feely, R. A., Sabine, C., Tanhua, T., Tilbrook, B., and Wanninkhof, R.: Advancing best practices for assessing trends of ocean acidification time series, Front. Marine Sci., 9, 1045667, https://doi.org/10.3389/fmars.2022.1045667, 2022.
Takeshita, Y., Frieder, C. A., Martz, T. R., Ballard, J. R., Feely, R. A., Kram, S., Nam, S., Navarro, M. O., Price, N. N., and Smith, J. E.: Including high-frequency variability in coastal ocean acidification projections, Biogeosciences, 12, 5853–5870, https://doi.org/10.5194/bg-12-5853-2015, 2015.
Waldbusser, G. G., Hales, B., Langdon, C. J., Haley, B. A., Schrader, P., Brunner, E. L., Gray, M. W., Miller, C. A., and Gimenez, I.: Saturation-state sensitivity of marine bivalve larvae to ocean acidification, Nat. Clim. Change, 5, 273–280, https://doi.org/10.1038/nclimate2479, 2015.