the Creative Commons Attribution 4.0 License.
the Creative Commons Attribution 4.0 License.
 | 26 Mar 2024
HiQ-LAI: a high-quality reprocessed MODIS leaf area index dataset with better spatiotemporal consistency from 2000 to 2022
Jingrui Wang
Rui Peng
Kai Yang
Xiuzhi Chen
Gaofei Yin
Jinwei Dong
Marie Weiss
Jiabin Pu
Ranga B. Myneni
Leaf area index (LAI) is a crucial parameter for characterizing vegetation canopy structure and energy absorption capacity. The Moderate Resolution Imaging Spectroradiometer (MODIS) LAI has played a significant role in landmark studies due to its clear theoretical basis, extensive historical time series, extensive validation results, and open accessibility. However, MODIS LAI retrievals are calculated independently for each pixel and a specific day, resulting in high noise levels in the time series and limiting its applications in the regions of optical remote sensing. Reprocessing MODIS LAI predominantly relies on temporal information to achieve smoother LAI profiles with little use of spatial information and may easily ignore genuine LAI anomalies. To address these problems, we designed the spatiotemporal information compositing algorithm (STICA) for the reprocessing of MODIS LAI products. This method integrates information from multiple dimensions, including pixel quality information, spatiotemporal correlation, and the original retrieval, thereby enabling both “reprocessing” and “value-added data” with respect to the existing MODIS LAI products, leading to the development of the high-quality LAI (HiQ-LAI) dataset. Compared with ground measurements, HiQ-LAI shows better performance than the original MODIS product with a root-mean-square error (RMSE) or bias decrease from 0.87 or −0.17 to 0.78 or −0.06, respectively. This is due to the improvement of HiQ-LAI with respect to capturing the seasonality in vegetation phenology and reducing abnormal time-series fluctuations. The time-series stability (TSS) index, which represents temporal stability, indicated that the area with smooth LAI time series expanded from 31.8 % (MODIS) to 78.8 % (HiQ) globally, and this improvement is more obvious in equatorial regions where optical remote sensing cannot usually achieve good performance. We found that HiQ-LAI demonstrates superior continuity and consistency compared with raw MODIS LAI from both spatial and temporal perspectives. We anticipate that the global HiQ-LAI time series, generated using the STICA procedure on the Google Earth Engine (GEE) platform, will substantially enhance support for diverse global LAI time-series applications. The 5 km 8 d HiQ-LAI datasets from 2000 to 2022 are available at https://doi.org/10.5281/zenodo.8296768 (Yan et al., 2023).
- Article
(18501 KB) - Full-text XML
-
Supplement
(2058 KB) - BibTeX
- EndNote


In recent years, the monitoring and assessment of vegetation parameters have gained increasing importance in the context of global climate change and the emphasis on ecosystem functions (Fang et al., 2019). Leaf area index (LAI), which is a basic parameter affecting the processes of plant water balance, radiation absorption, and photosynthetic activity (Knyazikhin et al., 1998; P. J. Sellers et al., 1997; Fang et al., 2019), is commonly defined as the one-sided green leaf area per unit ground horizontal surface area of broadleaf canopies and as the projected needle area of coniferous canopies (Chen and Black, 1992). LAI plays a crucial role in vegetation monitoring, agricultural management, and ecological modeling (Richardson et al., 2013; Zhu et al., 2016; De Wit et al., 2012). With advancements in remote-sensing technology (e.g., large-scale and continuous observation) and improved data acquisition capabilities, LAI estimation and spatiotemporal dynamic monitoring have become more accurate and comprehensive (Fang et al., 2019; Ganguly et al., 2010).
Among the various LAI time-series products with global coverage, the Moderate Resolution Imaging Spectroradiometer (MODIS) LAI product has been among the most extensively utilized LAI datasets. MODIS LAI offers clear theoretical foundations, extensive historical time series, satisfactory validation result outcomes, and an open-access policy (Yan et al., 2016b, 2021a). Additionally, it does not rely on other LAI products as input data, ensuring complete independence (Myneni et al., 2002). It is often utilized as a training dataset for other products (Baret et al., 2013; Ma and Liang, 2022) and as reference data for comparison (Xiao et al., 2013; Yan et al., 2016b). The long-time-series MODIS LAI dataset has made significant contributions to landmark studies on the “Greening the Earth” phenomena, the possible causes of large-scale vegetation dynamics, and the relationship between vegetation dynamics and global climate change or human activities (Mao et al., 2013; Chen and Dirmeyer, 2016; Zhu et al., 2016; Chen et al., 2019). From this perspective, the high quality of the MODIS LAI product is of the utmost importance.
The MODIS LAI operational algorithms comprise the main algorithm based on the three-dimensional radiative transfer theory and a backup algorithm based on the empirical relationship between the normalized difference vegetation index (NDVI) and canopy LAI (Myneni et al., 2002; Pu et al., 2020; Yan et al., 2018). The main algorithm utilizes a look-up table (LUT) inversion strategy and introduces the biome classification map as prior knowledge to reduce uncertainties associated with ill-posed inversion problems. By modeling the photon transfer process, the surface spectral bidirectional reflectance factors (BRFs) are linked to structural and spectral parameters of the vegetation canopy and soil. Based on atmospherically corrected BRFs and their uncertainties, the algorithm identifies candidate LAIs by comparing observed and modeled BRFs stored in biome-specific LUTs (Knyazikhin et al., 1998; Knyazikhin, 1999). When the uncertainty of the input BRFs falls within a point on the red NIR plane and an area, all canopy or soil patterns are considered as the candidate solutions, and the mean LAI values of these solutions are used as the output values of the main algorithm. The backup algorithm is triggered when the main algorithm fails, such as when the uncertainty of input BRFs exceeds a threshold or when there are inaccuracies in BRF simulation due to deficiencies in the radiative transfer model. The best retrievals are then selected using the temporal compositing method, and the 4 d or 8 d product is generated from the daily retrievals. Therefore, MODIS LAI retrievals are calculated independently for each pixel and day. Differences in adjacent observational conditions lead to significant uncertainty in the LAI time series. Specifically, atmospheric conditions (e.g., cloud cover, snow, and aerosol pollution), sensor malfunctions, and the inherent uncertainties in the retrieval algorithm all introduce challenges, resulting in poor spatiotemporal consistency and high noise in MODIS LAI products (Brown et al., 2020; Fuster et al., 2020; Yan et al., 2021b). Consequently, inconsistency and excessive noise impose limitations on its practical applications in research involving yield estimation, crop growth monitoring, terrestrial carbon monitoring, and global ecosystem dynamic simulation (Li et al., 2017; Xiao et al., 2009; Chen et al., 2020).
Many methods have been proposed to reprocess MODIS LAI products (ranging from Collection 4, C4, to Collection 6, C6) to improve their quality. A pressing need exists for continuous, high-quality, and easily accessible LAI datasets to better facilitate investigations in land surface process simulation, climate modeling, and global change research. Fang et al. (2006) proposed a spatiotemporal filtering (TSF) method that integrates the multi-seasonal average trend (background) and seasonal observations to generate spatially and temporally continuous MODIS LAI C4 products for the North American region to fill in and improve the gaps and poor quality values caused by cloud cover, seasonal snow cover, and instrument problems. Gao et al. (2008) utilized TIMESAT to process the MODIS LAI C4 product, aiming to fit the LAI time-series profile by incorporating sufficient high-quality data and replacing low-quality or missing observations, thereby obtaining a high-quality, spatiotemporally continuous LAI time series for the North American region to produce temporally smoothed and spatially continuous biophysical data for the North American Carbon Program. Aiming to generate a continuous input dataset for global climate models, Yuan et al. (2011) improved the Fang et al. (2006) method and proposed the modified TSF (mTSF) method to conduct simple data assimilation for relatively low-quality data and used post-processing TIMESAT and Savitzky–Golay (SG)filtering to obtain the final improved MODIS LAI C5 product. Recently, Hua Yuan's group (Lin et al., 2023) reprocessed MODIS LAI C6 products using a similar procedure. While these methods effectively utilize temporal and QC layer information, they frequently overlook the utilization of spatial information or rely on spatial correlation as an alternative and place a greater emphasis on leveraging temporal information. Consequently, although the LAI profile may appear smoother, genuine land surface LAI anomalies (e.g., caused by forests fire) may be artificially removed.
To address this issue, we proposed a spatiotemporal information compositing algorithm (STICA) in a previous study (Wang et al., 2023). This algorithm directly introduces prior multiple quality assessment (MQA) information and spatiotemporal correlation information into the MODIS LAI C6.1 product. Firstly, we carefully assessed the quality of MODIS LAI retrievals to obtain MQA information. Subsequently, the quality, spatiotemporal information, and relative original observational records are fully utilized, and these pieces of information are weighted and averaged according to our fusion strategy. More robust results are obtained by considering multiple dimensions of information to compensate for the limitations of using a single information source and by preserving LAI anomalies that are as realistic as possible. The advantages of our approach are as follows: (1) ensure consistency with existing MODIS LAI products while preserving the unique benefits of MODIS that maintain the original physics-based (radiative transfer model, RTM) production process; (2) leveraging pixel quality information to improve MODIS LAI retrievals with poor quality, facilitating the reprocessing and value-added data of the existing product. We anticipate that the high-quality LAI (HiQ-LAI) product effectively addresses regions with quality issues while maintaining good consistency with the original MODIS product, holding significant implications for the development of other LAI/FPAR (fraction of photosynthetically active radiation absorbed by vegetation) products.
We implemented the entire algorithm process using the Google Earth Engine (GEE) cloud computing platform (Gorelick et al., 2017) to reprocess MODIS C6.1 LAI, resulting in the production of the HiQ-LAI dataset covering the years from 2000 to 2022 on a global scale. The accuracy of HiQ-LAI was evaluated through ground-based validation and compared with MODIS LAI at a global scale and across different biome types. The temporal consistency and trends of global LAI products were analyzed, with in-depth comparative assessments conducted for regions exhibiting significant quality issues.
2.1 MODIS Land Cover map: MCD12Q1
The biome classification map serves as an auxiliary dataset for MODIS LAI, primarily aimed at reducing uncertainty in the retrieval algorithm. In the MODIS retrieval algorithm, parameters are configured based on the biome classification map to establish an accurate relationship between satellite observations and ground parameters (Knyazikhin, 1999). The MODIS Land Cover Type product (MCD12Q1) provides global land cover maps at annual time steps and a 500 m spatial resolution from 2001 to the present. The product was created using supervised classification of MODIS reflectance data for a total of 13 scientific datasets. MCD12Q1 adopts an LAI legacy classification scheme, including B1 (grass and cereal crops), B2 (shrubs), B3 (broadleaf crops), B4 (savanna), B5 (evergreen broadleaf forest, EBF), B6 (deciduous broadleaf forest, DBF), B7: (evergreen coniferous forest, ENF), and B8 (deciduous coniferous forest, DNF) (Yan et al., 2016a; Sulla-Menashe and Friedl, 2018). Figure 1 illustrates the approximate global distribution of biome types based on the land cover in 2021.
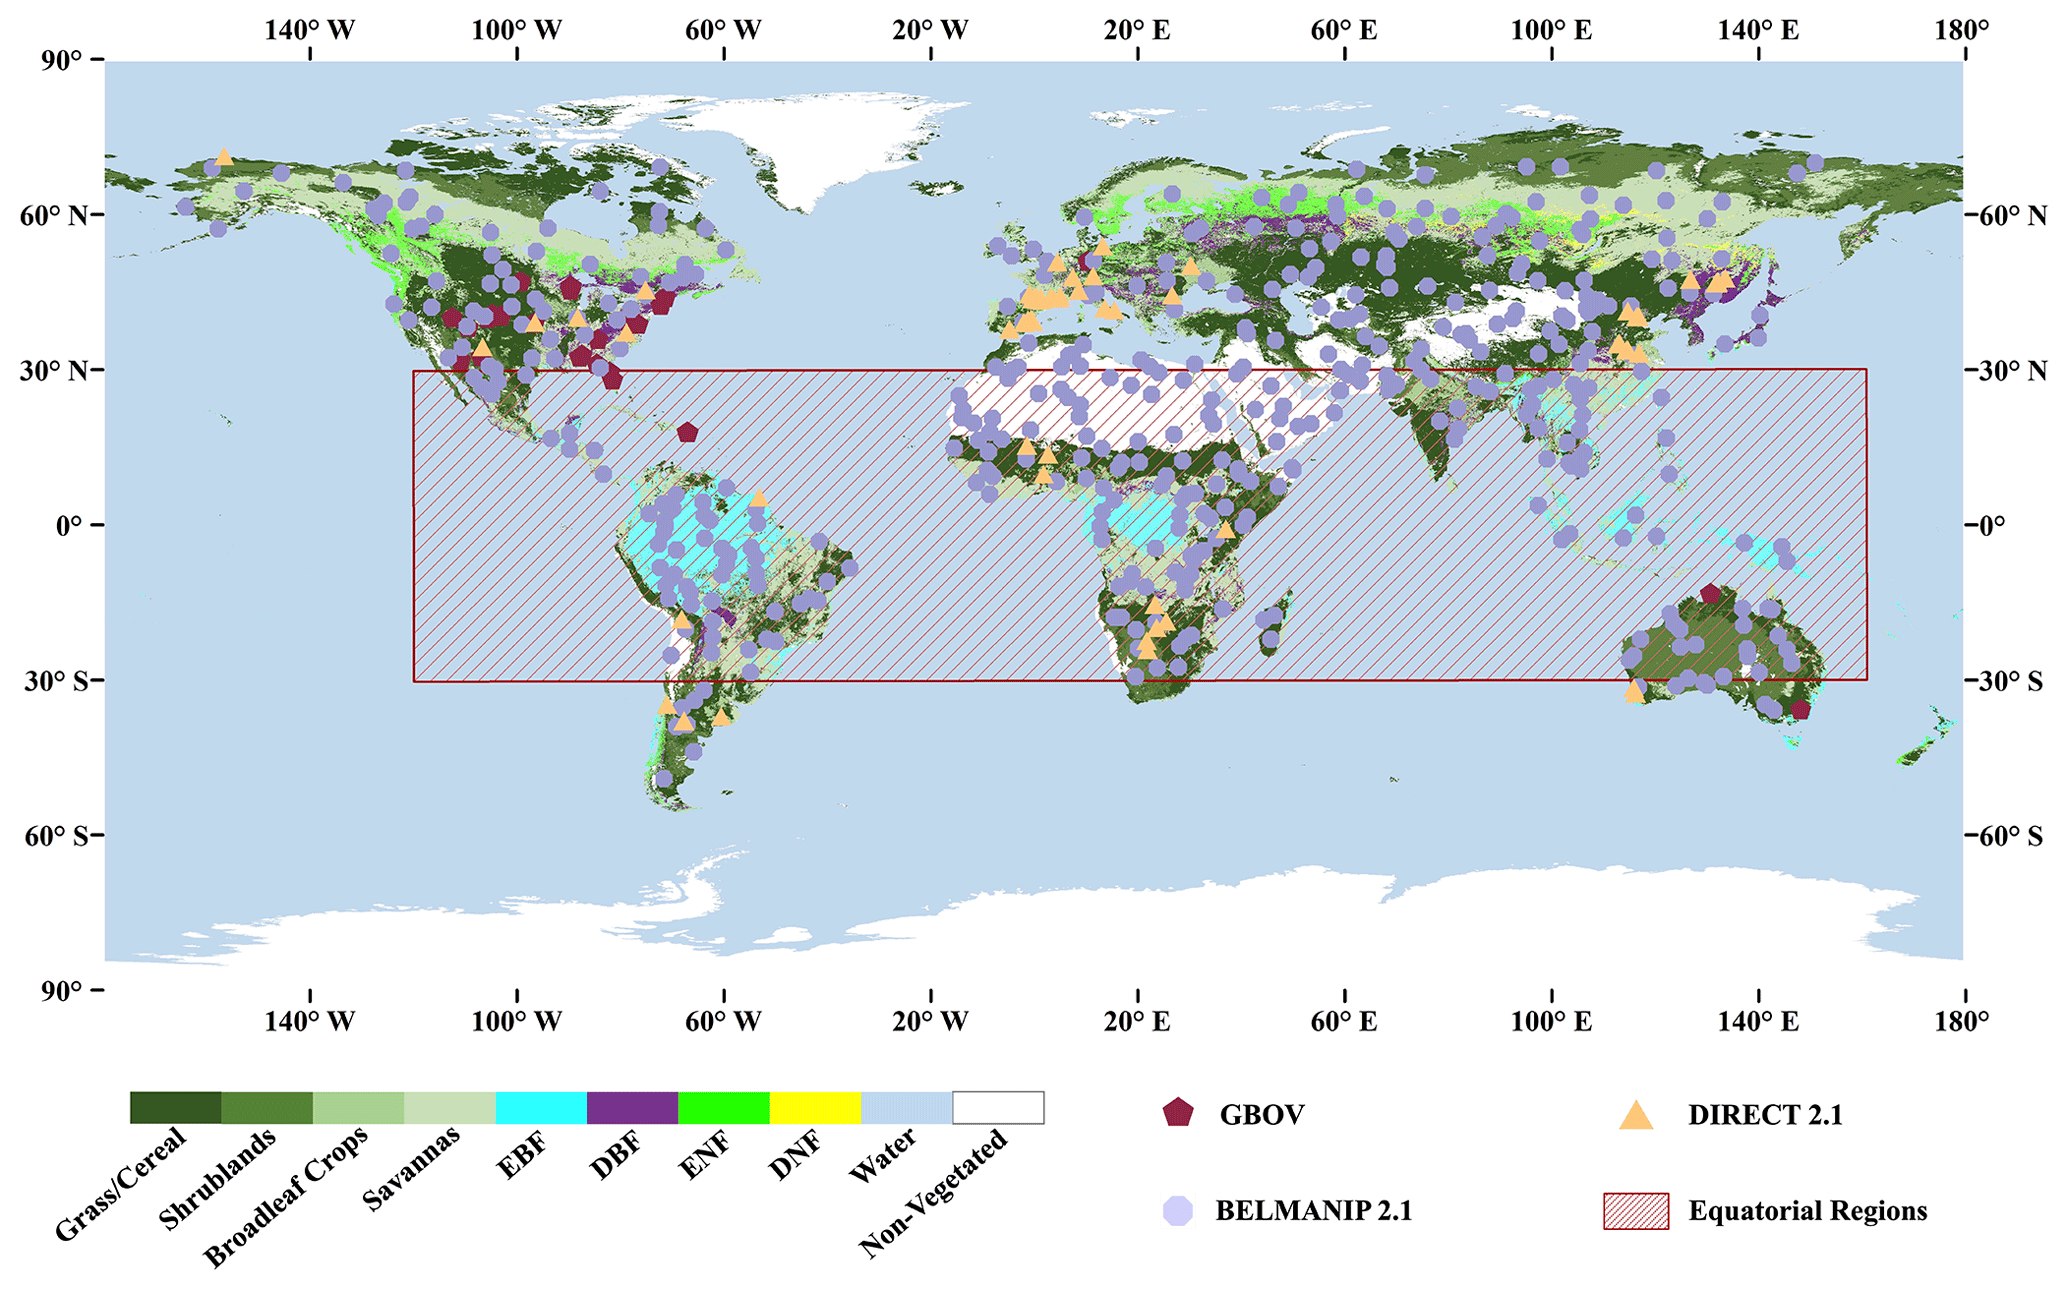
Figure 1Geographical distribution of the selected sites. The background color indicates the biome types of the 2021 MCD12Q1 classification scheme. The maroon hexagons, yellow triangles, purple dots, and red frame represent the GBOV sites, DIRECT 2.1 sites, BELMANIP 2.1 sites, and equatorial regions, respectively.
2.2 MODIS LAI/FPAR product: MOD15A2H
The standard MODIS LAI C6.1 product suite (MOD15A2H) offers global coverage with an 8 d temporal resolution and a 500 m spatial resolution (Yan et al., 2016a) spanning from February 2000 to the present. Typically, there are 46 composites per year, but some composites may be missing due to factors such as sensor issues or other anomalies (e.g., in 2001, 2016, and 2022). This LAI product is projected onto a sinusoidal grid and distributed as a standard Hierarchical Data Format (HDF) file. Each file contains six science datasets (SDSs): fraction of photosynthetically active radiation absorbed by vegetation (FPAR), LAI, FparLai_QC, FparExtra_QC, FparStdDev, and LaiStdDev. The LAI, FparLai_QC, and LaiStdDev layers store the LAI retrieval, quality control information, and retrieval uncertainty, respectively (Knyazikhin et al., 1998; Yan et al., 2016a; Myneni, 2020). Therefore, for this study, we utilized these three SDSs.
2.3 Ground LAI reference
With the increasing availability of Earth observation products, increasing attention has been paid to the product uncertainty assessed by verification based on ground measurements (Baret et al., 2006; Fang et al., 2012; Wenze et al., 2006). To evaluate the performance of the HiQ-LAI product, we utilized the Copernicus Ground-Based Observations for Validation (GBOV) LAI, DIRECT 2.1 LAI, and the BEnchmark Land Multisite ANalysis and Intercomparison of Products 2.1 (BELMANIP 2.1) as ground site references (Bai et al., 2019; Baret et al., 2006; Morisette et al., 2006).
2.3.1 GBOV
The GBOV service, which is part of the Copernicus Global Land Service (CGLS), is dedicated to the development and distribution of robust in situ datasets from various ground monitoring sites for the systematic and quantitative validation of land products (Bai et al., 2019; Brown et al., 2020). A comprehensive GBOV reference measurement database has been established through quality control and reprocessing of raw measurements obtained from existing in situ sites. This database includes canopy reflectance, surface albedo, LAI, FPAR, cover area, 5 cm soil moisture, and surface temperature. Currently, 29 available sites provide LAI references from 2013 to 2022. The data from this database are freely accessible to the scientific community through the GBOV portal (https://gbov.acri.fr, last access: 20 April 2023). In this study, we used the Land Products 3 (LP-3) leaf area index as the reference LAI.
2.3.2 DIRECT V2.1
We also employed the DIRECT V2.1 ground measurement reference to validate satellite-based products. This validation dataset was curated from a collection of sites that followed the Committee on Earth Observation Satellites (CEOS) Working Group on Calibration and Validation (WGCV) Land Product Validation (LPV) guidelines for collecting and processing ground survey data (Morisette et al., 2006; Garrigues et al., 2008). Mean values of LAI, the maximum fraction of photosynthetically active radiation absorbed by vegetation (FPAR), and vegetation cover (FCover) over a 3 km × 3 km area were compiled from the DIRECT V2.1 database. According to the CEOS WGCV LPV LAI good practices (Fernandes et al., 2014), the ground data were upscaled using an empirical “transfer function” between high-spatial-resolution radiation data and biophysical measurements to appropriately account for the spatial heterogeneity of the site. The DIRECT V2.1 database constitutes a major effort of the international community to provide ground references for the validation of LAI and FPAR Essential Climate Variables (ECVs). It currently encompasses 176 sites across seven major biome types around the world, with 280 LAI values, 128 FPAR values, and 122 FCover values spanning from 2000 to 2021 (https://calvalportal.ceos.org/lpv-direct-v2.1, last access: 21 March 2024).
2.4 BELMANIP V2.1
The BELMANIP site network was designed to represent the global variability in vegetation types and climatological conditions, independent of ground-based experimental measurements (Baret et al., 2006). The network primarily incorporates sites from existing experimental networks (FLUXNET, AERONET, VALERI, BigFoot, etc.) supplemented by sites from the Global Land Cover 2000 (GLC2000) land cover map. The BELMANIP V2.1 that we used was constructed using the GlobCover vegetation land cover map derived from Medium Resolution Imaging Spectrometer (MERIS) images in 2009. Site selection was conducted for each band of latitude (10° width), ensuring that the selected sites represented the same proportion of biome types as the entire latitude band. These sites are characterized by a uniform and nearly flat topography within a 10 km × 10 km area, with a minimum proportion of urban areas and permanent waterbodies. The updated BELMANIP V2.1 dataset (Fig. 1) added 25 sites corresponding to bare land (desert) and tropical forests, resulting in a total of 445 sites (https://calvalportal.ceos.org/web/olive/site-description, last access: 21 March 2024). It is important to note that most of these sites do not have ground reference measurements. Consequently, the network is primarily used for comparative analysis among sites rather than direct validation.
3.1 Proposed spatiotemporal information compositing algorithm
We proposed a spatiotemporal information composition algorithm (STICA) aimed at reducing noise fluctuations and improving the overall quality of the MODIS LAI product. This algorithm directly incorporates the prior spatiotemporal correlation information and multiple quality assessment (MQA) information into the existing MODIS LAI product. The detailed algorithmic process can be found in the article published by Wang et al. (2023). The algorithm consists of four main steps: multiple quality assessment, employing spatial correlation information, employing temporal correlation information, and multiple information compositing.
Satellite remote-sensing observations are often subject to uncertainties arising from climatic factors, sensor malfunctions, and other sources, resulting in varying levels of uncertainty for individual pixels. To address this issue, this approach employed multiple indicators to evaluate the uncertainty for each pixel (referred to as MQA hereafter). These indicators encompass the algorithm path, LAI standard deviation (SD), and relative time-series stability (TSS). The algorithm path (AP) is a crucial quality index, distinguishing between the main and backup algorithms. The main algorithm offers superior quality and precision retrieval, and the weight ratio of the main algorithm and backup algorithm has been determined as 6:4 in a previous study (Wang et al., 2023). The LAI SD reflects the retrieval uncertainty. The AP and LAI SD are derived from the FparLai_QC and LaiStdDev layers of the original MODIS data. The third indicator, relative TSS (RE-TSS), indicates the fluctuation in a time series (Zou et al., 2022). Following the principle of assigning a higher weight to smaller values, the LAI SD and RE-TSS are incorporated into the retrieval with the main algorithm, resulting in the generation of a new quality classification indicator, the MQA. Subsequently, the inverse distance weighting (IDW) method is utilized on the spatial scale to calculate the weighted average of all eligible pixels (belonging to the same land cover type) within the half-width of four pixels and the power exponent of 2 (Wang et al., 2023) of the target pixel. In this algorithm, the contribution of a pixel is determined not only by its spatial distance but also by its MQA value. In a word, pixels with closer proximity and a higher MQA value make a more significant contribution to the target pixel. On the temporal scale, the simple exponential smoothing (SES) method is employed to calculate the weighted average of all eligible pixels within the smoothing parameter of 0.5 and the half-length of 3 (Wang et al., 2023). Pixels that are closer in time to the target pixel and possess higher MQA values are assigned greater weights. Utilizing spatial/temporal correlation is based on spatial and temporal autocorrelation, i.e., everything is related to everything else, but near things are more related than distant things. The final step of the algorithm is to take a weighted average of the original MODIS LAI and the LAI calculated using spatial/temporal correlation, with their respective weights quantified using an indicator (TSS) that represents the temporal fluctuation in the time series (Zou et al., 2022). All processes of the method are implemented using the GEE cloud computing platform. The reprocessed LAI dataset, namely the HiQ-LAI product, has been generated with the help of the powerful cloud computing capability of GEE, covering the period from 2000 to 2022.
3.2 Assessment of LAI datasets
In this study, we utilized the GBOV LAI measurements from a total of 29 sites spanning from 2013 to 2021 as our ground reference LAI (Bai et al., 2019; Brown et al., 2020). A 3 km × 3 km square centered on the site location was selected as the study area (Fig. 1) so that the corresponding LAI product of each site was 36 (6 × 6) pixels. To enhance the credibility of the ground truth LAI, we filtered the ground LAI reference of these 29 sites based on the criterion that the “effective pixel” exceeded 90 % and the input and output of the land product value in the data aggregation process were within the specified range. This filtering process yielded a total of 818 reliable verification data points. Contrary to previous studies (Wang et al., 2023) that utilized only 2018 data from the GBOV site as a reference, this study expanded the timeline from 2013 to 2021, increased the number of sites from 24 to 29, and raised the criterion for effective pixels from 80 % to 90 %. These modifications were aimed at enhancing the reliability of the ground LAI data. Additionally, previous research focused on proposing and testing algorithms mainly at the tile scale, but this study migrated the algorithm to GEE to generate global long-term data series. Furthermore, the scope of analysis was also broadened to a global spatial scale and long-term time series. A comparative analysis was conducted at the spatial scale to examine the global spatial distribution of the LAI in February and July 2021. The mean LAI values for latitude bands were then calculated at 1° intervals during these specific months. Furthermore, we compared the global consistency of MODIS LAI and HiQ-LAI in 2021 using the BELMANIP V2.1 sites (445 in total) (Baret et al., 2006). Employing these sites not only reduced the computational burden at a global scale but also mitigated additional uncertainties arising from geometric registration bias and land cover misclassification. Similar to the GBOV, we selected a study area of 6 pixels × 6 pixels centered on each site location (Fig. 1). The MCD12Q1 data in 2021 were utilized to determine the biome type of each site, which was further classified into pure pixels and hybrid pixels based on B1–B7. The total number of data available for comparison was 16 420. Additionally, we used DIRECT V2.1 ground measurements in this research (Morisette et al., 2006; Garrigues et al., 2008). However, these data were not utilized for direct validation due to the discontinuity in the observed time series at these sites. Instead, the DIRECT V2.1 sites provided valuable reference values in Sect. 5.2. Similarly, a research area of 6 pixels × 6 pixels was selected for each site, and we compared the R2 and RMSE of the two products with sites across different quality grades. The analysis involved determining the RMSE reduction percentage and R2 increase in the percentage of HiQ-LAI relative to MODIS under various quality grades.
In this study, the Theil–Sen slope (TS) method and Mann–Kendall (MK) test (Suhartati, 2013; Theil, 1992) were employed to extract LAI trends from the two products. The TS method computes pairwise slopes across the study period, with the median slope representing the sign and magnitude of the long-term trend. Unlike ordinary least-squares linear regression, the TS trend is less susceptible to the influence of outliers. Meanwhile, the MK test is utilized to determine the significance of the trend (Kendall, 1948). The combination of TS and MK forms a robust approach for identifying trends in long-term sequential data. TS and MK are calculated as follows:
where Xj and Xi represent the LAI value of year j and year i, respectively. Here, TS>0 indicates an increasing trend, whereas TS≤0 indicates a decreasing trend. Following this, the MK test was applied to assess the annual mean trends for MODIS LAI and HiQ-LAI from 2000 to 2022, ensuring the statistical significance of the identified trends.
Here, S represents the sum of step function values obtained from the differences between any two distinct points within the time series, n signifies the total number of data points, m indicates the count of continuous groups in the data (duplicate dataset), and ti refers to the associated count (the number of repetitions in the ith range). Ultimately, we calculate the test statistic Zs, when means reject the null hypothesis (i.e., the absence of a trend), with α representing the significance level. In our analysis, we set α=0.05, with (indicating significance at 90 % and 95 % confidence levels when equal to 1.65 or 1.96, respectively).
The definition of TSS as follows:
where X(tn), X(tn+1), and X(tn−1) represent the LAI value at target moment t, the adjacent time-series data obtained at the previous moment, and the next moment, respectively. TSS denotes the deviation of a value at a given point in time from the linear interpolation line. In this study, higher TSS values indicate greater variability over time.
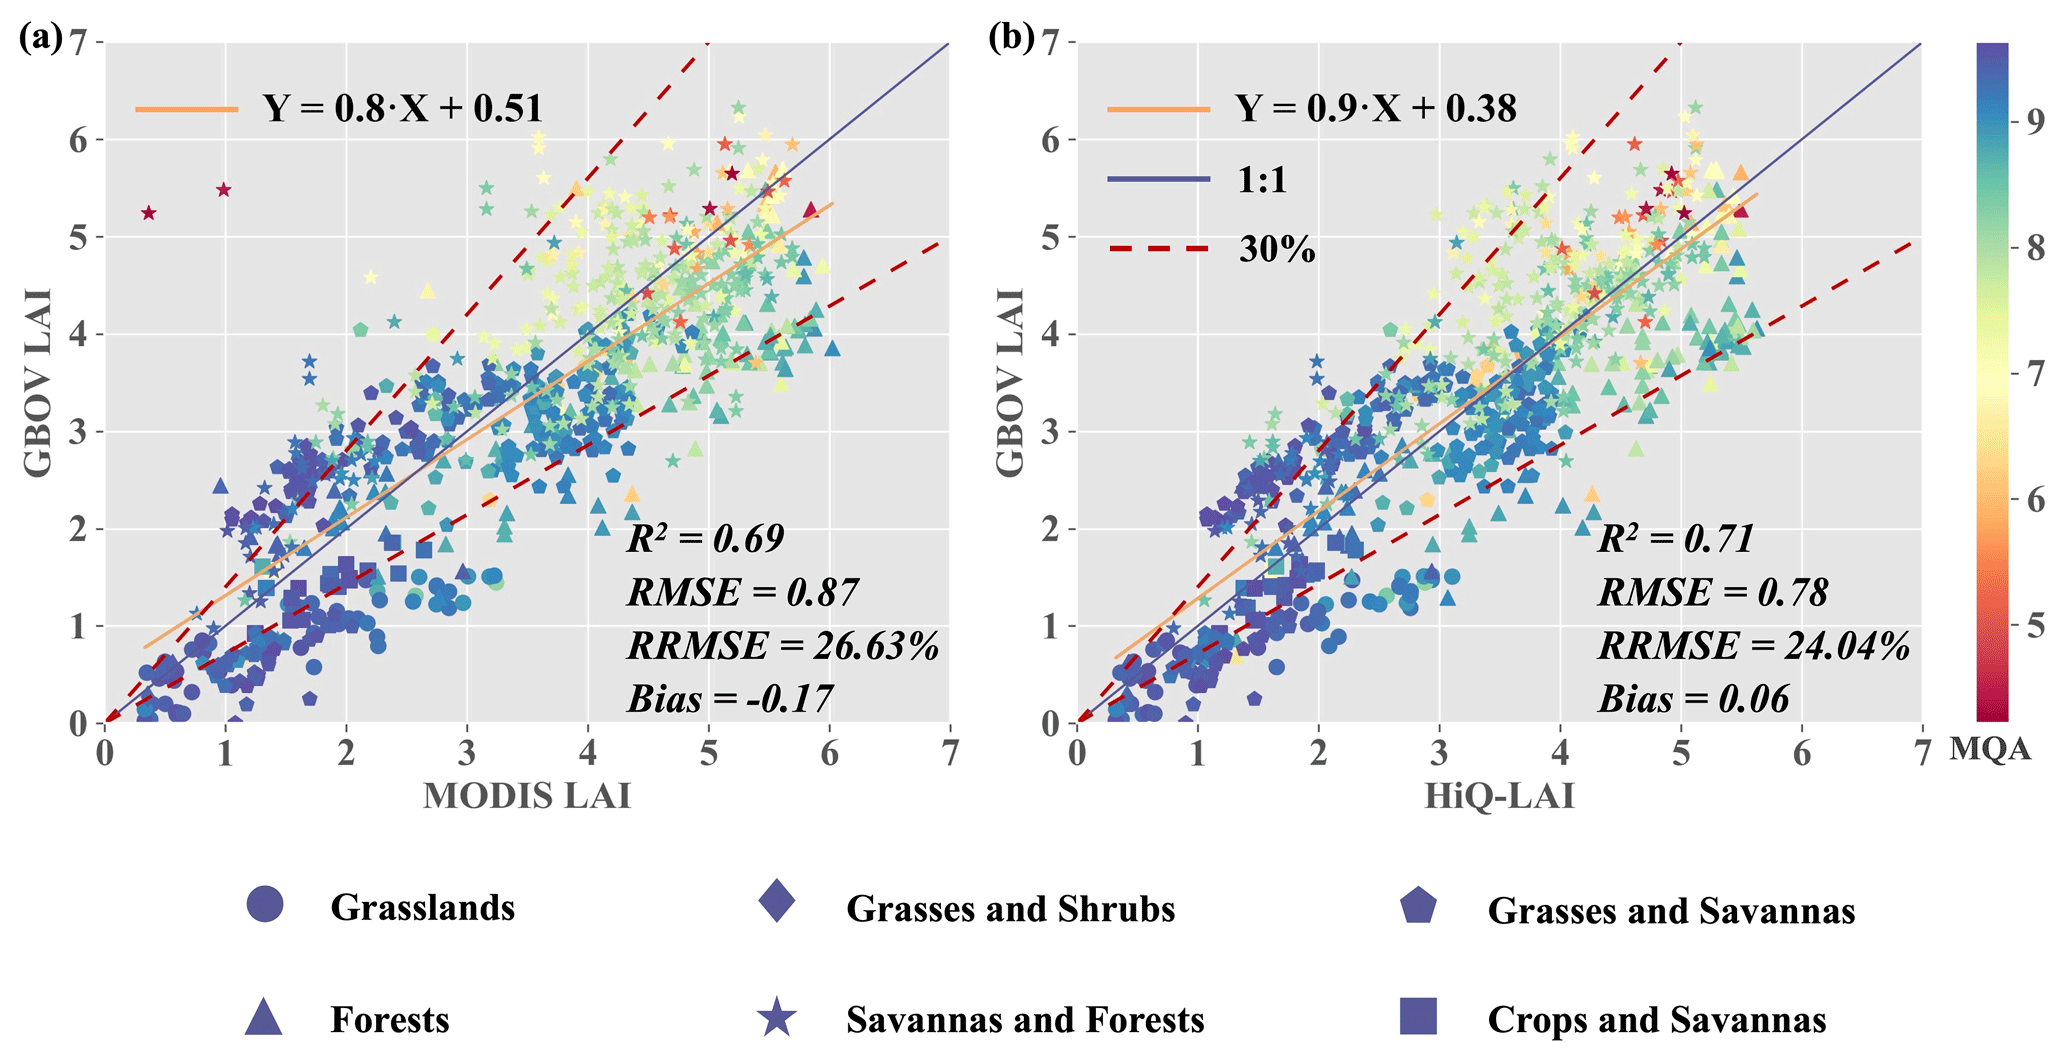
Figure 2Scatterplots comparing MODIS LAI (a) and HiQ-LAI (b) with the GBOV LAI reference (29 sites and 818 measurements). Symbol colors correspond to MQA values from 4 (poor) to 10 (good), and the shape of characters represents different biome types.
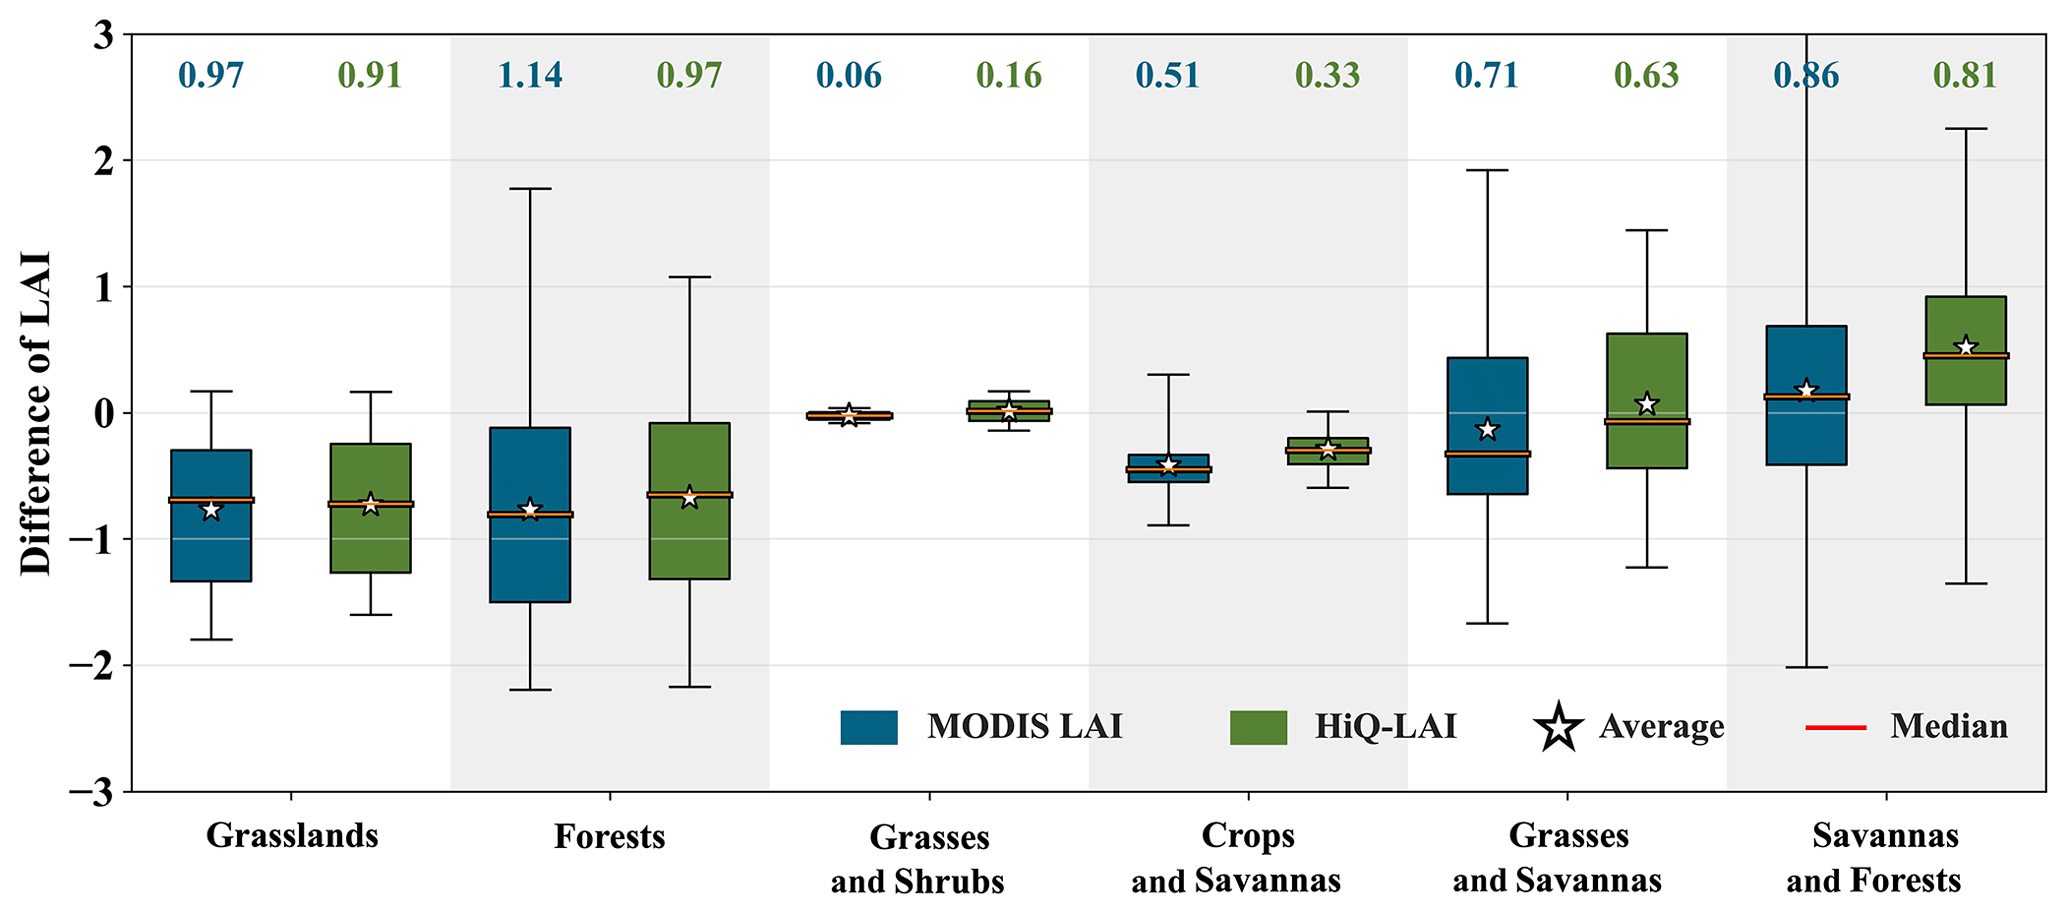
Figure 3Accuracy comparison between two products and GBOV LAI under different vegetation types. The numbers at the top represent the RMSE between the two respective products and the GBOV LAI reference.
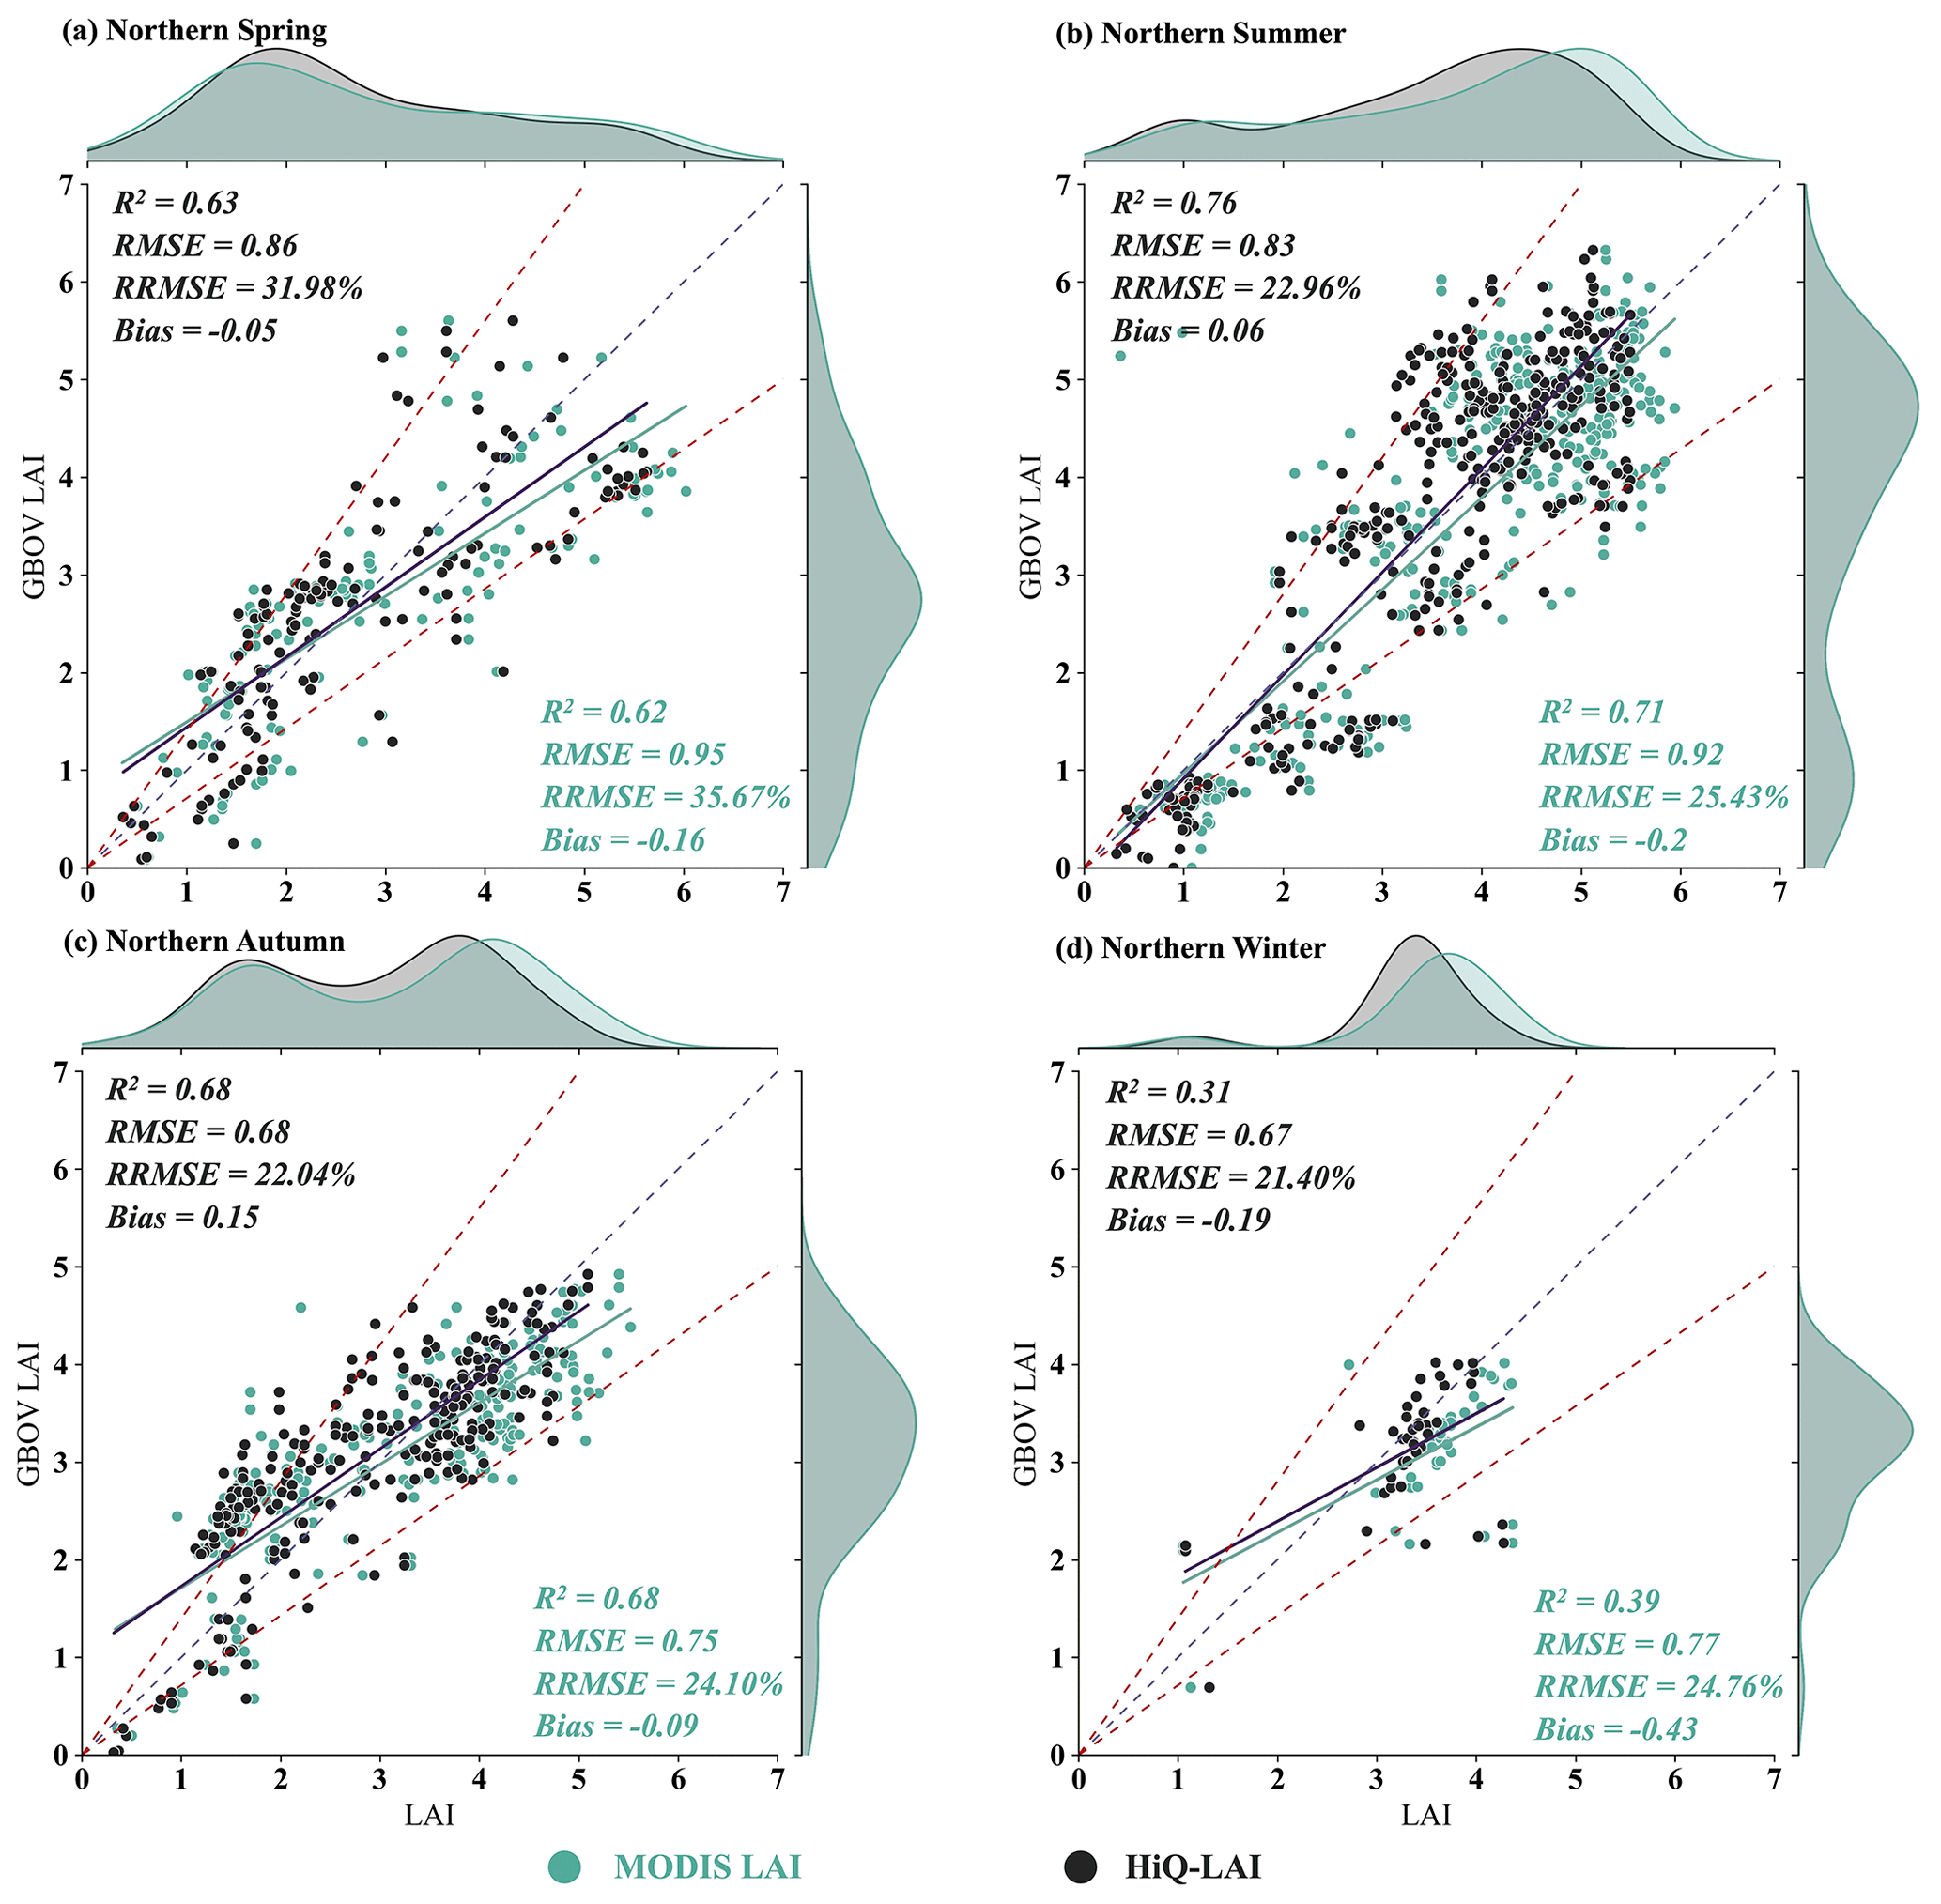
Figure 4Scatterplot distribution comparison of MODIS LAI (green) and HiQ-LAI (black) with the GBOV LAI reference in different seasons. Northern spring, summer, autumn, and winter include the months of March–May, June–August, September–November, and December–February, respectively.
4.1 Validation based on ground LAI reference
Figure 2 depicts the validation results obtained from GBOV ground reference LAI, highlighting the superior performance of HiQ-LAI compared with MODIS LAI. From MODIS LAI to HiQ-LAI, the R2 increases from 0.69 to 0.71, the RMSE decreases from 0.87 to 0.78, the relative RMSE (RRMSE) decreases from 26.63 % to 24.04 %, and the bias shifts from −0.17 to −0.06. Notably, the fitted line of MODIS LAI deviated more prominently from the 1:1 line compared with HiQ-LAI, indicating that HiQ-LAI exhibits higher accuracy with the ground reference LAI. The two methods had negligible differences in LAI performance in terms of the pure-grassland and mixed-grass biome types. However, MODIS LAI exhibited a substantial overestimation for the pure-forest type (Fig. 2, triangles). Incorporating data quality information (MQA), we observed a correspondence between high LAI values and low MQA values, and the majority of pure-forest and mixed-forest sites show the phenomenon of low MQA values. In contrast, the mixed savannas and forest biomes (Fig. 2, pentagrams) displayed an underestimation in MODIS LAI. Furthermore, MODIS LAI exhibited noticeable abnormal retrieval values (Fig. 2, red pentagrams in the upper left-hand corner), whereas HiQ-LAI effectively mitigated these issues. Comparing the LAI difference distribution among various vegetation types (Fig. 3) revealed that HiQ-LAI exhibited a tighter concentration around the zero value, resulting in a decreased RMSE across most categories, except for the third biome type (grasses and shrubs). Mixed savannas and forests emerged as the vegetation types with the widest MODIS LAI difference range. The enhanced HiQ-LAI notably narrowed this distribution range, although the median and mean deviated further from zero. Notably, the two biome types exhibiting the most conspicuous changes in difference distribution were pure forest and mixed crops and savannas. The verification analysis (Fig. 4), comparing both products against GBOV LAI references across different seasons, demonstrated that HiQ-LAI had superior performance over MODIS LAI throughout all four seasons and also outperformed the ground references. Analyzing the LAI density distribution revealed that MODIS LAI (Fig. 4, green) skewed towards higher values on the right-hand side compared with HiQ-LAI (Fig. 4, black). This indicated that MODIS LAI predominantly occupied high-value areas. Furthermore, the RMSE and RRMSE of HiQ-LAI are always smaller than those of MODIS LAI.
The LAI curve should exhibit stable annual and seasonal fluctuations in response to seasonal changes. Nevertheless, various factors such as harsh atmospheric conditions, sensor hardware issues, and other technical challenges introduce significant discrepancies between adjacent time windows of MODIS LAI observations (Garrigues et al., 2008), leading to abnormal fluctuations in the LAI time-series profiles. As depicted in the LAI time-series comparison diagram (Fig. 5 and Fig. S1 in the Supplement), HiQ-LAI demonstrates improved quality for different vegetation types. The time-series curves generated by HiQ-LAI exhibit reduced abnormal fluctuations and better alignment with expected phenological patterns compared with the original MODIS LAI. Notably, the RMSE values of all sites (totaling 29, as shown in Table 1 and Figs. 5 and S1) exhibit varying degrees of reduction, except for the DSNY, JERC, JORN, and SERC sites. Four sites (MOAB, STER, VASN, and WOMB) were excluded from calculating correlation coefficients due to the unavailability of validation data after filtering. Note that, as in situ measurements may be sensitive to all elements of the canopy, the resulting estimate should technically be referred to as the plant area index (PAI) (Brown et al., 2021). Studies have demonstrated that the PAI may overestimate LAI by as much as 61 % in certain scenarios (Brown et al., 2021). Considering this, Figs. 2, 5, and S1 illustrate that MODIS overestimates the LAI of forests to some extent, which is a finding consistent with prior research (Yan et al., 2016b, 2021a). However, HiQ-LAI corrects this overestimation to a certain degree.
Table 1Comparison of MODIS LAI and HiQ-LAI over GBOV sites.
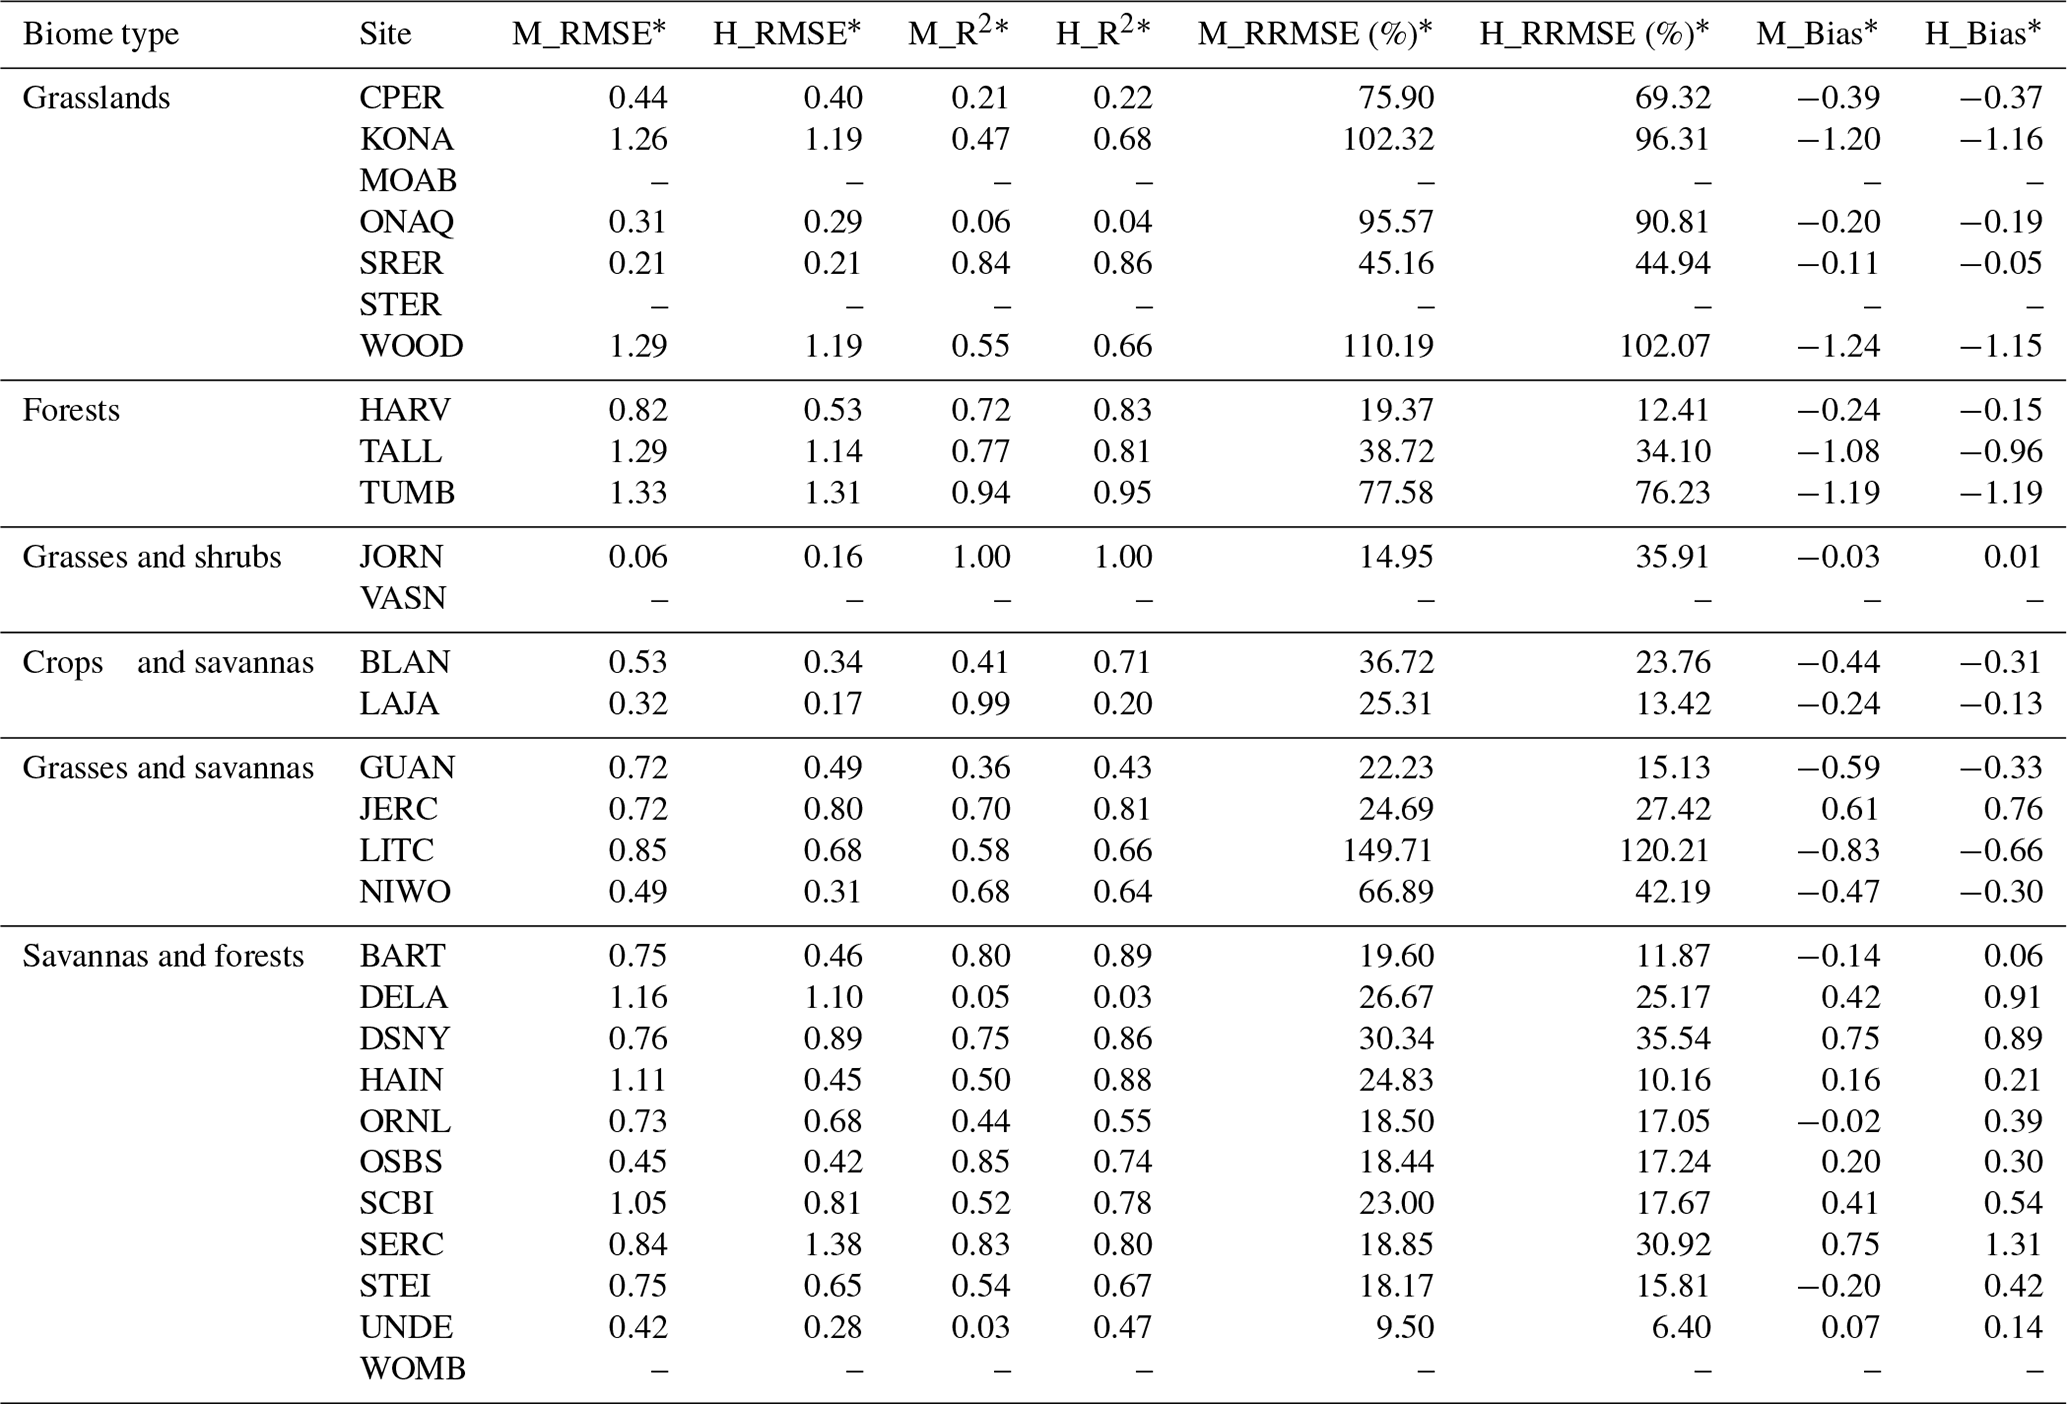
* The metrics listed in the table are as follows: M_RMSE represents the RMSE between MODIS LAI and GBOV LAI; H_RMSE denotes the RMSE between HiQ-LAI and GBOV LAI; M_R2 and H_R2 represent the R2 of MODIS LAI and HiQ-LAI, respectively; M_RRMSE and H_RRMSE represent the relative RMSE of MODIS LAI and HiQ-LAI, respectively; and M_Bias and H_Bias represent the bias of MODIS LAI and HiQ-LAI, respectively.
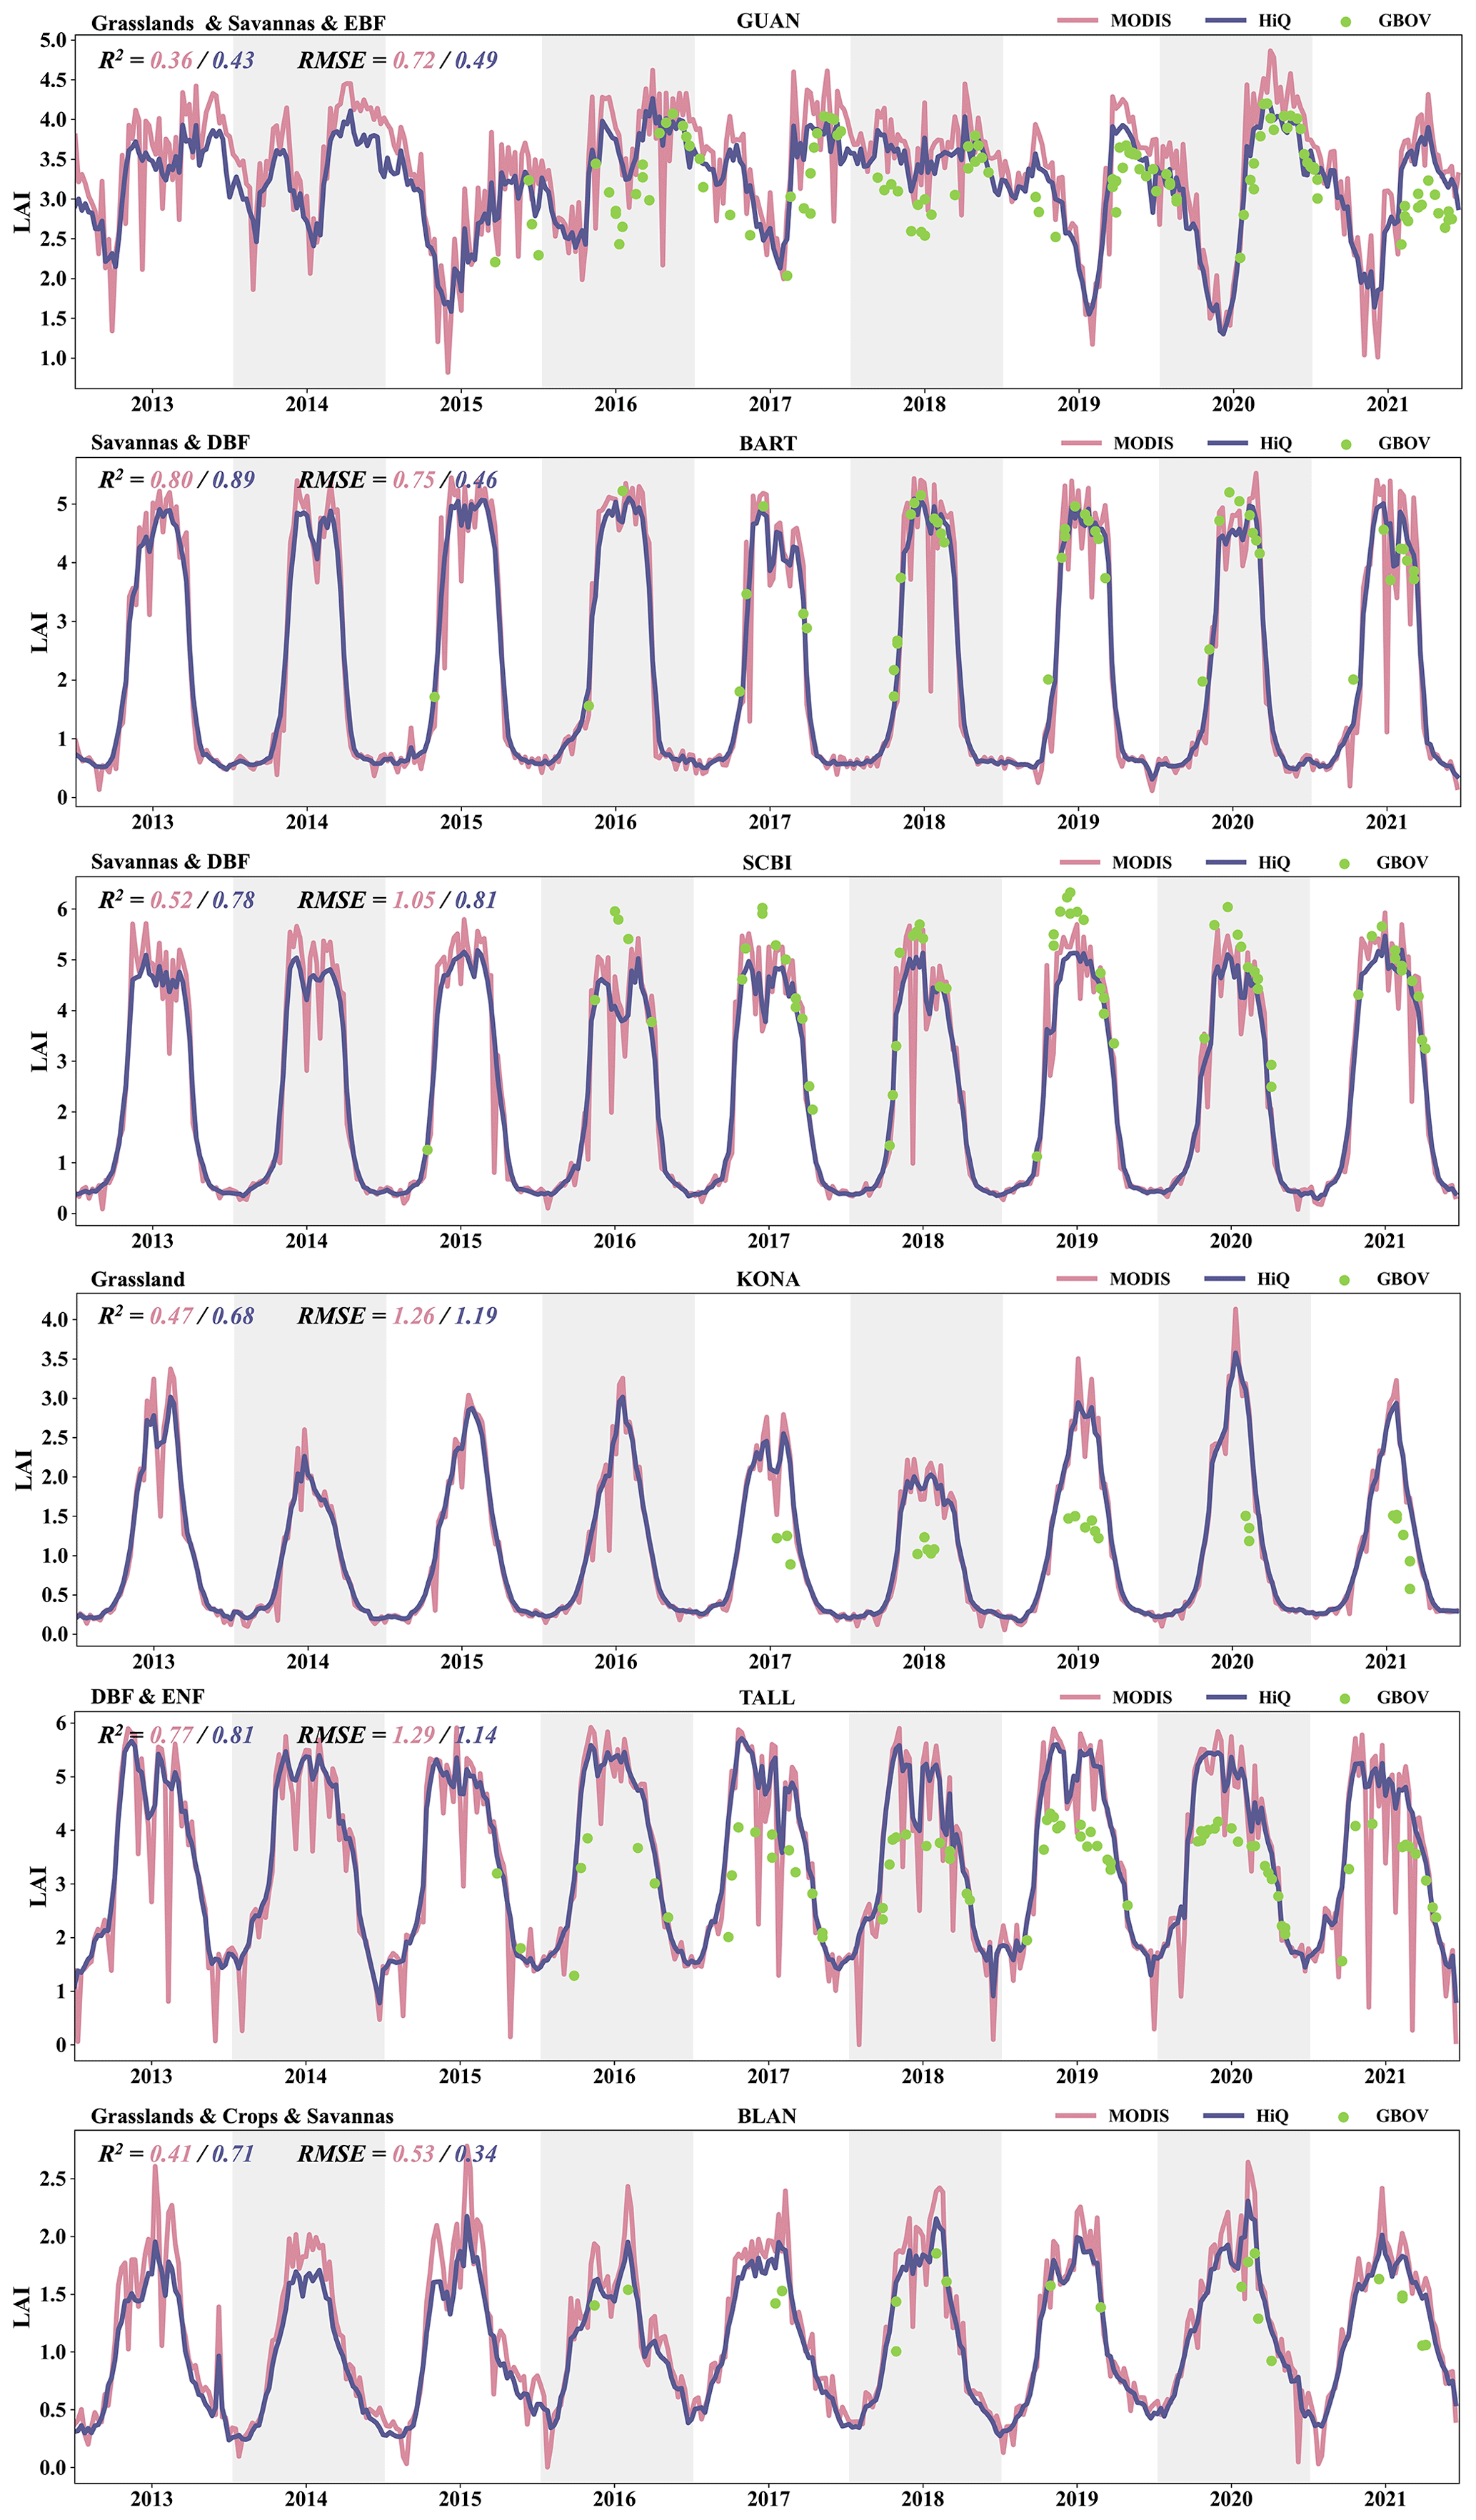
Figure 5Comparison of LAI time series from 2013 to 2021 at six GBOV sites representing different biome types. The LAI values from the MODIS C6 product and the newly proposed HiQ-LAI are shown as solid pink and purple lines, respectively. The LAI values from the ground-based GBOV reference are denoted with green dots.
4.2 Comparison of global spatial distribution
Figure 6 displays the 5 km spatial distribution of global MODIS LAI and HiQ-LAI for February and July. Overall, the two products demonstrate comparable spatial patterns across global regions. However, notable distinctions are shown in February, particularly in the Amazon rainforest region of South America. The mean LAI latitudinal profile for both products shows remarkable similarity, indicating consistent overall performance. Nevertheless, it is worth noting that the standard deviation of HiQ-LAI (green shading in Fig. 6c1 and c2) consistently falls within the range of the standard deviation of MODIS LAI (red shading in Fig. 6c1 and c2). This suggests that HiQ-LAI exhibits more stability at a global scale, indirectly implying superior data quality and enhanced stability compared with MODIS LAI.
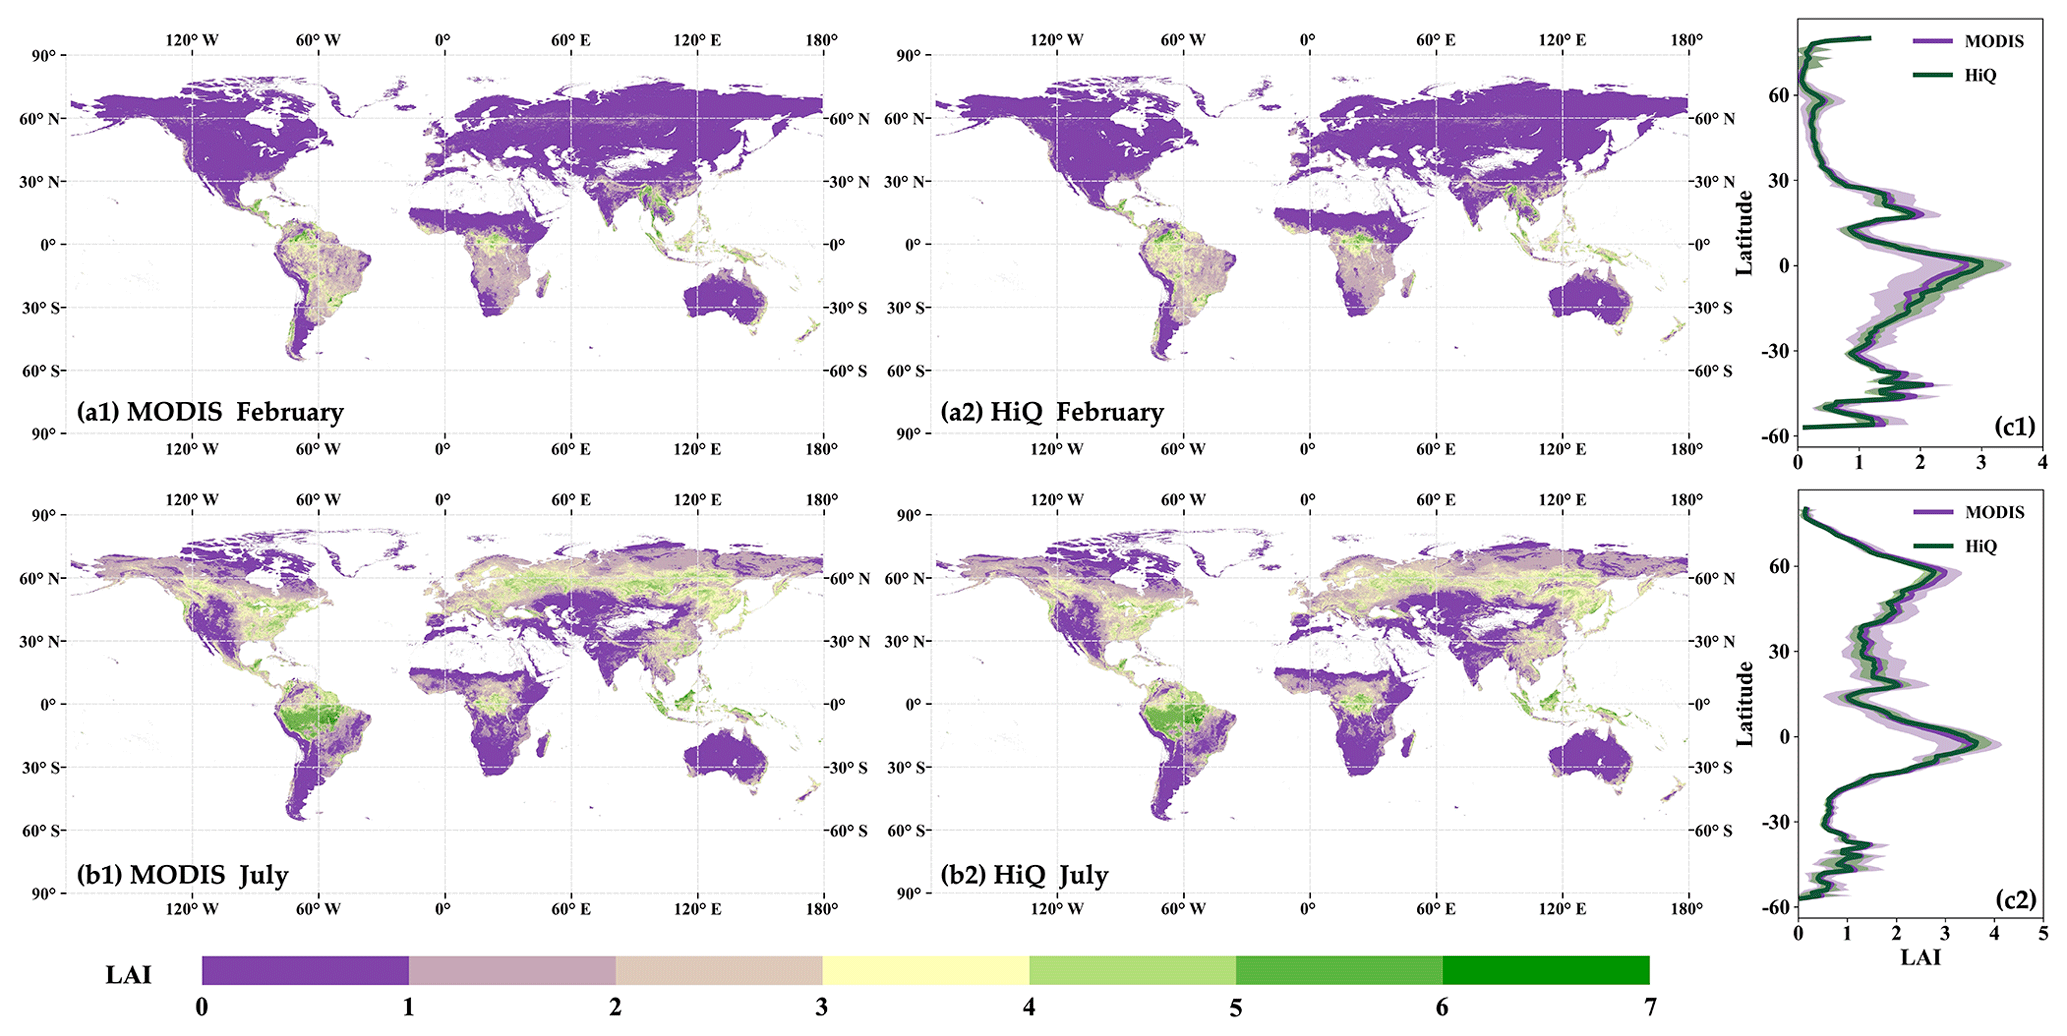
Figure 6Global spatial distribution of the mean MODIS LAI (a1) and HiQ-LAI (a2) values and a latitudinal profile distribution (c1) for February 2021. Panels (b1), (b2), and (c2) are same as panels (a1), (a2), and (c1), respectively, but for July 2021. In panels (c1) and (c2), the latitude interval is 1°, and the red and green lines denote MODIS LAI and HiQ-LAI, respectively.
4.3 Biome-specific comparison at a global scale
To further assess the performance of HiQ-LAI across different biome types, we extracted MODIS LAI and HiQ-LAI values from the BELMANIP V2.1 sites. A scatterplot (Fig. 7) was constructed based on the biome type to evaluate the consistency between the two products. The results demonstrate that, except for B5, the R2 for other monocultural vegetation types exceeds 0.88, and B1 and B3 surpassed 0.95. The consistency of mixed pixels is also relatively high, as indicated by an RMSE of 0.42 and an R2 of 0.86. However, B5 exhibits a significant disparity, with an R2 value of 0.15. The biome of B5 is primarily grown in the Amazon rainforest region of South America, Indonesia, and central Africa (Fig. 1). These regions are affected by the long-term influence of thick cloud cover, a high concentration of aerosol, and a saturation of red NIR, resulting in the limited availability of high-quality observation data and the poor accuracy of the LAI retrieval (Xu et al., 2018; Yan et al., 2016b). Consequently, it can be inferred that HiQ-LAI and MODIS LAI are consistent in most areas (different vegetation types) but inconsistent in local areas that suffer from quality issues.
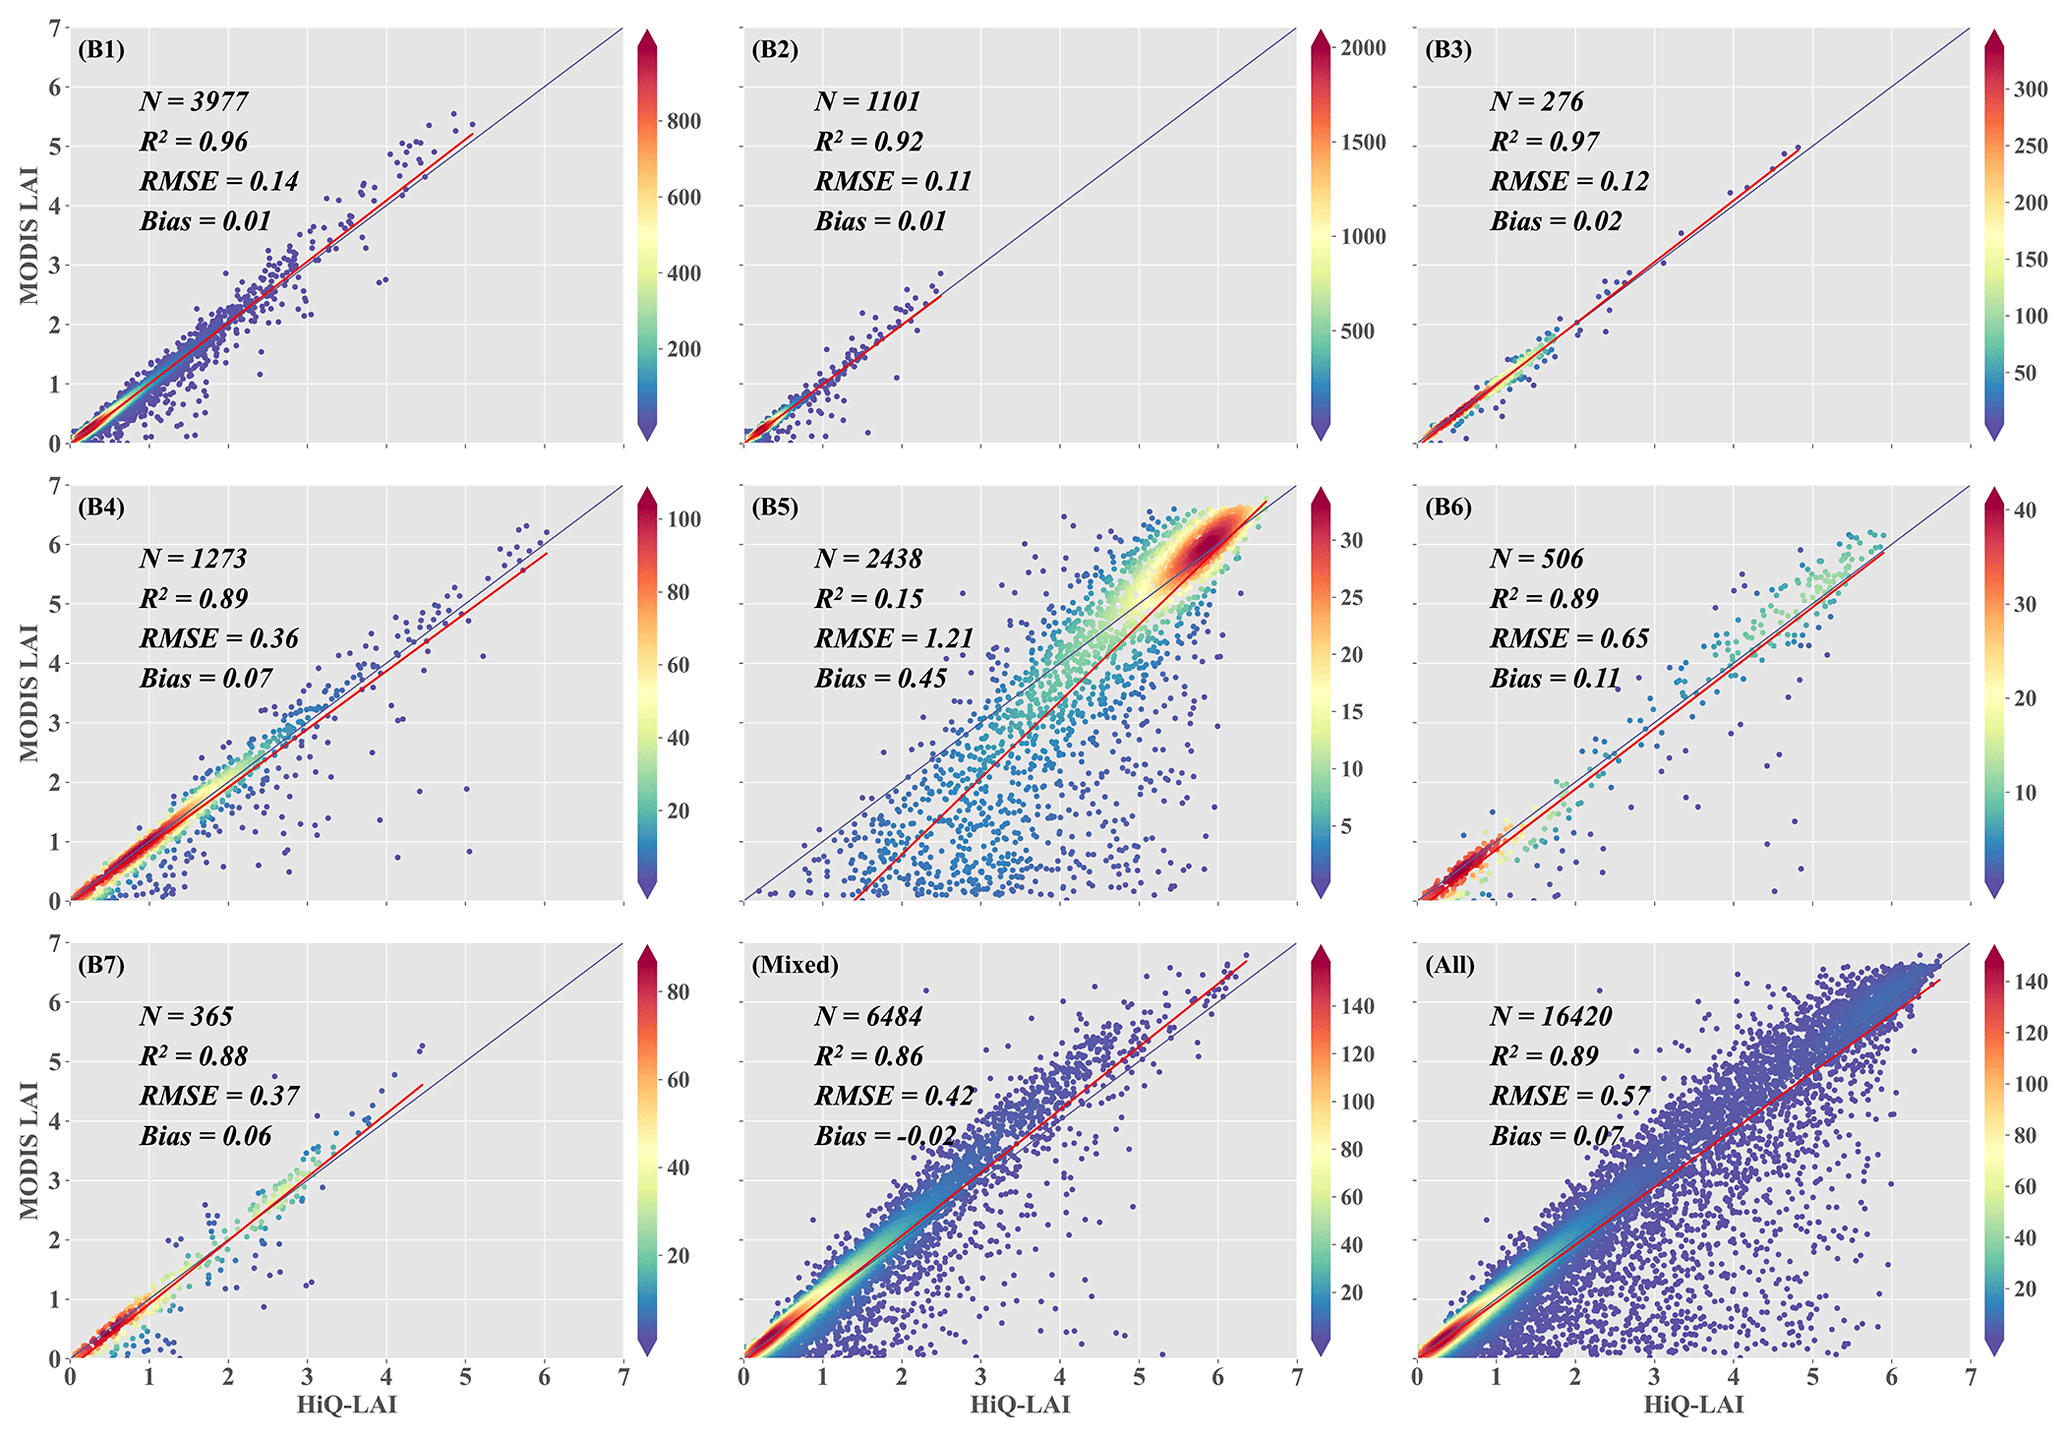
Figure 7Density scatterplot comparison of MODIS LAI and HiQ-LAI in 2021 using the BELMANIP V2.1 sites (445 sites) for (B1) grass and cereal crops, (B2) shrubs, (B3) broadleaf crops, (B4) savanna, (B5) evergreen broadleaf forest, (B6) deciduous broadleaf forest, (B7) evergreen coniferous forest, and (B8) deciduous coniferous forest.
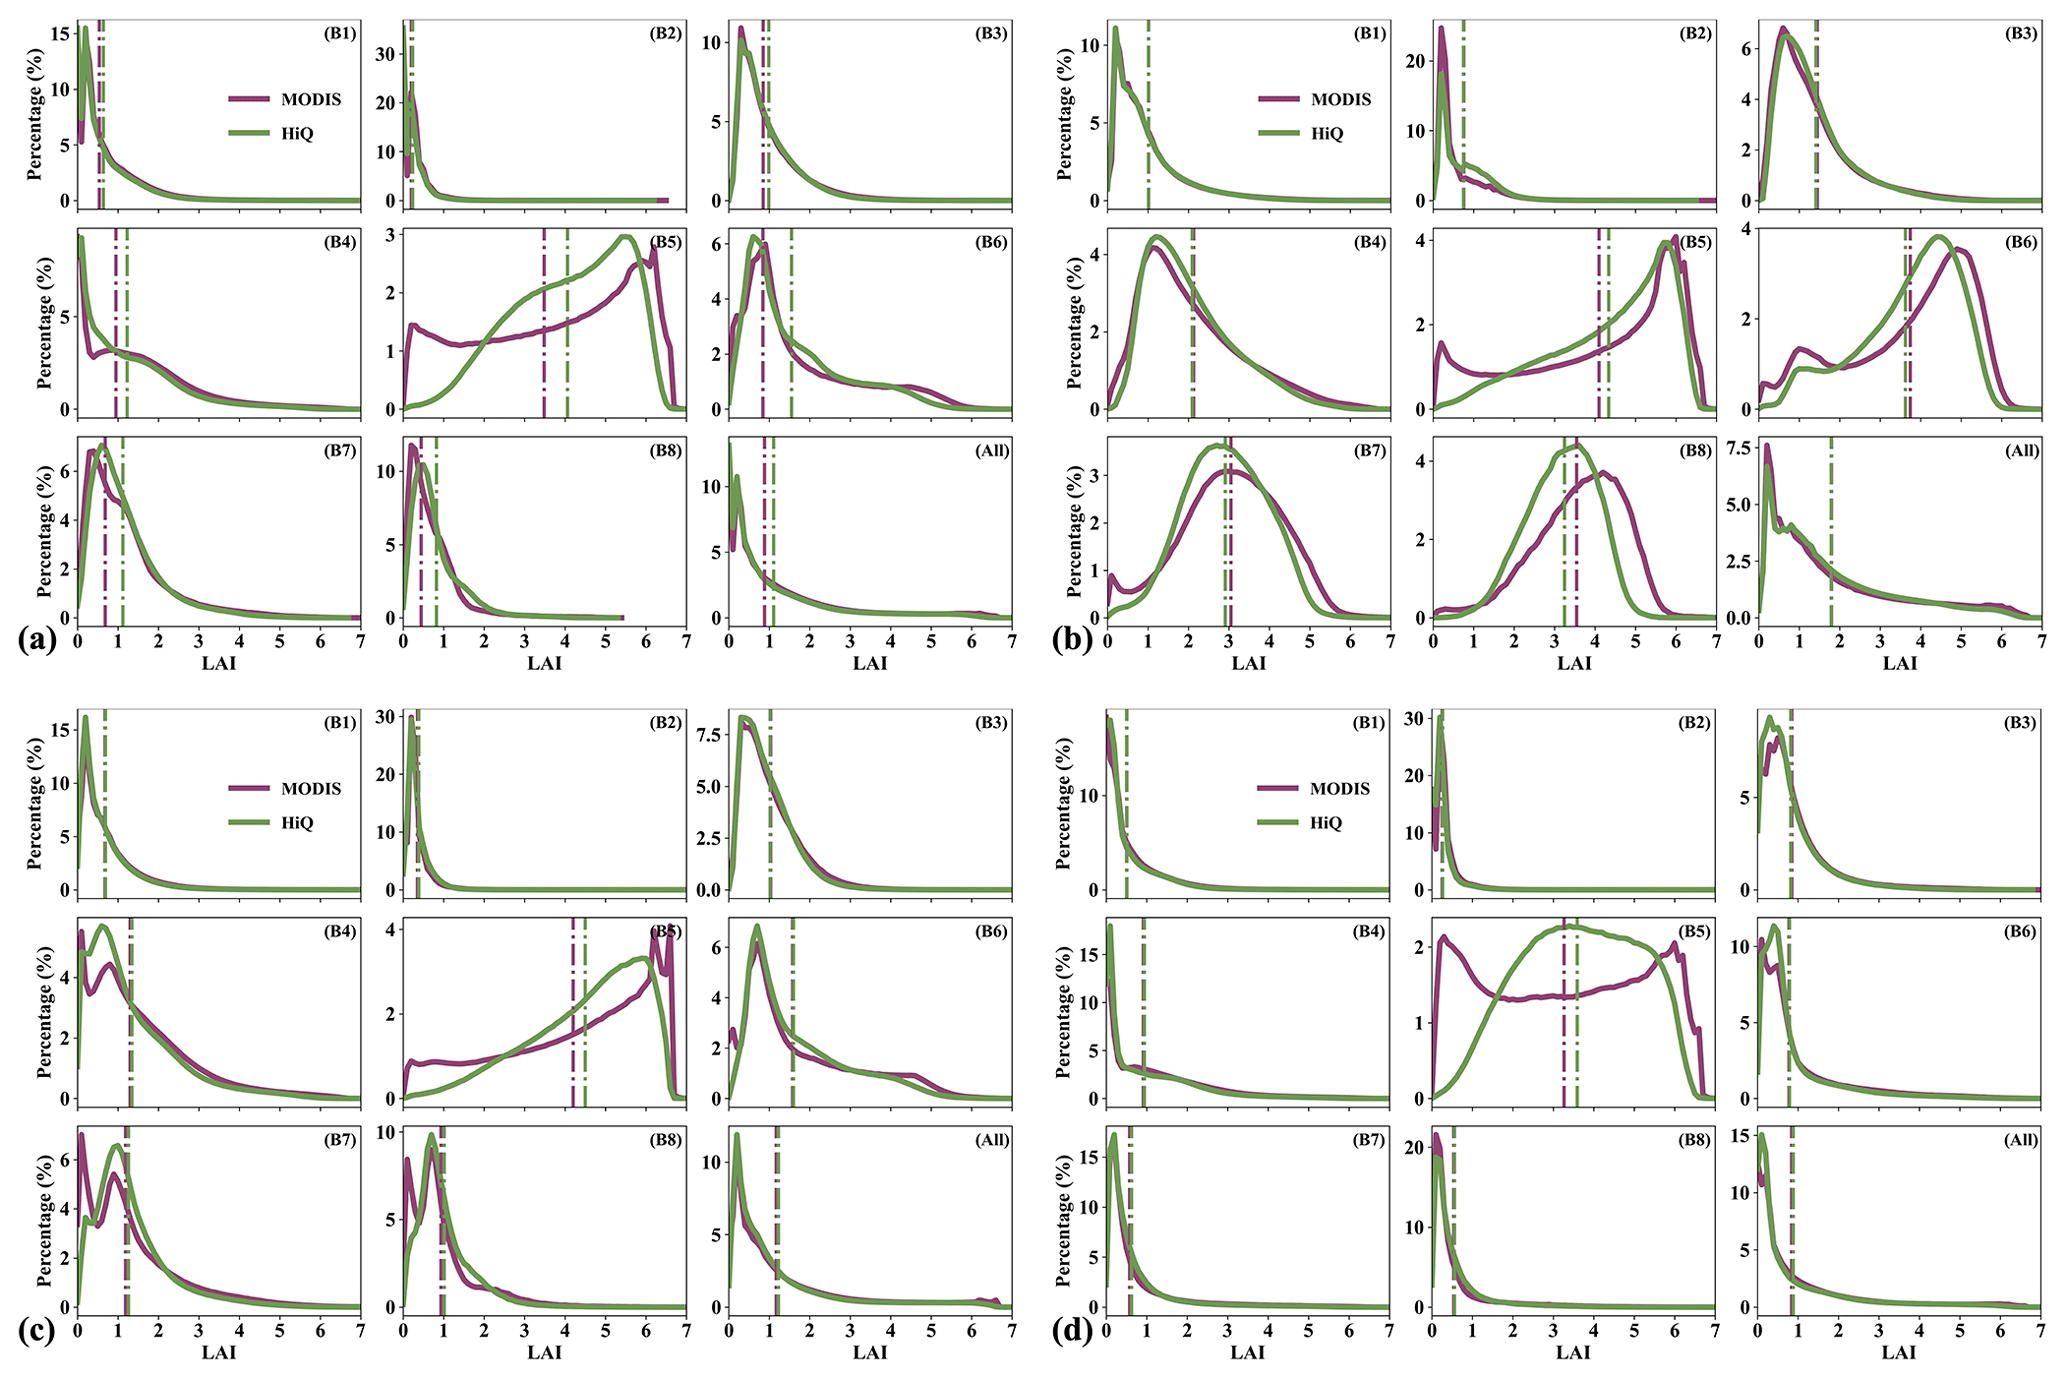
Figure 8The numerical distribution ranges of MODIS LAI and HiQ-LAI for different vegetation types are compared in 2021. Panels (a), (b), (c), and (d) represent spring, summer, autumn, and winter, respectively. The red and green vertical lines represent the mean value of MODIS LAI and HiQ-LAI, respectively.
Furthermore, we conducted a histogram of the numerical distribution (Fig. 8) of the two products under different vegetation types globally in 2021 by season. A similar phenomenon can be found in Fig. 7, with the most notable discrepancies observed in the numerical distribution of type B5. Moreover, substantial differences were noted across various seasons for B5, and the red vertical line representing the mean of MODIS LAI is consistently positioned to the left of the green vertical line representing the mean of HiQ-LAI. The distribution of the B1–B4 biomes remained highly consistent throughout different seasons with minimal variation. Conversely, the B6–B8 biomes displayed differences in the numerical distribution between spring and summer, demonstrating an opposite trend. In spring, the mean value of MODIS LAI (red vertical line) was consistently higher than that of HiQ-LAI (green vertical line), whereas the red vertical line was always located on the right of the green line in summer.
4.4 LAI trend comparison
To compare the vegetation change trend between MODIS LAI and HiQ-LAI products on a global scale, we computed the LAI mean from 2000 to 2022. By determining the slope of the time series through the fitting and then utilizing the Mann–Kendall (MK) test to discern the significance and monotonicity of trends, we obtained the spatial trend change map for this period (Fig. 9), revealing regions exhibiting greening trends (positive slope) or browning trends (negative slope) in vegetation. The spatial trend change map provides valuable insights into the dynamics of vegetation across the globe. Both products exhibit similar spatial patterns in greening trends, particularly in global hotspots such as China and India. Similarly, the browning trend is observed in similar locations in both products. From MODIS to HiQ-LAI, the proportion of insignificant change increased from 37.03 % to 39.95 %. The greening trend and browning trend of the two products were 60.24 % (MODIS) and 56.69 % (HiQ) and 2.73 % (MODIS) and 3.36 % (HiQ), respectively. The slight difference between the two products is mainly concentrated in high-latitude areas.
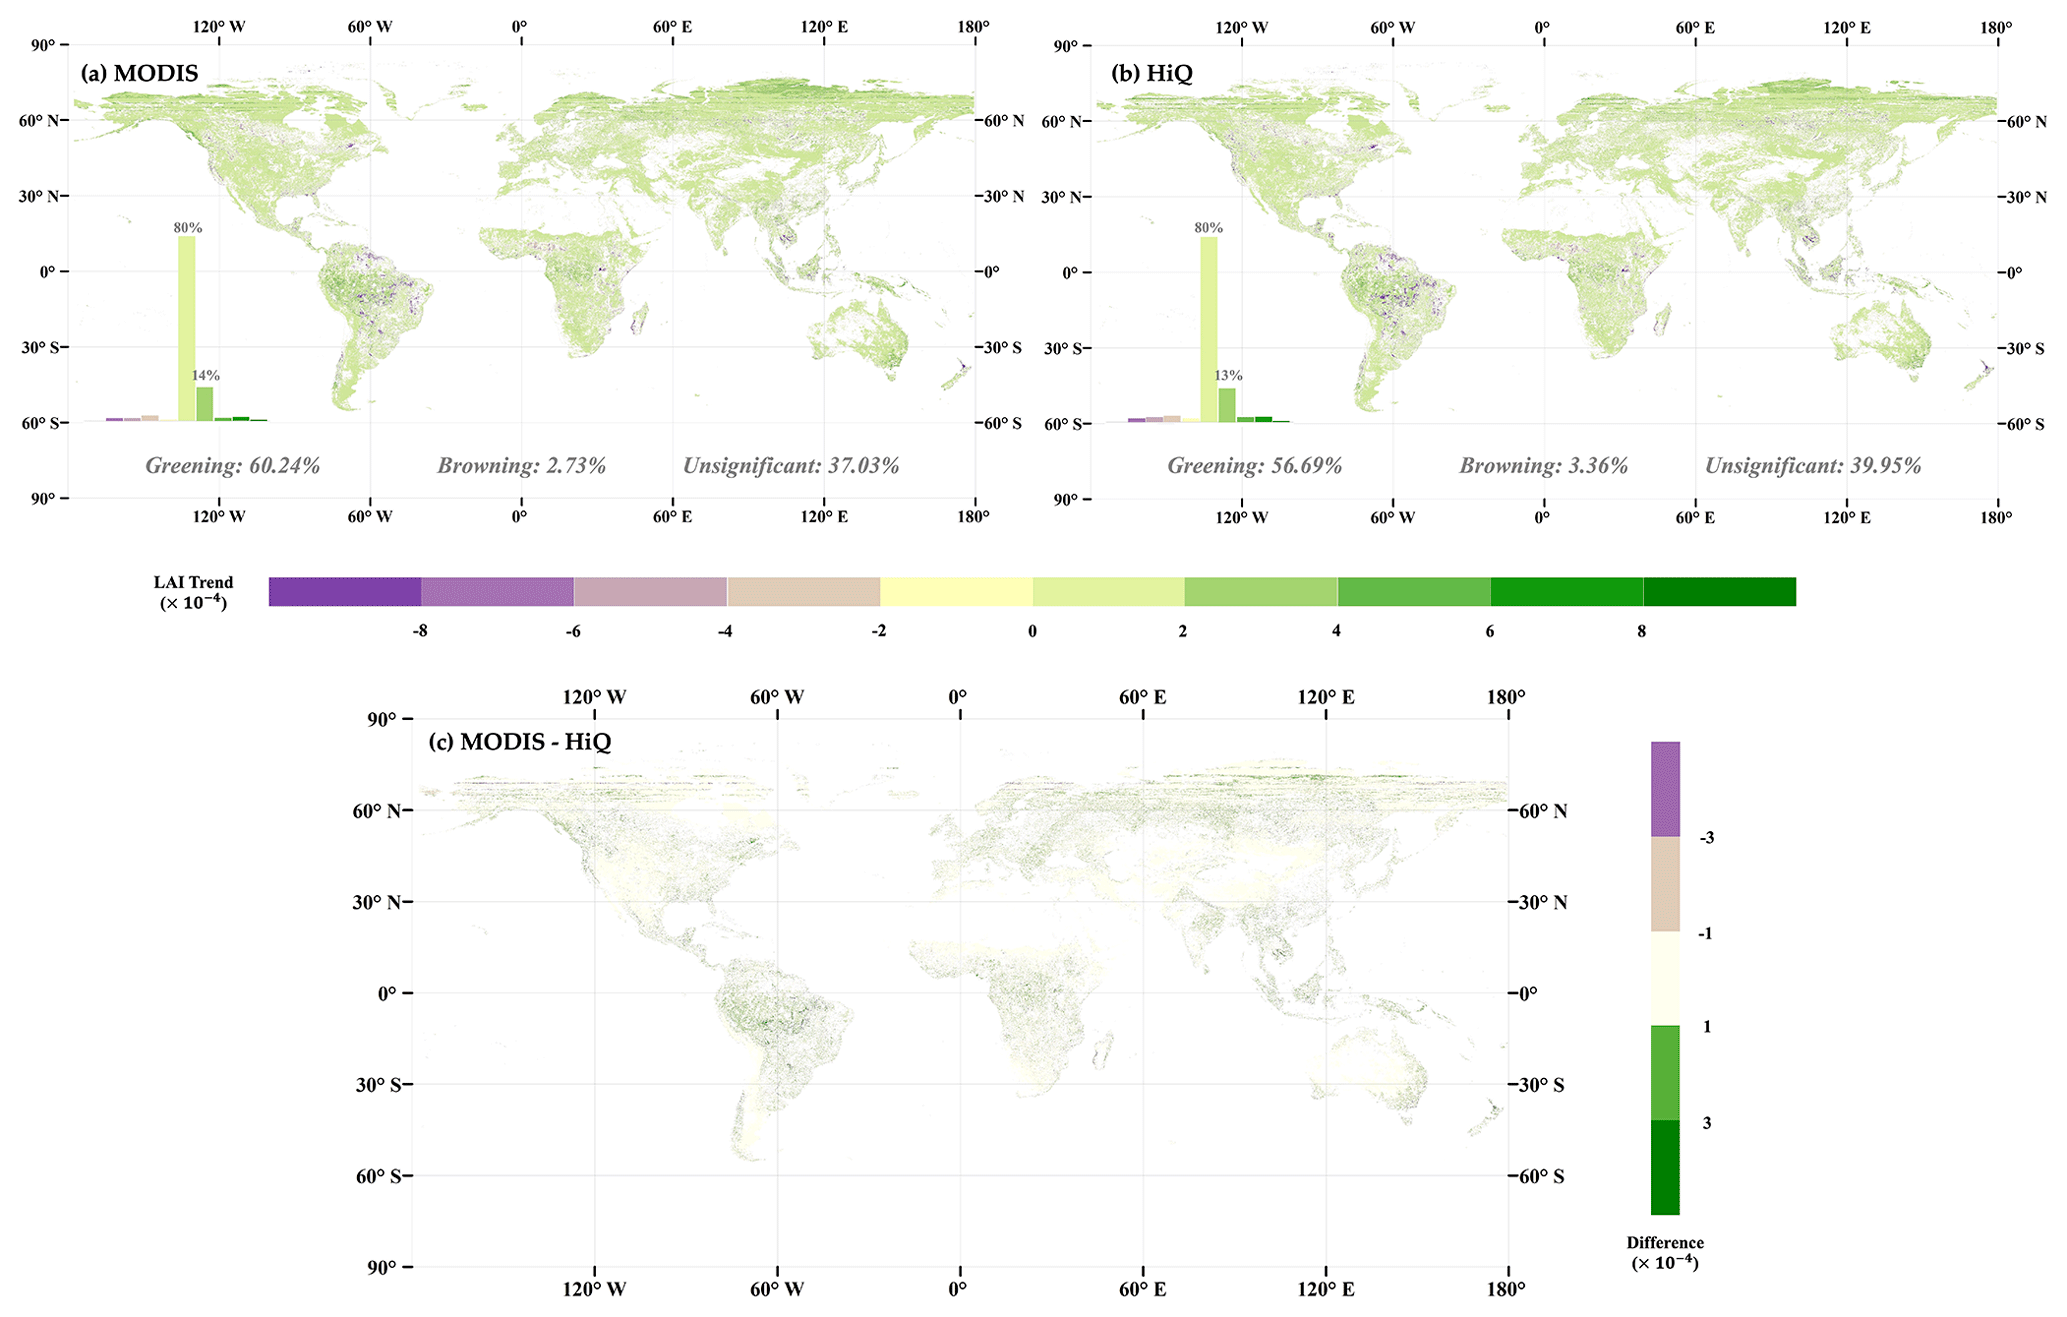
Figure 9Global maps of LAI trends between MODIS LAI (a) and HiQ-LAI (b) during 2000–2022. The Theil–Sen slope (TS) method and Mann–Kendall (MK) test were used to calculate these results. Panel (c) presents the difference in LAI trends between MODIS LAI and HiQ-LAI.
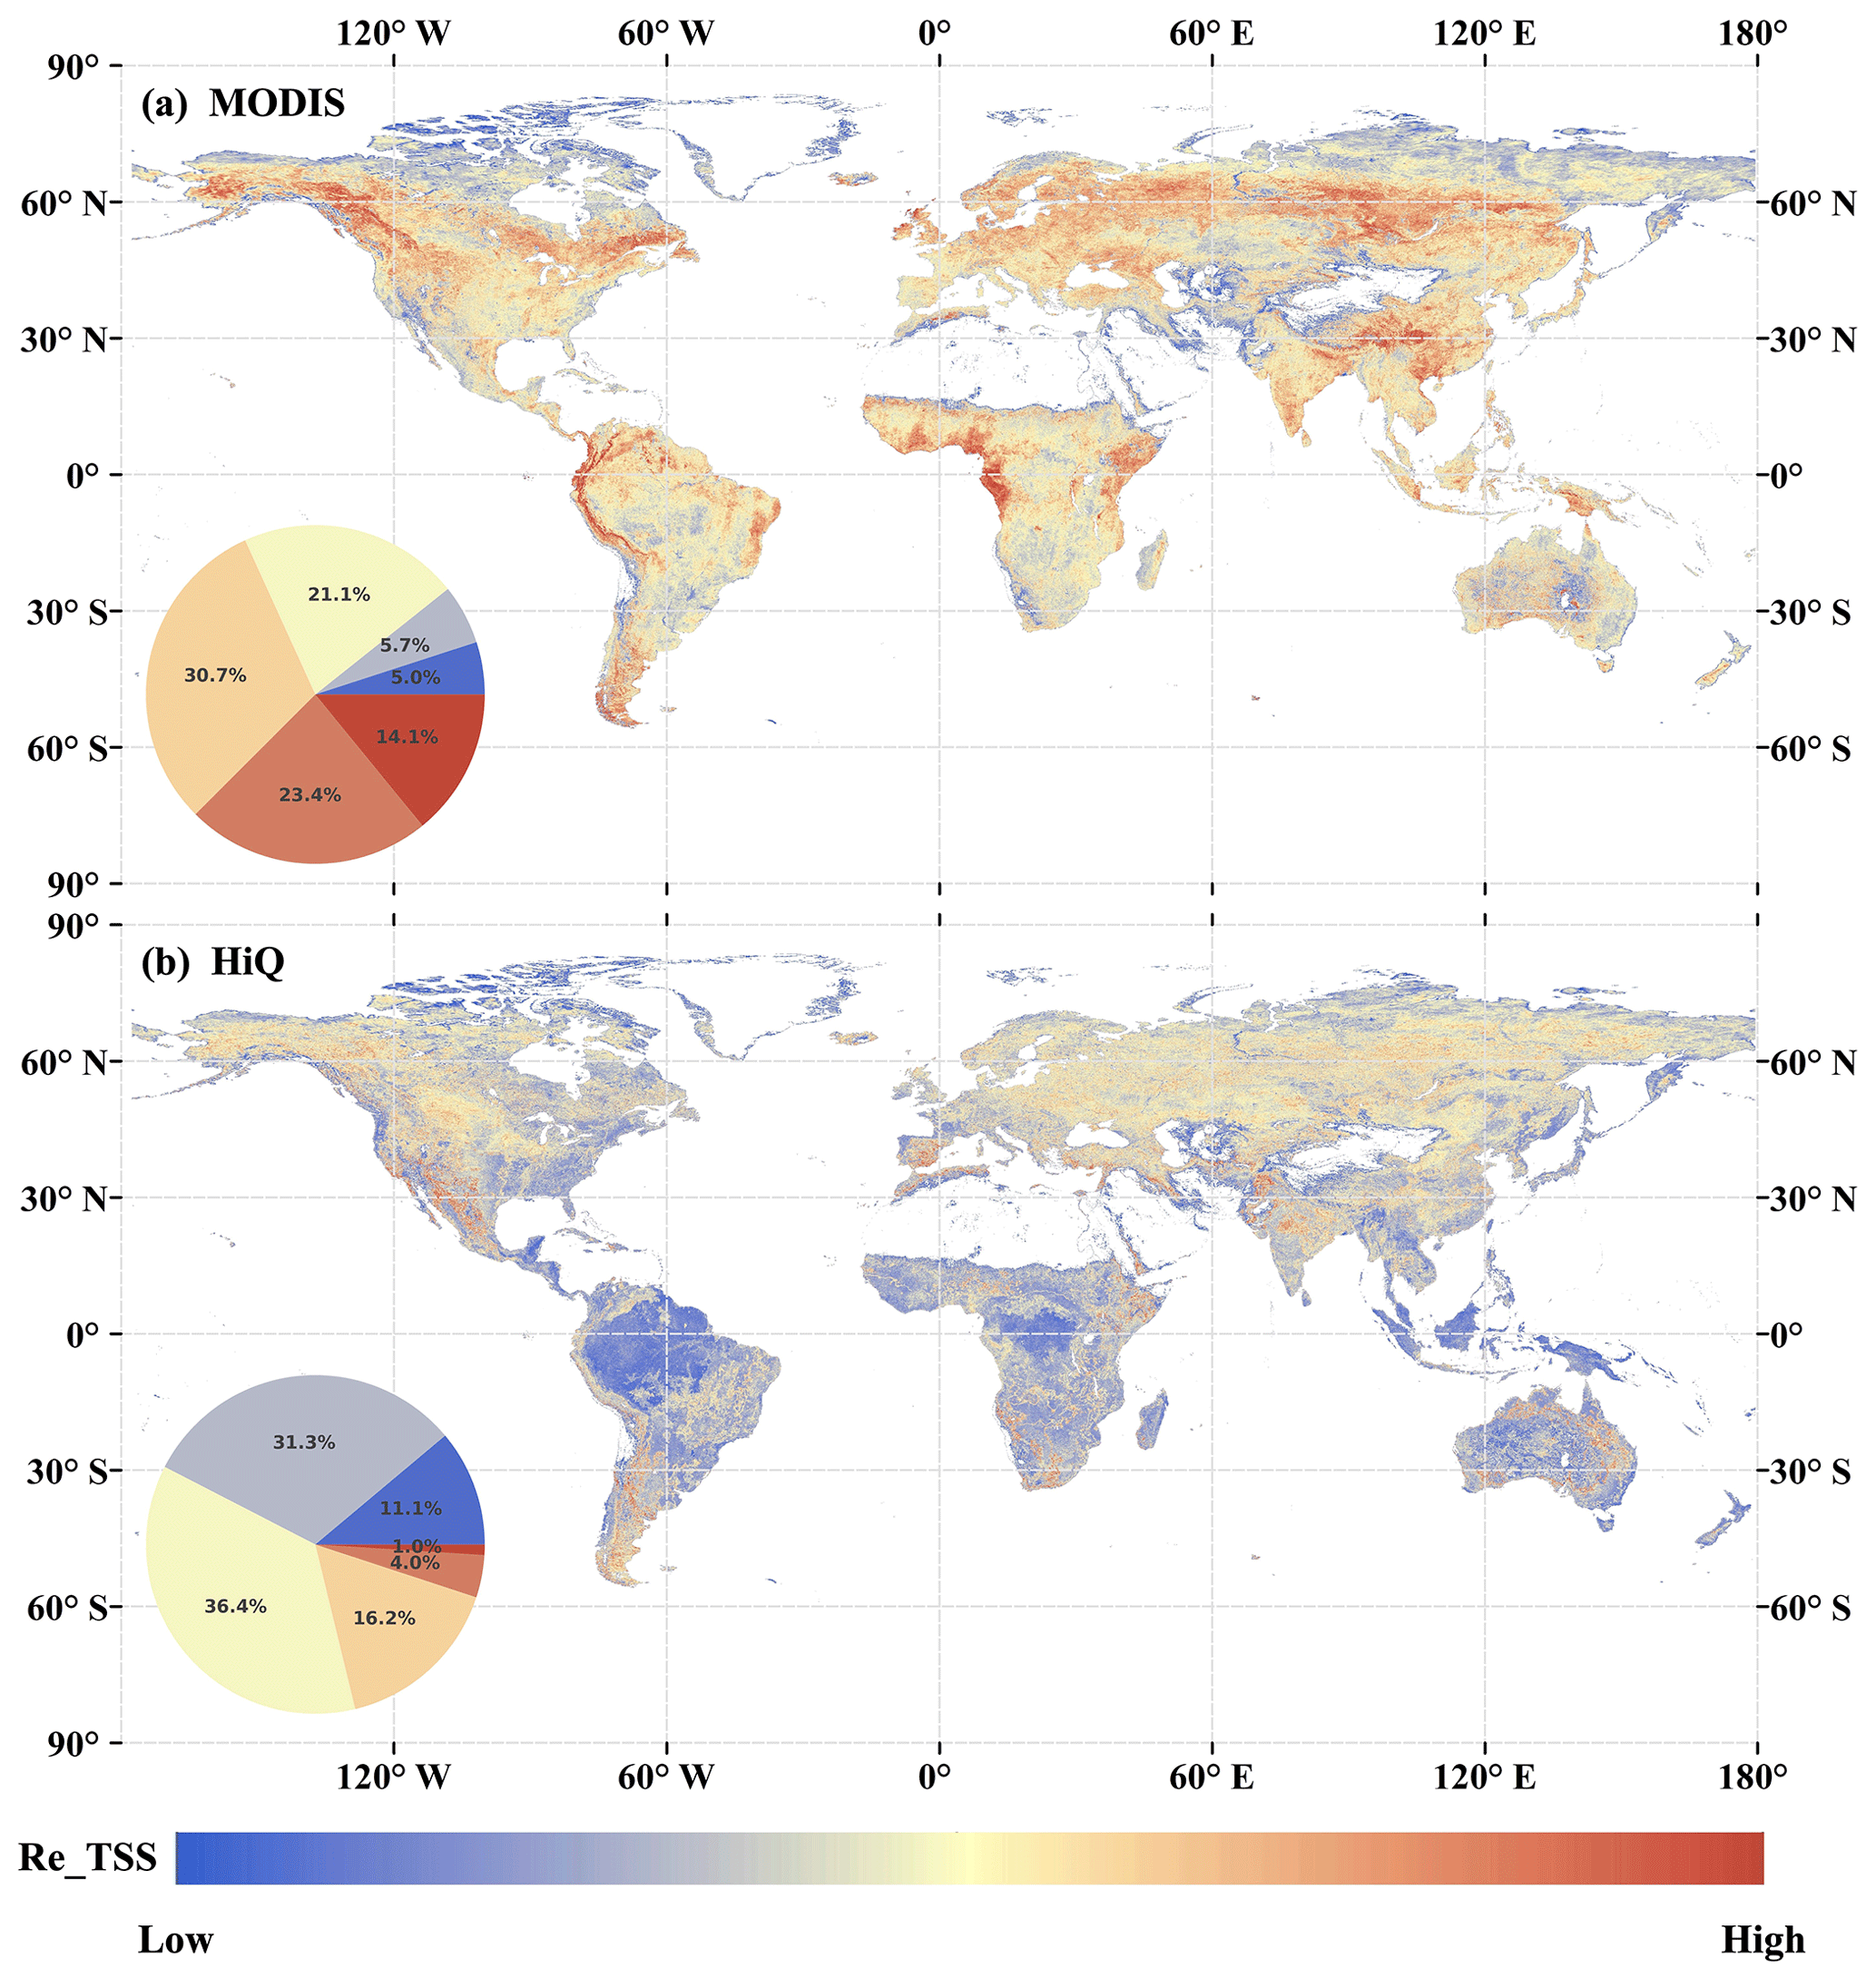
Figure 10Global spatial distribution of the cumulative relative TSS (RE-TSS) for MODIS LAI (a) and HiQ-LAI (b) for 2021 (containing 46 data periods).
4.5 Improvements in time-series stability
Typically, the LAI exhibits continuous variations throughout the year without significant fluctuations (Zou et al., 2022). However, the annual seasonal variation curve of MODIS LAI shows pronounced abnormal fluctuations (e.g., sudden increases and decreases). This phenomenon is attributed to the independent pixel-by-pixel daily inversion process of MODIS LAI. When affected by atmospheric conditions, sensor malfunctions, and retrieval algorithm uncertainties, MODIS LAI experiences poor spatiotemporal consistency and an accompanying increase in the noise level (Yan et al., 2021b; Fang et al., 2019). Consequently, it fails to accurately capture the long-term trend in LAI variations, thereby restricting its application with respect to crop modeling and prediction (Fang et al., 2011; Ines et al., 2013; Zhuo et al., 2022), climate change and vegetation dynamics research (Zheng et al., 2021; Chen et al., 2021), and long-term ecological environment monitoring and assessment (Dhorde and Patel, 2016; Mariano et al., 2018). From the ground-based direct validation results (Sect. 4.1), it is evident that HiQ-LAI effectively improves the data quality of the original MODIS LAI. It reduces apparent error in the raw LAI retrievals and generates smoother LAI time-series profiles that align better with expected phenological patterns. However, the GBOV site data are limited by spatial scale and resources, making them insufficient for comparing temporal changes on a global scale. Therefore, we utilize the TSS (Zou et al., 2022), a quantifiable metric for time-series stability, to further understand the temporal stability performance of the two products. HiQ-LAI encompasses abundant smaller TSS pixels (Fig. 10), particularly in regions near the Equator that are characterized by the EBF vegetation cover type. The proportion of low TSS values globally increases from 31.8 % (MODIS) to 78.8 % (HiQ). This confirms that our proposed HiQ-LAI product substantially improves the stability of time series compared with the original MODIS LAI, resulting in an overall enhancement in data quality. This will provide more reliable data support for the research and applications of ecology, climatology, land-use planning, and other fields.
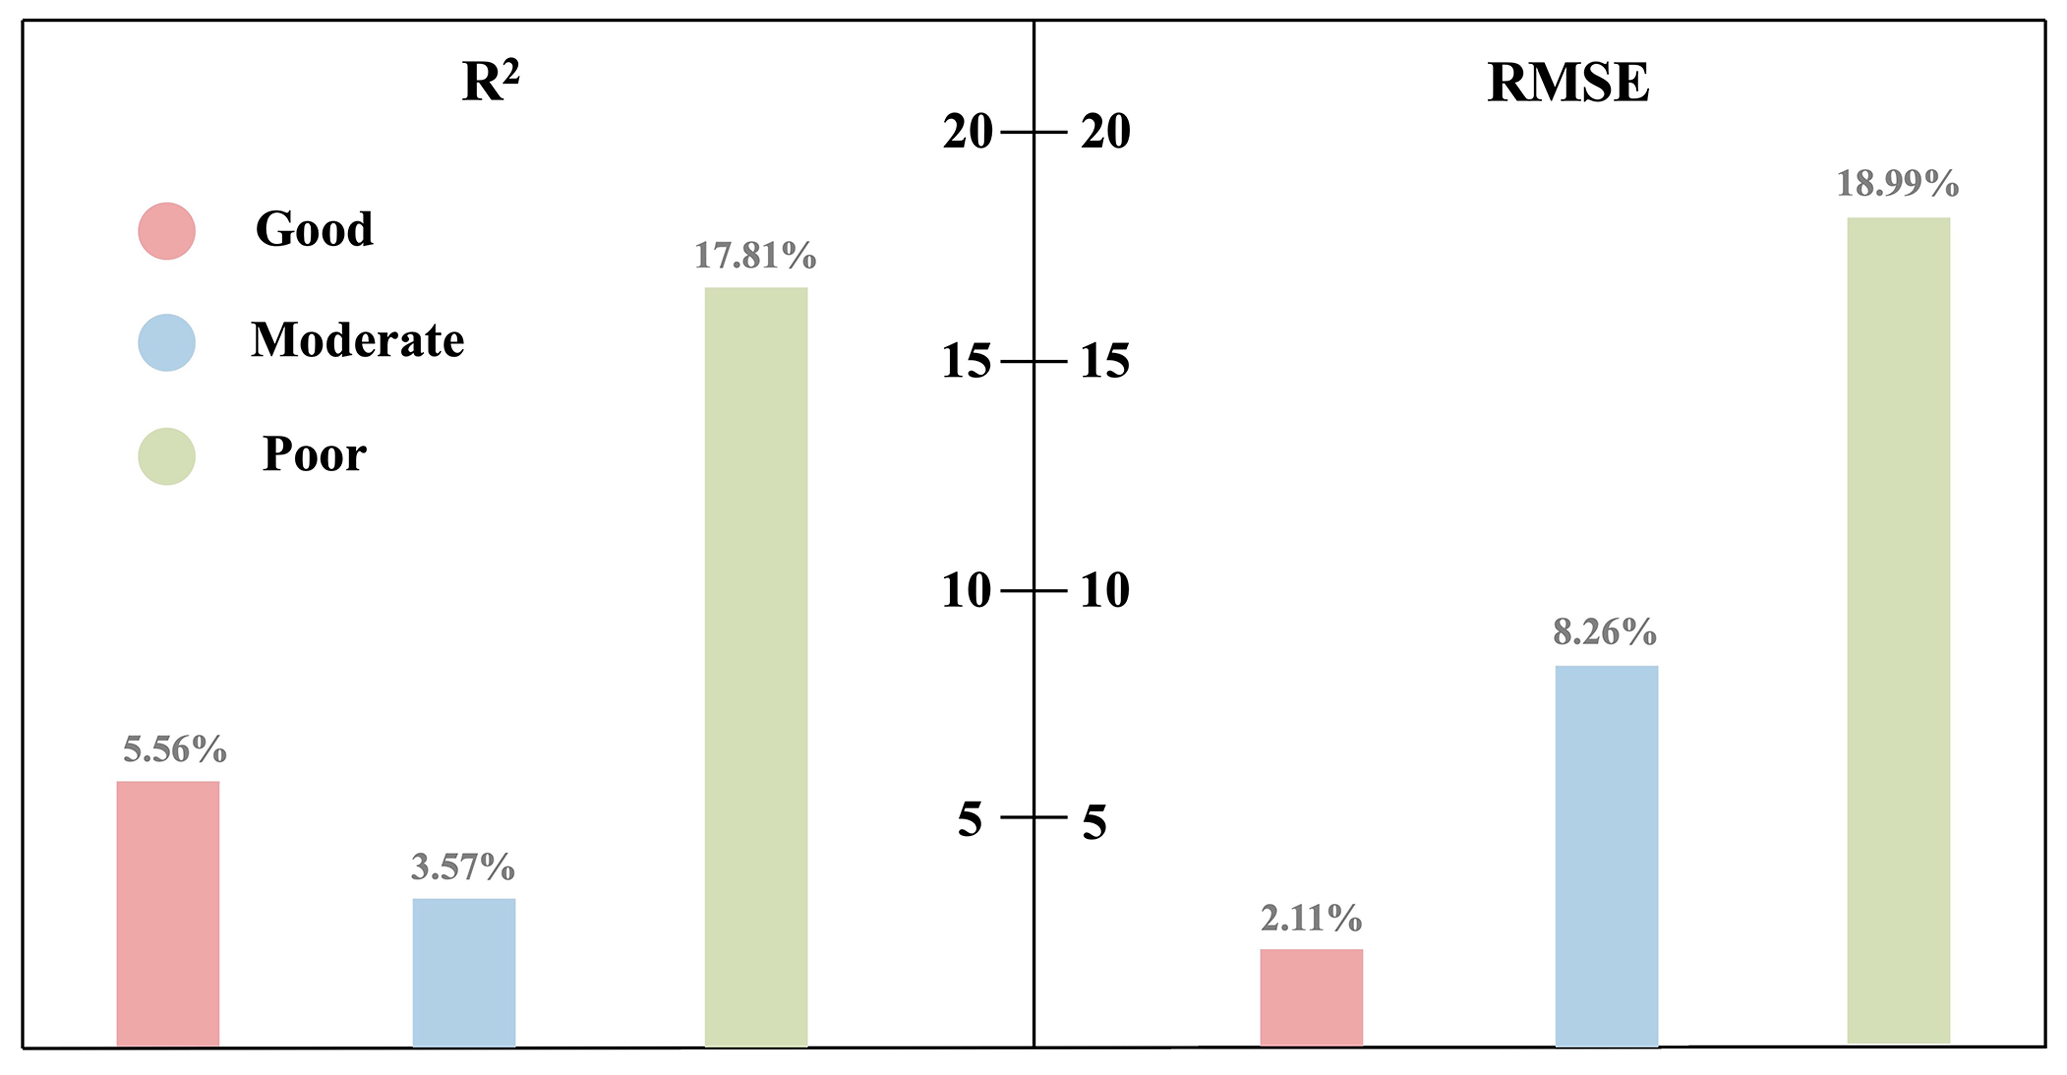
Figure 11Comparison of the improvement percentage of the RMSE and R2 between MODIS and HiQ-LAI within different quality classifications (good: MQA ≥ 9; moderate: 7 ≤ MQA < 9; and poor: MQA < 7) based on DIRECT 2.1 sites as a reference (99 sites and 268 measurements).
4.6 Relationship between improvement and raw data quality
Ground verification also reveals a consistent pattern between low MQA values and high LAI retrievals. Regions with high LAI values are mainly observed in tropical regions where there is greater cloud cover and aerosol load, causing signal saturation (Yan et al., 2016b; Samanta et al., 2012a). In the first step of our algorithm, pixel quality is assessed based on the algorithm path and LAI standard deviation of the main algorithm, where the saturation phenomenon reduces the MQA value. Thus, this phenomenon can be attributed to the overestimation of MODIS LAI retrievals due to signal saturation (Heiskanen et al., 2012). Moreover, other studies have confirmed that the main algorithm's saturation tends to yield higher MODIS LAI (Yuan et al., 2011; Lin et al., 2023). We graded pixels according to the MQA value (Fig. 11) and observed that the improvement effect on LAI retrievals became more pronounced as the quality level decreased. In the poor-quality level, HiQ-LAI exhibited a 17.81 % increase in the R2 and an 18.99 % reduction in the RMSE compared with MODIS LAI. However, the RMSE only decreased by 2.11 % in the good-quality level. HiQ-LAI substantially enhances the quality of LAI retrievals affected by observational conditions and inversion algorithms while maintaining the same pixels with good quality in the original MODIS LAI. This highlights the effectiveness of our proposed algorithm with respect to improving the spatiotemporal consistency of LAI products.
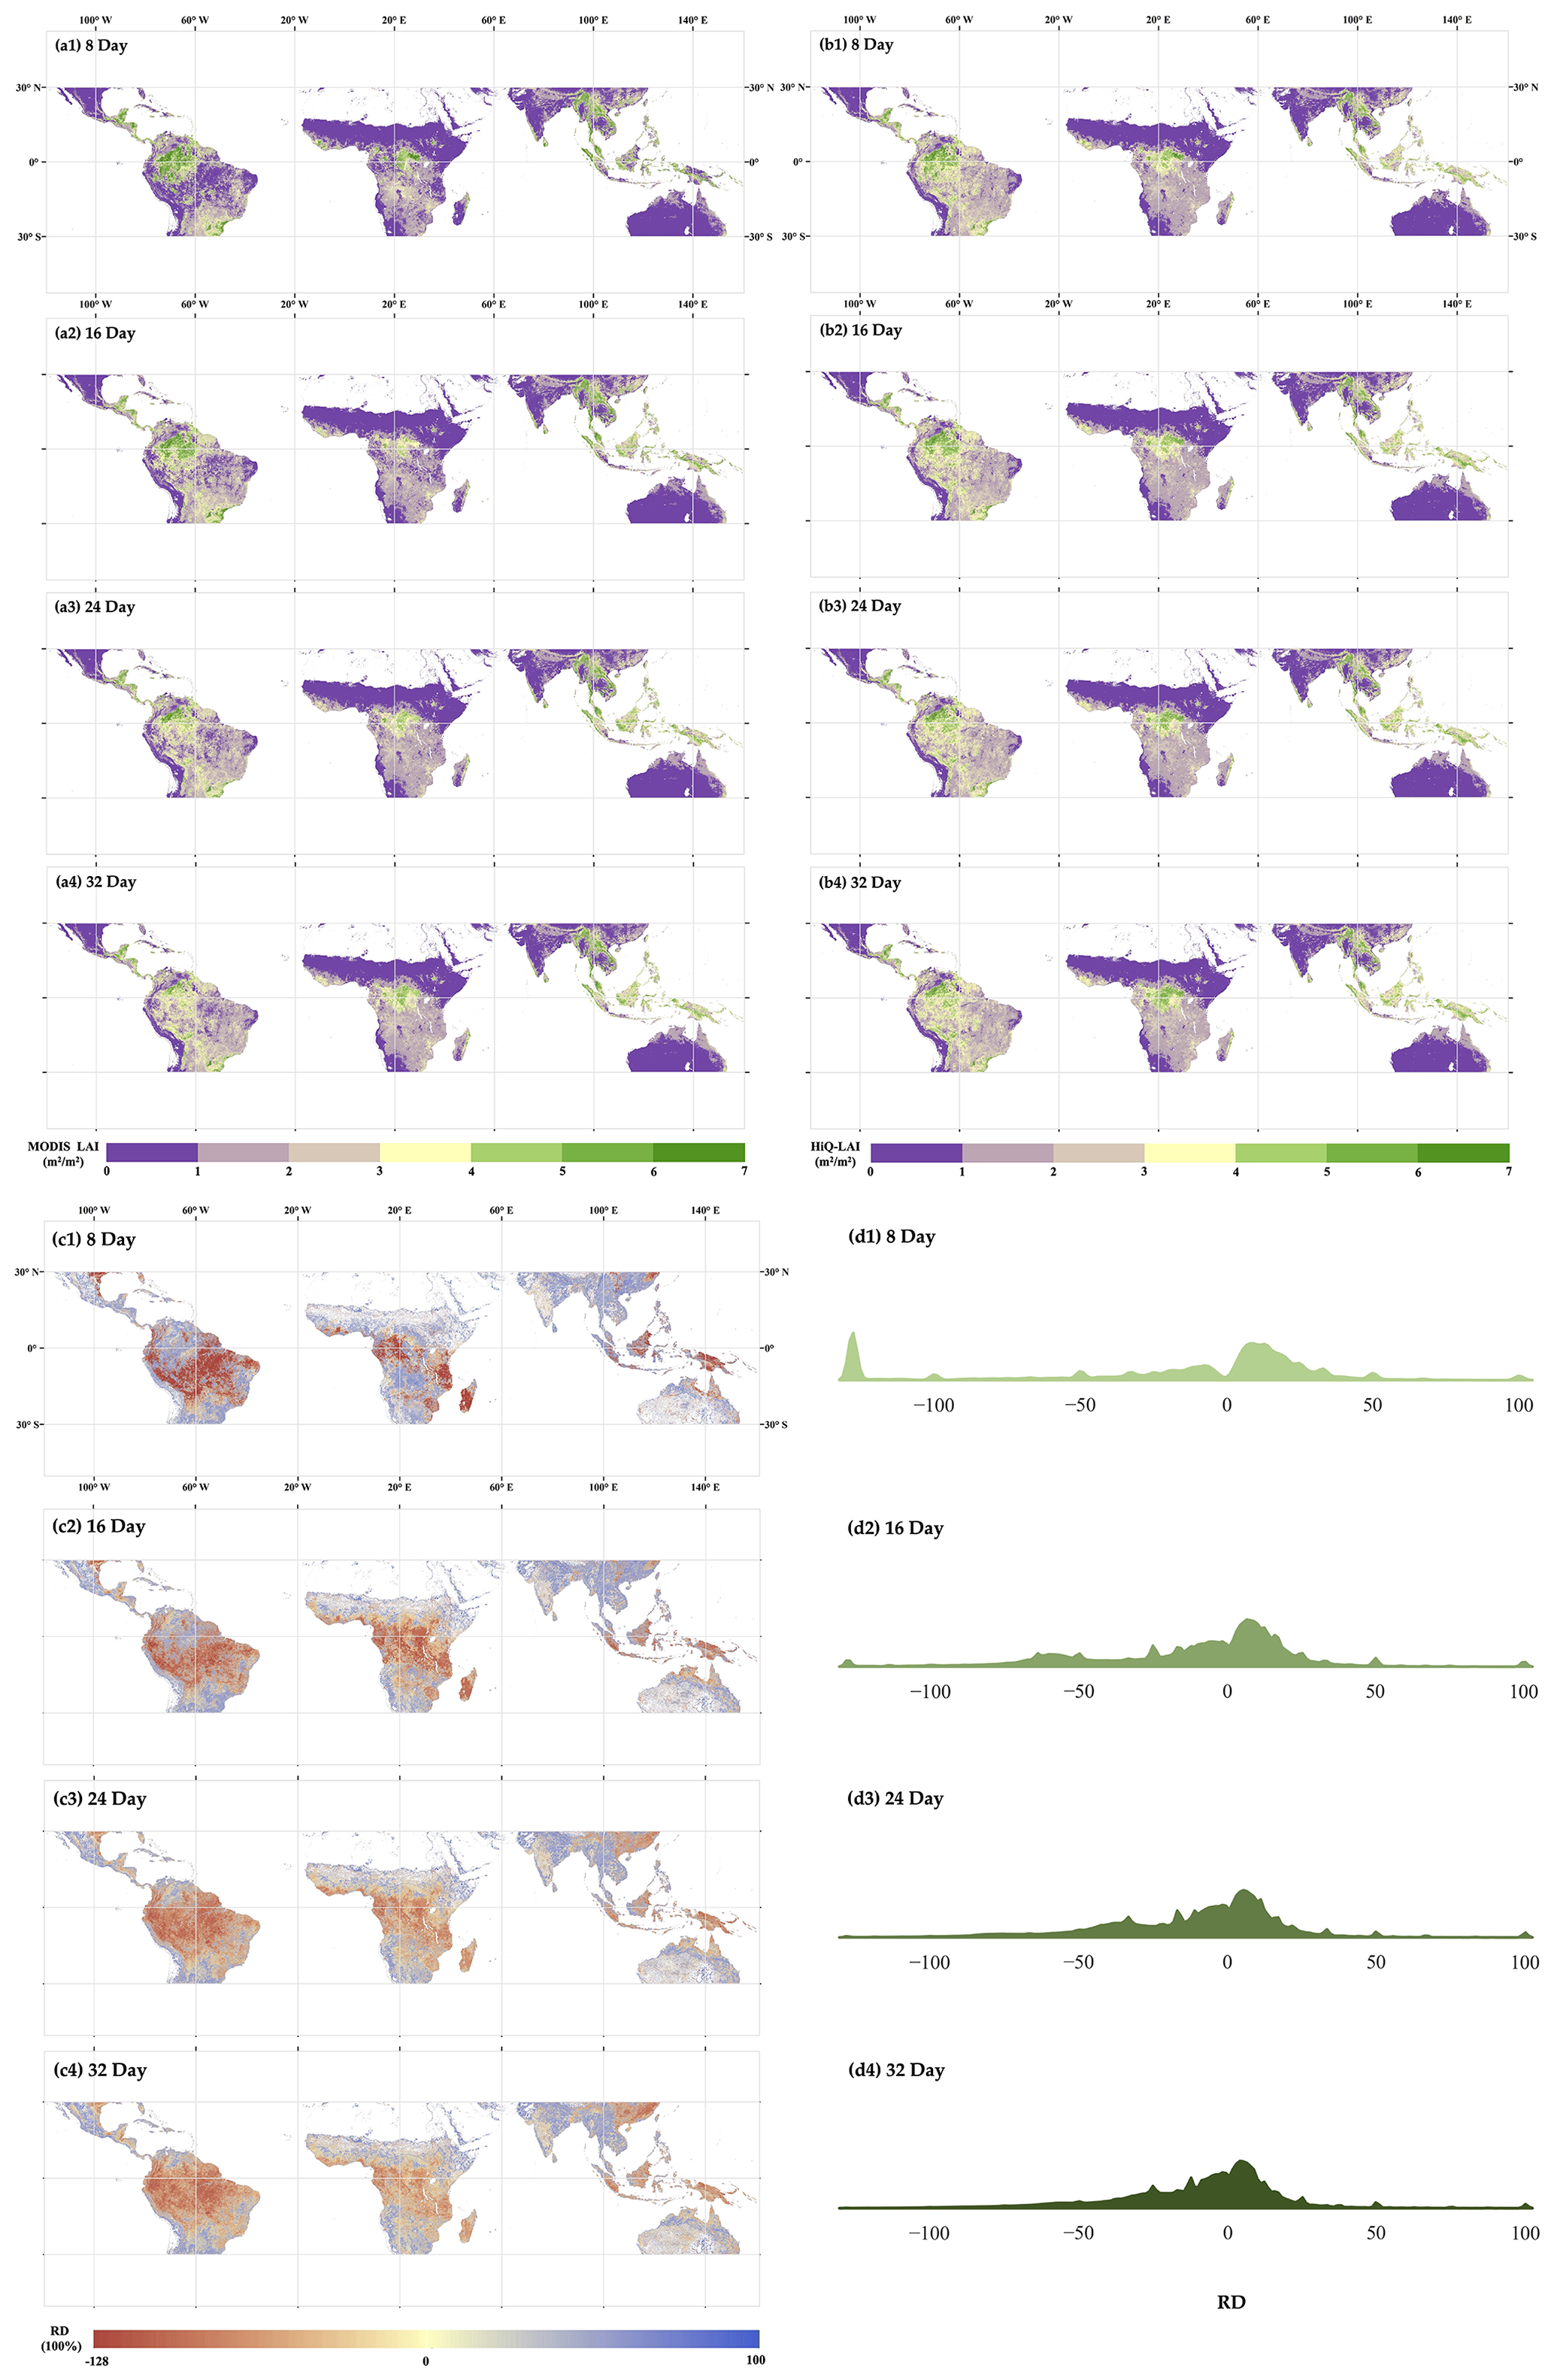
Figure 12Spatial distribution of MODIS LAI (a1–a4) and HiQ-LAI (b1–b4) in the equatorial region within different composite days. Spatial distribution of the RD (relative difference, c1–c4) and density distribution of the RD (d1–d4) in the equatorial region within different composite days. The day of the year (DOY) for the first 8 d of data is 2021041 (DOY 41 of 2021).
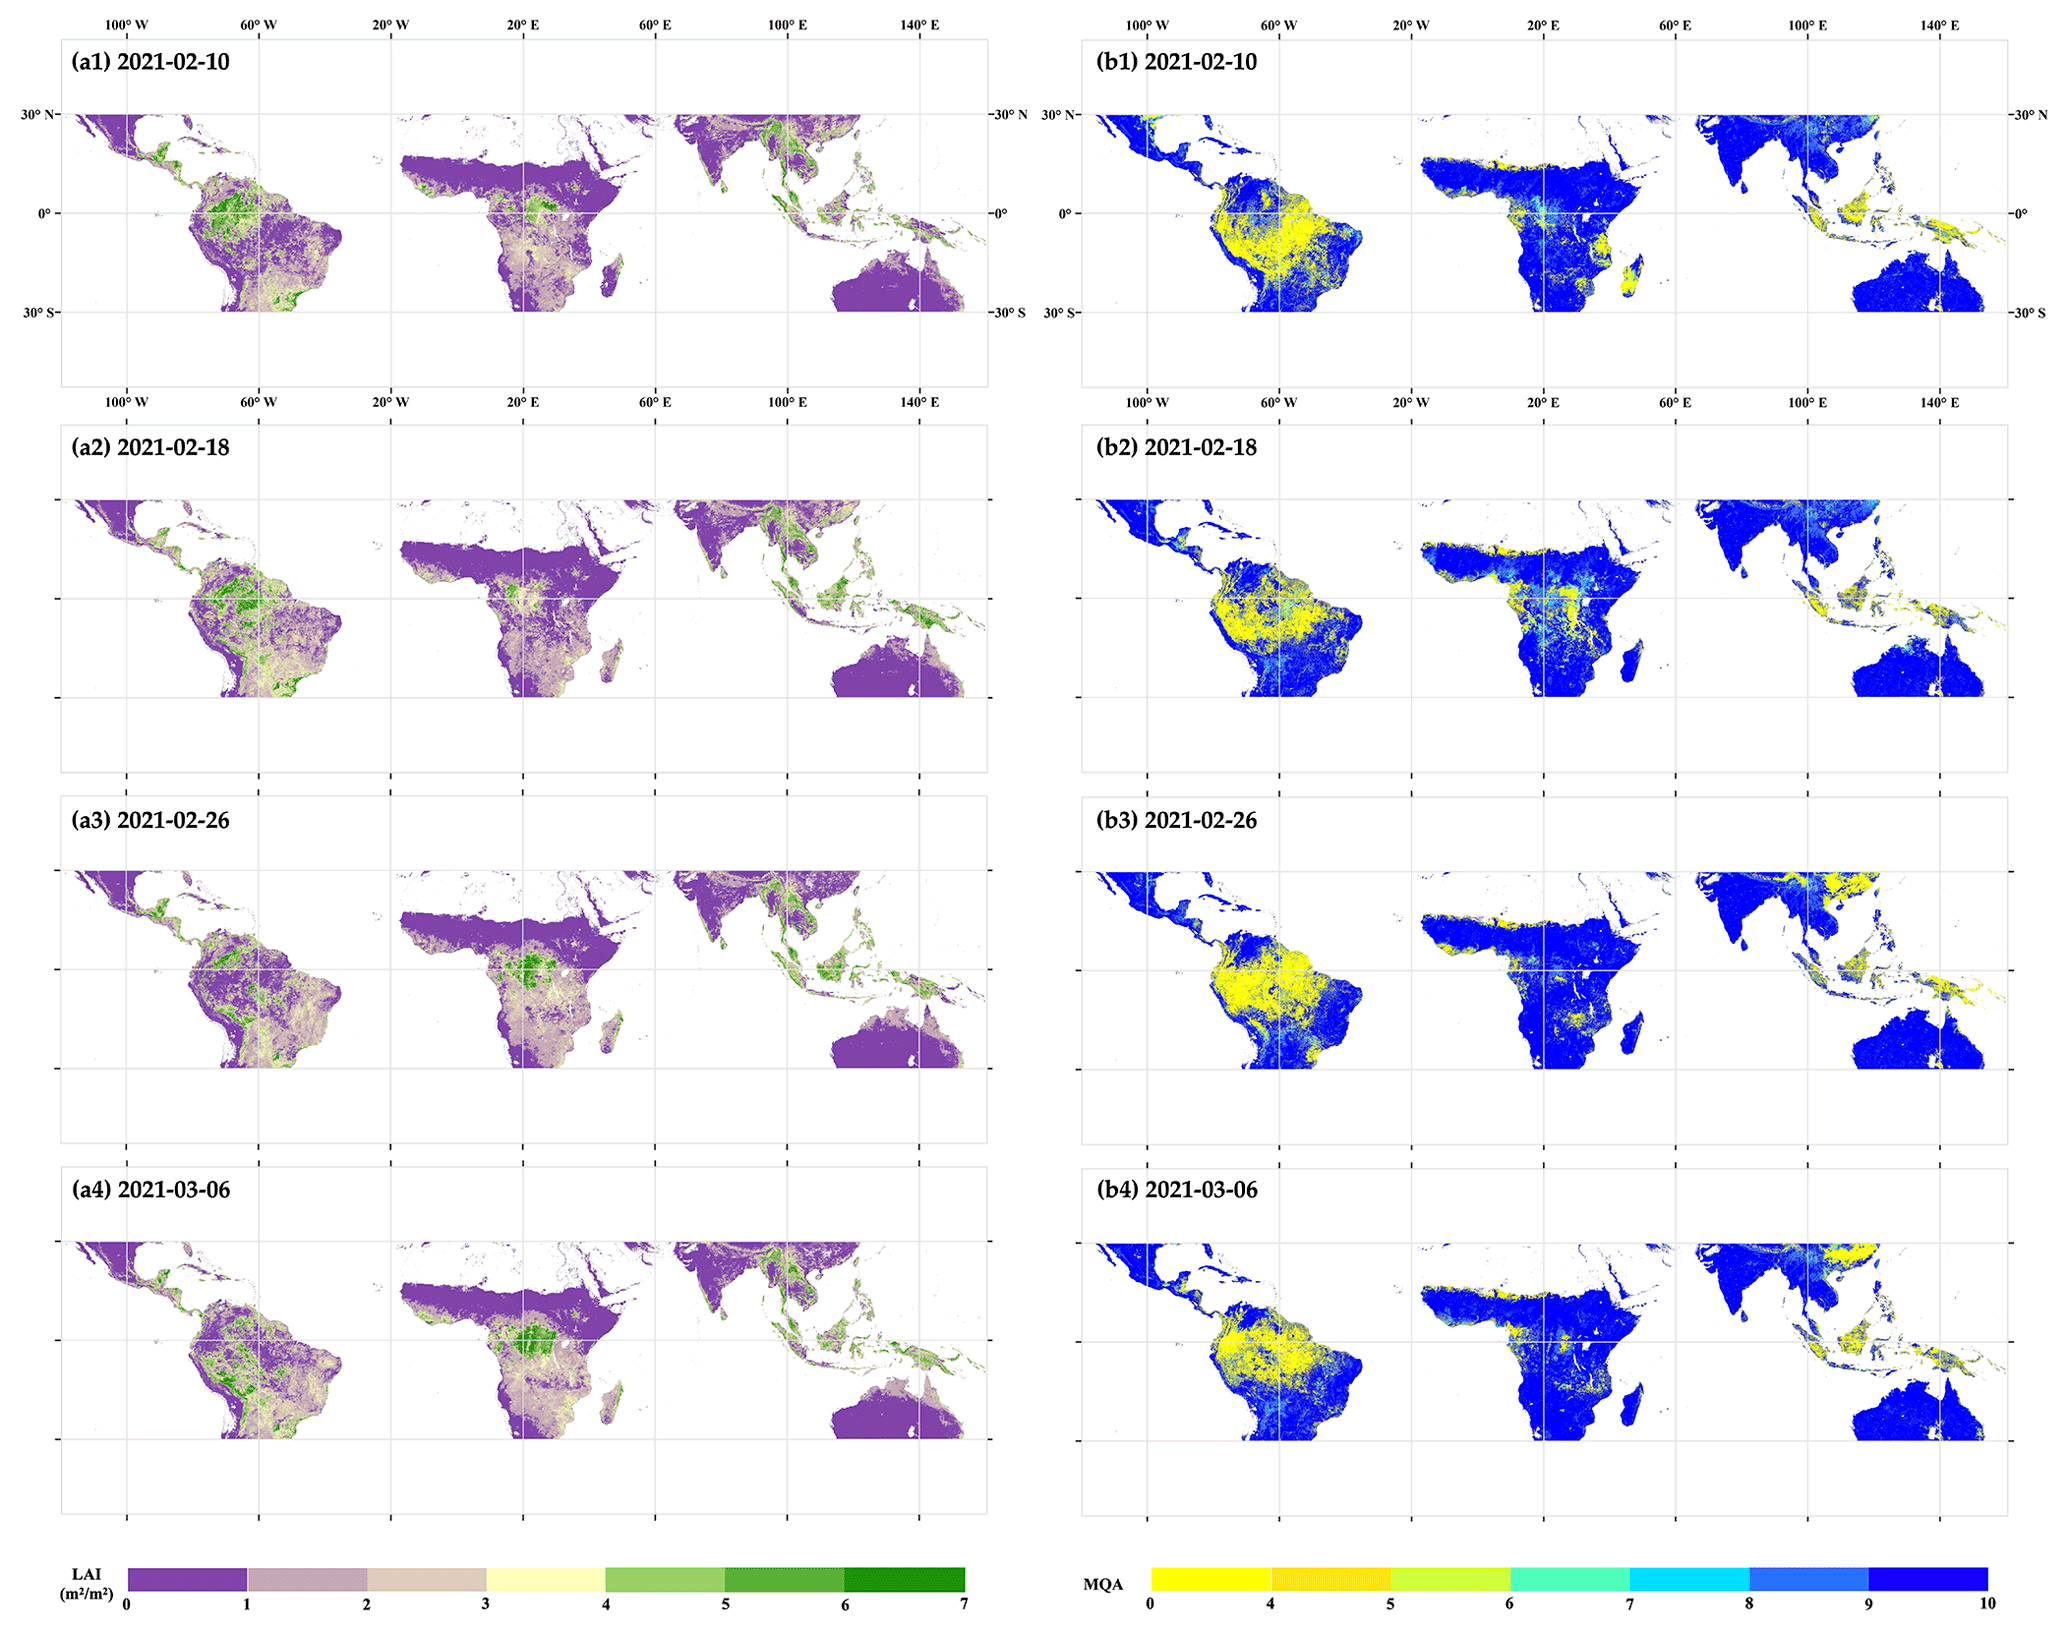
Figure 13Spatial distribution of MODIS LAI (a1–a4) and MQA (b1–b4) values over the equatorial region.
4.7 Detailed analysis in equatorial regions
Due to the long-term effects of extensive cloud cover contamination, high aerosols, and dense vegetation saturation, the availability of high-quality observation data from optical remote sensing in tropical regions is severely limited (Huete et al., 2002; Yuan et al., 2011; Xu et al., 2018). Among these regions, the Amazon forests, in particular, have a significant impact on global climate (Cox et al., 2013; Jimenez et al., 2018; Guimberteau et al., 2017) and carbon and water cycles (Marengo and Espinoza, 2016; Poulter et al., 2014; Yang et al., 2018). MODIS LAI retrievals are calculated independently pixel-by-pixel and daily. The varying observational conditions between adjacent time windows introduce more uncertainty, leading to relatively poor consistency in both temporal and spatial dimensions. Spatial pattern changes in MODIS LAI in short-term time series (Fig. 13) show that some higher values suddenly decrease in the next period, while some lower values suddenly increase. This phenomenon is unusual in heavily vegetated tropical regions, as previous studies have concluded that the LAI in Amazon forest areas is seasonal (Hashimoto et al., 2021; Samanta et al., 2012b; Myneni et al., 2007). Correspondingly, regions with sudden LAI changes exhibit lower MQA values, indicating that our method effectively identifies retrievals with quality issues.
The differences between the two products are mainly observed in the Amazon forest regions of South America, Indonesia, and central Africa. These areas are primarily characterized by the EBF vegetation type (Fig. 1), which aligns with the differences observed in the biome comparisons (Figs. 7, 8). The spatial pattern difference between MODIS LAI (Fig. 12a1) and HiQ-LAI (Fig. 12b1) at an 8 d resolution is the most pronounced. However, the spatial distributions of MODIS LAI and HiQ-LAI gradually become consistent as the synthesis period increases (Fig. 12). The 8 d relative difference (RD) density distribution shows a distinct peak towards the leftmost side. Nevertheless, the peak flattens out as the synthesis period increases, and the RD becomes more concentrated around zero. No significant spatial distribution change was observed in HiQ-LAI with an increasing synthesis period, and the 32 d synthesis data of MODIS LAI exhibited a similar spatial pattern to the 8 d product of HiQ-LAI. This evidence indirectly indicates that, compared with the original MODIS LAI, our products exhibit fewer abnormal fluctuations in the time series and greater stability in product quality. In terms of time-series stability and anomalies (Fig. 14), HiQ-LAI also outperforms MODIS LAI. By comprehensively considering pixel quality information and prior spatiotemporal correlation information, our algorithm effectively compensates for the abnormal fluctuations caused by differences in observational conditions. Through the optimization of MODIS LAI retrievals with poor quality, our algorithm substantially improves the quality of original MODIS LAI products and enhances their applicability in tropical regions. The increased stability and reliability of the HiQ-LAI product provide more reliable data support for research in tropical regions.
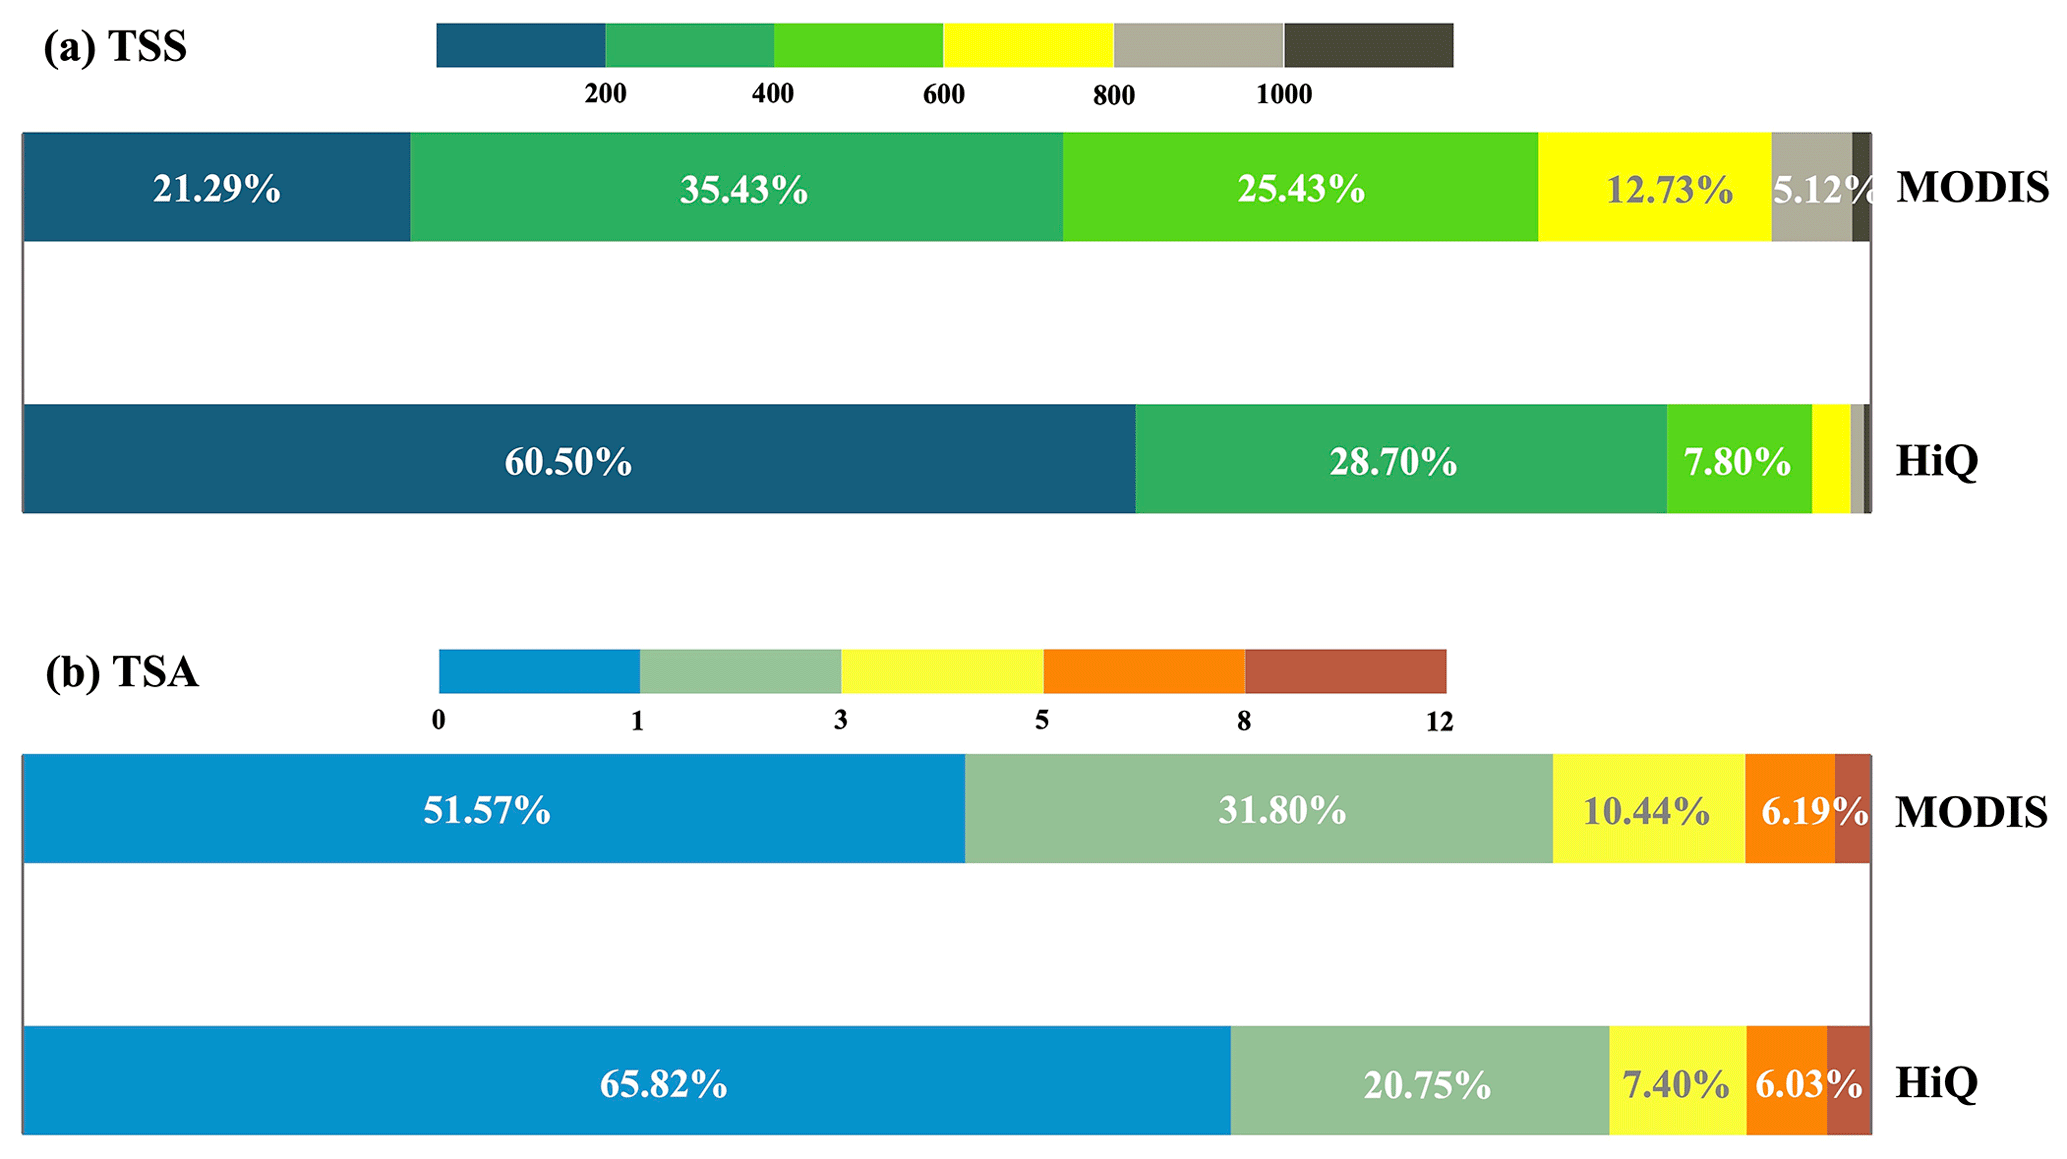
Figure 14The proportion of cumulative TSS (a) over 32 d and cumulative time-series anomaly (b) in 2021 between MODIS LAI and HiQ-LAI in the equatorial region.
As one of the most widely used LAI products, MODIS LAI possesses irreplaceable advantages. In this study, we employed an algorithm (STICA) based on the quality information and spatiotemporal correlation to effectively identify retrievals with poor quality and improve their quality while also maintaining the original physics-based (radiation transfer model, RTM) LAI generation process. The newly generated product, HiQ-LAI, is more reliable and consistent (both spatially and temporally) compared with the original MODIS LAI. Furthermore, the implementation of STICA solely relies on MODIS products without additional data requirements, mitigating the added uncertainty associated with using multiple data sources. Long-term time series of LAI play a crucial role in forest monitoring, climate model simulation (Boussetta et al., 2013; Richardson et al., 2013; Tillack et al., 2014), global water regulation, and carbon and energy cycles (A. P. J. Sellers et al., 1997; Chen et al., 2020). HiQ-LAI is expected to facilitate the advancement of these models by providing more accurate and reliable data sources. Additionally, due to the algorithm's high adaptability, it can also be applied to improve the data quality of other vegetation state parameters, such as FPAR, NDVI, and enhanced vegetation index (EVI).
We implemented the algorithm on the GEE cloud computing platform. Leveraging the powerful computing capabilities of the platform, users can easily conduct long-term time series and large-scale, or even global-scale, research and applications using this dataset. To facilitate users' understanding of the differences between the two products at the pixel scale, we provide the absolute difference between the two products as a data layer for users' reference.
Despite our efforts to enhance the overall data quality through spatiotemporal correlation, uncertainties still exist. This algorithm utilizes auxiliary MODIS Land Cover data (MCD12Q1) to identify pixels with the same biome type. Therefore, the classification uncertainty associated with these auxiliary data can affect the algorithm's accuracy. Additionally, the limited availability of high-quality observation samples in the high latitudes of the Northern Hemisphere, constrained by solar zenith angle and environmental conditions, poses challenges. Insufficient ground observation data in these regions further hinder accurate uncertainty assessments. Another source of uncertainty arises from the calculation of MQA values. The weight assigned to each pixel is not only influenced by its spatiotemporal proximity but also closely tied to the MQA value. Increased observed information provides more comprehensive information, enabling a more accurate assessment of pixel quality. Thus, future iterations of the product could incorporate additional pixel quality information, including environmental variables (e.g., cloud cover and aerosol) that substantially impact LAI.
The high-quality leaf area index (HiQ-LAI) is now accessible as an open dataset, providing two different spatial resolutions. The HiQ-LAI product with a spatial resolution of 500 m and a temporal resolution of 8 d is hosted on the GEE platform (https://code.earthengine.google.com/?asset=projects/verselab-398313/assets/HiQ_LAI/wgs_500m_8d, Yan et al., 2024). Including this dataset on the GEE platform will greatly benefit the GEE community, simplifying access to and utilization of this valuable resource. The dataset with a spatial resolution of 5 km and a temporal resolution of 8 d was derived by upscaling the original 500 m data using the nearest-neighbor method and can be found on Zenodo (https://doi.org/10.5281/zenodo.8296768, Yan et al., 2023). The HiQ-LAI product encompasses five-layer scientific datasets, containing LAI, original quality control information, relative TSS of MODIS and HiQ LAI, and the absolute difference between HiQ-LAI and MODIS LAI. For detailed quality control information, readers are referred to the MODIS Collection 6 (C6) LAI/FPAR Product User's Guide (Myneni, 2020). The original values have been adjusted to integers considering the data storage size, and all layers are stored as uint8 data types. The LAI layer has a valid range from 0 to 100, where each value represents 1/10 of the original value. The relative TSS of MODIS LAI and HiQ-LAI have valid ranges spanning from 0 to 10, with each value corresponding to 0.001 units. Lastly, the LAI difference layer (LAI_Diff) applies a scale factor of −100. Moreover, we utilized bicubic interpolation on a 500 m scale to create the 5 km and 8 d dataset, which is available on the GEE platform (https://code.earthengine.google.com/?asset=projects/verselab-398313/assets/HiQ_LAI/wgs_5km_8d_Bicubic, last access: 21 March 2024). This method involves considering information beyond just the nearest pixel and incorporating additional data from surrounding pixels to calculate new pixel values, which maximally preserves the pixel-level details from the original scale. Additionally, we aggregate the pixels by calculating the mean of a 5 km × 5 km window. Then, nearest-neighbor resampling can be carried out on this aggregated dataset to re-project it into the spatial resolution of 5 km. The final resulting 5 km dataset has been successfully stored on GEE (https://code.earthengine.google.com/?asset=projects/verselab-398313/assets/HiQ_LAI/wgs_5km_8d_NearNei, last access: 21 March 2024). More details about HiQ-LAI can be found on Zenodo https://doi.org/10.5281/zenodo.8296768 (Yan et al., 2023). Users are encouraged to refer to the data description document for guidance on value restoration.
The Moderate Resolution Imaging Spectroradiometer (MODIS) leaf area index (LAI) retrievals are calculated independently for each pixel and specific day. However, cloud, snow, aerosol pollution, sensor failure, and uncertainties in the retrieval algorithm lead to MODIS LAI products having poor spatiotemporal consistency that is accompanied by abnormally high noise. To address these limitations and improve the quality and spatiotemporal consistency of the existing MODIS LAI product at a global scale, we utilize the spatiotemporal information compositing algorithm (STICA), which leverages pixel quality information, spatiotemporal correlation, and original observation information to improve the MODIS LAI retrievals with poor quality. By considering multiple dimensions of information to compensate for the deficiency of using only temporal information, the high-quality reprocessed MODIS LAI dataset (HiQ-LAI) achieves better spatiotemporal consistency and provides global coverage from 2000 to 2022.
Direct ground verification demonstrates that HiQ-LAI exhibits higher accuracy and is closer to the ground references compared with the original MODIS LAI. MODIS LAI tends to overestimate LAI values for pure forests, especially in areas with low multiple quality assessment (MQA) values, due to signal saturation issues. When comparing the LAI time-series profile, it becomes evident that MODIS LAI is greatly affected by the observational conditions, resulting in abnormal fluctuations in the time series. In contrast, HiQ-LAI effectively mitigates these issues, generating smoother LAI time-series curves that align well with expected phenological patterns. Based on the references from the DIRECT 2.1 sites, the improvement rate of LAI retrievals gradually increased with the decreasing data quality. The global trend analysis reveals a general greening trend in most vegetated areas for both products. The MODIS LAI product has been widely used due to its clear theoretical basis and satisfactory verification results. Our original intention is to maintain consistency with the original high-quality MODIS LAI while enhancing the accuracy of LAI retrievals with poor quality. Our results confirm that both products generally exhibit similar spatial patterns globally, but differences emerge in certain regions, particularly near the Equator (e.g., South America, Indonesia, and the Amazon rainforest region of central Africa). These regions are characterized by evergreen broadleaf forest (EBF) and are affected by thick cloud cover, a high aerosol concentration, and NIR saturation throughout the year, substantially impacting the accuracy of MODIS LAI retrievals. Changes in observational conditions between adjacent time windows introduce more uncertainty, leading to the relatively poor spatiotemporal consistency of LAI. To address this challenge, we introduced prior knowledge and leveraged original high-quality observations and spatiotemporal correlation to optimize LAI retrievals with poor quality. The generated HiQ-LAI exhibits fewer abnormal fluctuations in time series and more consistent spatial patterns in regions with obvious differences, demonstrating a stronger stability and reliability of product quality. These findings indicate that our method effectively improves the spatiotemporal consistency of LAI products. The processing of HiQ-LAI is based on the GEE cloud computing platform, which provides users with easy access to long-term time series and large-scale global research and applications. Moreover, we plan to extend this algorithm to other MODIS products (e.g., FPAR and NDVI) that characterize vegetation state parameters to offer more comprehensive and accurate data support for vegetation monitoring and ecological research.
The supplement related to this article is available online at: https://doi.org/10.5194/essd-16-1601-2024-supplement.
KY and JW: methodology, conceptualization, software, formal analysis, visualization, and writing – original draft. KY: methodology, funding acquisition, project administration, investigation, and writing – review and editing. JW, RP, and KY: formal analysis and writing – review and editing. JP: investigation. XC and LF: investigation and supervision. MW: supervision, methodology, and resources. RBM: conceptualization, resources, and supervision.
The contact author has declared that none of the authors has any competing interests.
Publisher's note: Copernicus Publications remains neutral with regard to jurisdictional claims made in the text, published maps, institutional affiliations, or any other geographical representation in this paper. While Copernicus Publications makes every effort to include appropriate place names, the final responsibility lies with the authors.
The authors are grateful to the editors and anonymous reviewers for their constructive comments and suggestions with respect to improving the manuscript. We also gratefully acknowledge the Google Earth Engine (https://earthengine.google.com/, last access: 21 March 2024).
This research has been supported by the National Natural Science Foundation of China (grant nos. 42271356 and 42192580).
This paper was edited by Dalei Hao and reviewed by three anonymous referees.
Bai, G., Dash, J., Brown, L., Meier, C., Lerebourg, C., Ronco, E., Lamquin, N., Bruniquel, V., Clerici, M., and Gobron, N.: GBOV (Ground-Based Observation for Validation): A Copernicus Service for Validation of Vegetation Land Products, GARSS 2019 – 2019 IEEE International Geoscience and Remote Sensing Symposium, Yokohama, Japan, 4592–4594, https://doi.org/10.1109/IGARSS.2019.8898634, 2019.
Baret, F., Morissette, J. T., Fernandes, R. A., Champeaux, J. L., Myneni, R. B., Chen, J., Plummer, S., Weiss, M., Bacour, C., Garrigues, S., and Nickeson, J. E.: Evaluation of the representativeness of networks of sites for the global validation and intercomparison of land biophysical products: Proposition of the CEOS-BELMANIP, IEEE T. Geosci. Remote, 44, 1794–1802, https://doi.org/10.1109/TGRS.2006.876030, 2006.
Baret, F., Weiss, M., Lacaze, R., Camacho, F., Makhmara, H., Pacholcyzk, P., and Smets, B.: GEOV1: LAI and FAPAR essential climate variables and FCOVER global time series capitalizing over existing products. Part1: Principles of development and production, Remote Sens. Environ., 137, 299–309, https://doi.org/10.1016/j.rse.2012.12.027, 2013.
Boussetta, S., Balsamo, G., Beljaars, A., Kral, T., and Jarlan, L.: Impact of a satellite-derived leaf area index monthly climatology in a global numerical weather prediction model, Int. J. Remote Sens., 34, 3520–3542, https://doi.org/10.1080/01431161.2012.716543, 2013.
Brown, L. A., Meier, C., Morris, H., Pastor-Guzman, J., Bai, G., Lerebourg, C., Gobron, N., Lanconelli, C., Clerici, M., and Dash, J.: Evaluation of global leaf area index and fraction of absorbed photosynthetically active radiation products over North America using Copernicus Ground Based Observations for Validation data, Remote Sens. Environ., 247, 111935, https://doi.org/10.1016/j.rse.2020.111935, 2020.
Brown, L. A., Fernandes, R., Djamai, N., Meier, C., Gobron, N., Morris, H., Canisius, F., Bai, G., Lerebourg, C., Lanconelli, C., Clerici, M., and Dash, J.: Validation of baseline and modified Sentinel-2 Level 2 Prototype Processor leaf area index retrievals over the United States, ISPRS J. Photogramm., 175, 71–87, https://doi.org/10.1016/j.isprsjprs.2021.02.020, 2021.
Chen, C., Park, T., Wang, X., Piao, S., Xu, B., Chaturvedi, R. K., Fuchs, R., Brovkin, V., Ciais, P., Fensholt, R., Tømmervik, H., Bala, G., Zhu, Z., Nemani, R. R., and Myneni, R. B.: China and India lead in greening of the world through land-use management, Nat. Sustain., 2, 122–129, https://doi.org/10.1038/s41893-019-0220-7, 2019.
Chen, C., Li, D., Li, Y., Piao, S., Wang, X., Huang, M., Gentine, P., Nemani, R. R., and Myneni, R. B.: Biophysical impacts of Earth greening largely controlled by aerodynamic resistance, Sci. Adv., 6, 1–10, https://doi.org/10.1126/sciadv.abb1981, 2020.
Chen, J. M. and Black, T. A.: Defining leaf area index for non-flat leaves, Plant. Cell Environ., 15, 421–429, https://doi.org/10.1111/j.1365-3040.1992.tb00992.x, 1992.
Chen, L. and Dirmeyer, P. A.: Adapting observationally based metrics of biogeophysical feedbacks from land cover/land use change to climate modeling, Environ. Res. Lett., 11, 34002, https://doi.org/10.1088/1748-9326/11/3/034002, 2016.
Chen, Y., Feng, X., Tian, H., Wu, X., Gao, Z., Feng, Y., Piao, S., Lv, N., Pan, N., and Fu, B.: Accelerated increase in vegetation carbon sequestration in China after 2010: A turning point resulting from climate and human interaction, Glob. Change Biol., 27, 5848–5864, https://doi.org/10.1111/gcb.15854, 2021.
Cox, P. M., Pearson, D., Booth, B. B., Friedlingstein, P., Huntingford, C., Jones, C. D., and Luke, C. M.: Sensitivity of tropical carbon to climate change constrained by carbon dioxide variability, Nature, 494, 341–344, https://doi.org/10.1038/nature11882, 2013.
De Wit, A., Duveiller, G., and Defourny, P.: Estimating regional winter wheat yield with WOFOST through the assimilation of green area index retrieved from MODIS observations, Agr. Forest Meteorol., 164, 39–52, https://doi.org/10.1016/j.agrformet.2012.04.011, 2012.
Dhorde, A. G. and Patel, N. R.: Spatio-temporal variation in terminal drought over western India using dryness index derived from long-term MODIS data, Ecol. Inform., 32, 28–38, https://doi.org/10.1016/j.ecoinf.2015.12.007, 2016.
Fang, H., Liang, S., Townshend, J. R., and Dickinson, R. E.: Spatially and temporally continuous LAI data sets based on an integrated filtering method: Examples from North America, Remote Sens. Environ., 112, 75–93, https://doi.org/10.1016/j.rse.2006.07.026, 2006.
Fang, H., Liang, S., and Hoogenboom, G.: Integration of MODIS LAI and vegetation index products with the CSM-CERES-Maize model for corn yield estimation, Int. J. Remote Sens., 32, 1039–1065, https://doi.org/10.1080/01431160903505310, 2011.
Fang, H., Wei, S., and Liang, S.: Validation of MODIS and CYCLOPES LAI products using global field measurement data, Remote Sens. Environ., 119, 43–54, https://doi.org/10.1016/j.rse.2011.12.006, 2012.
Fang, H., Baret, F., Plummer, S., and Schaepman-Strub, G.: An Overview of Global Leaf Area Index (LAI): Methods, Products, Validation, and Applications, Rev. Geophys., 57, 739–799, https://doi.org/10.1029/2018RG000608, 2019.
Fernandes, R., Plummer, S., Nightingale, J., Baret, F., Camacho, F., Fang, H., Garrigues, S., Gobron, N., Lang, M., Lacaze, R., LeBlanc, S., Meroni, M., Martinez, B., Nilson, T., Pinty, B., Pisek, J., Sonnentag, O., Verger, A., Welles, J., Weiss, M., and Widlowski, J. L.: Global Leaf Area Index Product Validation Good Practices, Version 2.0, edited by: Schaepman-Strub, G., Román, M., and Nickeson, J., Good Pract. Satell. L. Prod. Valid., 1–78, https://doi.org/10.5067/doc/ceoswgcv/lpv/lai.002, 2014.
Fuster, B., Sánchez-Zapero, J., Camacho, F., García-Santos, V., Verger, A., Lacaze, R., Weiss, M., Baret, F., and Smets, B.: Quality assessment of PROBA-V LAI, fAPAR and fCOVER collection 300 m products of copernicus global land service, Remote Sens., 12, 1017, https://doi.org/10.3390/rs12061017, 2020.
Ganguly, S., Friedl, M. A., Tan, B., Zhang, X., and Verma, M.: Land surface phenology from MODIS: Characterization of the Collection 5 global land cover dynamics product, Remote Sens. Environ., 114, 1805–1816, https://doi.org/10.1016/j.rse.2010.04.005, 2010.
Gao, F., Morisette, J. T., Wolfe, R. E., Ederer, G., Pedelty, J., Masuoka, E., Myneni, R., Tan, B., and Nightingale, J.: An algorithm to produce temporally and spatially continuous MODIS-LAI time series, IEEE Geosci. Remote Sens. Lett., 5, 60–64, https://doi.org/10.1109/LGRS.2007.907971, 2008.
Garrigues, S., Lacaze, R., Baret, F., Morisette, J. T., Weiss, M., Nickeson, J. E., Fernandes, R., Plummer, S., Shabanov, N. V., Myneni, R. B., Knyazikhin, Y., and Yang, W.: Validation and intercomparison of global Leaf Area Index products derived from remote sensing data, J. Geophys. Res.-Biogeo., 113, G02028, https://doi.org/10.1029/2007JG000635, 2008.
Gorelick, N., Hancher, M., Dixon, M., Ilyushchenko, S., Thau, D., and Moore, R.: Google Earth Engine: Planetary-scale geospatial analysis for everyone, Remote Sens. Environ., 202, 18–27, https://doi.org/10.1016/j.rse.2017.06.031, 2017.
Guimberteau, M., Ciais, P., Ducharne, A., Boisier, J. P., Dutra Aguiar, A. P., Biemans, H., De Deurwaerder, H., Galbraith, D., Kruijt, B., Langerwisch, F., Poveda, G., Rammig, A., Rodriguez, D. A., Tejada, G., Thonicke, K., Von Randow, C., Von Randow, R. C. S., Zhang, K., and Verbeeck, H.: Impacts of future deforestation and climate change on the hydrology of the Amazon Basin: a multi-model analysis with a new set of land-cover change scenarios, Hydrol. Earth Syst. Sci., 21, 1455–1475, https://doi.org/10.5194/hess-21-1455-2017, 2017.
Hashimoto, H., Wang, W., Dungan, J. L., Li, S., Michaelis, A. R., Takenaka, H., Higuchi, A., Myneni, R. B., and Nemani, R. R.: New generation geostationary satellite observations support seasonality in greenness of the Amazon evergreen forests, Nat. Commun., 12, 684, https://doi.org/10.1038/s41467-021-20994-y, 2021.
Heiskanen, J., Rautiainen, M., Stenberg, P., Mõttus, M., Vesanto, V. H., Korhonen, L., and Majasalmi, T.: Seasonal variation in MODIS LAI for a boreal forest area in Finland, Remote Sens. Environ., 126, 104–115, https://doi.org/10.1016/j.rse.2012.08.001, 2012.
Huete, A., Didan, K., Miura, T., Rodriguez, E. P., Gao, X., and Ferreira, L. G.: Overview of the radiometric and biophysical performance of the MODIS vegetation indices, Remote Sens. Environ., 83, 195–213, 2002.
Ines, A. V. M., Das, N. N., Hansen, J. W., and Njoku, E. G.: Assimilation of remotely sensed soil moisture and vegetation with a crop simulation model for maize yield prediction, Remote Sens. Environ., 138, 149–164, https://doi.org/10.1016/j.rse.2013.07.018, 2013.
Jimenez, J. C., Barichivich, J., Mattar, C., Takahashi, K., Santamaría-Artigas, A., Sobrino, J. A., and Malhi, Y.: Spatio-temporal patterns of thermal anomalies and drought over tropical forests driven by recent extreme climatic anomalies, Philos. T. Roy. Soc. B, 373, 20170300, https://doi.org/10.1098/rstb.2017.0300, 2018.
Kendall, M. G.: Rank correlation methods, 1948.
Knyazikhin, Y.: MMODIS leaf area index (LAI) and fraction of photosynthetically active radiation absorbed by vegetation (FPAR) product (MOD15) algorithm theoretical basis document, https://lpdaac.usgs.gov/documents/90/MOD15_ATBD.pdf (last access: 21 March 2024), 1999.
Knyazikhin, Y., Martonchik, J. V., Myneni, R. B., Diner, D. J., and Running, S. W.: Synergistic algorithm for estimating vegetation canopy leaf area index and fraction of absorbed photosynthetically active radiation from MODIS and MISR data, J. Geophys. Res.-Atmos., 103, 32257–32275, https://doi.org/10.1029/98JD02462, 1998.
Li, X., Mao, F., Du, H., Zhou, G., Xu, X., Han, N., Sun, S., Gao, G., and Chen, L.: Assimilating leaf area index of three typical types of subtropical forest in China from MODIS time series data based on the integrated ensemble Kalman filter and PROSAIL model, ISPRS J. Photogramm., 126, 68–78, https://doi.org/10.1016/j.isprsjprs.2017.02.002, 2017.
Lin, W., Yuan, H., Dong, W., Zhang, S., Liu, S., Wei, N., Lu, X., Wei, Z., Hu, Y., and Dai, Y.: Reprocessed MODIS Version 6.1 Leaf Area Index Dataset and Its Evaluation for Land Surface and Climate Modeling, Remote Sens., 15, 1–25, https://doi.org/10.3390/rs15071780, 2023.
Ma, H. and Liang, S.: Development of the GLASS 250-m leaf area index product (version 6) from MODIS data using the bidirectional LSTM deep learning model, Remote Sens. Environ., 273, 112985, https://doi.org/10.1016/j.rse.2022.112985, 2022.
Mao, J., Shi, X., Thornton, P. E., Hoffman, F. M., Zhu, Z., and Myneni, R. B.: Global latitudinal-asymmetric vegetation growth trends and their driving mechanisms: 1982–2009, Remote Sens., 5, 1484–1497, https://doi.org/10.3390/rs5031484, 2013.
Marengo, J. A. and Espinoza, J. C.: Extreme seasonal droughts and floods in Amazonia: Causes, trends and impacts, Int. J. Climatol., 36, 1033–1050, https://doi.org/10.1002/joc.4420, 2016.
Mariano, D. A., Santos, C. A. C. do., Wardlow, B. D., Anderson, M. C., Schiltmeyer, A. V., Tadesse, T., and Svoboda, M. D.: Use of remote sensing indicators to assess effects of drought and human-induced land degradation on ecosystem health in Northeastern Brazil, Remote Sens. Environ., 213, 129–143, https://doi.org/10.1016/j.rse.2018.04.048, 2018.
Morisette, J. T., Baret, F., Privette, J. L., Myneni, R. B., Nickeson, J. E., Garrigues, S., Shabanov, N. V., Weiss, M., Fernandes, R. A., Leblanc, S. G., Kalacska, M., Sánchez-Azofeifa, G. A., Chubey, M., Rivard, B., Stenberg, P., Rautiainen, M., Voipio, P., Manninen, T., Pilant, A. N., Lewis, T. E., Iiames, J. S., Colombo, R., Meroni, M., Busetto, L., Cohen, W. B., Turner, D. P., Warner, E. D., Petersen, G. W., Seufert, G., and Cook, R.: Validation of global moderate-resolution LAI products: A framework proposed within the CEOS land product validation subgroup, IEEE T. Geosci., 44, 1804–1814, https://doi.org/10.1109/TGRS.2006.872529, 2006.
Myneni, R.: MODIS Collection 6 (C6) LAI/FPAR Product User's Guide, https://lpdaac.usgs.gov/documents/624/MOD15_User_Guide_V6.pdf (last access: 22 March 2024), 2020.
Myneni, R. B., Hoffman, S., Knyazikhin, Y., Privette, J. L., Glassy, J., Tian, Y., Wang, Y., Song, X., Zhang, Y., Smith, G. R., Lotsch, A., Friedl, M., Morisette, J. T., Votava, P., Nemani, R. R., and Running, S. W.: Global products of vegetation leaf area and fraction absorbed PAR from year one of MODIS data, Remote Sens. Environ., 83, 214–231, https://doi.org/10.1016/S0034-4257(02)00074-3, 2002.
Myneni, R. B., Yang, W., Nemani, R. R., Huete, A. R., Dickinson, R. E., Knyazikhin, Y., Didan, K., Fu, R., Negrón Juárez, R. I., Saatchi, S. S., Hashimoto, H., Ichii, K., Shabanov, N. V., Tan, B., Ratana, P., Privette, J. L., Morisette, J. T., Vermote, E. F., Roy, D. P., Wolfe, R. E., Friedl, M. A., Running, S. W., Votava, P., El-Saleous, N., Devadiga, S., Su, Y., and Salomonson, V. V.: Large seasonal swings in leaf area of Amazon rainforests, P. Natl. Acad. Sci. USA, 104, 4820–4823, https://doi.org/10.1073/pnas.0611338104, 2007.
Poulter, B., Frank, D., Ciais, P., Myneni, R. B., Andela, N., Bi, J., Broquet, G., Canadell, J. G., Chevallier, F., Liu, Y. Y., Running, S. W., Sitch, S., and Van Der Werf, G. R.: Contribution of semi-arid ecosystems to interannual variability of the global carbon cycle, Nature, 509, 600–603, https://doi.org/10.1038/nature13376, 2014.
Pu, J., Yan, K., Zhou, G., Lei, Y., Zhu, Y., Guo, D., Li, H., Xu, L., Knyazikhin, Y., and Myneni, R. B.: Evaluation of the MODIS LAI/FPAR algorithm based on 3D-RTM simulations: A case study of grassland, Remote Sens., 12, 1–17, https://doi.org/10.3390/rs12203391, 2020.
Richardson, A. D., Keenan, T. F., Migliavacca, M., Ryu, Y., Sonnentag, O., and Toomey, M.: Climate change, phenology, and phenological control of vegetation feedbacks to the climate system, Agr. Forest Meteorol., 169, 156–173, https://doi.org/10.1016/j.agrformet.2012.09.012, 2013.
Samanta, A., Ganguly, S., Vermote, E., Nemani, R. R., and Myneni, R. B.: Interpretation of variations in MODIS-measured greenness levels of Amazon forests during 2000 to 2009, Environ. Res. Lett., 7, 024018, https://doi.org/10.1088/1748-9326/7/2/024018, 2012a.
Samanta, A., Knyazikhin, Y., Xu, L., Dickinson, R. E., Fu, R., Costa, M. H., Saatchi, S. S., Nemani, R. R., and Myneni, R. B.: Seasonal changes in leaf area of Amazon forests from leaf flushing and abscission, J. Geophys. Res.-Biogeo., 117, 1–13, https://doi.org/10.1029/2011JG001818, 2012b.
Sellers, A. P. J., Dickinson, R. E., Randall, D. A., Betts, A. K., Hall, F. G., Berry, J. A., Collatz, J., Denning, A. S., Mooney, H. A., Nobre, C. A., Sato, N., Field, C. B., Sellers, P. J., Dickinson, R. E., Randall, D. A., Betts, A. K., Hall, F. G., Berry, J. A., Collatz, G. J., Denning, A. S., Mooney, H. A., Nobre, C. A., Sato, N., Field, C. B., and Henderson-Sellers, A.: Modeling the Exchanges of Energy, Water, and Carbon between Continents and the Atmosphere, Science, 275, 502–509, 1997.
Sellers, P. J., Dickinson, R. E., Randall, D. A., Betts, A. K., Hall, F. G., Berry, J. A., Collatz, G. J., Denning, A. S., Mooney, H. A., Nobre, C. A., Sato, N., Field, C. B., and Henderson-Sellers, A.: Modeling the exchanges of energy, water, and carbon between continents and the atmosphere, Science, 275, 502–509, https://doi.org/10.1126/science.275.5299.502, 1997.
uhartati, T.: Estimates of the Regression Coefficient Based on Kendall’s Tau, J. Am. Stat. Assoc., 63, 1379–1389, https://doi.org/10.1080/01621459.1968.10480934, 1968.
Sulla-Menashe, D. and Friedl, M. A.: User Guide to Collection 6 MODIS Land Cover Dynamics (MCD12Q2) Product, User Guid., 6, 1–8, 2018.
Theil, H.: A Rank-Invariant Method of Linear and Polynomial Regression Analysis, in: Raj, B. and Koerts, J., Henri Theil's Contributions to Economics and Econometrics, Adv. Stud. Theor. Appl. Econom., 23, 1397–1412, 1992.
Tillack, A., Clasen, A., Kleinschmit, B., and Förster, M.: Estimation of the seasonal leaf area index in an alluvial forest using high-resolution satellite-based vegetation indices, Remote Sens. Environ., 141, 52–63, https://doi.org/10.1016/j.rse.2013.10.018, 2014.
Wang, J., Yan, K., Gao, S., Pu, J., Liu, J., Park, T., Bi, J., Maeda, E. E., Heiskanen, J., Knyazikhin, Y., and Myneni, R. B.: Improving the Quality of MODIS LAI Products by Exploiting Spatiotemporal Correlation Information, IEEE T. Geosci. Remote, 61, 1–19, https://doi.org/10.1109/TGRS.2023.3264280, 2023.
Wenze, Y., Tan, B., Huang, D., Rautiainen, M., Shabanov, N. V., Wang, Y., Privette, J. L., Huemmrich, K. F., Fensholt, R., Sandholt, I., Weiss, M., Ahl, D. E., Gower, S. T., Nemani, R. R., Knyazikhin, Y., and Myneni, R. B.: MODIS leaf area index products: From validation to algorithm improvement, IEEE T. Geosci. Remote, 44, 1885–1896, https://doi.org/10.1109/TGRS.2006.871215, 2006.
Xiao, Z., Liang, S., Wang, J., Song, J., and Wu, X.: A temporally integrated inversion method for estimating leaf area index from MODIS data, IEEE T. Geosci., 47, 2536–2545, https://doi.org/10.1109/TGRS.2009.2015656, 2009.
Xiao, Z., Liang, S., Wang, J., Chen, P., Yin, X., Zhang, L., and Song, J.: Use of general regression neural networks for generating the GLASS leaf area index product from time-series MODIS surface reflectance, IEEE T. Geosci. Remote, 52, 209–223, 2013.
Xu, B., Park, T., Yan, K., Chen, C., Zeng, Y., Song, W., Yin, G., Li, J., Liu, Q., Knyazikhin, Y., and Myneni, R. B.: Analysis of global LAI/FPAR products from VIIRS and MODIS sensors for spatio-temporal consistency and uncertainty from 2012–2016, Forests, 9, 1–21, https://doi.org/10.3390/f9020073, 2018.
Yan, K., Park, T., Yan, G., Chen, C., Yang, B., Liu, Z., Nemani, R. R., Knyazikhin, Y., and Myneni, R. B.: Evaluation of MODIS LAI/FPAR product collection 6. Part 1: Consistency and improvements, Remote Sens., 8, 1–16, https://doi.org/10.3390/rs8050359, 2016a.
Yan, K., Park, T., Yan, G., Liu, Z., Yang, B., Chen, C., Nemani, R. R., Knyazikhin, Y., and Myneni, R. B.: Evaluation of MODIS LAI/FPAR product collection 6. Part 2: Validation and intercomparison, Remote Sens., 8, 460, https://doi.org/10.3390/rs8060460, 2016b.
Yan, K., Park, T., Chen, C., Xu, B., Song, W., Yang, B., Zeng, Y., Liu, Z., Yan, G., Knyazikhin, Y., and Myneni, R. B.: Generating global products of LAI and FPAR from SNPP-VIIRS data: Theoretical background and implementation, IEEE T. Geosci. Remote, 56, 2119–2137, https://doi.org/10.1109/TGRS.2017.2775247, 2018.
Yan, K., Zou, D., Yan, G., Fang, H., Weiss, M., Rautiainen, M., Knyazikhin, Y., and Myneni, R. B.: A Bibliometric Visualization Review of the MODIS LAI/FPAR Products from 1995 to 2020, J. Remote Sens., 2021, 1–20, https://doi.org/10.34133/2021/7410921, 2021a.
Yan, K., Pu, J., Park, T., Xu, B., Zeng, Y., Yan, G., Weiss, M., Knyazikhin, Y., and Myneni, R. B.: Performance stability of the MODIS and VIIRS LAI algorithms inferred from analysis of long time series of products, Remote Sens. Environ., 260, 112438, https://doi.org/10.1016/j.rse.2021.112438, 2021b.
Yan, K., Wang, J., Weiss, M., and Myneni, R. B.: A High-Quality Reprocessed MODIS Leaf Area Index Dataset (HiQ-LAI) (Version 1), Zenodo [data set], https://doi.org/10.5281/zenodo.8296768, 2023.
Yan, K., Wang, J., Weiss, M., and Myneni, R. B.: A High-Quality Reprocessed MODIS Leaf Area Index Dataset (HiQ-LAI), https://code.earthengine.google.com/?asset=projects/verselab-398313/assets/HiQ_LAI/wgs_500m_8d, last access: 21 March 2024.
Yang, Y., Saatchi, S. S., Xu, L., Yu, Y., Choi, S., Phillips, N., Kennedy, R., Keller, M., Knyazikhin, Y., and Myneni, R. B.: Post-drought decline of the Amazon carbon sink, Nat. Commun., 9, 3172, https://doi.org/10.1038/s41467-018-05668-6, 2018.
Yuan, H., Dai, Y., Xiao, Z., Ji, D., and Shangguan, W.: Reprocessing the MODIS Leaf Area Index products for land surface and climate modelling, Remote Sens. Environ., 115, 1171–1187, https://doi.org/10.1016/j.rse.2011.01.001, 2011.
Zheng, K., Tan, L., Sun, Y., Wu, Y., Duan, Z., Xu, Y., and Gao, C.: Impacts of climate change and anthropogenic activities on vegetation change: Evidence from typical areas in China, Ecol. Indic., 126, 107648, https://doi.org/10.1016/j.ecolind.2021.107648, 2021.
Zhu, Z., Piao, S., Myneni, R. B., Huang, M., Zeng, Z., Canadell, J. G., Ciais, P., Sitch, S., Friedlingstein, P., Arneth, A., Cao, C., Cheng, L., Kato, E., Koven, C., Li, Y., Lian, X., Liu, Y., Liu, R., Mao, J., Pan, Y., Peng, S., Peuelas, J., Poulter, B., Pugh, T. A. M., Stocker, B. D., Viovy, N., Wang, X., Wang, Y., Xiao, Z., Yang, H., Zaehle, S., and Zeng, N.: Greening of the Earth and its drivers, Nat. Clim. Change, 6, 791–795, https://doi.org/10.1038/nclimate3004, 2016.
Zhuo, W., Fang, S., Gao, X., Wang, L., Wu, D., Fu, S., Wu, Q., and Huang, J.: Crop yield prediction using MODIS LAI, TIGGE weather forecasts and WOFOST model: A case study for winter wheat in Hebei, China during 2009–2013, Int. J. Appl. Earth Obs. Geoinf., 106, 102668, https://doi.org/10.1016/j.jag.2021.102668, 2022.
Zou, D., Yan, K., Pu, J., Gao, S., Li, W., Mu, X., Knyazikhin, Y., and Myneni, R. B.: Revisit the Performance of MODIS and VIIRS Leaf Area Index Products from the Perspective of Time-Series Stability, IEEE J. Sel. Top. Appl., 15, 8958–8973, https://doi.org/10.1109/JSTARS.2022.3214224, 2022.