the Creative Commons Attribution 4.0 License.
the Creative Commons Attribution 4.0 License.
 | 04 Jan 2024
Sensor-independent LAI/FPAR CDR: reconstructing a global sensor-independent climate data record of MODIS and VIIRS LAI/FPAR from 2000 to 2022
Jiabin Pu
Samapriya Roy
Zaichun Zhu
Miina Rautiainen
Yuri Knyazikhin
Ranga B. Myneni
Leaf area index (LAI) and fraction of photosynthetically active radiation (FPAR) are critical biophysical parameters for the characterization of terrestrial ecosystems. Long-term global LAI/FPAR products, such as the moderate resolution imaging spectroradiometer (MODIS) and the Visible Infrared Imaging Radiometer Suite (VIIRS), provide the fundamental dataset for accessing vegetation dynamics and studying climate change. However, existing global LAI/FPAR products suffer from several limitations, including spatial–temporal inconsistencies and accuracy issues. Considering these limitations, this study develops a sensor-independent (SI) LAI/FPAR climate data record (CDR) based on Terra-MODIS/Aqua-MODIS/VIIRS LAI/FPAR standard products. The SI LAI/FPAR CDR covers the period from 2000 to 2022, at spatial resolutions of 500 m/5 km/0.05∘, 8 d/bimonthly temporal frequencies and available in sinusoidal and WGS1984 projections. The methodology includes (i) comprehensive analyses of sensor-specific quality assessment variables to select high-quality retrievals, (ii) application of the spatial–temporal tensor (ST-tensor) completion model to extrapolate LAI and FPAR beyond areas with high-quality retrievals, (iii) generation of SI LAI/FPAR CDR in various projections and various spatial and temporal resolutions, and (iv) evaluation of the CDR by direct comparisons with ground data and indirectly through reproducing results of LAI/FPAR trends documented in the literature. This paper provides a comprehensive analysis of each step involved in the generation of the SI LAI/FPAR CDR, as well as evaluation of the ST-tensor completion model. Comparisons of SI LAI (FPAR) CDR with ground truth data suggest an RMSE of 0.84 LAI (0.15 FPAR) units with R2 of 0.72 (0.79), which outperform the standard Terra/Aqua/VIIRS LAI (FPAR) products. The SI LAI/FPAR CDR is characterized by a low time series stability (TSS) value, suggesting a more stable and less noisy dataset than sensor-dependent counterparts. Furthermore, the mean absolute error (MAE) of the CDR is also lower, suggesting that SI LAI/FPAR CDR is comparable in accuracy to high-quality retrievals. LAI/FPAR trend analyses based on the SI LAI/FPAR CDR agree with previous studies, which indirectly provides enhanced capabilities to utilize this CDR for studying vegetation dynamics and climate change. Overall, the integration of multiple satellite data sources and the use of advanced gap filling modeling techniques improve the accuracy of the SI LAI/FPAR CDR, ensuring the reliability of long-term vegetation studies, global carbon cycle modeling, and land policy development for informed decision-making and sustainable environmental management. The SI LAI/FPAR CDR is open access and available under a Creative Commons Attribution 4.0 License at https://doi.org/10.5281/zenodo.8076540 (Pu et al., 2023a).
- Article
(17471 KB) - Full-text XML
-
Supplement
(12519 KB) - BibTeX
- EndNote


The leaf area index (LAI) is a fundamental parameter for quantifying the structural and functional characteristics of terrestrial vegetation canopies, defined as half of the total green foliage per unit of horizontal ground area (Chen and Black, 1992; Chen, 1996). LAI plays an essential role in models of ecological processes, global primary productivity, climate dynamics, water cycle, and the carbon cycle analysis (Sellers et al., 1997; Boussetta et al., 2013; Piao et al., 2015; Fang et al., 2019; Chen et al., 2022). The fraction of incident photosynthetically active radiation (400–700 nm) absorbed by vegetation (FPAR) is an important biophysical parameter used to quantify the energy absorption capacity of the vegetation canopy (Knyazikhin et al., 1998a; Myneni et al., 2002). LAI and FPAR are key climate variables and biodiversity metrics identified by the United Nations Global Climate Observing System (GCOS) (Skidmore et al., 2015).
In recent decades, there has been a remarkable increase in the use of global long-term satellite-derived LAI/FPAR datasets from various sensors, e.g., the Advanced Very High-Resolution Radiometer (AVHRR), the Moderate Resolution Imaging Spectroradiometer (MODIS), and the Visible Infrared Imaging Radiometer Suite (VIIRS). Among these, the LAI/FPAR products from MODIS on the Terra platform have been widely used since 2000 and represent a milestone in operational generation of vegetation parameters from satellite observations (Knyazikhin, 1999; Myneni and Park, 2015; Yan et al., 2016, 2021c). The LAI/FPAR are also available from MODIS on the Aqua platform and VIIRS on the Suomi National Polar-Orbiting Partnership (S-NPP) and the Joint Polar Satellite System (JPSS) satellites since 2002 (2012), ensuring the extension of the Terra MODIS long-term data record (Justice et al., 2013). The MODIS/VIIRS LAI/FPAR datasets have contributed significantly to many studies, such as terrestrial carbon sinks, understanding seasonal and interannual variations in equatorial forests, analyses of spatial patterns of drought, and climate and energy flux dynamics (Tang et al., 2013; Mariano et al., 2018; Chen et al., 2019, 2022; Sun et al., 2022).
Two weaknesses of the MODIS/VIIRS LAI/FPAR products have been identified (i.e., temporal stability and absolute accuracy), which limit their application in vegetation dynamic studies (Fang et al., 2012a, 2019; Yan et al., 2021a). These problems mainly arise due to uncertainties in input information to the operational retrieval algorithm such as surface reflectance and land cover type (Knyazikhin, 1999; Fang et al., 2019; Tian et al., 2000). Several post-processing techniques have been proposed to remove uncertainties in the MODIS/VIIRS LAI/FPAR standard products. These techniques include (1) identifying areas with a high fraction of water area in the satellite pixel and removing their impact on the retrieval using a mixed pixel correction method (Xu et al., 2020; Dong et al., 2023); (2) integration of prior knowledge of reflectance variations into the generation of the image composite (Pu et al., 2023b); and (3) accounting for the canopy hotspot effect in the retrieval technique (Yan et al., 2021b). These methods would increase product spatial coverage. Furthermore, the scientific community also developed various gap filling techniques to extrapolate retrievals beyond areas with valid satellite observations such as (1) cubic splines (Mitášová and Hofierka, 1993); (2) spatial linear, bilinear, and kriging interpolations (Xu et al., 2015; Smith, 1981; Oliver and Webster, 1990); and (3) various temporal extrapolation techniques (Holben, 1986; Lange et al., 2017; Roerink et al., 2000; Zhu et al., 2011; Das and Ghosh, 2017; Chu et al., 2021; Wang et al., 2023). However, most of the approaches are characterized by high computational costs or lack of information necessary for their implementation at the global scale. Consequently, most research has been limited to specific regions (e.g., China and North America), leaving a significant gap in developing a climate data record (CDR) which, by definition, is a consistently processed time series of uncertainty-quantified data, located in time and space, of sufficient length and quality to be useful for climate timescale analyses (Merchant et al., 2017).
The objective of this paper is to develop a long-term LAI and FPAR CDR using standard LAI and FPAR products from MODIS and VIIRS sensors. Our approach includes (i) comprehensive analyses of sensor-specific quality assessment (QA) variables to select high-quality retrievals, (ii) application of the spatial–temporal tensor (ST-tensor) completion model (Chu et al., 2021) to extrapolate LAI and FPAR beyond areas with high-quality retrievals, (iii) generation of SI LAI/FPAR CDR in various projections and various spatial and temporal resolutions, and (iv) evaluation of the CDR by direct comparisons with ground measurement and indirectly through reproducing results of LAI/FPAR trend analyses to revisit the “Greening Earth”.
The paper is organized as follows: Section 2 introduces the data used in this study and the study area. Section 3 details the steps involved in generating the SI LAI/FPAR CDR, including analyses of sensor-specific QA, generation of high-quality filtered SI LAI/FPAR time series, and applying the ST-tensor completion model. The results of the validation and evaluation are presented in Sect. 4. Section 5 discusses the underlying factors that contributed to the improvement of the SI LAI/FPAR CDR and the associated issues and challenges. The final section summarizes the key findings and highlights the significance of the research.
2.1 LAI/FPAR products: MOD15A2H, MYD15A2H, and VNP15A2H
The MODIS/VIIRS LAI/FPAR inputs surface bidirectional reflectance factors (BRFs) in the red and near-infrared (NIR) spectral bands, their uncertainties, sun-sensor geometry, and biome classification map, and they retrieve the LAI and FPAR for each satellite pixel. The retrieval technique consists of a main algorithm, which is based on the radiative transfer equation (RTE), and a backup algorithm, which uses empirical relationships between the normalized difference vegetation index (NDVI) and canopy LAI/FPAR (Myneni et al., 2002; Yan et al., 2018; Knyazikhin, 1999; Knyazikhin et al., 1998b). The main algorithm compares the observed spectral BRF with those evaluated from the RTE-based entries stored in a look-up table (LUT) for a suite of canopy structures and soil patterns that represent an expected range of typical conditions for a given biome type. All canopy/soil patterns for which modeled and observed BRFs differ within a specified uncertainty level are considered as acceptable solutions. The mean values of LAI and FPAR, and their dispersions, are reported as retrievals and their uncertainties. When this method fails to localize a solution, the backup method is utilized (Myneni et al., 2002; Yan et al., 2018).
Analyses of the performance of the MODIS LAI/FPAR algorithm indicate that the best-quality, high-precision retrievals are obtained from the main algorithm. In the case of dense canopies, the BRFs saturate and become weakly sensitive to changes in canopy properties. The reliability of parameters retrieved under the condition of saturation is lower than that generated by the main algorithm using unsaturated BRF. The algorithm path is the key quality assessment (QA) flag that provides information about the overall quality of the LAI/FPAR. It includes four values (from highest to lowest quality): the main algorithm without saturation, the main algorithm with saturation, the backup algorithm due to sun-sensor geometry, and the backup algorithm due to other reasons. The QA variables provide information about the cloud state, aerosol load, and the presence of snow, which are inherited from the upstream BRF product (Knyazikhin, 1999; Myneni and Park, 2015; Yan et al., 2016; Park et al., 2017).
The daily retrievals are composited over an 8 d period by selecting the LAI and FPAR pair corresponding to the maximum FPAR value generated by the main algorithm (Knyazikhin and Myneni, 2018). The backup algorithm retrievals are selected only when no main algorithm retrievals are available during the 8 d compositing period. The 8 d composited LAI/FPAR product is distributed to the public from the NASA EOSDIS Land Processes Distributed Active Archive Center (Myneni et al., 2015; Myneni and Knyazikhin, 2018).
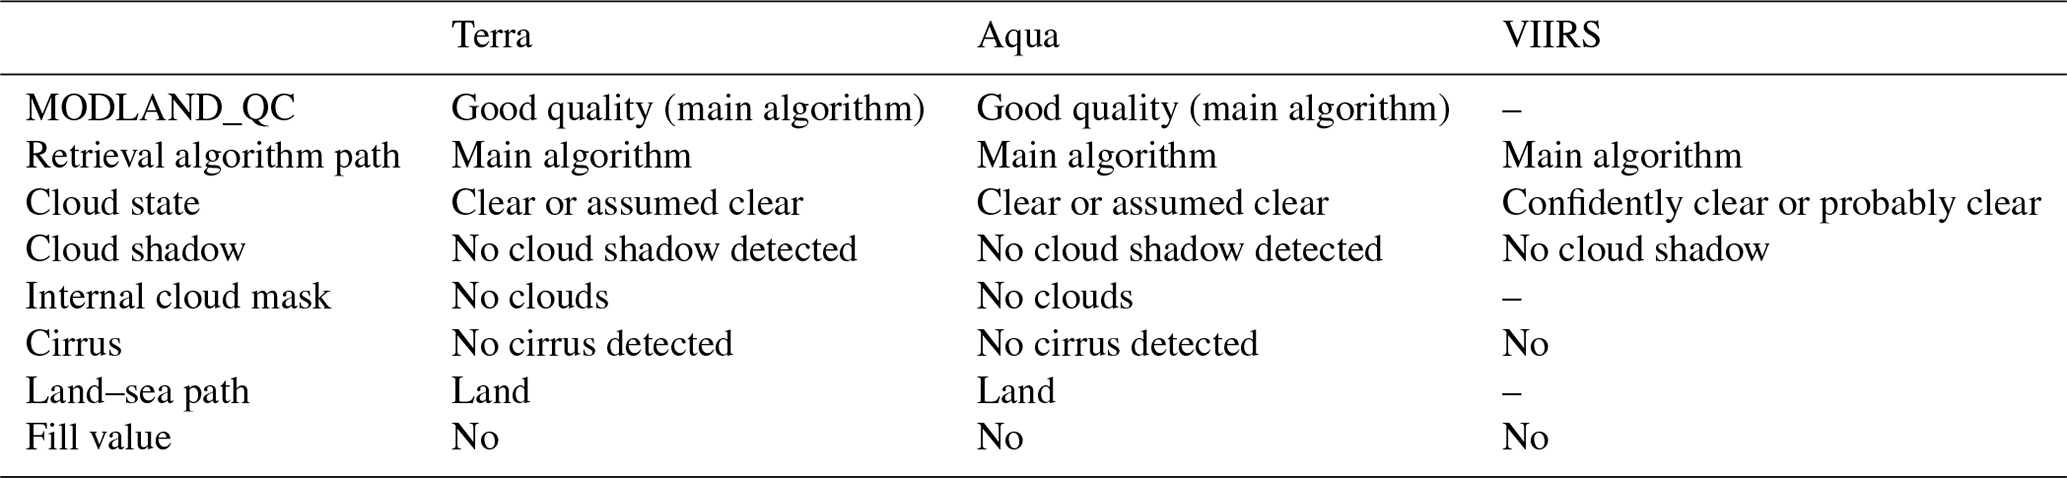
In this study, we used the Collection 6 (C6) MOD15A2H, C6 MYD15A2H, and the Collection 1 (C1) VNP15A2H LAI/FPAR products. The products are available at 500 m sinusoidal grid and are updated every 8 d, resulting in approximately 46 composites per year. MOD15A2H data have been available since 18 February 2000, MYD15A2H since 14 July 2002, and VNP15A2H since 17 January 2012. These datasets are distributed in standard hierarchical data format (HDF) files. Each HDF file contains six scientific datasets (SDS): FPAR, LAI, FparLai_QC, FparExtra_QC, FparStdDev, and LaiStdDev. The LAI and FPAR layers contain the LAI/FPAR retrievals, while the FparLai_QC and FparExtra_QC layers provide information about the algorithm paths and atmospheric conditions. This quality information underlies the first step in generating SI LAI/FPAR CDR, as detailed in Sect. 3.1.
2.2 Land cover map: MCD12Q1
The MODIS land cover product (MCD12Q1) provides a global map of land cover types at a spatial resolution of 500 m and an annual time step (Sulla-Menashe and Friedl, 2018). In this study, we used the LAI legacy classification scheme (LC_Type_3), which categorizes global vegetation into eight biomes: grasses and cereal crops (biome 1), shrubs (biome 2), broadleaf crops (biome 3), savannas (biome 4), evergreen broadleaf forests (EBF; biome 5), deciduous broadleaf forests (DBF; biome 6), evergreen needleleaf forests (ENF; biome 7), and deciduous needleleaf forests (DNF; biome 8) (Sulla-Menashe and Friedl, 2018). The biome classification map is an important auxiliary dataset for MODIS/VIIRS LAI/FPAR operational algorithms. It reduces the number of unknowns of the inverse problem through the use of simplifying assumptions (e.g., leaf normal orientation) and standard constants (e.g., leaf albedo and patterns of ground reflectance) that are assumed to vary with the biome (Knyazikhin, 1999). A global distribution of the eight biomes is shown in Fig. 1.
2.3 Ground LAI/FPAR reference
The growing utilization of earth observation (EO) products has highlighted the importance of addressing product uncertainty through validation based on ground measurements (Baret et al., 2006; Yang et al., 2006; Fang et al., 2012b). In our study, we validated the SI LAI/FPAR CDR by comparing their values with LAI and FPAR ground reference data from version 3 of the Copernicus Ground-Based Observations for Validation (GBOV) and version 2 of the DIRECT database (Brown et al., 2020, 2021). The combined utilization of both sets of measured data provides comprehensive coverage across the globe, encompassing a diverse array of representative biome types. The only notable exceptions are the eastern part of China and Eastern Europe, which lacks the measurement sites.
GBOV, part of the Copernicus Global Land Service, aims to facilitate the use of ground-based observations to validate EO products and ensure their quality and consistency. GBOV collects multiyear ground-based observations from global networks and upgrades existing sites or establishes new ones to bridge thematic or geographic gaps (Brown et al., 2020; Bai et al., 2022). To ensure data quality, the GBOV reference database has undergone rigorous quality control procedures and includes various measurements such as top of canopy reflectance, surface albedo, LAI, FPAR, proportion of ground cover, soil moisture at 5 cm depth, and surface temperature. GBOV data are available through the open GBOV portal (https://gbov.acri.fr, last access: 21 December 2023). We used the GBOV LAI/FPAR maps since 2014 as a reference dataset. We selected 29 GBOV sites of 3 km × 3 km each (see Fig. 1). The LAI/FPAR reference maps were averaged over the 3 km × 3 km area for product assessment. Statistics based on downloaded data, i.e., the GBOV validation dataset used in this study, consisted of 9805 LAI and 10 548 FPAR measurements.
The DIRECT LAI, FPAR, and vegetation cover are available as spatially averaged values over 3 km × 3 km reference maps (Brown et al., 2021). Following the CEOS WGCV LPV good practice, the ground data are enhanced with high spatial resolution imagery to account for spatial heterogeneity. This dataset includes 176 global sites representing seven major biome types, covering the period from 2000 to 2021. Forest sites without understorey are filtered out of the DIRECT database (https://calvalportal.ceos.org/lpv-direct-v2.1, last access: 21 December 2023). The dataset used in this study contains 446 LAI and 109 FPAR measurements.
2.4 Study area
Figure 1 shows distribution of biome types and selected GBOV and DIRECT validation sites. We selected a study area of global world, and selected the typical area of 86 to 30∘ W and from 20∘ S to 10∘ N (inset in Fig. 1), containing Amazonian forests to highlight the importance of various steps in developing the SI LAI/FPAR CDR. Obtaining high-quality observations over this area is difficult due to a large amount of cloud-contaminated data. It is therefore particularly valuable to assess the quality of our LAI/FPAR CDR in this region.
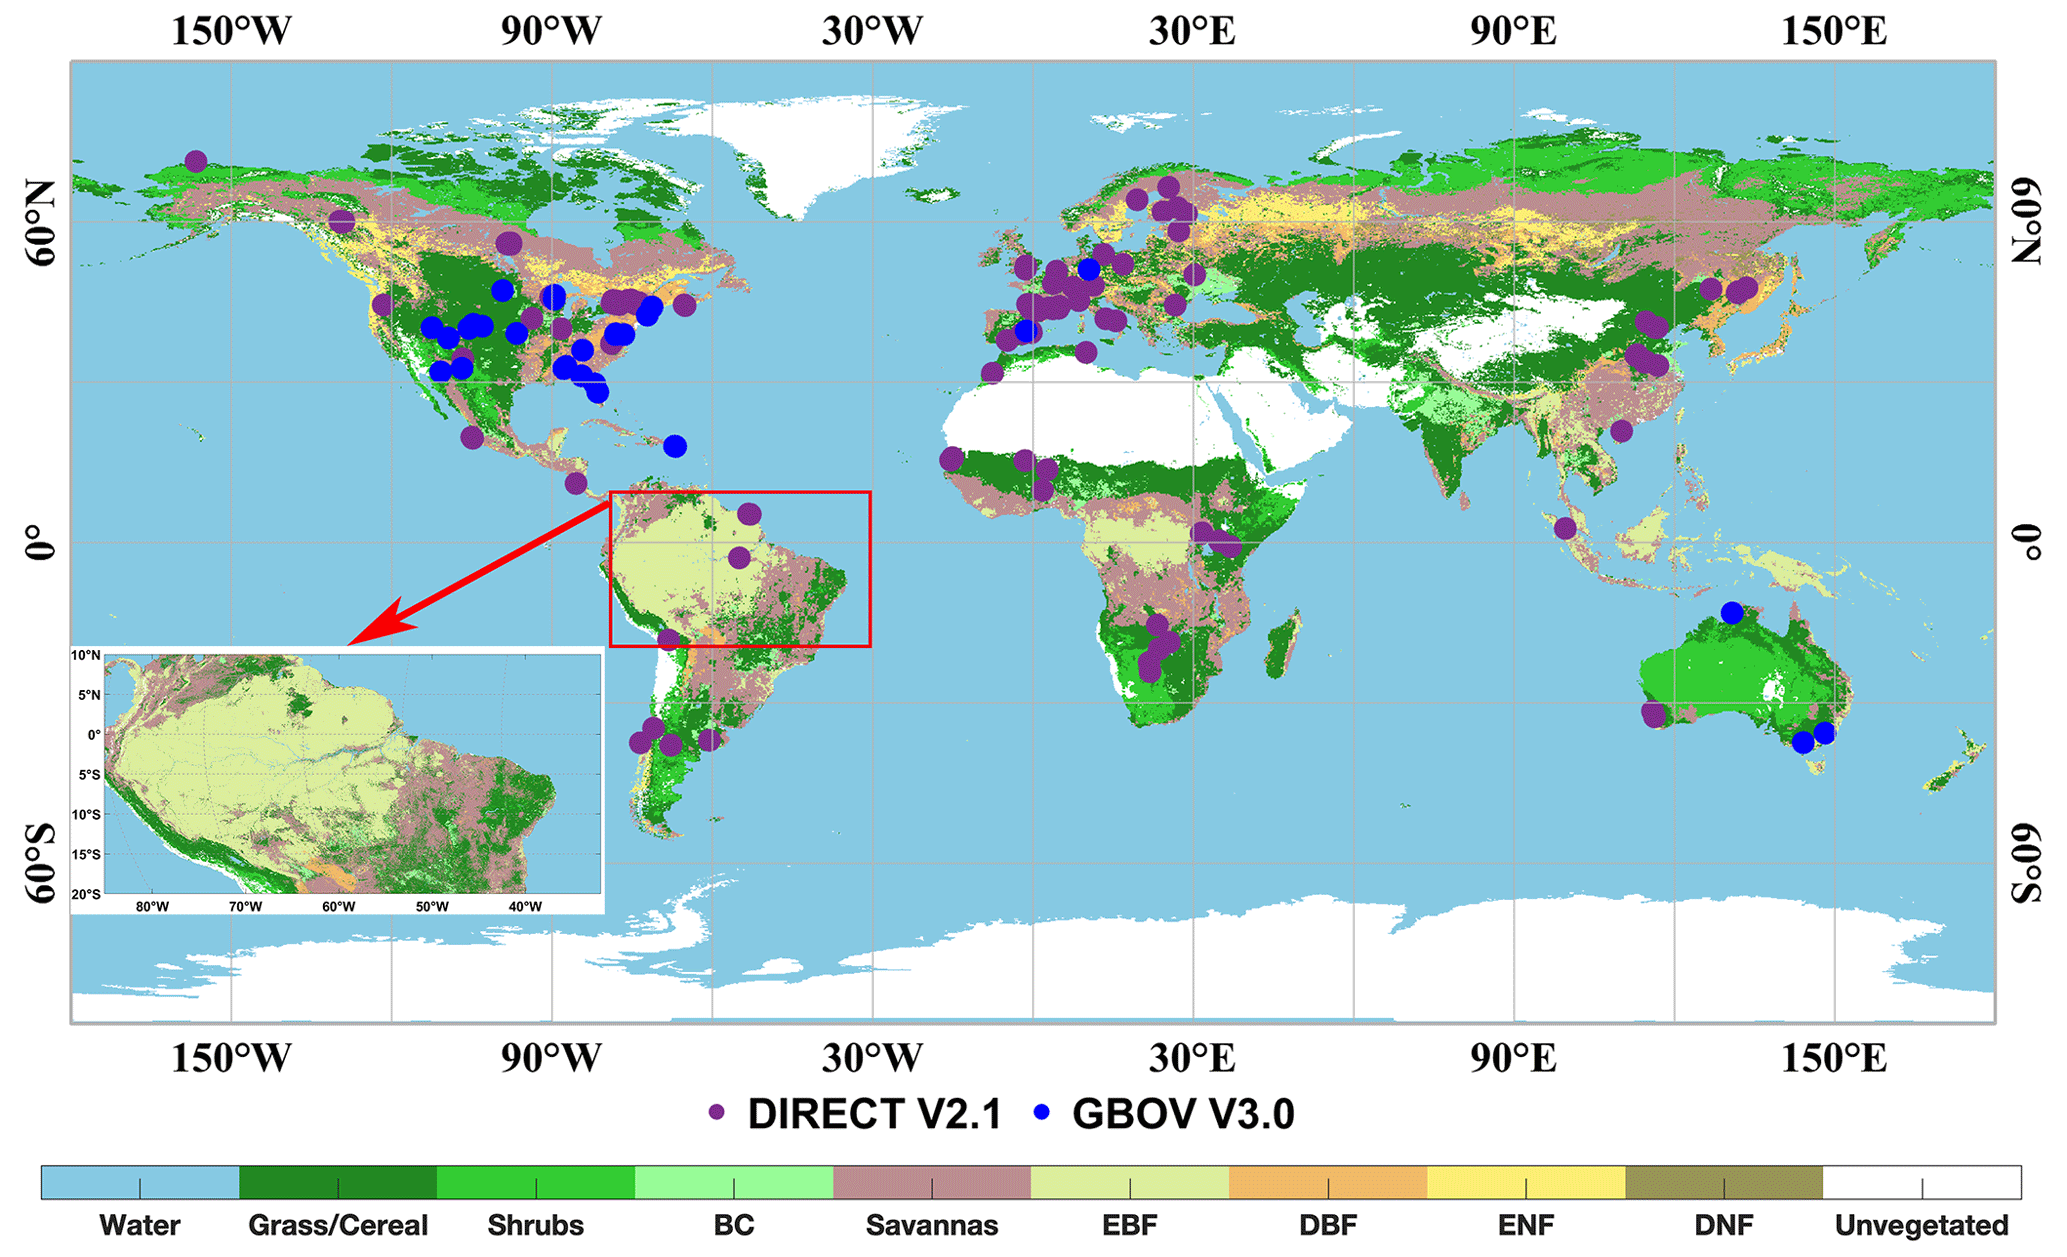
Figure 1Distribution of the selected GBOV and DIRECT sites. Amazonian forests used as a study area to assess various steps in developing LAI/FPAR CDR is shown as a red square. The background color indicates the biome types from the MCD12Q1 classification schemes of the year 2017 (grasses and cereal crops (biome 1), shrubs (biome 2), broadleaf crops (biome 3), savannas (biome 4), evergreen broadleaf forests (EBF; biome 5), deciduous broadleaf forests (DBF; biome 6), evergreen needleleaf forests (ENF; biome 7), and deciduous needleleaf forests (DNF; biome 8)). The blue and purple dots represent the GBOV3.0 and DIRECT2.1 sites.
2.5 Metrics for evaluating
In this study, we assessed the variability of SI LAI/FPAR CDR using two metrics: time series stability (TSS) (Weiss et al., 2007; Zou et al., 2022) and mean absolute error (MAE) (Zhou et al., 2015). Both metrics provide insight into the uncertainties associated with a dataset. TSS quantifies the deviation of a value at a given time (t0) from the linear interpolation line calculated from the preceding and succeeding time series data points (Eq. 1):
We analyzed three adjacent time series data points, X(t1), X(t0), and X(t−1), obtained at the following (t1), current (t0), and the previous (t−1) times, respectively. To ensure a fair comparison, we calculated the cumulative TSS based on the same length of time series. The TSS represents the deviation of a value at a given point in time from the linear interpolation line, and in this study, higher TSS values indicate greater variability over time.
The MAE metric is employed in this study to evaluate the accuracy of the retrieval methods by measuring the average absolute difference between the predicted and actual values. Following the approach proposed by Zhou et al. (2015), the MAE is calculated as the discrepancy between the reference and the retrieved series. (The process of generating the reference time series is discussed in Sect. 3.2.) We used the MAE as a metric to assess the similarity (Eq. 2):
Furthermore, performance analyses indicate that the retrievals from the main algorithm without clouds and aerosols provide the highest quality and accuracy (Pu et al., 2020). Therefore, we used a retrieval index (RI), which represents the percentage of pixels with high-quality retrievals (Xu et al., 2018; Yan et al., 2018, 2021a), as an indicator of the uncertainty of the LAI/FPAR retrievals (Eq. 3). This RI serves as an additional measure to assess the uncertainty associated with LAI/FPAR retrievals and is calculated as follows:
2.6 Calculation of LAI/FPAR trends
Trends in annual average SI LAI/FPAR CDR (2001–2022) are evaluated by the Mann–Kendall (MK) test. The MK test is a non-parametric statistical test commonly used for climate diagnostics and prediction. It enables the detection of monotonic trends in time series data, helping to determine if significant trends exist (Hamed and Rao, 1998). The MK test is employed as follows:
Equation (4) calculates the sum (S) of step function values, which represent the differences between values at different points (xj and xi) in the time series. The function sgn(x) takes the value 1 if its argument is a positive number, and −1 otherwise. The variables n and m denote the number of data points and the number of tied groups (recurring datasets), respectively. Next in Eq. (5), the variance (Var(S)) is calculated by assessing the magnitude of S to evaluate the statistical significance of the detected trends. Where the ti is the number of the ties (the number of repeats in the extent i). Finally, we calculated the test statistic Zs (Eq. 6). When , the null hypothesis (i.e., no trend) is rejected and the α is a special significance level. Here, we use the significance level of α=0.05 and the . Thus, the trends with P≤0.05 are considered to be statistically significant in this study.
Our methodology includes four key steps as shown in Fig. 2: (1) filtering low-quality observations based on QA values; (2) consolidating the filtered Terra/Aqua/VIIRS LAI/FPAR into filtered SI LAI/FPAR time series; (3) gap filling the missing values using a spatial–temporal tensor completion model; and (4) generating the SI LAI/FPAR CDR in different projections and spatial–temporal resolutions. The details are described in the following subsections.
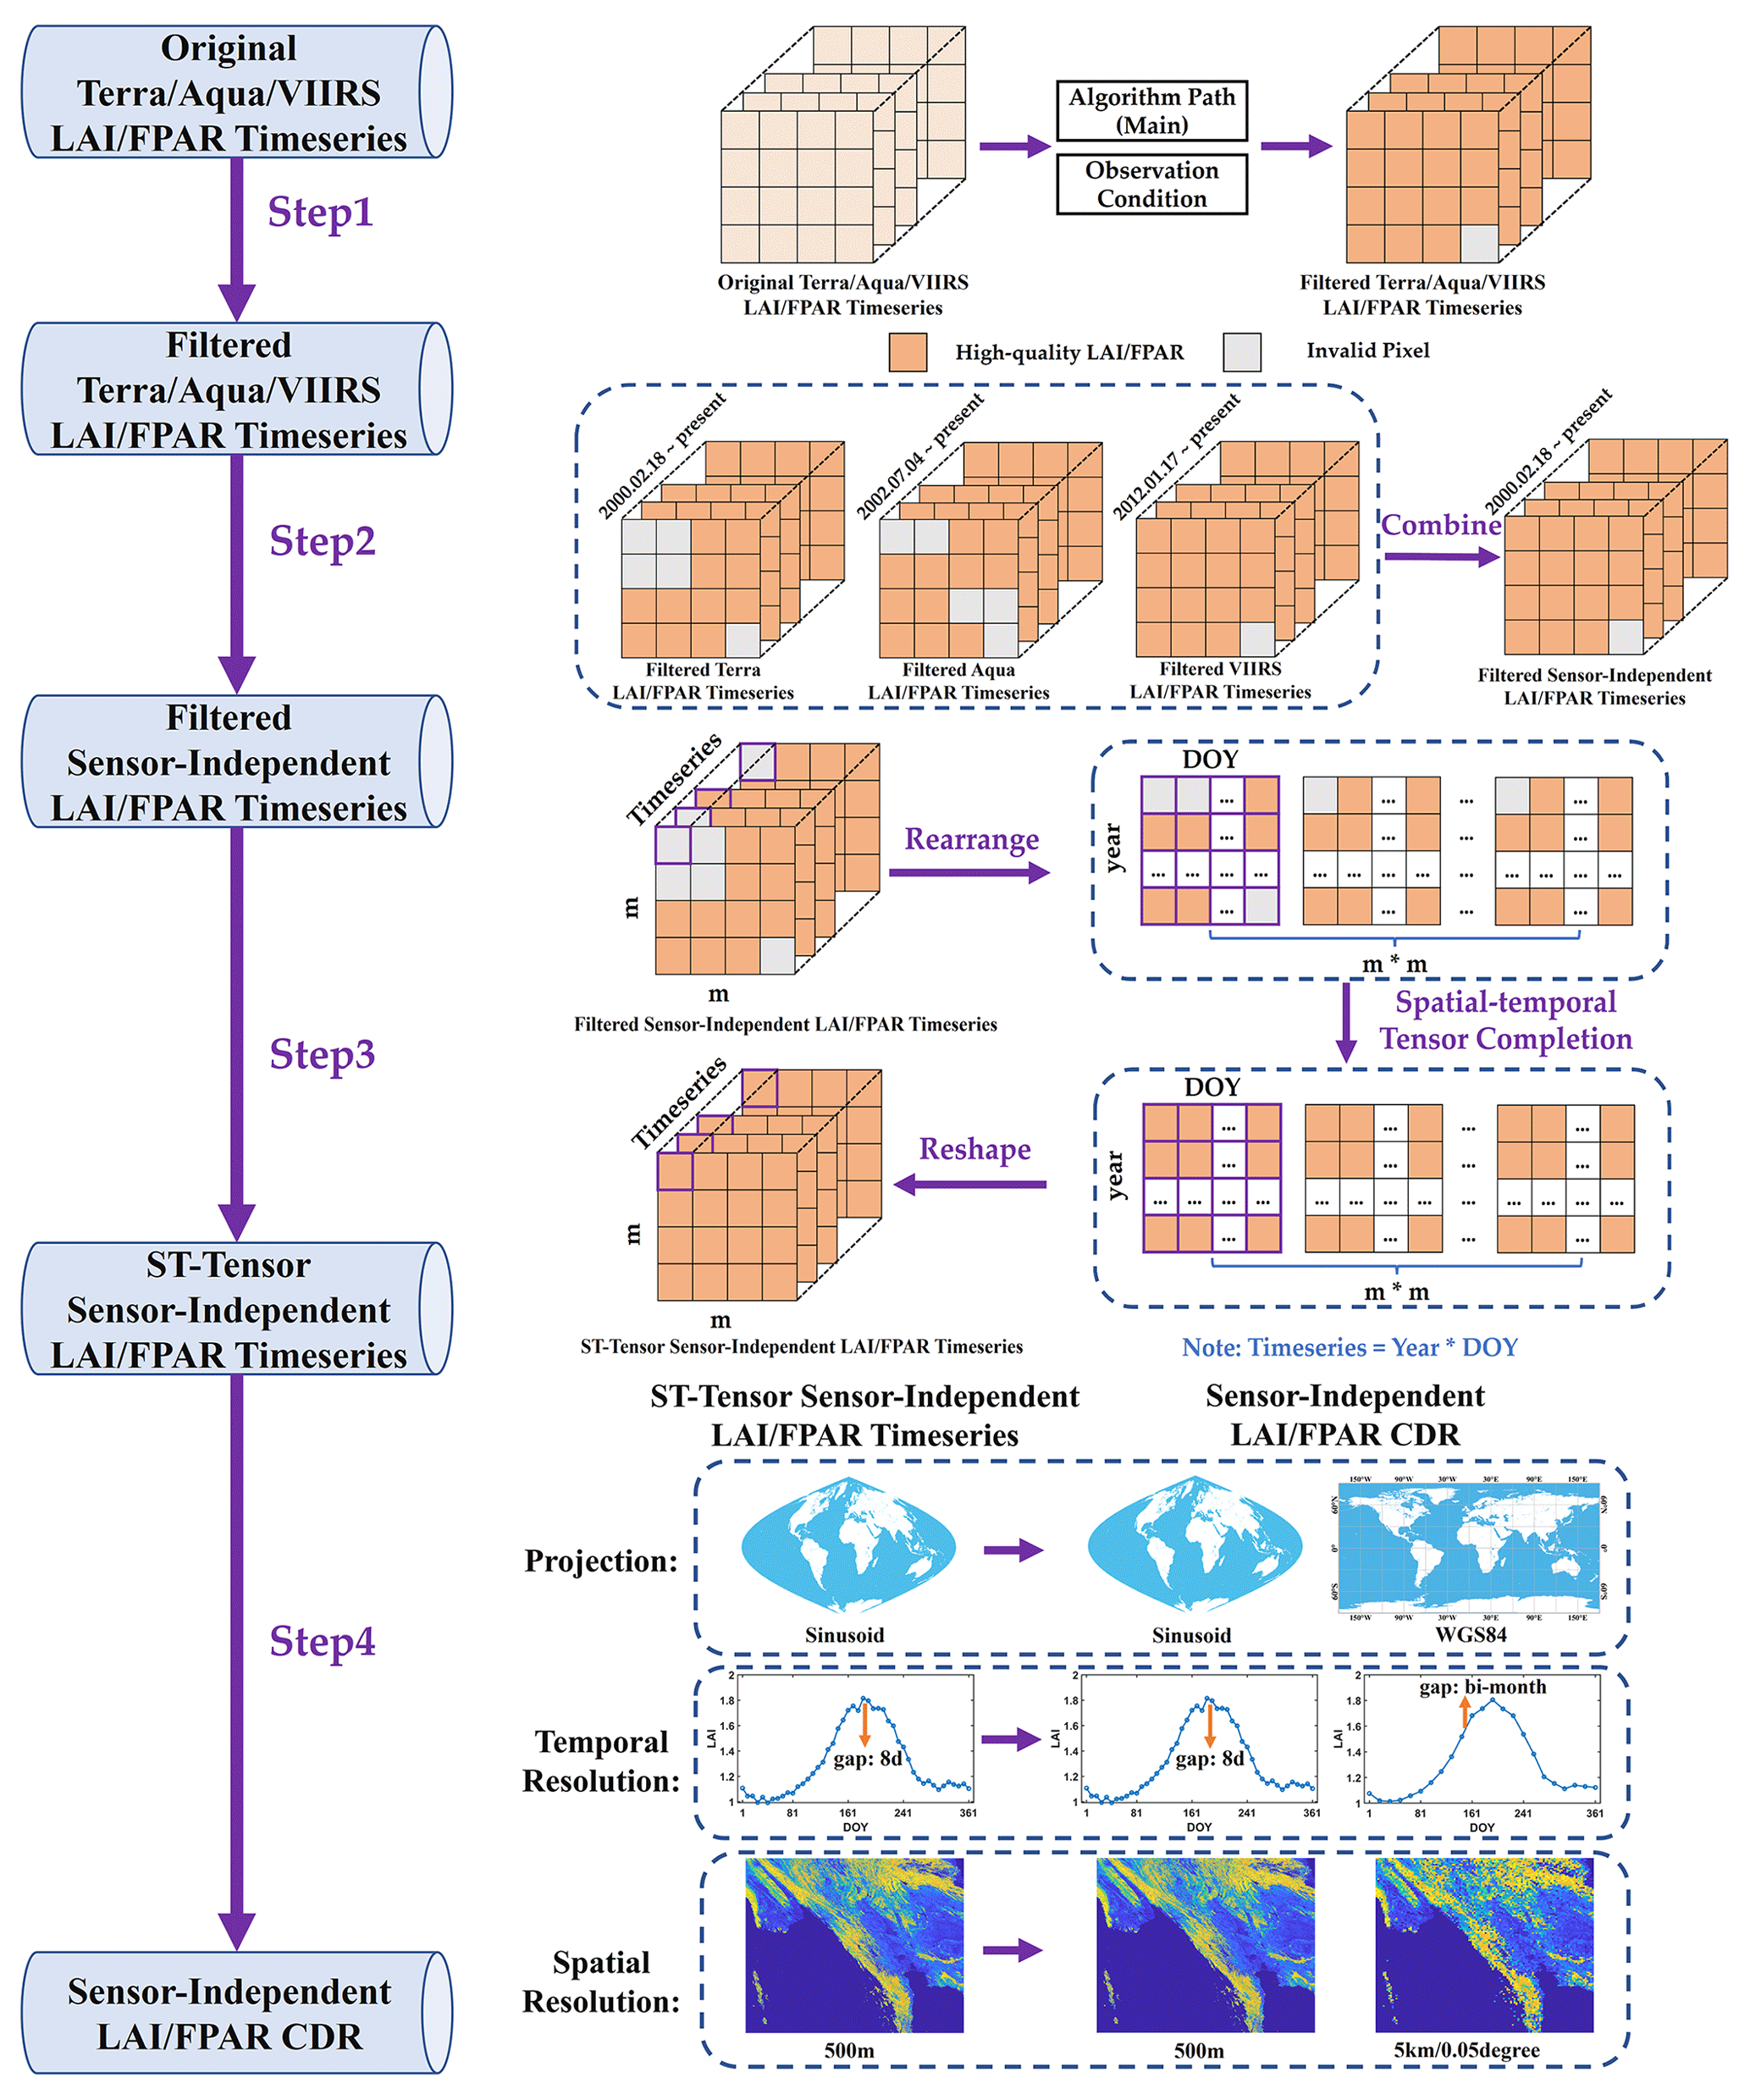
Figure 2Schematic flowchart of the generation of the SI LAI/FPAR CDR.
3.1 Step 1: filtering the low-quality observations based on QA values
The FparLai_QC and FparExtra_QC layers within the MODIS/VIIRS LAI/FPAR products provide information about the quality of LAI/FPAR, which include algorithm path, cloud and aerosol contaminations, and other factors that lower the reliability of retrievals. Best-quality, high-precision retrievals are obtained from the main algorithm. With a high probability the main algorithm fails in the case of cloud- and/or snow-contaminated pixels, or pixels with a high aerosol load (Yan et al., 2021a). As depicted in Table 1, the first step eliminates LAI/FPAR values retrieved by the backup algorithm as well as suspicious values from the main algorithm, which could be affected by clouds, aerosols, and cloud shadows. Note that the quality flags of the Terra-MODIS and Aqua-MODIS products are consistent, while VIIRS slightly differs from the two MODIS QA (e.g., the absence of MODLAND_QC for VIIRS). All three LAI/FPAR products have the same algorithm path and atmospheric conditions. After removing suspicious and low-quality values, we get a filtered Terra/Aqua/VIIRS LAI/FPAR dataset.
3.2 Step 2: consolidating the filtered Terra/Aqua/VIIRS LAI/FPAR into filtered SI LAI/FPAR time series
After completing the first step, we obtained three filtered LAI/FPAR time series of different spatial coverage. We consolidated the three time series into a filtered SI LAI/FPAR time series as follows: first, a fill value assigned to a pixel, if there are no high-quality LAI/FPARs from any sensor during the compositing period. Second, if there is only one pair of high-quality LAI and FPAR for the pixel, it is taken as the CDR value with the accompanying quality flag set to 1. Finally, if several high-quality retrievals are available for a given pixel during the compositing period, their average is the CDR value. The corresponding quality flag is set to 1 in this case. We generated a 23-year (2000–2022) time series of the filtered SI LAI/FPAR using this procedure. As Zhou et al. (2015) argued, this time series can be used as a reference to estimate an absolute reconstruction error. The reference LAI/FPAR map is shown in Figs. S1 and S2 in the Supplement.
3.3 Step 3: gap filling the missing values using a spatial–temporal tensor completion model
Our next step is gap filling, i.e., replacing fill values with estimates of LAI and FPAR. We used an ST-tensor completion model as our spatial–temporal gap filling method (Chu et al., 2021). This method is particularly well suited for correcting remote sensing images due to its ability to capture intrinsic multidimensional correlations. This technique has proven successful in many applications such as hyperspectral image recovery and reconstruction of missing data in remote sensing images (He et al., 2017; Zheng et al., 2019; Zhang et al., 2019; Chu et al., 2022, 2021). The ST-tensor completion model used in this study can be broken down into the following four steps:
-
Tensor rearrangement. The LAI/FPAR time series have three distinct features. First, they possess spatial neighborhood similarity based on the first law of geography (Goodchild, 2009). Second, they have temporal neighborhood correlation, assuming vegetation growth is continuous and smooth (Cong et al., 2012). Finally, they exhibit periodic temporal similarity because vegetation growth varies periodically (Whitt and Ulaby, 1994). While the original tensor form adequately captures spatial neighborhood similarity and temporal neighborhood correlation, it does not directly express periodic temporal similarity. Therefore, it is necessary to transform the original tensor into a new tensor that includes all three features. As shown in step 3 of Fig. 2, this study transforms the one-dimensional multiyear time series for each pixel into a two-dimensional matrix. In this matrix, each row represents a 1-year time series. At the same time, the two-dimensional spatial image is transformed into a one-dimensional vector. The following equation illustrates this transformation:
where X is the original tensor, Y is the transformed tensor, m denotes the spatial length of the original tensor, and T denotes the total number of observations in the entire time series, which is basically equal to the number of years (ny) multiplied by the number of observations in a year (nd).
-
Iteration updates the weight values and gap fills the missing values. The current third-order tensor can be decomposed into three matrices by three different modes. The tensor rank is defined in different ways and is mainly determined by the correlation and similarity of the elements in the different domains of the tensor. A smaller tensor rank indicates a higher similarity between the values of the tensor elements, which also implies that the missing values are filled consistently across all three dimensions, resulting in the best gap filling. The tensor rank can be defined by considering the three expansion matrices' rank order. Therefore, the data filling process in this study can be represented by the following equation, which aims to optimize problem solving:
where wn is the weight corresponding to Yn which is always non-negative and satisfies . In the process of solving Eq. (8), it is first necessary to iteratively determine the weight values. We initialize the weights of the three expansion matrices as equal () and then update them iteratively using the method based on singular value decomposition introduced by Chu et al. (2021). Once the weight values are obtained, Eq. (8) can be solved efficiently using the algorithm proposed by Ji et al. (2017). This algorithm uses a logarithmic operator, which better approximates the tensor rank than the classical kernel parameterization, leading to higher accuracy (Ji et al., 2018).
-
Iterate L1 trend filtering. After the ST-tensor completion process, although a gap-free LAI/FPAR time series can be obtained, some residual noise may still exist due to the uncertainties in flag data. Thus, we employ an iterative L1 trend filtering method, known for its flexibility in de-noising one-dimensional time series data by regularizing the residual and smoothing terms (Chu et al., 2021, 2022; Eilers, 2003). In this method, we denote the noisy time series as y and the fitted series as z. The objective of the L1 trend filtering method is to balance two conflicting objectives: (a) fidelity to the original series and (b) smoothness of the filtered series. This is achieved by optimizing the following objective function (Eq. 9):
where Dz represents the second-order difference matrix and λ is the regularization parameter that balances the fidelity and smoothness terms.
In practice, this method is well suited to preserving the detailed characteristics of turning points, thanks to the L1 parametric constraint. Furthermore, due to the completion of the ST-tensor process, the remaining noise can be assumed to have a negative bias. In our approach, data with flag = 0 is considered as noise, while flag = 1 is considered as almost noiseless. The iterative process is as follows: in the first and second iterations, the L1 trend filter is applied to smooth the LAI/FPAR time series, preserving the good data while replacing only the noisy values that fall below the smoothed series. Subsequent iterations then replace all the noise. By iteratively repeating this process, we achieve a good balance between noise reduction and the preservation of good data. At the end of the filtering step, the results are both gap- and noise-free.
-
Reshape the tensor. Following the reverse process of rearrangement in step 1), the filled and filtered LAI/FPAR tensor is returned to its original form.
3.4 Step 4: generating the SI LAI/FPAR CDR at different projections and spatial–temporal resolutions
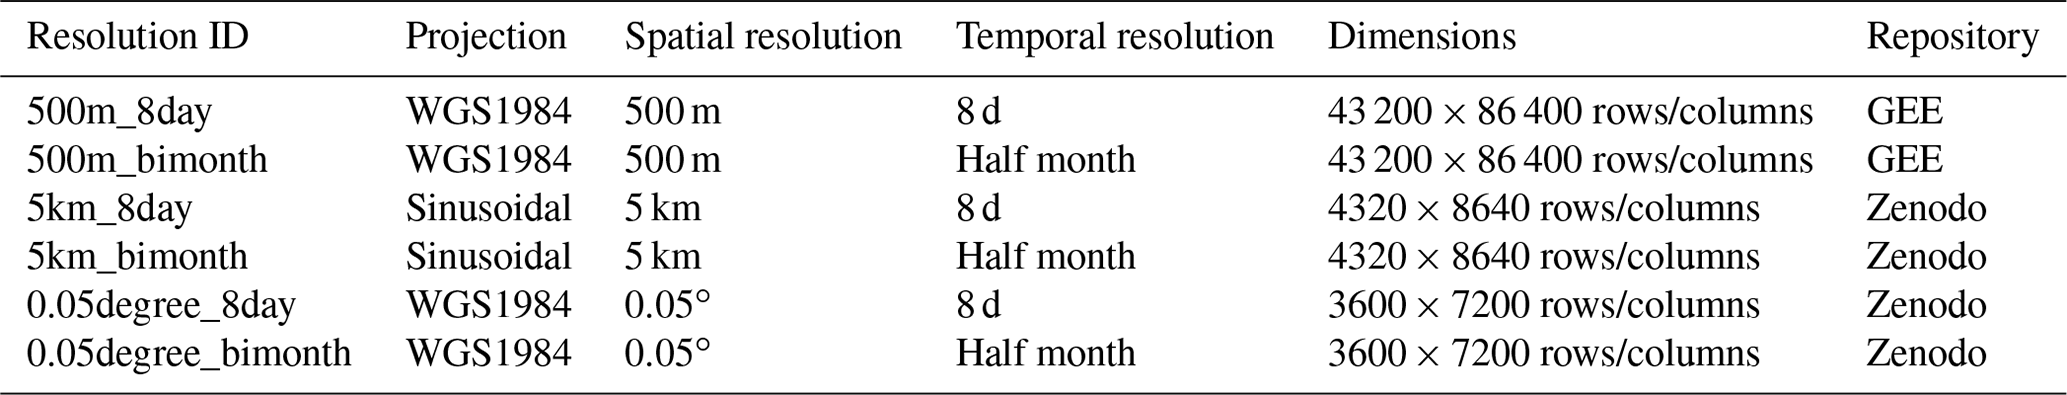
Our final step aims to generate CDRs at different spatial and temporal resolutions projected on WGS1984 and sinusoidal grids. First, we calculated the bimonthly LAI/FPAR using a weighted averaging method. The spatial resolution of the data was then adjusted to 5 km by nearest neighbor interpolation. Following this step, the projection was transformed from sinusoidal to WGS1984 and the data were further interpolated from a spatial resolution of 500 m down to 0.05∘ using the block average method. As a result of these transformations, we obtained six different versions of the SI LAI/FPAR CDR, as shown in Table 2. Finally, the SI LAI/FPAR CDR with 500 m spatial resolution were uploaded to Google Earth Engine (GEE) for users to mix and match with other datasets, and due to the ease of using this in GEE, all datasets were reprojected to WGS1984 using the gdalwarp function with a crs of EPSG:4326 for ease of ingestion. The other four versions of SI LAI/FPAR CDR can be found on Zenodo (detailed in the section “Data availability”).
Table 2Projections and spatial/temporal resolutions of SI LAI/FPAR CDR.
4.1 Evaluation for the generating steps of SI LAI/FPAR CDR over the Amazon forest
The assessment of vegetation dynamics in the Amazon rainforest, including seasonal changes, is challenging due to persistent cloud cover that interferes with optical remote sensing observations. Therefore, during the evaluation process of the SI LAI/FPAR CDR, each step was assessed using the Amazon forest region (Fig. 2) as a representative study area. In the first step, considering the significant presence of EBF (50.26 %) in the Amazon forest region, this part compares the LAI/FPAR time series from Terra/Aqua/VIIRS before and after filtering the low-quality observations. There is a negative correlation between the RI and the contrast in LAI/FPAR values before and after filtering, which can be explained by significant differences in the quality of retrievals produced by the main and backup algorithms. This filtering process has reduced the magnitude of the LAI variation, leaving their values in the range of 5–6 (Fig. 3), as expected (Samanta et al., 2012a, b). Filtered FPAR values vary around its interannual average of 0.85 (Fig. S3). Furthermore, we observed a consistent intra-annual variation in LAI/FPAR, indicating a clear seasonal dynamic in the EBF.
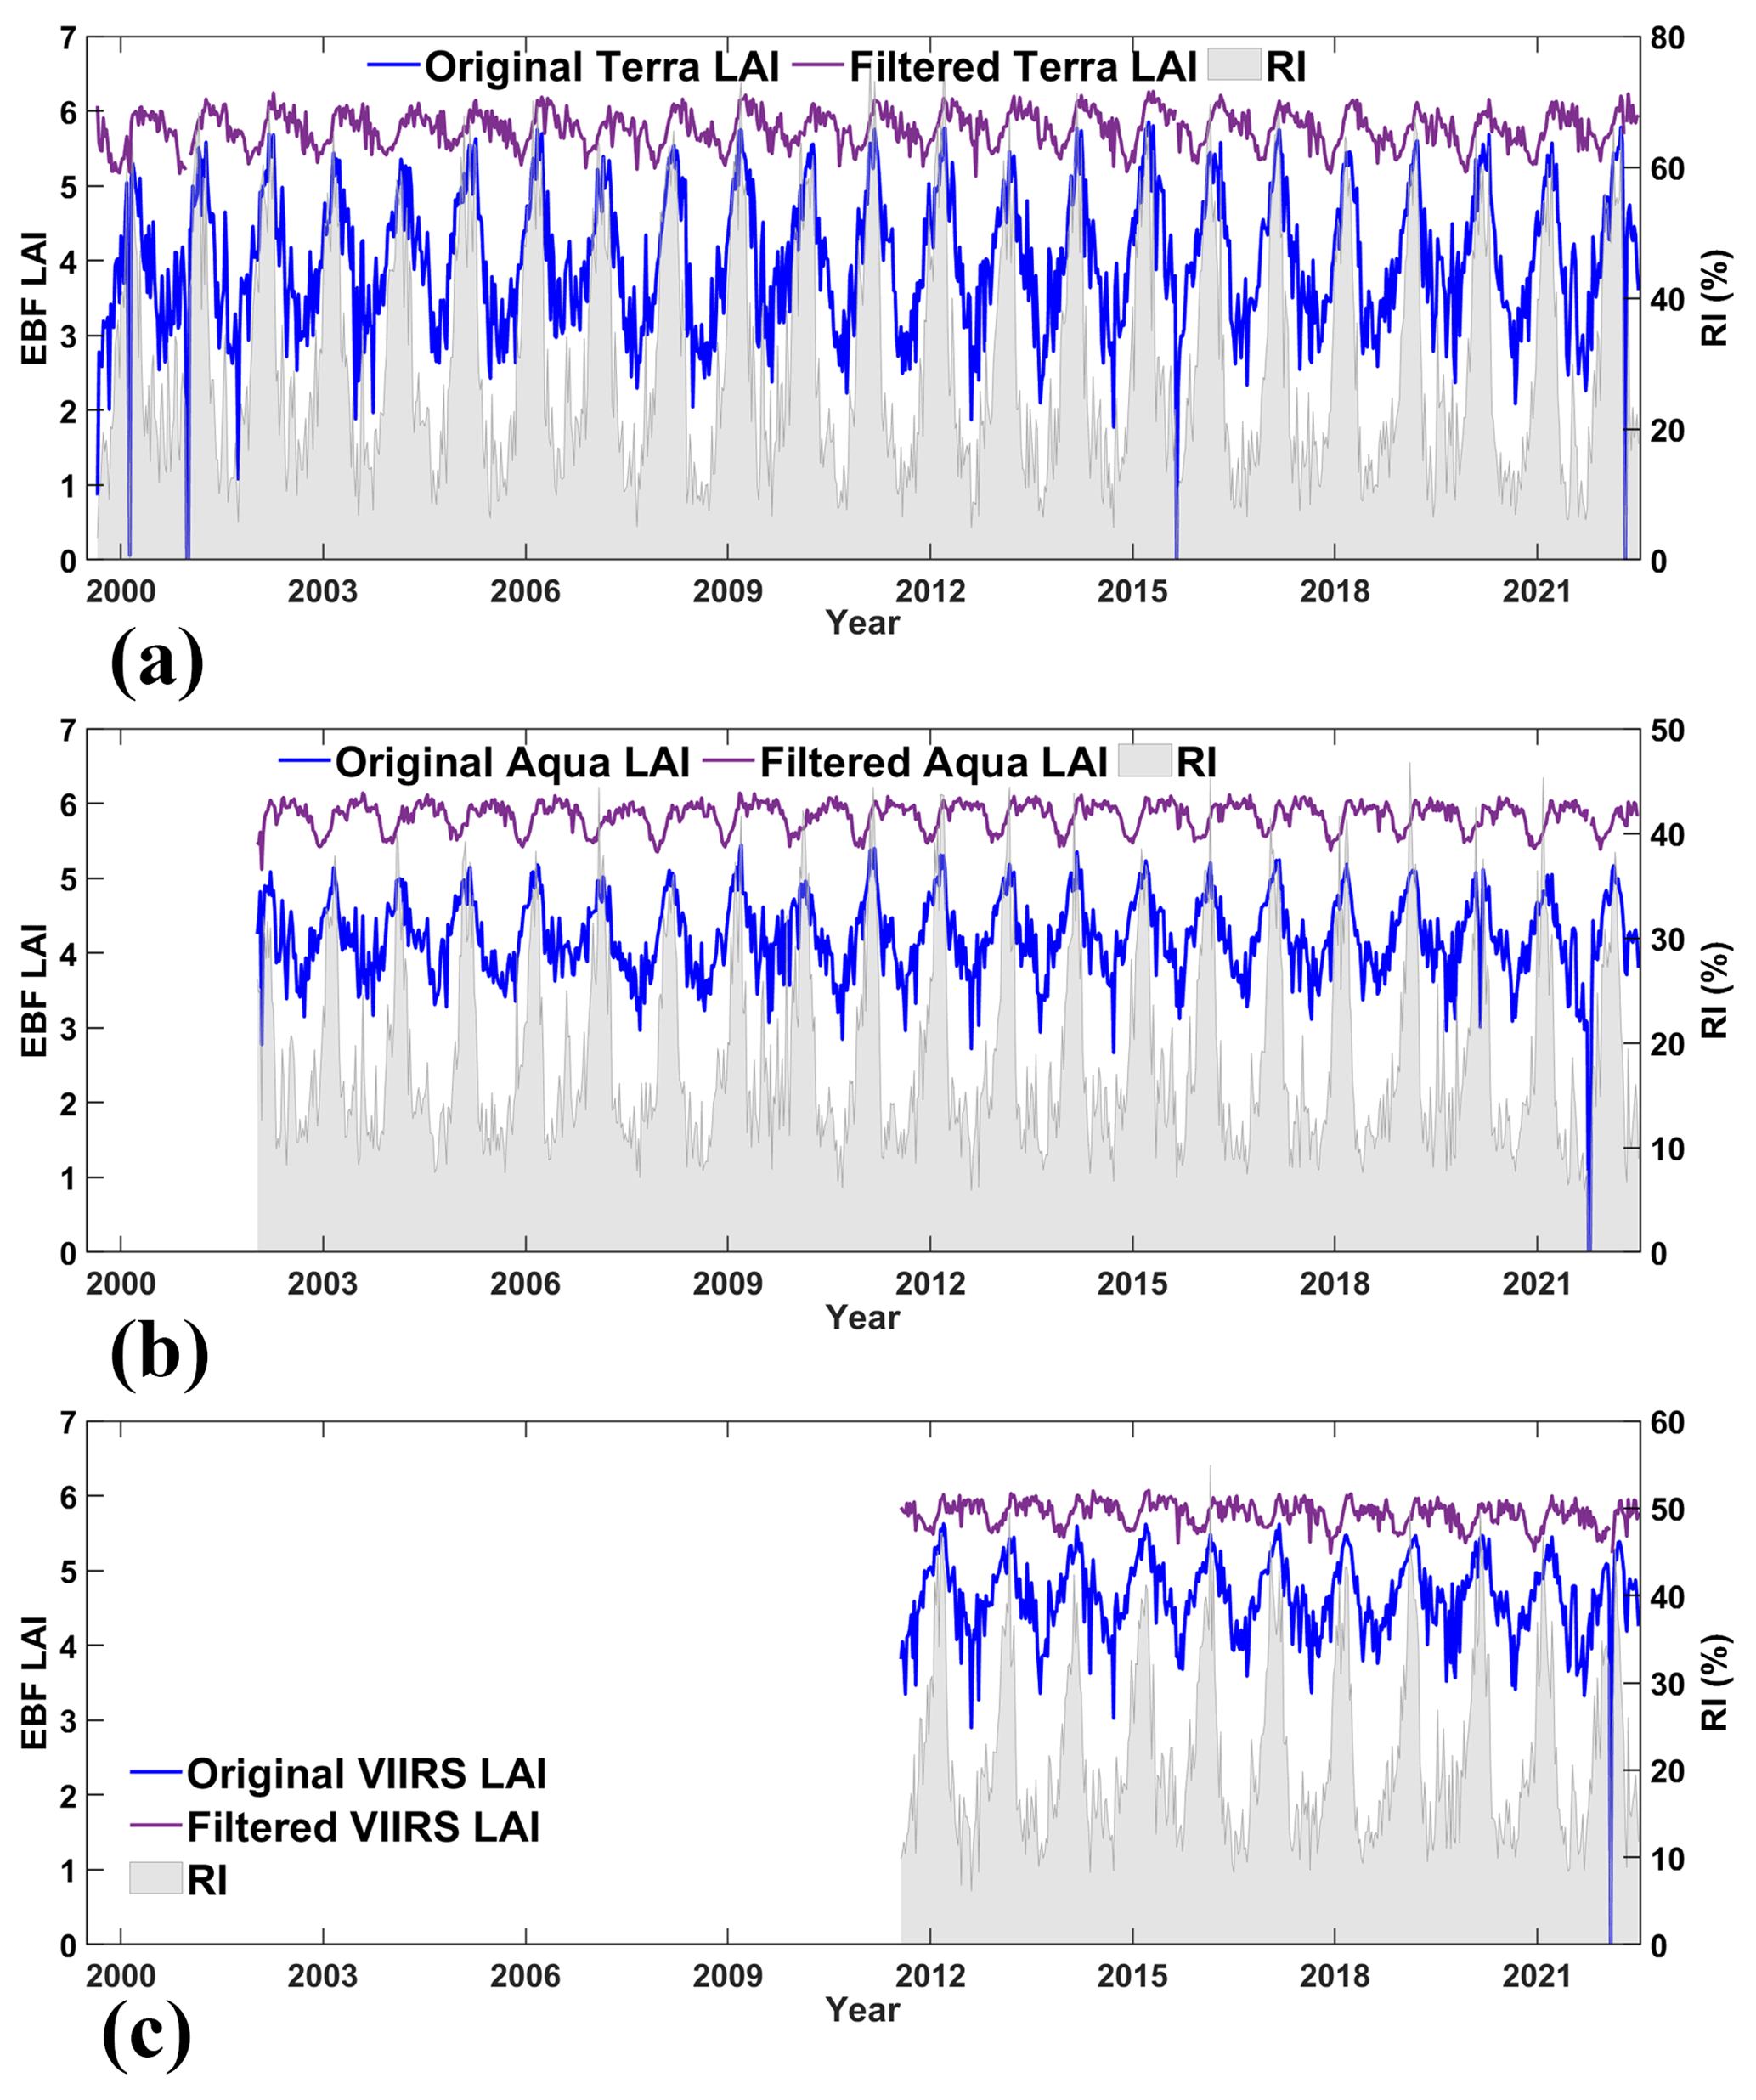
Figure 3The temporal comparisons between the original Terra/Aqua/VIIRS LAI and filtered Terra/Aqua/VIIRS LAI for the EBF of the Amazon forest region. Panels (a)–(c) represent Terra/Aqua/VIIRS, respectively. The blue and purple lines indicate original and filtered LAI (left y axis), and the shadow indicates the RI (right y axis). The RI is negatively correlated with the difference between the original and filtered values, suggesting that this procedure reduces the impact of poor-quality retrievals on the time series.
Figure 4 illustrates percentages of high-quality retrievals from single sensors and after step 2 for selected Amazon forest region (inset in Fig. 1) for the 2013–2022 overlap period. Table 3 summarizes the changes after the implementation of step 2 for the whole and overlap periods. For the overlap period the percentages increase from 41.09 % (Terra), 29.55 % (Aqua), and 30.90 % (VIIRS) to 58.50 % in filtered SI time series. If the time interval is extended to the whole dataset record period (2000–2022), the percentages increase from 41.68 %, 26.73 %, and 14.85 % to 54.07 %. Consequently, the percentage of pixels that need to be gap filled reaches 45.93 %. Table 3 also shows a low frequency of high-quality retrievals available simultaneously from all sensors: 12.45 % for the overlap period and 6.02 % for the entire acquisition period. Furthermore, Fig. 4 also illustrates that the percentage varies with biome type: it takes values of 46.30 % for EBF (northwest region) and 67.51 % for savannas (southeast region). Figure 5 highlights the discontinuity of the spatial–temporal distribution of the quality flag generated by the data consolidation algorithm (Sect. 3.2). For example, the RI for DOY 001 in 2014 (rain season) is 52.66 %, while for DOY 193 in 2014 (dry season) it is 76.63 %. This lack of a clear pattern in the spatial–temporal distribution of the pixels to be gap filled places significant demands on the subsequent filling process.
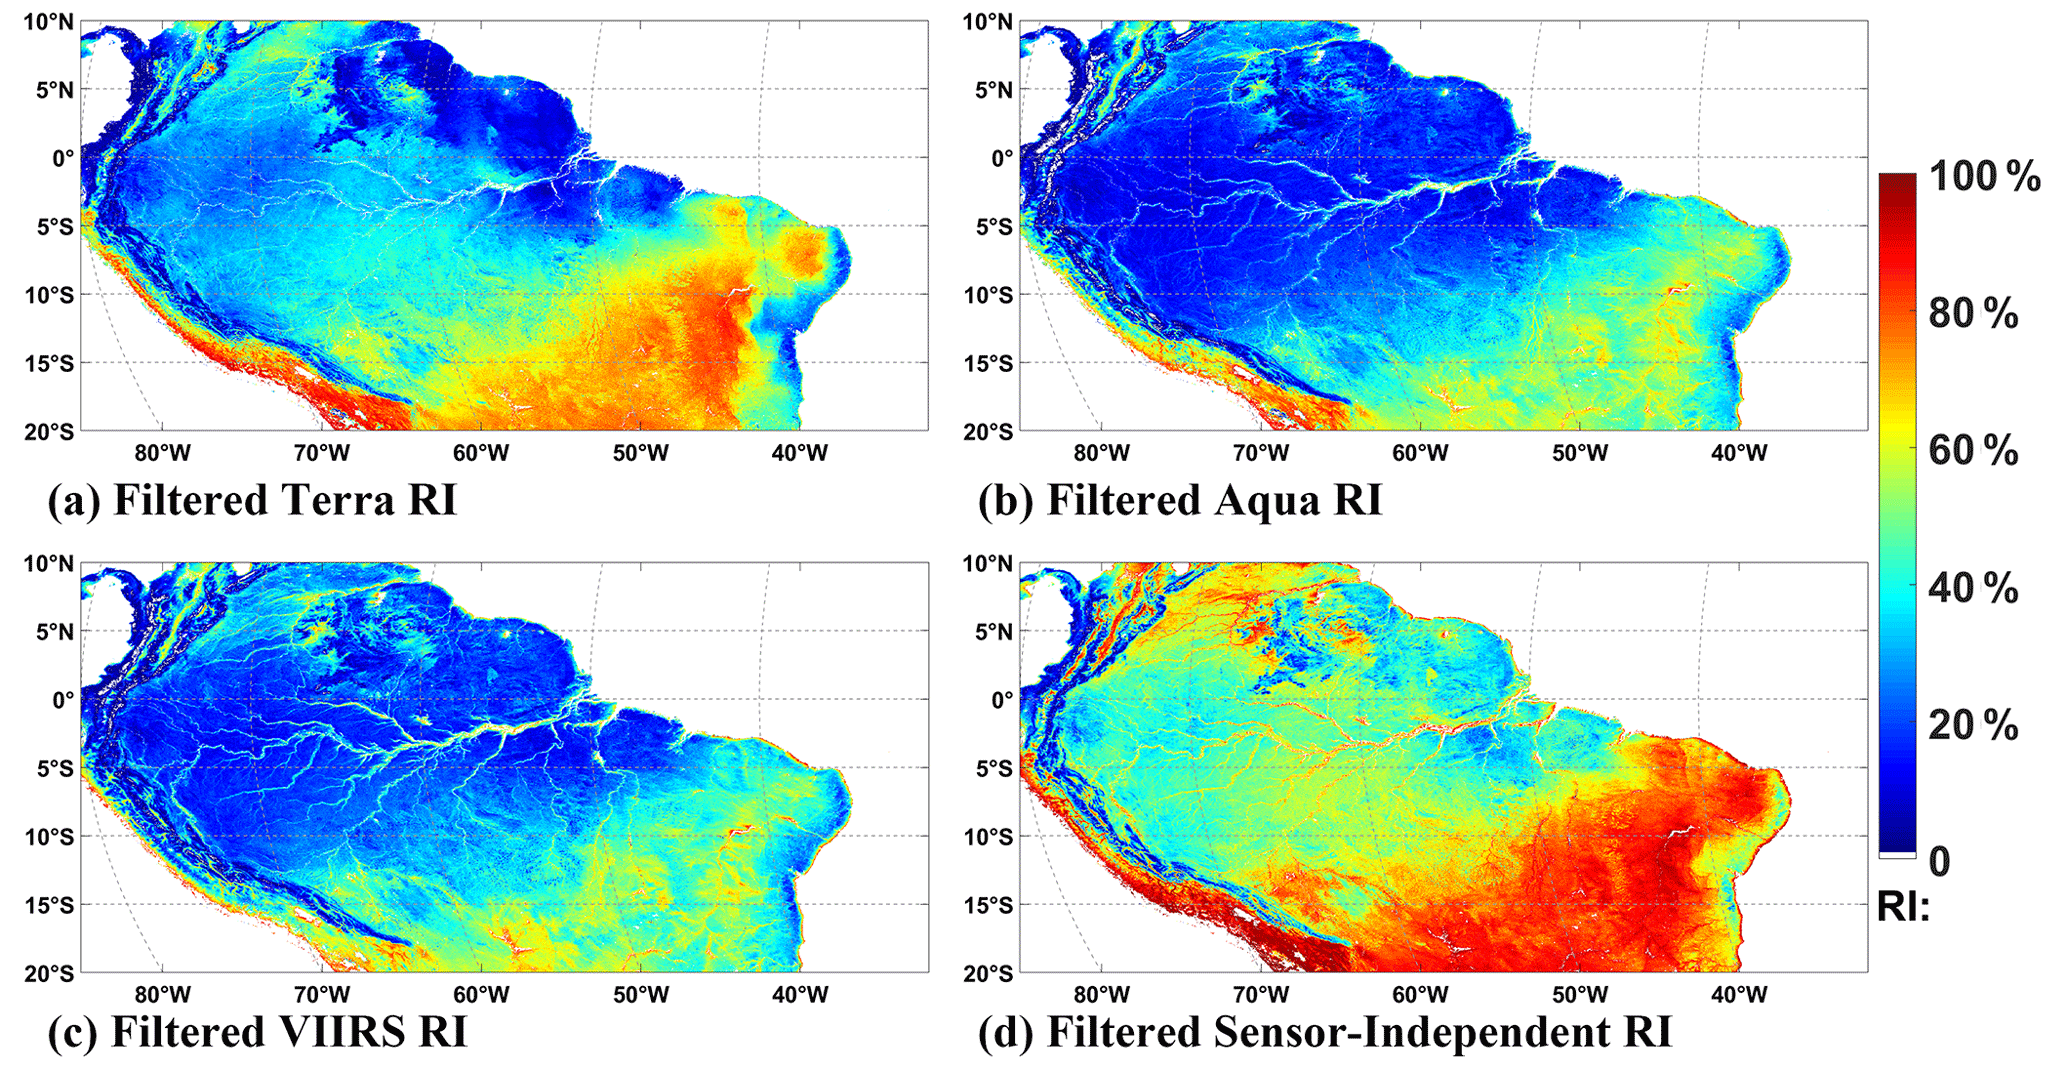
Figure 4The spatial distribution of filtered Terra (a), Aqua (b), VIIRS (c), and SI (d) RI in the selected Amazon forest region (inset in Fig. 1) in the overlap period (2013–2022).
Table 3Percentage of pixels with high-quality retrievals from single sensors and their combinations for the whole (2000–2022) and overlap (2013–2022) periods. Each row sums to 100 %.

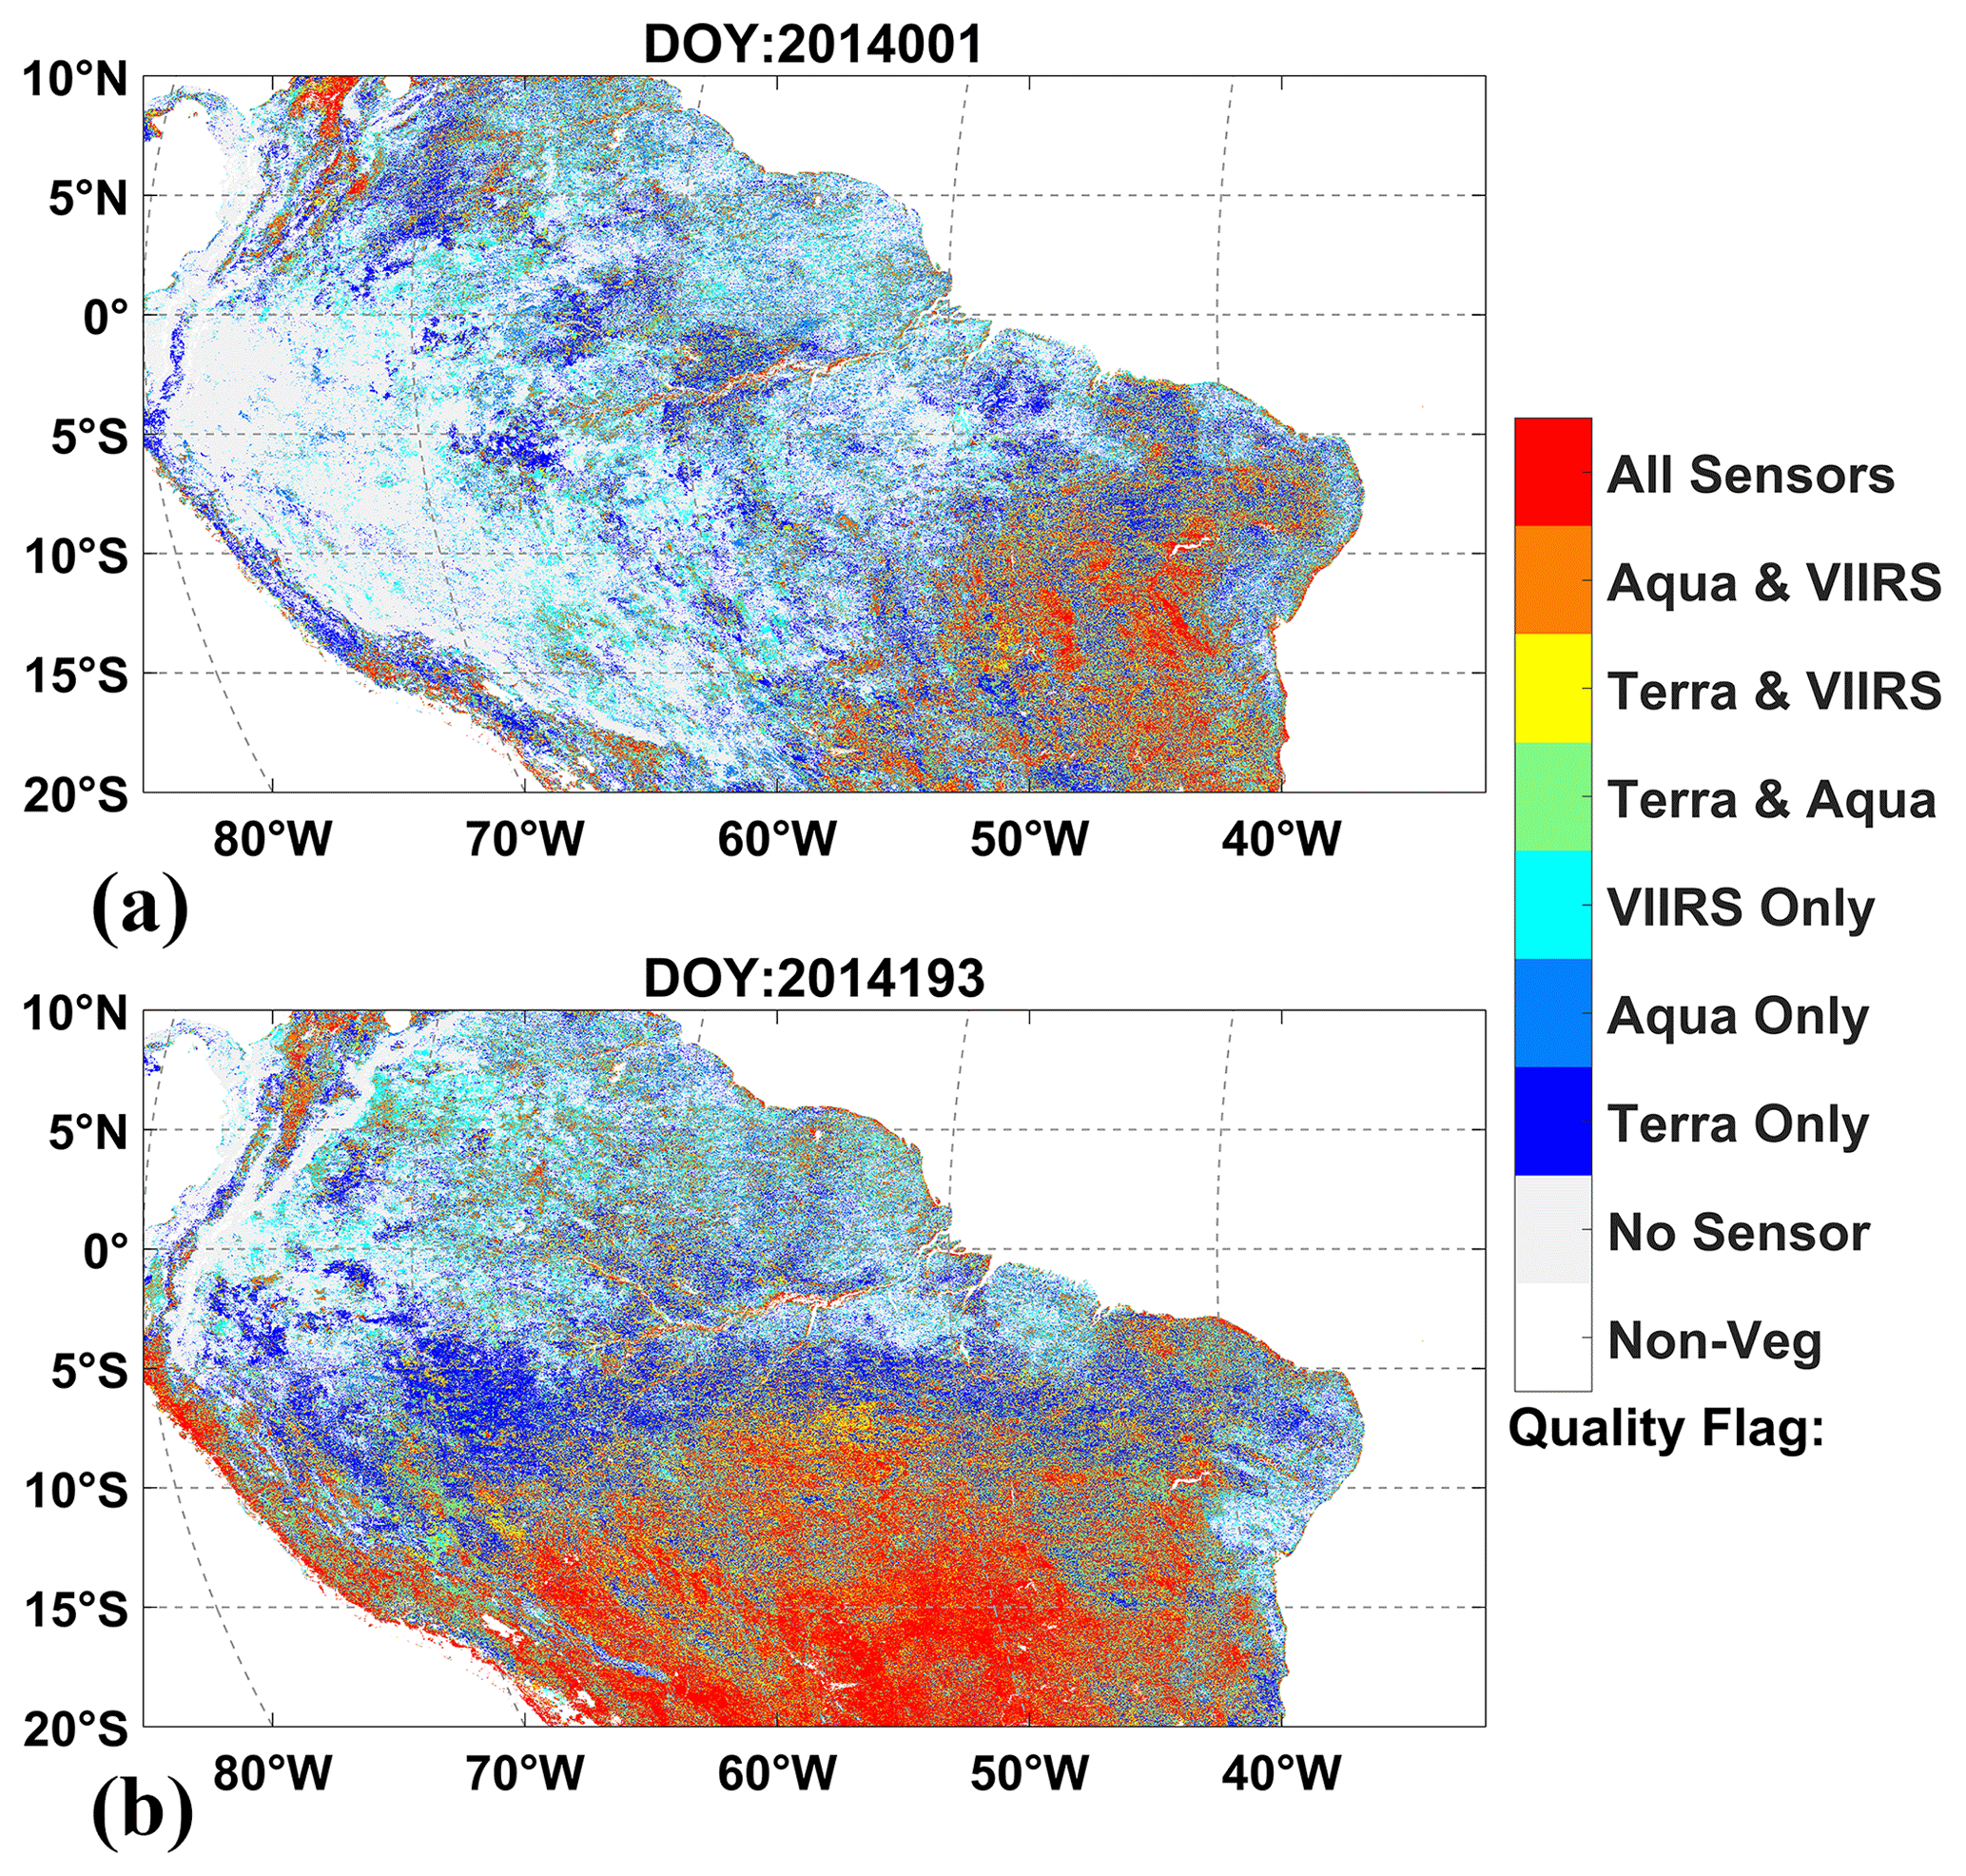
Figure 5Spatial distribution of the quality flag of the data consolidation algorithm (see Sect. 3.2). Panels (a) and (b) represent DOYs 1 and 193. A flag value of 0 is gray coded, while other colors correspond to the quality flag = 1 for various combinations of the sensors. The color corresponding to flag = 0 represents the No-Sensor category, while the other colors represent flag = 1. “Non-Veg” means this pixel is “Non-vegetated land”. “No Sensor” means there is no high-quality LAI/FPAR in this pixel. “Terra Only”, “Aqua Only”, and “VIIRS Only” means there is only one high-quality LAI/FPAR from Terra/Aqua/VIIRS. “Terra & Aqua” means there are high-quality LAIs/FPARs from Terra and Aqua, same meaning for “Terra & VIIRS” and “Aqua & VIIRS”. All sensors means there are 3 high-quality LAIs/FAPRs from 3 sensors.
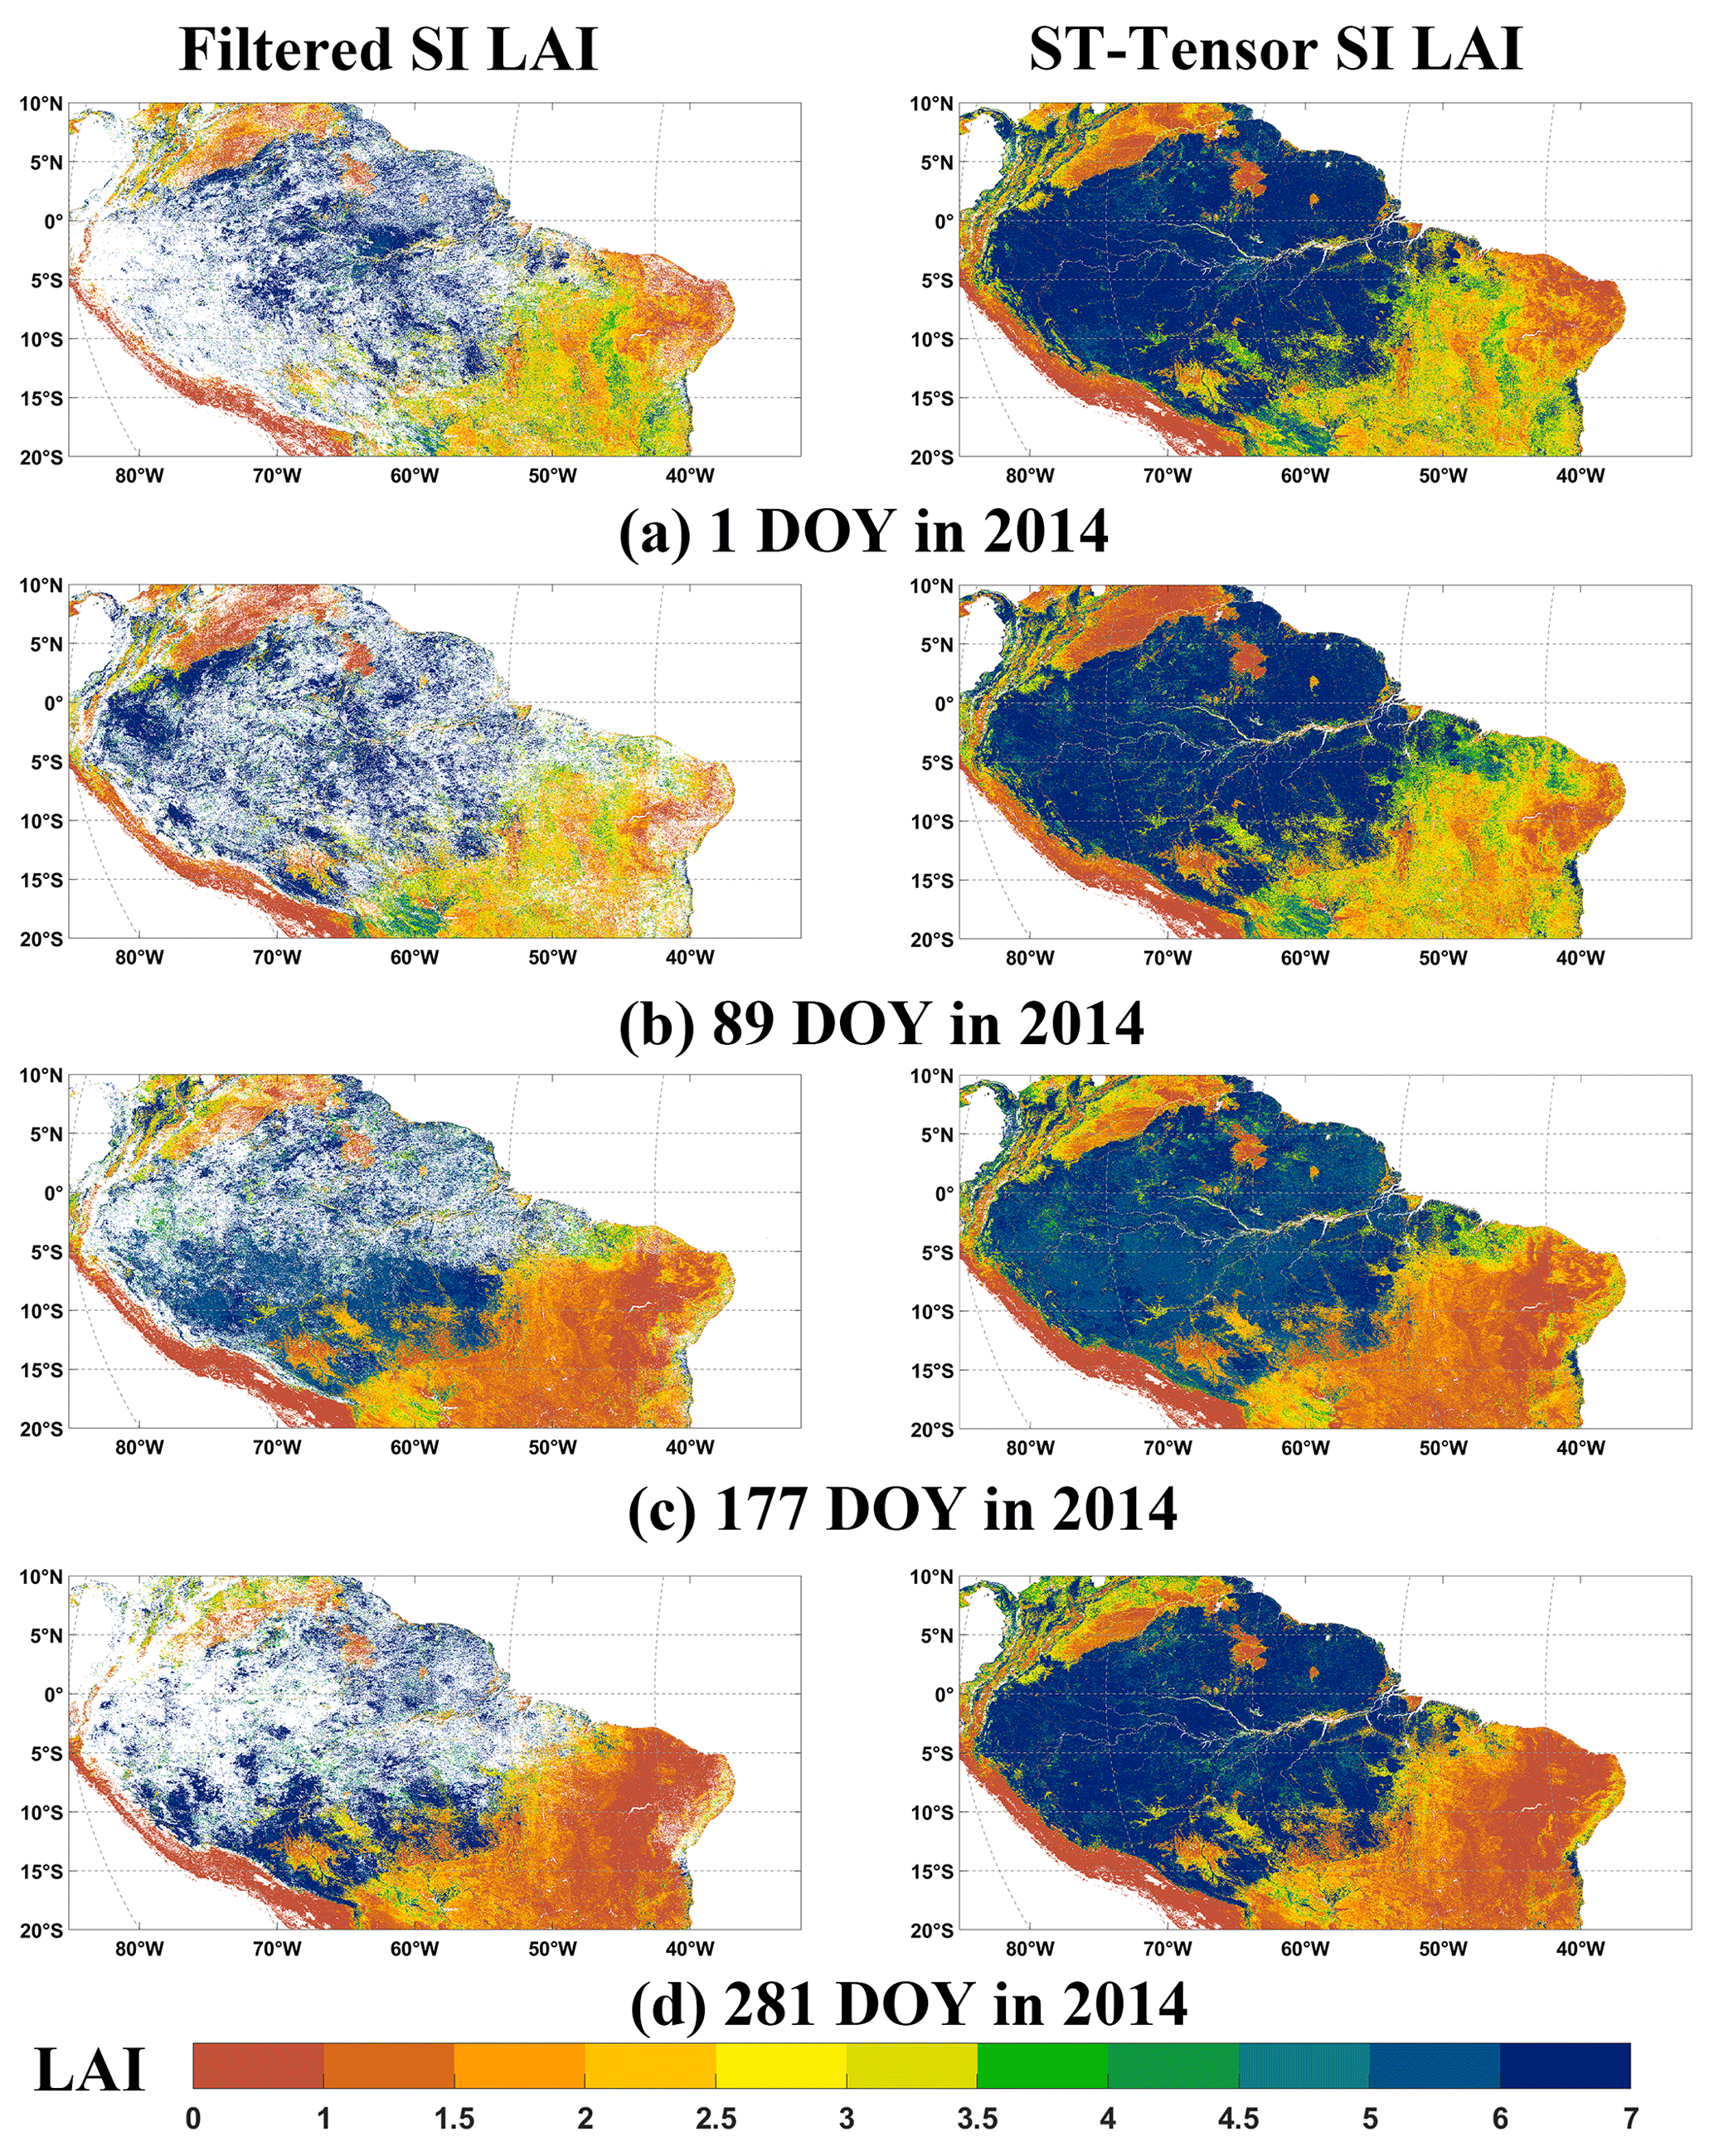
Figure 6The spatial performance of the ST-tensor method for DOY 1 (a), 89 (b), 177 (c), and 281 (d) in 2014 in the Amazon forest region. The left panels and right panels represent the filtered SI LAI and ST-tensor ST LAI, respectively.
In step 3, we replaced fill values with LAI/FPAR estimates produced by the ST-tensor completion model. The goal of this section is to assess the performance of this technique in terms of whether the recovered pixels are spatially–temporally reasonable. First, Figs. 6 and S4 provide compelling visual evidence of the excellent performance achieved by the ST-tensor completion model. In the spatial domain, it is significant that the LAI/FPAR values obtained after gap filling exhibit a high concordance with the original high-quality SI LAI/FPAR values of the nearest neighboring pixels. This underscores the model's ability to preserve spatial consistency. Meanwhile, in the temporal domain, the gap filling LAI/FPAR exhibits highly correlated seasonal variation with biome type at the pixel scale. Furthermore, the improved stability of the LAI/FPAR time series is a notable evidence of this process. In summary, these results collectively emphasize the substantial enhancement in the quality of LAI/FPAR data following the application of the ST-tensor completion model, both in terms of spatial fidelity and temporal coherence.
4.2 Intercomparison at the global scale
Here we evaluate the SI LAI/FPAR CDR as well as the LAI/FPAR derived from the original Terra/Aqua/VIIRS data using the TSS and MAE metrics. The results suggest significant improvements in the SI LAI/FPAR CDR compared with the original Terra/Aqua/VIIRS LAI/FPAR datasets. As shown in Figs. 7–8 and S5–S6, SI LAI/FPAR CDR (8 d temporal resolution, 0.05∘ spatial resolution, and WGS84 projection) have a higher number of “blue” pixels and lower number of “red” pixels, indicating lower TSS and MAE values. Specifically, the TSS (Fig. 7) of SI LAI CDR (65.06) is much lower than original Terra LAI (168.25), original Aqua LAI (172.50), and original VIIRS LAI (167.35). Similarly, the TSS (Fig. S5) of SI FPAR CDR (12.67) is the lowest compared with the original Terra FPAR (39.68), original Aqua FPAR (41.18), and original VIIRS FPAR (37.94). These values indicate that the SI LAI/FPAR CDR has reduced volatility and noise compared with the original versions. The MAE (Fig. 8) shows a similar trend as TSS, with the MAE decreasing from 0.80 (original Terra LAI), 0.79 (original Aqua LAI), and 0.75 (original VIIRS LAI) to 0.39 (SI LAI CDR). Furthermore, the MAE decreases from 0.16 for the original Terra FPAR, 0.17 for the original Aqua FPAR, and 0.16 for original VIIRS FPAR to 0.10 for SI FPAR CDR (Fig. S6). This suggests that the SI LAI/FPAR CDR is more closely related to a high-quality LAI/FPAR reference than the original Terra/Aqua/VIIRS LAI/FPAR. In addition, the variation of TSS/MAE with latitude confirms these improvements, as the SI LAI/FPAR CDR shows smaller mean values and standard deviation of TSS/MAE compared with the original Terra/Aqua/VIIRS LAI/FPAR.
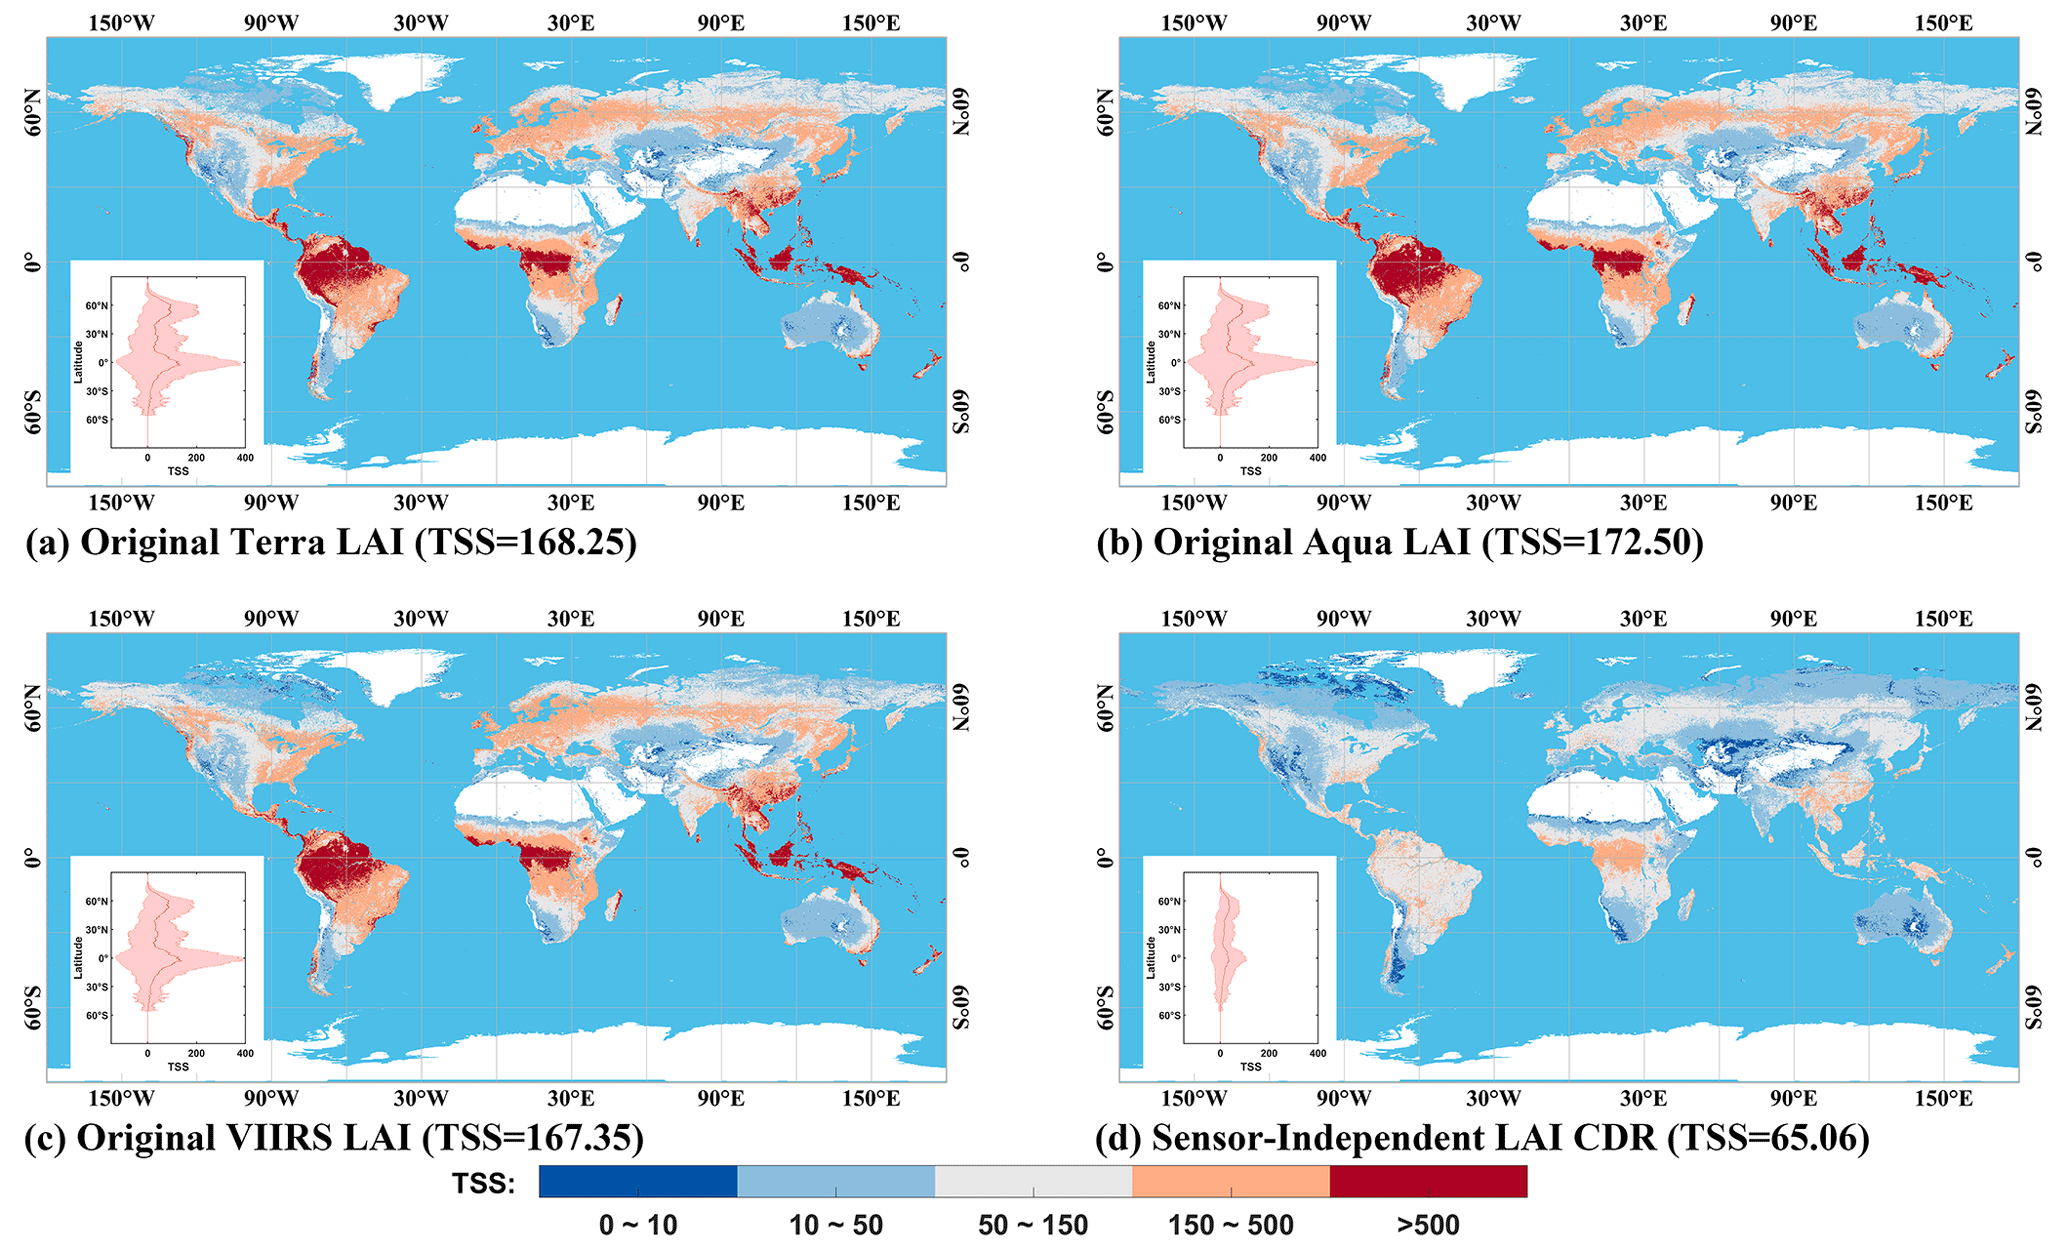
Figure 7The global distribution of LAI TSS in each grid from 2013 to 2022. Panels (a)–(c) display the TSS of the original Terra/Aqua/VIIRS LAI, respectively, and (d) shows the TSS of SI LAI CDR. A WGS1984 projection is used here and the temporal resolution is 8 d. Panels (b) and (d) represent latitudinal transects (0.05∘ interval) of TSS values for LAI. Red lines and shading represent the mean values and standard deviations of LAI TSS of the 0.05∘ latitude zone.
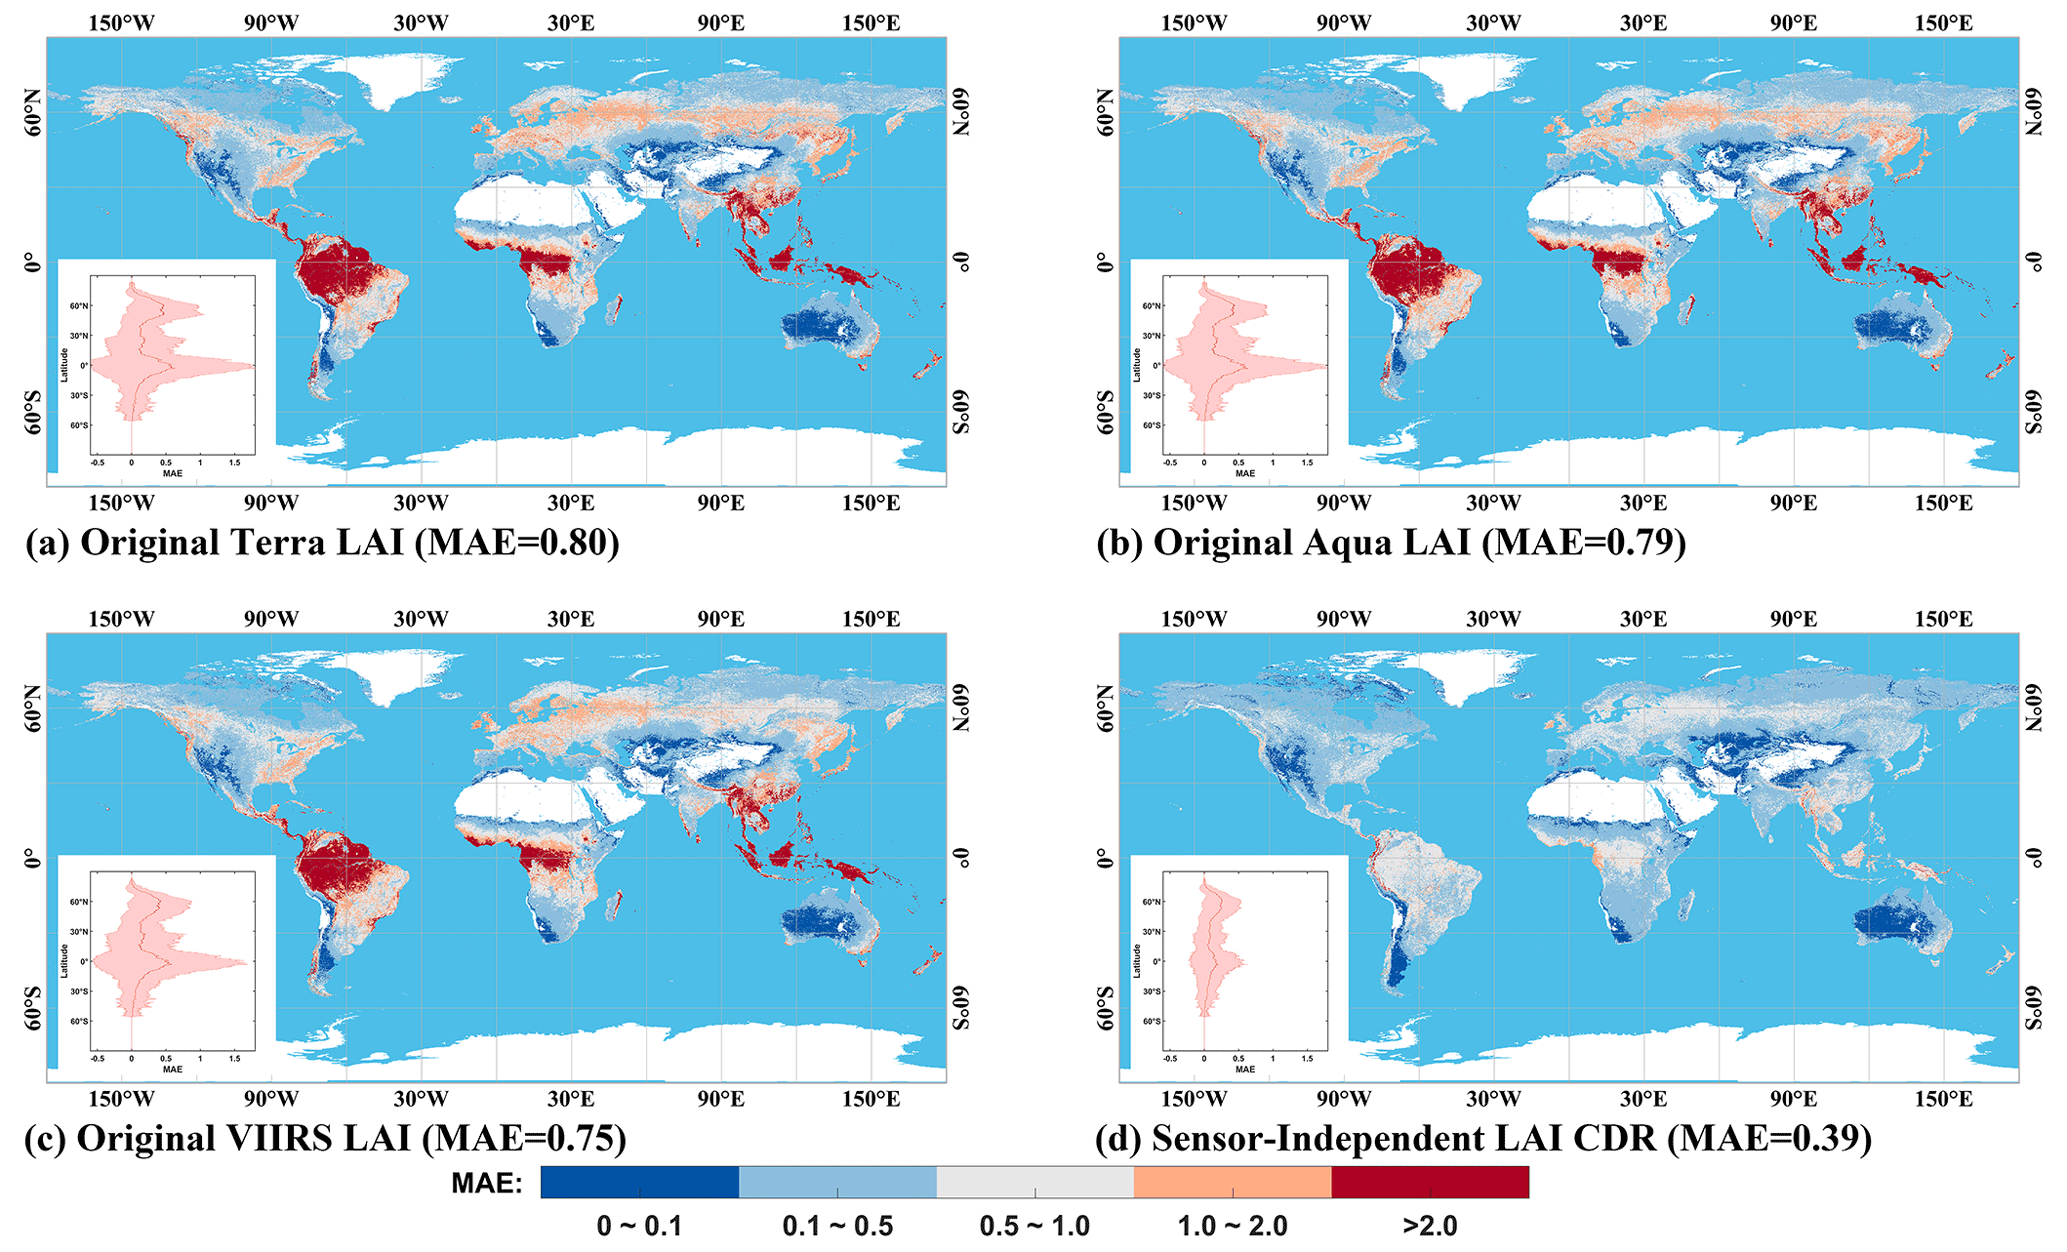
Figure 8Same as Fig. 7, but the metric is MAE. The global distribution of LAI MAE in each grid from 2013 to 2022 is shown.
Evidently, these improvements are particularly noticeable in the selected Amazon forest region, where both the TSS and MAE of SI LAI/FPAR CDR show a significant decreasing trend compared with the original Terra/Aqua/VIIRS LAI/FPAR (Figs. S7–S10). The magnitude decrease of TSS for SI LAI/FPAR CDR is above , and the magnitude decrease of MAE is above , which exceeds other global regions. This implies a significant improvement in the SI LAI/FPAR CDR, especially when dealing with large amounts of missing data. Furthermore, similar improvements are observed when the temporal resolution is bimonthly (Figs. S11–S14). Overall, these results highlight the significant improvement achieved with the SI LAI/FPAR CDR over the original Terra/Aqua/VIIRS LAI/FPAR, demonstrating its enhanced performance and accuracy.
4.3 Validation using ground LAI/FPAR measurements
Figure 9 shows comparisons of the SI LAI CDR and original Terra/Aqua/VIIRS LAI with the GBOV ground data. The SI LAI CDR shows highest accuracy, as evidenced by R2=0.72 and RMSE = 0.84, followed by the original VIIRS LAI (R2=0.67 and RMSE = 0.89) and then the original Terra/Aqua LAI (R2=0.63 and RMSE = 0.95 for both Terra/Aqua). Similar results are observed in the case of FPAR, where the SI FPAR CDR outperforms the original Terra/Aqua/VIIRS FPAR. The R2 values increased from the original Terra/Aqua/VIIRS FPAR by to 0.79 (SI FPAR CDR), while the RMSE decrease from to 0.15 (Fig. S15). It is important to note that all datasets show a tendency to overestimate low LAI/FPAR values and underestimate high FPAR values. However, the SI LAI/FPAR CDR shows a closer fit to the 1:1 line compared with the original Terra/Aqua/VIIRS LAI/FPAR. In addition, the SI LAI/FPAR CDR shows significant improvements across all RI ranges. The R2 values increased by approximately 0.02 to 0.21 from the original Terra/Aqua/VIIRS LAI/FPAR to SI LAI/FPAR CDR, while the RMSE values decreased by approximately 0.01 to 0.22 (Figs. 10 and S16). Especially with the RI in the range of [0, 0.5), the enhancements were the most significant among all RI ranges for both Terra/Aqua/VIIRS, which indicates that the SI LAI/FPAR CDR represents a significant improvement over the LAI/FPAR obtained using the backup algorithm.
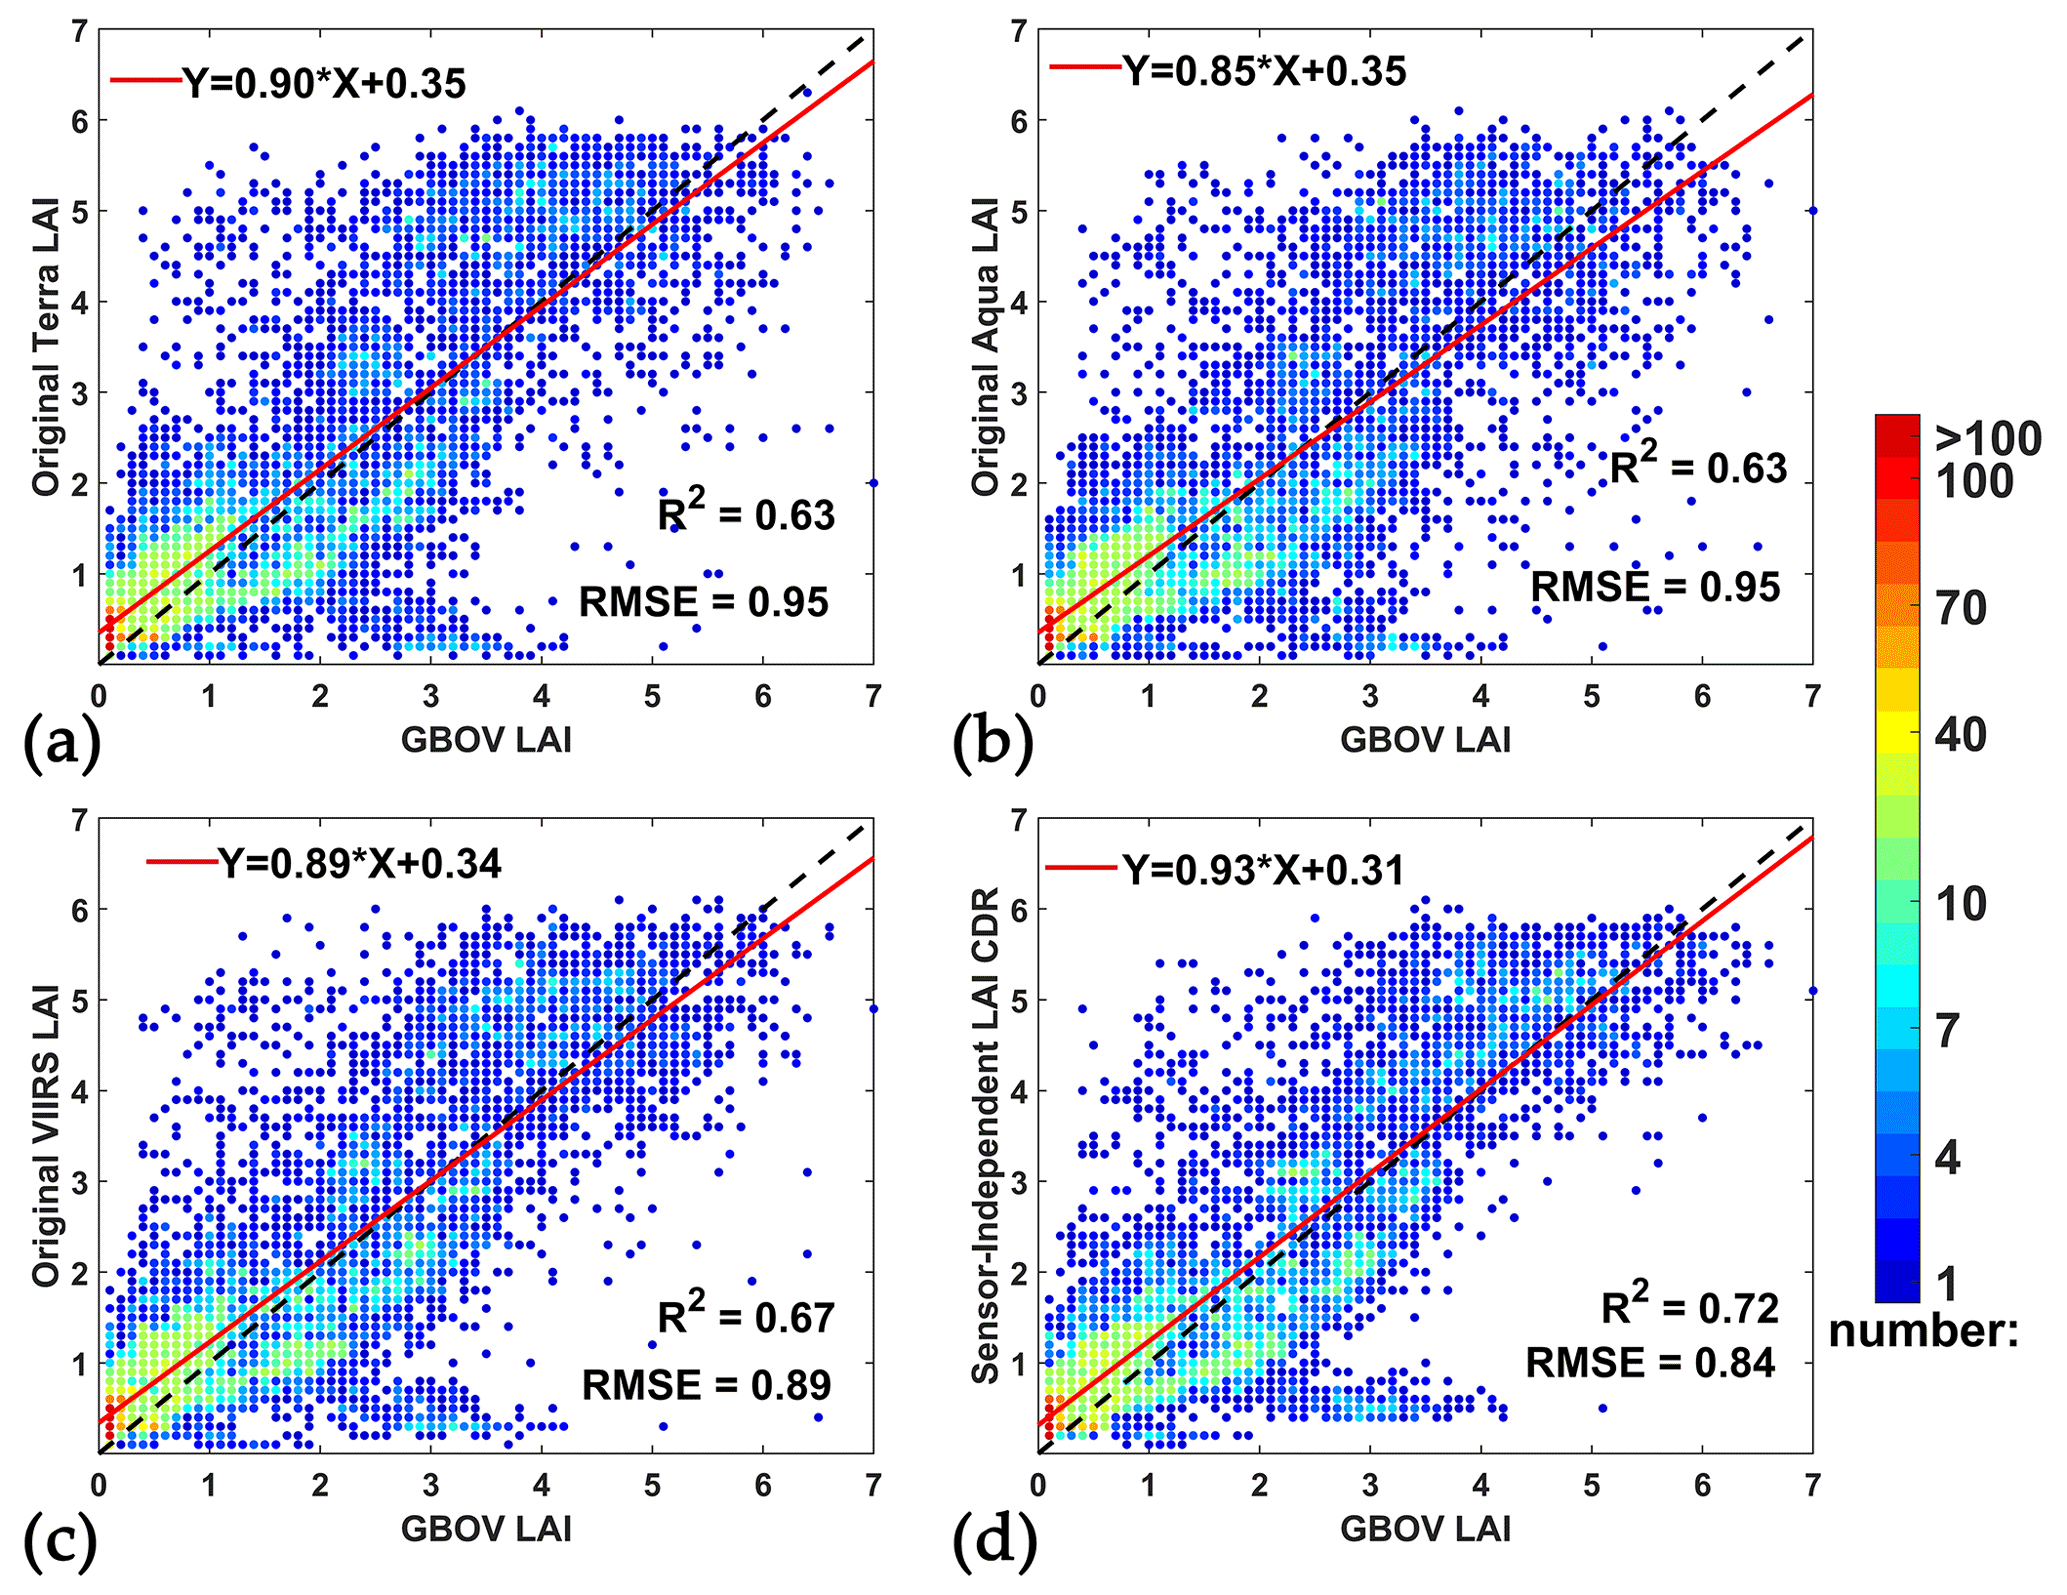
Figure 9Comparisons of the original Terra/Aqua/VIIRS LAI and SI LAI CDR with ground GBOV LAI. The bin for the x and y axes is 0.1 and the color indicates the number of pixels in this bin.
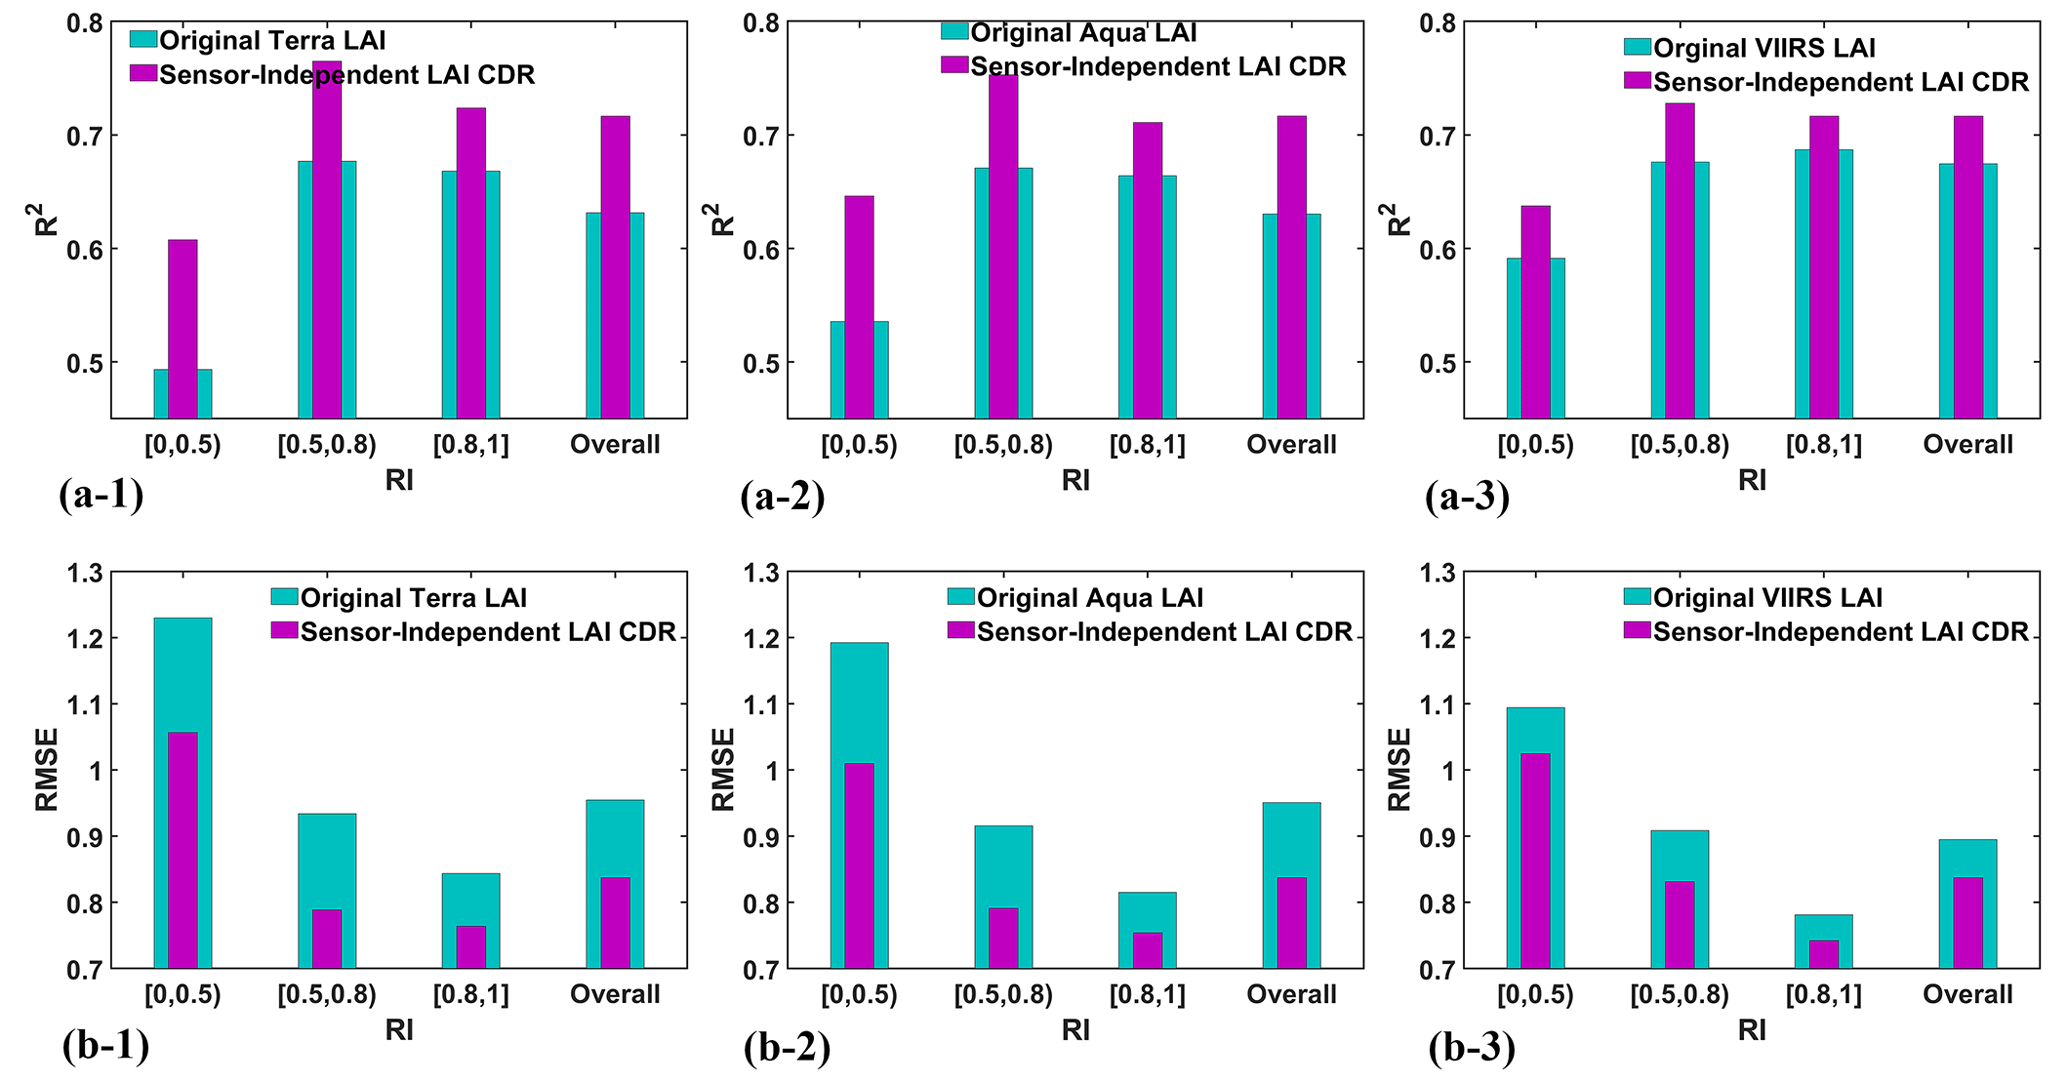
Figure 10The R2 and RMSE between original Terra/Aqua/VIIRS LAI and SI LAI CDR and GBOV LAI in different RI ranges.
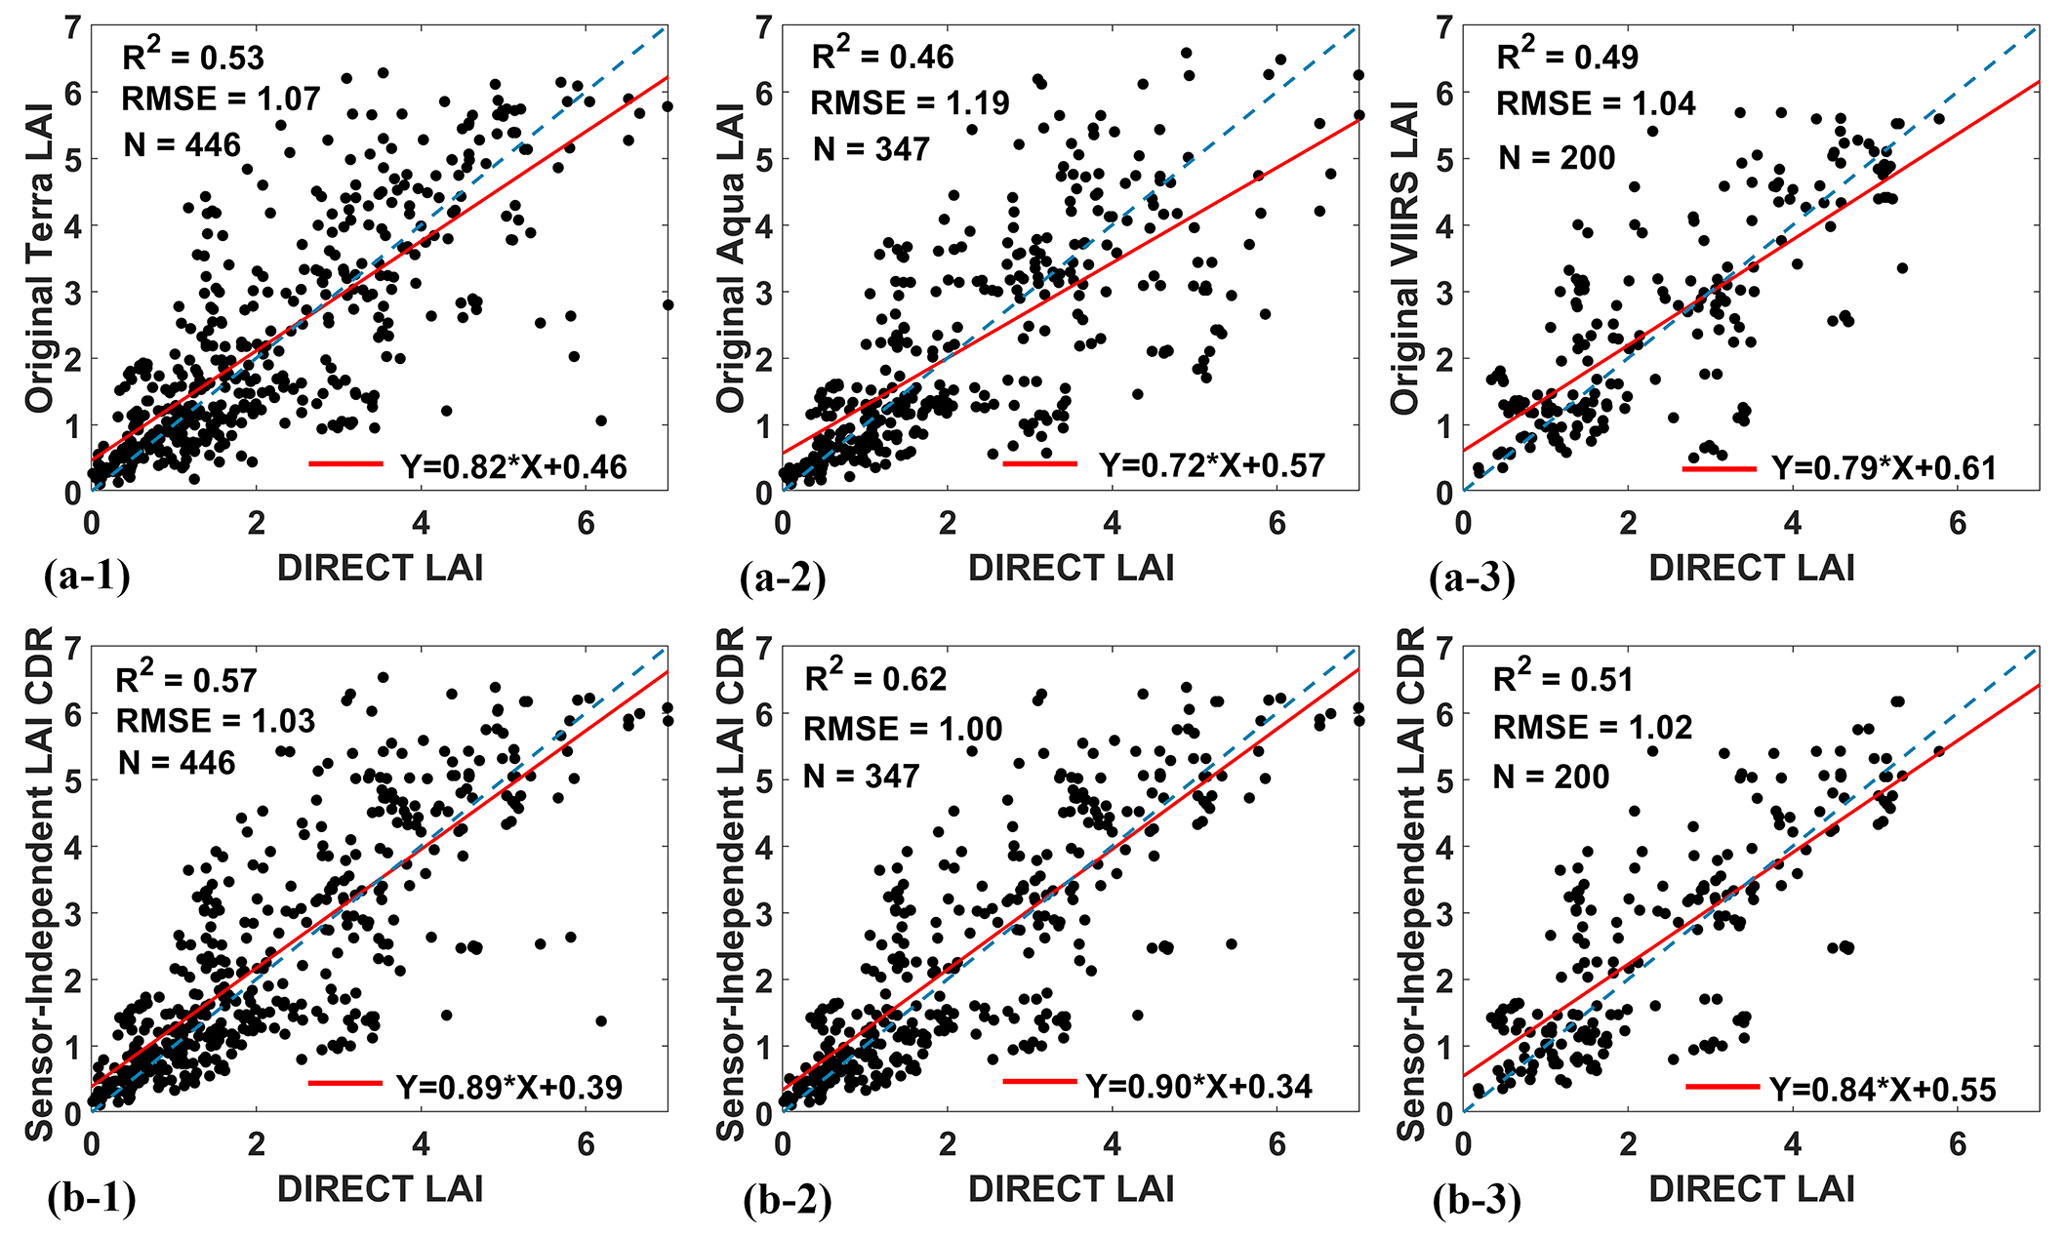
Figure 11Comparisons of original Terra/Aqua/VIIRS LAI and SI LAI CDR with ground DIRECT2.1 LAI measurements. The numbers corresponding to N in (a-1)–(a-3) are the number of all DIRECT measurements for the period covered by Terra/Aqua/VIIRS, respectively, and N in (b-1)–(b-3) corresponds to N in (a-1)–(a-3), respectively.
Improvements were also observed based on comparisons with the DIRECT ground truth data. Compared with the original Terra/Aqua/VIIRS LAI, the R2 values of SI LAI CDR increased by , while the RMSE values showed a decrease by (Fig. 11). Similarly, there is an increasing trend in R2 of for FPAR, accompanied by a decreasing trend in RMSE of (Fig. S17). The improvement from original Aqua LAI to SI LAI CDR was the most pronounced in LAI, with R2 increasing from 0.46 to 0.62 and RMSE decreasing from 1.19 to 1.00. The improvement from original Terra FPAR to SI FPAR CDR was the most pronounced in FPAR, with R2 increasing from 0.71 to 0.82 and RMSE decreasing from 0.13 to 0.11. The improvement is also reflected in the fact that the SI LAI/FPAR CDR scatters vs. DIRECT LAI/FPAR are closer to the 1:1 line.
4.4 Revisit the “Greening Earth”
Previous studies have shown a significant greening trend in global leaf area (Zhang et al., 2017; Chen et al., 2019; Cortés et al., 2021). However, due to loss of sensor calibration, atmospheric contamination of the vegetation signal influenced the previous studies. Thus, this study aims to provide further insight into “Greening Earth” by analyzing the high-quality SI LAI/FPAR CDR. The results obtained from this study provide a clear indication of the greening trend of vegetation. Specifically, according to SI LAI CDR, almost one-third (30.71 %) of the vegetated areas are greening and only 6.67 % of the vegetated areas show a browning trend (Fig. 12a). These findings are also supported by the results of the SI FPAR CDR, where about 31.26 % of the vegetated area is greening and only 6.50 % is browning (Fig. 12b). In terms of overall global vegetation status, the analysis suggests a significant increase in greenness from 2001 to 2022. The LAI shows a significant increasing trend of 2.33 % per decade and the FPAR also shows a significant increasing trend of 1.93 % per decade, which can be translated to a constant net increase in leaf area. Focusing on individual regions, SI LAI/FPAR CDR also highlights the significant contribution of China and India to the global greening trend. These regions show significant increases in vegetation greenness, supporting the overall global trend observed in the analysis. However, there are scattered browning trends in the high latitudes of the Northern Hemisphere, southern part of the African continent, and Amazon forest region.
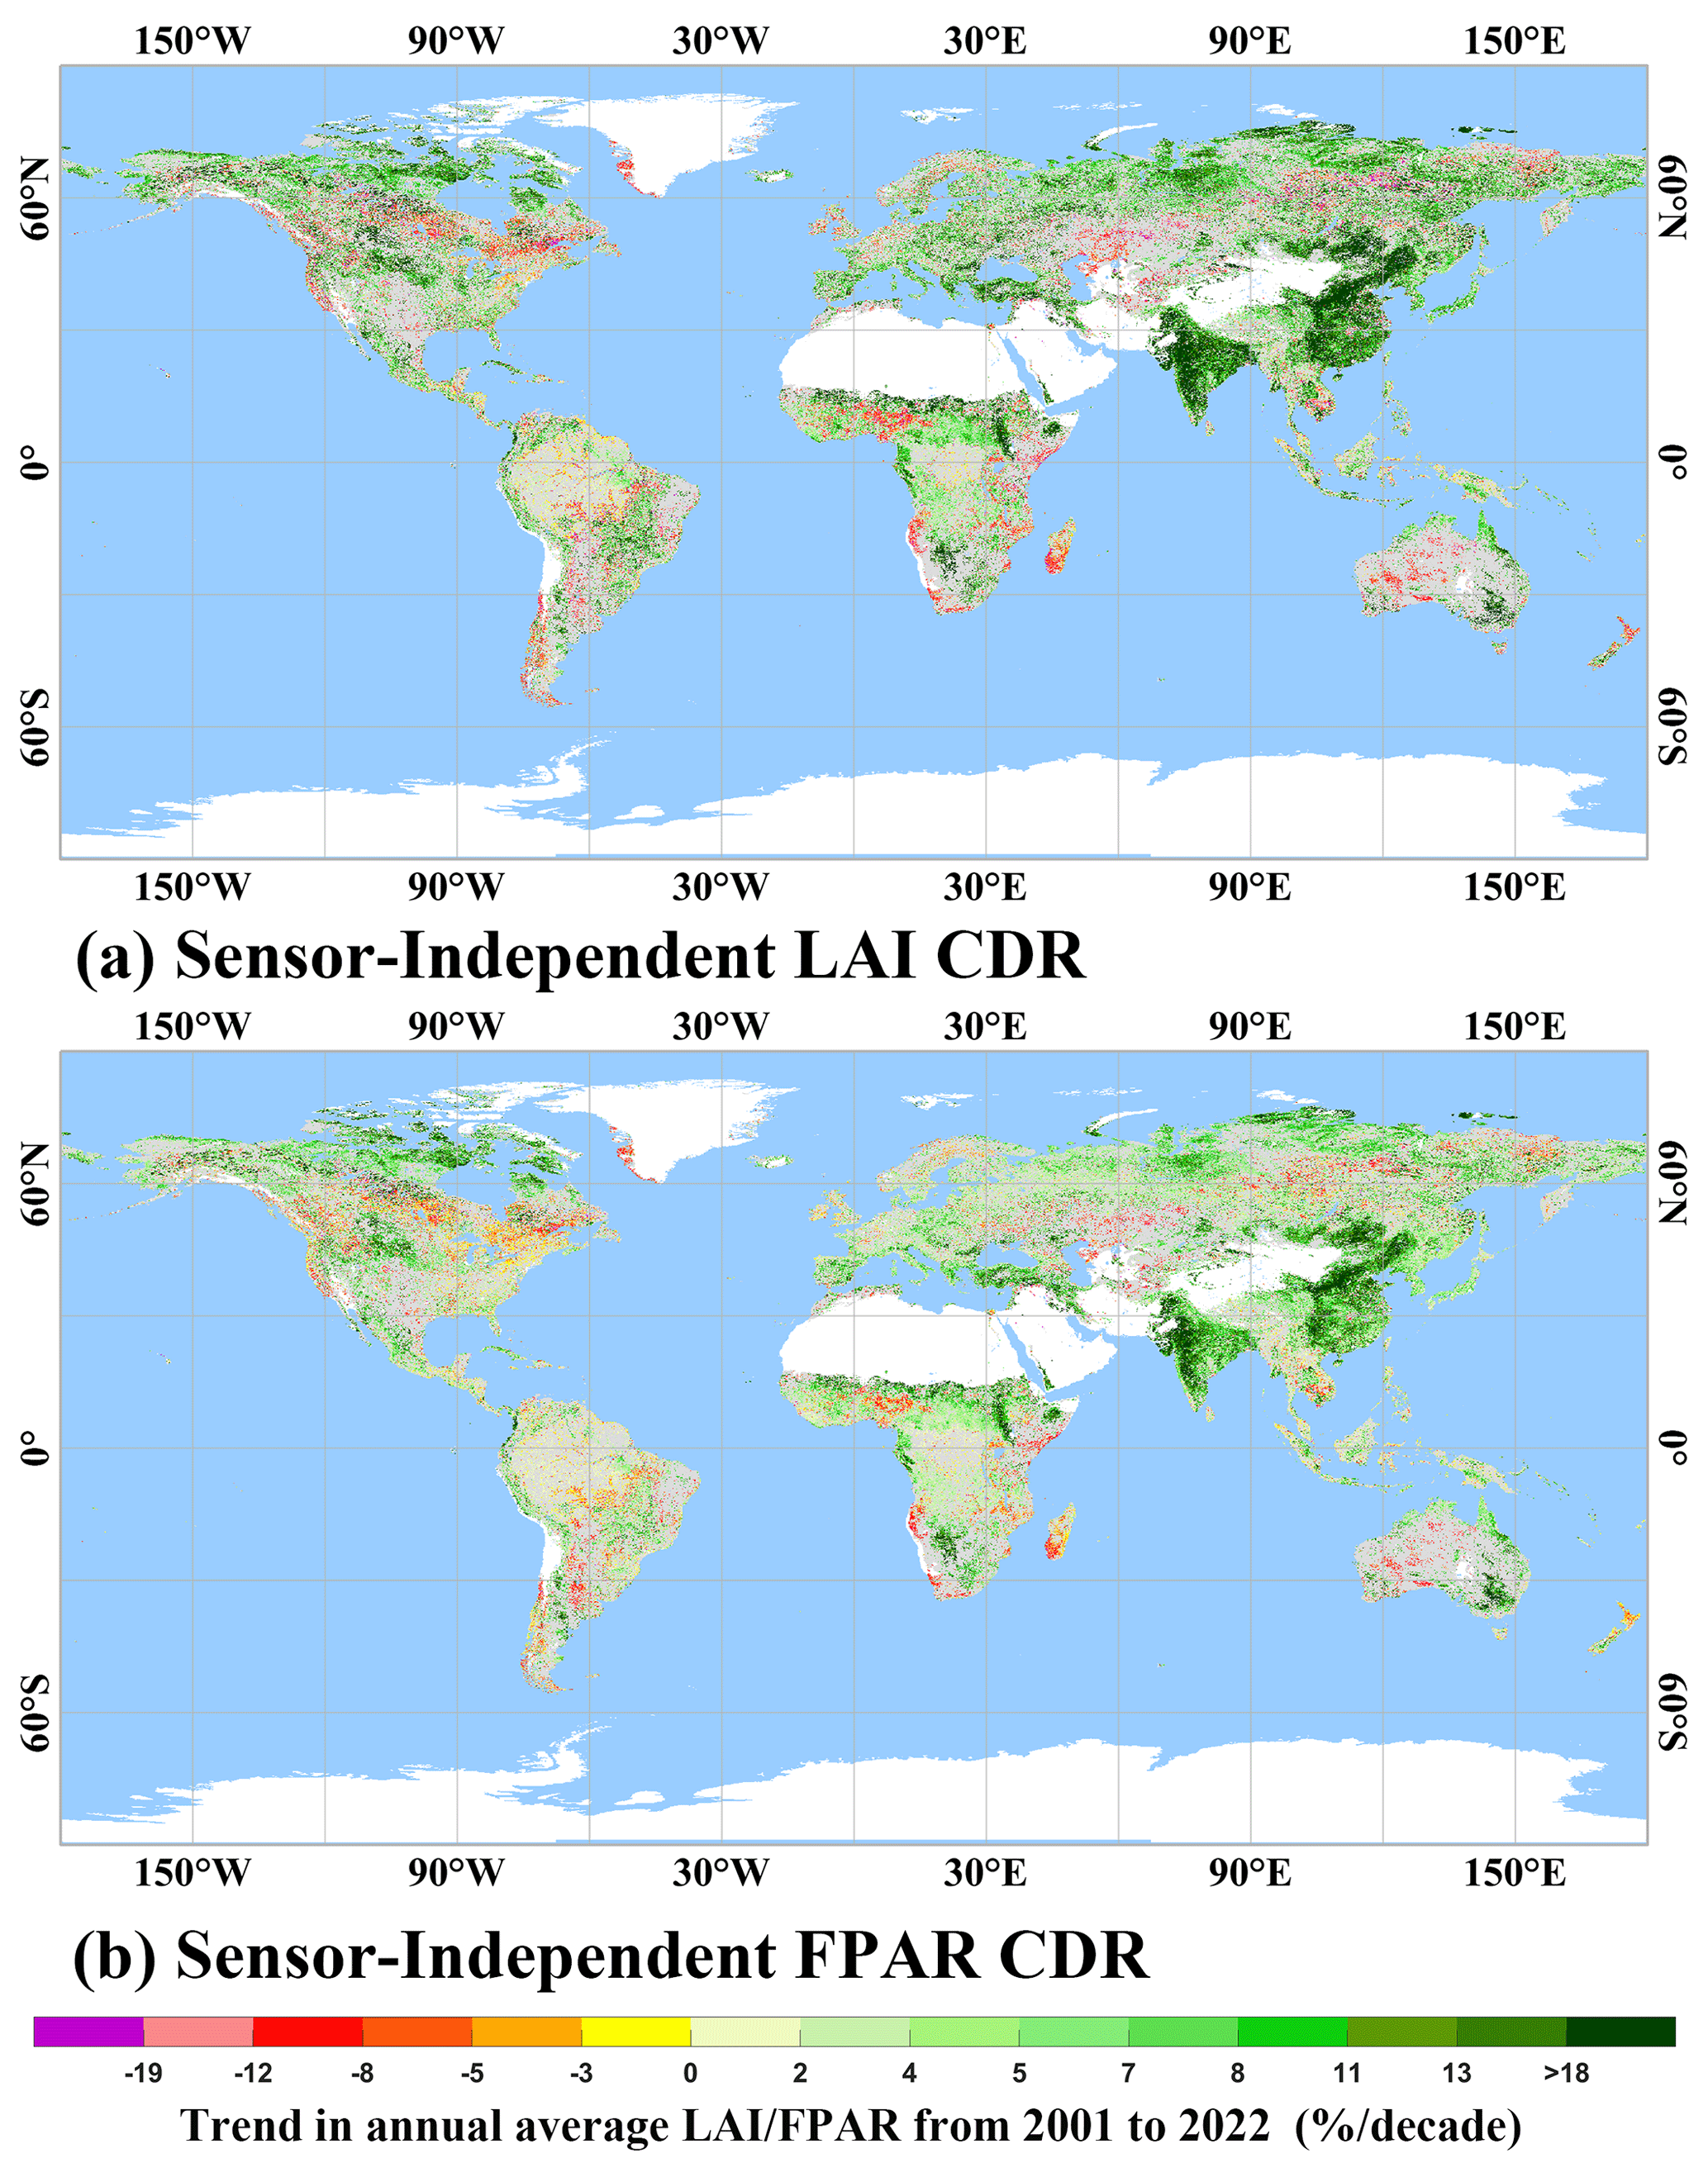
Figure 12Map of trends in annual average SI LAI/FPAR for 2001–2022. Statistically significant trends (Mann–Kendall test; P≤0.05) are color coded. Gray areas show vegetated land with statistically insignificant trends. White areas depict barren lands, permanent ice-covered areas, permanent wetlands, and built-up areas. Blue areas represent water.
Improving the quality of LAI/FPAR time series is crucial to ensure the reliability of vegetation studies. Therefore, it is necessary to explore various techniques of post-processing satellite-derived LAI/FPAR. In the operational data processing, the main RT-based algorithm produces best-quality and high-precision parameters. With a high probability the main algorithm fails in the case of cloud- and/or snow-contaminated pixels, or pixels with a high aerosol load. When this happens, the backup method is utilized. This causes high frequency noise in the LAI/FPAR time series, which indirectly leads to time series instability and absolute-accuracy problems. Therefore, the first step in the developing SI LAI/FPAR CDR production process was to eliminate poor-quality retrievals to ensure that subsequent steps, such as gap filling, are not affected by noise. As a result, the first-step filtering principle is also relatively more stringent. Previous studies on the reconstruction of MODIS/VIIRS LAI time series often only filter the backup algorithm (Huang et al., 2021), but this study also filters the main algorithms that have been affected by clouds and aerosols. The findings after step 1 are consistent with previous studies investigating the dynamics of vegetation phenology in tropical rainforest (Myneni et al., 2007; Samanta et al., 2012a; Hashimoto et al., 2021; Sun et al., 2022), which also indirectly proves the necessity of this step.
The current MODIS/VIIRS LAI/FPAR retrieval algorithm considers the effect of SZA on LAI, but also FPAR depends on SZA (Knyazikhin et al., 1998a; Pu et al., 2020). The newly proposed SI LAI/FPAR CDR differs from the previously reconstructed sensor-dependent time series by its SI feature, which includes both morning and afternoon high-quality retrievals. By accounting for the effects of satellite transit times at different times of the day, particularly in relation to SZA variations, the SI LAI/FPAR CDR avoids potential systematic biases. Thus, the SI property allows FPAR to be unaffected by a single observation. In addition, the process of consolidating the original Terra/Aqua/VIIRS LAI/FPAR into an SI LAI/FPAR CDR also provides as much information as possible for the subsequent gap filling step (Ganguly et al., 2008; Xiao et al., 2014).
In recent years, numerous spatial–temporal reconstruction methods have been proposed from different perspectives. However, most of these methods are based on empirical filtering and function fitting approaches, neglecting the use of prior information or statistical properties. The ST-tensor model used in this study differs from previous models in that it considers the strong correlation between temporal and spatial scales (Chu et al., 2021). In addition, the ST-tensor model considers the consistency of variability across years, effectively exploiting the internal correlation of the LAI/FPAR (Ji et al., 2018; Li et al., 2019). As a result, the gap filled LAI/FPAR shows a high degree of consistency with the original high-quality data, thus preserving the integrity of the original measurements. This reduction in the frequency of noise within the LAI/FPAR time series is highly beneficial for phenology studies and agricultural management. Additionally, the L1 trend iteration step of the ST-tensor model ensures that certain anomalous observations, such as forest degradation due to fire, are not inadvertently smoothed by the algorithm. This capability contributes to the reliability and accuracy of the model.
This study establishes the accuracy of the SI LAI/FPAR CDR through direct ground validation, which includes rigorous evaluation against ground measurements and related metrics. The results of this validation process demonstrate the reliability of the product. Furthermore, we also compared the above by analyzing results (see Sect. 4.4) reported by recent studies (Chen et al., 2019; Zhang et al., 2017), and both greening and browning trends are consistent. These results confirm the previous understanding of “Greening Earth” and indirectly prove the reliability of SI LAI/FPAR CDR. The SI LAI/FPAR CDR analysis provides a valuable tool for monitoring and understanding the dynamics of global vegetation change. The consistency of the study's results with those of previous research adds to the robustness and credibility of the product. The provision of multiple spatial and temporal resolution versions of the SI LAI/FPAR CDR in this study greatly enhances the ability to study global and local vegetation change and climate dynamics.
The SI LAI/FPAR CDR is openly available at https://doi.org/10.5281/zenodo.8076540 (Pu et al., 2023a), https://code.earthengine.google.com/?asset=projects/sat-io/open-datasets/BU_LAI_FPAR/wgs_500m_8d (Pu and Roy, 2023a, only available for logged-in users), and https://code.earthengine.google.com/?asset=_projects/sat-io/open-datasets/BU_LAI_FPAR/wgs_500m_bimonthly (Pu and Roy, 2023b, only available for logged-in users).
The “Readme” files about data description, data availability, and example code of GEE and MATLAB for SI LAI/FPAR CDR can be found at https://github.com/JiabinPu/Sensor-Independent-LAI-FPAR-CDR (Pu, 2023).
This study developed an SI LAI/FPAR CDR based on Terra-MODIS/Aqua-MODIS/VIIRS LAI/FPAR standard products and an ST-tensor completion model. The CDR covers a substantial temporal period from 2000 to 2022, with spatial resolutions of 500 m/5 km/0.05∘ and temporal resolutions of 8 d or a half month. The generation of the SI LAI/FPAR CDR was evaluated at each step. Evaluation results show that the elimination of low-quality LAI/FPAR and consolidating Terra/Aqua/VIIRS LAI/FPAR into SI LAI/FPAR are effective in the production process; and the ST-tensor completion model was excellent in gap filling. The ground-based validations show that the newly generated SI LAI/FPAR CDR achieves higher accuracy compared with the original Terra/Aqua/VIIRS LAI/FPAR products. Specifically, the SI LAI/FPAR CDR shows the highest accuracy ( and RMSE for LAI/FPAR) among all LAI/FPAR products with GBOV LAI/FPAR as benchmark. Similarly, the SI LAI/FPAR CDR shows an increased R2 magnitude of 0.04–0.16/0.05–0.09 and a decreased RMSE magnitude of 0.02–0.19/0.01–0.02 based on DIRECT LAI/FPAR. The evaluation results also show that the SI LAI/FPAR CDR has a lower TSS compared with the original Terra/Aqua/VIIRS LAI/FPAR product, which suggests that this CDR has less noise and provides more stable time series. Conversely, the MAE is also lower, indicating that the SI LAI/FPAR CDR is closer to high-quality LAI/FPAR retrievals compared with Terra/Aqua/VIIRS LAI/FPAR products. Additionally, the reproduced results of the “Greening Earth” study demonstrate the consistency of trend analysis based on the SI LAI/FPAR CDR with previous findings. The same consistency analysis greatly enhances the ability to conduct further studies on vegetation dynamics and climate change. By exploiting the integration of multiple satellite data sources and applying advanced gap filling techniques, the SI LAI/FPAR CDR presented in this study provides a valuable resource for researchers studying vegetation dynamics and their relationship to climate change. Overall, the rigorous evaluation and validation conducted throughout the study provide confidence in the accuracy and reliability of the SI LAI/FPAR CDR, further strengthening its utility for diverse applications in environmental science and land management.
The supplement related to this article is available online at: https://doi.org/10.5194/essd-16-15-2024-supplement.
JP: methodology, conceptualization, software, formal analysis, writing – original draft. KY: methodology, conceptualization, draft revision, supervision. SR: dataset management and resources. ZZ: draft review and revision. MR: draft review and revision. YK: formal analysis, draft revision, supervision, and resources. RBM: conceptualization, resources, and supervision.
The contact author has declared that none of the authors has any competing interests.
Publisher's note: Copernicus Publications remains neutral with regard to jurisdictional claims made in the text, published maps, institutional affiliations, or any other geographical representation in this paper. While Copernicus Publications makes every effort to include appropriate place names, the final responsibility lies with the authors.
We thank NASA for providing MODIS/VIIRS standard products. We gratefully acknowledge the Google Earth Engine (https://earthengine.google.com/, last access: 21 December 2023). We also thank Dong Chu at Wuhan University for the code of the ST-tensor completion model.
This work was supported by the NASA grants to Boston University under the MODIS and VIIRS projects (grant nos. 80NSSC21K1925 and 80NSSC21K1960).
This paper was edited by Yun Yang and reviewed by two anonymous referees.
Bai, G., Lerebourg, C., Brown, L., Morris, H., Dash, J., Clerici, M., and Gobron, N.: BOV (Ground-Based Observation for Validation): A Copernicus Service for Validation of Land Products, in: IGARSS 2022-2022 IEEE International Geoscience and Remote Sensing Symposium, 4304–4307, 2022.
Baret, F., Morissette, J. T., Fernandes, R. A., Champeaux, J. L., Myneni, R. B., Chen, J., Plummer, S., Weiss, M., Bacour, C., and Garrigues, S.: Evaluation of the representativeness of networks of sites for the global validation and intercomparison of land biophysical products: Proposition of the CEOS-BELMANIP, IEEE T. Geosci.Remote, 44, 1794–1803, https://doi.org/10.1109/TGRS.2006.876030, 2006.
Boussetta, S., Balsamo, G., Beljaars, A., Kral, T., and Jarlan, L.: Impact of a satellite-derived leaf area index monthly climatology in a global numerical weather prediction model, Int. J. Remote Sens., 34, 3520–3542, https://doi.org/10.1080/01431161.2012.716543, 2013.
Brown, L. A., Meier, C., Morris, H., Pastor-Guzman, J., Bai, G., Lerebourg, C., Gobron, N., Lanconelli, C., Clerici, M., and Dash, J.: Evaluation of global leaf area index and fraction of absorbed photosynthetically active radiation products over North America using Copernicus Ground Based Observations for Validation data, Remote Sens. Environ., 247, 111935, https://doi.org/10.1016/j.rse.2020.111935, 2020.
Brown, L. A., Camacho, F., García-Santos, V., Origo, N., Fuster, B., Morris, H., Pastor-Guzman, J., Sánchez-Zapero, J., Morrone, R., and Ryder, J.: Fiducial reference measurements for vegetation bio-geophysical variables: an end-to-end uncertainty evaluation framework, Remote Sens., 13, 3194, https://doi.org/10.3390/rs13163194, 2021.
Chen, C., Park, T., Wang, X., Piao, S., Xu, B., Chaturvedi, R. K., Fuchs, R., Brovkin, V., Ciais, P., Fensholt, R., Tommervik, H., Bala, G., Zhu, Z., Nemani, R. R., and Myneni, R. B.: China and India lead in greening of the world through land-use management, Nat. Sustain., 2, 122–129, https://doi.org/10.1038/s41893-019-0220-7, 2019.
Chen, C., Riley, W. J., Prentice, I. C., and Keenan, T. F.: CO2 fertilization of terrestrial photosynthesis inferred from site to global scales, P. Natl. Acad. Sci. USA, 119, e2115627119, https://doi.org/10.1073/pnas.2115627119, 2022.
Chen, J. M.: Optically-based methods for measuring seasonal variation of leaf area index in boreal conifer stands, Agr. Forest Meteorol. 80, 135–163, https://doi.org/10.1016/0168-1923(95)02291-0, 1996.
Chen, J. M. and Black, T. A.: Defining leaf area index for non-flat leaves, Plant Cell Environ., 15, 421–429, https://doi.org/10.1111/j.1365-3040.1992.tb00992.x, 1992.
Chu, D., Shen, H., Guan, X., Chen, J. M., Li, X., Li, J., and Zhang, L.: Long time-series NDVI reconstruction in cloud-prone regions via spatio-temporal tensor completion, Remote Sens. Environ., 264, 112632, https://doi.org/10.1016/j.rse.2021.112632, 2021.
Chu, D., Shen, H., Guan, X., and Li, X.: An L1-regularized variational approach for NDVI time-series reconstruction considering inter-annual seasonal similarity, Int. J. Appl. Earth Obs., 114, 103021, https://doi.org/10.1016/j.jag.2022.103021, 2022.
Cong, N., Piao, S., Chen, A., Wang, X., Lin, X., Chen, S., Han, S., Zhou, G., and Zhang, X.: Spring vegetation green-up date in China inferred from SPOT NDVI data: A multiple model analysis, Agr. Forest Meteorol., 165, 104–113, https://doi.org/10.1016/j.agrformet.2012.06.009, 2012.
Cortés, J., Mahecha, M. D., Reichstein, M., Myneni, R. B., Chen, C., and Brenning, A.: Where are global vegetation greening and browning trends significant?, Geophys. Res. Lett., 48, e2020GL091496, https://doi.org/10.1029/2020GL091496, 2021.
Das, M. and Ghosh, S. K.: A deep-learning-based forecasting ensemble to predict missing data for remote sensing analysis, IEEE J. Sel. Top. Appl., 10, 5228–5236, https://doi.org/10.1109/JSTARS.2017.2760202, 2017.
Dong, Y., Li, J., Jiao, Z., Liu, Q., Zhao, J., Xu, B., Zhang, H., Zhang, Z., Liu, C., and Knyazikhin, Y.: A method for retrieving coarse-resolution leaf area index for mixed biomes using a mixed-pixel correction factor, IEEE T. Geosci. Remote, 61, 4400317, https://doi.org/10.1109/TGRS.2023.3235949, 2023.
Eilers, P. H.: A perfect smoother, Anal. Chem., 75, 3631–3636, https://doi.org/10.1021/ac034173t, 2003.
Fang, H., Wei, S., Jiang, C., and Scipal, K.: Theoretical uncertainty analysis of global MODIS, CYCLOPES, and GLOBCARBON LAI products using a triple collocation method, Remote Sens. Environ., 124, 610–621, https://doi.org/10.1016/j.rse.2012.06.013, 2012a.
Fang, H., Wei, S., and Liang, S.: Validation of MODIS and CYCLOPES LAI products using global field measurement data, Remote Sens. Environ., 119, 43–54, https://doi.org/10.1016/j.rse.2011.12.006, 2012b.
Fang, H., Baret, F., Plummer, S., and Schaepman-Strub, G.: An overview of global leaf area index (LAI): Methods, products, validation, and applications, Rev. Geophys., 57, 739–799, https://doi.org/10.1029/2018RG000608, 2019.
Ganguly, S., Schull, M. A., Samanta, A., Shabanov, N. V., Milesi, C., Nemani, R. R., Knyazikhin, Y., and Myneni, R. B.: Generating vegetation leaf area index earth system data record from multiple sensors. Part 1: Theory, Remote Sens. Environ., 112, 4333–4343, https://doi.org/10.1016/j.rse.2008.07.014, 2008.
Goodchild, M. F.: First law of geography, in: International Encyclopedia of Human Geography, Elsevier Inc., 179–182, https://doi.org/10.1016/B978-008044910-4.00438-7, 2009.
Hamed, K. H. and Rao, A. R.: A modified Mann-Kendall trend test for autocorrelated data, J. Hydrol., 204, 182–196, https://doi.org/10.1016/S0022-1694(97)00125-X, 1998.
Hashimoto, H., Wang, W., Dungan, J. L., Li, S., Michaelis, A. R., Takenaka, H., Higuchi, A., Myneni, R. B., and Nemani, R. R.: New generation geostationary satellite observations support seasonality in greenness of the Amazon evergreen forests, Nat. Commun., 12, 684, https://doi.org/10.1038/s41467-021-20994-y, 2021.
He, W., Zhang, H., and Zhang, L.: Total variation regularized reweighted sparse nonnegative matrix factorization for hyperspectral unmixing, IEEE T. Geosci. Remote, 55, 3909–3921, https://doi.org/10.1109/TGRS.2017.2683719, 2017.
Holben, B. N.: Characteristics of maximum-value composite images from temporal AVHRR data, Int. J. Remote Sens., 7, 1417–1434, https://doi.org/10.1080/01431168608948945, 1986.
Huang, A., Shen, R., Di, W., and Han, H.: A methodology to reconstruct LAI time series data based on generative adversarial network and improved Savitzky-Golay filter, Int. J. Appl. Earth Obs., 105, 102633, https://doi.org/10.1016/j.jag.2021.102633, 2021.
Ji, T.-Y., Huang, T.-Z., Zhao, X.-L., Ma, T.-H., and Deng, L.-J.: A non-convex tensor rank approximation for tensor completion, Appl. Math. Model., 48, 410–422, https://doi.org/10.1016/j.apm.2017.04.002, 2017.
Ji, T.-Y., Yokoya, N., Zhu, X. X., and Huang, T.-Z.: Nonlocal tensor completion for multitemporal remotely sensed images' inpainting, IEEE T. Geosci. Remote, 56, 3047–3061, https://doi.org/10.1109/TGRS.2018.2790262, 2018.
Justice, C. O., Román, M. O., Csiszar, I., Vermote, E. F., Wolfe, R. E., Hook, S. J., Friedl, M., Wang, Z., Schaaf, C. B., and Miura, T.: Land and cryosphere products from Suomi NPP VIIRS: Overview and status, J. Geophys. Res.-Atmos., 118, 9753–9765, https://doi.org/10.1002/jgrd.50771, 2013.
Knyazikhin, Y.: MODIS leaf area index (LAI) and fraction of photosynthetically active radiation absorbed by vegetation (FPAR) product (MOD 15) algorithm theoretical basis document, https://modis.gsfc.nasa.gov/data/atbd/atbd_mod15.pdf (last access: 21 December 2023), 1999.
Knyazikhin, Y. and Myneni, R.: VIIRS leaf area index (LAI) and fraction of photosynthetically active radiation absorbed by vegetation (FPAR) user guide, https://lpdaac.usgs.gov/documents/126/VNP15_User_Guide.pdf (last access: 21 December 2023), 2018.
Knyazikhin, Y., Martonchik, J., Myneni, R. B., Diner, D., and Running, S. W.: Synergistic algorithm for estimating vegetation canopy leaf area index and fraction of absorbed photosynthetically active radiation from MODIS and MISR data, J. Geophys. Res.-Atmos., 103, 32257–32275, https://doi.org/10.1029/98JD02462, 1998a.
Knyazikhin, Y., Martonchik, J. V., Diner, D. J., Myneni, R. B., Verstraete, M. M., Pinty, B., and Gobron, N.: Estimation of vegetation canopy leaf area index and fraction of absorbed photosynthetically active radiation from atmosphere-corrected MISR data, J. Geophys. Res., 103, 32239–32256, https://doi.org/10.1029/98JD02461, 1998b.
Lange, M., Dechant, B., Rebmann, C., Vohland, M., Cuntz, M., and Doktor, D.: Validating MODIS and sentinel-2 NDVI products at a temperate deciduous forest site using two independent ground-based sensors, Sensors, 17, 1855, https://doi.org/10.3390/s17081855, 2017.
Li, X.-T., Zhao, X.-L., Jiang, T.-X., Zheng, Y.-B., Ji, T.-Y., and Huang, T.-Z.: Low-rank tensor completion via combined non-local self-similarity and low-rank regularization, Neurocomputing, 367, 1–12, 2019.
Mariano, D. A., Santos, C. A. C. D., Wardlow, B. D., Anderson, M. C., Schiltmeyer, A. V., Tadesse, T., and Svoboda, M.: Use of remote sensing indicators to assess effects of drought and human-induced land degradation on ecosystem health in Northeastern Brazil, Remote Sens. Environ., 213, 129–143, https://doi.org/10.1016/j.rse.2018.04.048, 2018.
Merchant, C. J., Paul, F., Popp, T., Ablain, M., Bontemps, S., Defourny, P., Hollmann, R., Lavergne, T., Laeng, A., de Leeuw, G., Mittaz, J., Poulsen, C., Povey, A. C., Reuter, M., Sathyendranath, S., Sandven, S., Sofieva, V. F., and Wagner, W.: Uncertainty information in climate data records from Earth observation, Earth Syst. Sci. Data, 9, 511–527, https://doi.org/10.5194/essd-9-511-2017, 2017.
Mitášová, H. and Hofierka, J.: Interpolation by regularized spline with tension: II. Application to terrain modeling and surface geometry analysis, Math. Geol., 25, 657–669, https://doi.org/10.1007/BF00893172, 1993.
Myneni, R. and Knyazikhin, Y.: VIIRS/NPP Leaf Area Index/FPAR 8-Day L4 Global 500m SIN Grid V001, NASA EOSDIS Land Processes Distributed Active Archive Center [data set], https://doi.org/10.5067/VIIRS/VNP15A2H.001, 2018.
Myneni, R. and Park, Y.: MODIS Collection 6 (C6) LAI/FPAR Product User's Guide, https://modis-land.gsfc.nasa.gov/pdf/MOD15_C6_UserGuide_June2020.pdf (last access: 21 December 2023), 2015.
Myneni, R., Knyazikhin, Y., and Park, T.: MOD15A2H MODIS/Terra Leaf Area Index/FPAR 8-Day L4 Global 500 m SIN Grid V006, NASA EOSDIS Land Processes Distributed Active Archive Center [data set], https://doi.org/10.5067/MODIS/MOD15A2H.006, 2015.
Myneni, R. B., Hoffman, S., Knyazikhin, Y., Privette, J., Glassy, J., Tian, Y., Wang, Y., Song, X., Zhang, Y., and Smith, G.: Global products of vegetation leaf area and fraction absorbed PAR from year one of MODIS data, Remote Sens. Environ., 83, 214–231, https://doi.org/10.1016/S0034-4257(02)00074-3, 2002.
Myneni, R. B., Yang, W., Nemani, R. R., Huete, A. R., Dickinson, R. E., Knyazikhin, Y., Didan, K., Fu, R., Juárez, R. I. N., and Saatchi, S. S.: Large seasonal swings in leaf area of Amazon rainforests, P. Natl. Acad. Sci. USA, 104, 4820–4823, https://doi.org/10.1073/pnas.0611338104, 2007.
Oliver, M. A. and Webster, R.: Kriging: a method of interpolation for geographical information systems, Int. J. Geograph. Inf. Sci., 4, 313–332, https://doi.org/10.1080/02693799008941549, 1990.
Park, T., Yan, K., Chen, C., Xu, B., Knyazikhin, Y., and Myneni, R.: VIIRS Leaf Area Index (LAI) and Fraction of Photosynthetically Active Radiation Absorbed by Vegetation (FPAR) Product Algorithm Theoretical Basis Document (ATBD), NASA Technical Report, https://lpdaac.usgs.gov/documents/125/VNP15_ATBD.pdf (last access: 21 December 2023), 2017.
Piao, S., Yin, G., Tan, J., Cheng, L., Huang, M., Li, Y., Liu, R., Mao, J., Myneni, R. B., and Peng, S.: Detection and attribution of vegetation greening trend in China over the last 30 years, Glob. Change Biol., 21, 1601–1609, https://doi.org/10.1111/gcb.12795, 2015.
Pu, J.: Sensor-Independent-LAI-FPAR-CDR, Github [code], https://github.com/JiabinPu/Sensor-Independent-LAI-FPAR-CDR, last access: 21 December 2023.
Pu, J. and Roy, S.: wgs_500m_8d, https://code.earthengine.google.com/?asset=projects/sat-io/open-datasets/BU_LAI_FPAR/wgs_500m_8d, last access: 21 December 2023a.
Pu, J. and Roy, S.: wgs_500m_bimonthly, https://code.earthengine.google.com/?asset=_projects/sat-io/open-datasets/BU_LAI_FPAR/wgs_500m_bimonthly, last access: 21 December 2023b.
Pu, J., Yan, K., Zhou, G., Lei, Y., Zhu, Y., Guo, D., Li, H., Xu, L., Knyazikhin, Y., and Myneni, R. B.: Evaluation of the MODIS LAI/FPAR Algorithm Based on 3D-RTM Simulations: A Case Study of Grassland, Remote Sens., 12, 3391, https://doi.org/10.3390/rs12203391, 2020.
Pu, J., Roy, S., Knyazikhin, Y., and Myneni, R.: Sensor-Independent LAI/FPAR CDR, Zenodo [data set], https://doi.org/10.5281/zenodo.8076540, 2023a.
Pu, J., Yan, K., Gao, S., Zhang, Y., Park, T., Sun, X., Weiss, M., Knyazikhin, Y., and Myneni, R. B.: Improving the MODIS LAI compositing using prior time-series information, Remote Sens. Environ., 287, 113493, https://doi.org/10.1016/j.rse.2023.113493, 2023b.
Roerink, G. J., Menenti, M., and Verhoef, W.: Reconstructing cloudfree NDVI composites using Fourier analysis of time series, Int. J. Remote Sens., 21, 1911–1917, https://doi.org/10.1080/014311600209814, 2000.
Samanta, A., Ganguly, S., Vermote, E., Nemani, R. R., and Myneni, R. B.: Interpretation of variations in MODIS-measured greenness levels of Amazon forests during 2000 to 2009, Environ. Res. Lett., 7, 024018, https://doi.org/10.1088/1748-9326/7/2/024018, 2012a.
Samanta, A., Knyazikhin, Y., Xu, L., Dickinson, R. E., Fu, R., Costa, M. H., Saatchi, S. S., Nemani, R. R., and Myneni, R. B.: Seasonal changes in leaf area of Amazon forests from leaf flushing and abscission, J. Geophys. Res.-Biogeo., 117, G01015, https://doi.org/10.1029/2011JG001818, 2012b.
Sellers, P., Dickinson, R. E., Randall, D., Betts, A., Hall, F., Berry, J., Collatz, G., Denning, A., Mooney, H., and Nobre, C.: Modeling the exchanges of energy, water, and carbon between continents and the atmosphere, Science, 275, 502–509, https://doi.org/10.1126/science.275.5299.502, 1997.
Skidmore, A. K., Pettorelli, N., Coops, N. C., Geller, G. N., Hansen, M., Lucas, R., Mücher, C. A., O'Connor, B., Paganini, M., Pereira, H. M., Schaepman, M. E., Turner, W., Wang, T., and Wegmann, M.: Environmental science: Agree on biodiversity metrics to track from space, Nature, 523, 403–405, https://doi.org/10.1038/523403a, 2015.
Smith, P. R.: Bilinear interpolation of digital images, Ultramicroscopy, 6, 201–204, https://doi.org/10.1016/0304-3991(81)90061-9, 1981.
Sulla-Menashe, D. and Friedl, M. A.: User Guide to Collection 6 MODIS Land Cover (MCD12Q1 and MCD12C1) Product, http://girps.net/wp-content/uploads/2019/03/MCD12_User_Guide_V6.pdf (last access: 21 December 2023), 2018.
Sun, Y., Knyazikhin, Y., She, X., Ni, X., Chen, C., Ren, H., and Myneni, R. B.: Seasonal and long-term variations in leaf area of Congolese rainforest, Remote Sens. Environ., 268, 112762, https://doi.org/10.1016/j.rse.2021.112762, 2022.
Tang, X., Wang, Z., Xie, J., Liu, D., Desai, A. R., Jia, M., Dong, Z., Liu, X., and Liu, B.: Monitoring the seasonal and interannual variation of the carbon sequestration in a temperate deciduous forest with MODIS time series data, Forest Ecol. Manage., 306, 150–160, https://doi.org/10.1016/j.foreco.2013.06.032, 2013.
Tian, Y., Zhang, Y., Knyazikhin, Y., Myneni, R. B., Glassy, J. M., Dedieu, G., and Running, S. W.: Prototyping of MODIS LAI and FPAR algorithm with LASUR and LANDSAT data, IEEE T. Geosci. Remote, 38, 2387–2401, https://doi.org/10.1109/36.868894, 2000.
Wang, J., Yan, K., Gao, S., Pu, J., Liu, J., Park, T., Bi, J., Maeda, E. E., Heiskanen, J., and Knyazikhin, Y.: Improving the Quality of MODIS LAI Products by Exploiting Spatiotemporal Correlation Information, IEEE T. Geosci. Remote, 61, 4402319, https://doi.org/10.1109/TGRS.2023.3264280, 2023.
Weiss, M., Baret, F., Garrigues, S., and Lacaze, R.: LAI and fAPAR CYCLOPES global products derived from VEGETATION. Part 2: validation and comparison with MODIS collection 4 products, Remote Sens. Environ., 110, 317–331, https://doi.org/10.1016/j.rse.2007.03.001, 2007.
Whitt, M. W. and Ulaby, F. T.: Radar response of periodic vegetation canopies, Int. J. Remote Sens., 15, 1813–1848, https://doi.org/10.1080/01431169408954211, 1994.
Xiao, Z., Liang, S., Wang, J., Chen, P., Yin, X., Zhang, L., and Song, J.: Use of General Regression Neural Networks for Generating the GLASS Leaf Area Index Product From Time-Series MODIS Surface Reflectance, IEEE T. Geosci. Remote, 52, 209–223, https://doi.org/10.1109/TGRS.2013.2237780, 2014.
Xu, B., Park, T., Yan, K., Chen, C., Zeng, Y., Song, W., Yin, G., Li, J., Liu, Q., Knyazikhin, Y., and Myneni, R.: Analysis of Global LAI/FPAR Products from VIIRS and MODIS Sensors for Spatio-Temporal Consistency and Uncertainty from 2012–2016, Forests, 9, 2, https://doi.org/10.3390/f9020073, 2018.
Xu, B., Li, J., Park, T., Liu, Q., Zeng, Y., Yin, G., Yan, K., Chen, C., Zhao, J., and Fan, W.: Improving leaf area index retrieval over heterogeneous surface mixed with water, Remote Sens. Environ., 240, 111700, https://doi.org/10.1016/j.rse.2020.111700, 2020.
Xu, L., Li, B., Yuan, Y., Gao, X., and Zhang, T.: A temporal-spatial iteration method to reconstruct NDVI time series datasets, Remote Sens., 7, 8906–8924, https://doi.org/10.3390/rs70708906, 2015.
Yan, K., Park, T., Yan, G., Chen, C., Yang, B., Liu, Z., Nemani, R., Knyazikhin, Y., and Myneni, R.: Evaluation of MODIS LAI/FPAR Product Collection 6. Part 1: Consistency and Improvements, Remote Sens., 8, 5, https://doi.org/10.3390/rs8050359, 2016.
Yan, K., Park, T., Chen, C., Xu, B., Song, W., Yang, B., Zeng, Y., Liu, Z., Yan, G., and Knyazikhin, Y.: Generating global products of lai and fpar from snpp-viirs data: Theoretical background and implementation, IEEE T. Geosci. Remote, 56, 2119–2137, https://doi.org/10.1109/TGRS.2017.2775247, 2018.
Yan, K., Pu, J., Park, T., Xu, B., Zeng, Y., Yan, G., Weiss, M., Knyazikhin, Y., and Myneni, R. B.: Performance stability of the MODIS and VIIRS LAI algorithms inferred from analysis of long time series of products, Remote Sens. Environ., 260, 112438, https://doi.org/10.1016/j.rse.2021.112438, 2021a.
Yan, K., Zhang, Y., Tong, Y., Zeng, Y., Pu, J., Gao, S., Li, L., Mu, X., Yan, G., and Rautiainen, M.: Modeling the radiation regime of a discontinuous canopy based on the stochastic radiative transport theory: Modification, evaluation and validation, Remote Sens. Environ., 267, 112728, https://doi.org/10.1016/j.rse.2021.112728, 2021b.
Yan, K., Zou, D., Yan, G., Fang, H., Weiss, M., Rautiainen, M., Knyazikhin, Y., and Myneni, R. B.: A Bibliometric Visualization Review of the MODIS LAI/FPAR Products from 1995 to 2020, J. Remote Sens., 2021, 7410921, https://doi.org/10.34133/2021/7410921, 2021c.
Yang, W., Tan, B., Huang, D., Rautiainen, M., Shabanov, N. V., Wang, Y., Privette, J. L., Huemmrich, K. F., Fensholt, R., and Sandholt, I.: MODIS leaf area index products: From validation to algorithm improvement, IEEE T. Geosci. Remote, 44, 1885–1898, https://doi.org/10.1109/TGRS.2006.871215, 2006.
Zhang, H., Liu, L., He, W., and Zhang, L.: Hyperspectral image denoising with total variation regularization and nonlocal low-rank tensor decomposition, IEEE T. Geosci. Remote, 58, 3071–3084, https://doi.org/10.1109/TGRS.2019.2947333, 2019.
Zhang, Y., Song, C., Band, L. E., Sun, G., and Li, J.: Reanalysis of global terrestrial vegetation trends from MODIS products: Browning or greening?, Remote Sens. Environ., 191, 145–155, https://doi.org/10.1016/j.rse.2016.12.018, 2017.
Zheng, Y.-B., Huang, T.-Z., Zhao, X.-L., Jiang, T.-X., Ma, T.-H., and Ji, T.-Y.: Mixed noise removal in hyperspectral image via low-fibered-rank regularization, IEEE T. Geosci. Remote, 58, 734–749, https://doi.org/10.1109/TGRS.2019.2940534, 2019.
Zhou, J., Jia, L., and Menenti, M.: Reconstruction of global MODIS NDVI time series: Performance of Harmonic ANalysis of Time Series (HANTS), Remote Sens. Environ., 163, 217–228, https://doi.org/10.1016/j.rse.2015.03.018, 2015.
Zhu, W., Pan, Y., He, H., Wang, L., Mou, M., and Liu, J.: A changing-weight filter method for reconstructing a high-quality NDVI time series to preserve the integrity of vegetation phenology, IEEE T. Geosci. Remote, 50, 1085–1094, https://doi.org/10.1109/TGRS.2011.2166965, 2011.
Zou, D., Yan, K., Pu, J., Gao, S., Li, W., Mu, X., Knyazikhin, Y., and Myneni, R. B.: Revisit the Performance of MODIS and VIIRS Leaf Area Index Products from the Perspective of Time-series Stability, IEEE J. Sel. Top. Appl., 15, 8958–8973, https://doi.org/10.1109/JSTARS.2022.3214224, 2022.