the Creative Commons Attribution 4.0 License.
the Creative Commons Attribution 4.0 License.
 | 15 Mar 2024
A regolith lead isoscape of Australia
Candan U. Desem
Patrice de Caritat
Jon Woodhead
Roland Maas
Graham Carr
We present the first national-scale lead (Pb) isotope maps of Australia based on surface regolith for five isotope ratios, , , , , and , determined by single-collector sector field inductively coupled plasma mass spectrometry after an ammonium acetate leach followed by aqua regia digestion. The dataset is underpinned principally by the National Geochemical Survey of Australia (NGSA) archived floodplain sediment samples. We analysed 1219 samples (0–10 cm depth, <2 mm grain size), collected near the outlet of 1119 large catchments covering 5.647×10⁶ km2 (∼75 % of Australia). The samples consist of mixtures of the dominant soils and rocks weathering in their respective catchments (and possibly those upstream) and are therefore assumed to form a reasonable representation of the average isotopic signature of those catchments. This assumption was tested in one of the NGSA catchments, within which 12 similar samples were also taken; results show that the Pb isotope ratios of the NGSA catchment outlet sediment sample are close to the average of the 12 upstream sub-catchment samples. National minimum, median, and maximum values were 15.56, 18.84, and 30.64 for ; 14.36, 15.69, and 18.01 for ; 33.56, 38.99, and 48.87 for ; 0.5880, 0.8318, and 0.9847 for ; and 1.4149, 2.0665, and 2.3002 for , respectively. The new dataset was compared with published bedrock and ore Pb isotope data, and it was found to dependably represent crustal elements of various ages from Archaean to Phanerozoic. This suggests that floodplain sediment samples are a suitable proxy for basement and basin geology at this scale, despite various degrees of transport, mixing, and weathering experienced in the regolith environment, locally over protracted periods of time. An example of atmospheric Pb contamination around Port Pirie, South Australia, where a Pb smelter has operated since the 1890s, is shown to illustrate potential environmental applications of this new dataset. Other applications may include elucidating details of Australian crustal evolution and mineralisation-related investigations. The new regolith Pb isotope dataset for Australia is publicly available (Desem et al., 2023; https://doi.org/10.26186/5ea8f6fd3de64).
- Article
(10315 KB) - Full-text XML
- BibTeX
- EndNote


Isoscapes – isotopic maps of landscapes – are increasingly used as tools to address a wide range of research questions in fields as diverse as hydrochemistry (e.g., Bowen et al., 2009), forensic studies (e.g., Chesson et al., 2014), and tracking animal migrations (e.g., Hobson et al., 2010). Isotopic maps of the element strontium (Sr) in particular, often constructed at large scale, are finding increasing utility in provenance studies (e.g., Adams et al., 2019; Willmes et al., 2018; Bataille et al., 2020; Scaffidi and Knudson, 2020; de Caritat et al., 2022, 2023). The utility of Sr in this regard stems from its high bioavailability, coupled with its relative ease of isotopic determination in soil, water, and animal and plant tissue.
One limitation of Sr as a tracer is that it has only one radiogenic isotope ratio (); hence, a single isotopic determination on a target material may match multiple natural occurrences of that value across an isoscape. In contrast, the element lead (Pb) offers greater resolving potential; its isotopic composition is the result of three independent radioactive decay chains, producing effectively “three tracers in one” and, as a result, much greater potential for accurate source attribution. Pb isotopes have, in fact, been used for many decades in provenance determination where metallic archaeological objects such as coins, shipwreck anchors, lead ingots, etc., have been traced to the likely sources from which their ores were mined (e.g., Gale and Stos-Gale, 2000). A similar methodology has been applied to track the origin of basaltic stone tools (e.g., Weisler and Woodhead, 1995). Pb is also a relatively bioavailable element, with well-known adverse effects on human health due to its cumulative toxicity and widespread use, and Pb isotopes have been used extensively to track the sources of Pb in humans (e.g., Gulson, 2008).
These existing Pb isotope studies, however, typically rely on matching samples to known point sources and, as such, do not employ the full predictive power of isoscapes, e.g. allowing for the estimation of likely values for regions that do not have high sampling density. While Sr isoscapes are now in widespread use, the major impediment to the construction of continental-scale Pb isotope maps is primarily an analytical one: Pb isotope analysis traditionally requires exacting clean-room chemistry and specialised mass spectrometry procedures, and it is correspondingly more expensive and time-consuming than Sr isotope analysis. As a result, very few large-scale, empirical Pb isotope isoscapes have been constructed – an agricultural soil map of Europe (Reimann et al., 2012) and a tooth enamel study in Britain (Evans et al., 2022) being major exceptions – with ongoing but smaller-scale studies in various other countries aimed at tracking anthropogenic contaminants (e.g., Bing-Quan et al., 2002; Zuluaga et al., 2017), determining the provenance of cultural materials (e.g., Hsu and Sabatini, 2019), and isotopic changes in blood and teeth associated with migration between countries (Gulson et al., 1997, 2003; Gulson, 2008).
In this study, we release the first regolith Pb isoscapes constructed on a large scale for the Australian continent. Based upon surface regolith samples collected during the National Geochemical Survey of Australia (NGSA; https://www.ga.gov.au/ngsa, last access: 13 March 2024; de Caritat and Cooper, 2011, 2016; de Caritat, 2022), these isoscapes are underpinned by a relatively dense and homogeneous distribution of sampling sites across the continent (Fig. 1). This work was made possible by technological developments allowing for both rapid and precise Pb isotope analysis of large sample sets using an analytical method recently described in Desem et al. (2022) and summarised below. The major advantage of this protocol over traditional methodologies for Pb isotope analysis is it does not require matrix separation, thus greatly streamlining the analysis of large sample sets.
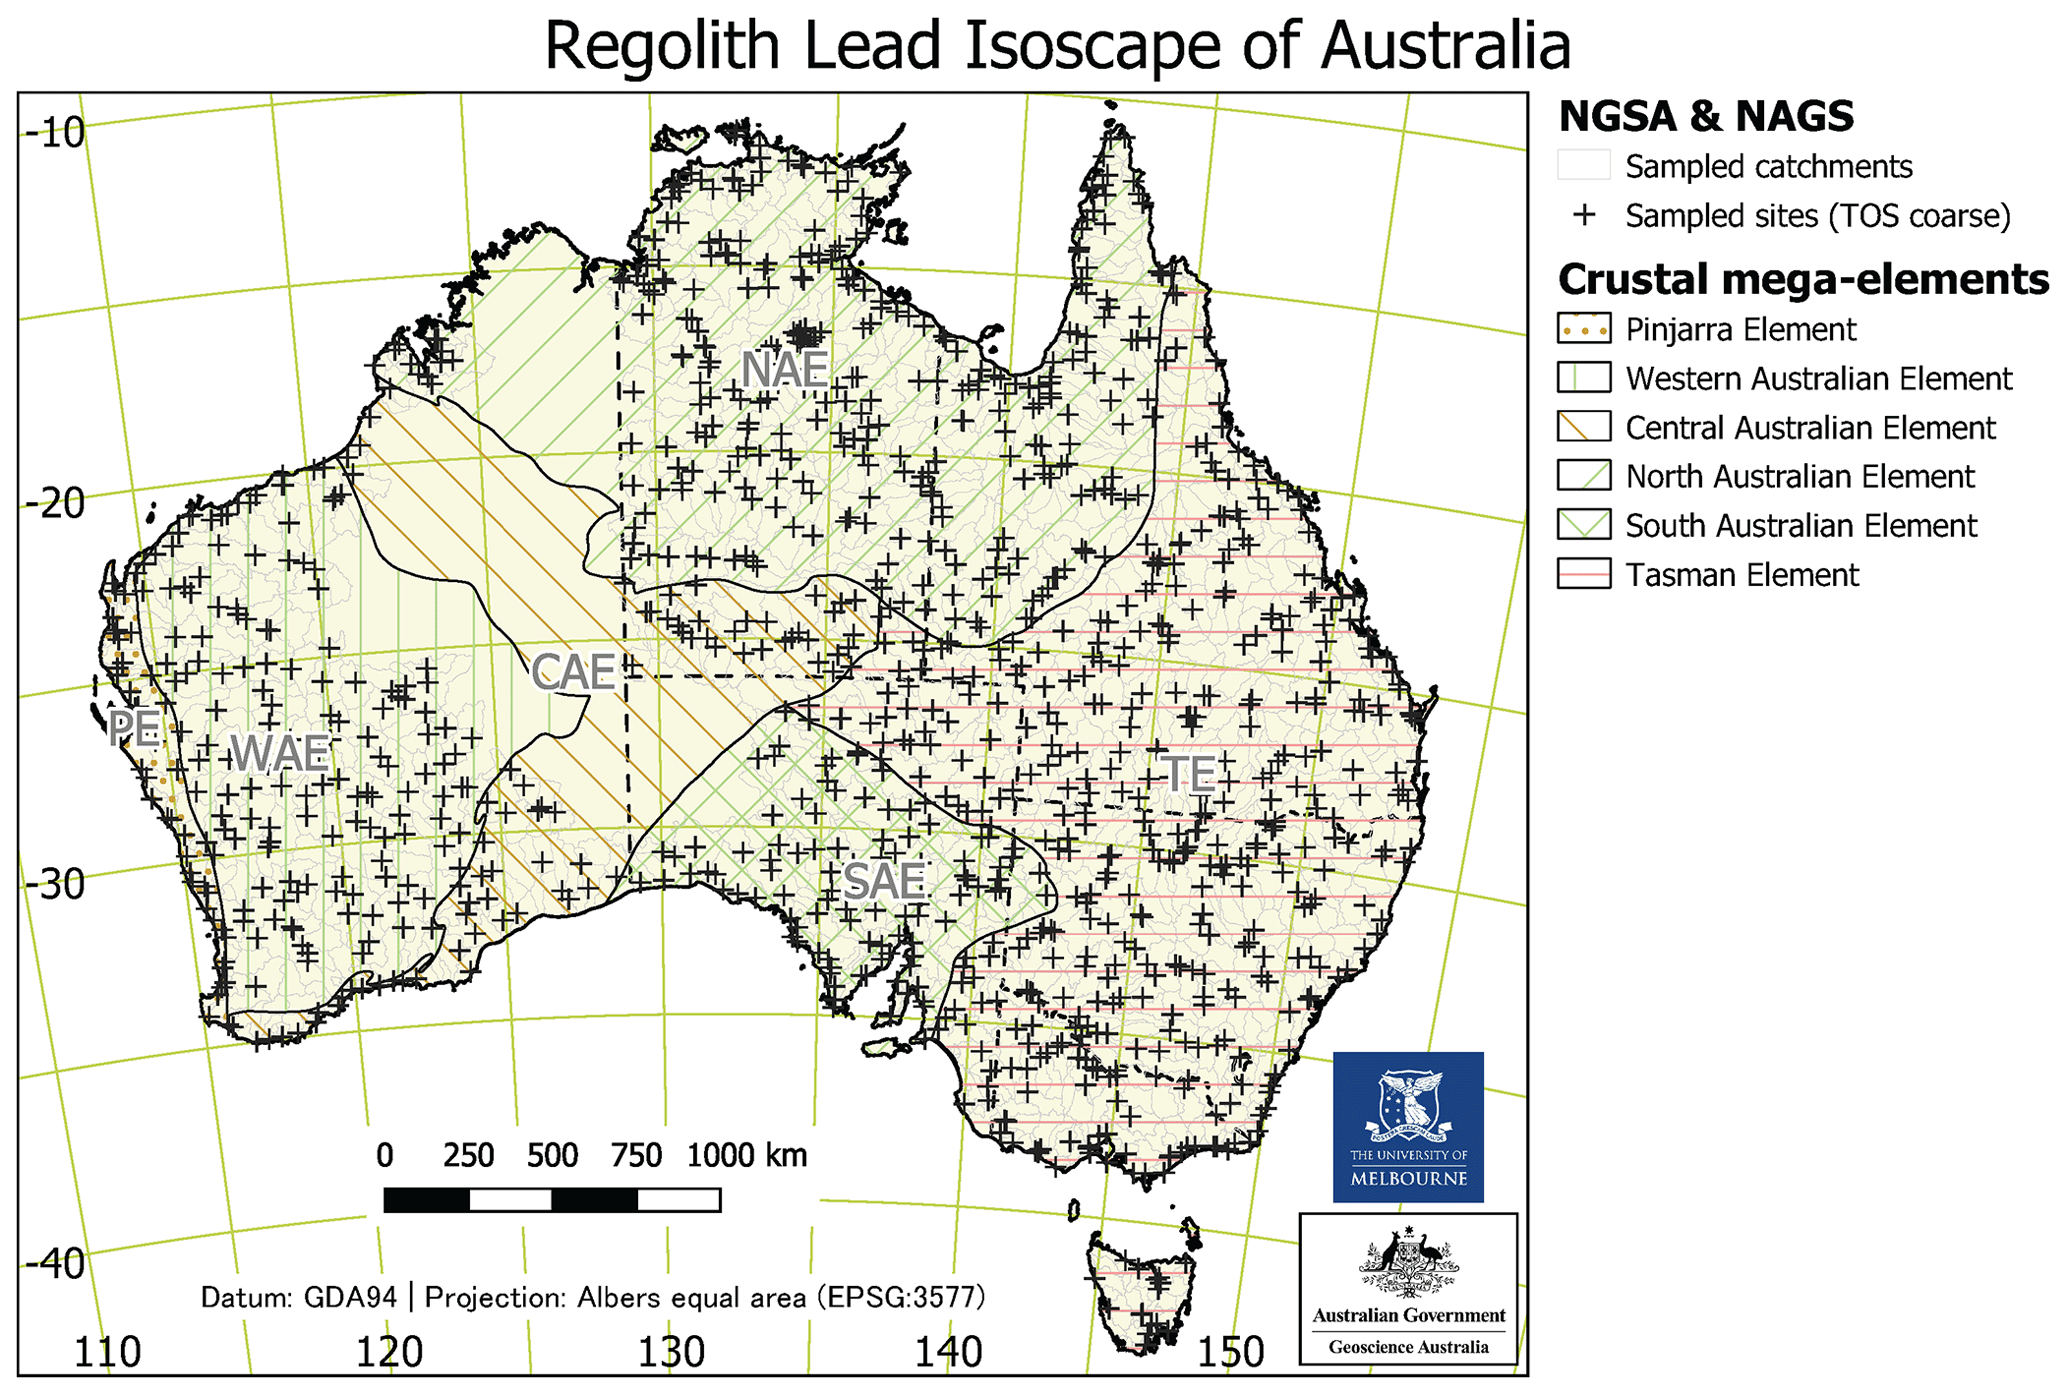
Figure 1Map showing the location of the National Geochemical Survey of Australia (NGSA) and Northern Australia Geochemical Survey (NAGS) sampling sites (black crosses) and NGSA catchments (grey polygons) (de Caritat and Cooper, 2011; Main et al., 2019) overlain by crustal mega-elements (polygons with hatching) (Shaw et al., 1998). The mega-elements are labelled as follows (west to east). PE: Pinjarra Element; WAE: Western Australian Element; CAE: Central Australian Element; NAE: North Australian Element; TE: Tasman Element.
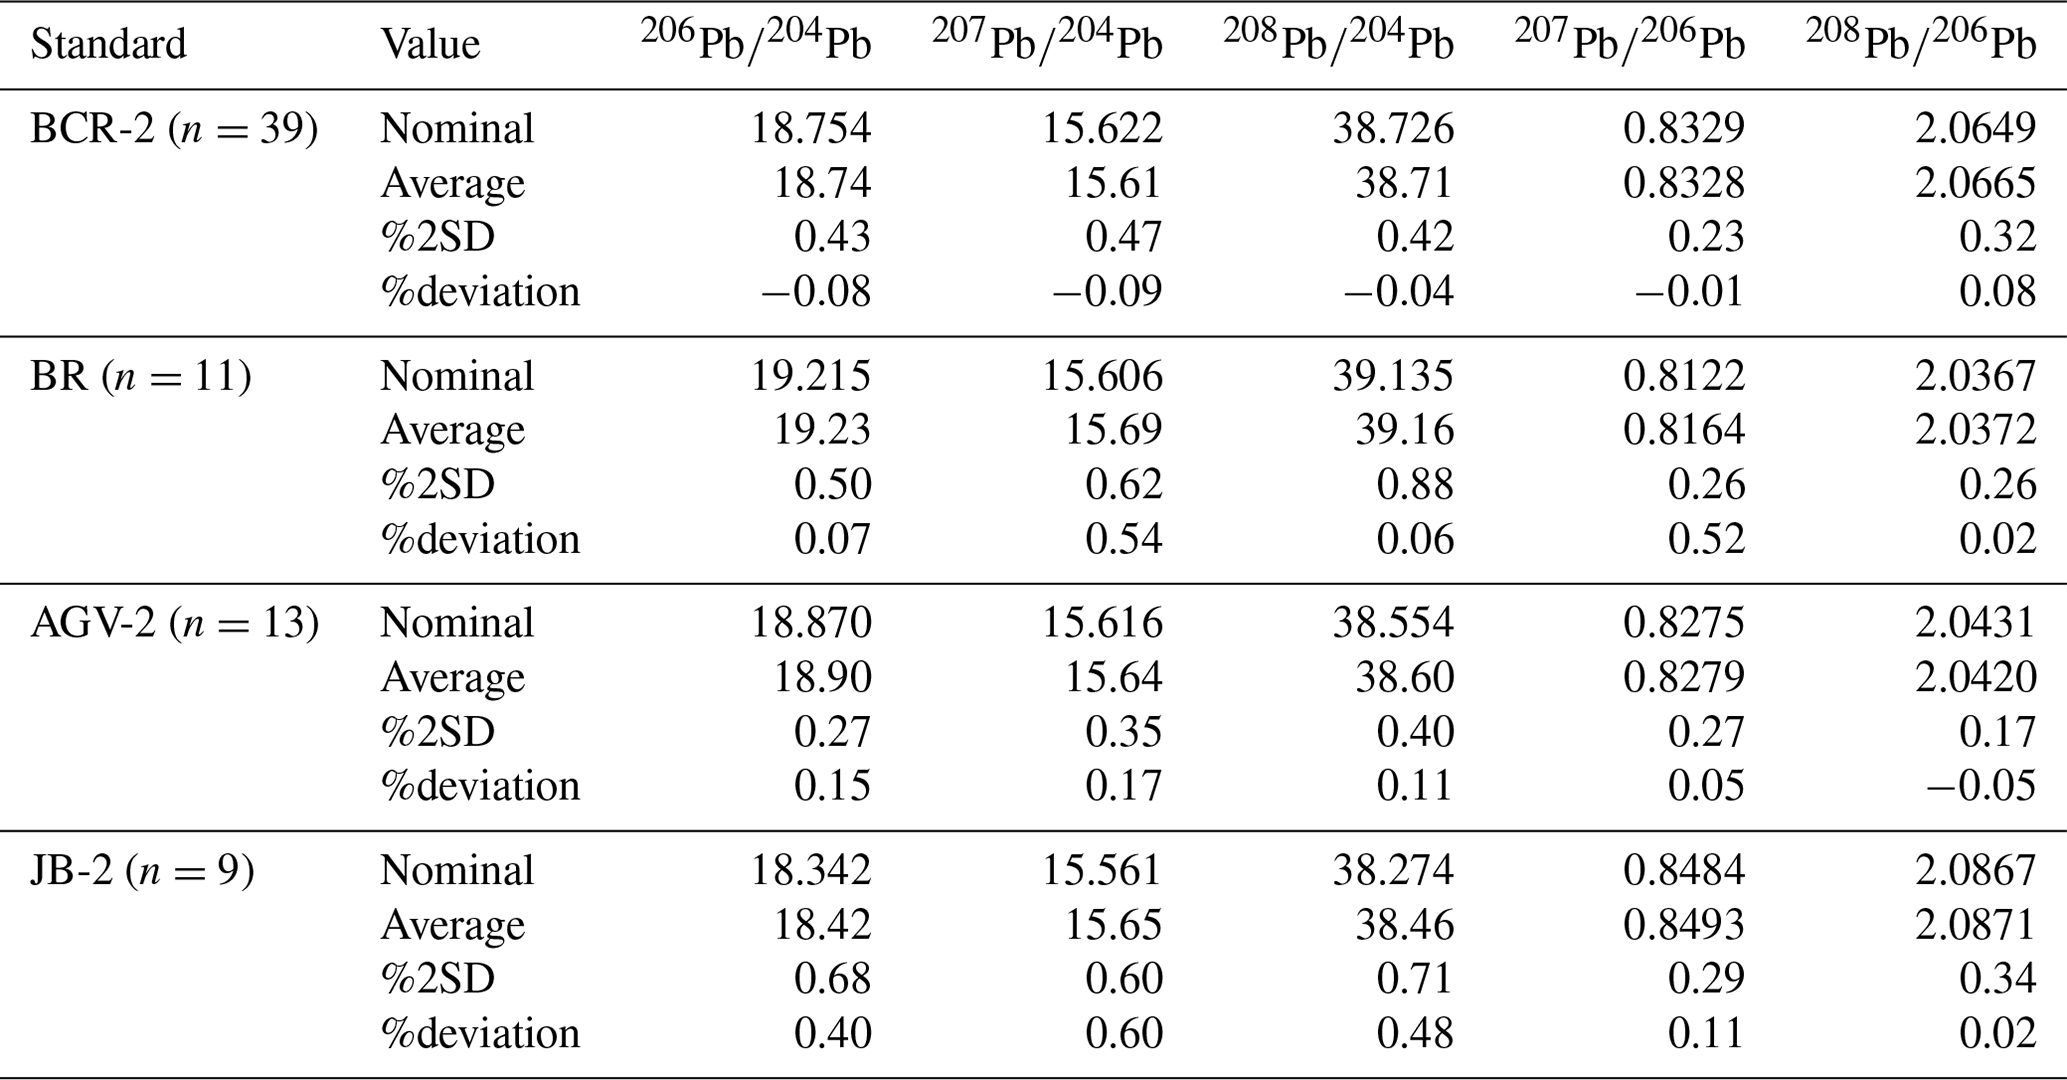
Table 1Pb isotope data obtained for geological reference materials run concurrently with the analyses reported in this paper and employed as secondary standards. Nominal values are derived from GeoREM (Jochum et al., 2007).
2.1 Materials
Our study principally utilises “catchment outlet sediment” samples originally collected from two depths (top outlet sediment, or TOS, from 0 to 10 cm depth, and bottom outlet sediment, or BOS, from, on average, 60 to 80 cm depth) during the NGSA project (de Caritat and Cooper, 2011, 2016; de Caritat, 2022), which covered ∼80 % of the Australian continent (for details on sample collection, see Lech et al., 2007). At Geoscience Australia, freshly collected samples were air dried at 40 °C for a minimum of 48 h (or to constant mass), homogenised, and reduced by riffle splitting, with half of each sample set aside in an archive for future investigations, and the other half was prepared for various analyses (for details on sample preparation, see de Caritat et al., 2009). A bulk split was retained for mineralogical analyses, another was sieved to a coarse (<2 mm) grain-size fraction, and yet another was sieved to a fine (<75 µm) grain-size fraction. The latter two fractions of both depths were then further prepared for the comprehensive geochemical analysis programme of the NGSA (for details on sample analysis, see de Caritat et al., 2010). Here, 1204 NGSA TOS coarse samples from 1098 catchments were used, with three of them analysed twice for a total of 1207 analyses. Twelve additional TOS coarse samples collected in a similar manner to the NGSA samples (from 0 to 10 cm depth and sieved to <2 mm) during the Northern Australia Geochemical Survey, or NAGS (Main et al., 2019), were included in this study, giving a total of 1219 TOS coarse analyses underpinning the present isoscapes. In addition to the above, 16 NGSA TOS fine (<75 µm) and 16 NGSA BOS coarse (<2 mm) samples were also analysed. Although these data are released herewith for the sake of completeness, they are not discussed further.
2.2 Methods
For the purpose of the Pb isotope analyses, conducted at The University of Melbourne, the TOS coarse fractions from the NGSA project were utilised. All samples to be analysed were subjected to a two-step sequential leaching protocol designed to minimise and isolate any anthropogenic overprints on the primary Pb isotope data. In the first step, an ammonium acetate (AmAc) leach, developed at CSIRO and described in Carr et al. (2011), was applied to extract and remove any labile or loosely bound/adsorbed components. Splits of ∼1.2 g of sample were mixed with 6 mL of a 1:1 mixture of ultrapure water and ammonium acetate buffer solution (AmAc; pH ∼5). The soil / leach solution mix was shaken and left to react at 20 °C for 15 h. Following centrifuging (4.5 min at 3000 rpm), a clear supernatant solution – the “AmAc leach” or “A” sample – was pipetted off and dried in a high-efficiency particulate air (HEPA)-filtered fume hood. In the second step, the remaining undigested sample was subjected to an aqua regia (AR, 3:1 HCl:HNO3) acid attack to digest most (though not all) of the more refractory components of the samples. Following an ultrapure-water rinse of the residual soil, 3 mL AR solution was added, and the material was shaken and again left to react at 20 °C for 15 h. After centrifuging, the clear supernatant solution – the “AR digest” or “B” sample – was removed and dried in the HEPA-filtered fume hood. The lead isotope analyses discussed in this study were performed on the AR digest, although additional AmAc results are also provided for a subset of samples but are not discussed further.
Table 2Summary statistics of the Pb isotope data obtained from 1207 National Geochemical Survey of Australia (NGSA) and 12 Northern Australia Geochemical Survey (NAGS) TOS coarse analyses by aqua regia digestion following ammonium acetate leach (n=1219). See the main text for further details.
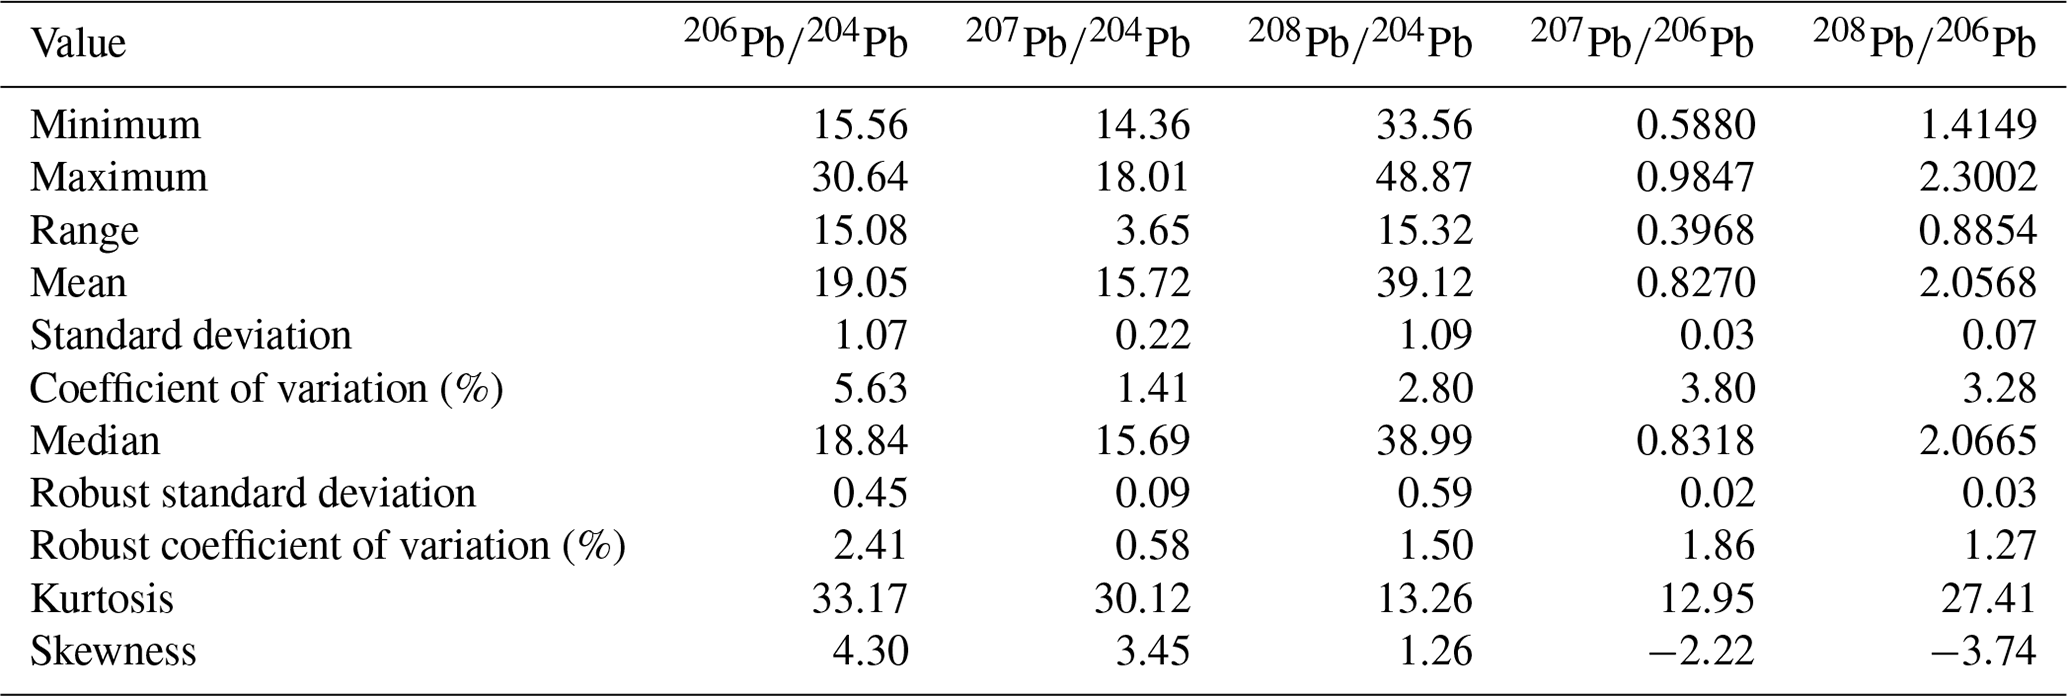
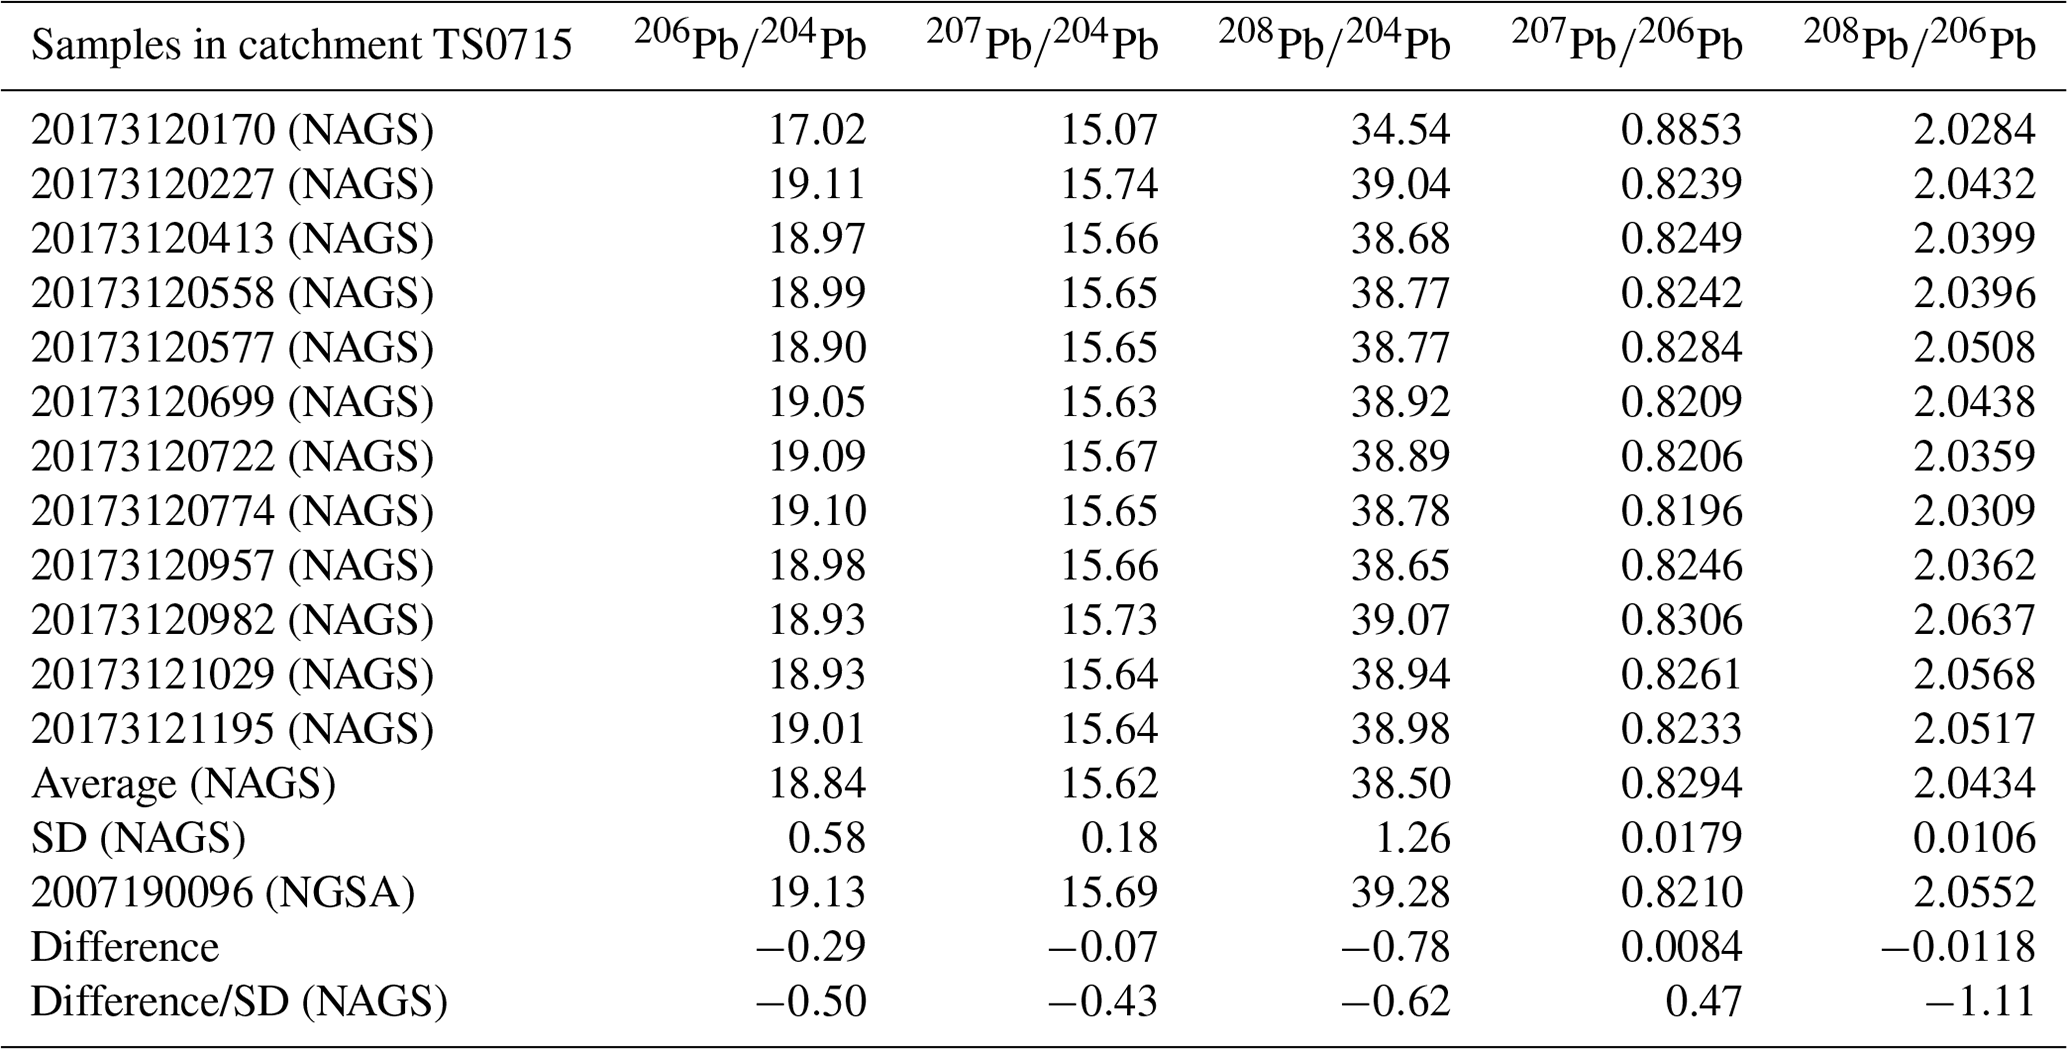
Table 3Pb isotope data obtained from 12 Northern Australia Geochemical Survey (NAGS) samples in catchment TS0715 compared to the National Geochemical Survey of Australia (NGSA) catchment outlet sample for the same catchment. The “Difference” (Average NAGS minus NGSA) is shown as absolute values and normalised to the standard deviation (SD) of the NAGS values. See the main text for further details.
Lead isotope analyses followed procedures described in Desem et al. (2022) and are briefly outlined below. Importantly, the methodology allows for the analysis of samples without prior matrix removal, greatly improving sample throughput. Analyses were performed using a Nu Instruments Attom SF-ICP-MS (sector field inductively coupled plasma mass spectrometer). Dried soil digests were redissolved in 2 % HNO3 run solutions containing admixed high-purity thallium (1 ppb Tl), and they were diluted to provide ∼1 ppb Pb in solution. Following the method of Woodhead (2002), addition of natural, Pb-free Tl (with a nominal of 2.3871) allowed for the correction of instrumental mass bias effects during Pb isotope analyses. Analyses of the National Institute of Standards and Technology (NIST) common lead isotopic Standard Reference Material (SRM) 981 (certificate of analysis available at https://tsapps.nist.gov/srmext/certificates/archives/981.pdf; last access: 4 February 2024) interspersed throughout the unknown analyses were used to update the long-term Pb vs. Tl master correlations. Pb blanks for the combined leaching and chemical procedures were typically <100 pg and are considered negligible relative to the amount of Pb being processed (typically hundreds of ng); as a result, no blank corrections have been made. A small number of samples with low Pb concentrations exhibited very low signal sizes during analysis, resulting in correspondingly high analytical uncertainties. Samples producing within-run uncertainties of >1 % relative (measured on the ratio) were discarded as being insufficiently precise to contribute meaningfully to the dataset.
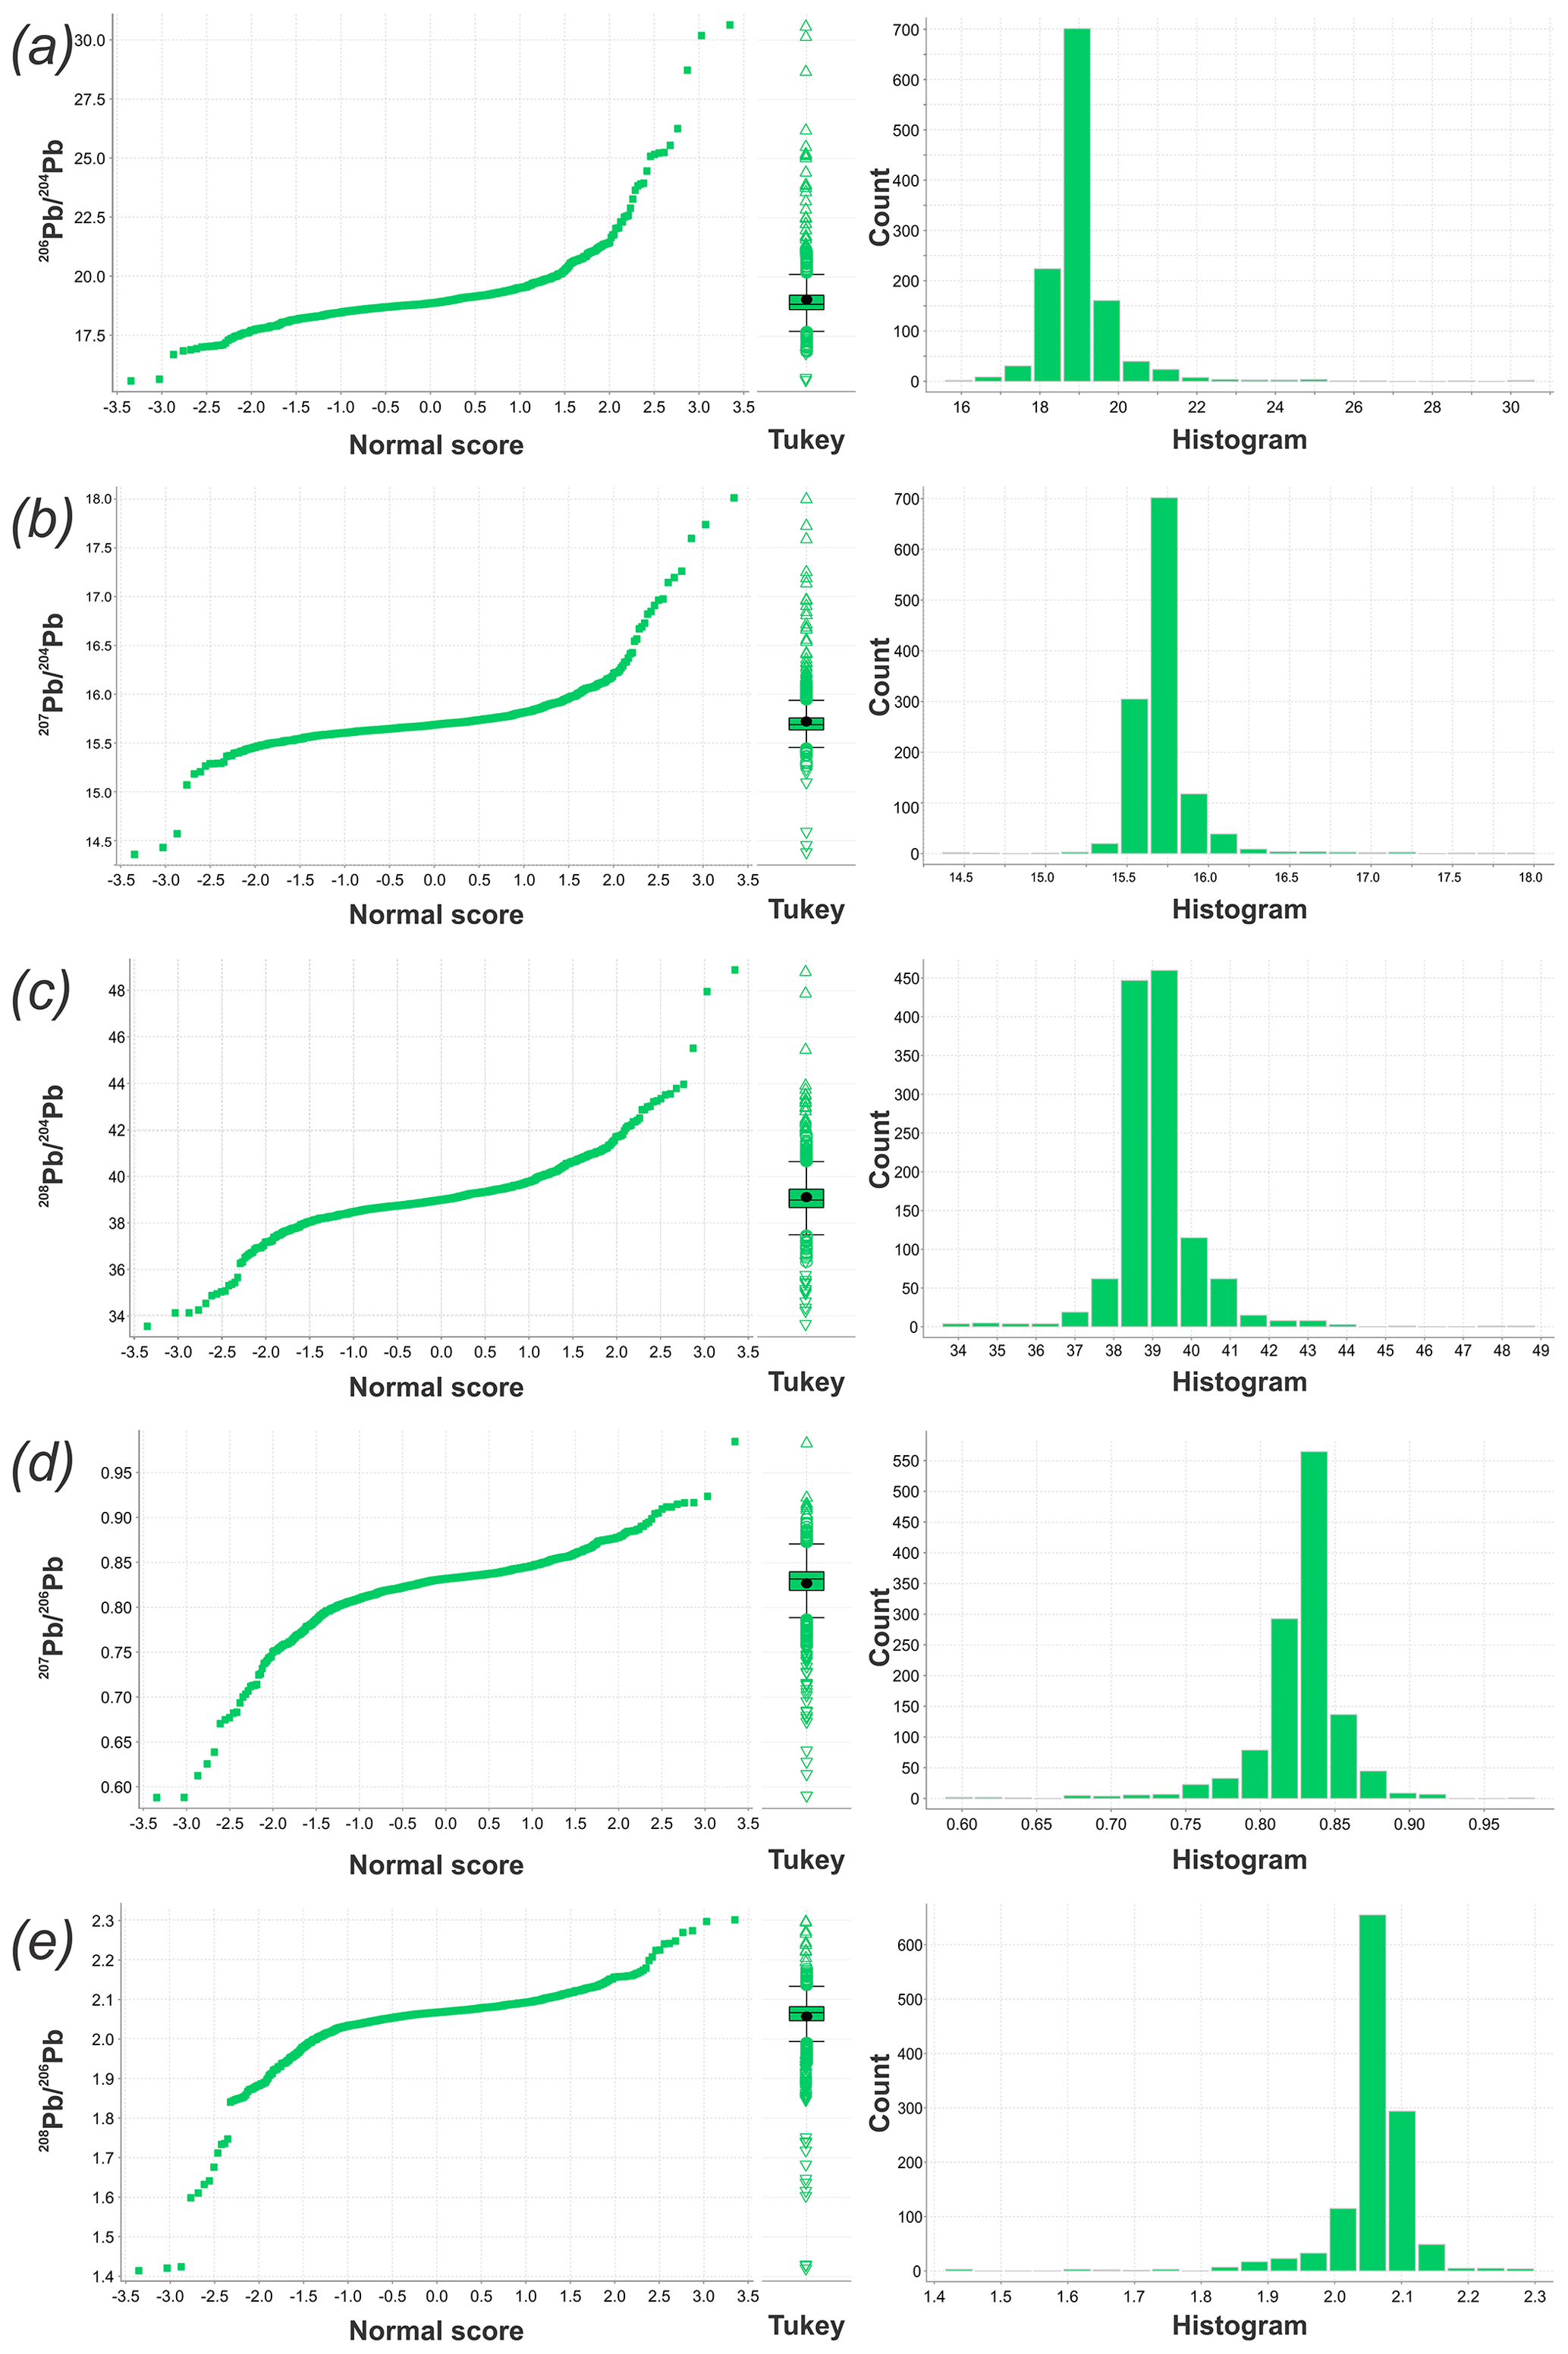
Figure 2Normal score, Tukey boxplot, and histogram distributions for (a) , (b) , (c) , (d) , and (e) isotope ratios obtained for Australian TOS coarse samples by aqua regia digestion following an ammonium acetate leach (n=1219). Mean, outlier, and far outlier values are shown on the Tukey boxplots as dots, circles, and triangles, respectively. See the main text for further details.
2.3 Quality assessment
Although previous studies using the Attom SF-ICP-MS technique (e.g., Newman and Georg, 2012) used sample–standard bracketing techniques to correct for instrumental mass bias during Pb isotope analysis, in this study Tl doping was found to produce more precise, accurate, and reproducible results. As the NIST SRM 981 was used to establish the Pb-Tl calibration (see above), SRM 981 values could not be used to assess analytical accuracy. Averages obtained for a variety of other, secondary reference materials measured during the course of this study, however, are consistent with accepted values (see Table 1), providing confidence in the analysis of unknowns.
Table 4Regolith Pb isotope ratios from this study, averaged for each of the mega-crustal elements (Shaw et al., 1998) compared with ore Pb signatures and Stacey–Kramers model ages from Huston et al. (2019, 2021).
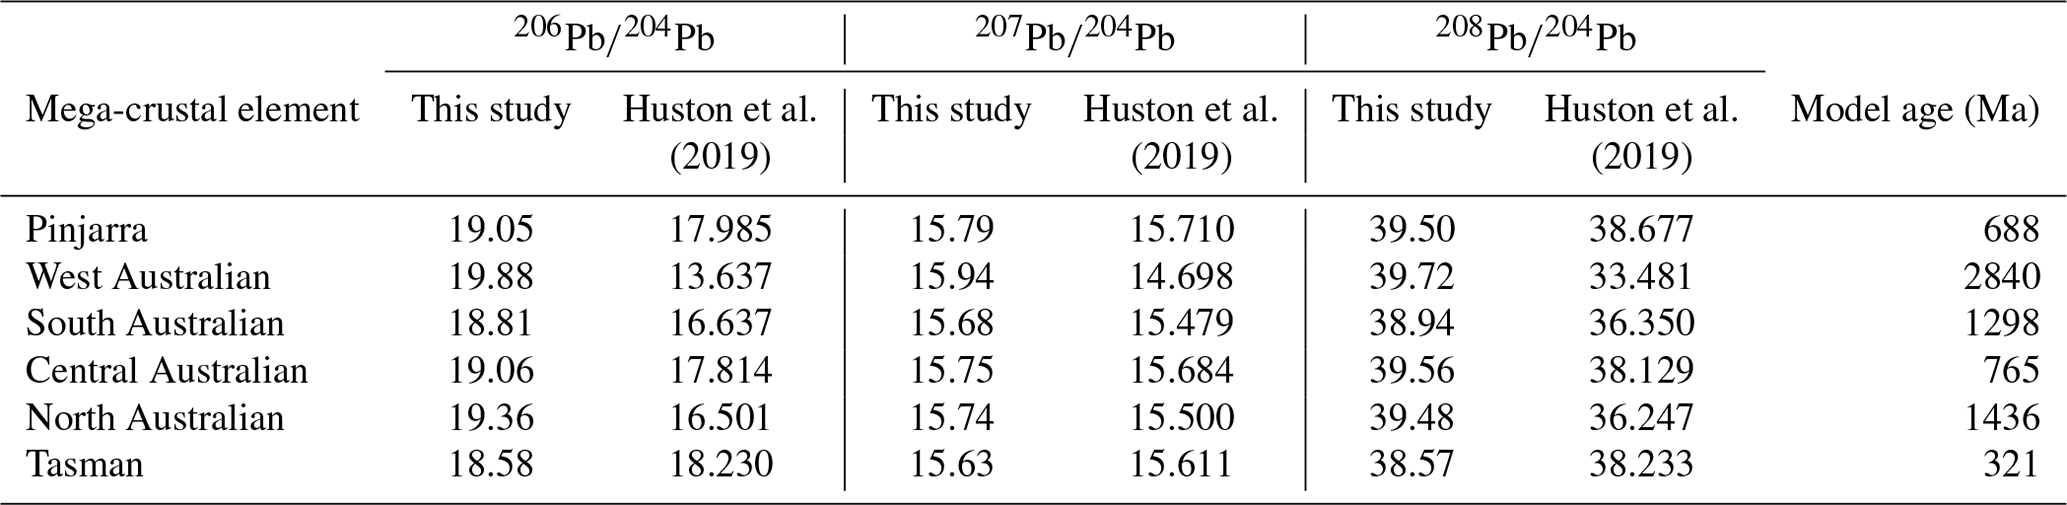
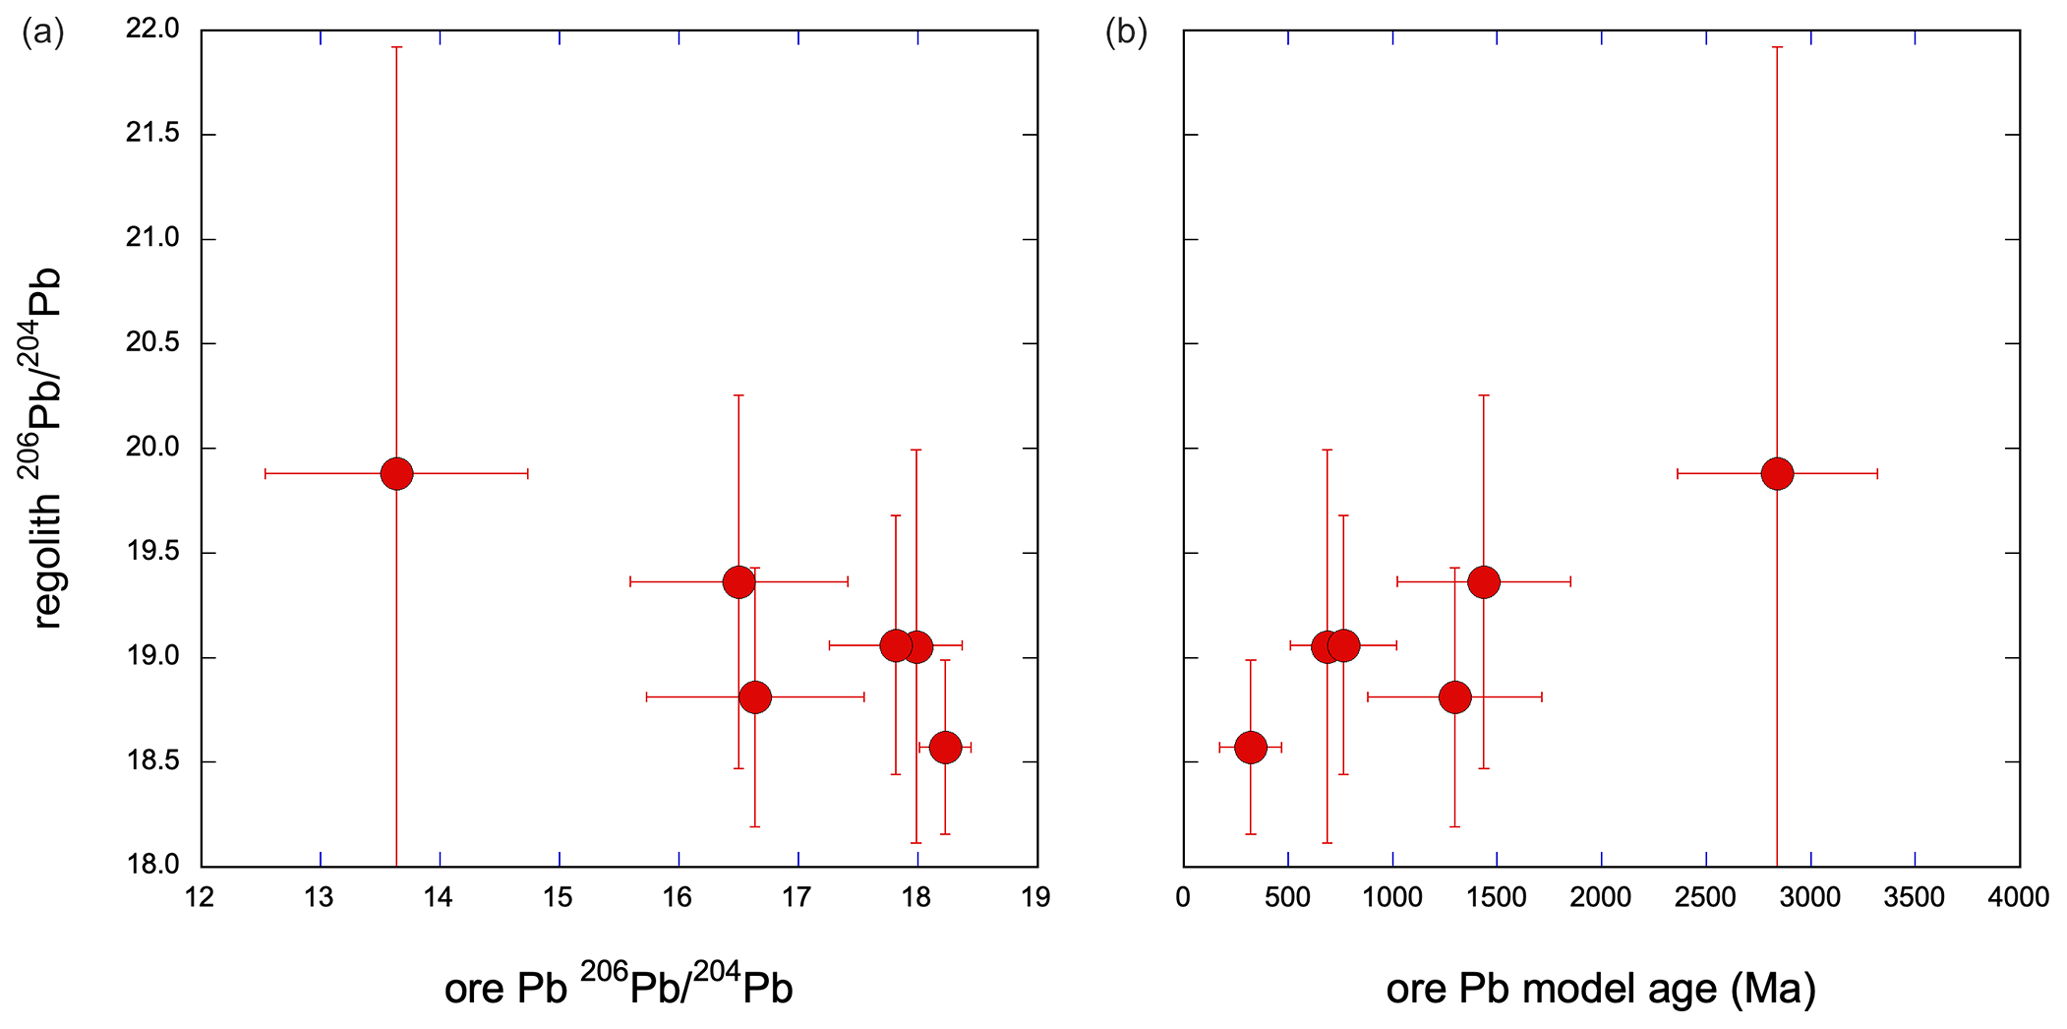
Figure 3Regolith vs. ore Pb isotope averages for each mega-crustal element (a) and vs. model ages (b) derived for these from ore Pb data (Huston et al., 2019, 2021).
We see very good agreement between our SF-ICP-MS data and nominally accepted values for the well-known and described reference materials BCR-2 and AGV-2 (both produced by the United States Geological Survey). Agreement was slightly poorer for the two other reference materials utilised – BR (produced by the Centre de Recherches Pétrographiques et Géochimiques, CRPG, Nancy) and JB-2 (produced by the Japanese Geological Survey) – especially for 207Pb-based ratios. But these have been relatively little studied, and at least some of this variation may therefore be the result of uncertainty in assigned literature values. Based upon the data for the BCR-2 and AGV-2 reference materials, for which we have the most analyses and for which accepted values are more robust, our accuracy is estimated to be typically <0.17 %. More detailed assessments of data quality, including comparisons with other instrumental techniques for Pb isotope analysis, can be found in Desem et al. (2022) and are not reiterated here.
One hundred and six field duplicate sample pairs (NGSA field duplicates, collected at a median distance of ∼100 m from one another on the same landscape unit; see Cooper et al., 2010) were analysed using the TOS <2 mm sample and returned median relative standard deviations for ratios , , , , and of 0.50 %, 0.24 %, 0.43 %, 0.30 %, and 0.34 %, respectively. The relative standard deviations from field duplicates includes natural variability (mineralogical/chemical heterogeneity of the alluvial deposit), as well as sample collection, preparation, and analysis uncertainties. Overall, we consider that the quality of the data presented herein is adequate for the purpose of constructing isoscapes at the regional scale.
2.4 Data presentation
Data management and analysis, including visualisation, were performed using Microsoft Excel (v.2306), Imdex ioGAS (v.8.0), and open-source software QGIS (v.3.16).
3.1 Statistics
The overall results obtained in this study are summarised in Table 2. Normal score, Tukey boxplot, and histogram distributions of the , , , , and ratios are shown in Fig. 2. It can be seen that these distributions are fairly normal (Gaussian or balanced about the median), tight (small interquartile ranges or boxes, and widespread lower and upper quartiles), and with variable kurtosis and skewness.
3.2 Validation
3.2.1 Intra-catchment variation
One NGSA catchment was also sampled at higher resolution by several NAGS samples, providing an opportunity to test the fundamental assumption underpinning the catchment-based sampling strategy of the NGSA, namely that one catchment outlet sediment sample fairly represents an average value for the whole catchment. In this case, NGSA sample 2007190096 is from the Newcastle Creek catchment (TS0715), approximately 100 km northeast of Elliott in the Northern Territory (NT), which was also sampled by 12 NAGS samples. The mean of these 12 NAGS samples is within 0.62 standard deviation of the singular catchment-outlet NGSA value for , , , and ; for the isotopic ratio , it is within 1.11 standard deviation (Table 3). All samples are TOS coarse fractions digested in AR after an AmAc leach as described above. The comparison supports the premise of the NGSA sampling strategy, namely that catchment outlet sediments are geochemically and mineralogically representative of their overall catchment, yet of course recognises that intra-catchment variation is occurring and can be significant.
3.2.2 Regional scale isotopic variation
The regolith Pb isotope data, at the continental scale, are clearly governed by major crustal boundaries. At the highest level, this is reflected in the more radiogenic signatures (e.g., higher ratios) in older terranes (i.e., west and northern Australia) compared with less radiogenic signatures of younger terranes (Tasman and New England Fold belts), but it is also visible in data averages calculated for each of the crustal elements indicated in Fig. 1 and Table 4. At this scale, the and isotope signatures exhibit the greatest variation since most 235U decayed early in Earth's history; thus, changes in are more subdued compared to variations in the and signatures.
Regolith-derived data averages also broadly correlate with initial Pb signatures derived from a compilation of ore Pb data (Huston et al., 2019, 2021) and the terrane model ages derived from these data (Fig. 3).
Figure 4Regolith Pb isoscape of Australia for with data points (AR digestion of TOS coarse samples) classed by quantiles and overlain on an IDW interpolation raster classed identically. The red rectangle indicates the location of Fig. 9. See the main text for further details.

Figure 5Regolith Pb isoscape of Australia for with data points (AR digestion of TOS coarse samples) classed by quantiles and overlain on an IDW interpolation raster classed identically. See the main text for further details.
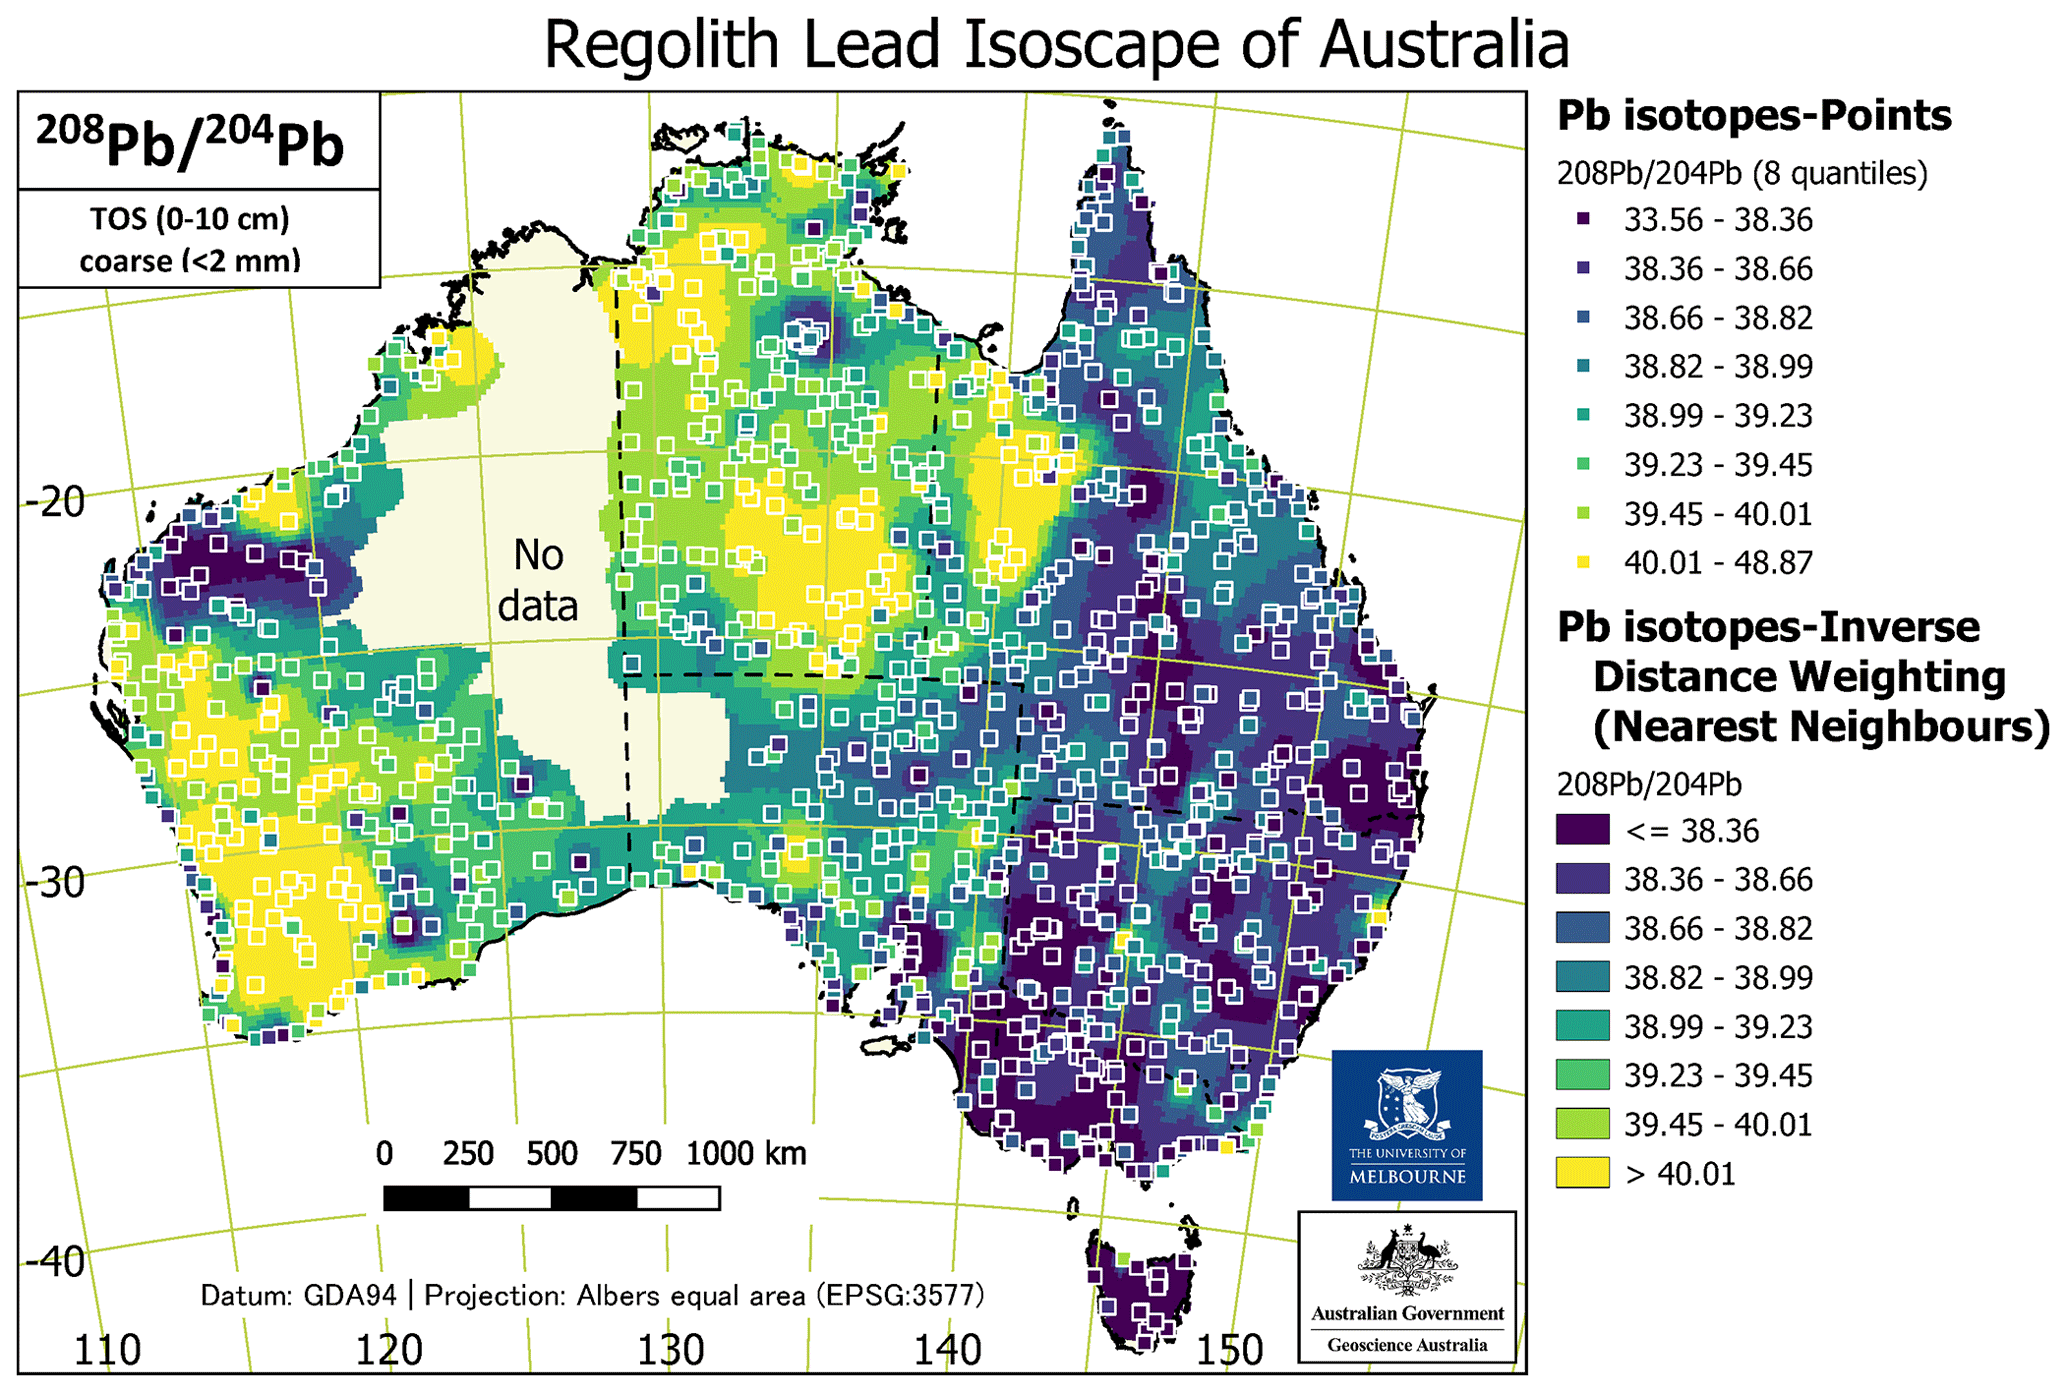
Figure 6Regolith Pb isoscape of Australia for with data points (AR digestion of TOS coarse samples) classed by quantiles and overlain on an IDW interpolation raster classed identically. See the main text for further details.
3.3 Isoscapes
The Pb isotope maps (isoscapes) for the ratios , , , , and are presented below (Figs. 4 to 8). Each map includes a series of points coloured according to eight quantile classes for binning overlain on a raster surface coloured in the same way. The raster is an “inverse distance weighting” (IDW) interpolation produced with the “Grid (IDW with nearest-neighbour searching)” or “invdistnn” GDAL tool in QGIS. The “inverse distance to a power” gridding method is a weighted average interpolator. Sample points are weighted during interpolation such that the influence of one point relative to another declines with the distance from the unknown pixel to be estimated. Here, a weighting power of 2, minimum/maximum nearest neighbouring points of 6/12, and grid cells of 0.25°×0.25° resolution are the parameters used. The rectangular rasters thus produced were subsequently clipped to a custom polygon combining the Australian coastline with the area of “No data” in the NGSA coverage using the “Clip Raster by Mask Layer” or “gdalwarp–cutline” GDAL tool in QGIS. All isoscape IDW-NN GeoTIFF rasters are downloadable as per the data subsection.
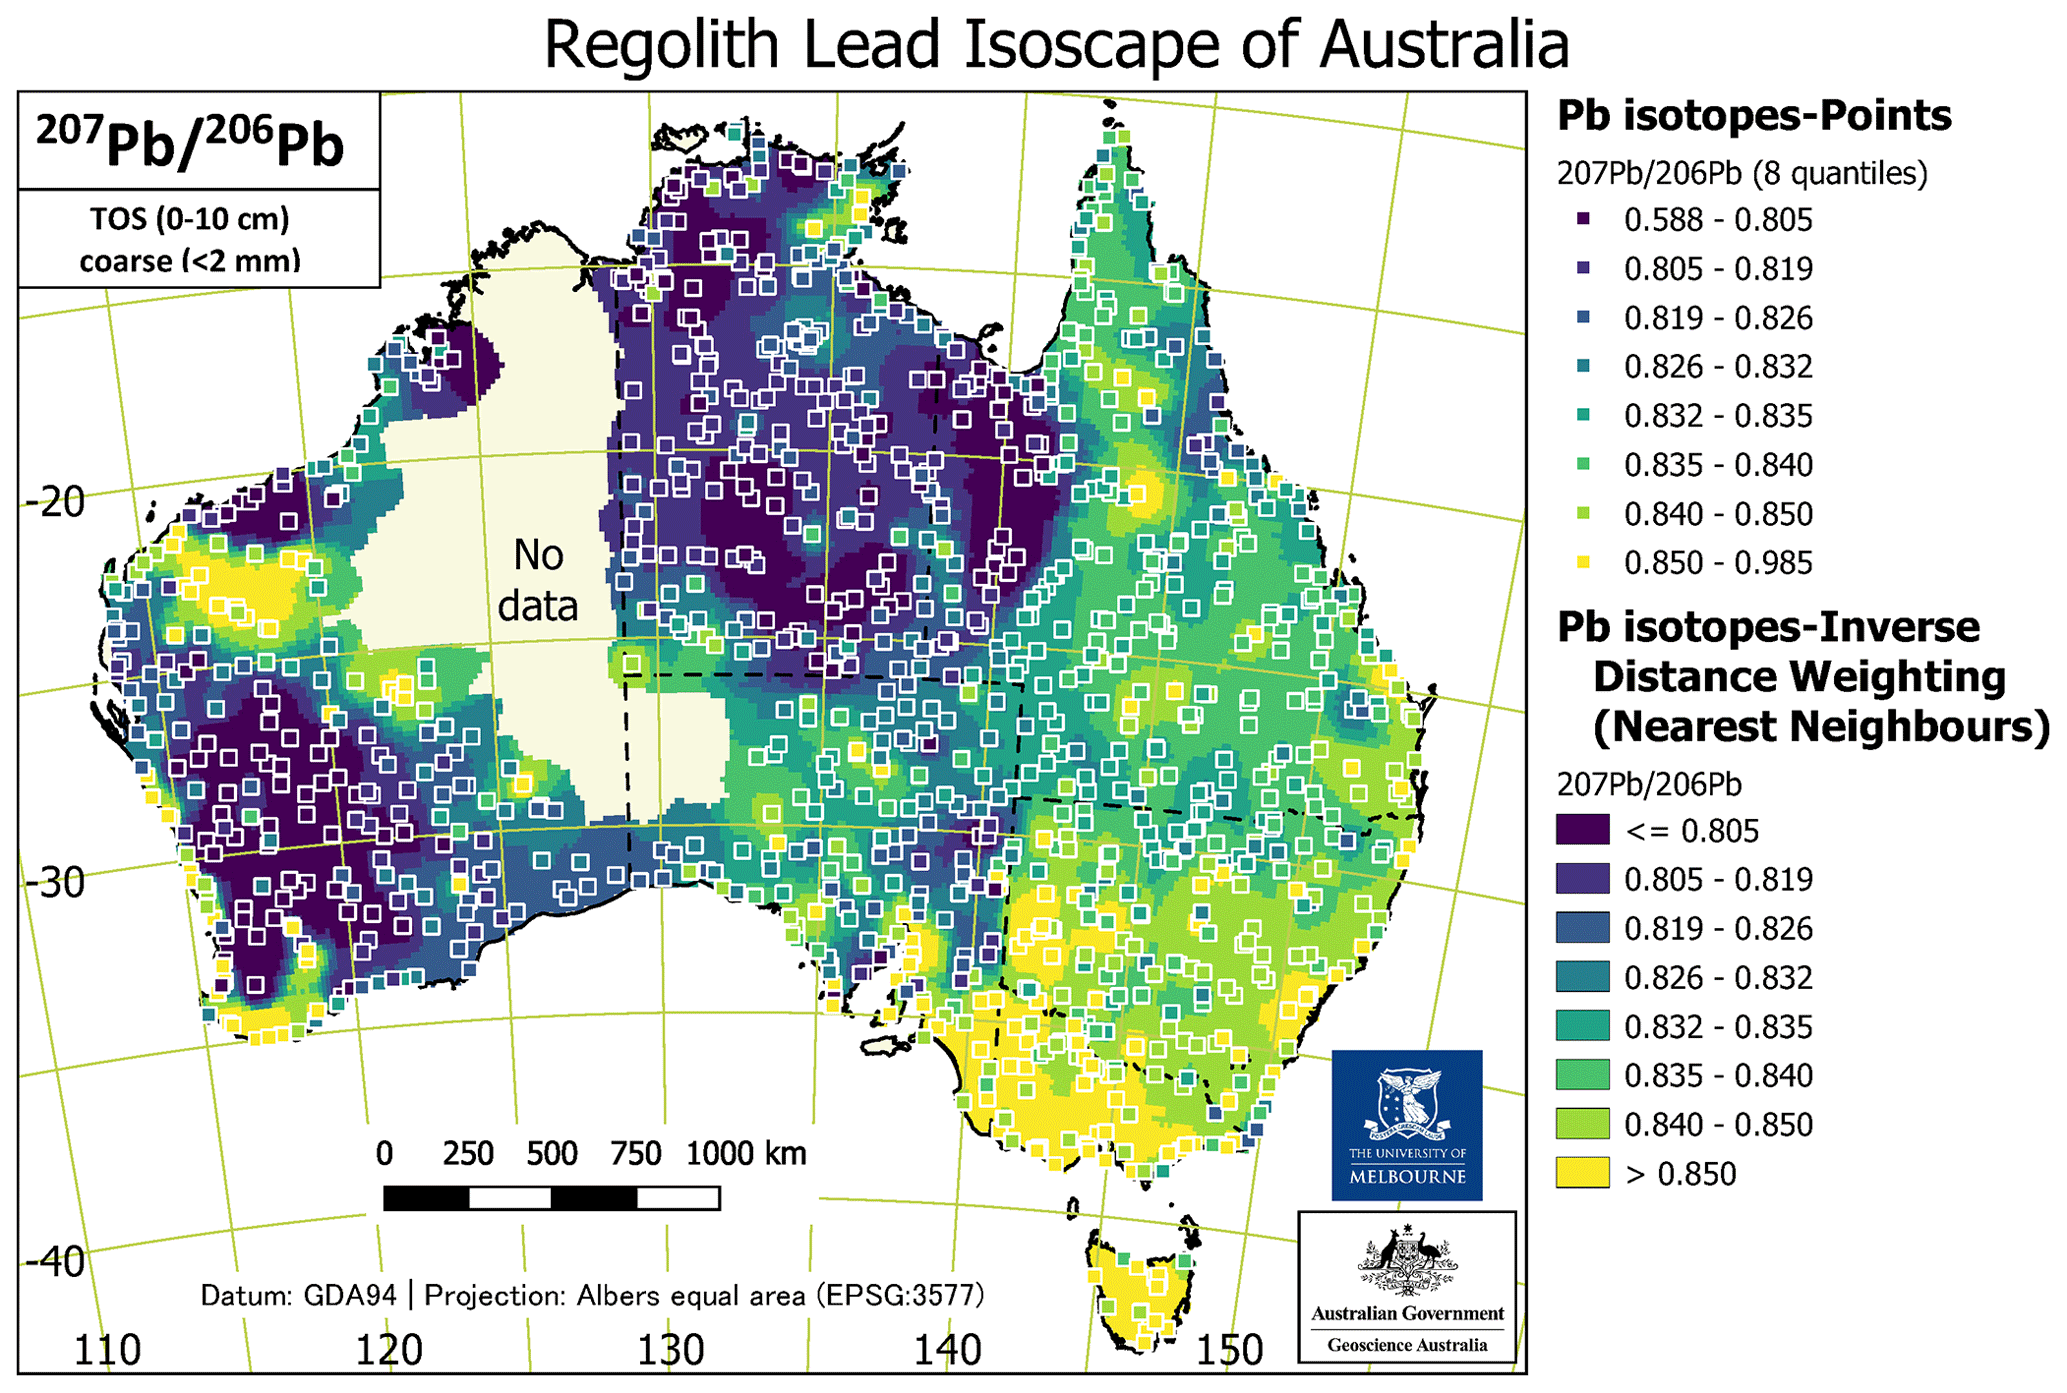
Figure 7Regolith Pb isoscape of Australia for with data points (AR digestion of TOS coarse samples) classed by quantiles and overlain on an IDW interpolation raster classed identically. See the main text for further details.
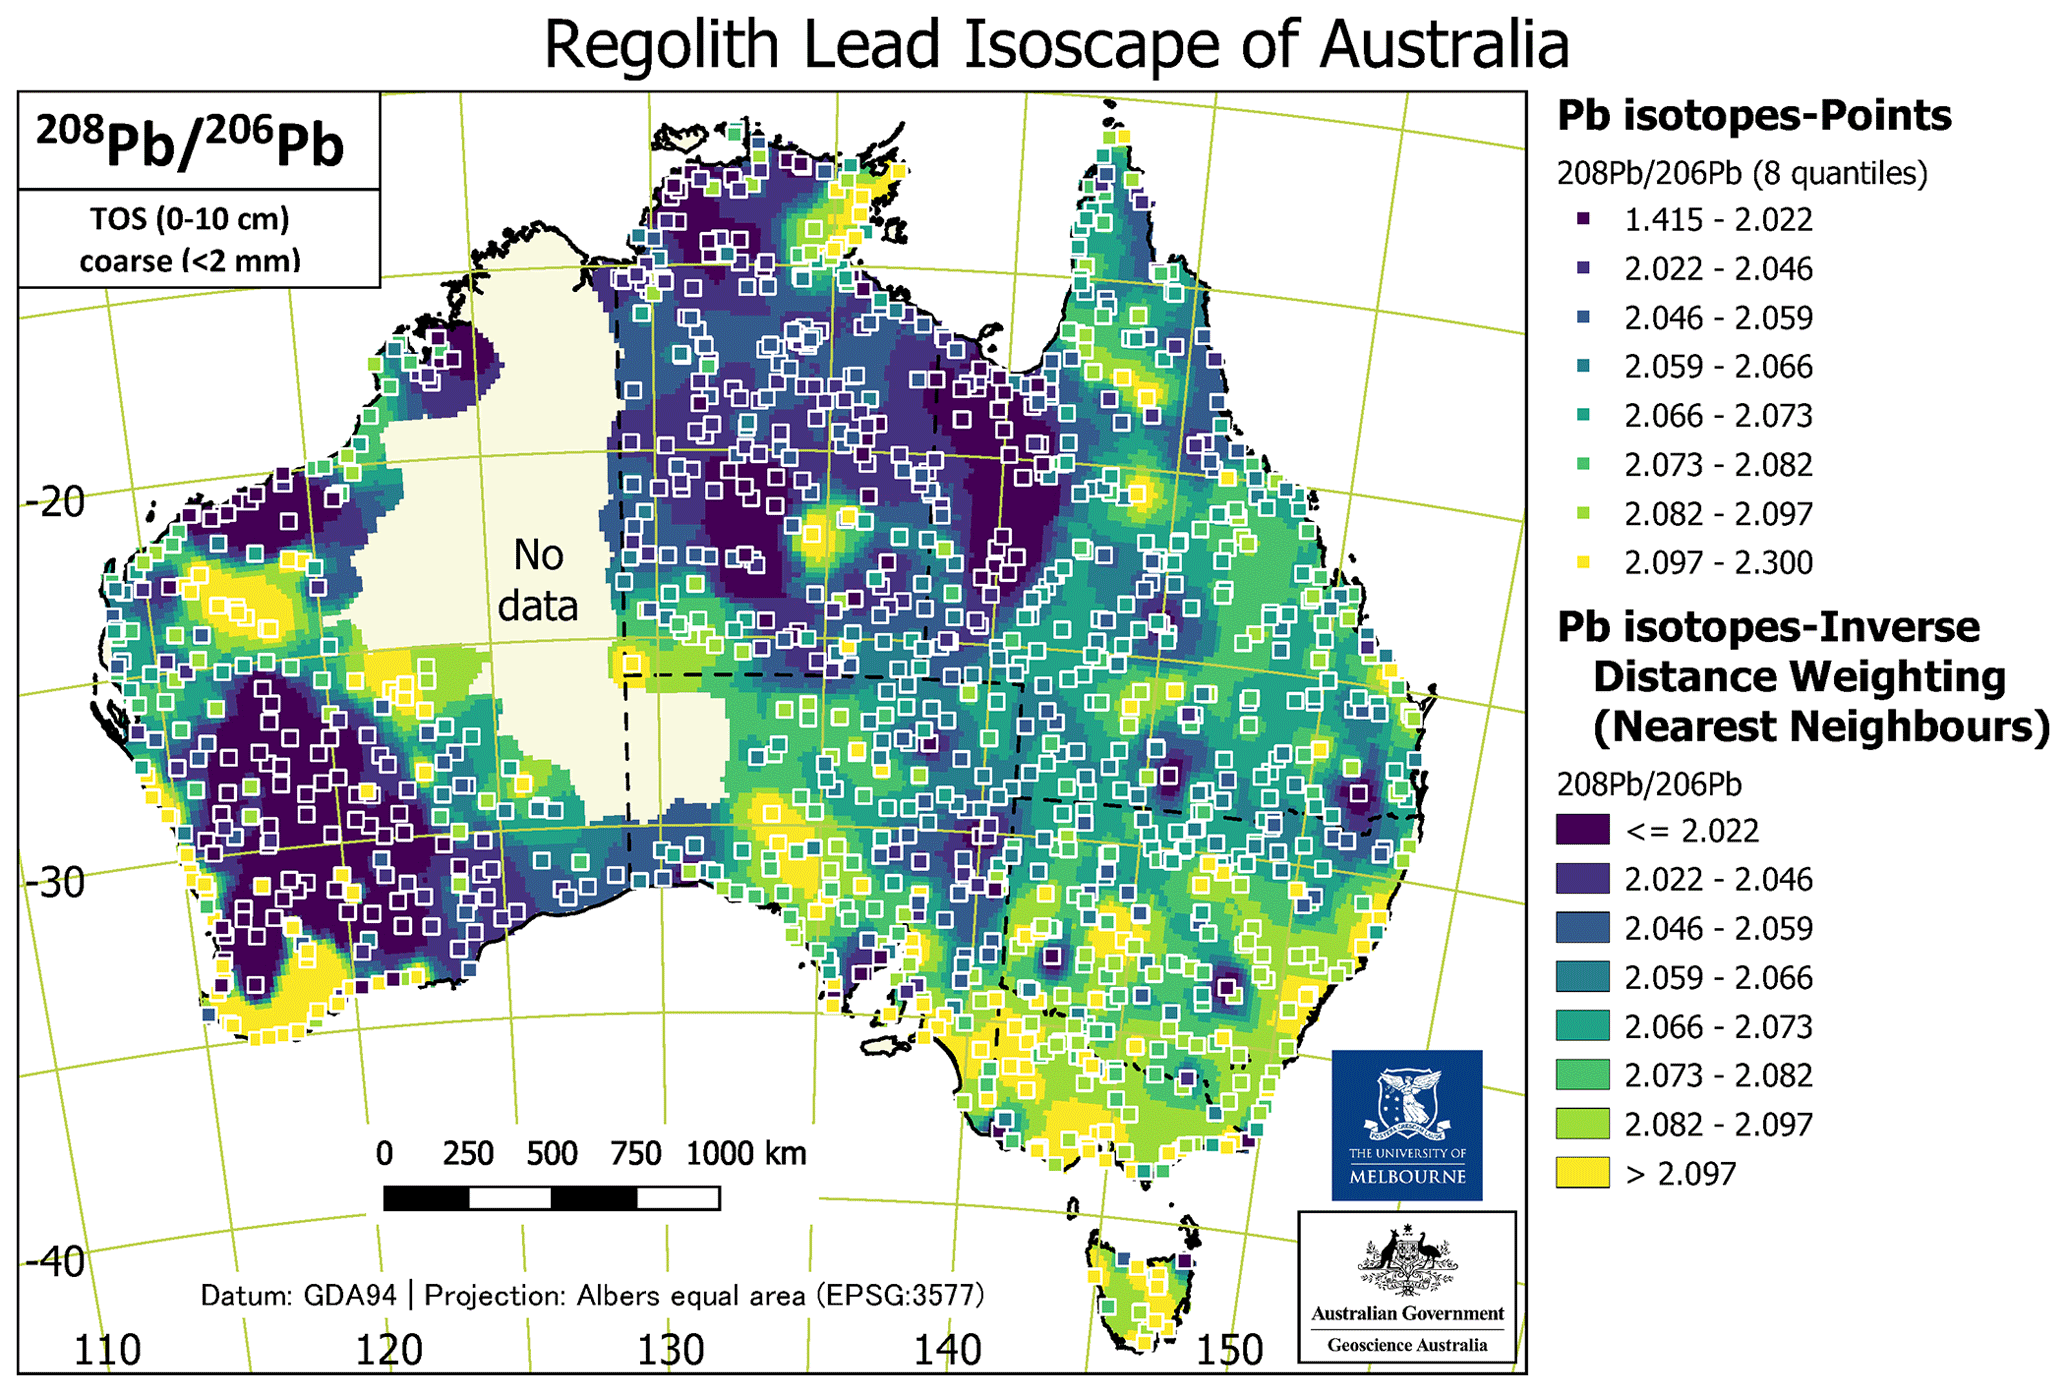
Figure 8Regolith Pb isoscape of Australia for with data points (AR digestion of TOS coarse samples) classed by quantiles and overlain on an IDW interpolation raster classed identically. See the main text for further details.
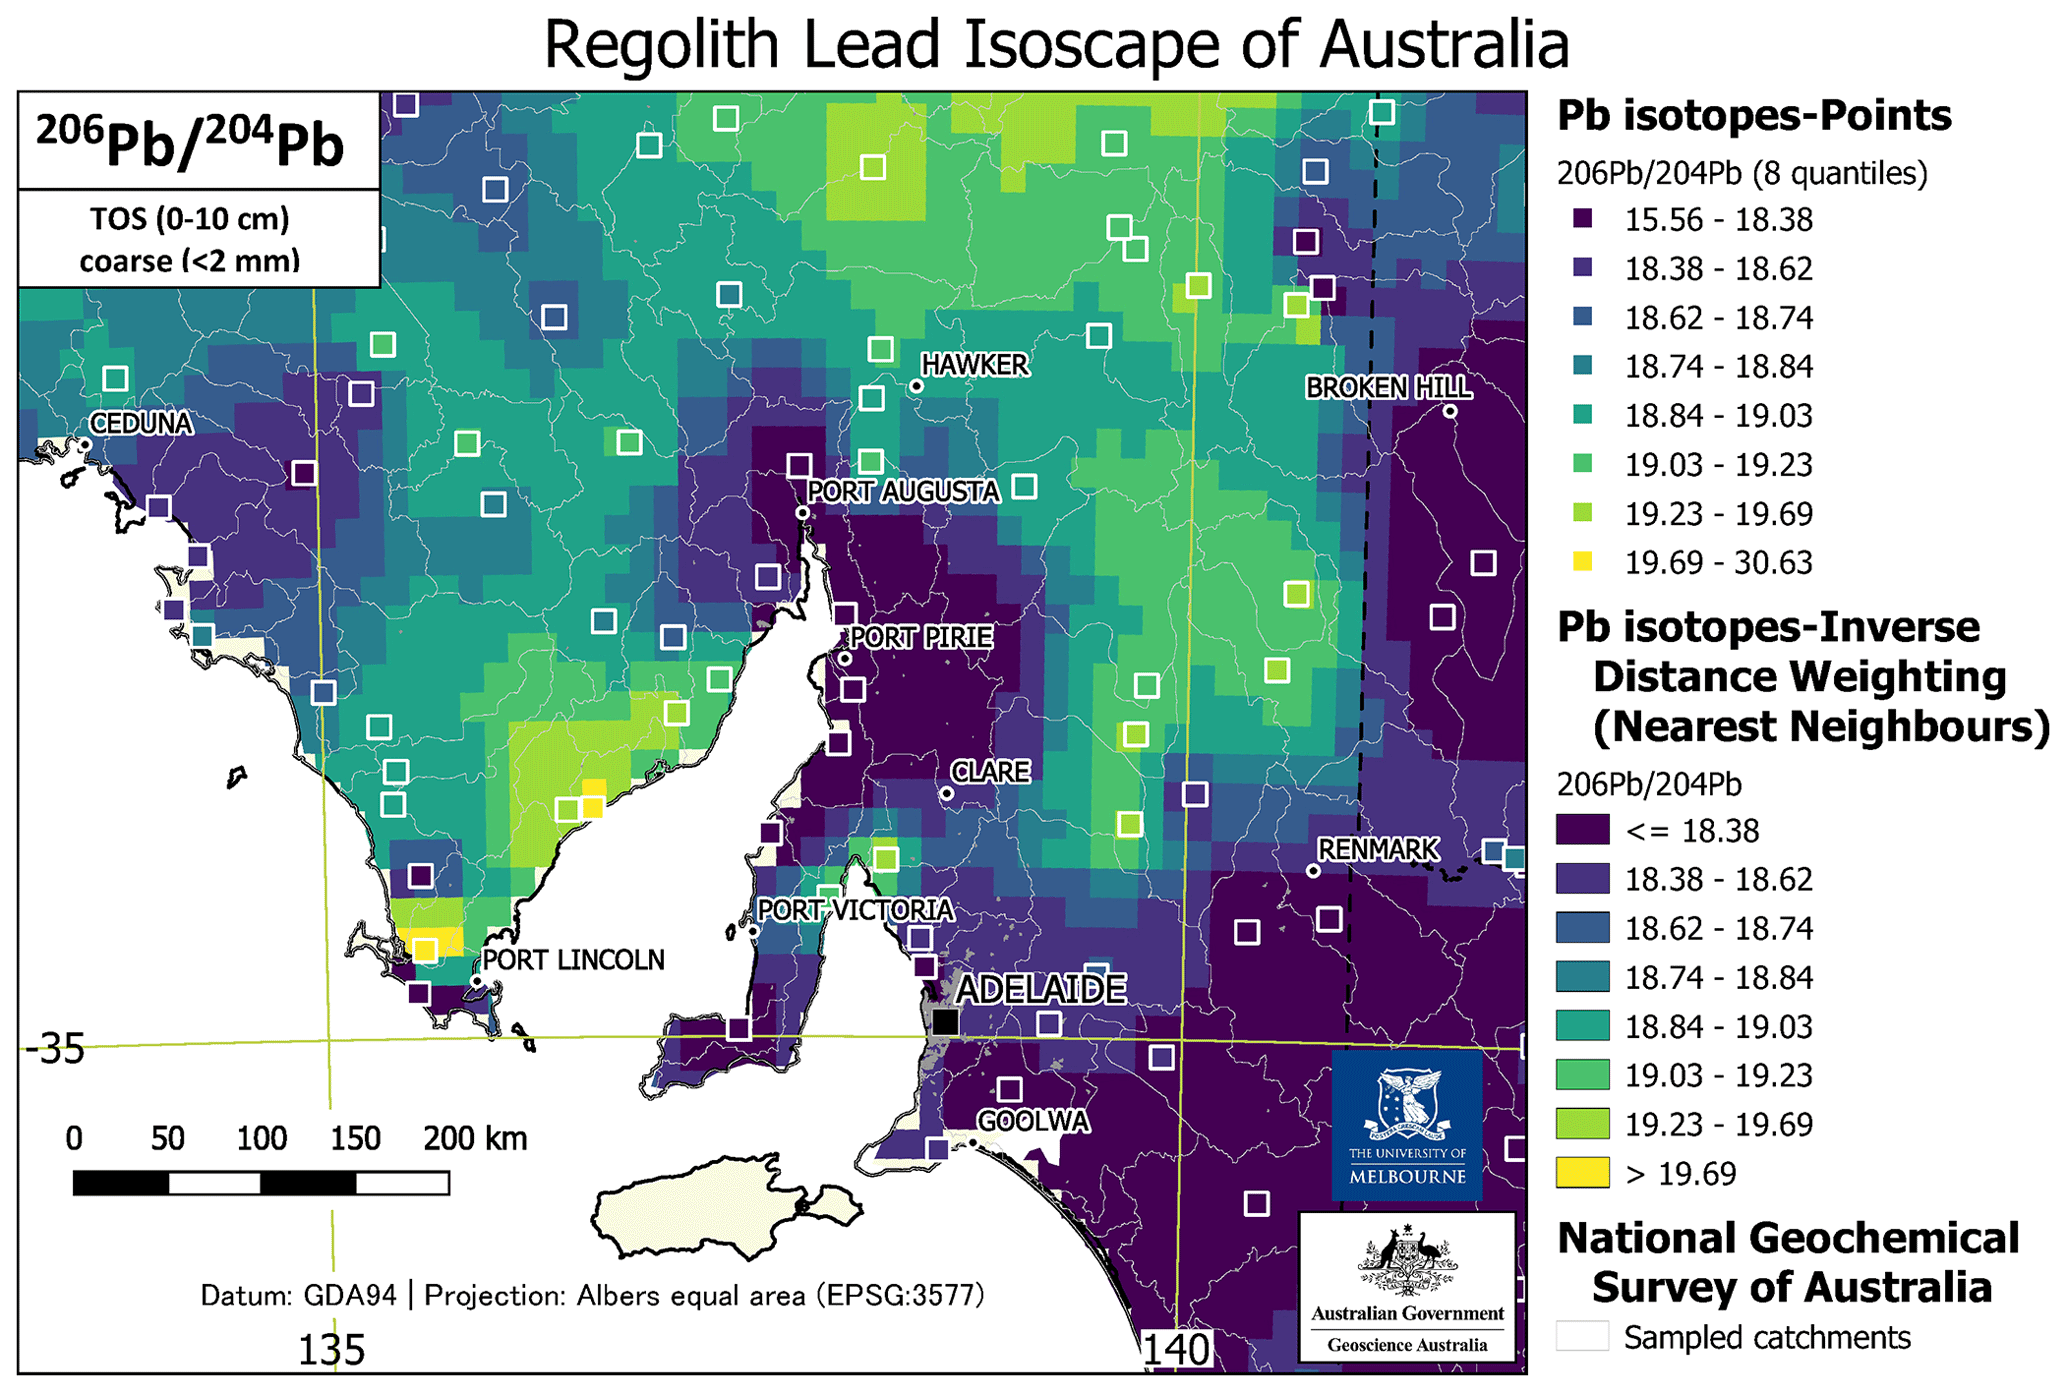
Figure 9Regional detail of the regolith Pb isoscape of Australia in the vicinity of the Pt Pirie smelter, South Australia, for with data values (AR digestion of TOS coarse samples) classed by quantiles and overlain on an IDW interpolation raster classed identically. The NGSA catchments are shown by the thin grey polygons. See the main text for further details.
3.4 Applications
The present Pb isoscapes can be applied to studies of the evolution of the Australian crust, regional mineral exploration, and baselines for environmental investigations. The former two will be developed elsewhere, but the latter is illustrated below with an example from data obtained close to the Port Pirie smelter in South Australia. Port Pirie is the locality of the largest Pb smelter and refinery in the Southern Hemisphere; a Pb smelter has been active there for over 130 years (South Australia Environmental Protection Authority). The widespread contamination of the area surrounding the smelter by means of windblown Pb dust is well documented in the literature (e.g., Gulson et al., 1981). Our TOS regolith data (Fig. 9) show pronounced unradiogenic signatures (e.g., lower ratios) adjacent to the area, which likely reflect a profound overprint from the ores processed in the facility, despite the application of the AmAc pre-leach to these samples. During its greater than 100-year history, the dominant source of the feedstock for the smelter was from the geologically ancient (1600 million years; Gulson, 1984) Broken Hill deposit in New South Wales (Body et al., 1988) and, later, the Teutonic Bore mine in Western Australia. The low ratios in the smelter emissions are consistent with the low ratios of 16.00 in the Broken Hill ore (Gulson, 1984). For two NGSA sites – 2007190995 located south of the Port Pirie Pb smelter and 2007190228 from north of the Port Pirie location – we analysed both TOS and BOS sample aliquots, with the TOS coarse fraction producing less radiogenic Pb isotope signatures compared to the BOS fraction samples. This further suggests that most of the anthropogenic contamination resides in the surface layer (recent deposits). The bottom fraction samples for both locations are very similar to one another and likely reflect the signature of floodplain deposits formed prior to the initiation of smelting activities and therefore provide a more reliable geogenic signature. The isotopic profiles in this study are consistent with those identified by Gulson et al. (1981).
The regolith Pb isotope dataset of Australia is publicly available (Desem et al., 2023; https://doi.org/10.26186/5ea8f6fd3de64).
National-scale regolith lead (Pb) isoscapes for Australia are presented for the ratios , , , , and . The results of this study suggest that the isotopic signatures obtained from transported regoliths in Australia are dominated by Pb from the catchment bedrock geology. This influence is more easily visible in older (i.e. Archaean and Proterozoic) terranes, simply because of the greater opportunity for radiogenic ingrowth here. This is demonstrated by the correlation of Pb signatures with major crustal elements and their respective geological model ages. Exogenous (anthropogenic) inputs of Pb have been detected at some sample locations and provide further encouragement for the utilisation of the new Pb isoscapes in source attribution for environmental studies. An example from around the Port Pirie Pb smelter is developed for illustration of this application. Other potential applications of this dataset include studies of the crustal evolution of Australia and using Pb isotopes for mineral exploration.
CUD contributed to the investigation (Pb isotope analysis), validation, and writing (original draft). PdC contributed to the data curation, formal analysis, resources (samples), validation, visualisation, and writing (original draft and reviewing and editing). JW contributed to the project administration, methodology, supervision, and writing (original draft and reviewing and editing). RM contributed to the supervision, validation (standards data), and methodology. GC contributed to the supervision and methodology.
The contact author has declared that none of the authors has any competing interests.
This paper is published with the permission of the chief executive officer of Geoscience Australia.
Publisher’s note: Copernicus Publications remains neutral with regard to jurisdictional claims made in the text, published maps, institutional affiliations, or any other geographical representation in this paper. While Copernicus Publications makes every effort to include appropriate place names, the final responsibility lies with the authors.
The National Geochemical Survey of Australia (NGSA) project would not have been possible without Commonwealth funding through the Onshore Energy Security Program (http://www.ga.gov.au/ngsa, last access: 5 September 2023), and Geoscience Australia appropriation. The Northern Australia Geochemical Survey (NAGS) project was funded under the “Exploring for the Future” programme (https://eftf-production.ga.gov.au/northern-australia-geochemical-survey, last access: 5 September 2023) and Geoscience Australia appropriation. Collaboration with the geoscience agencies of all states and the Northern Territory is gratefully recognised. We acknowledge all land owners and custodians, whether private, corporate, and/or traditional, for granting access to the field sites for the purposes of sampling. We are also grateful to Geoscience Australia laboratory staff for assistance with preparing and analysing the samples. We thank Geoscience Australia reviewers David Huston and Kathryn Waltenberg, journal reviewers Brian Gulson and one anonymous reviewer, and the editorial team for their detailed and constructive critique of our work.
Analytical work was conducted as part of Candan Desem's PhD studies, supported financially by The University of Melbourne Research Scholarship, Baragwanath Geology Research Scholarship, and the Albert Shimmins Fund, in addition to a PhD Student Research Grant from the International Association of GeoChemists (IAGC).
This research has also been supported by the Australian Government (Exploring for the Future, https://www.eftf.ga.gov.au/about, last access: 5 September 2023). Geoscience Australia's Exploring for the Future programme provides pre-competitive information to inform decision-making by government, community, and industry on the sustainable development of Australia's mineral, energy, and groundwater resources. By gathering, analysing, and interpreting new and existing pre-competitive geoscience data and knowledge, we are building a national picture of Australia's geology and resource potential. This leads to a strong economy, resilient society, and sustainable environment for the benefit of all Australians. This includes supporting Australia's transition to net-zero emissions; strong, sustainable resources and agriculture sectors; and economic opportunities and social benefits for Australia's regional and remote communities. The Exploring for the Future programme, which commenced in 2016, is an 8-year AUD 225 million investment by the Australian Government.
This paper was edited by Attila Demény and reviewed by Brian Gulson and one anonymous referee.
Adams, S., Grün, R., McGahan, D., Zhao, J.-X., Feng, Y., Nguyen, A., Willmes, M., Quaresimin, M., Lobsey, B., Collard, M., and Westaway, M. C.: A strontium isoscape of north-east Australia for human provenance and repatriation, Geoarchaeol., 34, 231–251, https://doi.org/10.1002/gea.21728, 2019.
Bataille, C. P., Crowley, B. E., Wooller, M. J., and Bowen, G. J.: Advances in global bioavailable strontium isoscapes, Palaeogeogr. Palaeocl., 555, 109849, https://doi.org/10.1016/j.palaeo.2020.109849, 2020.
Bing-Quan, Z., Yu-Wei, C., and Xiang-Yang, C.: Application of Pb isotopic mapping to environment evaluation in China, Chem. Speciation Bioavail., 14, 49–56, https://doi.org/10.3184/095422902782775335, 2002.
Body, P. E., Inglis, G. R., and Mulcahy, D. E.: Lead contamination in Port Pirie South Australia, SADEP Report number 101, SA Department of Environment and Planning, Adelaide, 87 pp., 1988.
Bowen, G. J., West, J. B., Vaughn, B. H., Dawson, T. E., Ehleringer, J. R., Fogel, M. L., Hobson, K., Hoogewerff, J., Kendall, C., Lai, C.-T., Miller, C. C., Noone, D., Schwartz, H., and Still, C. J.: Isoscapes to address large-scale earth science challenges, EOS T. Am. Geophys. Union, 90, 109–116, https://doi.org/10.1029/2009EO130001, 2009.
Carr, G. R., Korsch, M. J., Denton, G. J., Gatehouse, S., Law, A., Gray, D. R., and Andrew, A. S.: AMIRA P618, Isotopic Discrimination of Partial Leach, Geochemical Anomalies in Covered Terrains, Final Report, CSIRO Division of Earth Science and Resource Engineering, CSIRO Report, EP0410117, 2011.
Chesson, L. A., Tipple, B. J., Howa, J. D., Bowen, G. J., Barnette, J. E., Cerling, T. E., and Ehrlinger, J. R.: Stable isotopes in forensics applications, in: Treatise on Geochemistry, Second Edition, edited by: Holland H. D. and Turekian K. K., 14, 285–317, https://doi.org/10.1016/B978-0-08-095975-7.01224-9, 2014.
Cooper, M., de Caritat, P., Burton, G., Fidler, R., Green, G., House, E., Strickland, C., Tang, J., and Wygralak, A.: National Geochemical Survey of Australia: Field Data, Record, 2010/18, Geosci. Austral., Canberra, https://doi.org/10.11636/Record.2011.020, 2010.
de Caritat, P.: The National Geochemical Survey of Australia: review and impact, Geochem. Explo. Env. Anal., geochem2022-032, https://doi.org/10.1144/geochem2022-032, 2022.
de Caritat, P. and Cooper, M.: National Geochemical Survey of Australia: The Geochemical Atlas of Australia, Record, 2011/20, Geosci. Austral., Canberra, http://pid.geoscience.gov.au/dataset/ga/71973 (last access: 13 March 2024), 2011.
de Caritat, P. and Cooper, M.: A continental-scale geochemical atlas for resource exploration and environmental management: the National Geochemical Survey of Australia, Geochem. Explo. Env. Anal., 16, 3–13, https://doi.org/10.1144/geochem2014-322, 2016.
de Caritat, P., Cooper, M., Lech, M., McPherson, A., and Thun, C.: National Geochemical Survey of Australia: Sample Preparation Manual, Record, 2009/08, Geosci. Austral., Canberra, http://pid.geoscience.gov.au/dataset/ga/68657 (last access: 13 March 2024), 2009.
de Caritat, P., Cooper, M., Pappas, W., Thun, C., and Webber, E.: National Geochemical Survey of Australia: Analytical Methods Manual, Record, 2010/15, Geosci. Austral., Canberra, http://pid.geoscience.gov.au/dataset/ga/70369 (last access: 13 March 2024), 2010.
de Caritat, P., Dosseto, A., and Dux, F.: A strontium isoscape of inland southeastern Australia, Earth Syst. Sci. Data, 14, 4271–4286, https://doi.org/10.5194/essd-14-4271-2022, 2022.
de Caritat, P., Dosseto, A., and Dux, F.: A strontium isoscape of northern Australia, Earth Syst. Sci. Data, 15, 1655–1673, https://doi.org/10.5194/essd-15-1655-2023, 2023.
Desem, C. U., Maas, R., Woodhead, J., Carr, G., and Greig, A.: The utility of rapid throughput single-collector sector-field ICP-MS for soil Pb isotope studies, Appl. Geochem., 143, 105361, https://doi.org/10.1016/j.apgeochem.2022.105361, 2022.
Desem, C. U., de Caritat, P., Woodhead, J. D., Maas, R., and Carr, G.: National Geochemical Survey of Australia: Lead Isotopes Dataset, Geosci. Austral., Canberra [data set], https://doi.org/10.26186/5ea8f6fd3de64, 2023.
Evans, J. A., Pashley, V., Mee, K., Wagner, D., Parker Pearson, M., Fremondeau, D., Albarella, U., and Madgewick, R.: Applying lead (Pb) isotopes to explore mobility in humans and animals, PLoS ONE, 17, e0274831, https://doi.org/10.1371/journal.pone.0274831, 2022.
Gale, N. H. and Stos-Gale, Z. A.: Lead isotope analyses applied to provenance studies, in: Modern Analytical Methods in Art and Archaeology, edited by: Ciliberto, E. and Spoto, G., Wiley, New York, ISBN 978-0-471-29361-3, 503–584, 2000.
Gulson, B.: Stable lead isotopes in environmental health with emphasis on human investigations, Sci. Total Environ., 400, 75–92, https://doi.org/10.1016/j.scitotenv.2008.06.059, 2008.
Gulson, B. L.: Uranium-lead and lead-lead investigations of minerals from the Broken Hill lodes and mine sequence rocks, Econ. Geol., 79, 476–490, 1984.
Gulson, B. L., Tiller, K. G., Mizon, K. J., and Merry, R. H.: Use of lead isotopes to identify the source of lead contamination near Adelaide, South Australia, Env. Sci. Technol., 15, 691–696, https://doi.org/10.1021/es00088a008, 1981.
Gulson, B. L., Gillings, B. R., and Jameson, C. W.: Stable lead isotopes in teeth as indicators of past domicile – a potential new tool in forensic science, J. Forensic Sci., 42, 787–791, 1997.
Gulson, B. L., Mizon, K. J., Korsch, M. J., Palmer, J. M., and Donnelly, J. B.: Mobilisation of lead from human bone tissue during pregnancy and lactation – a summary of long-term research, Sci. Total Environ., 303, 79–104, 2003.
Hobson, K. A., Barnett-Johnson, R., and Cerling, T.: Using isoscapes to track animal migration, in: Isoscapes, edited by: West, J. B., Bowen, G. J., Dawson, T. E., and Tu, K. P., Springer, Dordrecht, the Netherlands, 273–298, https://doi.org/10.1007/978-90-481-3354-3_13, 2010.
Hsu, Y.-K. and Sabatini, B. J.: A geochemical characterization of lead ores in China: an isotope database for provenancing archaeological materials, Plos One, 14, e0215973, https://doi.org/10.1371/journal.pone.0215973, 2019.
Huston, D. L., Champion, D. C., Ware, B., Carr, G., Maas, R., and Tessalina, S.: Preliminary National-Scale Lead Isotope Maps of Australia, Record, 2019/001, Geosci. Austral., Canberra, https://doi.org/10.11636/Record.2019.001, 2019.
Huston, D. L., Doublier, M.P., Downes P.M.: Geological setting, age and endowment of major Australian mineral deposits – a compilation. Record 2021/20, Geosci Austral., Canberra, https://doi.org/10.11636/Record.2021.020, 2021.
Jochum, K. P., Nohl, U., Herwig, K., Lammel, E., Stoll, B., and Hofman, A. W.: GeoREM: a new geochemical database for Reference Materials and Isotopic standards, Geostand. Geoanal. Res., 29, 333–338, https://doi.org/10.1111/j.1751-908X.2005.tb00904.x, 2007.
Lech, M. E., de Caritat, P., and McPherson, A. A.: National Geochemical Survey of Australia: Field Manual, Record, 2007/08, Geosci. Austral., Canberra, http://pid.geoscience.gov.au/dataset/ga/65234 (last access: 13 March 2024), 2007.
Main, P. T., Bastrakov, E. N., Wygralak, A. S., and Khan, M.: Northern Australia Geochemical Survey: Data Release 2 – Total (Coarse Fraction), Aqua Regia (Coarse and Fine Fraction), and Fire Assay (Coarse and Fine Fraction) Element Contents, Record, 2019/002, Geosci. Austral., Canberra, https://doi.org/10.11636/Record.2019.002, 2019.
Newman, K. and Georg, R. B.: The measurement of Pb isotope ratios in sub-ng quantities by fast scanning single collector sector field-ICP-MS, Chem. Geol., 304–305, 151–157, https://doi.org/10.1016/j.chemgeo.2012.02.010, 2012.
Reimann, C., Flem, B., Fabian, K., Birke, M., Ladenberger, A., Negrel, P., Demetriades, A., Hoogewerff, J., and GEMAS Project Team: Lead and lead isotopes in agricultural soils of Europe – the continental perspective, Appl. Geochem., 27, 532–542, https://doi.org/10.1016/j.apgeochem.2011.12.012, 2012.
Scaffidi, B. K. and Knudson, K. J.: An archaeological strontium isoscape for the prehistoric Andes: understanding population mobility through a geostatistical meta-analysis of archaeological values from humans, animals, and artifacts, J. Archaeol. Sci., 117, 10521, https://doi.org/10.1016/j.jas.2020.105121, 2020.
Shaw, R. D., Wellman, P., Gunn, P. J., Whitaker, A. J., and Tarlowski, C.Z.: Australian Crustal Elements (National Geoscience Dataset), Geosci. Austral., Canberra [data set], http://pid.geoscience.gov.au/dataset/ga/21195 (last access: 13 March 2024), 1998.
Weisler, M. and Woodhead, J. D.: Basalt Pb isotope analysis and the prehistoric settlement of Polynesia, P. Natl. Acad. Sci. USA, 92, 1881–1885, https://doi.org/10.1073/pnas.92.6.1881, 1995.
Willmes, M., Bataille, C. P., James, H. F., Moffat, I., McMorrow, L., Kinsley, L., Armstrong, R. A., Eggins, S., and Grün, R.: Mapping of bioavailable strontium isotope ratios in France for archaeological provenance studies, Appl. Geochem., 90, 75–86, https://doi.org/10.1016/j.apgeochem.2017.12.025, 2018.
Woodhead, J. D.: A simple method for obtaining highly accurate Pb isotope data by MC-ICP-MS, J. Anal. Atom. Spectrom., 17, 1381–1385, https://doi.org/10.1039/B205045E, 2002.
Zuluaga, M. C., Norini, G., Ayuso, R., Nieto, J. M., Lima, A., Albanese, S., and De Vivo, B.: Geochemical mapping, environmental assessment and Pb isotopic signatures of geogenic and anthropogenic sources in three localities in SW Spain with different land use and geology, J. Geochem. Explor., 181, 172–190, https://doi.org/10.1016/j.gexplo.2017.07.011, 2017.