the Creative Commons Attribution 4.0 License.
the Creative Commons Attribution 4.0 License.
 | 11 Mar 2024
Improving the Latin America and Caribbean Soil Information System (SISLAC) database enhances its usability and scalability
Sergio Díaz-Guadarrama
Viviana M. Varón-Ramírez
Iván Lizarazo
Mario Guevara
Marcos Angelini
Gustavo A. Araujo-Carrillo
Jainer Argeñal
Daphne Armas
Rafael A. Balta
Adriana Bolivar
Nelson Bustamante
Ricardo O. Dart
Martin Dell Acqua
Arnulfo Encina
Hernán Figueredo
Fernando Fontes
Joan S. Gutiérrez-Díaz
Wilmer Jiménez
Raúl S. Lavado
Jesús F. Mansilla-Baca
Maria de Lourdes Mendonça-Santos
Lucas M. Moretti
Iván D. Muñoz
Carolina Olivera
Guillermo Olmedo
Christian Omuto
Sol Ortiz
Carla Pascale
Marco Pfeiffer
Iván A. Ramos
Danny Ríos
Rafael Rivera
Lady M. Rodriguez
Darío M. Rodríguez
Albán Rosales
Kenset Rosales
Guillermo Schulz
Víctor Sevilla
Leonardo M. Tenti
Ronald Vargas
Gustavo M. Vasques
Yusuf Yigini
Yolanda Rubiano
Spatial soil databases can help model complex phenomena in which soils are a decisive factor – for example, evaluating agricultural potential or estimating carbon storage capacity. The Latin America and Caribbean Soil Information System, SISLAC, is a regional initiative promoted by the Food and Agriculture Organization's (FAO) Latin America and the Caribbean Soil Partnership to contribute to sustainable management of soil. SISLAC includes data from 49 084 soil profiles distributed unevenly across the continent, making it the region's largest soil database. In addition, there are other soil databases in the region with about 40 000 soil profiles that can be integrated into SISLAC and improve it. However, some problems hinder its usages, such as the quality of the data and their high dimensionality. The objective of this research is evaluate the quality of the SISLAC data and the other available soil databases to generate a new improved version that meets the minimum quality requirements to be used for different purposes or practical applications. The results show that 15 % of the existing soil profiles had an inaccurate description of the diagnostic horizons and 17 % of the additional profiles already existed in SISLAC; therefore, a total of 32 % of profiles were excluded for these two reasons. Further correction of an additional 4.5 % of existing inconsistencies improved overall data quality. The improved database consists of 66 746 profiles and is available for public use at https://doi.org/10.5281/zenodo.7876731 (Díaz-Guadarrama and Guevara, 2023). This revised version of SISLAC data offers the opportunity to generate information that helps decision-making on issues in which soils are a decisive factor. It can also be used to plan future soil surveys in areas with low density or where updated information is required.
- Article
(4149 KB) - Full-text XML
- BibTeX
- EndNote


Soil is a three-dimensional natural body consisting of strata called horizons when there are chemical, biological, and even physical relations (i.e., transference of components or products of their alteration among them) or simply layers when they are a consequence of successive deposition of different sediments. Both horizons and layers are a mixture of degraded mineral materials, organic material, air, and water (Bockheim et al., 2005). Soil is a product of the soil itself (such as information on the soil at a point at a site), climate, organisms, topography, the parent material, time, and spatial position, together also known as the SCORPAN factors of soil formation (Mcbratney et al., 2003). Soil provides various ecologic or productive contributions besides its obvious importance as a critical factor in food production, for example, in urban ecosystem services (such as water buffering capacity of open areas), human health (breakdown of toxic contaminants), or climate regulation through carbon storage (Otte et al., 2012). Its sustainable management is of the utmost importance in the main environmental challenges such as food security, climate change, and the loss of biodiversity (Dewitte et al., 2013). Soil data are an essential starting point to reach an adequate level of knowledge about soil status, raise awareness about its importance, and preserve this valuable resource (Bouma et al., 2012). Digital soil data (such as soil profiles) are in great demand as inputs to, for example, estimate the potential of agricultural land (Amirinejad et al., 2011; Bini et al., 2013; Owusu et al., 2020); in addition, their availability is key to assessing soil functions such as water and climate regulation, energy supply, and biodiversity (Greiner et al., 2017; Varón-Ramírez et al., 2022). Greater diffusion of soil information has substantial benefits in disciplines such as agricultural sciences because it allows for better estimation of current and future crop productivity or the identification of constraints and risks of land degradation (FAO and IIASA, 2009; Hopmans et al., 2021; Paterson et al., 2015). The Food and Agriculture Organization (FAO) indicates that more and better soil data can further achievements in the fight against poverty and hunger and to advance sustainable development (FAO, 2017).
Technological advances and increased computing capabilities have led to the development of soil databases on both a regional and global scale (Hendriks et al., 2019; Keskin et al., 2019; Rossiter, 2018). Global databases exist such as the World Soil Information Service, WoSIS (Batjes et al., 2017, 2020), or the World Inventory of Soil Emission Potentials, WISE (Batjes, 2016); regional databases such as the Africa Soil Profiles database (Leenaars, 2013); and national ones such as SISINTA in Argentina (Angelini et al., 2018), the Harmonized Soil Database of Ecuador 2021 (Armas et al., 2022), or IRAKA in Colombia (Araujo-Carrillo et al., 2021). These datasets are an example of efforts at different levels to have soil profile data that help to support decision-making on problems involving this resource's management. Organizations such as the FAO's Global Soil Partnership (GSP) and the Latin America and the Caribbean Soil Partnership (LACS) emphasize the need to preserve such data as, in some parts of the world, soil survey data are the only source of information available (Beaudette and O'Geen, 2009; Hengl and Macmillan, 2019).
The mentioned databases allow scientists to generate information on soil properties such as soil organic carbon (SOC). SOC is one of the most important chemical properties related to soil fertility and climate regulation and the key to multiple functions in ecosystem services (Owusu et al., 2020). Global projects such as the FAO's Global Soil Organic Carbon Map (FAO and ITPS, 2018); national projects in Brazil (Gomes et al., 2019), Ghana (Owusu et al., 2020), and Cameroon (Silatsa et al., 2020); or regional projects in Andalusia, Spain (Armas et al., 2017), or in páramo ecosystem soils in Colombia (Gutierrez et al., 2020) have been some of the works that have estimated SOC (in its vertical or horizontal dimensions) from soil databases.
The Latin America and Caribbean Soil Information System, SISLAC, is an initiative coordinated and financed by the FAO's Global Soil Partnership (GSP) to contribute to the sustainable management of this resource in the region (SISLAC, 2013). SISLAC (Fig. 1a) has data on almost 50 000 soil profiles and 140 000 horizons and layers, making it the most extensive database in the region. The data include a description of the site for each profile, its spatial location, its comprising layers, its physical and chemical properties, its data provider, and its metadata. In addition to SISLAC, there are other soil databases available in the region that should be analyzed and integrated with it in order to improve it.
When analyzing available data, it is evident that some of them present inconsistencies due to the high heterogeneity of sources that provide such data. These inconsistencies can be due to, for example, old descriptions using obsolete description systems or errors in transferring information from the field to the office. So, if they are not corrected, the analysis results will have a high degree of uncertainty and inaccuracy, primarily since the performance of a model depends on the quality of the training data (Garg et al., 2020). Data quality is a multidimensional concept involving management, analysis, quality control, storage, and presentation (Chapman, 2005). It is closely related to their potential use and ability to meet user needs (English, 1999), which Krol (2008) calls “use aptitude”.
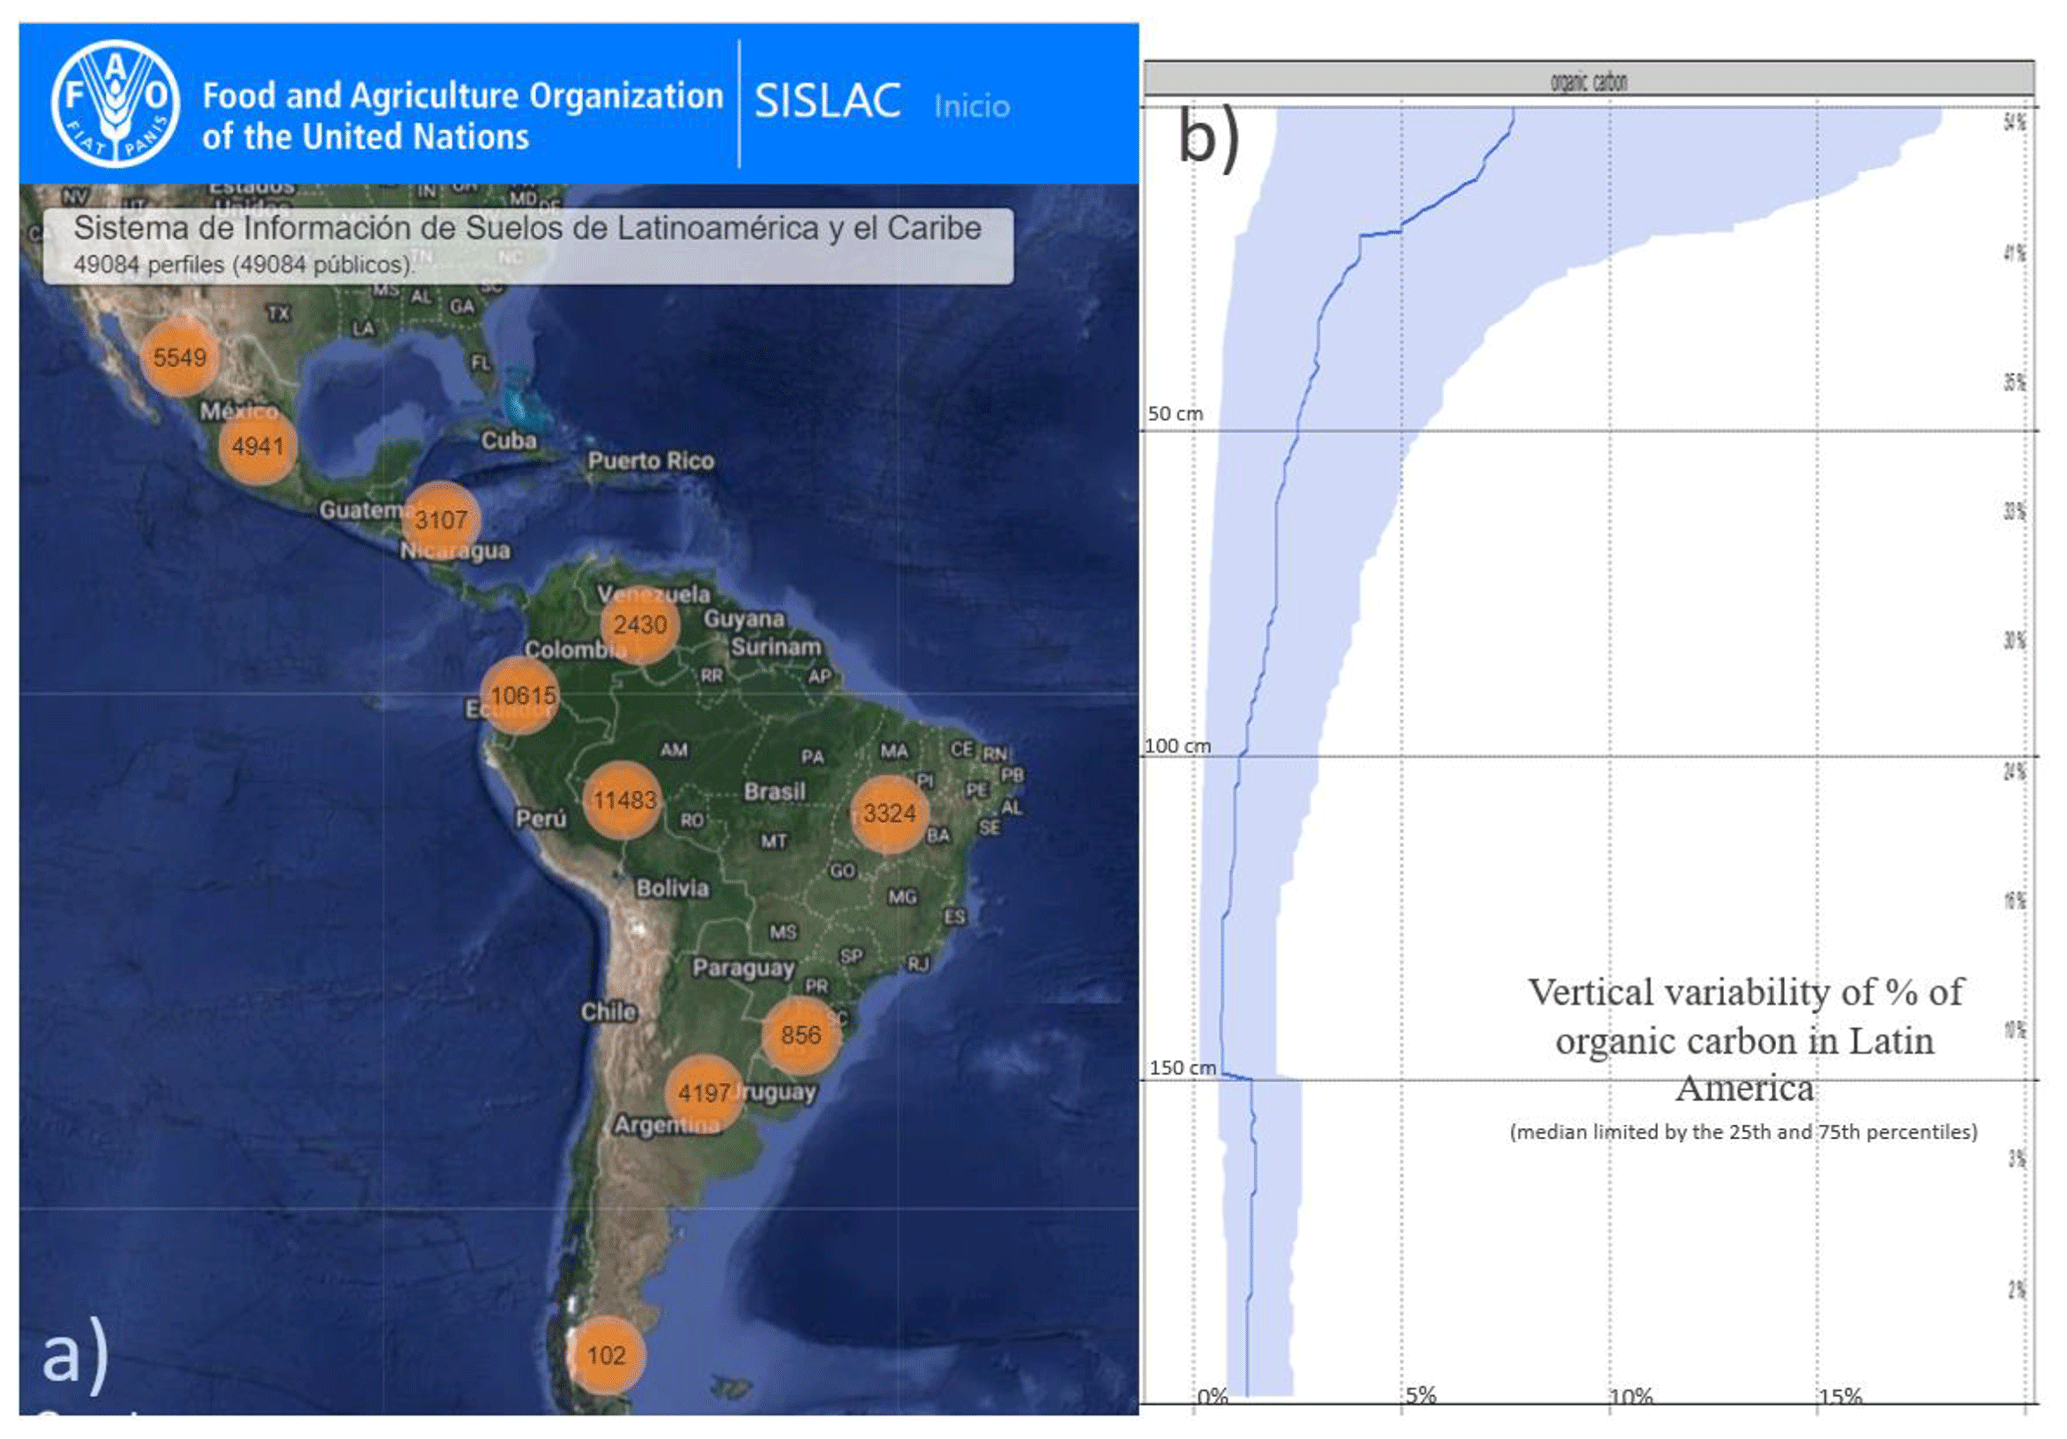
Figure 1(a) SISLAC interface; each number in the orange circles indicates the number of profiles in that area (from the SISLAC web page). (b) Vertical variability in the percentage of organic carbon in Latin America.
Therefore, this research aims to evaluate the quality of SISLAC data and existing soil databases in terms of logical consistency to generate a new version of the SISLAC database that meets the minimum requirements of completeness in the description of profile horizons.
The flow diagram (Fig. 2) shows the work carried out, consisting of four phases: the first comprises a revision of the special correspondence, the second an identification of spatially duplicated profiles, the third a validation of errors in the description of horizons, and the fourth a correction of minor inconsistencies.
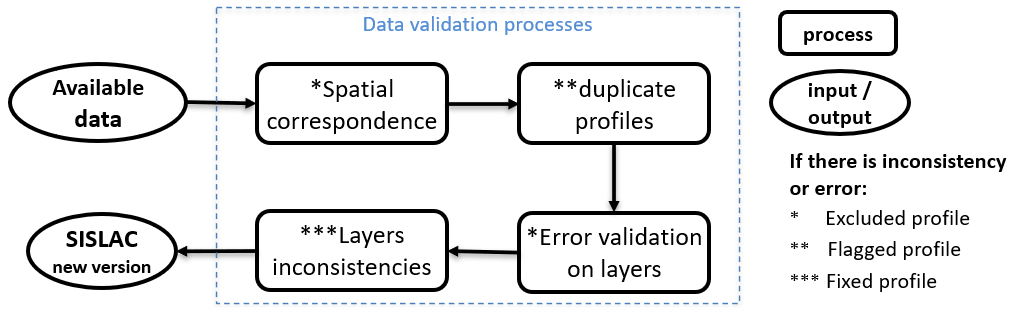
Figure 2Flowchart of this research. The blue box shows the validation processes applied to 100 % of the data.
2.1 Study area
The study area (Fig. 1a) is composed of the Latin American and Caribbean countries listed in Table 1, where since 2016 we have had a soil database representative of such a diverse region. In the same figure, the number of profiles per region can be seen aggregated in orange circles.
2.2 Data
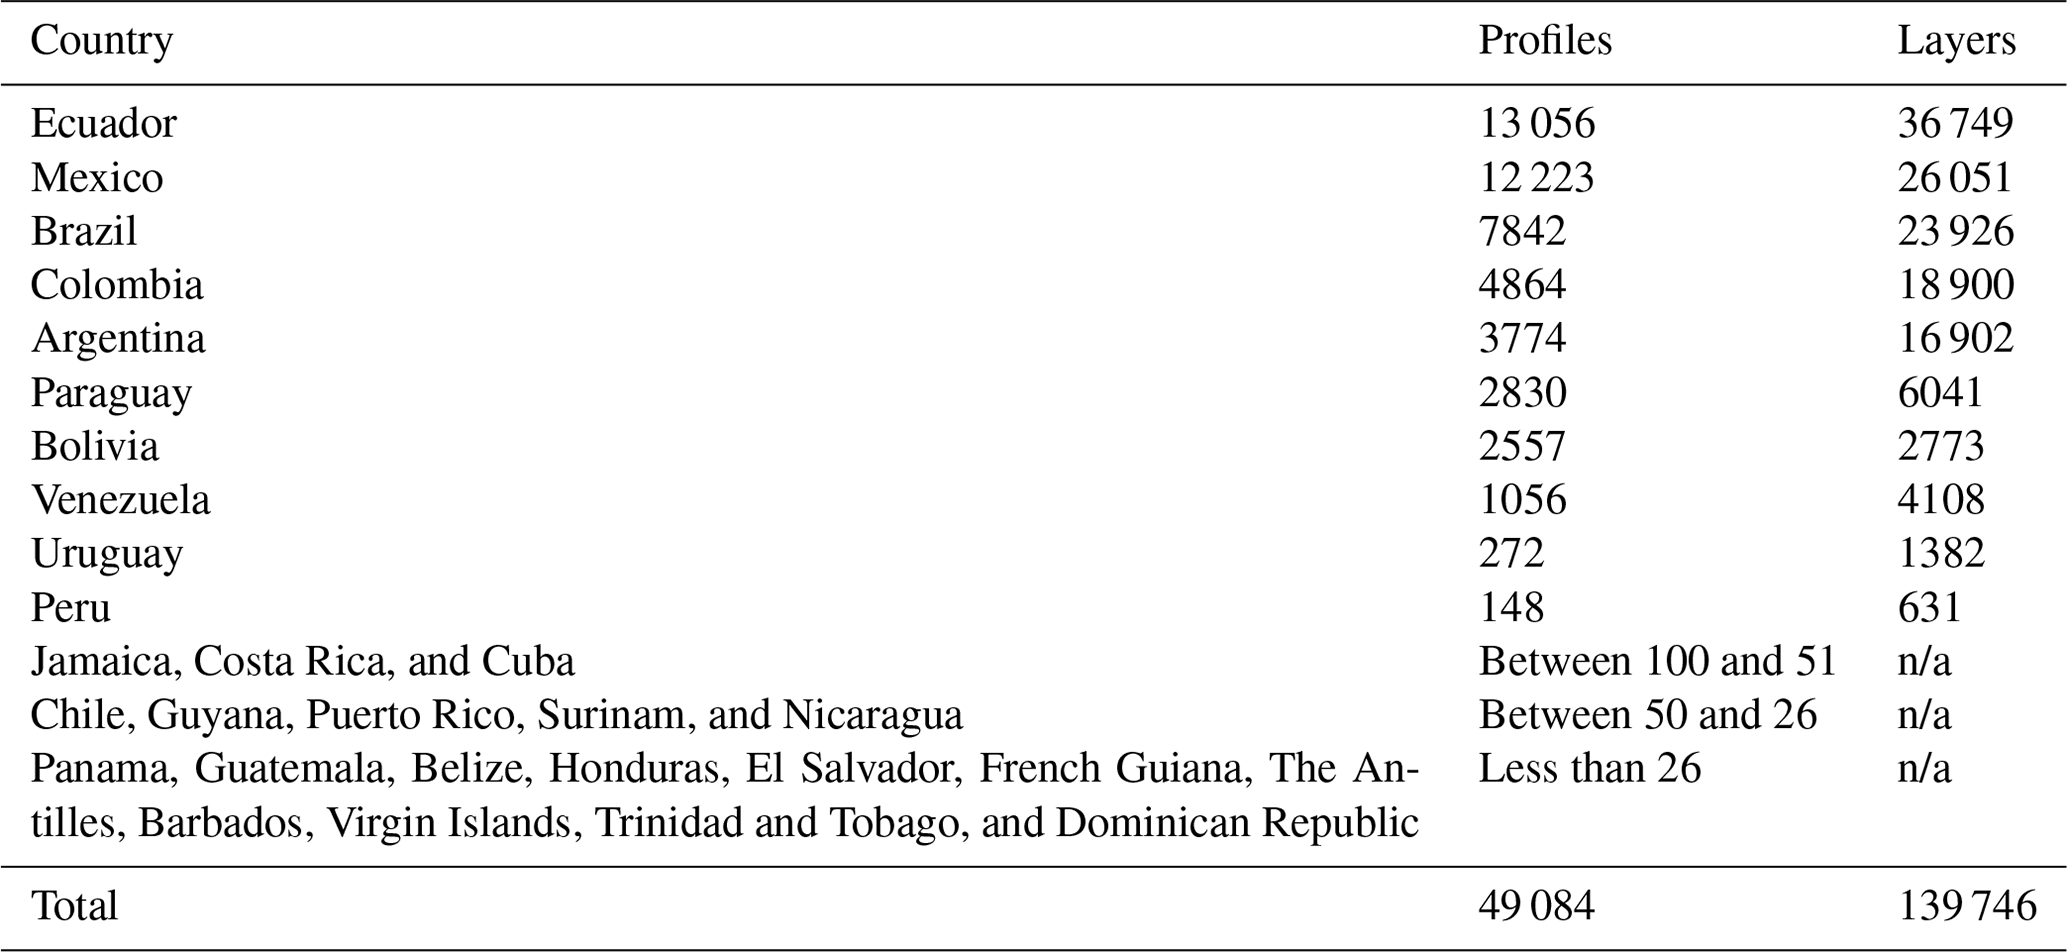
The SISLAC database, which can be downloaded from the official site (http://54.229.242.119/sislac/es, last access: 6 March 2024), consists of 49 084 profiles (with a total of 139 746 horizons). The number of these by country is detailed in Table 1. Validations are applied to 100 % of the data.
Table 1Initial profiles and their layers by country. The countries are ordered by the number of profiles, and those with fewer than 100 profiles were grouped together (n/a: not applicable).
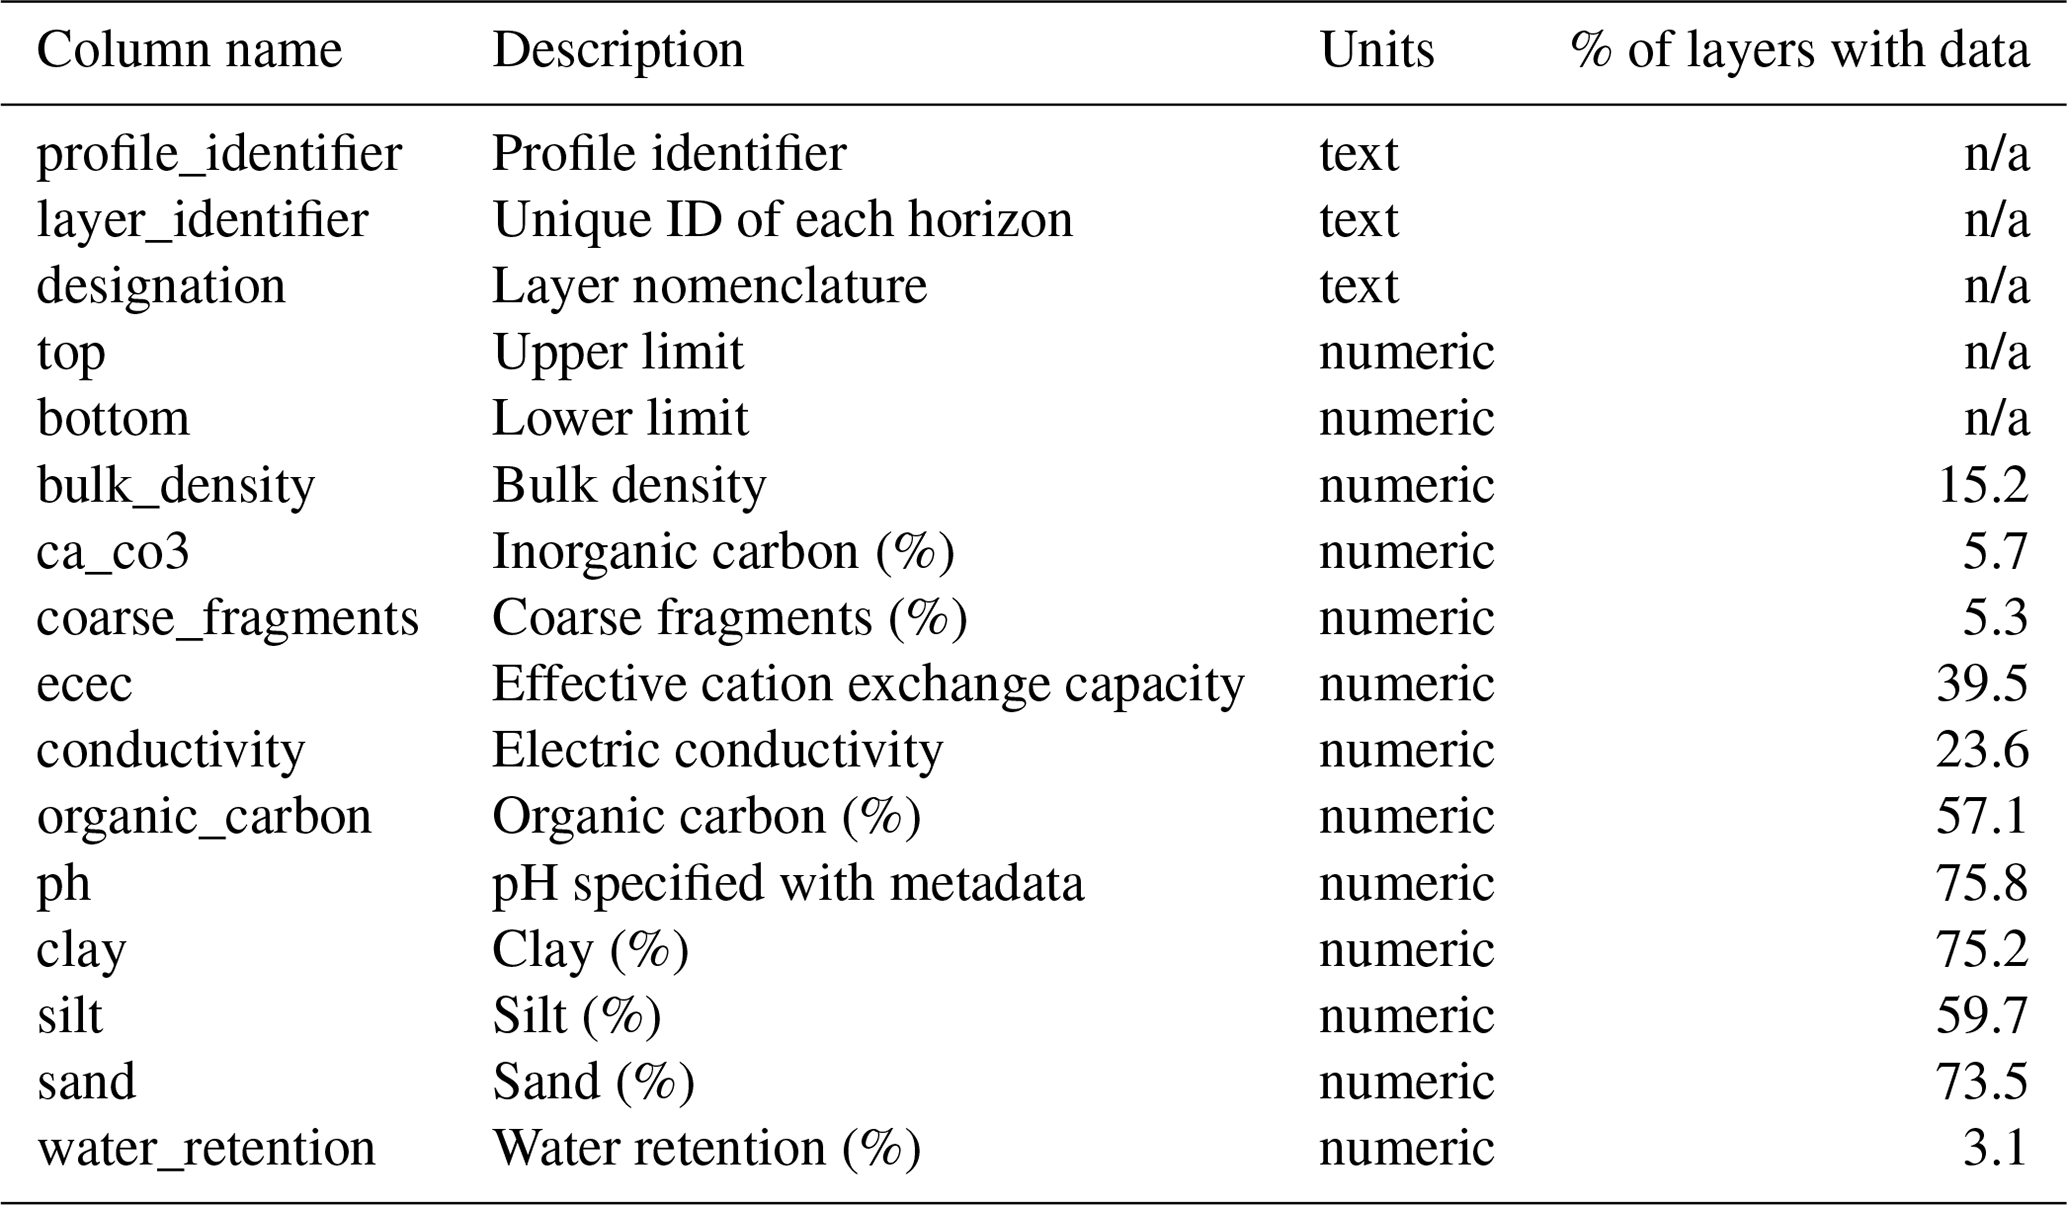
Profile attributes are detailed in Table 2, where the name of the attribute is listed in the first column, description in the second, and data type in the third. The location is given in geographic coordinates in WGS 84 datum. As for horizons and layers, their attributes are listed in Table 3 in the same way as they appear in the profiles.
Table 2Profile attributes and attributes related to the site description.
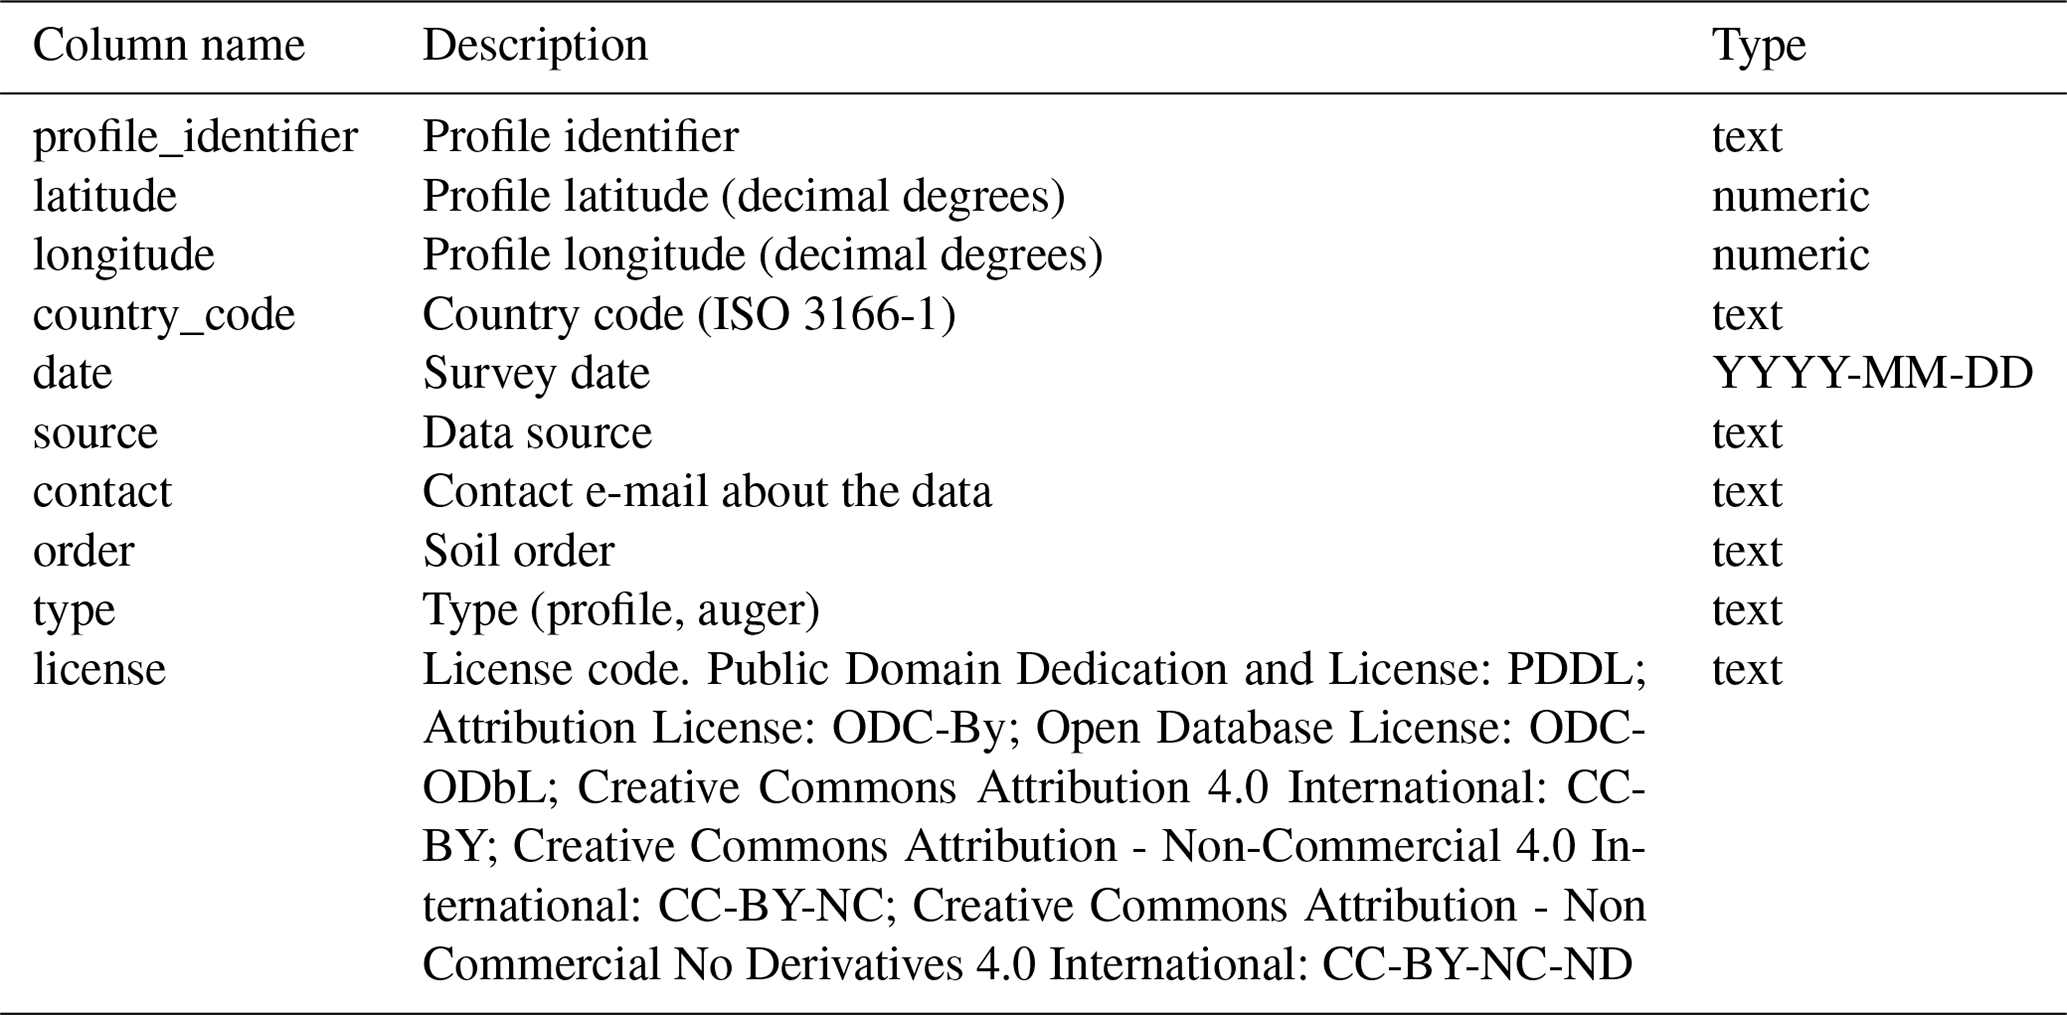
Table 3Layer attributes, where the measured attributes are numerical attributes (excluding the top and bottom, which are the limits of each layer); in the last column, for each attribute measured, the percentage of records with valid data is indicated (n/a: not applicable).
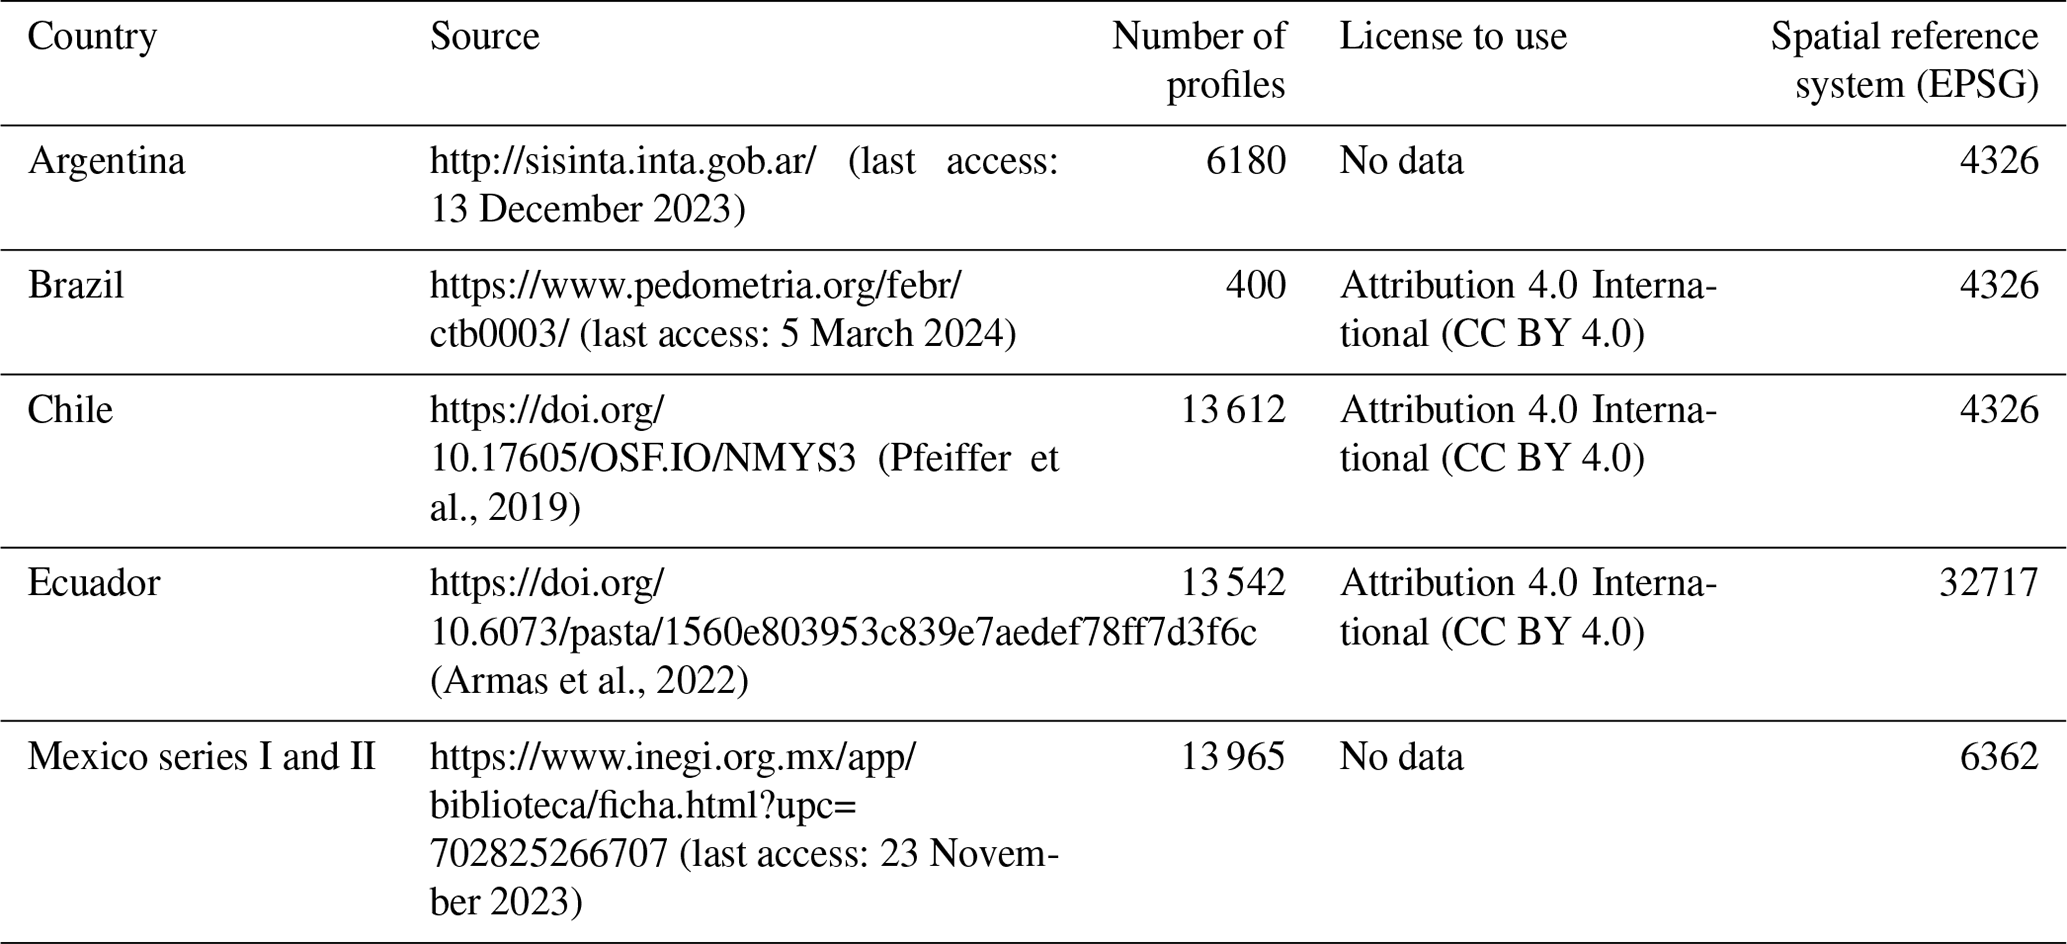
The additional available databases are listed in Table 4, detailing the country, link to the data, number of profiles, license of use, and spatial reference system. The data of the new version are in geographic coordinates, EPSG:4326, whereas those expressed in a different system are reprojected. As with SISLAC data, 100 % of the data is analyzed. The total number of profiles analyzed is 96 783. These databases contain more or fewer attributes than those of the SISLAC structure; in this case, only those within the SISLAC structure will be processed.
Table 4List of databases available for incorporation into the new version of SISLAC.
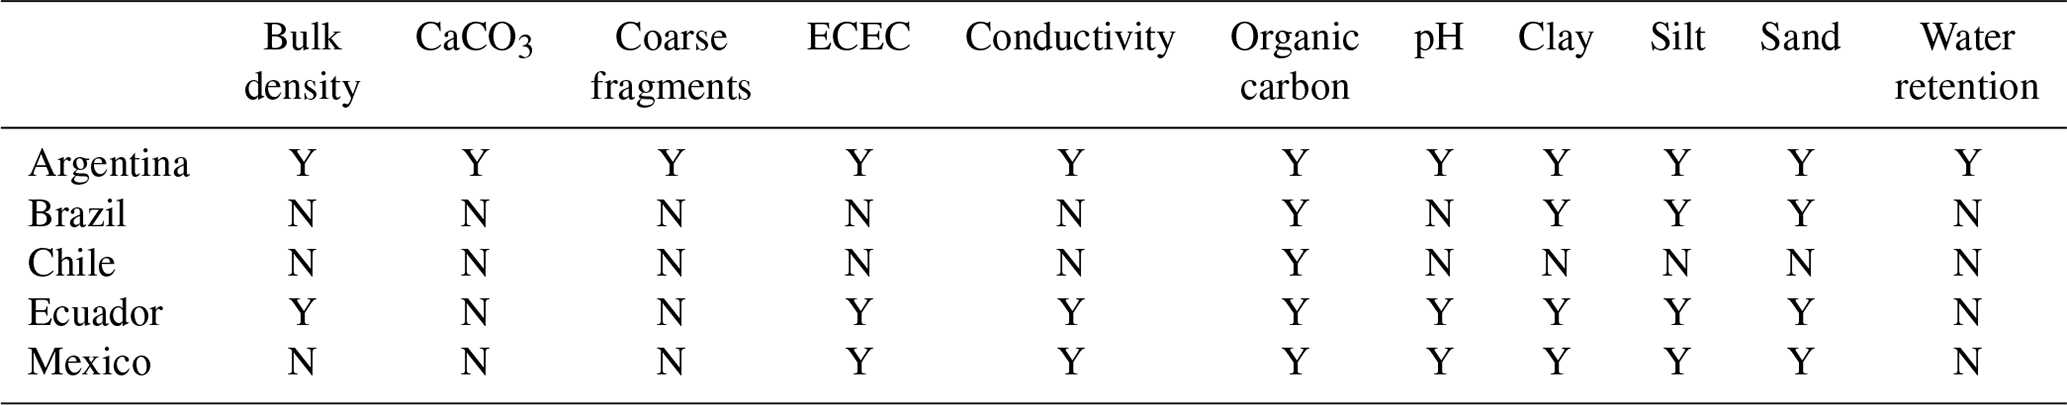
The above databases have different structures and attributes. Table 5 lists the SISLAC attributes found in those databases that are added to this one. As can be seen, SOC is the common attribute in all of the databases, followed by clay, silt, sand, and pH.
Table 5SISLAC physical and chemical property attributes available in the databases. The attribute in common is soil organic carbon (SOC). The databases of Argentina, Ecuador, and Mexico have the most attributes in common (Y: yes and N: no).
2.3 Methods
2.3.1 Quality assessment and improvement of SISLAC data
The evaluation of the quality and the improvement of the data were carried out in three stages, the first two for the site data and the third for the different layers. The first stage consisted of checking that the profiles were in the correct location (spatial correspondence). It was carried out by spatial intersection between the profiles (points) and the cartography of the countries (polygons). Based on the country_code attribute of the profiles, this correspondence was verified, and those that coincided with their respective country were considered valid (Fig. 3a). Those that did not coincide were verified one by one; those that were within the limits of their country, considering the cartographic scale of the reference information, the precision of the equipment with which the coordinate was taken, or the reference systems under which original data were taken and were considered valid (Fig. 3b). Still, others had the coordinates inverted (Fig. 3c) and the latitude and longitude values exchanged, and their correspondence was verified again. Finally, the profiles outside their zone that could not be corrected for having the wrong location were excluded (Fig. 3d).
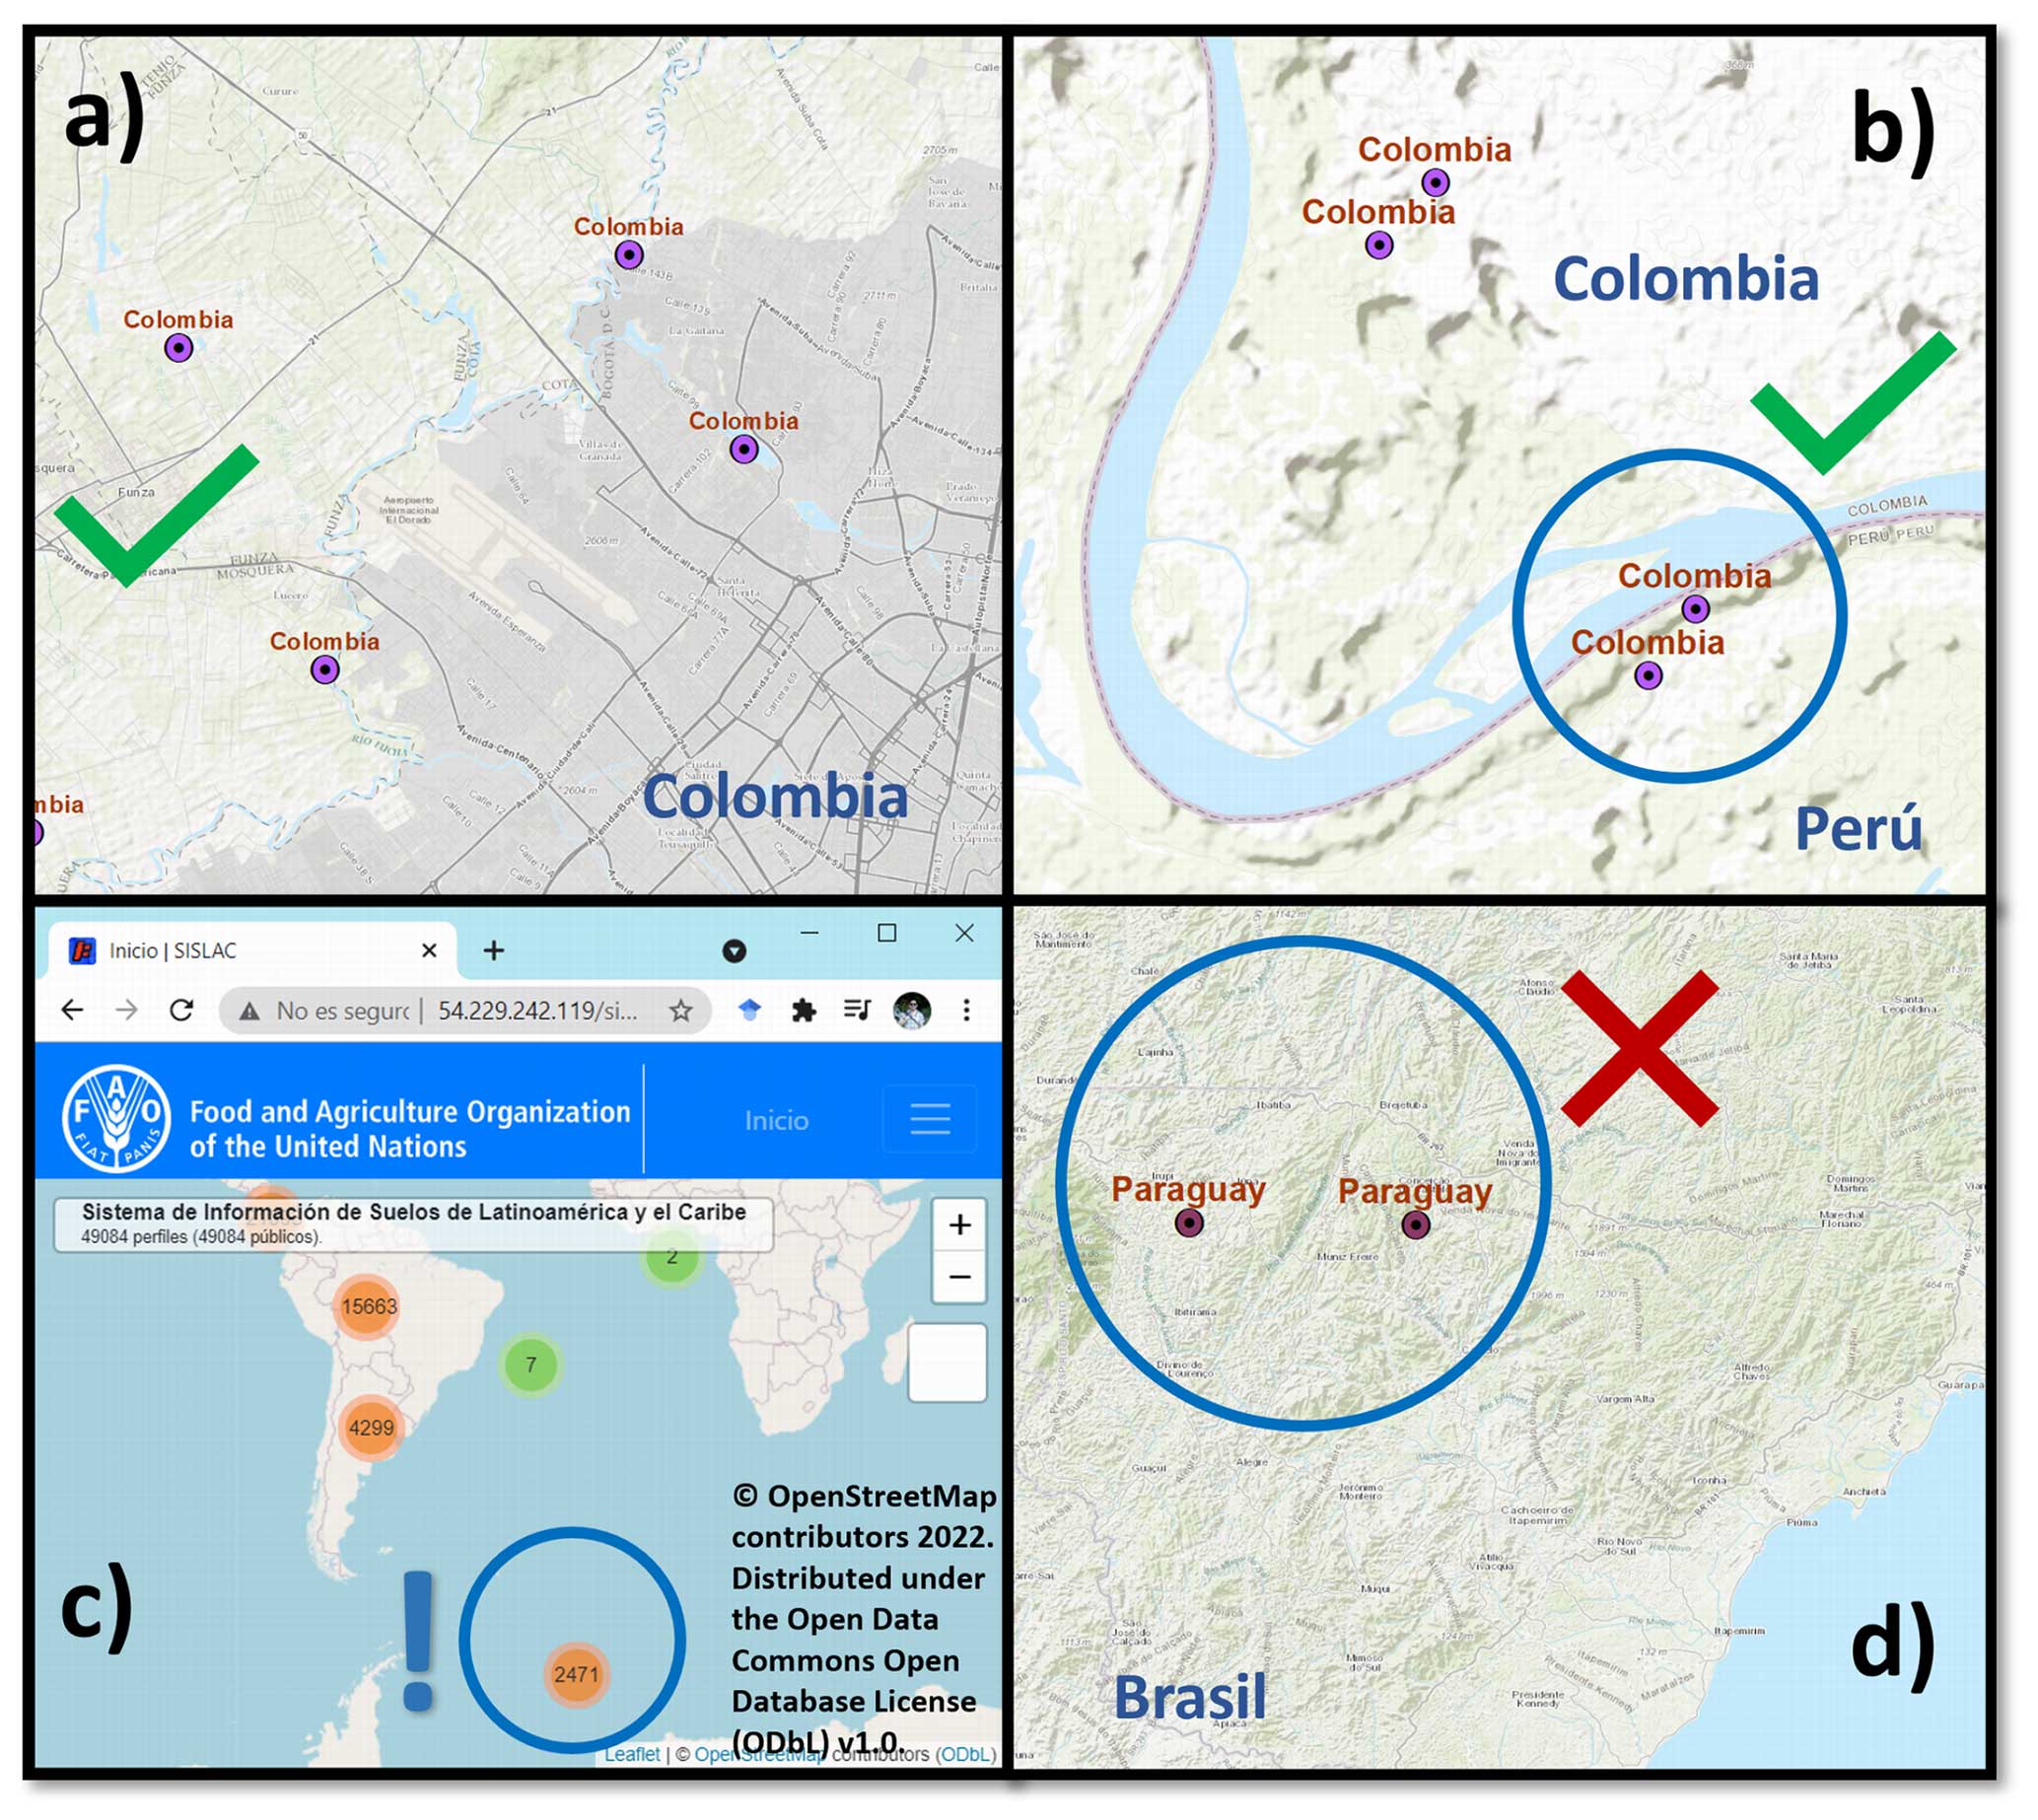
Figure 3Example of criteria found in spatial validation (the source for panels a, b, and d is ESRI, 2022; the source for panel c is the SISLAC web page).
The second stage consisted of verifying if there were overlapping profiles in addition to verifying if the values in their attributes were different. For this, the number of times the same pair of coordinates is to be repeated was validated en masse. Unlike the previous validation, these cannot be arbitrarily excluded since the correct profile cannot be determined. Those with duplicity were then marked so the user of the data can use the ones they consider appropriate. A new attribute in the profiles (perfil_duplicado of binary type) indicates if the profile has duplicity (TRUE) or is unique (FALSE). With respect to the additional databases, the existence of these profiles in SISLAC is also verified. If this occurs, the profiles with the highest number of valid attributes are be validated in order to be kept in the new database.
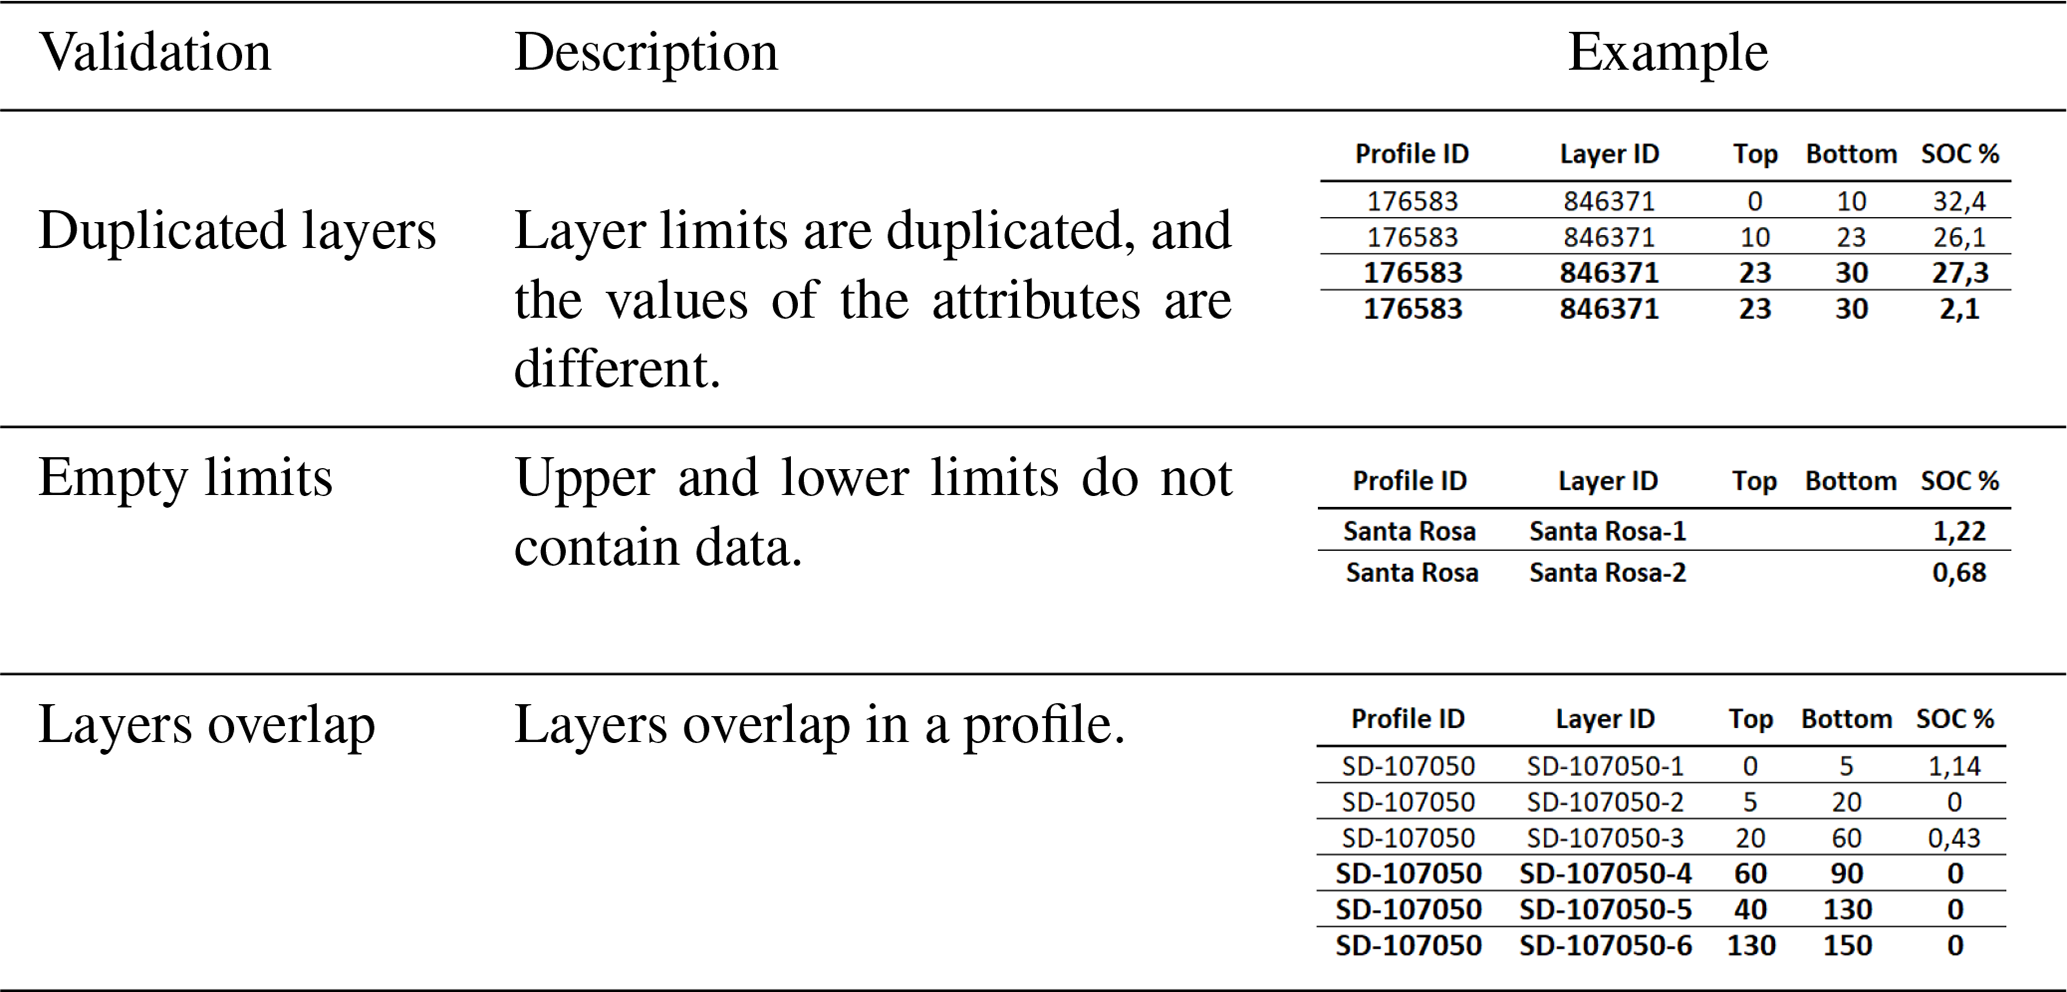
The third stage consisted of validating the description of the horizons or layers of each profile, verifying that , where u is the upper limit and v the lower limit. The upper limit of the layer must be lower than its lower limit, and the lower limit must be lower than or equal to the upper limit of the next layer. Gaps may exist, but there is never overlap between layers. Gaps can occur for reasons such as the data not being taken at the site, the loss of data in the office, or an error or omission in transcription. Errors, those in which the structure could not be corrected, were first validated so these profiles could be excluded. Table 6 lists the three applied rules, their description, and an example of each.
Table 6Layer error validation. In the example, the layers with errors are highlighted in bold; for the first and third case, the last layers of the profiles are the ones with errors, while in the second case both layers have errors because the limits have no data.
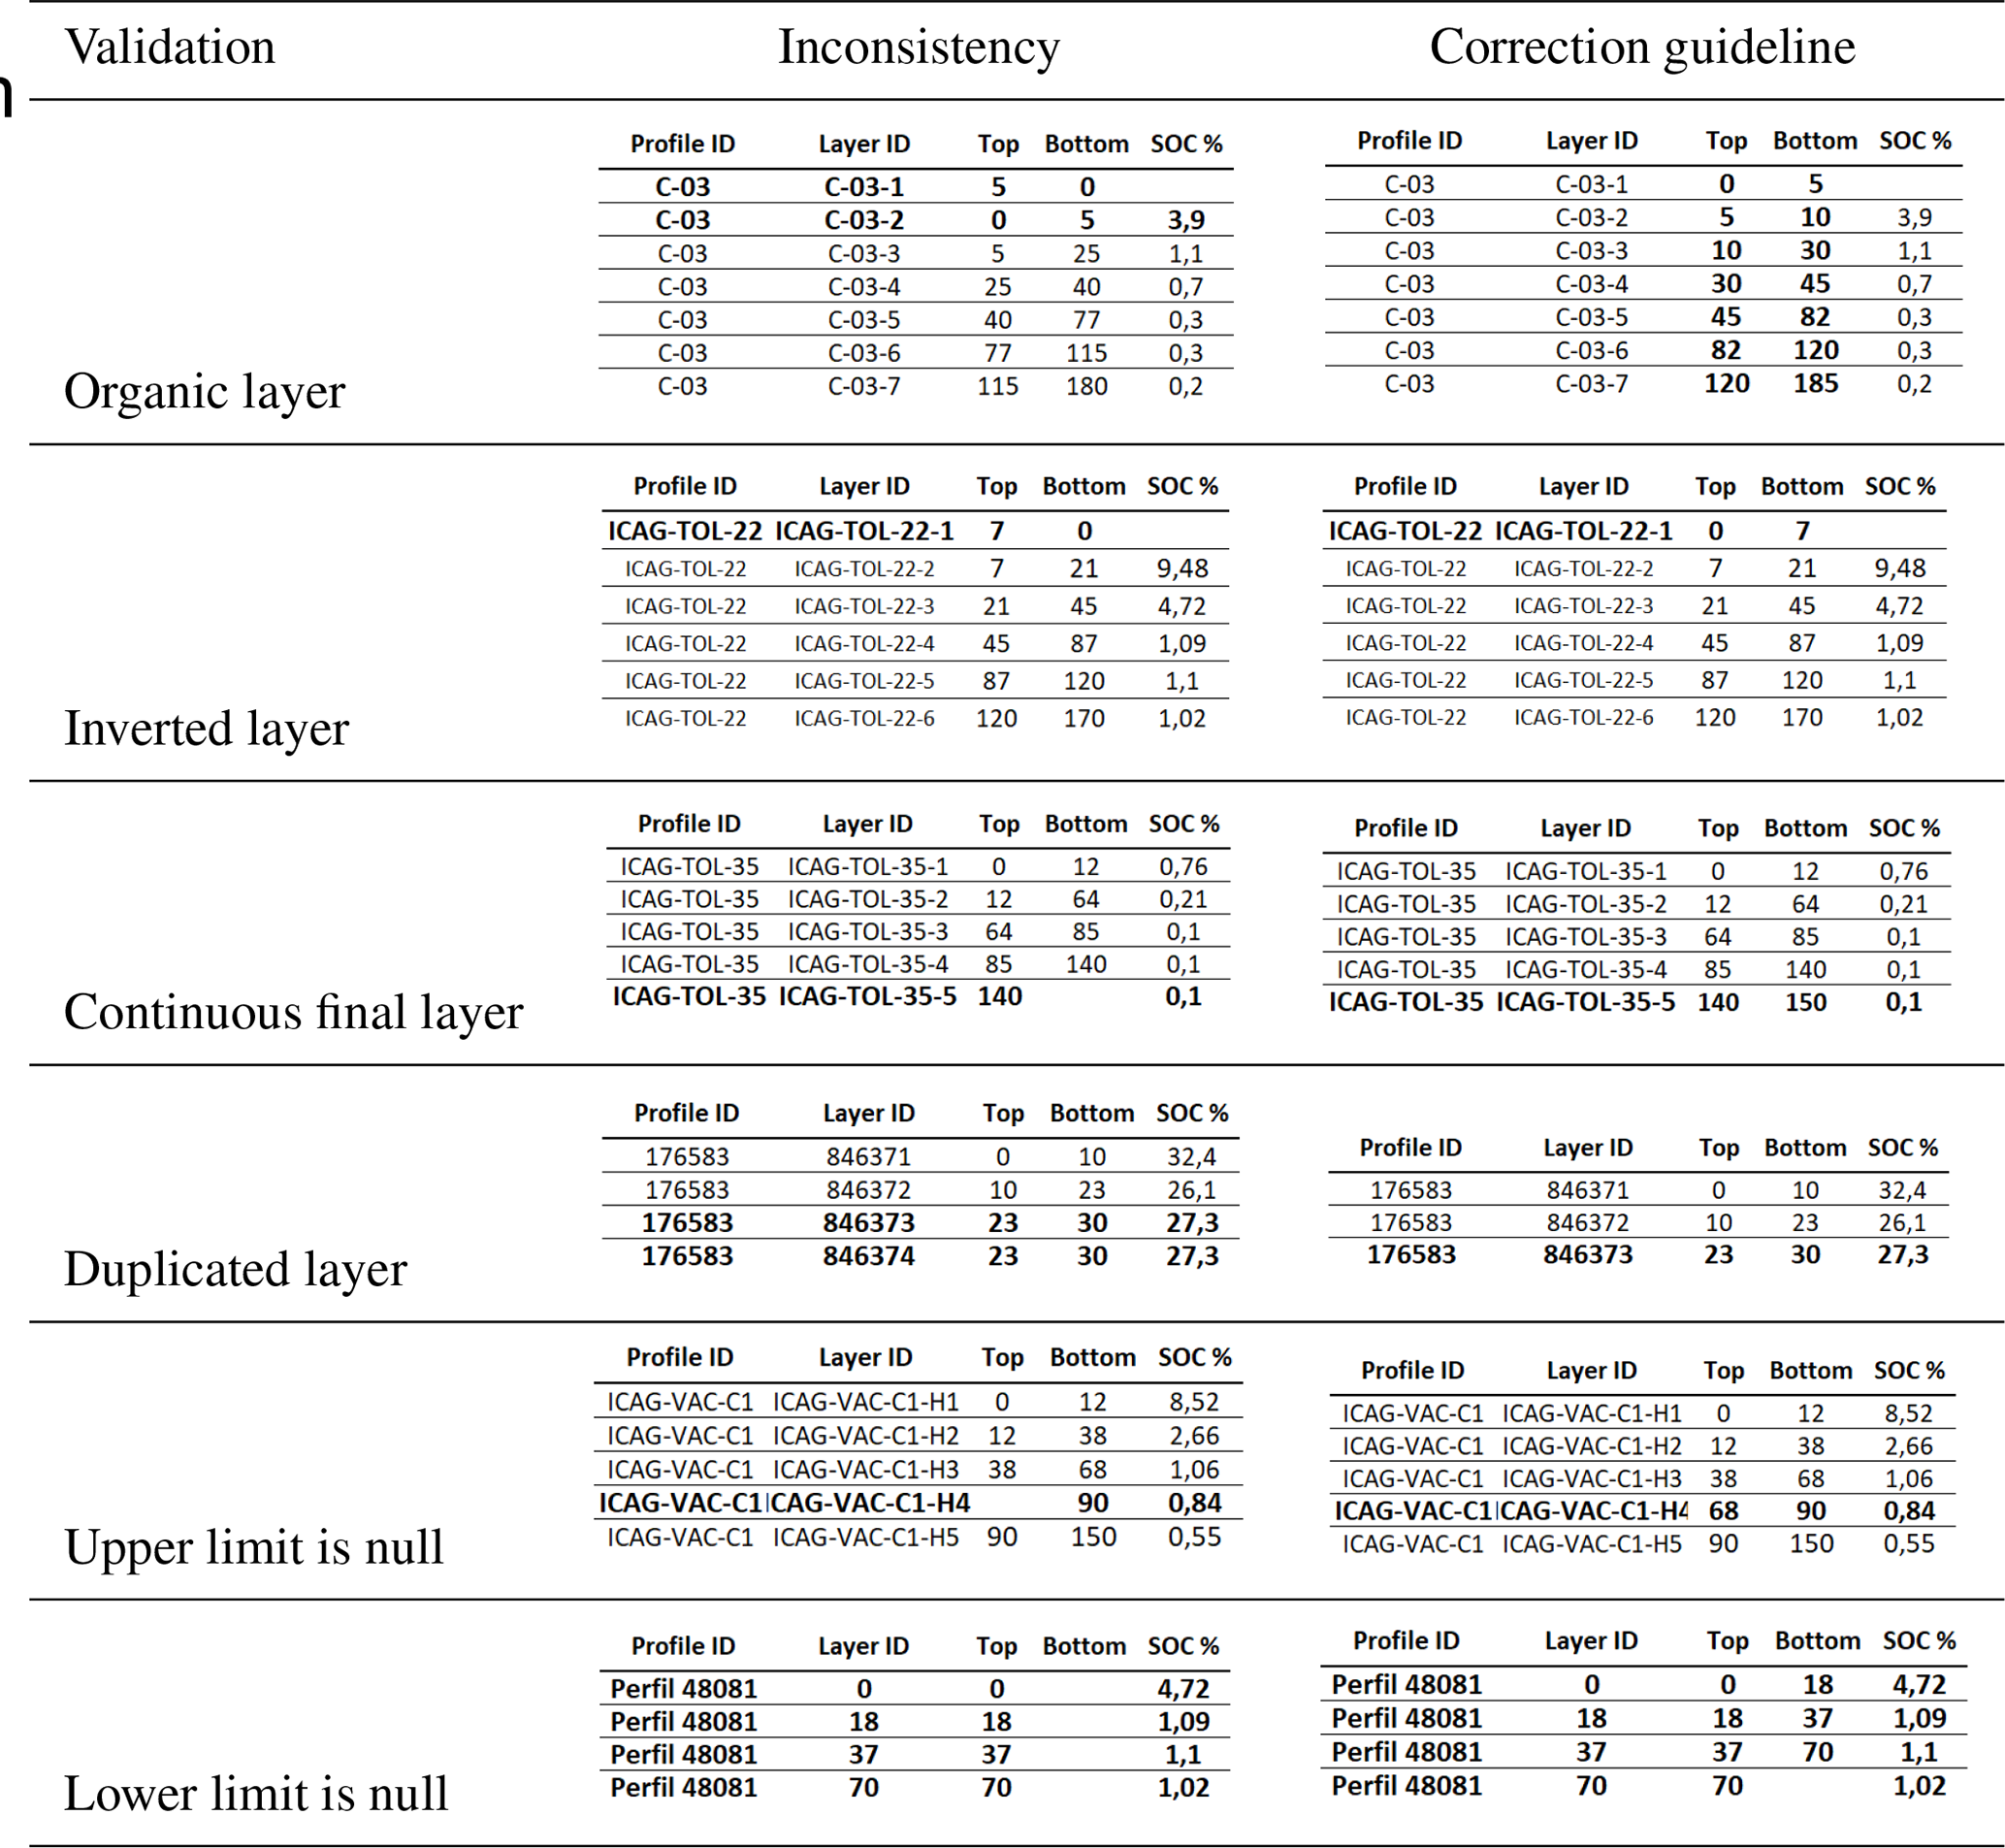
After excluding the profiles with errors, the existence of inconsistencies was validated. Unlike errors, these can be corrected by guidelines that do not alter the structure of the profile. Next, Table 7 lists the rules applied to their description and the guideline for their correction. For a better understanding of the content of Table 7, Table 8 below illustrates the described inconsistency (middle column) and how it was corrected (third column).
Table 7Description of the validation of inconsistencies and the guidelines for their correction.
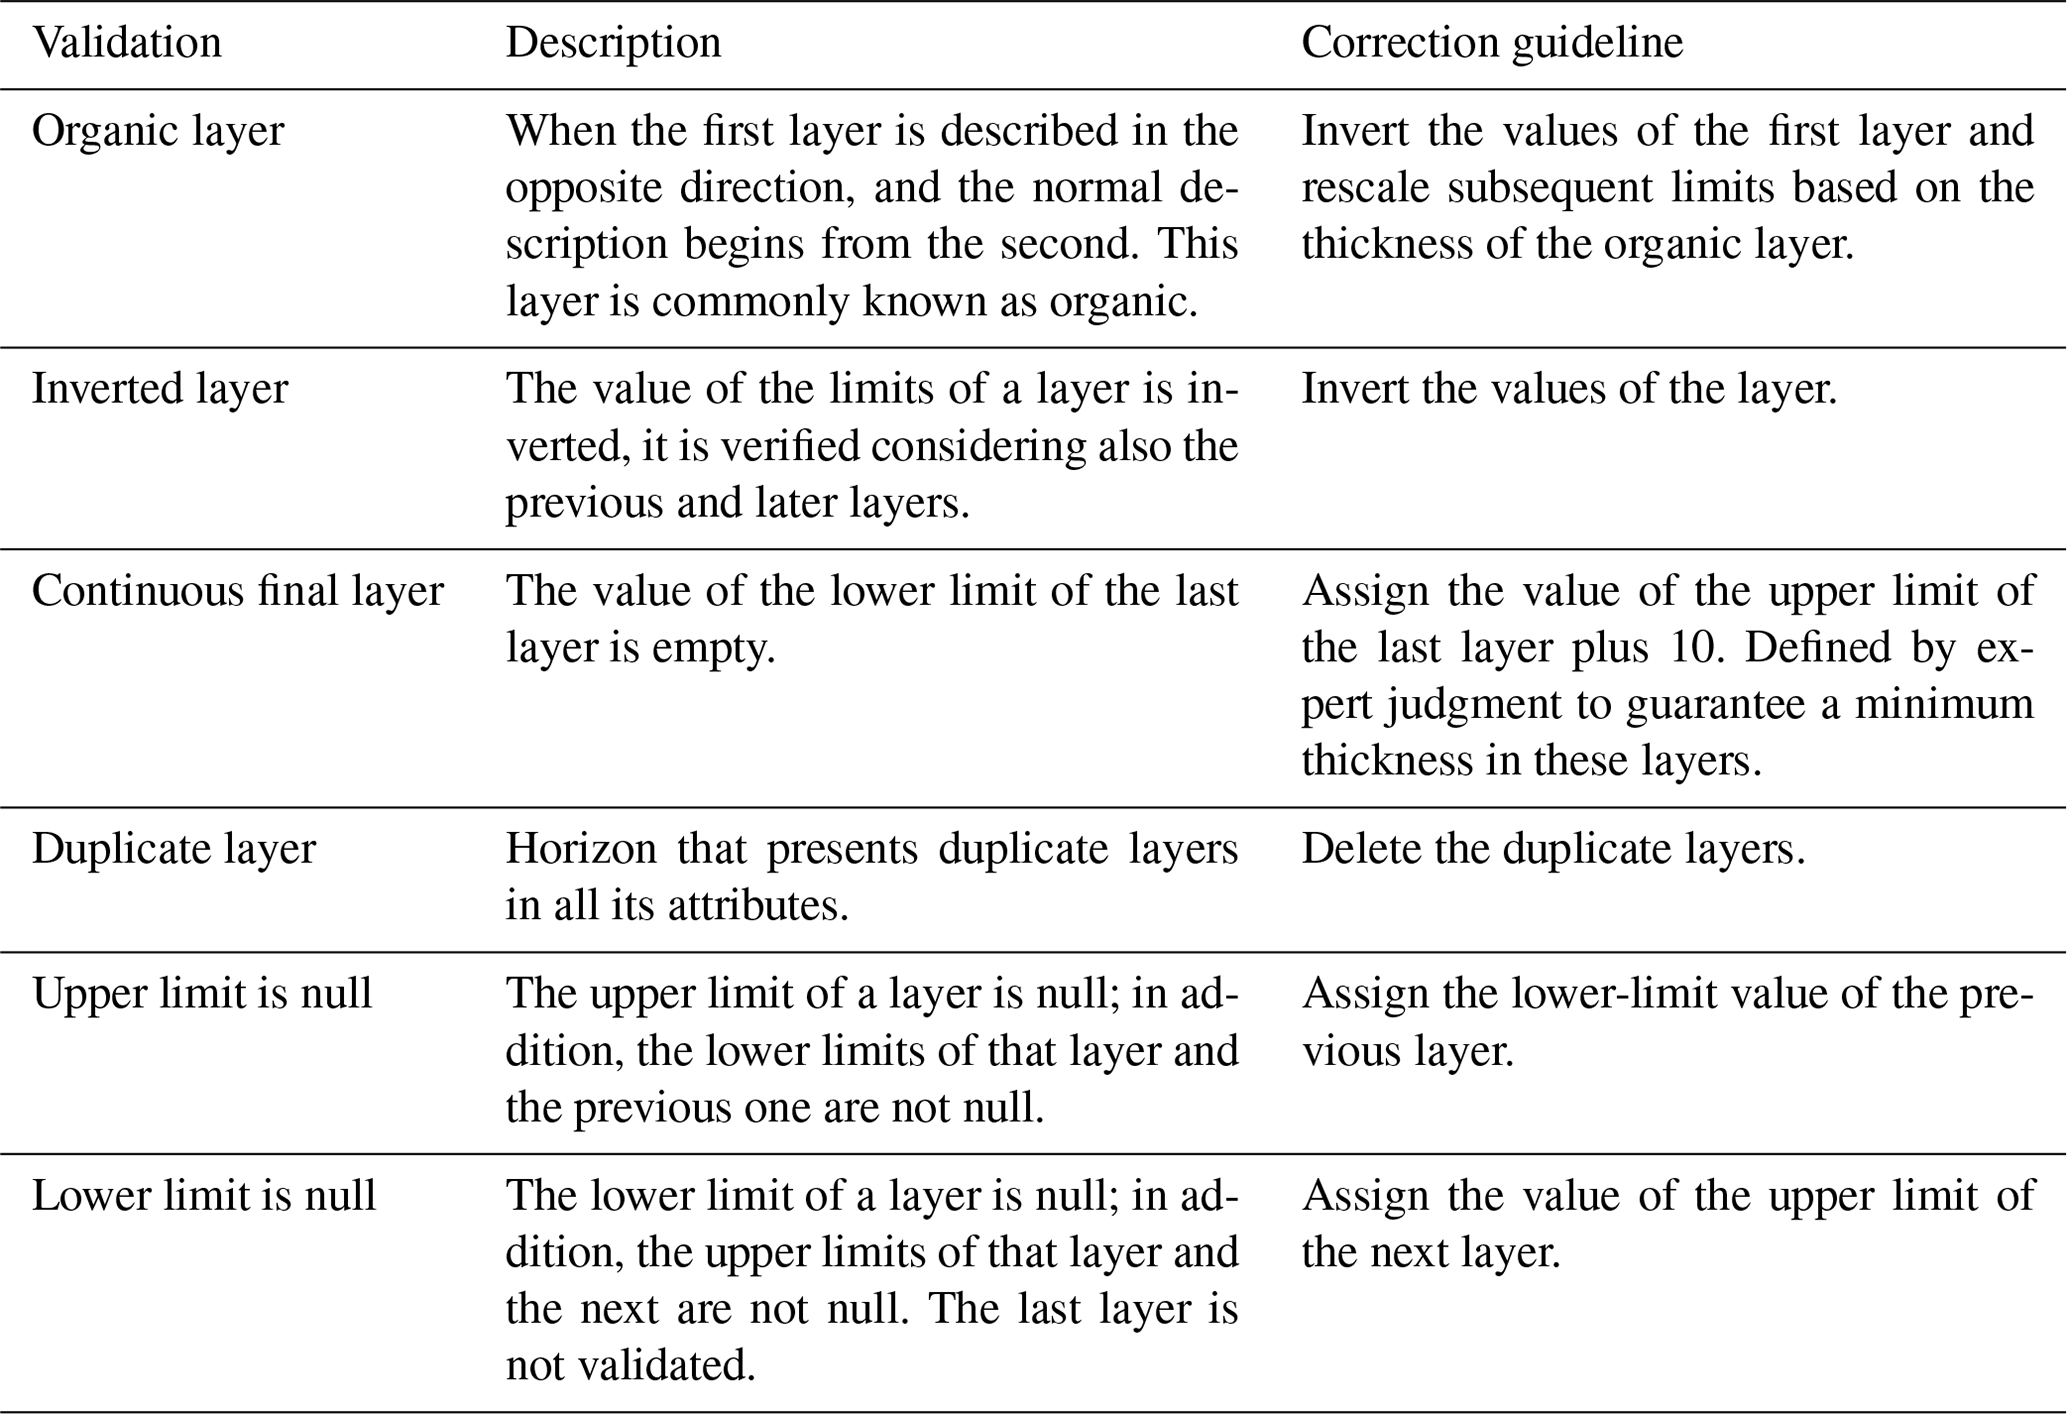
Table 8Illustration of inconsistencies and their correction guidelines. In the second column in bold the layers with inconsistency are shown; in the third column, also in bold, it is shown how to correct them using the established guidelines. In the first case all profile limits are modified and for the rest only those of the layer with inconsistency.
2.3.2 Brief characterization of Latin American and Caribbean (LAC) soils using the new SISLAC database
After applying the workflow presented in this research, we obtained a new harmonized database for Latin America of soil profiles that meet minimum integrity requirements for use in different applications such as soil characterization, soil function evaluation, soil process recognition, and soil impact identification in the ecosystems. Finally, in this research, we present a brief characterization of Latin American and Caribbean (LAC) soils through a principal component analysis (PCA).
The PCA included profile characteristics (soil variables), profile depth, number of profile horizons, and profile classification according to the World Reference Base for Soil Resources (IUSS Working Group WRB, 2007). The soil variables used were effective cation exchange capacity (ECEC), pH, organic carbon (OC), and clay and sand content. These variables were selected because they are those with the highest number of records in the database. To represent the soil profile at each site using the values registered by the horizon, the mean, minimum (min), and maximum (max) of each variable were calculated. The profile depth was identified as the maximum value of each site's “bottom” variable. Finally, the profile classification was obtained from the most probable soil group layer from SoilGrids at a spatial resolution of 250 m.
Finally, 18 variables (17 quantitative and 1 qualitative) were included in the PCA. Those soil groups with fewer than 100 profiles were removed from the dataset, and finally, a total of 27 960 soil profiles (those with complete cases) distributed in the LAC region were analyzed. The PCA was performed with the FactoMineR package in R (Lê et al., 2008).
3.1 Quality assessment and improvement of SISLAC data
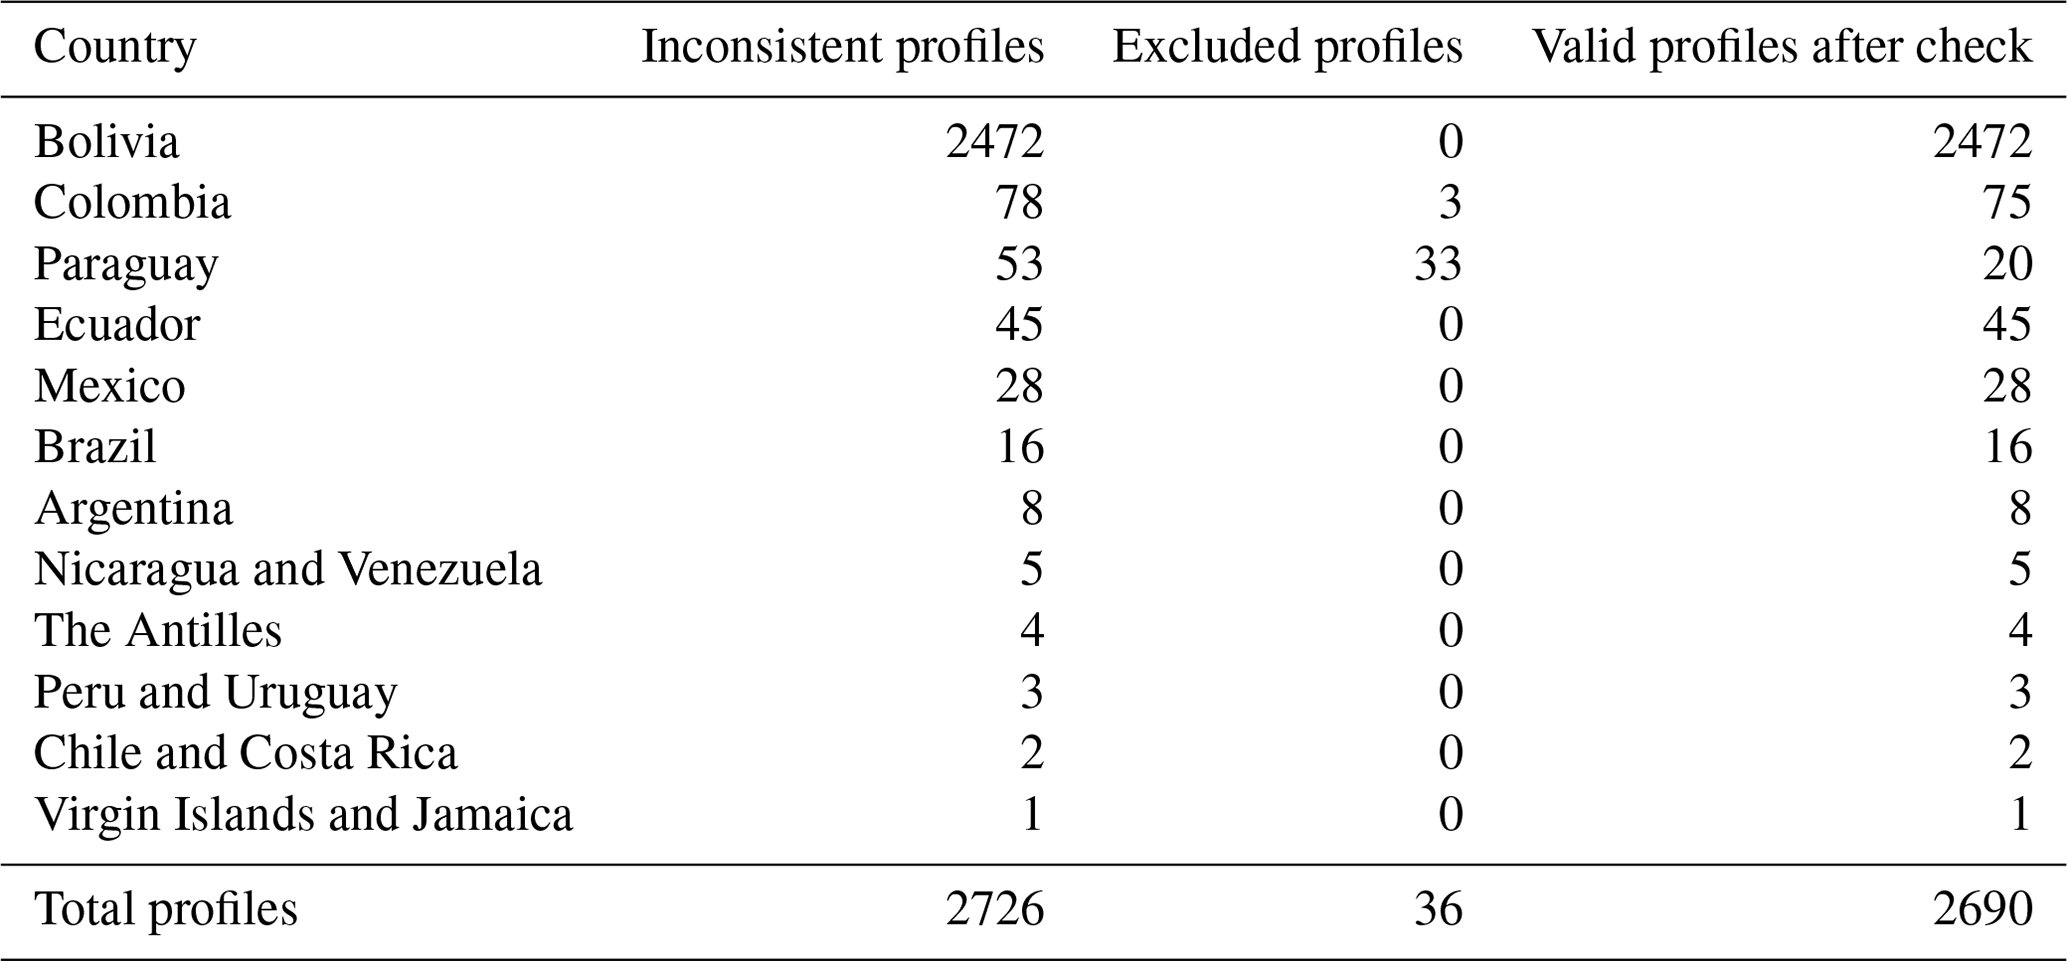
With the first validation, 2726 profiles were found that did not match their country. Table 9 lists these profiles at the country level. As can be seen, Bolivia has the largest number of these with 2472 profiles (90 % of the cases). After the review, it was identified that 2471 of those cases (from Bolivia) had the coordinates inverted, so after changing the values and their validation, their correct location was verified, and they were considered valid. A total of 36 profiles (1.3 % of those reviewed) were excluded for having an erroneous location, as presented in Fig. 3d, of those 3 from Colombia and 33 from Paraguay. A total of 96 747 profiles (of the initial 96 783 considering SISLAC and the additional databases) passed the second validation.
Table 9Spatial validation results sorted by country with the highest number of inconsistencies (second column); the third column indicates how many profiles were excluded, and the fourth column indicates how many were considered valid after being reviewed one by one.
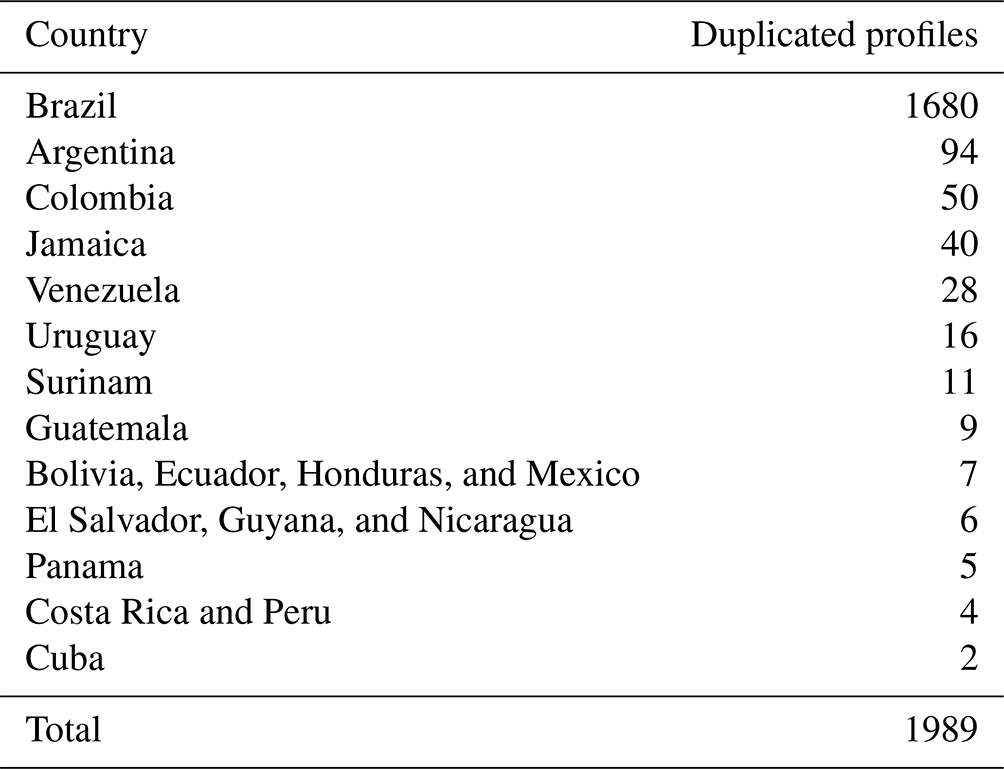
With the second part of the validations, 1989 duplicate profiles were identified in SISLAC. Table 10 lists the country and the number of these profiles. The largest number is concentrated in Brazil, 1680, which is 84.5 % of the total and 21 % of the total profiles provided by that country (of 7842). As commented in the previous section, the profiles with duplicity were marked in the table; the profiles with duplicity in the perfil_duplicado field contain the value TRUE. In addition, profiles that already existed in SISLAC were excluded from the available databases. In Argentina, the number of these profiles was 3374 out of 6180, in Ecuador 4633 out of 13 542, and in Mexico 7274 out of 13 965.
Table 10Profiles from SISLAC with spatial duplication by country.
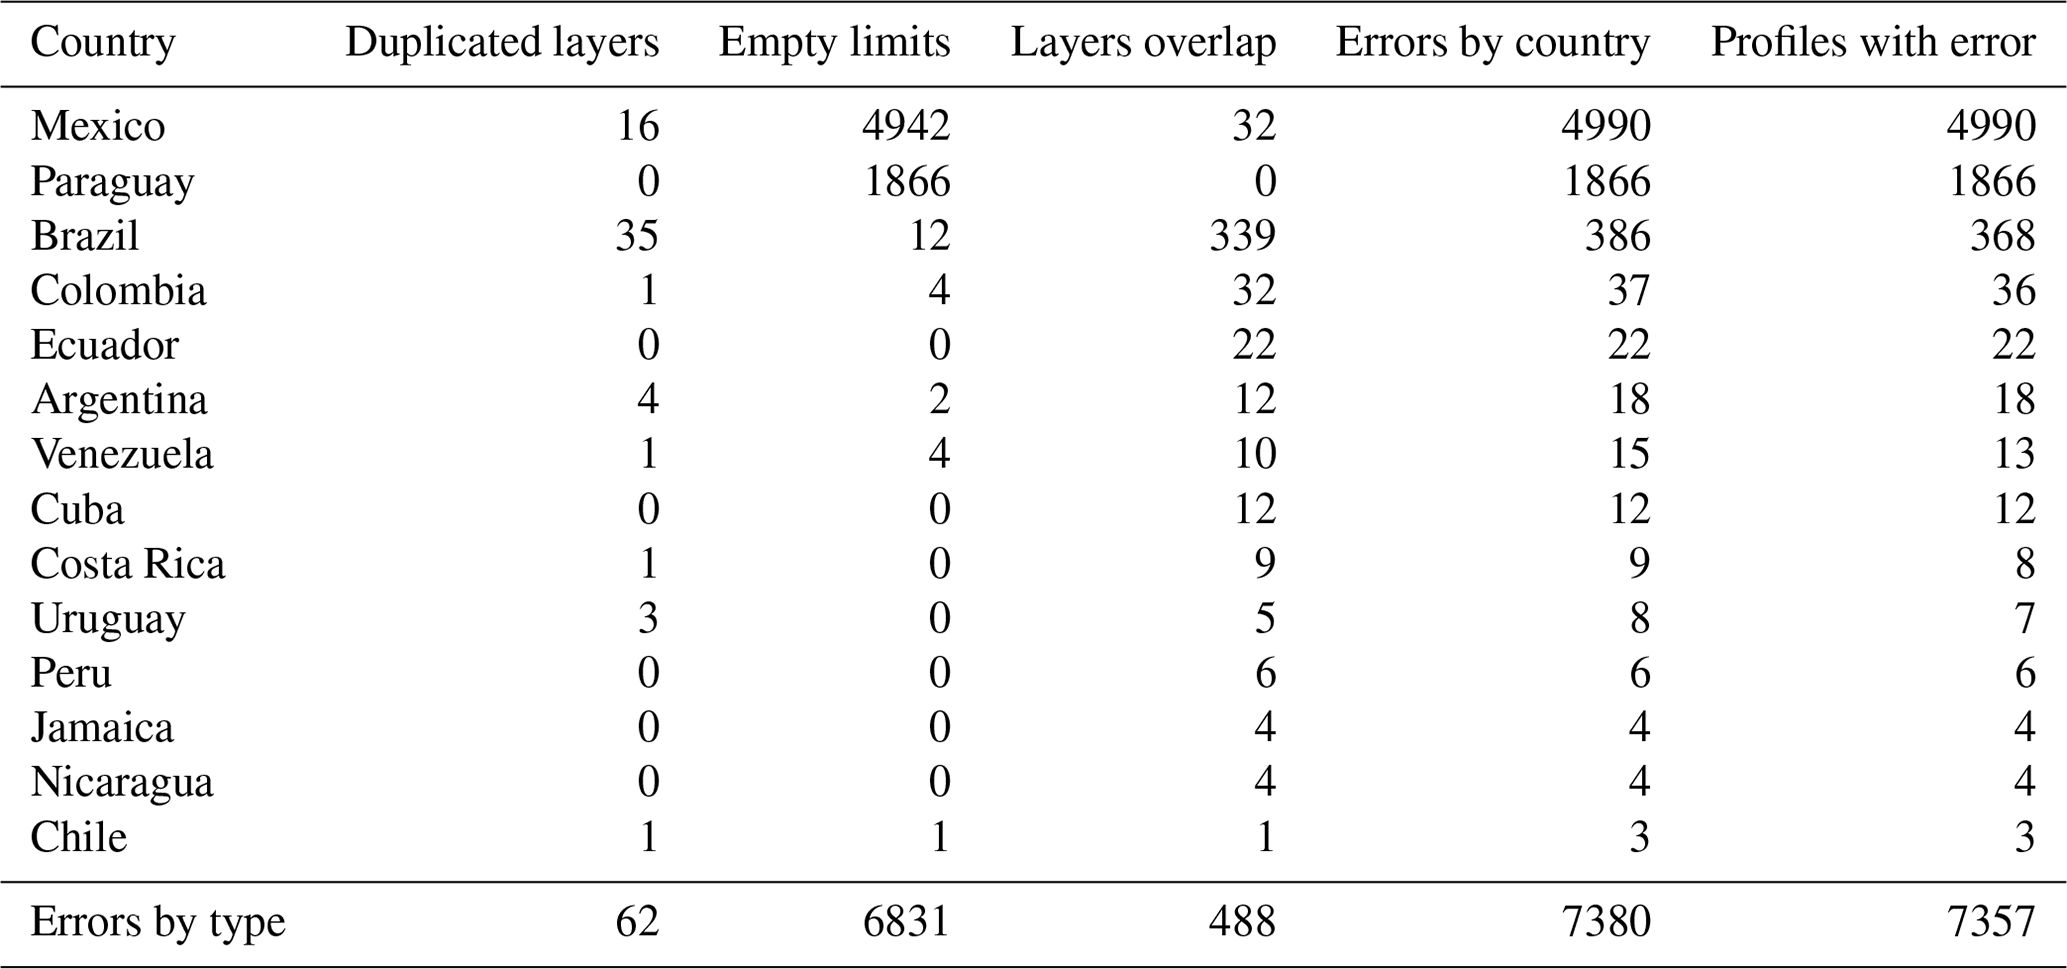
Regarding the revision of the horizons from SISLAC, 7380 errors were found (in 7357 profiles). Table 11 details the number of these by country and type. Most were present in profiles from Mexico, Paraguay, and Brazil. Profiles with empty limits were the main error with 6831 cases. Those 7357 profiles were excluded for being inconsistent. On the other hand, in the additional data, 61 profiles from Argentina, 13 from Chile, and 67 from Ecuador were found to have overlapping horizons, and 6493 profiles from Mexico had empty limits, so they were also excluded. An additional point was presented with the data from Mexico; the SISLAC data (12 223 profiles) were the same as those of series I and II (13 965). The first ones had fewer attributes and an incorrect spatial location, and for that reason all the data from Mexico were replaced by the valid profiles from series I and II.
Table 11Layer error validation; only countries with errors are listed. The profiles with errors may be fewer than the errors per country because one profile may have more than one type of error.
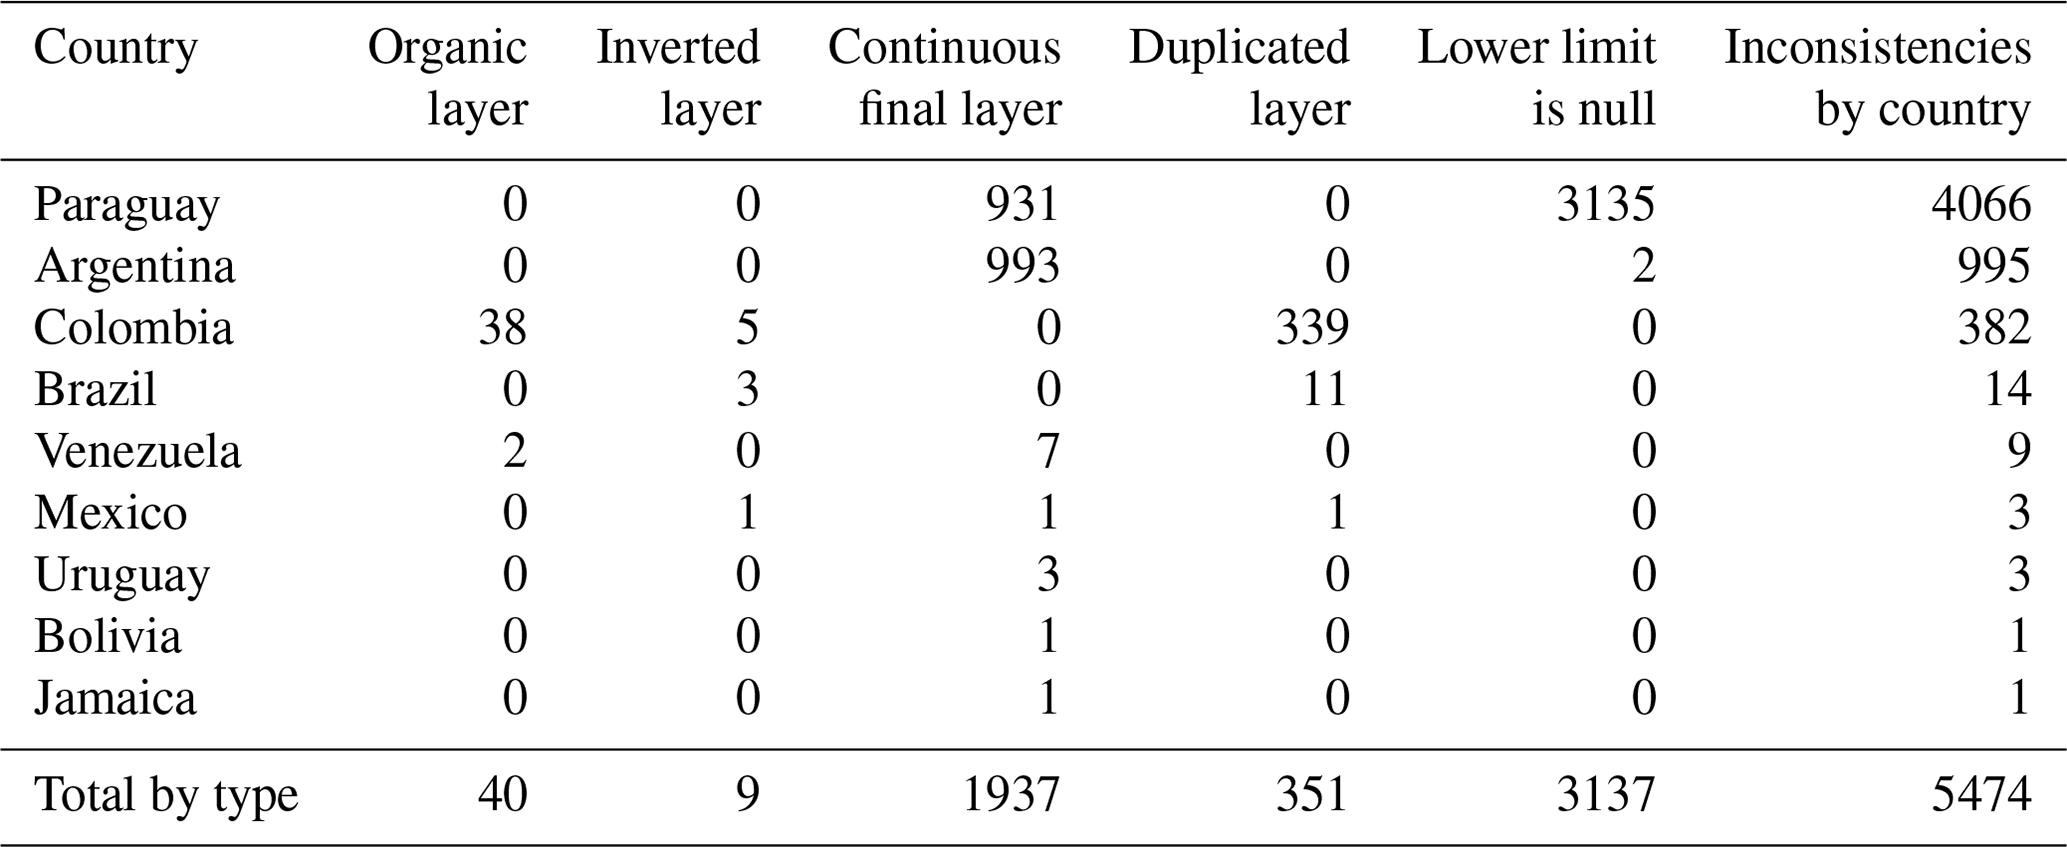
Inconsistencies are described in Table 12. Most were found in Paraguay, Argentina, and Colombia. The main causes were the null lower limit, continuous final horizon, and duplicate horizon. All of these were corrected according to the established guidelines. Although 5474 inconsistencies were found, these correspond to 2215 profiles, so there were profiles with more than one inconsistency; for example, although in Paraguay there are 4066 inconsistencies, these are present in 931 profiles, the total number of profiles from that country.
Table 12Layer inconsistency validation; in these, the bottom limit with null validation was the only one that did not present records with this inconsistency.
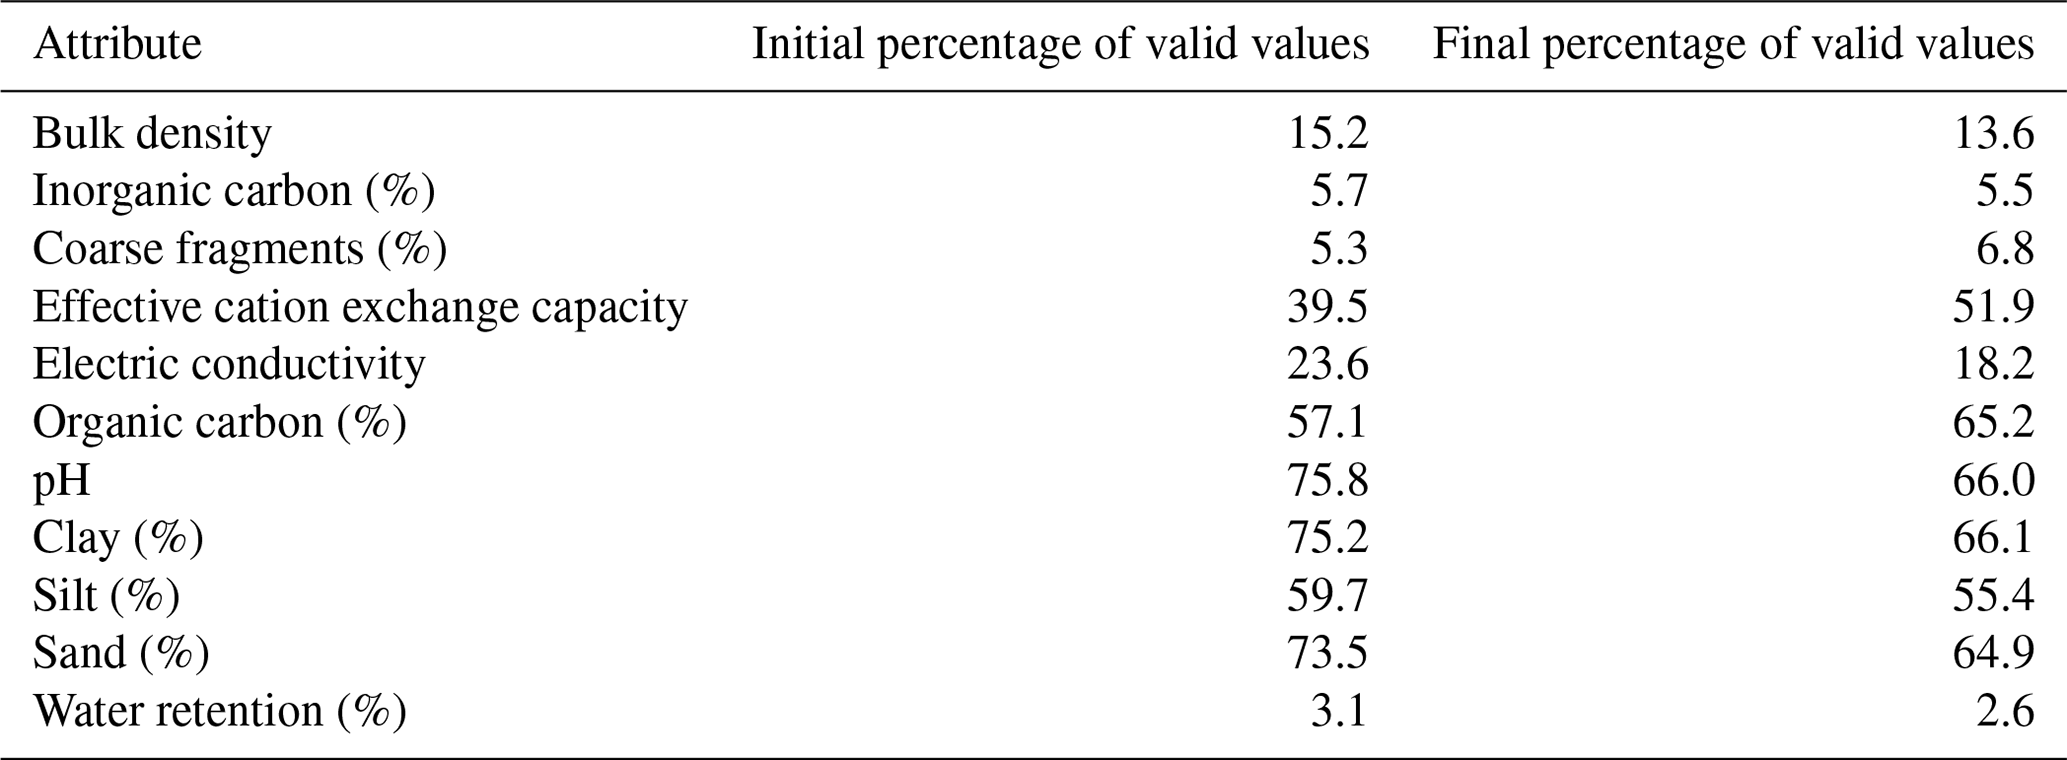
Finally, the following tables summarize the results obtained. First, Table 13 lists the countries with a change in the number of profiles. As can be seen, there was an increase in the first five countries, since the available databases correspond to these countries, while for the following countries profiles were excluded due to errors in their descriptions. In addition, Table 14 lists the sources of the data that contribute to this new version of SISLAC; as can be seen, there are almost 10 000 profiles obtained from WoSIS, and the rest are contributed by institutions in the countries of the region. To conclude, Table 15 shows the initial and final percentage of records with valid values for the soil property attributes, showing that SOC, pH, clay, silt, and sand are the attributes with the highest percentage. From SISLAC, after the processes carried out, of the 49 084 initial profiles 15 % were excluded and another 4.5 % were corrected so that they met the minimum integrity requirements; in addition, 17 % of the profiles in the other databases already existed in SISLAC. Of the 96 783 total profiles analyzed, 32 % were excluded due to erroneous descriptions or because they already existed in the SISLAC data. The revised version consists of 66 746 profiles made up of 192 568 horizons and layers.
Table 13Details of the SISLAC data validation processes; total numbers of layers are in parentheses, and the errors caused the profile to be excluded, while the inconsistencies were corrected.
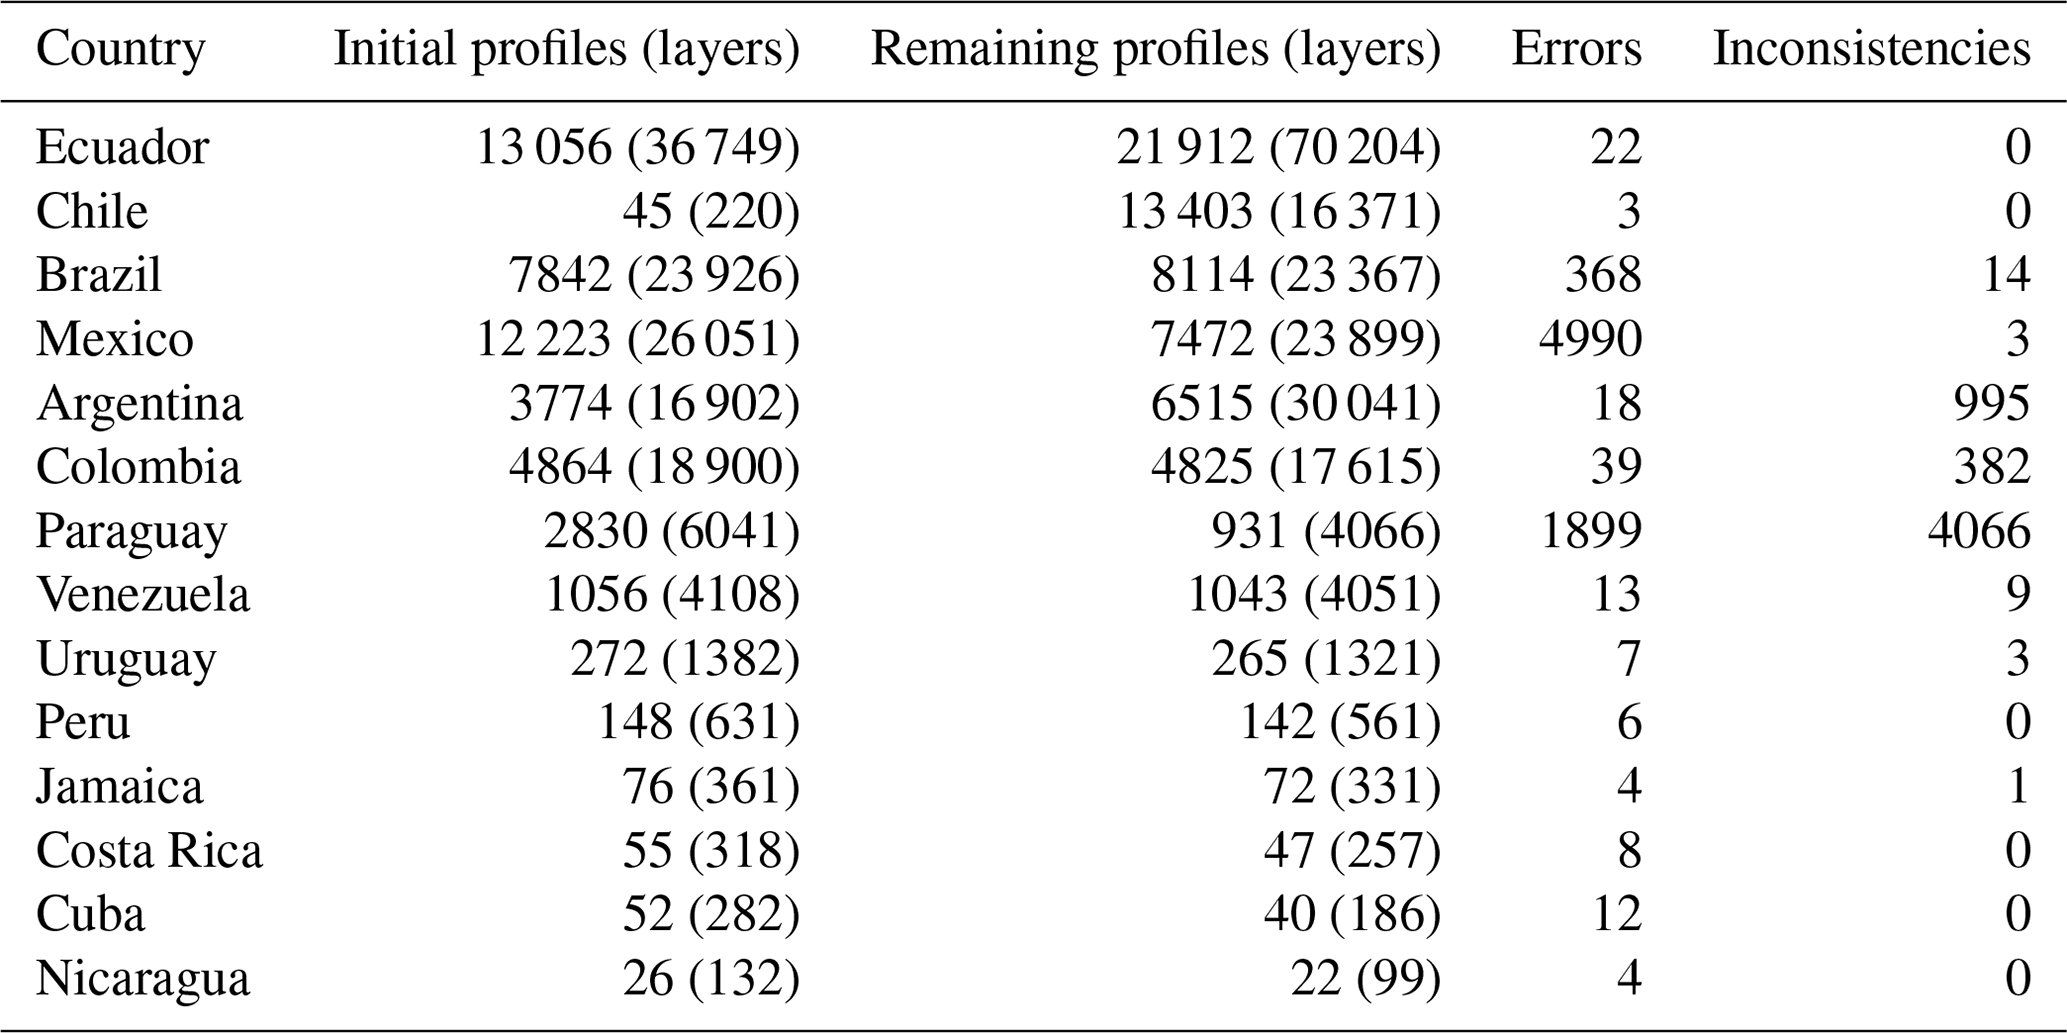
Table 14Number of profiles contributed by each data source to the new version of SISLAC (NA: not available).
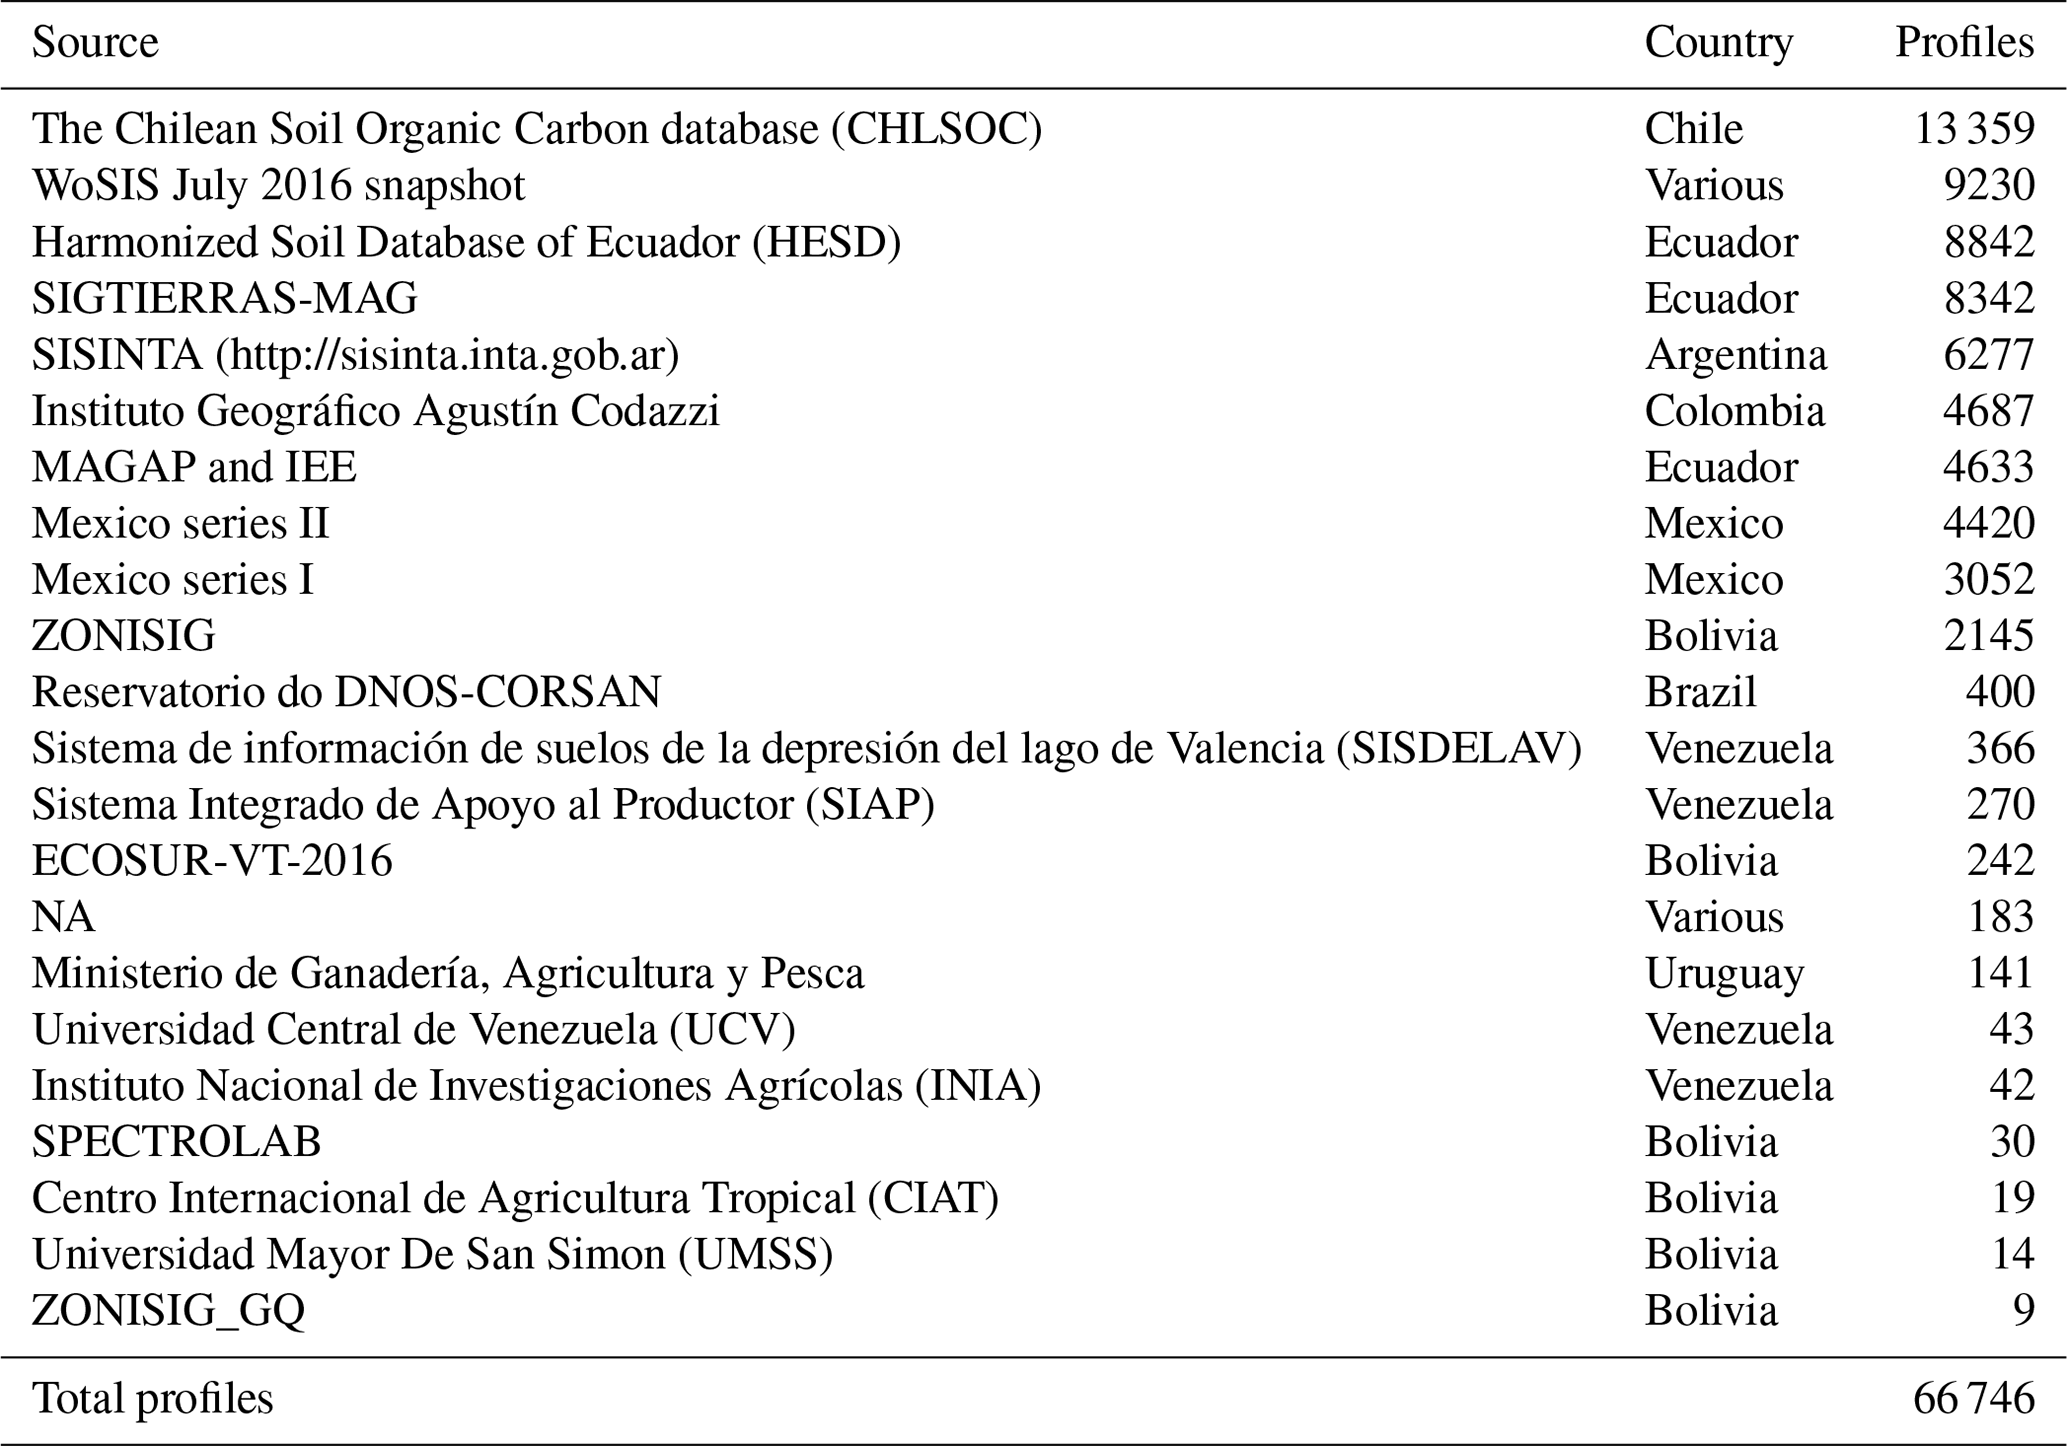
Table 15Percentage of valid records for soil properties, showing that SOC is the attribute with the highest number of valid records followed by pH, clay, silt, and sand.
3.2 Characterization of Latin American and Caribbean (LAC)soils
According to the most probable soil group from SoilGrids 2.0 (based on the World Reference Base, WRB, of 2006), the 27 960 soil profiles (those with complete cases) in the new SISLAC database correspond to 16 soil groups. The Cambisols (22.2 %), Andosols (19.9 %), and Ferralsols (14.6 %) are those with the highest number of soil profiles. Cambisols are present across all LAC regions, principally in Colombia, Ecuador, Mexico, Venezuela, Brazil, and Argentina. Andosols are primarily found in the Andes Mountains regions (Colombia and Ecuador) and some volcanic mountains in Mexico and Costa Rica. Ferralsols are principally located in South American regions in Brazil, Ecuador, Colombia, and Argentina. Meanwhile, Arenosols (0.5 %), Planosols (0.7 %), and Fluvisols (1 %) are those less represented in the database. Arenosols are principally in the northern region of Mexico and central Brazil. Planosols are in the south of Brazil and north of Argentina. Fluvisols are principally in the north of Colombia, east of Brazil, and west of Ecuador.
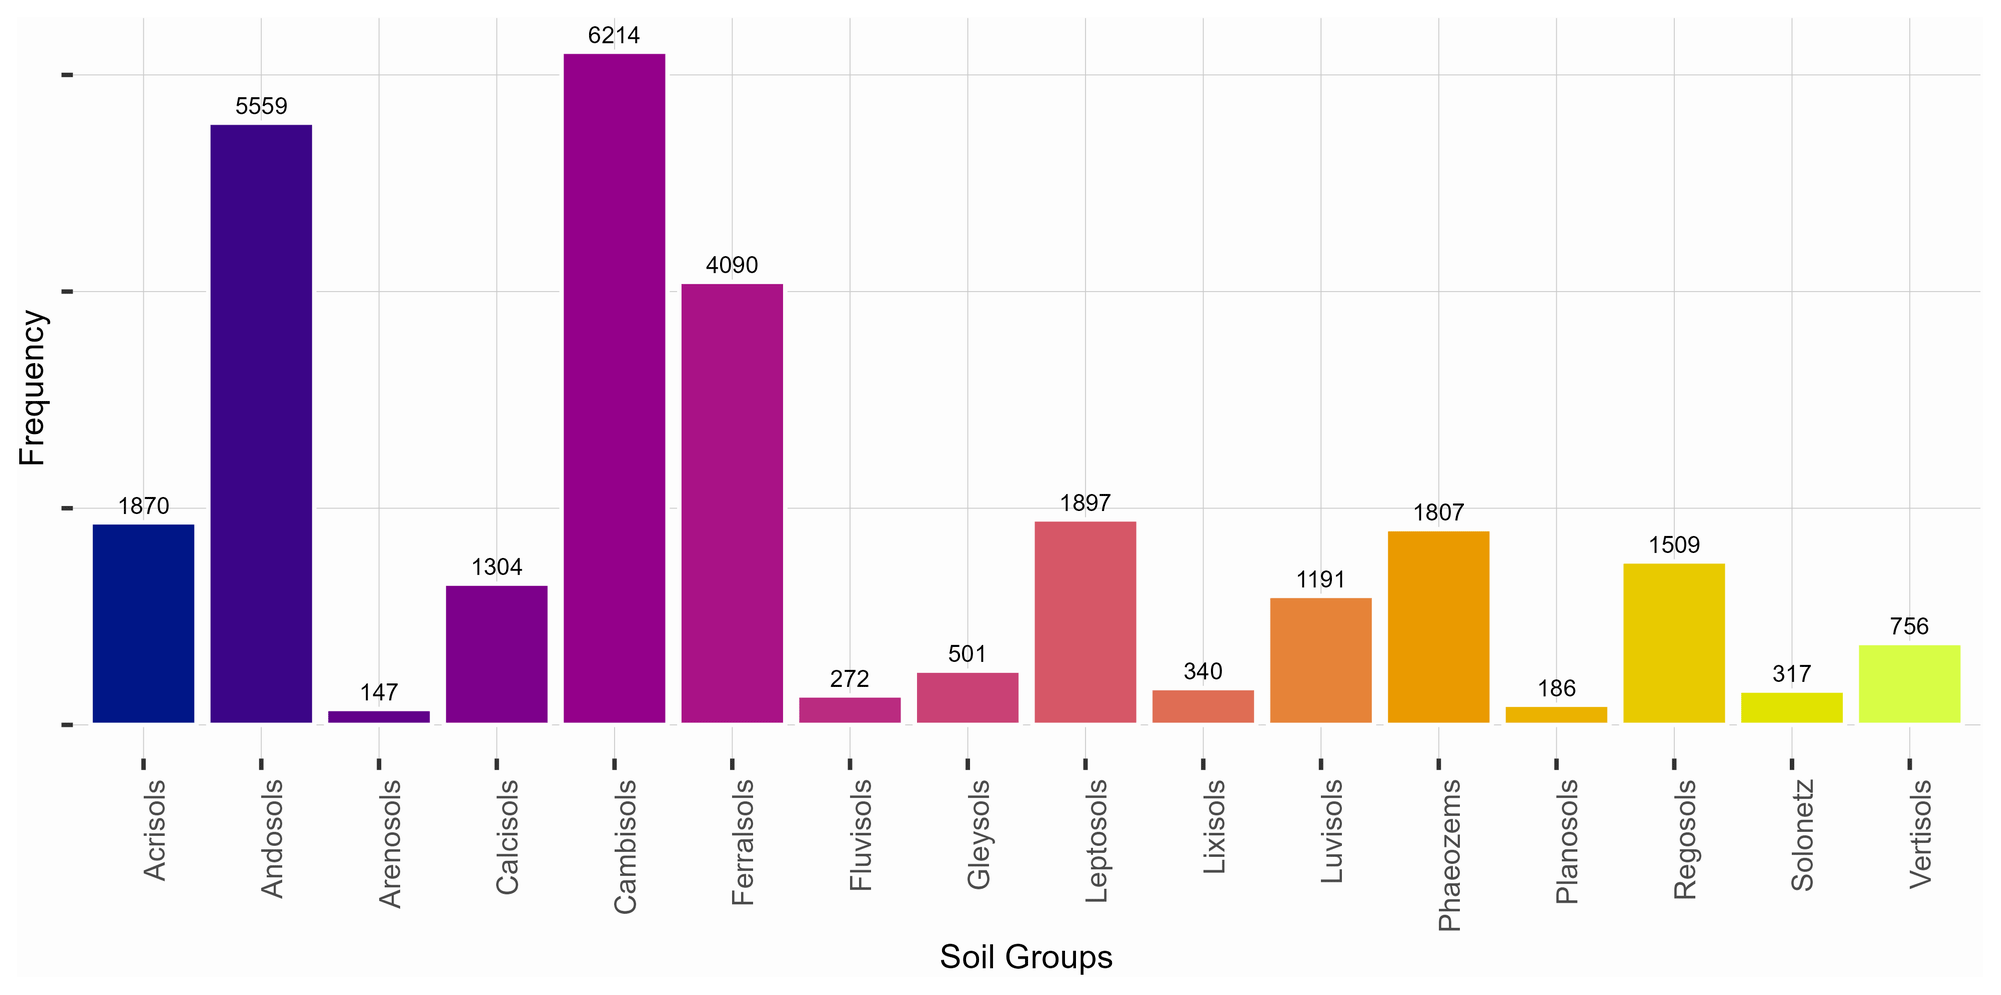
Figure 4Frequency of soil profiles by soil group according to the World Reference Base (WRB).
In the PCA, five dimensions have eigenvalues greater than 1 (Table 16). These first five dimensions explain 86.49 % of the total variance in the dataset. The first two dimensions express 52.52 % of the total variance, which means that 52.52 % of the individuals' (or variables') total cloud variability is explained by the plane formed by the first dimension (Dim 1) and the second dimension (Dim 2). The first dimension (28.73 % of variance explained) represents soil texture (clay and sand content) and the cation exchange capacity variables (Fig. 5a). On the other hand, the second dimension (23.79 % of variance explained) captures the variability in pH, organic carbon, and cation exchange capacity (Fig. 5a). The third dimension (Dim 3; 16.28 % of variance explained) comprises profile depth, number of profile horizons, and cation exchange capacity (Fig. 5b). The organic carbon content and pH variables represent the fourth dimension (Dim 4; 9.72 % of variance explained) (Fig. 5b).
Table 16Decomposition of the total inertia obtained from the principal component analysis based on profile characteristics of 28 460 sites of the new version of the SISLAC database (Dim: dimension).
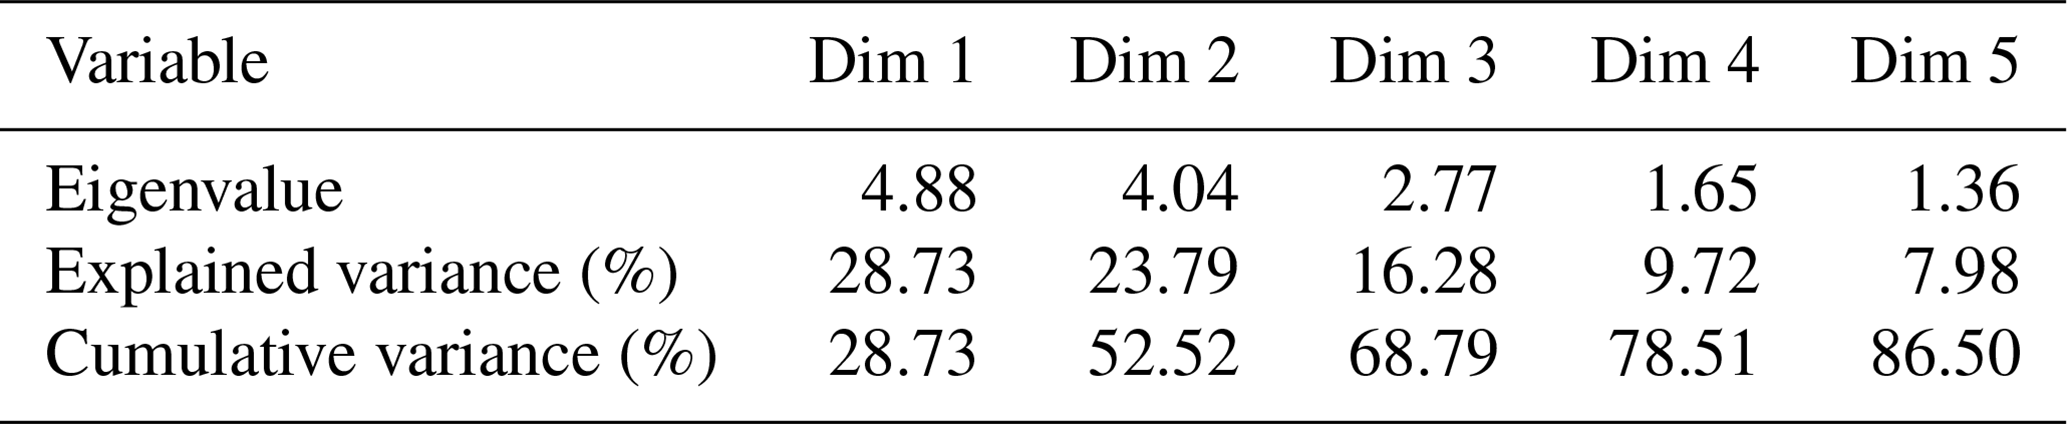
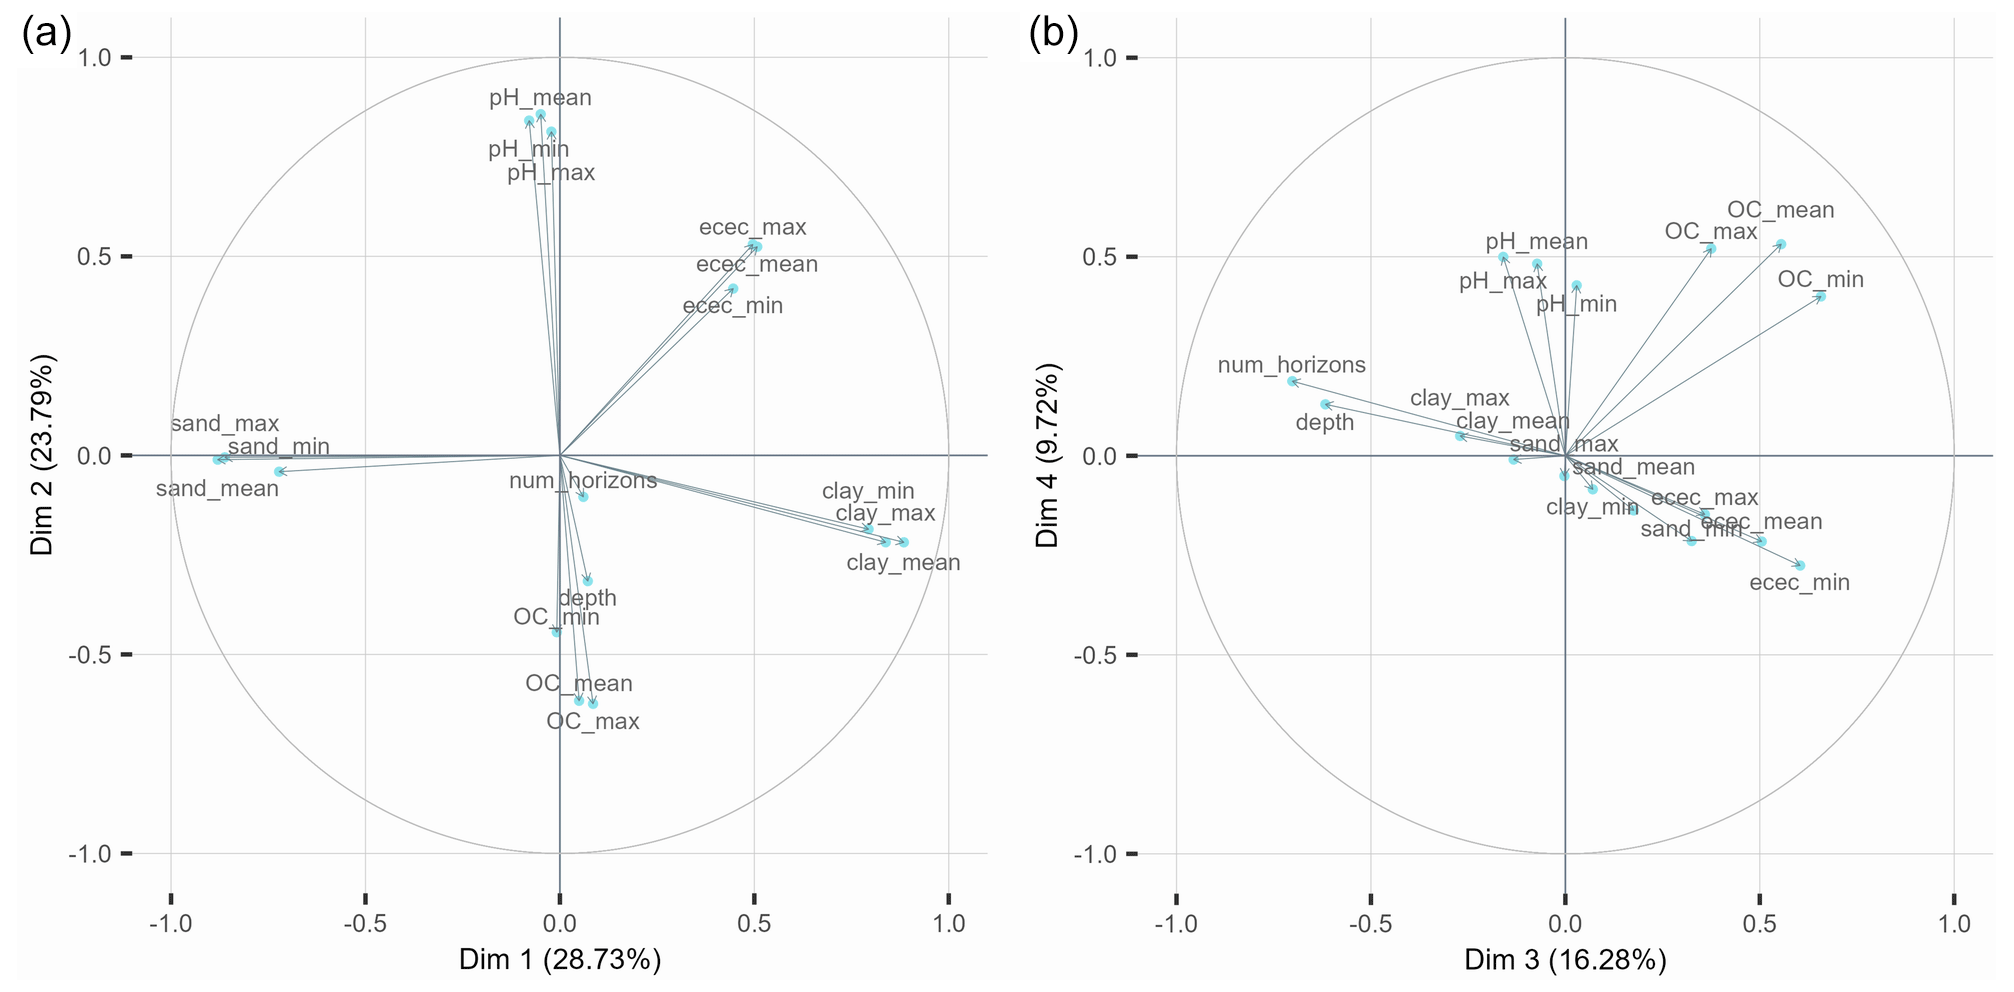
Figure 5Map of variables for the first plane. The quantitative variables are pH, effective cation exchange capacity (ECEC), organic carbon (OC), clay and sand content, the number of horizons (num_horizons), and profile depth (depth) (Dim: dimension).
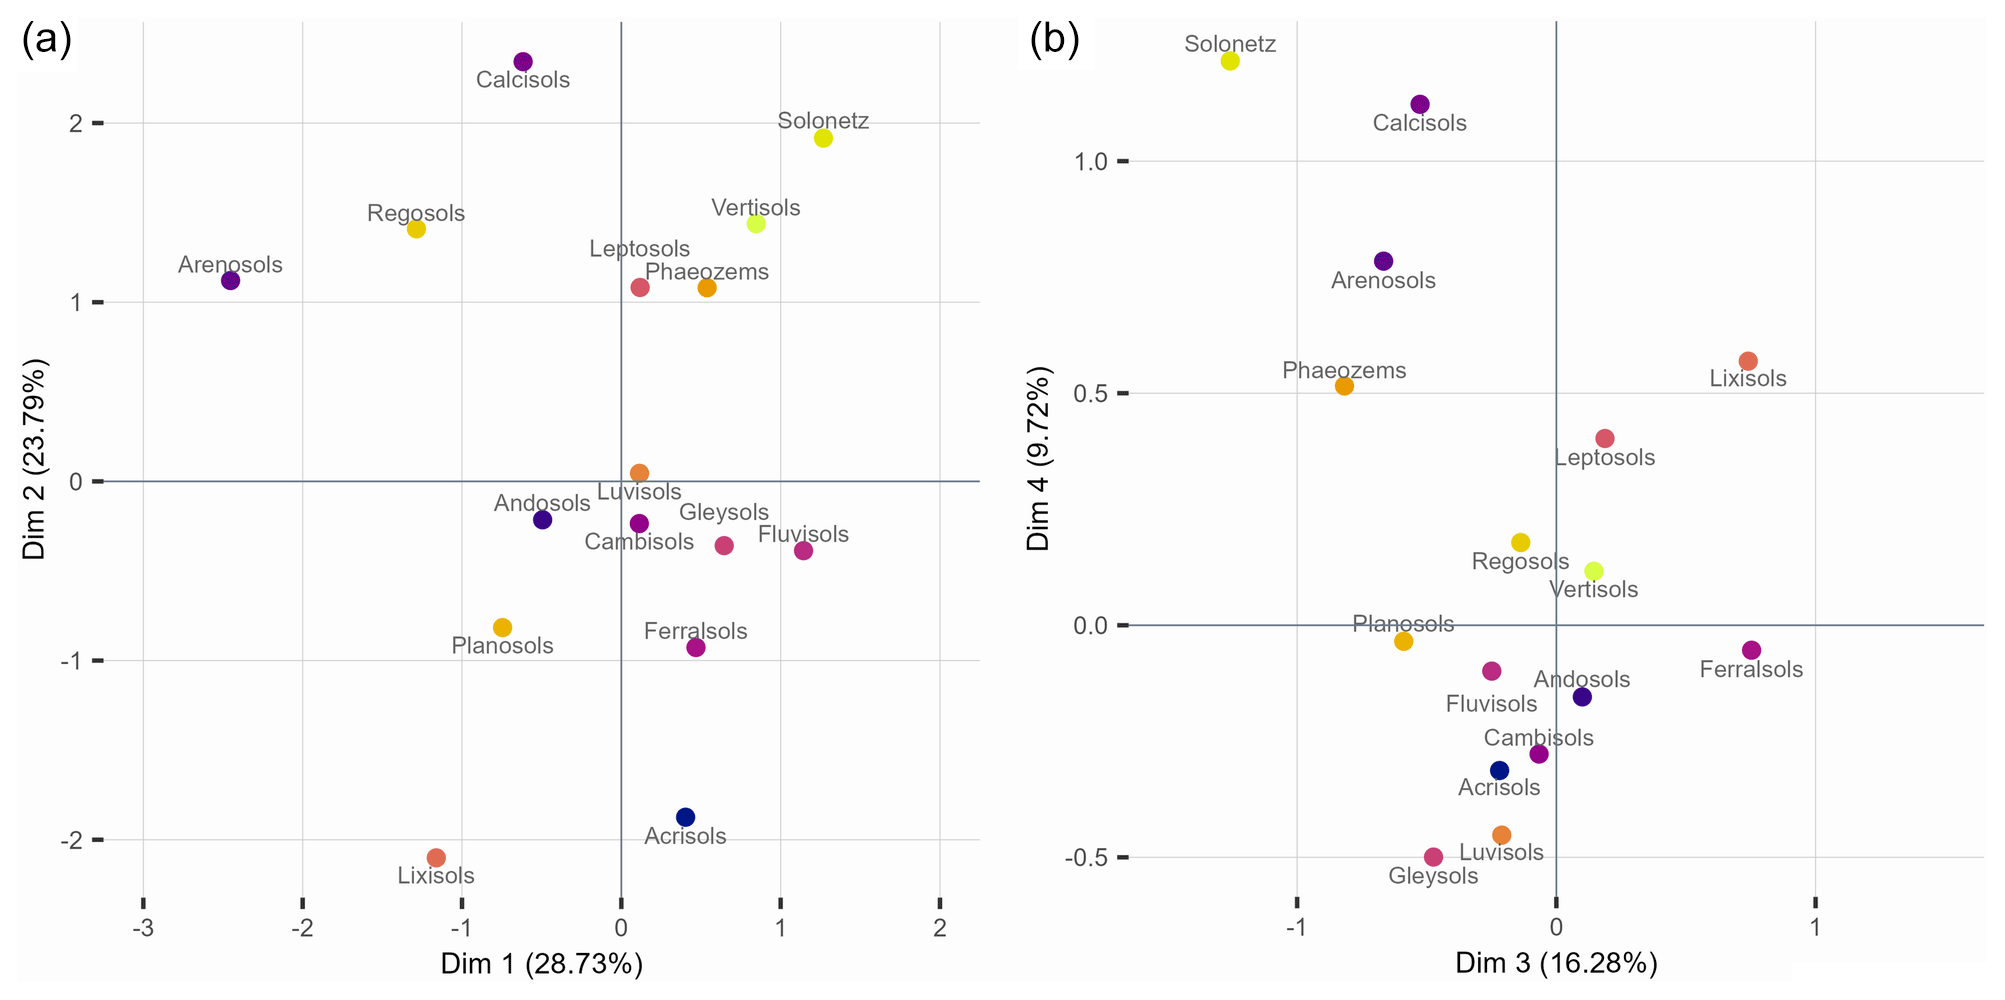
Figure 6Quality factor map with soil group according to the World Reference Base (WRB). (a) The first plane and (b) the second plane of the principal component analysis (Dim: dimension).
The qualitative factor map shows the distance between soil groups in the first plane (Fig. 6). In the first plane, the soil groups most different from others are Arenosols, Calcisols, Solonetz, Acrisols, and Lixisols (Fig. 6a). The Arenosols are those most correlated with Dim 1, representing the soil's texture and cation exchange capacity. Meanwhile, Calcisols, Lixisols, Solonetz, and Acrisols are most correlated with Dim 2, which represents the soil's pH and organic carbon. On the other hand, in the second plane, the soil groups most different from others are Solonetz, Calcisols, Phaeozems, Lixisols, Ferralsols, and Gleysols (Fig. 6b). The Solonetz, Phaeozems, Ferralsols, and Lixisols correlate most with Dim 3, which represents profile attributes such as profile depth and number of horizons; meanwhile, Solonetz, Calcisols, and Arenosols are most correlated with Dim 4, which represents principally organic carbon content and the pH of the soil.
This work made it possible to determine that the main problems in the SISLAC profiles occur systematically in some countries. In addition, we were able to incorporate new data to improve this database and make a greater number of soil profiles of the region available to the soil community.
4.1 Quality assessment and improvement of SISLAC data
As shown in Table 1, the most frequent error in the profiles was due to empty limits, which occurred mainly in Mexico and Paraguay with 67 % and 25 % of the total errors, respectively. In Mexico, these errors correspond to 40 % of the profiles provided, while in Paraguay they correspond to 65 %. On the other hand, most of the inconsistencies (Table 12) are found in Argentina, Paraguay, and Colombia with 44 %, 42 %, and 12 % of the total, respectively. Although all these inconsistencies were corrected, it is observed that, for example, in Paraguay of the total profiles provided (2830), only nine contain SOC values, whereas the rest all have the attribute empty. The foregoing represents a limitation if one wanted to carry out any type of analysis with these data.
The validations were defined by expert judgment; they coincide with those described in the works of Batjes (1995) and Leenaars (2013) and were applied to all the elements. For the horizons, it was guaranteed that they were correctly described, since as these authors indicate, if they are not adequately described, in-depth analyses cannot be carried out since the analysis tools may fail or a high degree of uncertainty may be generated.
In the profiles of the available databases, the data had a correct description of the profiles, so most of them are incorporated into SISLAC. In these, the main attributes available were SOC, pH, clay, silt, and sand. With these data, an increase in the database of more than 50 % was achieved, since the revised SISLAC database had just over 42 000 records and the number of soil profiles in the new version exceeds 66 000 from the entire Latin American region.
4.2 Latin American and Caribbean (LAC) soils
A principal component analysis (PCA) considering the profile attributes and soil variables with the highest number of records (SOC, pH, ECEC, and clay and sand content; number of horizons; and profile depth) was carried out to characterize the new SISLAC database. A way to validate the database information was to relate those profile attributes and soil variables with a soil classification. In the database, just 37 % of the soil profiles have a taxonomic classification, 26 % based on the USDA (profiles in Argentina, Colombia, and Ecuador, principally) and 11 % based on the WRB (profiles in Mexico) taxonomic classification system. Therefore, it was necessary to identify the most probable soil group from a unified global source (SoilGrids 2.0) for the 27 960 soil profiles with complete records for the soil variables included in the PCA. Even if it is not a field-based taxonomic classification of each soil profile, the SoilGrids product represents the global tendency of the world soils (Poggio et al., 2021).
Some soil groups are separated from others and strongly correlated with Dim 1 or Dim 2 according to soil variables. As expected, soil groups characterized by the variables included in the PCA are those most differentiated in the analysis. Soil groups characterized by textural attributes such as Arenosols (high content of sand) are strongly correlated with Dim 1, which represents the sand and clay content of the mineral soil. Meanwhile, soil groups characterized by accumulation of sales such as Calcisols (high content of calcium) or Solonetz (high content of exchangeable sodium) are correlated with Dim 2 due to the effect of sales in the pH of the soil; similarly, those soil groups with an accumulation of organic matter such as Phaeozems (dark superficial layers) are also mostly correlated with Dim 2, which represents organic matter characteristics too.
On the other hand, those most represented soil groups in the new SISLAC database not characterized by the variables included in the PCA are not differentiated from other soil groups. Cambisols (which are identified by edafogenetic alteration evidence but not stronger alteration or accumulation processes), Andosols (which are identified by their relationship between Fe and Al, bulk density, and phosphate retention), and Ferralsols (which are identified by Fe or Mn accumulation in the soil profile) are the soil groups most represented in the database (57 % of the total soil profiles). These soil groups appear at the central portion of the factor maps in the PCA and do not show a specific correlation with dimensions.
The PCA showed the relation between soil variables in the new SISLAC database and soil groups (from a different source), making this new database's value and potential use evident. However, it is essential to highlight that this PCA was made with 42 % (27 960) of the total soil profiles in the new SISLAC database (66 746). This analysis does not represent regions with few complete data such as Central America (Guatemala, Honduras, Nicaragua, Cuba, and Dominican Republic among others) and South America (Chile, Peru, Bolivia, Paraguay, and south of Venezuela and Brazil).
4.3 Limitations and future directions
A factor not considered in this work was the validation of the attributes of the horizon properties in a simple or combined way to identify outliers, for example, using Tukey's rule (Pham et al., 2019) or checking whether they are out of range (pH values less than 0 or greater than 14). This omission was due to the fact that a large part of the horizons did not have assigned values. As shown in Table 15, only four attributes (SOC, pH, clay, and sand) exceed 65 % of records with values, while another two (silt and effective cation exchange capacity) have just over 50 % of data with values. The other attributes do not exceed 20 %, and there are even three properties with less than 6 % of data with values, which are inorganic carbon, coarse fragments, and water retention.
A possible reason why the profiles have been provided incomplete may be the one mentioned by Arrouays et al. (2017) or Rossiter (2004) about how privacy or data ownership policies, in addition to institutional, legal, and cultural factors, prevent data from being fully shared. Breaking down those barriers would allow that data to be used by a larger number of global users.
Given the importance of these databases, it is important to make new efforts to collect data from other sources, such as research centers or universities, in order to strengthen this database or other databases. This revised version of SISLAC data offers the potential to generate information that helps decision-making on issues in which soils are decisive. It can also be used to plan future soil surveys in areas with low density or where updated information is required. Another possible use of these data may be to improve existing information (in scale and depth), such as the Global Soil Organic Carbon Map (FAO and ITPS, 2018), or to generate new information such as that presented by Gutierrez (2020) using SISLAC data.
In summary, from the total dataset, 38 % of profiles were excluded and another 4.5 % were corrected, and from the available databases nearly 24 000 soil profiles were incorporated. This work tried to exclude as few profiles as possible given their importance in areas with low spatial density. Furthermore, as mentioned by Hengl (2019), these data are the only thing available at this time in many places, so their availability is important. Knowing the level of integrity of the data, what the main problems are, and where they occur can help the countries involved know where to put more efforts to have more reliable data. In that sense, this work may contribute to supporting soil conservation efforts, increasing food and water security, maintaining healthy ecosystems, and reducing climate change's impact.
The data are available at https://doi.org/10.5281/zenodo.7876731 (Díaz-Guadarrama and Guevara, 2023) in comma-separated value format (.csv). The source code used for data processing is also available in the same repository.
This work was successful in improving the SISLAC database, thus generating a revised version of the database in which all the soil profiles have high quality and completeness to be efficiently used in multiple applications (e.g., digital soil carbon mapping and reporting). In the revised SISLAC database, 15 % of soil profiles were excluded (e.g., horizon information duplicated or overlapped) and 4.5 % of the soil profiles were adjusted to the same data structure. With the available soil databases, it was possible to increase the database by more than 50 %; initially the valid SISLAC profiles were around 41 000, so the additional profiles represent more than 25 000 records. SISLAC is a product of the cooperation of national institutions of the countries of the region, investing efforts in the collection of additional data; for example, those produced in universities or research centers could lead to an increase in the volume of the revised version of SISLAC (as new and better data become available), and these in turn may allow for the new generation of spatial information on soil properties to improve what is currently available.
SDG: conceptualization, data curation, formal analysis, investigation, software, validation, visualization, and writing (original draft preparation). VMVR: conceptualization, formal analysis, methodology, visualization, and writing (review and editing). MG: conceptualization, methodology, funding acquisition, and writing (original draft preparation). IL, MA, and YR: conceptualization, methodology, and writing (review and editing). GAAC, JA, DA, RAB, AB, NB, ROD, MDA, AE, HF, FF, JSGD, WJ, RSL, JFMB, MdLMS, LMM, IDM, CaO, GO, ChO, SO, CP, MP, IAR, DR, RR, LMR, DMR, AR, KR, GS, VS, LMT, RV, GMV, and YY: data curation and writing (review and editing).
The contact author has declared that none of the authors has any competing interests.
Publisher's note: Copernicus Publications remains neutral with regard to jurisdictional claims made in the text, published maps, institutional affiliations, or any other geographical representation in this paper. While Copernicus Publications makes every effort to include appropriate place names, the final responsibility lies with the authors.
This article is part of the special issue “Benchmark datasets and machine learning algorithms for Earth system science data (ESSD/GMD inter-journal SI)”. It is not associated with a conference.
Sergio Díaz-Guadarrama acknowledges support by the Colombian Institute of Educational Credit and Technical Studies Abroad (ICETEX).
We would also like to thank the people who contributed data to SISLAC from their institutions – Bolivia: Miguel Ángel Vaca; Chile: José Sergei Padarian Campusano; Colombia: Oscar Daniel Beltrán Rodríguez, Napoleón Ordoñez Delgado, Javier Otero García, Rafael Antonio Pedraza Rute, and Reinaldo Sánchez López; Costa Rica: Bryan Alemán Montes; Ecuador: María Natalia Rumazo Chiriboga and Darwin Sánchez Rodríguez; El Salvador: Edgard Mayen; Guatemala: Juan Antonio Padilla Cruz and Claudia Cecilia Saput; Honduras: Arturo Varela Ocón; Nicaragua: Jose Ariel Cruz Martínez and Wilmer Rodríguez; Perú: Germán Belizario-Quispe, Marcos Gabriel Cerna Arellano, Alberto Cortez Farfán, José Carlos De la Cruz Espinoza, Gouri Agusto Aparicio Cavero, Gabriel Máximo Larota Cantuta, Efraín Oscar Rosario Sánchez, Kharolyn Elizabeth Santander Hidalgo Candia, Raúl Uscamayta Quispe, and Jorge Vásquez Acuña; Uruguay: Inés Barilani, Gastón Bentancor, Gonzalo Daniel Pereira Facal, and Claudio Prieto.
This research has been supported by the UNESCO International Geoscience Programme (grant no. 765) and the Consejo Nacional de Ciencia y Tecnología's (CONACyT) Ciencia de Frontera 2023 scholarship (grant no. CF-2023-I-1846).
This paper was edited by Dalei Hao and reviewed by Jinshi Jian and José Lucas Safanelli.
Amirinejad, A. A., Kamble, K., Aggarwal, P., Chakraborty, D., Pradhan, S., and Mittal, R. B.: Assessment and mapping of spatial variation of soil physical health in a farm, Geoderma, 160, 292–303, https://doi.org/10.1016/j.geoderma.2010.09.021, 2011.
Angelini, M., Rodriguez, D. M., Olmedo, G. F., and Schulz, G.: Sistema de Información de Suelos del INTA (SISINTA): presente y futuro, in: XXVI Congreso Argentino de la Ciencia del Suelo, Tucumán, Argentina, 15–18 May 2018, 5 pp., https://www.researchgate.net/publication/325607030_Sistema_de_informacion_de_suelos_del_INTA_SISINTA_Presente_y_futuro (last access: 6 March 2024), 2018.
Araujo-Carrillo, G. A., Varón-Ramírez, V. M., Jaramillo-Barrios, C. I., Estupiñan-Casallas, J. M., Silva-Arero, E. A., Gómez-Latorre, D. A., and Martínez-Maldonado, F. E.: IRAKA: The first Colombian soil information system with digital soil mapping products, Catena, 196, 104940, https://doi.org/10.1016/j.catena.2020.104940, 2021.
Armas, D., Guevara, M., Alcaraz-Segura, D., Vargas, R., Soriano-Luna, Á., Durante, P., and Oyonarte, C: Digital map of the organic carbon profile in the soils of Andalusia, Spain, Ecosistemas, 26, 80–88, https://doi.org/10.7818/ecos.2017.26-3.10, 2017.
Armas, D. I., Guevara, M., Bezares, F., Vargas, R., Durante, P., Osorio, V. H., Jimenez, W. A., and Oyonarte, C.: Harmonized Soil Database of Ecuador 2021 ver 3, Environmental Data Initiative [data set], https://doi.org/10.6073/pasta/1560e803953c839e7aedef78ff7d3f6c, 2022.
Arrouays, D., Leenaars, J. G. B., Richer-de-Forges, A. C., Adhikari, K., Ballabio, C., Greve, M., Grundy, M., Guerrero, E., Hempel, J., Hengl, T., Heuvelink, G., Batjes, N., Carvalho, E., Hartemink, A., Hewitt, A., Hong, S., Krasilnikov, P., Lagacherie, P., Lelyk, G., Libohova, Z., Lilly, A., McBratney, A., McKenzie, N., Vasquez, G. M., Mulder, V. L., Minasny, B., Montanarella, L., Odeh, I., Padarian, J., Poggio, L., Roudier, P., Saby, N., Savin, I., Searle, R., Solbovoy, V., Thompson, J., Smith, S., Sulaeman, Y., Vintila, R., Rossel, R. V., Wilson, P., Zhang, G., Swerts, M., Oorts, K., Karklins, A., Liu Feng, L., Navarro, A. R. I., Levin, A., Laktionova, T., Dell'Acqua, M., Suvannang, N., Ruam, W., Prasad, J., Patil, N., Husnjak, S., Pásztor, L., Okx, J., Hallett, S., Keay, C., Farewell, T., Lilja, H., Juilleret, J., Marx, S., Takata, Y., Kazuyuki, Y., Mansuy, N., Panagos, P., Liedekerke, M. V., Skalsky, R., Sobocka, J., Kobza, J., Eftekhari, K., Alavipanah, S. K., Liedekerke, M. V., Skalsky, R,, Sobocka, J., Kobza, J., Eftekhari, K., Alavipanah, S. K., Moussadek, R., Badraoui, M., Da Silva, M., Paterson, G., Gonçalves, M. C., Theocharopoulos Moussadek, R., Badraoui, M., Da Silva, M., Paterson, G., Gonçalves, M. C., Theocharopoulos, S., Yemefack, M., Tedou, S., Vrscaj, B., Grob, U., Kozák, J., Boruvka, L., Dobos, E., Taboada, M. S., Yemefack, M., Tedou, S., Vrscaj, B., Grob, U., Kozák, J., Boruvka, L., Dobos, E., Taboada, M., Moretti, L., Rodriguez, D., Moretti, L., and Rodriguez, D.,: Soil legacy data rescue via GlobalSoilMap and other international and national initiatives, GeoResJ, 14, 1–19, https://doi.org/10.1016/j.grj.2017.06.001, 2017.
Batjes, N.: World inventory of soil emission potentials – WISE 2.1, International Soil Reference and Information Centre, 65 pp., https://www.isric.org/sites/default/files/ISRIC_TechPap26.pdf (last access: 6 September 2022), 1995.
Batjes, N.: Harmonized soil property values for broad-scale modelling (WISE30sec) with estimates of global soil carbon stocks, Geoderma, 269, 61–68, https://doi.org/10.1016/j.geoderma.2016.01.034, 2016.
Batjes, N. H., Ribeiro, E., van Oostrum, A., Leenaars, J., Hengl, T., and Mendes de Jesus, J.: WoSIS: providing standardised soil profile data for the world, Earth Syst. Sci. Data, 9, 1–14, https://doi.org/10.5194/essd-9-1-2017, 2017.
Batjes, N. H., Ribeiro, E., and van Oostrum, A.: Standardised soil profile data to support global mapping and modelling (WoSIS snapshot 2019), Earth Syst. Sci. Data, 12, 299–320, https://doi.org/10.5194/essd-12-299-2020, 2020.
Beaudette, D. and O'Geen, A. T.: Soil-Web: An online soil survey for California, Arizona, and Nevada, Comput. Geosci., 35, 2119–2128, https://doi.org/10.1016/j.cageo.2008.10.016, 2009.
Bini, D., Santos, C. A. dos, Carmo, K. B. do, Kishino, N., Andrade, G., Zangaro, W., and Nogueira, M. A.: Effects of land use on soil organic carbon and microbial processes associated with soil health in southern Brazil, Eur. J. Soil Biol., 55, 117–123, https://doi.org/10.1016/j.ejsobi.2012.12.010, 2013.
Bockheim, J. G., Gennadiyev, A. N., Hammer, R. D., and Tandarich, J. P.: Historical development of key concepts in pedology, Geoderma, 124, 23–36, https://doi.org/10.1016/j.geoderma.2004.03.004, 2005.
Bouma, J., Broll, G., Crane, T., Dewitte, O., Gardi, C., Schulte, R., and Towers, W.: Soil information in support of policy making and awareness raising, Curr. Opin. Env. Sust., 4, 552–558, https://doi.org/10.1016/j.cosust.2012.07.001, 2012.
Chapman, A. D.: Principles of Data Quality, version 1.0. Report for the Global Biodiversity Information Facility, Copenhagen, 61 pp., https://doi.org/10.15468/doc.jrgg-a190, 2005.
Dewitte, O., Jones, A., Spaargaren, O., Breuning-Madsen, H., Brossard, M., Dampha, A., Deckers, J., Gallali, T., Hallett, S., Jones, R., Kilasara, M., Le Roux, P., Michéli, E., Montanarella, L., Thiombiano, L., Van Ranst, E., Yemefack, M., and Zougmore, R.: Harmonisation of the soil map of africa at the continental scale, Geoderma, 211–212, 138–153, https://doi.org/10.1016/j.geoderma.2013.07.007, 2013.
Diaz-Guadarrama, S. and Guevara, M.: Revised database of the Soil Information System of Latin America and the Caribbean, SISLAC version 1.2, Zenodo [data set], https://doi.org/10.5281/zenodo.7876731, 2023.
English, L. P.: Improving Data Warehouse and Business Information Quality: Methods for Reducing Costs and Increasing Profits, John Wiley & Sons, Inc., New York, 518 pp., 1999.
FAO: FAO y los Objetivos de Desarrollo Sostenible, https://www.fao.org/sustainable-development-goals/es/ (last access: 6 September 2022), 2017.
FAO and IIASA: Harmonized world soil database. Food and Agriculture Organization, 43, 312, 2009.
FAO and ITPS: Global Soil Organic Carbon Map (GSOCmap) Technical Report, http://esdac.jrc.ec.europa.eu/content/global-soil-organic-carbon-estimates (last access: 7 November 2023), 2018.
Garg, P. K., Garg, R. D., Shukla, G., and Srivastava, H. S.: Digital Mapping of Soil Landscape Parameters, Springer International Publishing, https://doi.org/10.1007/978-981-15-3238-2, 2020.
Gomes, L. C., Faria, R. M., de Souza, E., Veloso, G. V., Schaefer, C. E. G. R., and Filho, E. I. F.: Modelling and mapping soil organic carbon stocks in Brazil, Geoderma, 340, 337–350, https://doi.org/10.1016/j.geoderma.2019.01.007, 2019.
Greiner, L., Keller, A., Grêt-Regamey, A., and Papritz, A.: Soil function assessment: review of methods for quantifying the contributions of soils to ecosystem services, Land Use Policy, 69, 224–237, https://doi.org/10.1016/j.landusepol.2017.06.025, 2017.
Gutierrez, J., Ordoñez, N., Bolivar, A., Bunning, S., Guevara, M., Medina, E., Olivera, C., Olmedo, G. F., Rodriguez, L., Sevilla, V., and Vargas, R.: Estimación del carbono orgánico en los suelos de ecosistema de páramo en Colombia, Ecosistemas, 29, 1–10, https://doi.org/10.7818/ECOS.1855, 2020.
Hendriks, C. M. J., Stoorvogel, J., Lutz, F., and Claessens, L.: When can legacy soil data be used, and when should new data be collected instead?, Geoderma, 348, 181–188, https://doi.org/10.1016/j.geoderma.2019.04.026, 2019.
Hengl, T. and Macmillan, R. A.: Predictive Soil Mapping with R, OpenGeoHub foundation, Wageningen, the Netherlands, 370 pp., ISBN 978-0-359-30635-0, 2019.
Hopmans, J. W., Qureshi, A. S., Kisekka, I., Munns, R., Grattan, S. R., Rengasamy, P., Ben-Gal, A., Assouline, S., Javaux, M., Minhas, P. S., Raats, P. A. C., Skaggs, T. H., Wang, G., De Jong van Lier, Q., Jiao, H., Lavado, R. S., Lazarovitch, N., Li, B., and Taleisnik, E.: Critical knowledge gaps and research priorities in global soil salinity, Adv. Agron., 169, 1–191, https://doi.org/10.1016/BS.AGRON.2021.03.001, 2021.
IUSS Working Group WRB: World Reference Base for Soil Resources 2006, first update 2007, World Soil Resources Reports No. 103, FAO, Rome, 2007.
Keskin, H., Grunwald, S., and Harris, W. G.: Digital mapping of soil carbon fractions with machine learning, Geoderma, 339, 40–58, https://doi.org/10.1016/j.geoderma.2018.12.037, 2019.
Krol, B.: Towards a Data Quality Management Framework for Digital Soil Mapping with Limited Data, in: Hartemink, A. E., Mcbratney, A. B., and Mendonça-Santos, M. de L., Digital Soil Mapping with Limited Data, 137–149, Springer International Publishing, https://doi.org/10.1007/978-1-4020-8592-5_11, 2008.
Lê, S., Josse, J., and Husson, F.: FactoMineR: An R Package for Multivariate Analysis, J. Stat. Softw., 25, 1–18, https://doi.org/10.18637/jss.v025.i01, 2008.
Leenaars, J. G. B.: Africa Soil Profiles Database, Version 1.1. A compilation of georeferenced and standardised legacy soil profile data for Sub-Saharan Africa, in: ISRIC Report 2013/03, vol. 03, https://doi.org/10.1201/b16500-13, 2013.
Mcbratney, A., Mendonça Santos, M. L., and Minasny, B.: On digital soil mapping, Geoderma, 117, 1–2, https://doi.org/10.1016/S0016-7061(03)00223-4, 2003.
Otte, P., Maring, L., De Cleen, M., and Boekhold, S.: Transition in soil policy and associated knowledge development, Curr. Opin. Env. Sust., 4, 565–572, https://doi.org/10.1016/j.cosust.2012.09.006, 2012.
Owusu, S., Yigini, Y., Olmedo, G. F., and Omuto, C.: Spatial prediction of soil organic carbon stocks in Ghana using legacy data, Geoderma, 360, 114008, https://doi.org/10.1016/j.geoderma.2019.114008, 2020.
Paterson, G., Turner, D., Wiese, L., Van Zijl, G., Clarke, C., and Van Tol, J.: Spatial soil information in South Africa: Situational analysis, limitations and challenges, S. Afr. J. Sci., 111, 28–35, https://doi.org/10.17159/sajs.2015/20140178, 2015.
Pfeiffer, M., Padarian, J., Osorio, R., Bustamante, N., Olmedo, G., Guevara, M., Aburto, F., Antilen, M., Araya, E., Arellano, E., Barret, M., Barrera, J., Boeckx, P., Briceño, M., Bunning, S., Cabrol, L., Casanova, M., Cornejo, P. C. F., Curaqueo, G., Doetterl, S., Duran, P., Escudey, M., Espinoza, A., Francke, S., Fuentes, J. P., Fuentes, M., Gajardo, G., García, R., Gallaud, A., Galleguillos, M., Gomez, A., Hidalgo, M., Ivelic-Sáez, J., Mashalaba, L., Matus, F., Mora, M., Mora, J., Muñoz, C., Norambuena, P., Olivera, C., Ovalle, C., Panichini, M., Pauchard, A., Perez-Quezada, J., Radic, S., Ramirez, J., Riveras, N., Ruiz,G., Salazar, O., Salgado, I., Seguel, O., Sepúlveda, M., Sierra, C., Tapia, Y., Toledo, B., Torrico, J. M., Valle, S., Vargas, R., Wolff, M., and Zagal, E.: CHLSOC: The Chilean Soil Organic Carbon database [data set], https://doi.org/10.17605/OSF.IO/NMYS3, 2019.
Pham, K., Kim, D., Yoon, Y., and Choi, H.: Analysis of neural network based pedotransfer function for predicting soil water characteristic curve, Geoderma, 351, 92–102, https://doi.org/10.1016/j.geoderma.2019.05.013, 2019.
Poggio, L., de Sousa, L. M., Batjes, N. H., Heuvelink, G. B. M., Kempen, B., Ribeiro, E., and Rossiter, D.: SoilGrids 2.0: producing soil information for the globe with quantified spatial uncertainty, SOIL, 7, 217–240, https://doi.org/10.5194/soil-7-217-2021, 2021.
Rossiter, D.: Digital soil resource inventories: status and prospects, Soil Use Manage., 20, 296–301, https://doi.org/10.1111/j.1475-2743.2004.tb00372.x, 2004.
Rossiter, D.: Past, present & future of information technology in pedometrics, Geoderma, 324, 131–137, https://doi.org/10.1016/j.geoderma.2018.03.009, 2018.
Silatsa, F. B. T., Yemefack, M., Tabi, F. O., Heuvelink, G. B. M., and Leenaars, J. G. B.: Assessing countrywide soil organic carbon stock using hybrid machine learning modelling and legacy soil data in Cameroon, Geoderma, 367, 13, https://doi.org/10.1016/j.geoderma.2020.114260, 2020.
SISLAC.: Sistema de Información de Suelos de Latinoamérica – SISLAC, http://www.sislac.org/# (last access: 2 October 2017), 2013.
Varón-Ramírez, V. M., Araujo-Carrillo, G. A., and Guevara Santamaría, M. A.: Colombian soil texture: building a spatial ensemble model, Earth Syst. Sci. Data, 14, 4719–4741, https://doi.org/10.5194/essd-14-4719-2022, 2022.