the Creative Commons Attribution 4.0 License.
the Creative Commons Attribution 4.0 License.
 | 06 Mar 2024
The Tibetan Plateau space-based tropospheric aerosol climatology: 2007–2020
Honglin Pan
Jiming Li
Zhongwei Huang
Minzhong Wang
Ali Mamtimin
Fan Yang
Tian Zhou
Kanike Raghavendra Kumar
A comprehensive and robust dataset of tropospheric aerosol properties is important for understanding the effects of aerosol–radiation feedback on the climate system and reducing the uncertainties of climate models. The “Third Pole” of Earth (Tibetan Plateau, TP) is highly challenging for obtaining long-term in situ aerosol data due to its harsh environmental conditions. Here, we provide the more reliable new vertical aerosol index (AI) parameter from the spaceborne-based lidar CALIOP (Cloud-Aerosol Lidar with Orthogonal Polarization) on board CALIPSO (Cloud-Aerosol Lidar and Infrared Pathfinder Satellite Observations) for daytime and nighttime to investigate the aerosol's climatology over the TP region during 2007–2020. The calculated vertical AI was derived from the aerosol extinction coefficient (EC), which was rigorously quality-checked and validated for passive satellite sensors (MODIS) and ground-based lidar measurements. Generally, our results demonstrated that there was agreement of the AI dataset with the CALIOP and ground-based lidar. In addition, the results showed that, after removing the low-reliability aerosol target signal, the optimized data can obtain the aerosol characteristics with higher reliability. The data also reveal the patterns and concentrations of high-altitude vertical structure characteristics of the tropospheric aerosol over the TP. They will also help to update and make up the observational aerosol data in the TP. We encourage climate modelling groups to consider new analyses of the AI vertical patterns, comparing the more accurate datasets, with the potential to increase our understanding of the aerosol–cloud interaction (ACI) and aerosol–radiation interaction (ARI) and their climate effects. Data described in this work are available at https://doi.org/10.11888/Atmos.tpdc.300614 (Huang, 2023).
- Article
(21643 KB) - Full-text XML
- BibTeX
- EndNote


The three poles (i.e. the Arctic, the Antarctic, and the Tibetan Plateau – TP) have the highest mountains in the world and store more snow, ice, and freshwater than any other place. The unique geographical locations of the Antarctic, the Arctic, and the TP have unique ecological, climatic, and natural environmental changes. Also, the three locations have a crucial role in global and regional climate change. However, studies have found that these regions are susceptible to climate change. The differences in these regions may also affect key feedback loops for global climate change and the sustainability of human life. Unfortunately, our understanding of the three poles, particularly the relations between the regions, remains limited due to insufficient observation data. Currently, the collection of additional research data for these extreme environments is one of the major bottlenecks in facilitating comprehensive studies of these regions. Sufficient attention has been given to the polar regions and the TP in successive IPCC reports (IPCC, 2013, 2021). The similarities between the TP and the other two polar regions are their low temperatures, remote location, and large water storage capacity. On the other hand, the TP has a more highly complex climate than the Arctic and the Antarctic (where ice is the primary medium), and its land surface (including forests, grasslands, bare soil, lakes, and glaciers) is more diverse. These differences make the transport and accumulation of pollutants in the TP region different from the other two polar regions.
The TP is known as the “Third Pole” because it has the third largest ice mass on Earth, after the Antarctic and Arctic regions (Qiu, 2008). The TP, also called “Asia's Water Tower”, provides freshwater to 40 % of the world's population due to its vast water reserves such as glaciers, lakes, and rivers (Immerzeel et al., 2010). Furthermore, the TP is the “Roof of the World”, which covers an area of ∼2.5×10⁶ km2 at an average altitude of about 4000 m a.s.l. (above sea level) and includes all of Tibet, parts of Qinghai, Gansu, Yunnan, and Sichuan in south-western China, as well as parts of India, Nepal, Bhutan, and Pakistan (Nieberding et al., 2020). To the north of the TP region is the Taklamakan Desert (TD) (see Fig. 1). This high-altitude and specific topographic area effectively serves as a heat source during the spring (MAM) and summer (JJA) months. This thermal structure helps the TP to function virtually as an “air pump”, attracting warm and humid air from the lower-latitude oceans by suction (Yanai et al., 1992; Wu and Zhang, 1998; Wu et al., 2007, 2012). Consequently, large-scale mountains play a crucial role in shaping regional and even global weather and climate through mechanical and thermodynamic effects and affect the global energy–water cycle (Xu et al., 2008; Molnar et al., 2010; Boos and Kuang, 2010; Wu et al., 2015). It is closely related to the survival of human beings in the world.
Climate projections are simulated responses of the climate system to future emission or concentration scenarios of greenhouse gases (GHGs) and aerosols and are generally calculated using climate models. The reasons for the gap between models and observations may also be inadequate solar, volcanic, and aerosol forcing used in the models and in some modelling may be due to an overestimation of the response to increasing GHGs and other anthropogenic forcing (the latter includes the role of aerosols). The most significant uncertainties in predicting future climate change are related to uncertainties in the distribution and properties of aerosols and clouds, their interactions, and limitations in the representation of aerosols and clouds in global climate models (IPCC, 2021). The primary aerosol type over the TP is dust, which is primarily contributed by the Taklimakan Desert (Z. Liu et al., 2008; S. Chen et al., 2013, 2022; Xu et al., 2015). Previously, some studies of aerosol–cloud interaction (ACI) and aerosol–radiation interaction (ARI) were conducted (Liu et al., 2022). For example, the dust aerosols lifting over the TP reduce the radii of ice particles in the convective clouds and prolong the cloud lifetime through the indirect radiation effect, which can lead to the development of higher convective clouds. The dust-affected convective clouds move further eastward under the action of westerly winds and merge with local convective cloud masses, triggering heavy precipitation in the Yangtze River Basin and northern China downstream of the TP (Z. Liu et al., 2019; Y. Liu et al., 2020). However, the effect of aerosol on the atmospheric energy and water cycle remains uncertain, mainly due to the lack of a long-term and accurate vertical aerosol optical property dataset over the TP region. This can help better understand aerosol's impact on the atmospheric heating rate and stabilization and the subsequent cloud-precipitation process. Therefore, constructing a more long-term and reliable vertical dataset of aerosol optical parameters can make up the observational facts for aerosol-related study and provide a scientific basis for improving the global climate model simulation over the TP.
Generally, the primary aerosol optical parameter (such as extinction coefficient, EC, and aerosol optical depth, AOD) acquisition method is in situ observations, which have high precision. However, in situ observations are restricted by the distribution of measurement stations over the TP. Hence, the resulting data lack spatial continuity, making it difficult to meet the objectives of growing regional atmospheric environmental studies (Chen et al., 2022; Goldberg et al., 2019; Giles et al., 2019). Satellite remote sensing (active and passive) is an effective tool for collecting aerosol optical information (including the vertical structure and spatial distribution) over a wide range of spatial scales, significantly offsetting the deficiencies of in situ observations. Satellite remote sensing can tackle difficulties connected to insufficient data and uneven geographical distributions to a certain extent (Chen et al., 2022; Wei et al., 2021). While for aerosol products observed from the Cloud-Aerosol Lidar and Infrared Pathfinder Satellite Observations (CALIPSO), the presence of some low-reliability aerosol target (LRAT) caused by cloud contamination, solar noise contamination (especially in the daytime), and ground clutter among mostly aerosol observations skews the distribution of the aerosol EC towards larger values (at least some of which may be identified as aerosols and retained in the analysis), making the presence of some low-confidence aerosol targets bias the distribution of aerosol extinction in most aerosol observations. The distribution of the aerosol EC will show greater biased values (Thomason and Vernier, 2013; Kovilakam et al., 2020; Pan et al., 2020; Kahn et al., 2010) and then will further enhance the aerosol index (AI) value due to the influence of radiation transfer interaction between clouds and the absorption layer, which will not truly reflect the differences in aerosol physical properties (Guan et al., 2008; Y. Liu et al., 2019; Kim et al., 2018). Hence, gaining high confidence in the EC helps us analyse aerosol optical properties and leads to numerous pertinent uses of EC data, which is essential for accurately characterizing the upper range of aerosol ECs that occur on the TP.
The present study provides a dataset of monthly averaged vertical structure characteristics of tropospheric high-confidence aerosol optical properties including the EC, AOD, Ångström exponent (AE), and AI in the daytime and nighttime over the TP and surrounding areas. The data for the abovementioned optical properties were retrieved based on the spaceborne CALIOP (Cloud-Aerosol Lidar with Orthogonal Polarization) on board the CALIPSO satellite for the period 2007–2020. The main objective of this study is to calculate new and high-confidence aerosol optical parameters of the AI in the vertical distribution through strict quality control and validation for a passive remote sensing satellite sensor (MODIS) and active remote sensing ground-based lidar. The AI is dependent on the aerosol concentration, optical properties, and altitude of the aerosol layer. Also, the AI is particularly sensitive to high-altitude aerosols and is used to indicate small particles (those that act as cloud condensation nuclei) with a high weight (Guan et al., 2010; Buchard et al., 2015; Y. Liu et al., 2019; Nakajima et al., 2001). The comprehensive dataset of aerosol optical properties utilized in the study is of substantial importance for understanding the impact of aerosol on the ecosystem and reducing the uncertainties of the climate models.
The dataset used in this study is more effective at characterizing the vertical structure of aerosols while following standardized quality control methods to obtain higher confidence in the aerosol vertical structural property covariate datasets and to allow for comparison and application to the study of climate models and other atmospheric-science-related problems between our records and other different public datasets. To ensure meaningful confidence estimates, it is necessary to carefully apply the following correction procedures and analytical validation for the constructed aerosol covariates over the TP. The main steps for constructing the dataset are grouped as follows. (1) Remove the low-confidence aerosol EC at 532 and 1064 nm caused by the misclassification of clouds and other interferences (e.g. surface clutter, hygroscopicity). Based on this, an interquartile range (IQR) method (see Sect. 2.2) is utilized to discard the low-confidence targets and to further obtain the monthly averaged aerosol EC for daytime and nighttime with higher confidence. (2) The pseudo AE is calculated using the aerosol EC at 532 and 1064 nm with higher confidence. (3) Obtain the vertical AI by the product of the AOD (the vertical layer integral of EC) and AE. (4) Validate the constructed AI with MODIS and in situ lidar measurements using the standardized frequency distributions.
2.1 Study area
Figure 1 depicts the geopotential height of the TP and its surrounding areas (27–42° N, 75–102° E; about 4000 m a.s.l.) and a schematic diagram of the CALIPSO satellite ground track over the TP in different months. The role of the “heat-driving air pump” of the TP provides abundant water vapour for the formation of clouds (Luo and Yanai, 1984; Liou, 1986). Furthermore, the TP environment is greatly affected by natural and anthropogenic aerosols from the surrounding regions (Chen et al., 2013; Bucci et al., 2014; Xu et al., 2015). The strong convection generated by the TP will promote aerosols' vertical transport and increase aerosols' content in the troposphere and stratosphere (Vernier et al., 2015; Liu et al., 2022). Aerosols also serve as cloud condensation nuclei (CCN) or ice nuclei (IN), modifying cloud structure properties and precipitation (Twomey, 1977). Hence, the TP has been called the pump of water vapour, the cloud incubator, and the sand dust transfer station. By delivering water vapour, clouds, and dust, it regulates extreme weather and climate in the downstream and surrounding areas. It can be seen that the TP plays a crucial role in the impact and regulation of global and regional climate or environments (Luo and Yanai, 1984; Rossow and Schiffer, 1999; Wan et al., 2017; Liu et al., 2022).
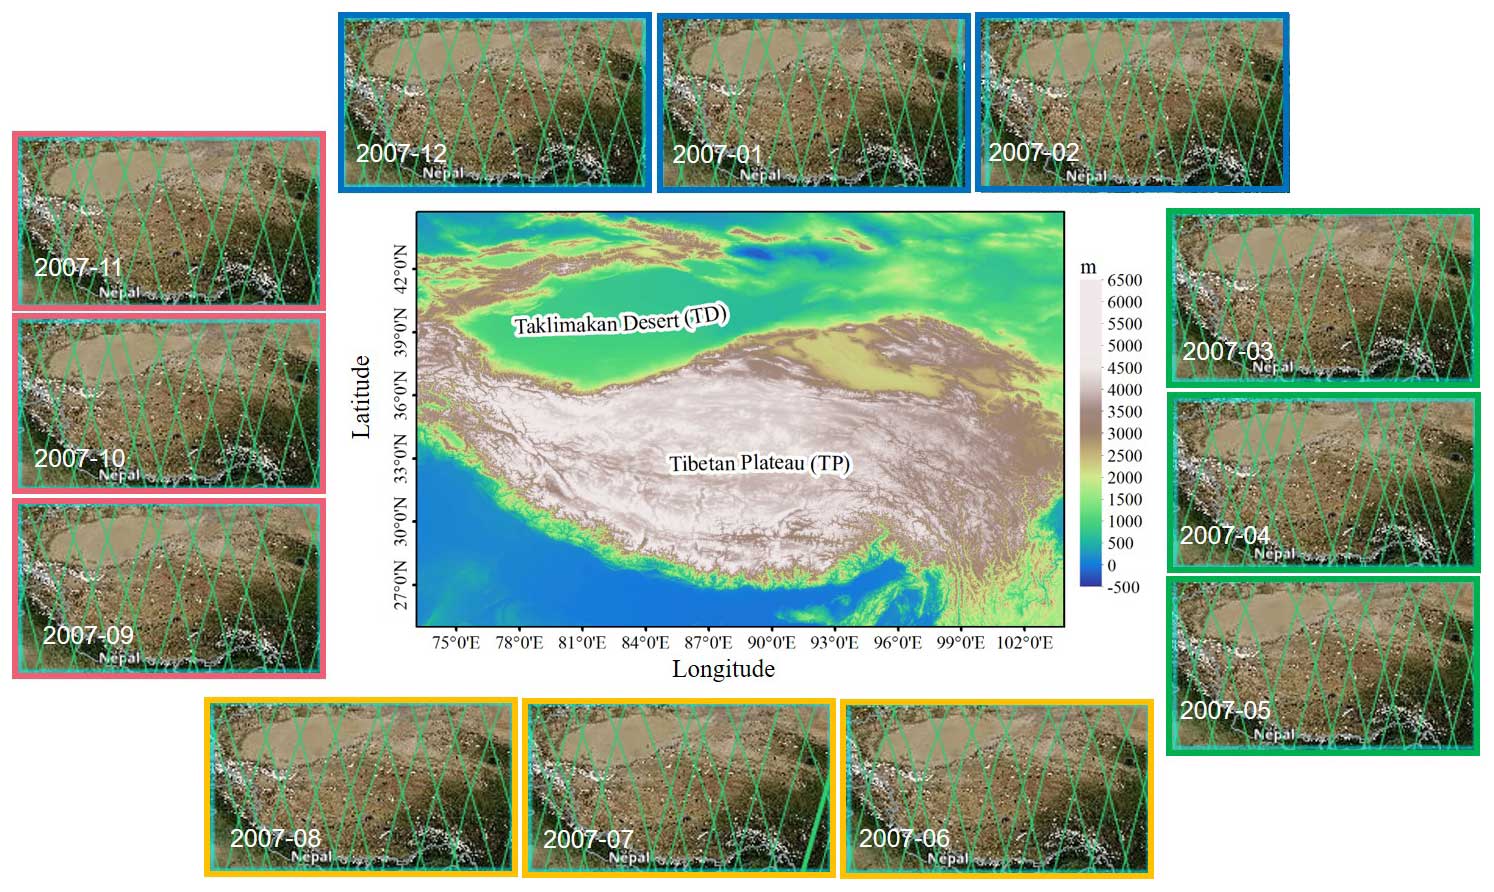
Figure 1The geopotential height of the TP and its surrounding areas (27–42° N, 75–102° E). The schematic diagram of the transit of the CALIPSO satellite orbits over the TP in all months of 2007 (with 2007 as an example; satellite orbit transit images from https://www.earthdata.nasa.gov, last access: 18 June 2022). The seasons have been classified as follows: March–May is spring, June–August is summer, September–November is autumn, and December–February is winter).
2.2 CALIOP data and the LRAT clearing method
CALIOP, on board the CALIPSO satellite, was launched by NASA on 28 April 2006 and is the nadir-pointing dual-wavelength polarization lidar which can provide global and continuous information on the vertical distribution of aerosols and clouds at 532 and 1064 nm for daytime and nighttime (Winker et al., 2007, 2009). The CALIPSO–CALIOP (version 4.20) level-2 aerosol profile product is selected in this study, with vertical and horizontal resolutions of 60 and 5 km, respectively. The used parameter includes Extinction_Coefficient_532 and Extinction_Coefficient_1064 between daytime and nighttime observations from 2007 to 2020. It should be noted that the CALIOP data use as few instruments as necessary to complete the monthly aerosol climatology. We make this decision to limit the impact of differences between instruments due to measurement techniques and wavelength ranges as well as to assess the general quality of the instrument's dataset.
The presence of some LRAT caused by cloud contamination, solar noise contamination (especially in the daytime), and ground clutter among mostly aerosol observations skews the distribution of the aerosol EC toward larger values (Thomason and Vernier, 2013). Consequently, to eliminate the LRAT, a statistical approach to identify the LRAT and extreme outliers is utilized based on the IQR. The IQR is a more conservative measure of the spread of the distribution than the standard deviation (Iglewicz and Hoaglin, 1993). Note that this technique is based on median statistics rather than the mean due to the skewed distribution of the EC. In our implementation, we used daily data at each altitude (0.06 km) and latitude (0.05°) bin from 2007 to 2020 to determine the frequency distribution of the EC for different months. In addition, we used the lower quartile (Q1) and upper quartile (Q3) of the underlying distribution to find the IQR, defined as Q3–Q1, a good measure of the spread in the data relative to the median. Here, an extreme outlier is defined as Q3 + (3.5× IQR), and a more upper outlier (Q3 + (1.5× IQR)) is used for comparison (Iglewicz and Hoaglin, 1993). Meanwhile, the extreme outlier threshold is used to clear LRAT-affected observations from the dataset, which is better and more effective at identifying outliers in the density distribution (Kovilakam et al., 2020).
2.3 AI data processing
According to the method described in Sect. 2.2, the aerosol EC (observed at 532 and 1064 nm for daytime and nighttime) with higher reliability over the TP is obtained. The monthly mean Ångström exponent (hereafter “pseudo Ångström exponent”) for daytime and nighttime is derived to establish the 14-year aerosol climatology (2007–2020) based on Eq. (1). The AE model for the EC, which is the wavelength dependence at 532 and 1064 nm, is given by Kovilakam et al. (2020).
EC and EC are extinction coefficients at 532 and 1064 nm, respectively. AE [] is the pseudo Ångström exponent (Rieger et al., 2015, 2019). The indices [m, i, j] represent the month, latitude, and altitude, respectively. () represents the ratio of the wavelengths at 532 and 1064 nm. The AE is gridded to 0.05° latitude and 0.06 km altitude resolution. Further, the vertical distribution of the AI is calculated according to Eq. (2). The AI was developed by Nakajima et al. (2001) and Y. Liu et al. (2019) with the equation given below.
AI and AOD are the aerosol index and aerosol optical depth, respectively. AE is the pseudo Ångström exponent. [m, i, j] represent the month, latitude, and altitude, respectively. Note that, to match the AE, AOD is also transformed into the vertical distribution (not the column parameter). As we focus on the characteristics of aerosols in the troposphere over the TP, we took samples from the surface at an altitude of 12 km with a vertical resolution of 0.06 km. We integrated the EC of both layers to obtain an AOD, which corresponds to the average of the AE values of both layers. This achieves spatial matching between AOD and AE at the vertical heights. At the later stage, when using the AI obtained from MODIS for comparative testing, we used the PDF (probability density function) and average values of the AI for characterization displayed to facilitate comparison due to the differences in horizontal and vertical space. The data in this paper are all based on the vertical structural distribution of altitude–latitude with vertical and horizontal resolutions of 60 m and 0.05°, respectively. The monthly mean climatology of the AI is retrieved from CALIOP and computed in altitude and latitude at 532 and 1064 nm for the daytime and nighttime datasets.
2.4 Aqua–MODIS satellite data
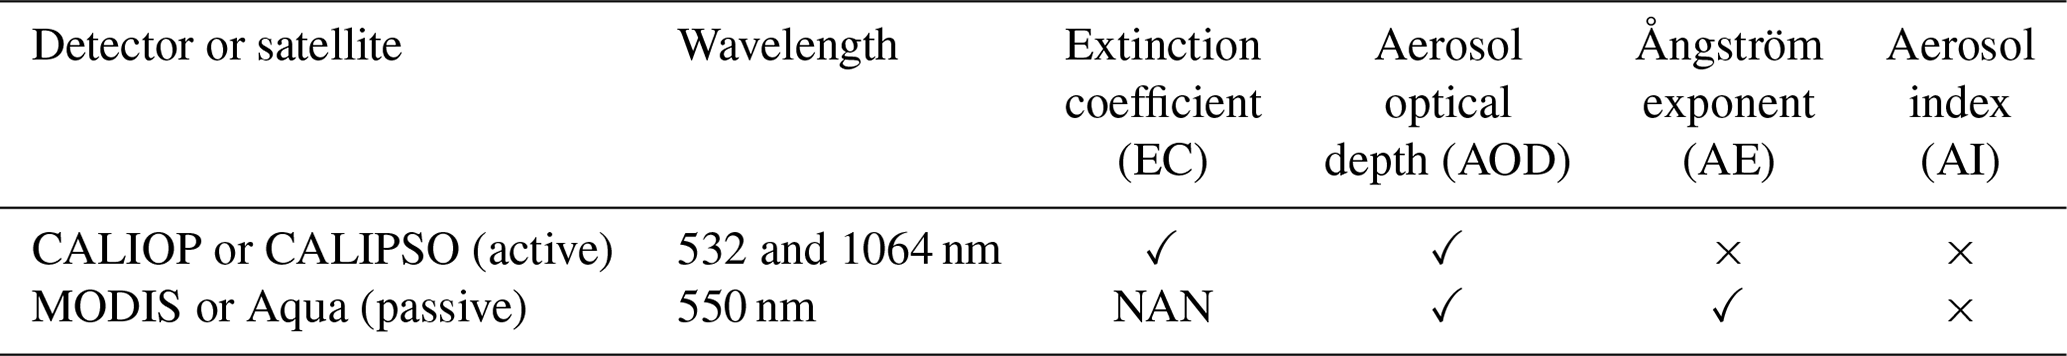
Like CALIPSO, Aqua is part of the A-Train constellation of satellites. Therefore, MODIS on board Aqua can achieve near-simultaneous observations of clouds and aerosols with CALIPSO–CALIOP (less than 2 min) (Winker et al., 2007; Hu et al., 2010). The Aqua satellite was successfully launched on 4 May 2002. Aqua is the afternoon star, passing through the Equator from south to north at around 13:30 local time. The observation data of 36 wavebands were obtained, with a maximum spatial resolution of 250 m and a scanning width of 2330 km. MODIS is a passive imaging spectroradiometer, and there are a total of 490 detectors distributed in 36 spectral bands, with full spectral coverage ranging from 0.4 µm (visible light) to 14.4 µm (thermal infrared). In this study, Level-3 data (MYD08_M3) on a 1° × 1° (longitude × latitude) gridded box are utilized. As shown in Table 1, MODIS can provide AOD and AE products at 550 nm wavelength. It is worth mentioning that we chose this data because MODIS data are widely used and have a certain reliability in aerosol research. The parameters of AE and AOD from MODIS are also used to calculate the AI, which is applied to evaluate the monthly mean climatology of the AI from CALIOP over the TP (see Table 1).
Table 1Comparison between MODIS and CALIOP existing data products (✓ represents the existing data products of the satellite, NAN indicates non-existent, and × represents non-existent data product parameters that need further calculation in this study).
2.5 Ground-based lidar data
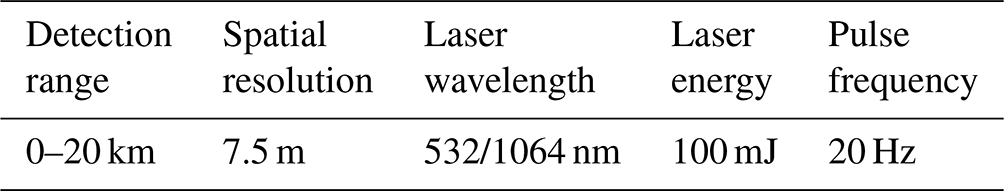
In addition, we used the ground-based lidar (38.967° N, 83.65° E; 1099.3 m) detection data from the hinterland of the TD to verify the validity and accuracy of the low-confidence aerosol removal method and the AI calculated by CALIOP detection data. The multi-band Raman polarization lidar (hereafter lidar) is mainly used for the detection of dust, aerosols, and cloud particles in the atmosphere, whose detection belongs to the “Belt and Road” lidar network from Lanzhou University, China (http://ciwes.lzu.edu.cn/, last access: 20 December 2022) and has the advantage of calibrating or validating satellite observations (see Fig. 2). The primary technical specifications of the lidar are mentioned in Table 2. For the performance of the lidar and the data inversion of aerosol-related optical parameters, the authors advise the readers to refer to the research work of Zhang et al. (2022, 2023).
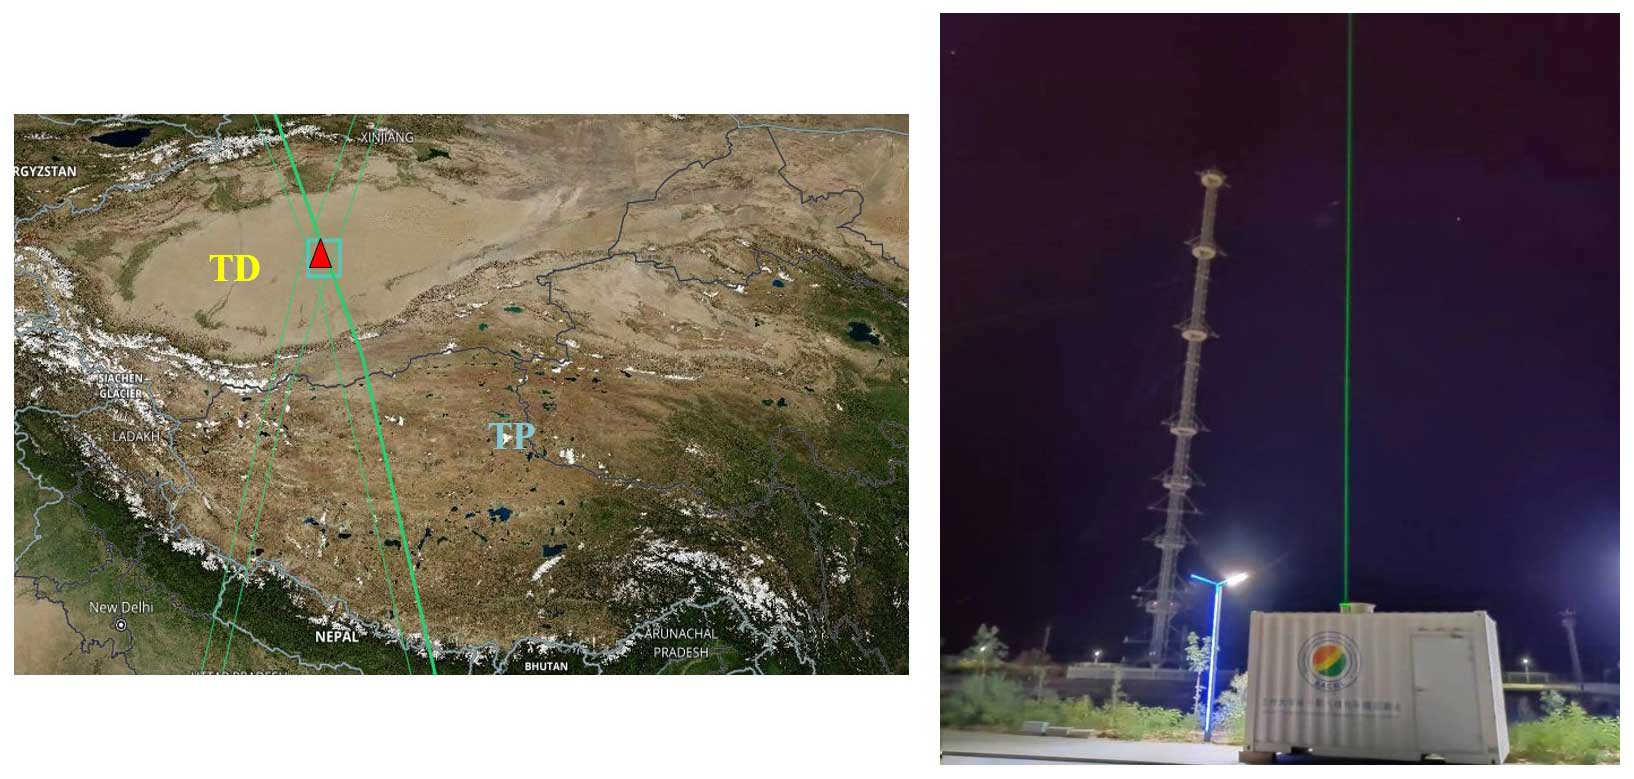
Figure 2The CALIPSO satellite orbit passes through the central area of the Taklimakan Desert hinterland – left. The red triangle represents the observation coordinates of the ground-based lidar – right (38.967° N, 83.65° E; 1099.3 m). TD: Taklimakan Desert; TP: Qinghai–Tibetan Plateau. Pictures from NASA'S Earth data (left) and photography (right).
Table 2Basic technical specifications of lidar from the hinterland of the Taklimakan Desert (TD).
In this study, based on the Level_2 aerosol profile data product (EC) for daytime and nighttime detected by CALIOP from 2007 to 2020, the LRAT is screened and eliminated. The aerosol characteristic dataset with higher reliability over the TP is constructed, and the dataset is verified and compared with MODIS and ground-based lidar to test its effectiveness and accuracy. Thus, the vertical structure of aerosol properties and its climatology with higher reliability over the TP can be obtained, providing adequate observation facts and a basis for the TP. All the steps were implemented and processed as shown in Fig. 3.
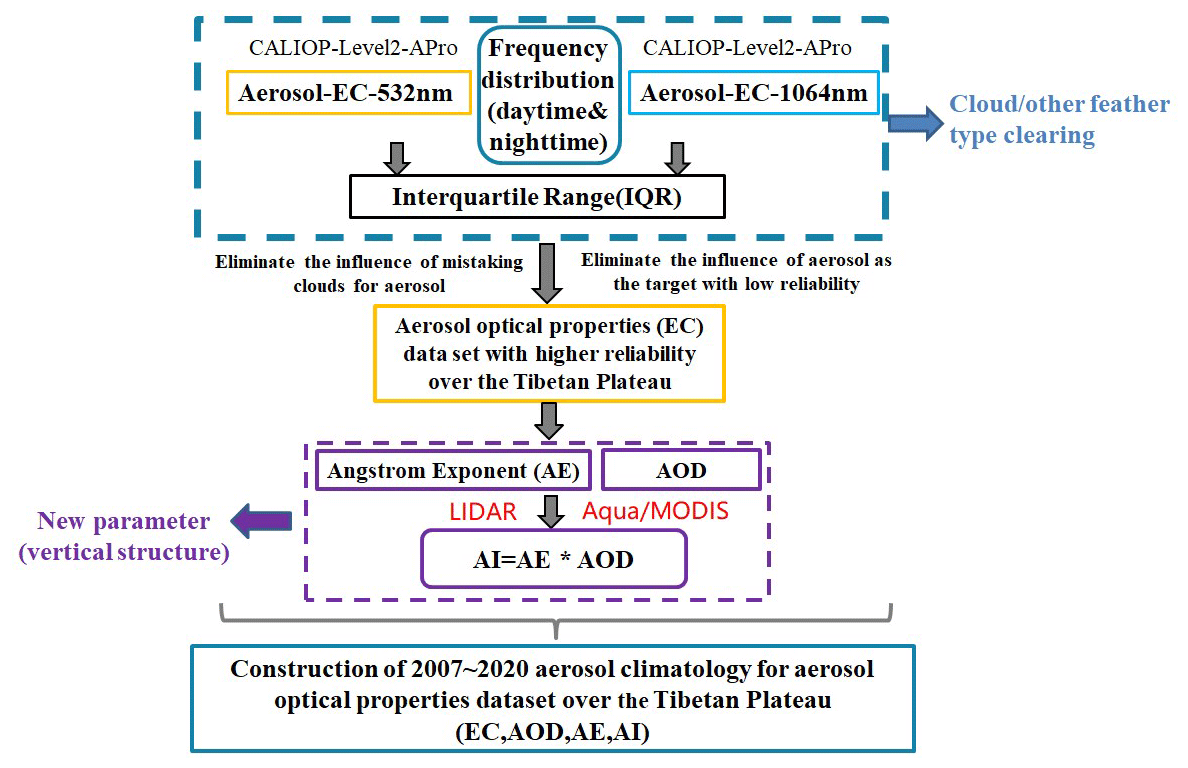
Figure 3Flowchart of the construction and calculation process of the aerosol optical characteristics dataset over the TP.
3.1 Screening and elimination of the LRAT
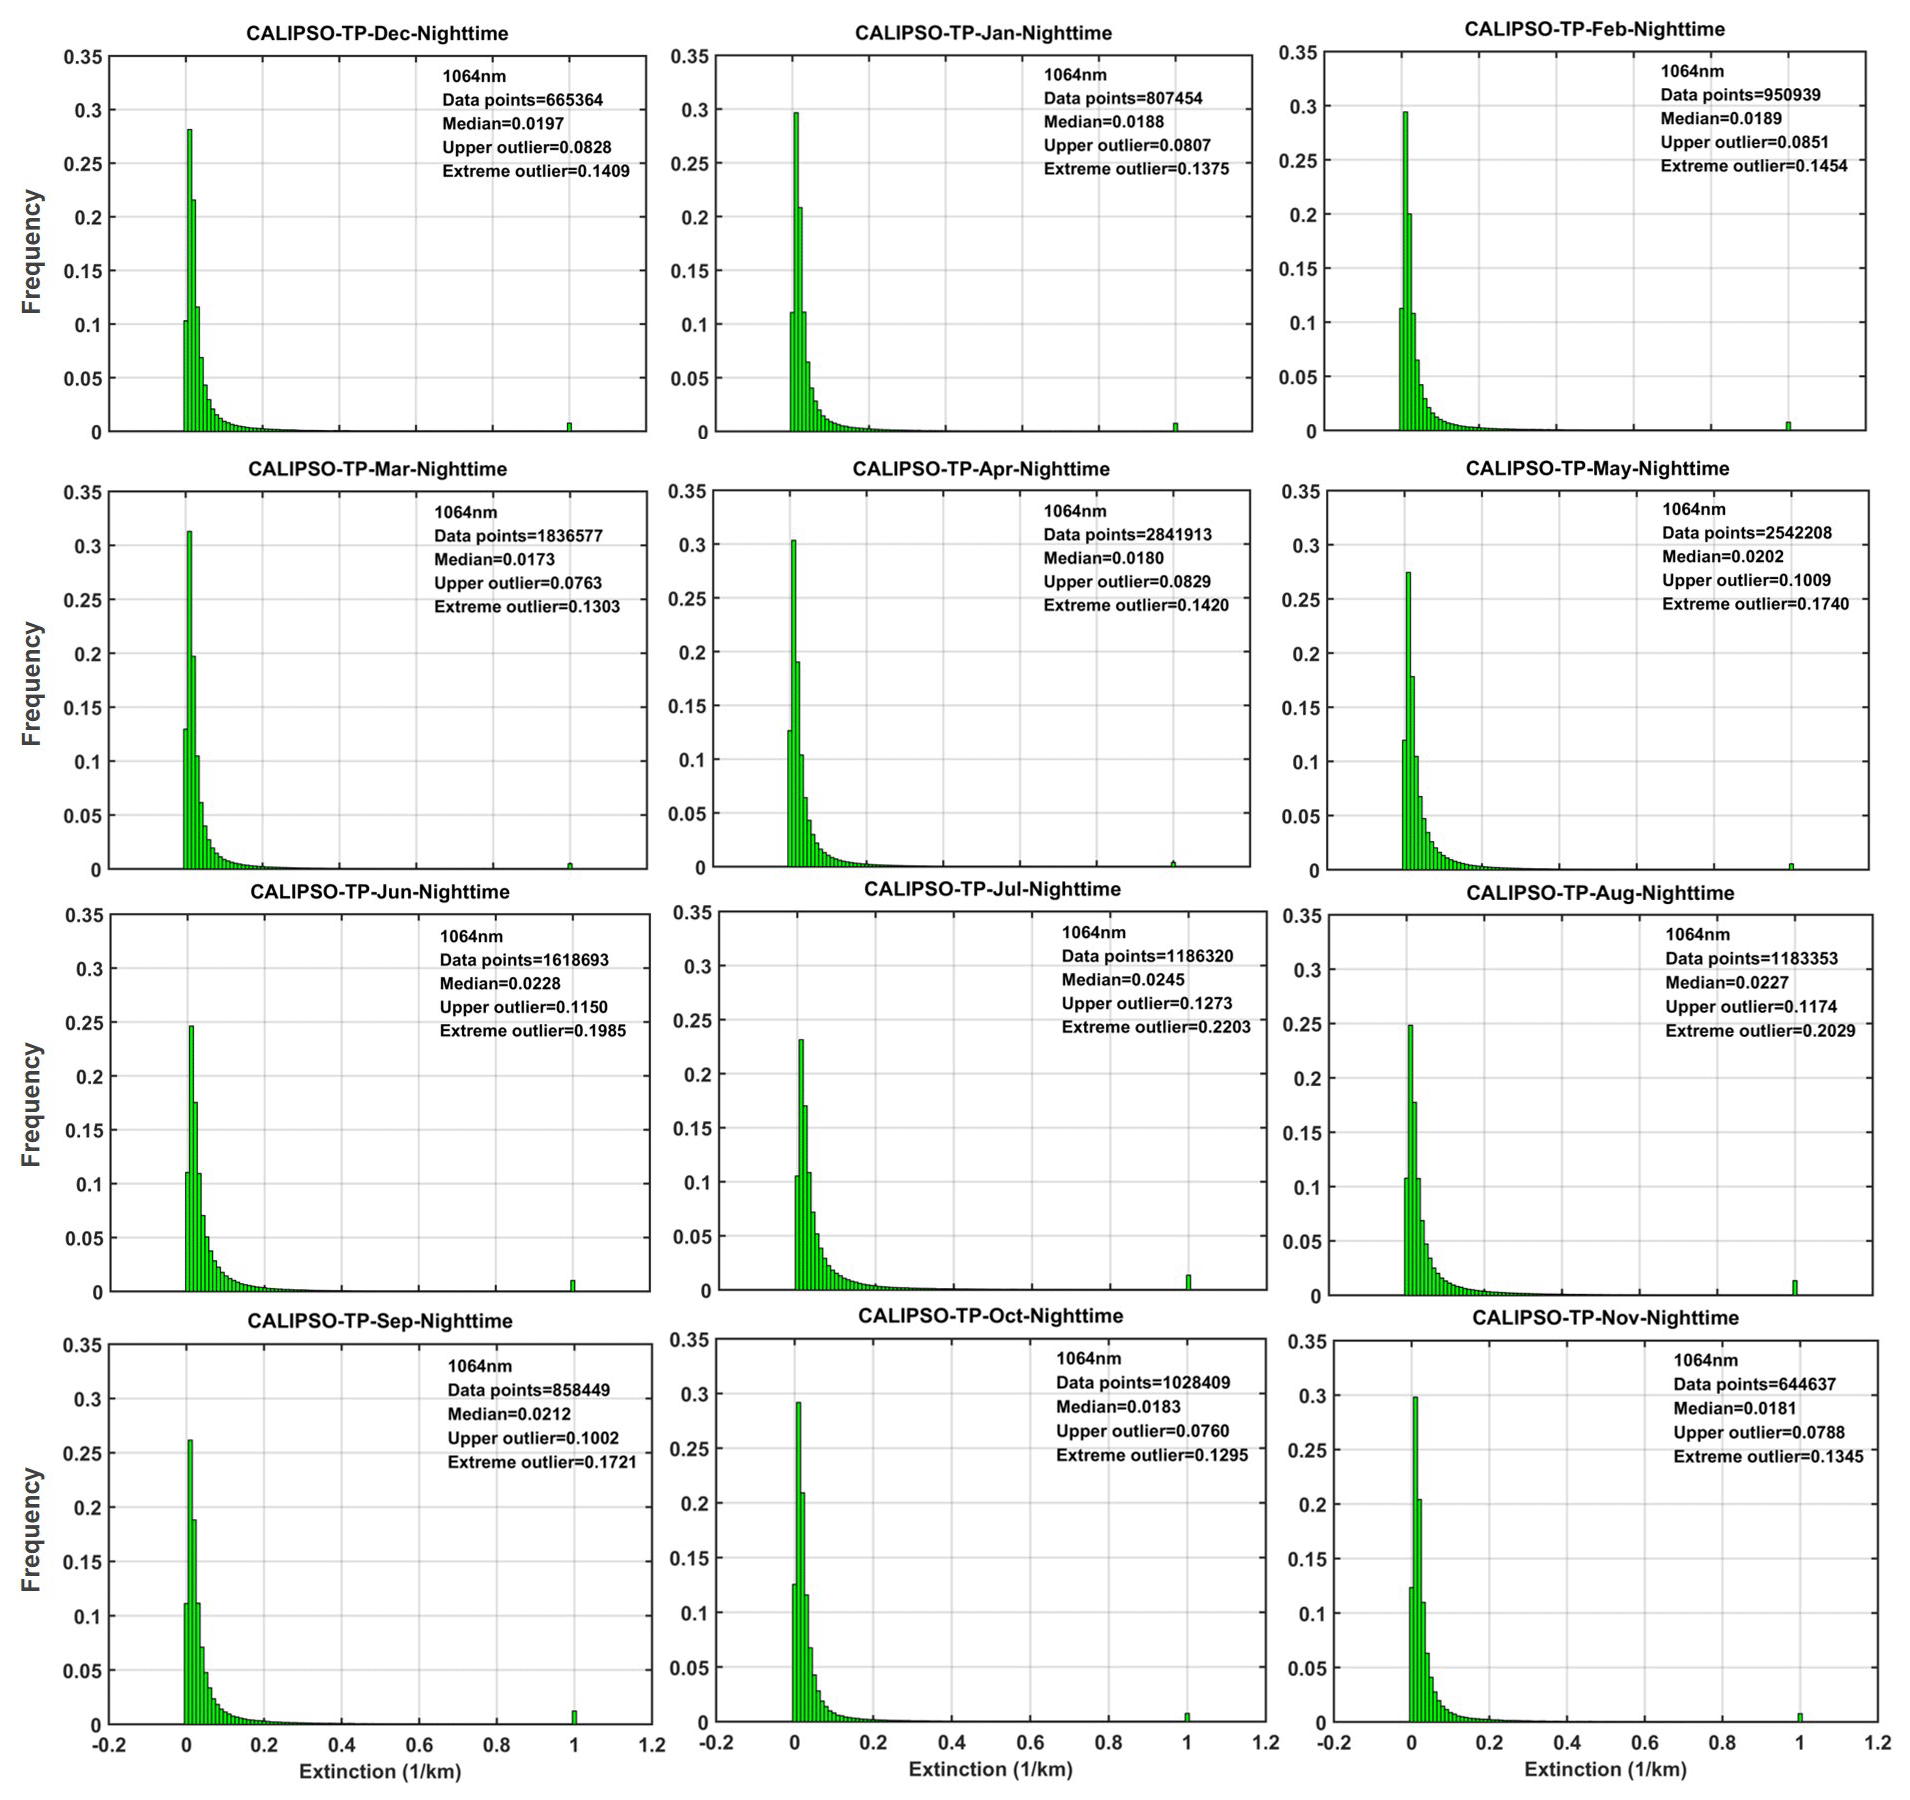
In this section, we screened and eliminated the LRAT for the tropospheric aerosol EC from CALIOP over the TP, based on the statistical method (see Sect. 2.2). Figures 4 and 5 show the monthly frequency distribution of the EC detected by CALIPSO–CALIOP at 532 and 1064 nm in the daytime during 2007–2020. Figures 6 and 7 are the same but for nighttime. It is observed that Figs. 4–7 demonstrated the non-normal distribution of the aerosol EC for daytime and nighttime. It is found that the upper outlier appeared to remove many enhanced aerosol measurements when more sand and dust events occurred in the surrounding areas and rose to the TP in spring and summer. In contrast, the extreme outlier was effectively identified in the frequency distribution. Therefore, the extreme outlier threshold is used to clear LRAT observations from the CALIOP dataset, which is necessary.
After the screening and elimination of the LRAT, the monthly aerosol climatology data and extreme outliers are compared for the years 2007–2020. We found that, during the daytime for 532 and 1064 nm, the aerosol EC over the TP is mainly concentrated between 0 and 0.2. The extreme outliers in July and August are more significant than those in other months, related to the rising motion of the TP as a heat source in summer to trigger convection. This results in more ice clouds in the upper air, thus increasing the probability of misclassification of the cirrus anvil as an aerosol (Carrió et al., 2007; Kojima et al., 2004; Seifert et al., 2007). Also, the aerosol data points (samples) are largest in May and smallest in November over the TP. Obviously, the aerosol samples are more numerous in the spring and summer seasons than in autumn and winter. This is related to the frequent sand and dust activities in the spring and summer seasons around the TP (such as the Taklimakan Desert) and anthropogenic pollution (Y. Liu et al., 2019, as mentioned earlier).
Similarly, during the nighttime for 532 and 1064 nm, the aerosol EC over the TP is mainly concentrated between 0 and 0.1, and the extreme outliers in July and August are more significant than those in other months. However, the aerosol EC observed in the nighttime is smaller than the daytime dataset. The primary consideration is that the daytime solar noise is considerable and the signal-to-noise ratio of lidar observation is low, which further increases the probability that the aerosol EC will present a skewed distribution. It can be seen that the elimination of the LRAT from daytime data is more conducive to improving the accuracy of the data. Meanwhile, the aerosol data points are largest in April and smallest in December over the TP. It can be seen that, in April (spring), more aerosol samples were lifted and transported to the TP. Numerous observations have shown elevated dust plumes lofted into the free troposphere during spring, and air parcels between 4 and 7 km mainly originate from the TD (Huang et al., 2008; Sasano, 1996; Liu et al., 2008; Zhou et al., 2002; Matsuki et al., 2003). It is the same as the daytime with spring and summer being more than autumn and winter and 1 order of magnitude larger than the daytime data. It is not difficult to see that CALIOP is less sensitive during daytime than nighttime due to signal-to-noise-ratio reduction by solar background illumination, which leads to weakly scattering layers being detected during nighttime and missed during daytime (Huang et al., 2013; Liu et al., 2009).
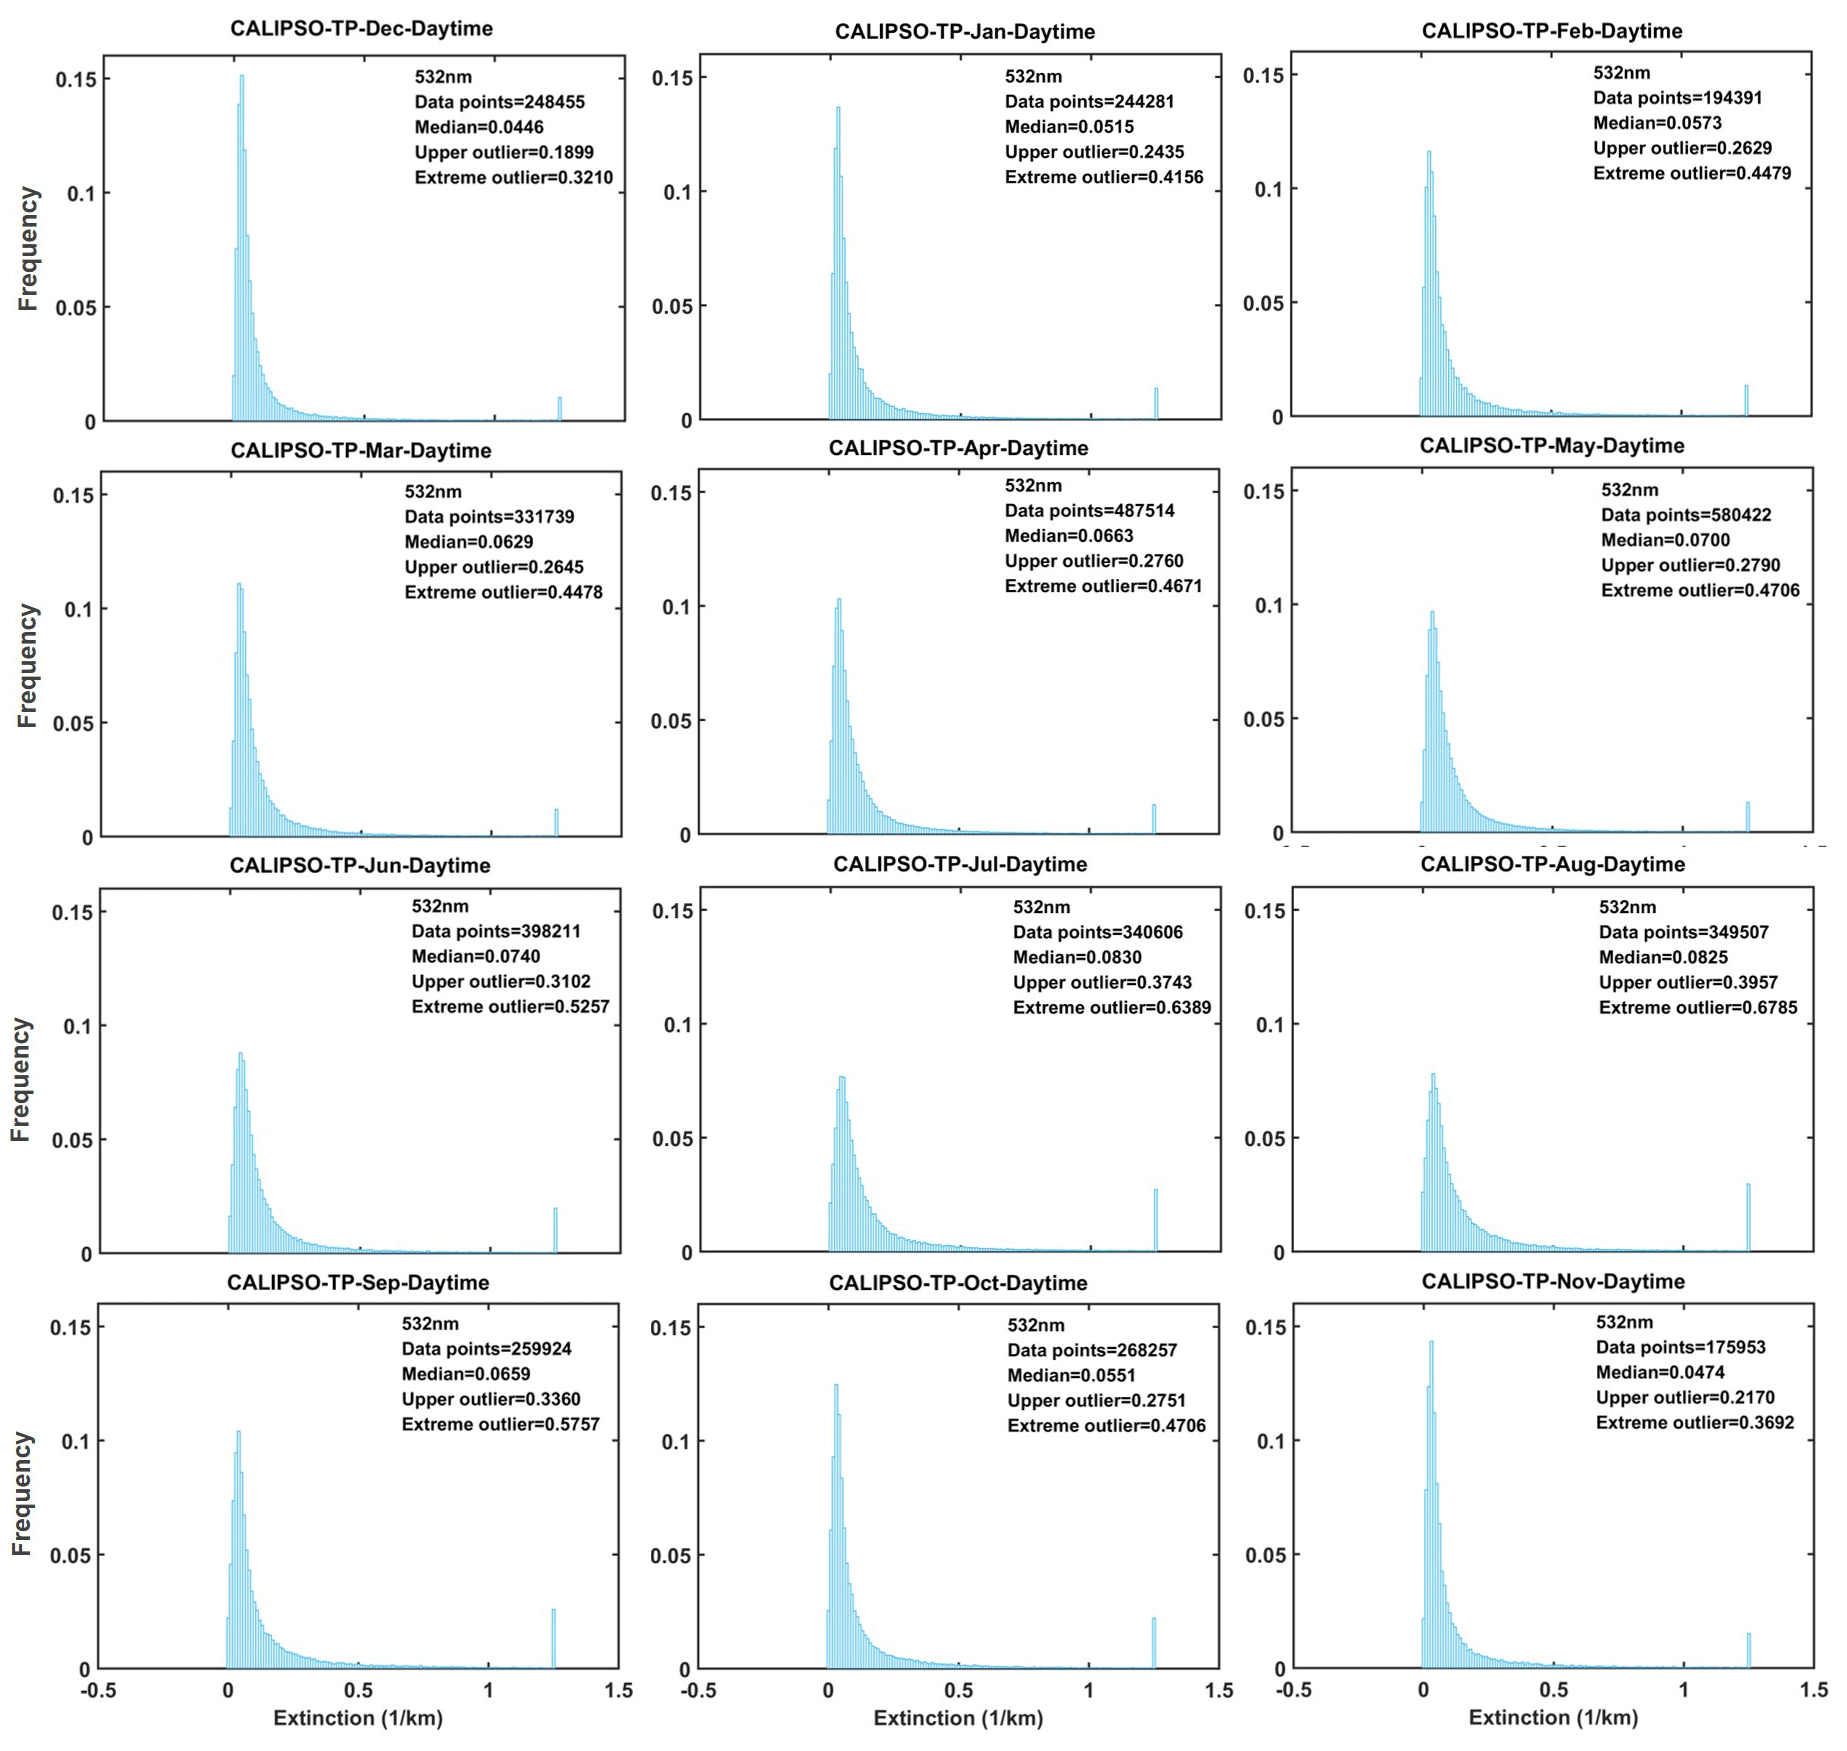
Figure 4Monthly frequency distribution of the aerosol extinction coefficient at 532 nm over the Tibetan Plateau (TP) in the daytime during 2007–2020 from January to December. The panels in the first, second, third, and fourth rows correspond to winter (December–February), spring (March–May), summer (June–August), and autumn (September–November). The frequency distribution is the number of events normalized to the maximum value. The upper outlier, extreme outlier, and median are also shown in all the panels.
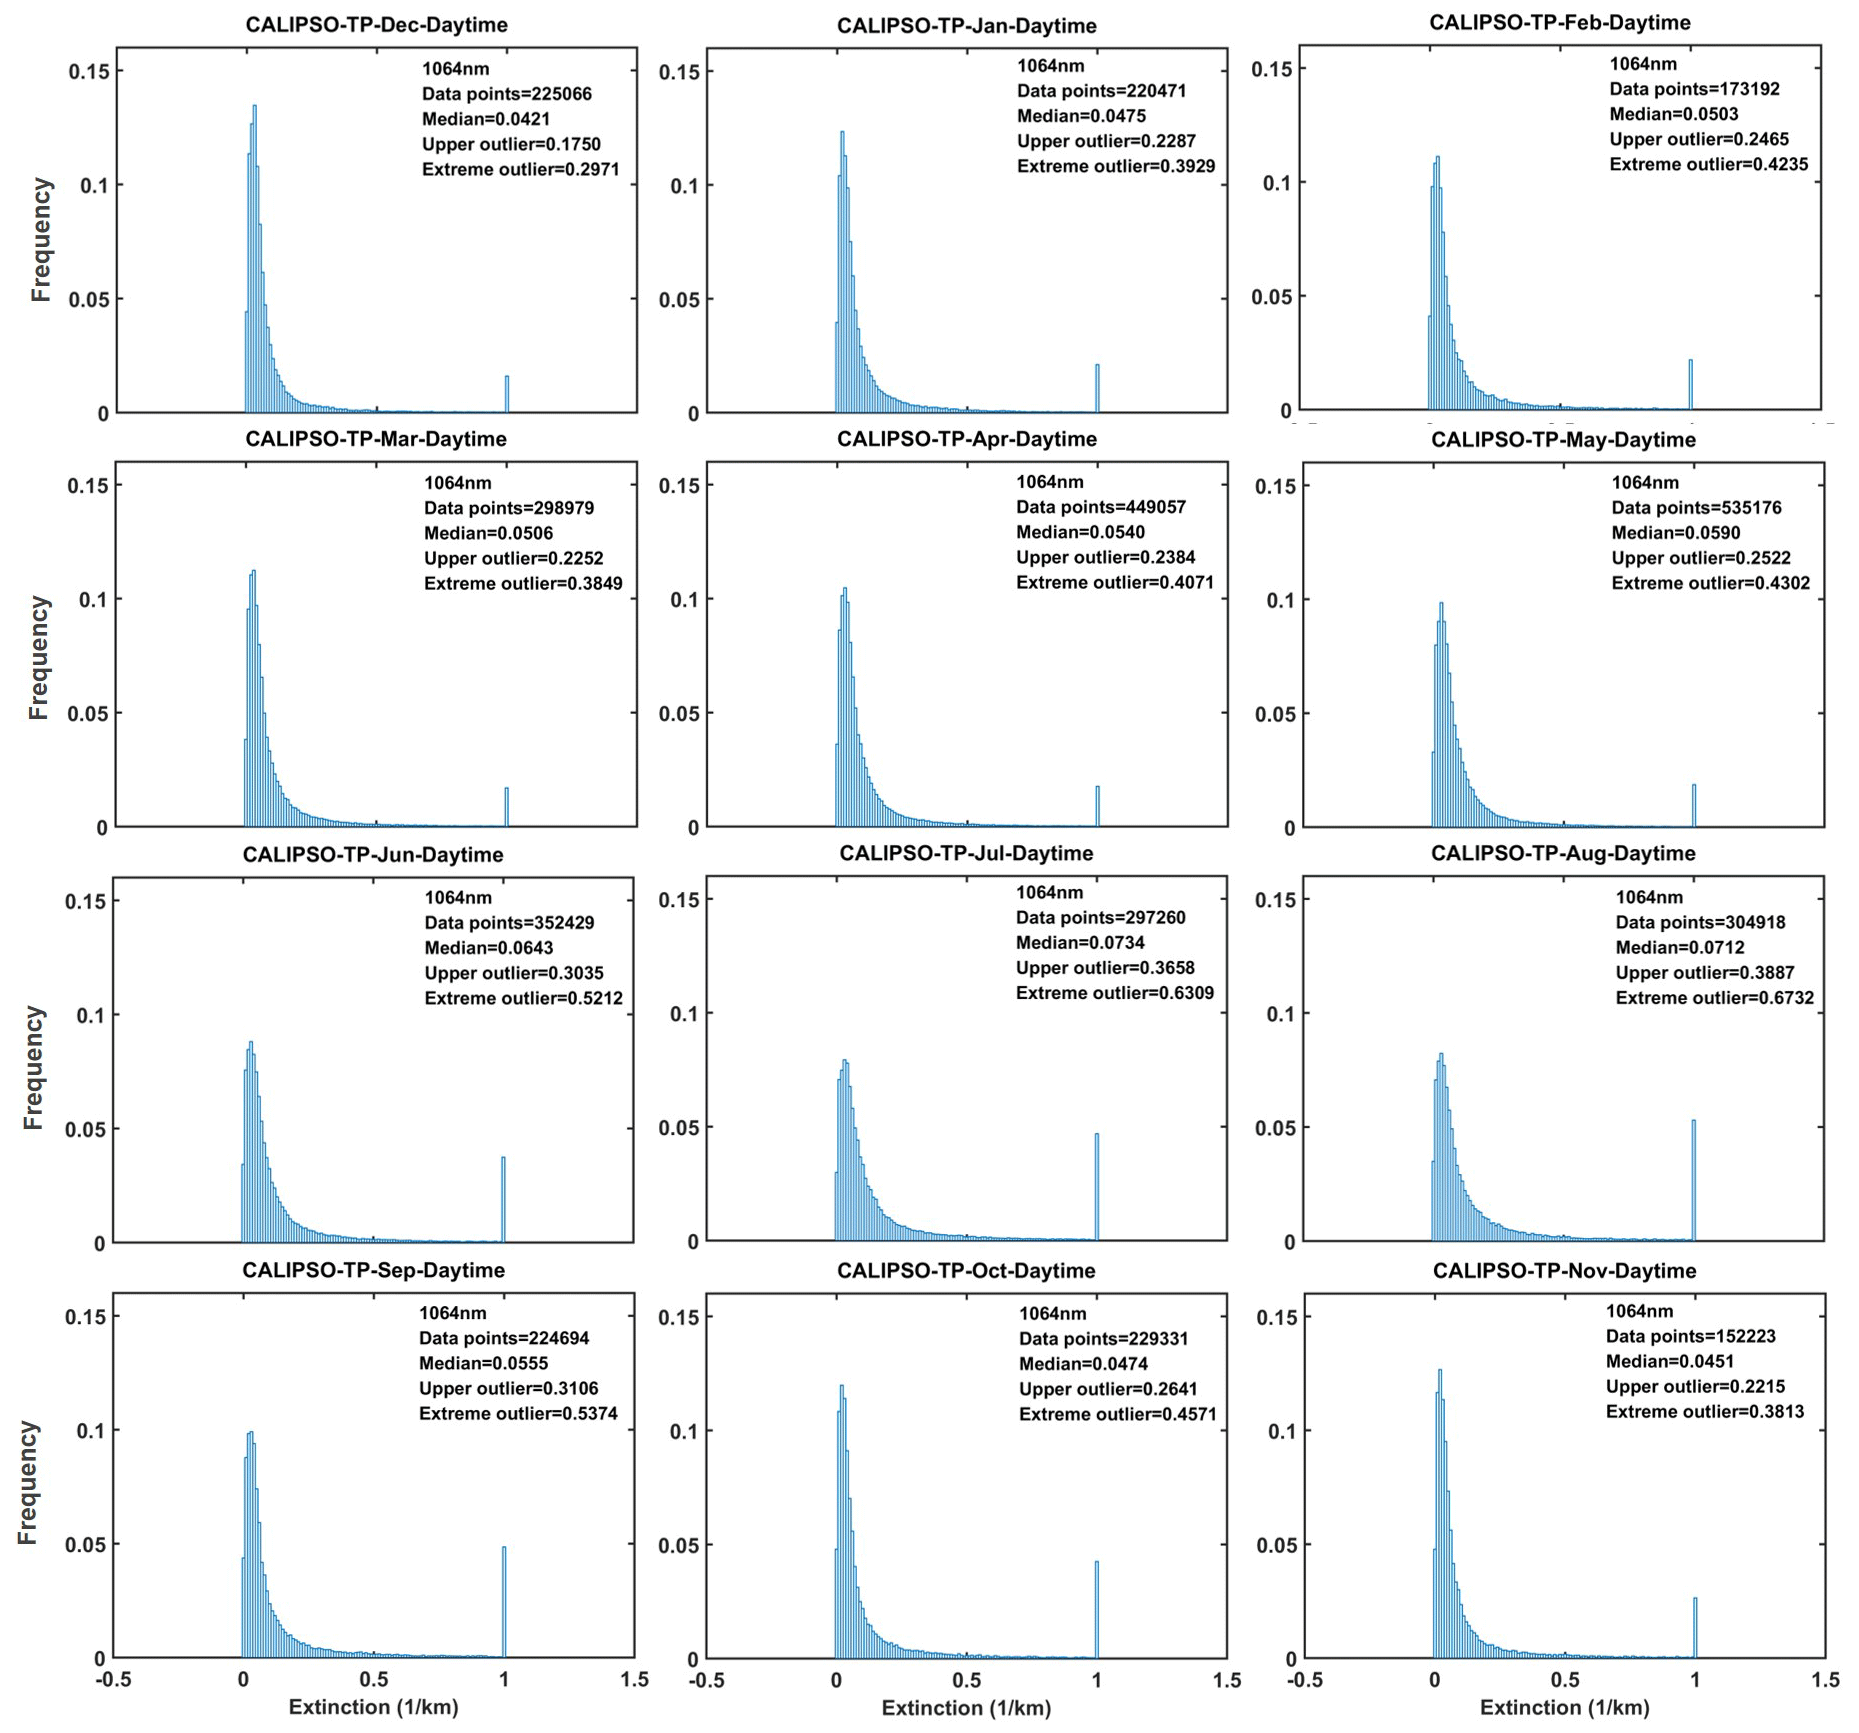
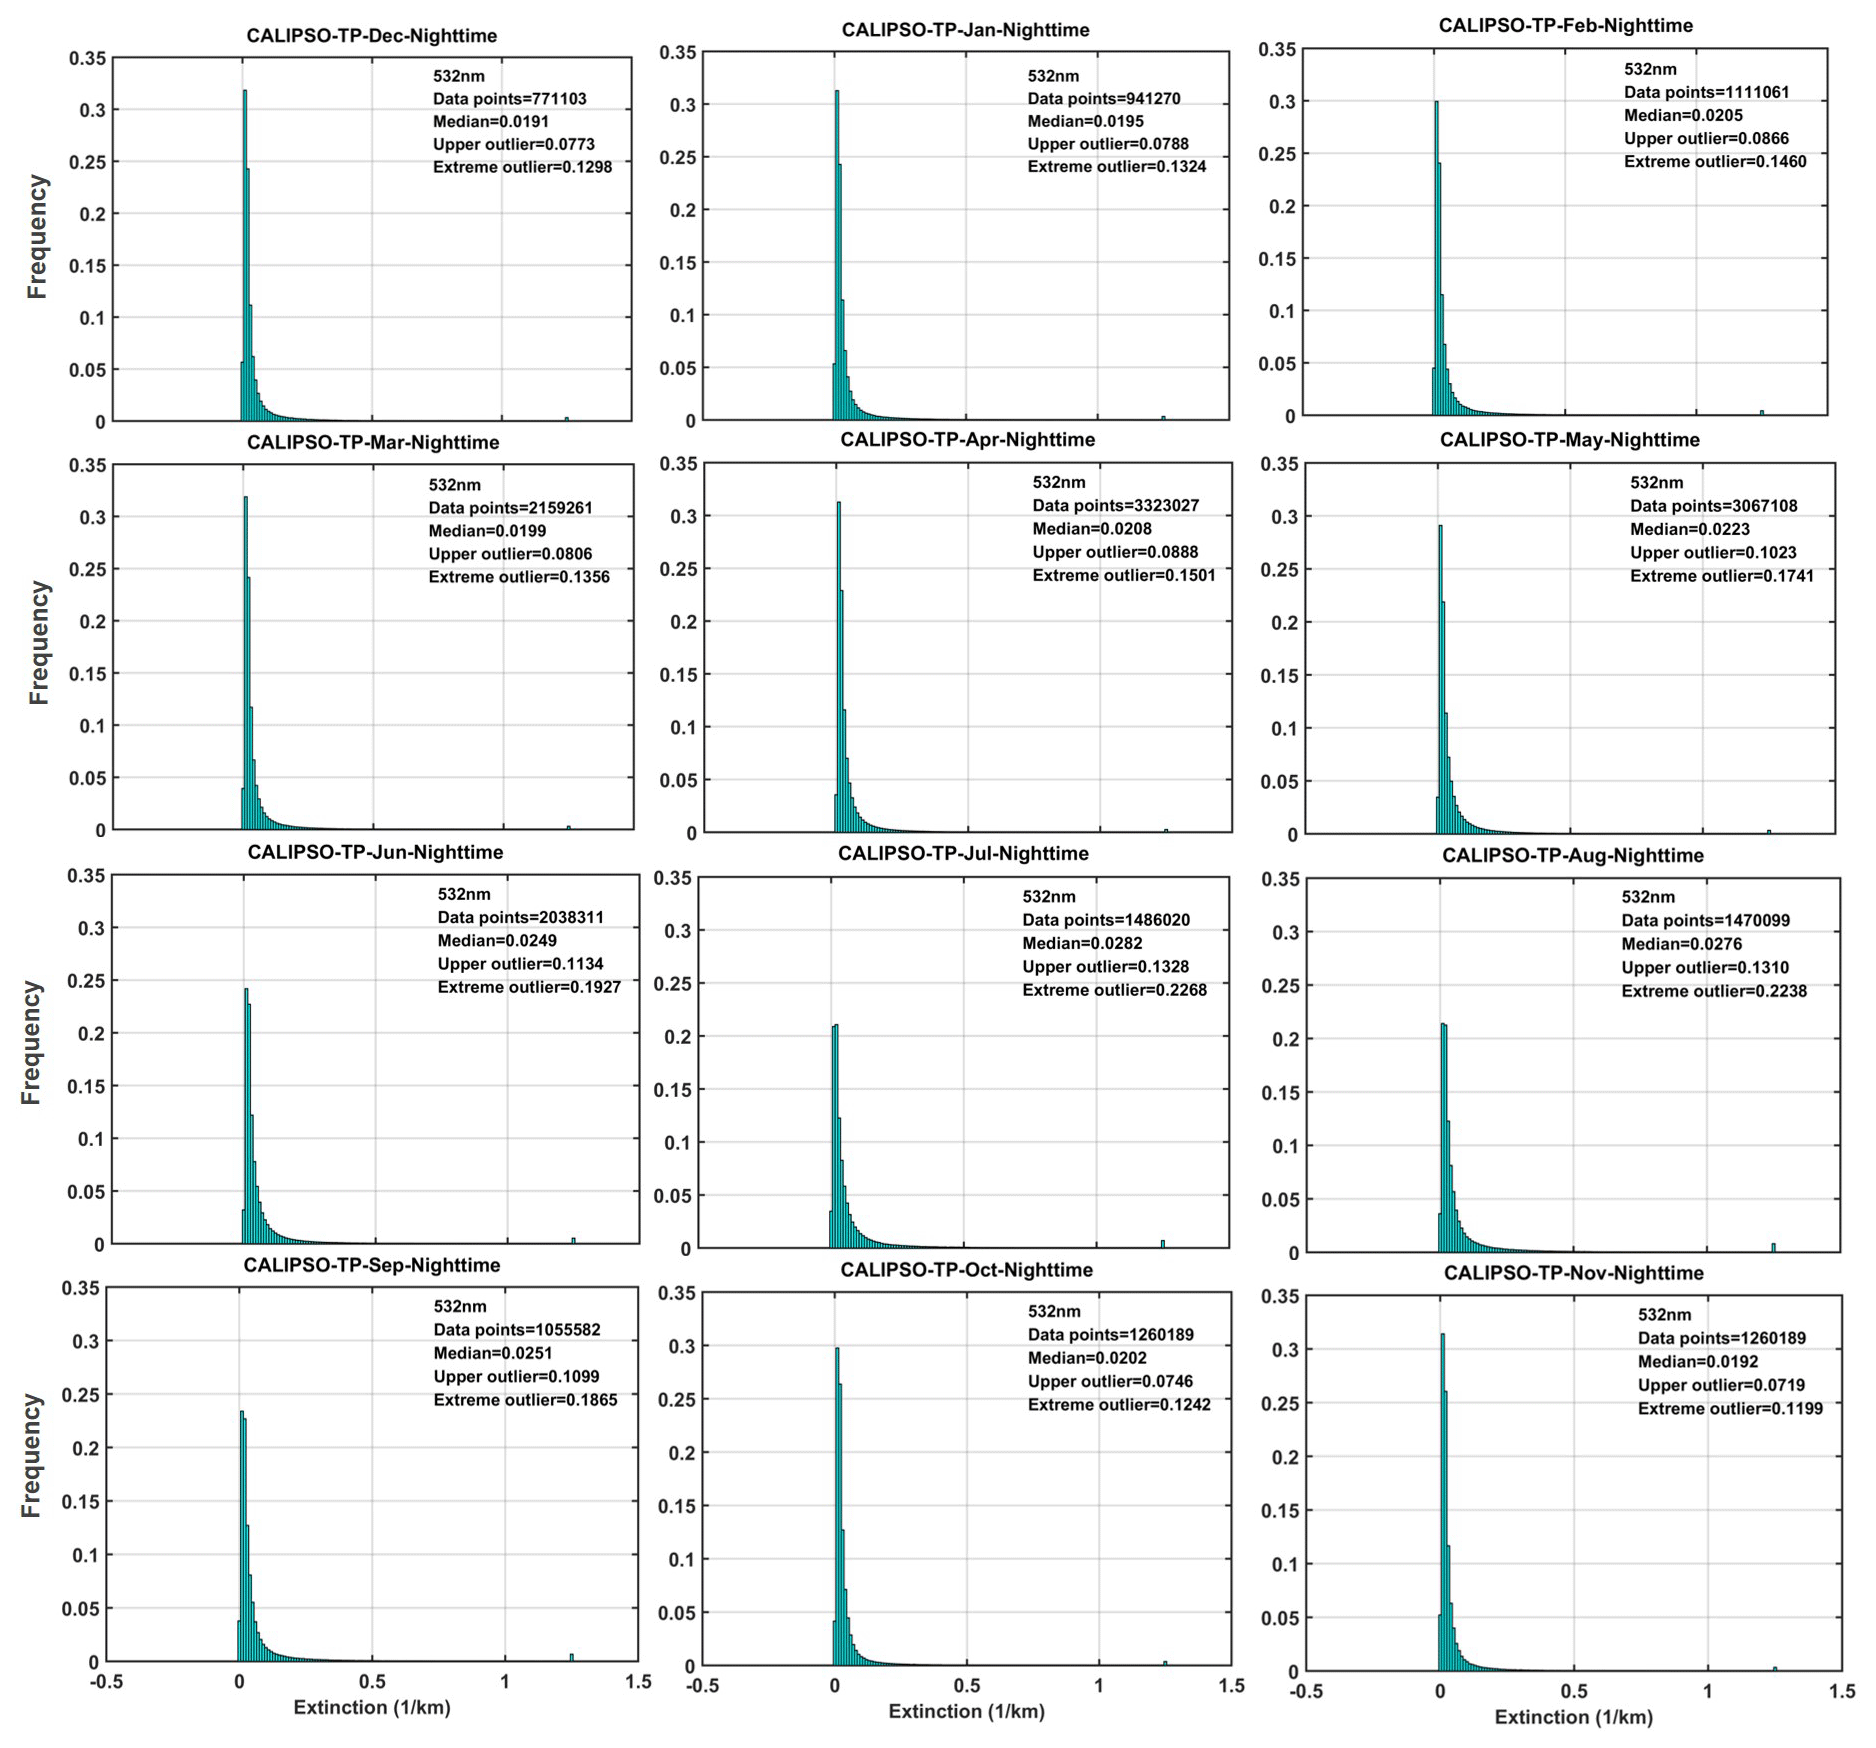
Figure 6Monthly frequency distribution of the aerosol extinction coefficient at 532 nm over the TP at nighttime during 2007–2020 from January to December. The panels in the first, second, third, and fourth rows correspond to winter (December–February), spring (March–May), summer (June–August), and autumn (September–November). The frequency distribution is the number of events normalized to the maximum value. The upper outlier, extreme outlier, and median are also shown in all the panels.
3.2 Constructing the vertical AI for daytime and nighttime
Figures 8 and 9 show daytime altitude–latitude plots of the monthly climatology of the aerosol EC at 532 and 1064 nm before and after the screen, respectively. The monthly mean climatology of the pseudo AE and AI vertical structure is then computed as shown in Fig. 10. We choose typical months of January, April, July, and October to represent the respective seasons of winter, spring, summer, and autumn. Figures 8 and 9 show that extreme outliers in the troposphere over the TP have been eliminated, especially in the lower layer, where a more obvious LRAT has been identified and eliminated. In the upper layer (more than 7 km), especially in April and July (i.e. spring and summer), weak cirrus signs may exist in the original aerosol signals and be eliminated. Compared with the other seasons, the aerosol on the TP is widely and uniformly distributed in the troposphere in April, indicating that, in general, more aerosol loads are lifted over the TP in April. In Fig. 10, we compute values between 0 and −1 for much of the troposphere, which occasionally are between 0 and 2 in the middle troposphere (less than 8 km), which has similar results or patterns to Kovilakam's study (Kovilakam et al., 2020). Note that the derived value for a pseudo AE is without a physical meaning, and it is simply a means of combining AOD to obtain the AI of a vertical structure. Using this climatology of pseudo AE values, we can effectively convert any month of AI data to 532 and 1064 nm because the fixed AE is not necessarily applicable to retrieving aerosol extinction in all months. Relevant research points out that the accuracy has been improved using the corresponding AE of each month to correct the satellite data (Kovilakam et al., 2020).
Figure 10 also demonstrates the distribution characteristics of AI values at 532 and 1064 nm in different seasons over the TP in the daytime. In all the seasons, the AI is mainly distributed between −0.04 and 0.04. Still, the proportion between 0 and −0.02 is the largest. Here, we have a broad understanding of a traditional AI. The AI is a way to measure how backscattered ultraviolet (UV) radiation from an atmosphere containing aerosols differs from that of a pure molecular atmosphere (Guan et al., 2010). The AI is especially sensitive to the presence of UV-absorbing aerosols such as smoke, mineral dust, and volcanic ash. The AI positively suggests the existence of absorbent aerosols (dust, black carbon, etc.). A small or negative AI suggests the presence of non-absorbable aerosols or clouds (Hu et al., 2020; Guan et al., 2010; Hammer et al., 2018). The AI varies with aerosol layer height, optical depth, and single scattering albedo (Torres et al., 1998, 2007; Hsu et al., 2004; Jeong and Hsu, 2008). However, the significance of obtaining a vertical structure AI in our research content is different from that of traditional AI representation. The AI obtained from our research work cannot effectively characterize the absorption and non-absorption of its aerosols, as the results obtained are in the non-ultraviolet band range. However, the aerosol concentration represented by the vertical structure AI is not possessed by column AOD. Compared to the aerosol column concentration AOD information, as AOD is an integral result of the entire layer height, it will to some extent lose some of the true changes in the vertical heights of aerosols. The significance of our work is that the AI with higher reliability obtained here can more effectively obtain aerosol concentration information at vertical height. In the four seasons, the distribution of aerosols in the north is broader than that in the south. In spring, the rise height of the aerosol is higher and the vertical distribution range is more comprehensive. The elevation in summer is lower than that in the other three seasons, but the aerosol species are more abundant because there are many ranges of AE values.
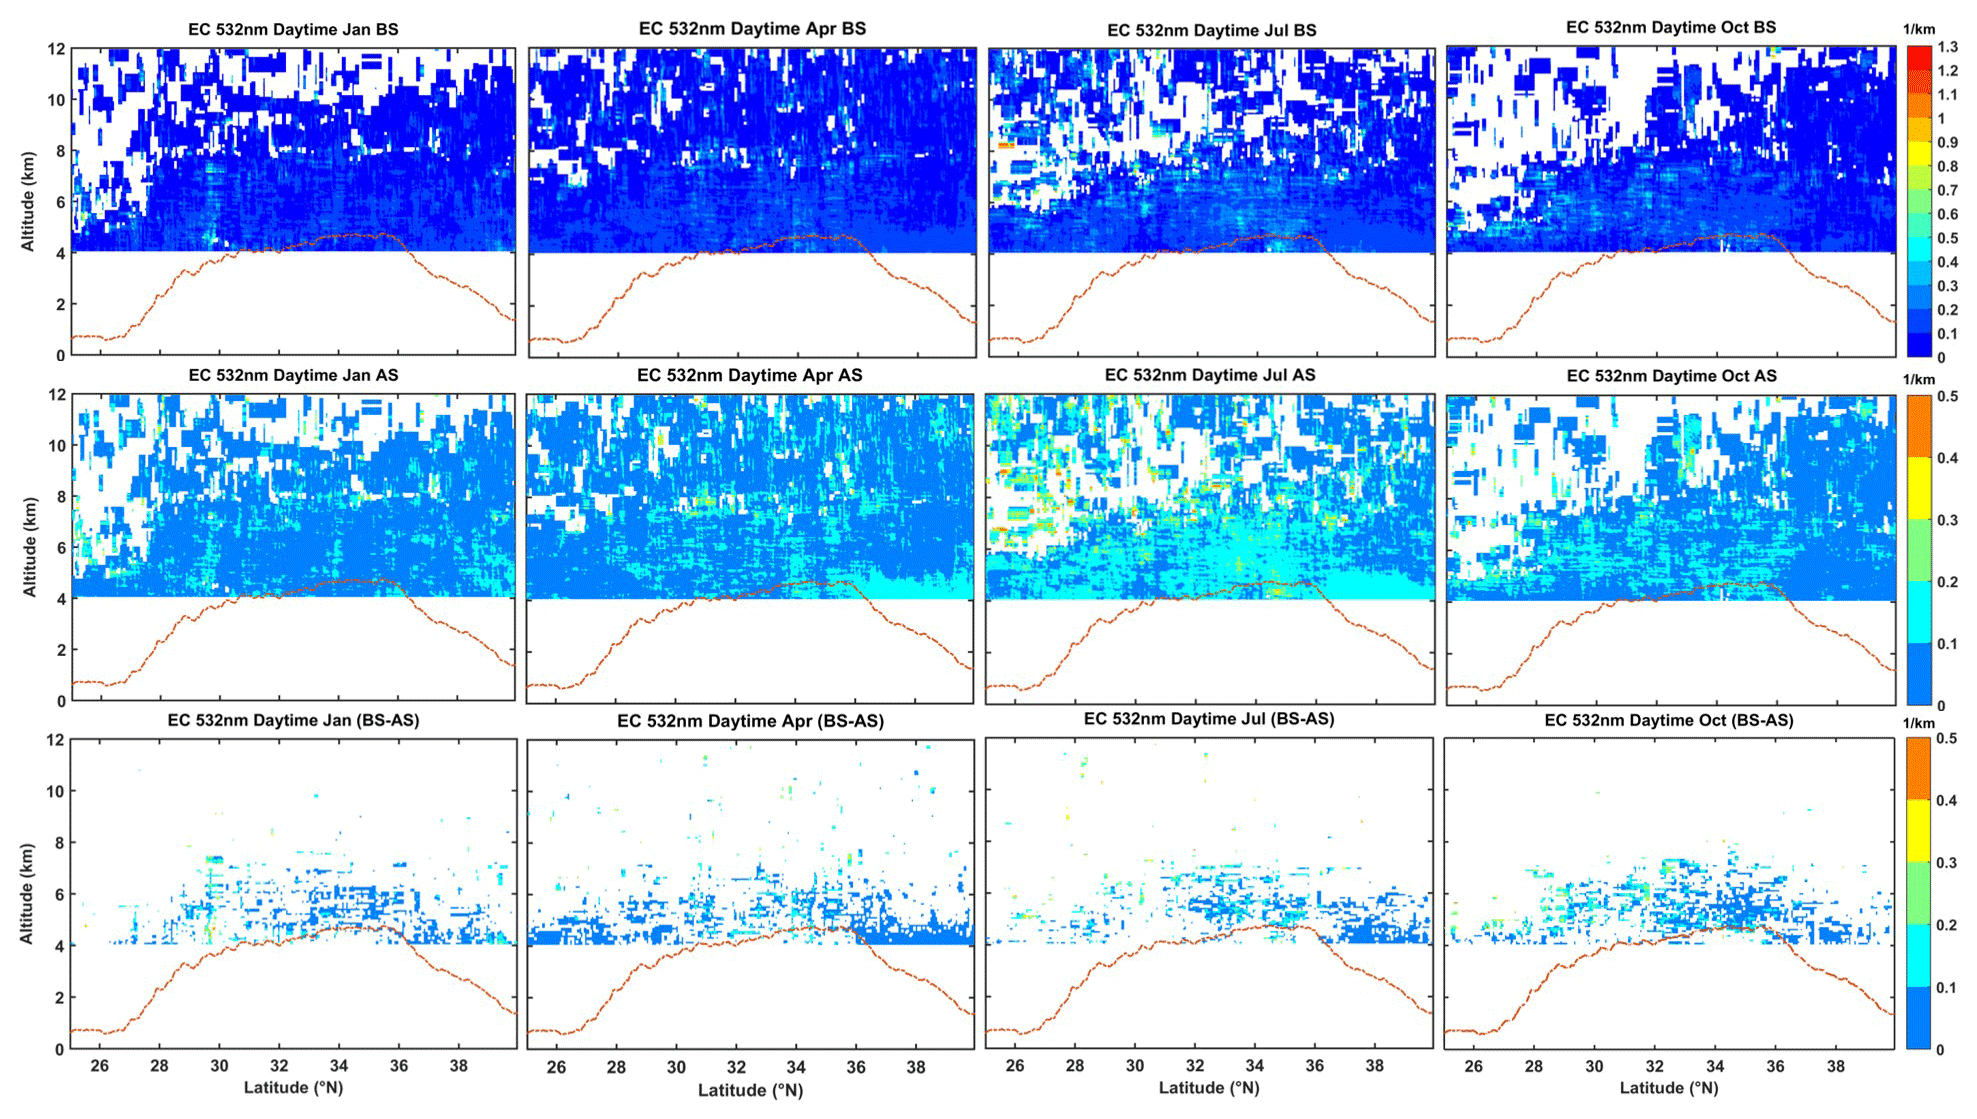
Figure 8The monthly average comparison and difference of the aerosol extinction coefficient at 532 nm before and after elimination of the LRAT over the TP for daytime during 2007–2020. The reddish-brown dotted line denotes the surface. BS: before-screened, first line; AS: after-screened, second line; BS–AS: before-screened minus after-screened, representing a spatial lattice with screening and elimination (third line).
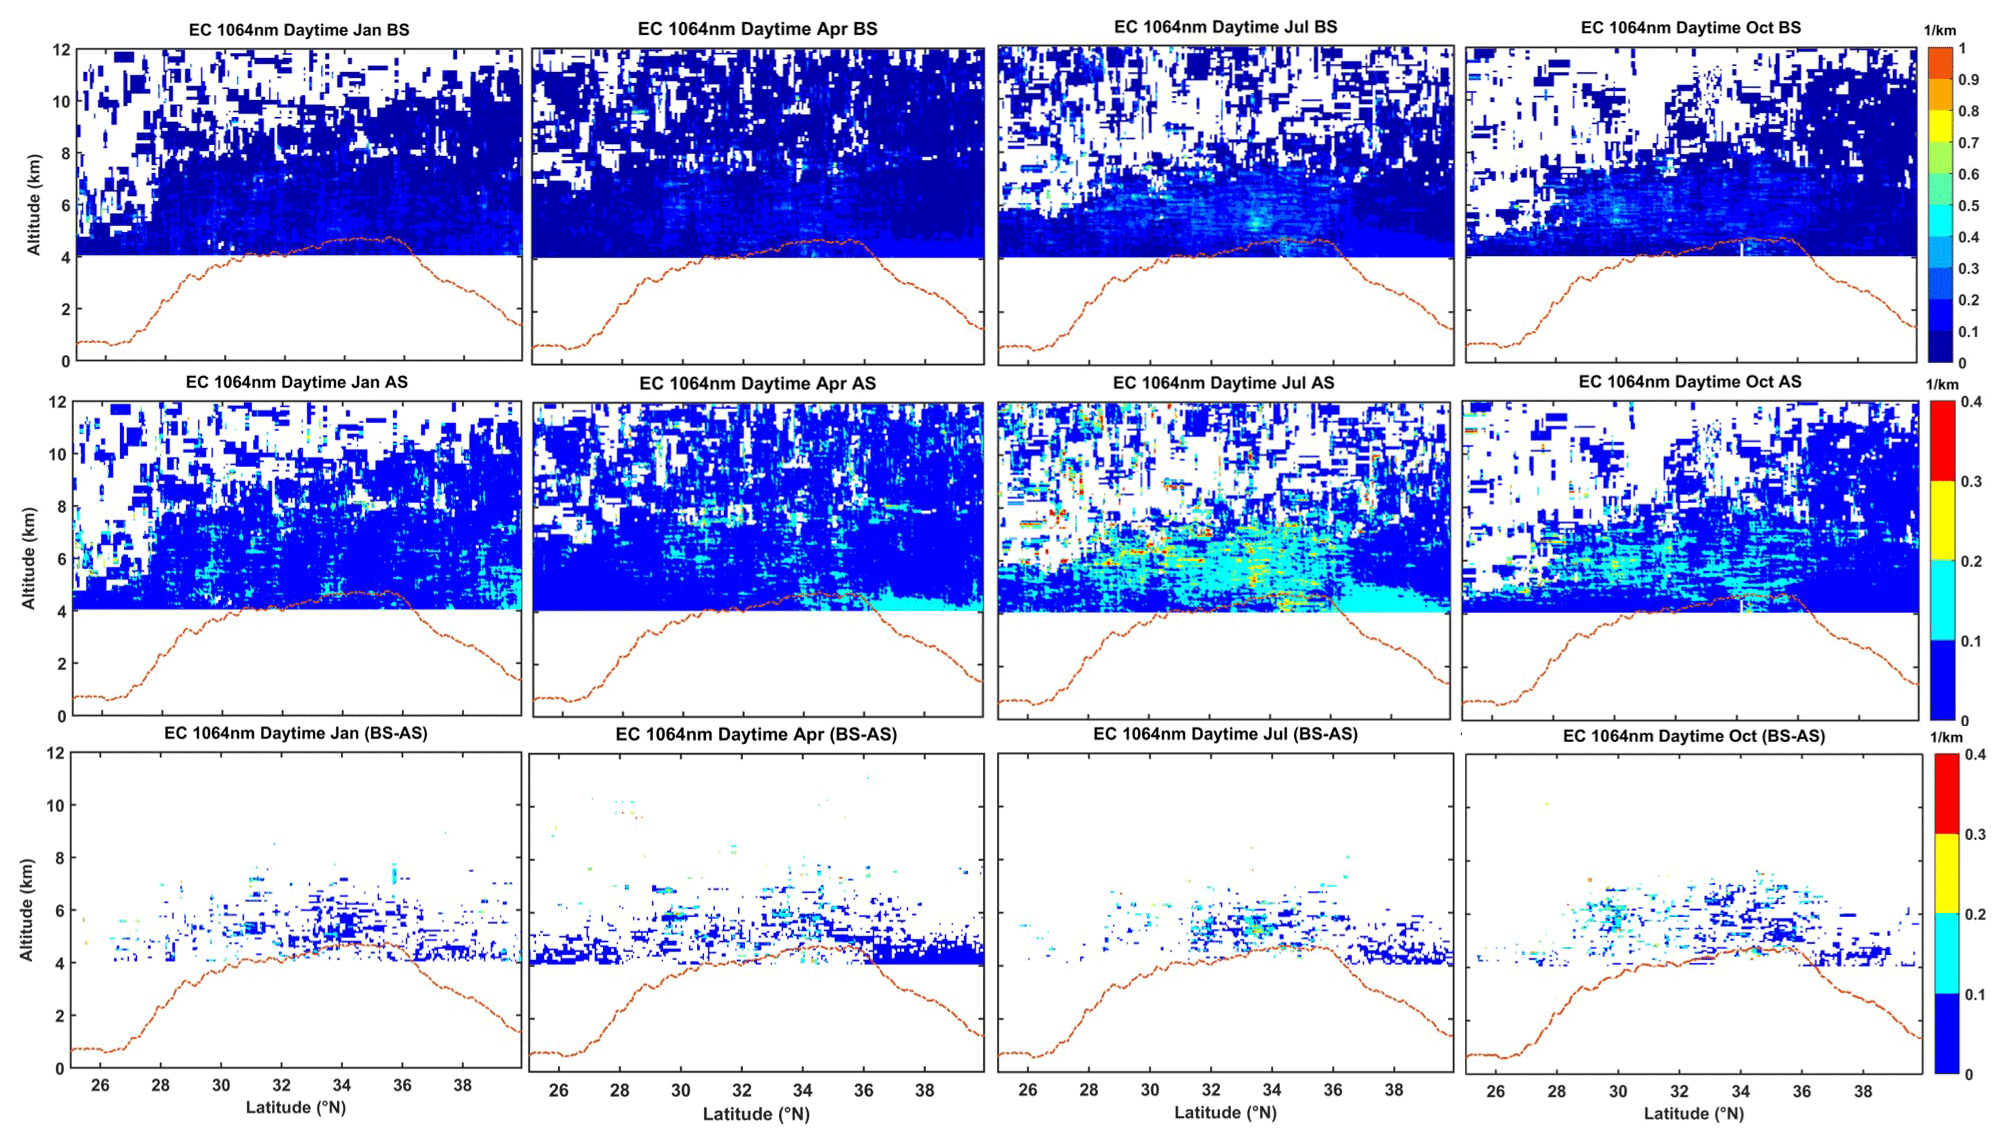
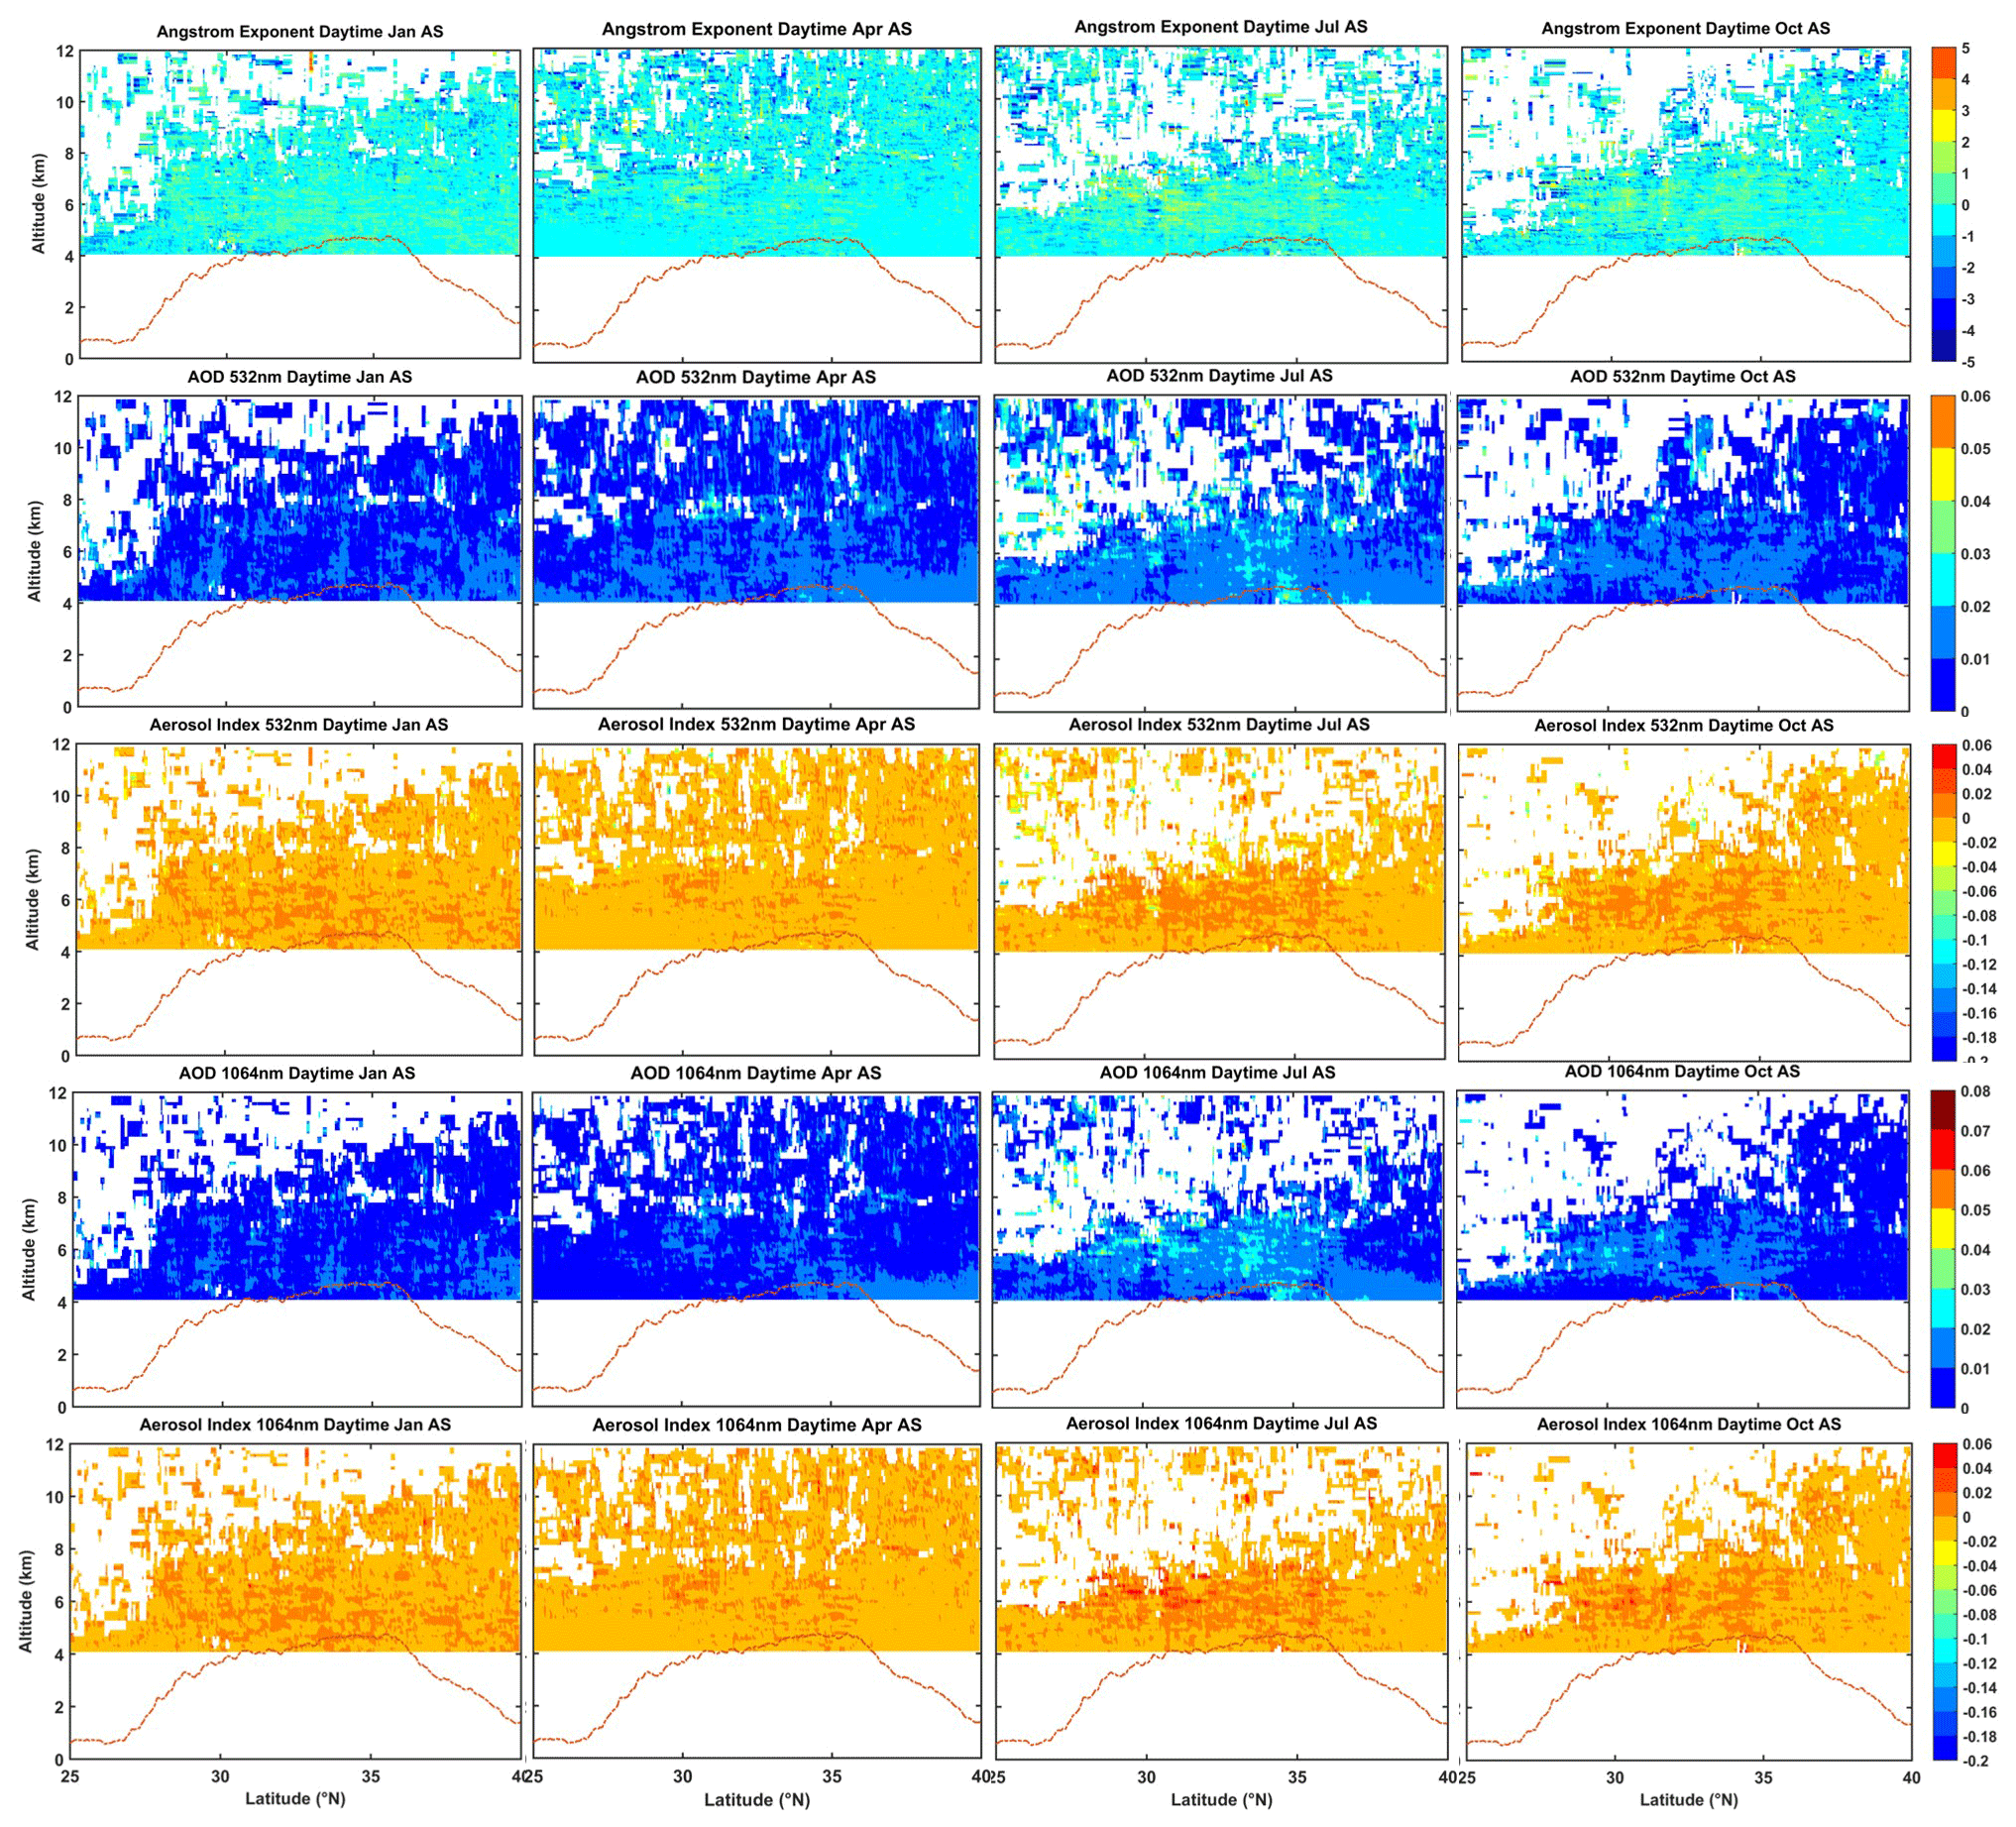
Figure 10The monthly average construction of the vertical structure of the Ångström exponent (AE) and aerosol index (AI) at 532 and 1064 nm over the TP for daytime during 2007–2020.
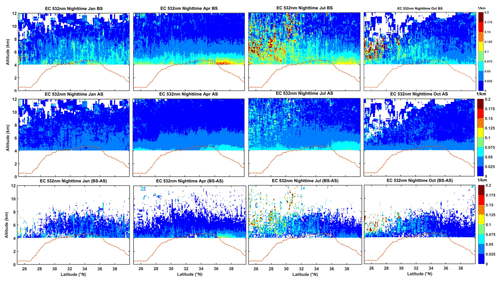
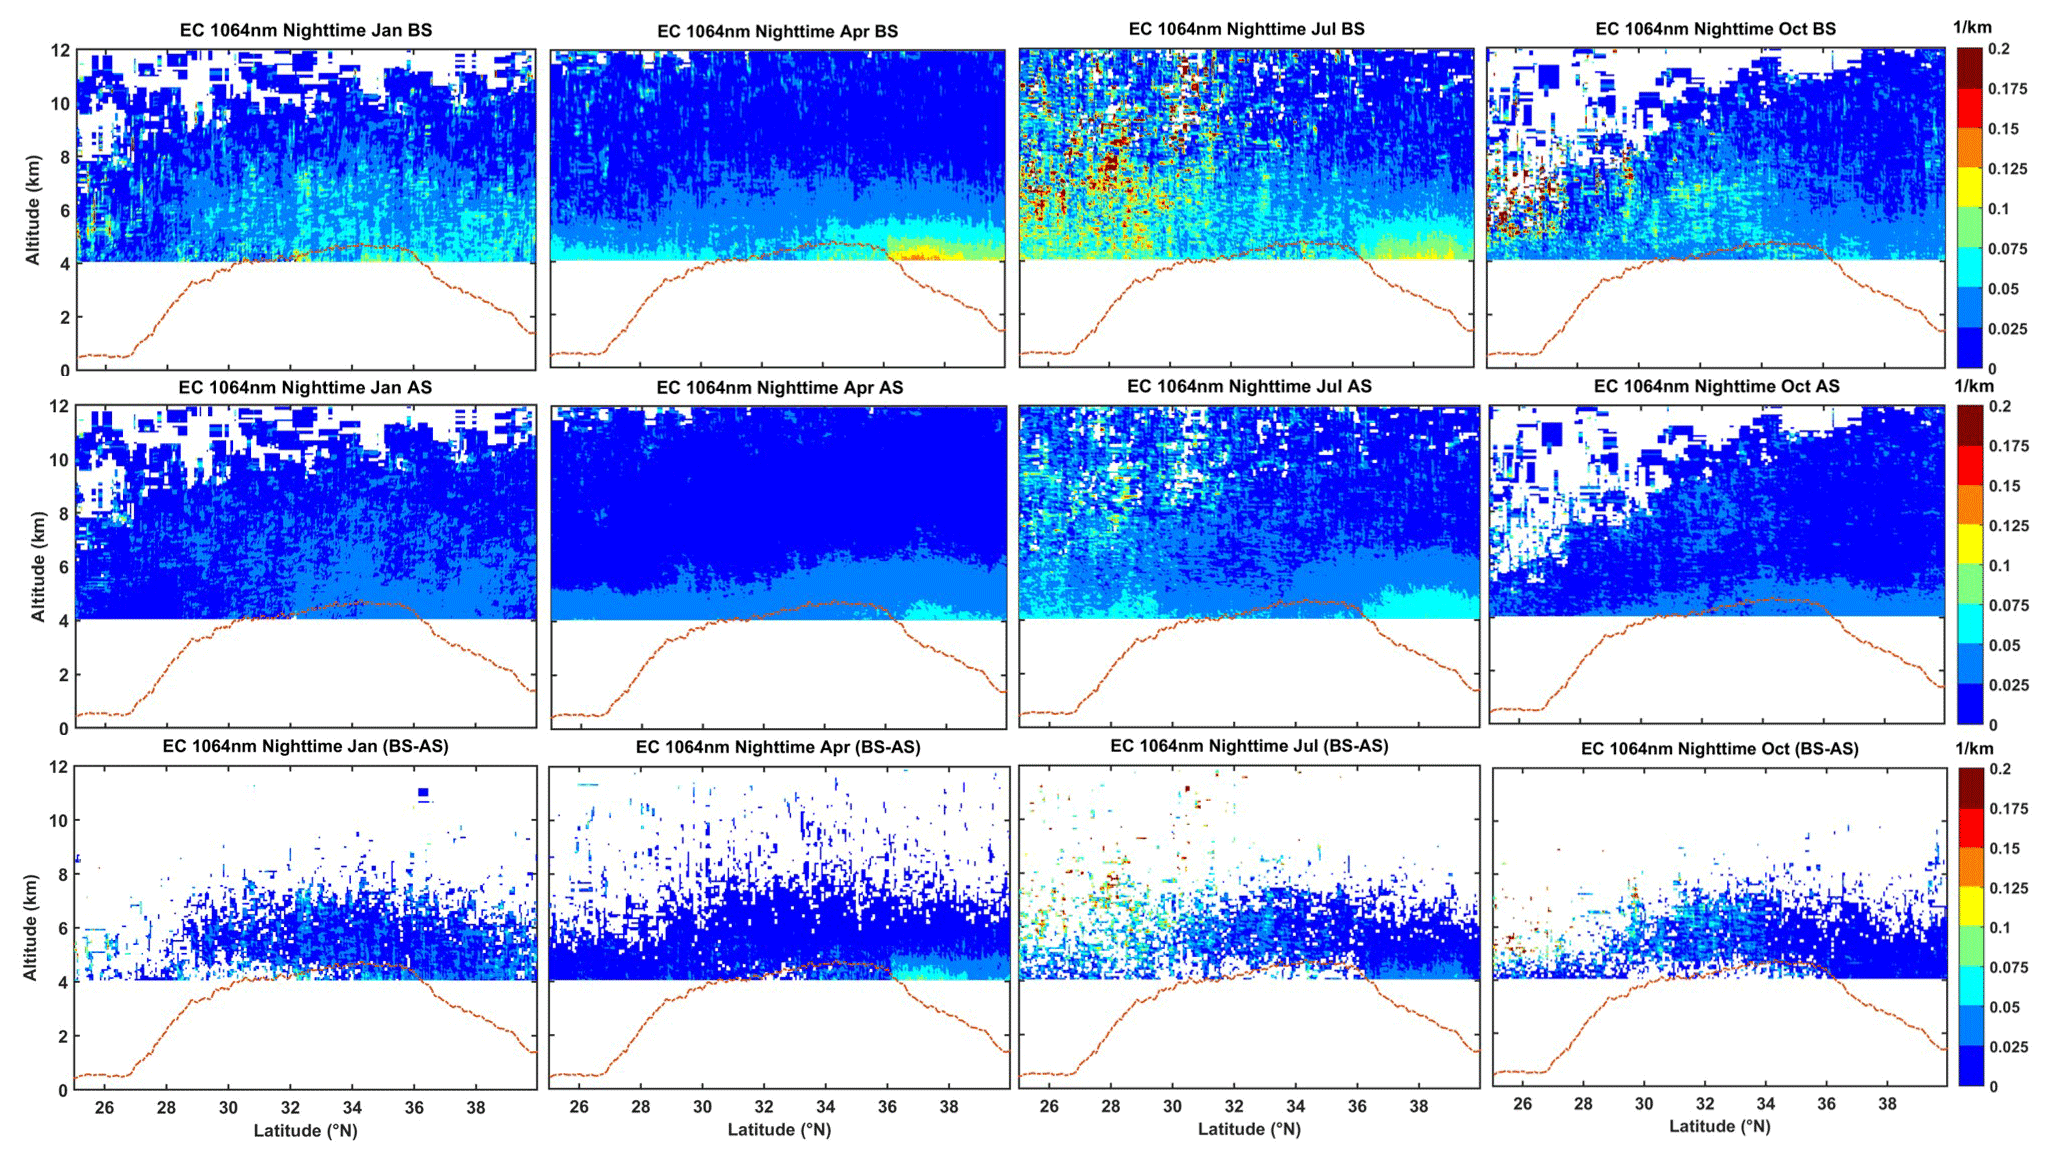
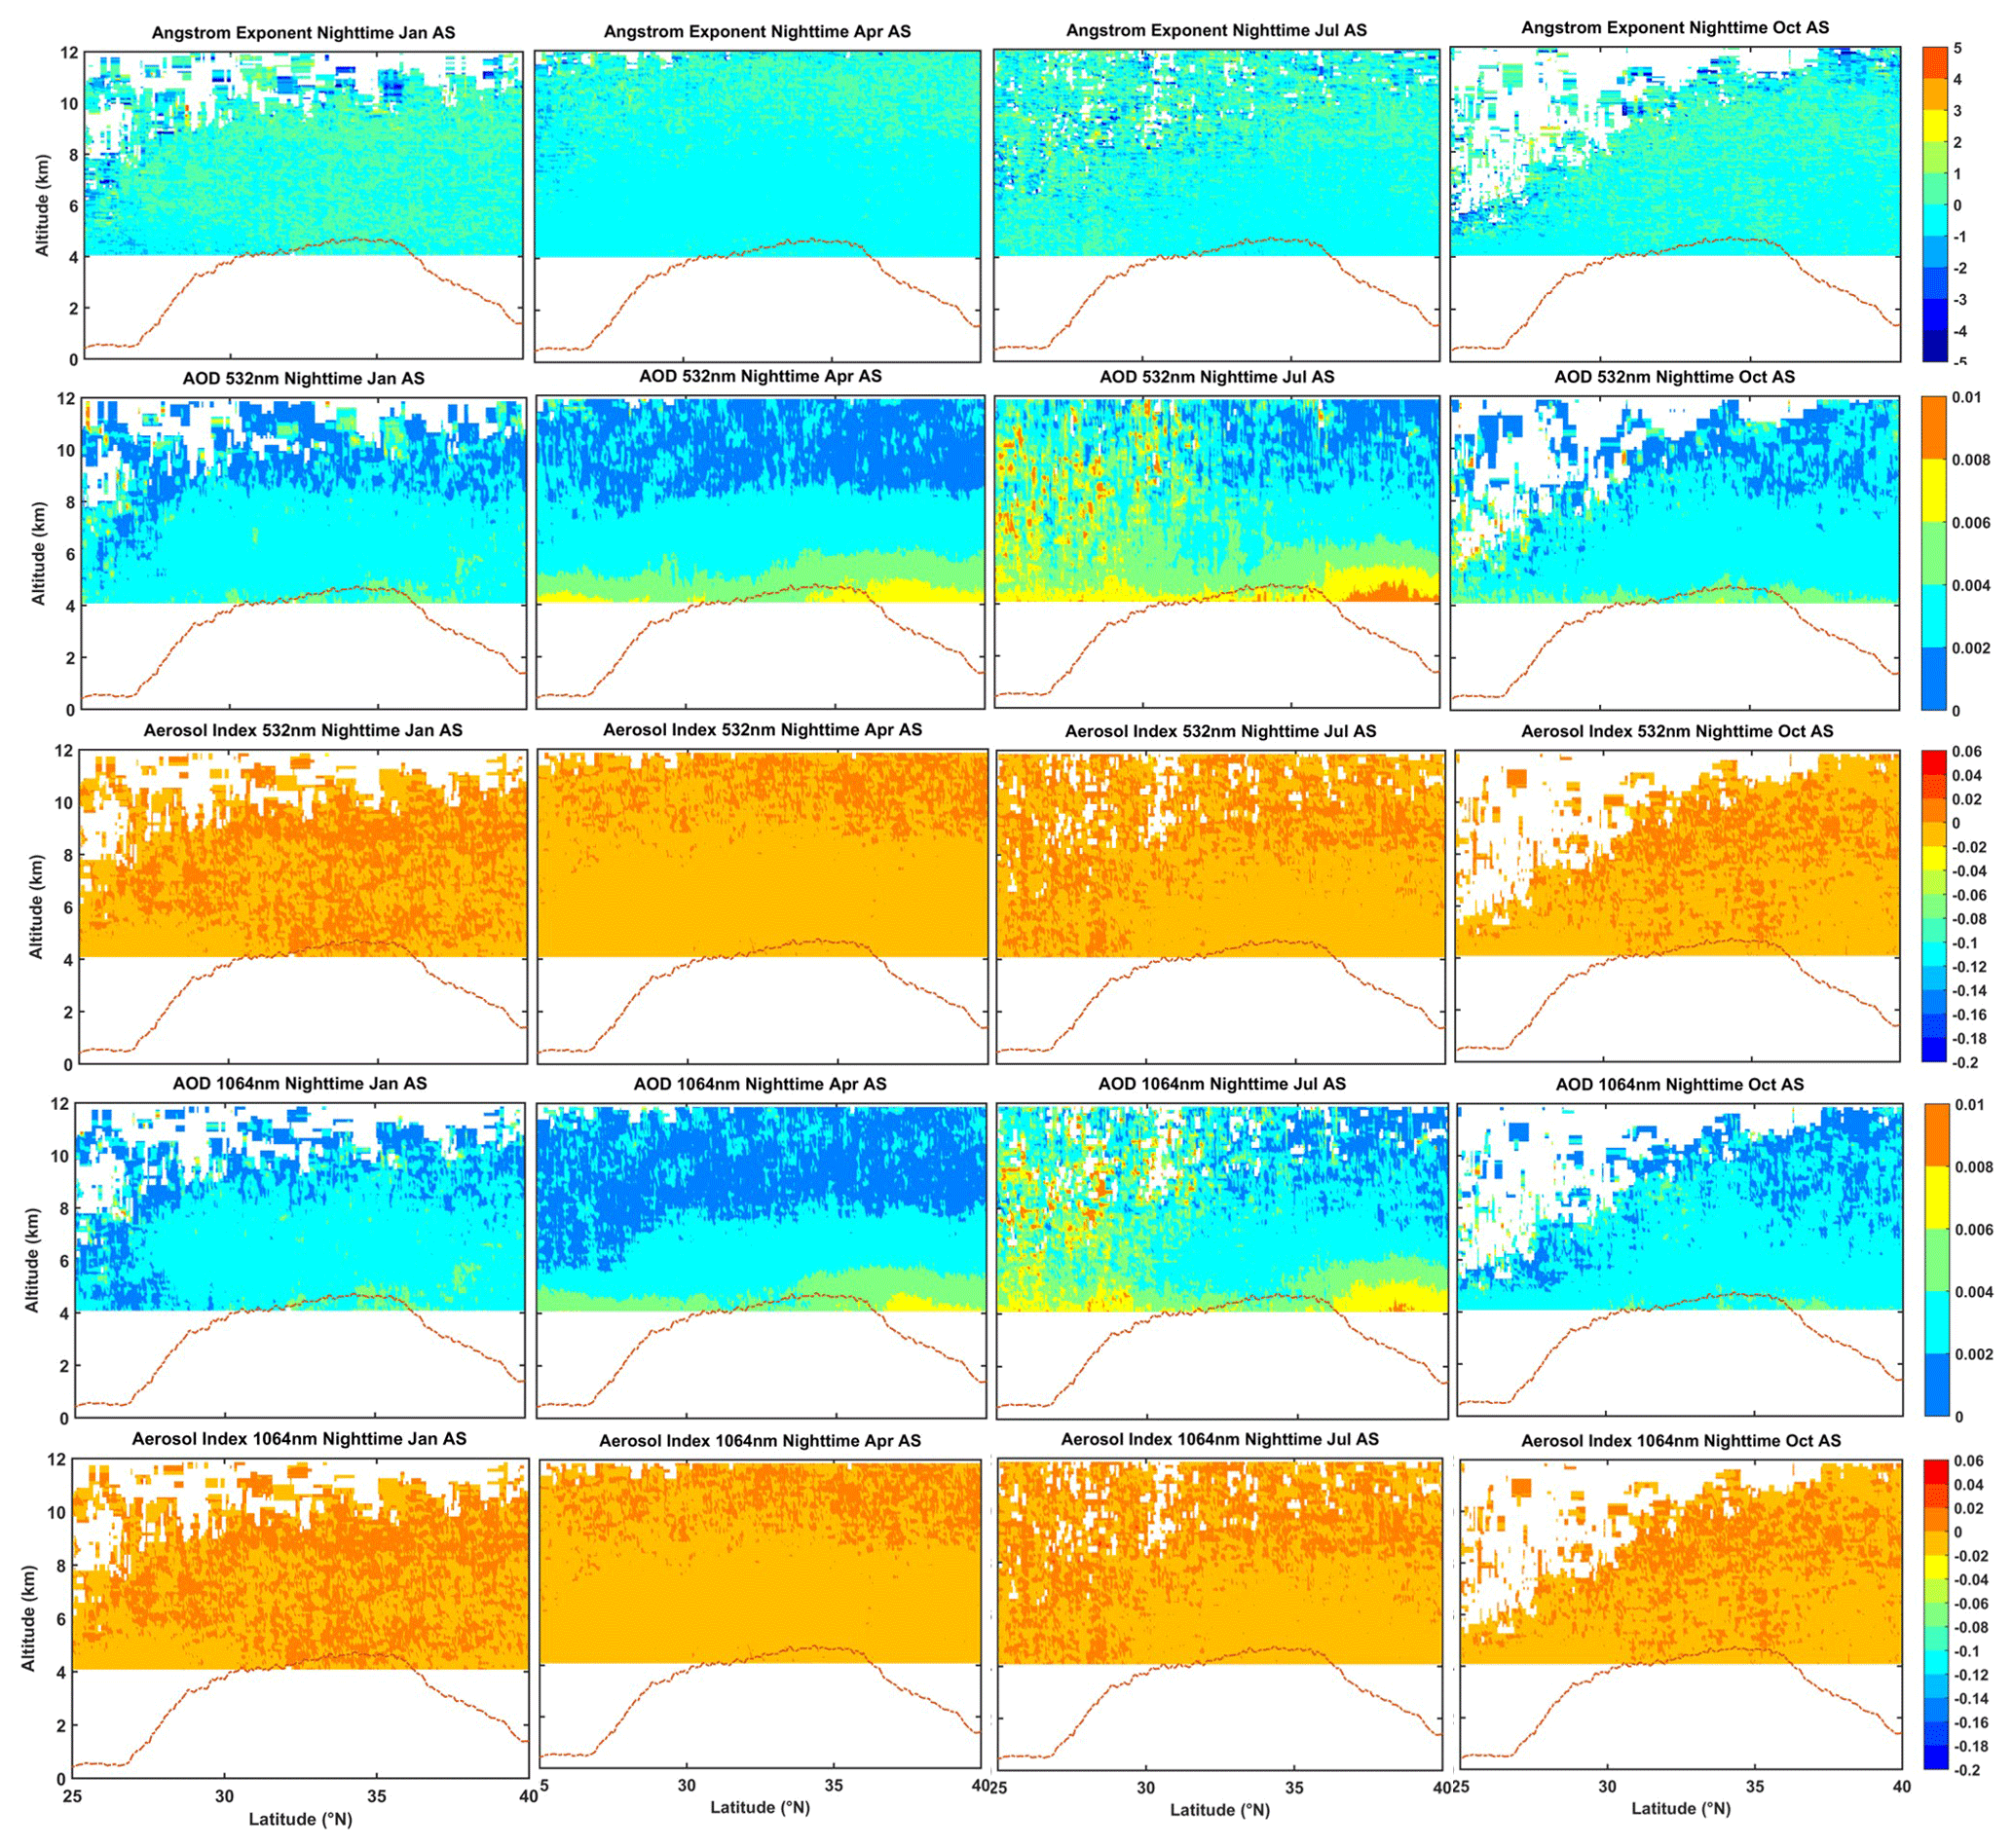
Similarly, Fig. 11 includes the nighttime difference plots of the aerosol EC at 532 nm between before-screened and after-screened for different months from 2007 to 2020. The difference before and after screening is immense, especially at a height of more than 5 km in the southern region of the TP in July and October. Extreme outliers are observed in the troposphere over the TP and have been recognized and eliminated. The EC detected at 1064 nm shows a similar distribution characteristic to that found at 532 nm and also includes the different attributes before and after the screening and elimination of the LRAT (see Fig. 12). In all the seasons, the AI is mainly distributed between −0.02 and 0.02. Still, the proportion between 0 and −0.02 is largest in April and July between 4 and 8 km. Meanwhile, the AI above 8 km is mainly concentrated at 0–0.02, indicating modal characteristics of the vertical structure distribution of the aerosol concentration and diversity of aerosol types. It is worth noting that there is a large amount of aerosol over the TP in January (winter) related to anthropogenic emissions of pollutants in winter and fossil fuel combustion (such as black carbon and smoke). It is found that the pattern of the AI is more or less consistent with objective facts and phenomena.
Interestingly, compared with the daytime, the aerosol detected by CALIOP at night can rise to a greater height and has a broader distribution range. It can be seen that the signal-to-noise ratio at night is higher than that in the daytime. CALIOP can detect smaller particles, which is also why the quality and effectiveness of CALIOP night detection data are better than those in the day. After a series of correction algorithms and calculating relevant parameters, we constructed the tropospheric AI climatology dataset over the TP for 2007–2020.
3.3 Validation of the AI dataset
3.3.1 Comparisons with satellite Aqua–MODIS AI products
The multiyear monthly average spatial distributions of the AE and AOD from MODIS are shown in Fig. 14, and the AI was also calculated (Fig. 14). The distribution of AE values over the TP in all seasons shows a decreasing trend from south-east to north-west, indicating that the particles in the upper air of the south-eastern region are dominated by small particles. In contrast, the particles in the upper air of the north-western region are dominated by large particles, especially in April of spring, which is related to the uplift and transmission of dust aerosol from the Taklimakan Desert to the northern part of the TP in spring. Also, we can see that the AE value of the Taklimakan Desert in the north of the TP in April and July in spring and summer is smaller (as the source of the sand area, mainly dust aerosol), which is smaller than in January and October in autumn and winter. AOD and AE showed opposite seasonal variation distribution patterns. According to the spatial distribution pattern of the AI calculated from MODIS detection results (AE and AOD), it can be seen that the AI value over the TP is mainly between 0 and 0.4.
Figure 14 also compares the normalized frequency distribution of the AI over the TP, exhibiting a significant difference in all the seasons from MODIS and CALIOP before and after screening. It is evident that, in general, compared with the data results without any processing, after the elimination of the low-reliability aerosol target, the average AI value of CALIOP is closer to the result of MODIS and the normalized frequency distribution pattern is closer to the same. Interestingly, the AI mean value and normalized frequency distribution pattern of CALIOP in April (spring) after removing the LRAT are more in agreement and matched with the results of MODIS. In addition, the mean AI and normalized frequency distribution pattern of CALIOP in July (summer) and October (autumn) are more consistent with the MODIS results, and both have apparent improvement. The difference between the mean AI from CALIOP in January (winter) and the result of MODIS is relatively more extensive, but the normalized frequency distribution pattern is more consistent. This may be related to the type and chemical composition of aerosol particles that rise over the TP in different seasons and the atmospheric climate conditions unique to the topography of the TP. In brief, the accuracy of the aerosol parameters' AI calculated after obtaining the aerosol EC with higher reliability has been dramatically improved (more or less), so even though not completely accurate, this strategy is expected to at least reduce the inaccuracy of the computed AI.
Meanwhile, we proved that using extreme outliers as a limit to get more reliable aerosol detection information is effective and reliable. It is important to note that the 550 nm wavelength range of MODIS belongs to the visible light range, and the data products provided at the satellite transit time are the daytime detection results. Therefore, here we compare and verify the daytime detection results of CALIOP (532 nm) with MODIS results, which are consistent in time, close in detection wavelength, comparable, and representative. In addition, the quality of CALIOP daytime detection data is inferior to that at night, and the reliability and accuracy of the optimized data are more effectively verified by comparison with the results of MODIS. Passive techniques (i.e. MODIS) have the advantage of providing a 2-D distribution of the AI over a wide swath during active strategies (i.e. CALIOP) with the vertical structure of the AI. They are complementary and have their advantages.
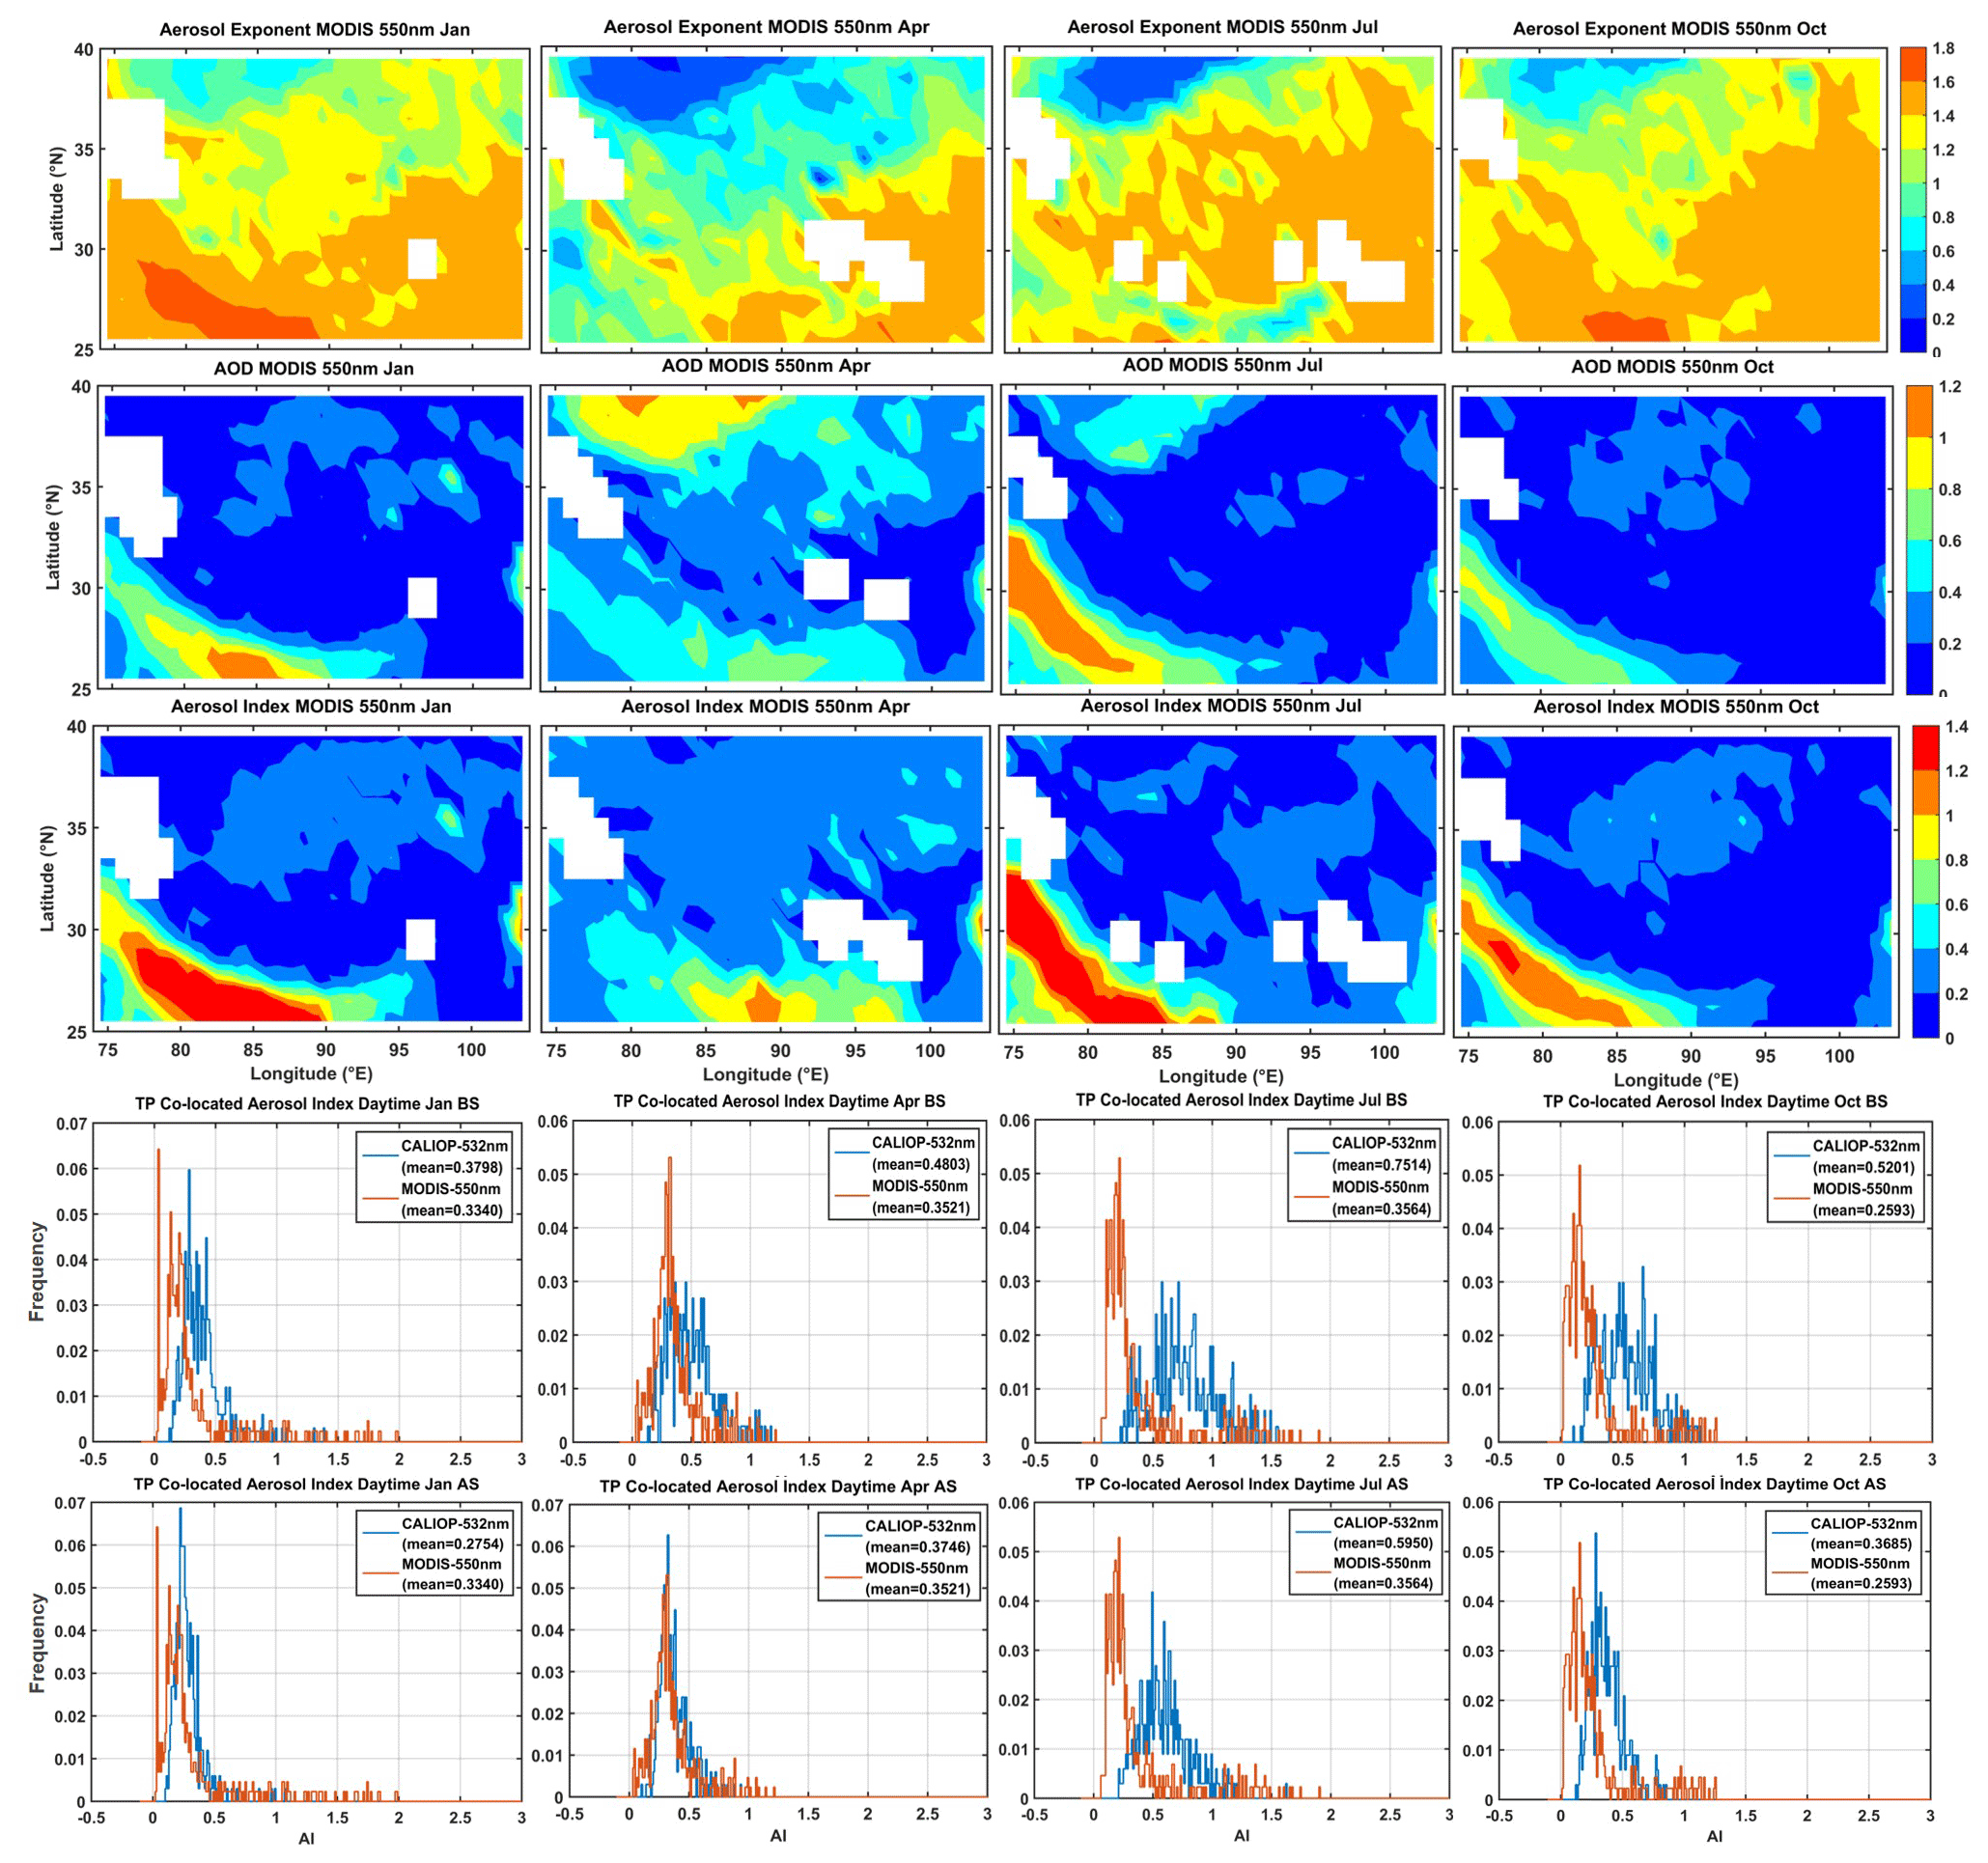
Figure 14Frequency test of the AI calculated by the MODIS-based aerosol AE and AOD over the Qinghai–Tibetan Plateau and the AI calculated by the CALIPSO-based aerosol AE and AOD with high reliability for daytime (before-screened, fourth line; after-screened, fifth line).
3.3.2 Performance evaluation based on in situ lidar observations
To further verify the performance of the AI product derived from CALIOP over the TP, we chose the ground-based lidar observation results in the centre of the Taklimakan Desert in the north of the TP to evaluate the effectiveness and accuracy of the AI vertical structure of CALIOP.
To match the transit time of ground-based lidar observation and satellite CALIOP observation, we extracted the EC (532 and 1064 nm) of ground-based lidar during the daytime and nighttime to match the CALIOP-adjacent observation period, as shown in Fig. 15 (observation case in the TD on 11 July 2021, daytime: 03:00–05:00, night: 14:00–16:00, China Beijing time, UTC + 8). Considering the daytime detection results of CALIOP for comparison and verification with MODIS above, to further strengthen the inspection of CALIOP optimization results, we still choose the daytime results of ground-based lidar detection for comparison and verification. From Fig. 15, it can also be seen that there are clouds or another LRAT at the daytime high altitude in the ground-based lidar detection signal. This will be more beneficial for us to check the validity and reliability of the results of the elimination of the LRAT and the calculated AI value.
Similarly, for ground-based lidar detection, we first reverse the EC and use the IQR method (see Sect. 2.2) to obtain extreme outliers and identify and eliminate the LRAT (Fig. 15). We can see that the LRATs (such as clouds and surface clutter) are effectively eliminated after the data optimization of 532 and 1064 nm detection-result ECs. It is once again proved that it is effective and reliable to use extreme outliers as a limit to obtain more reliable aerosol detection information.
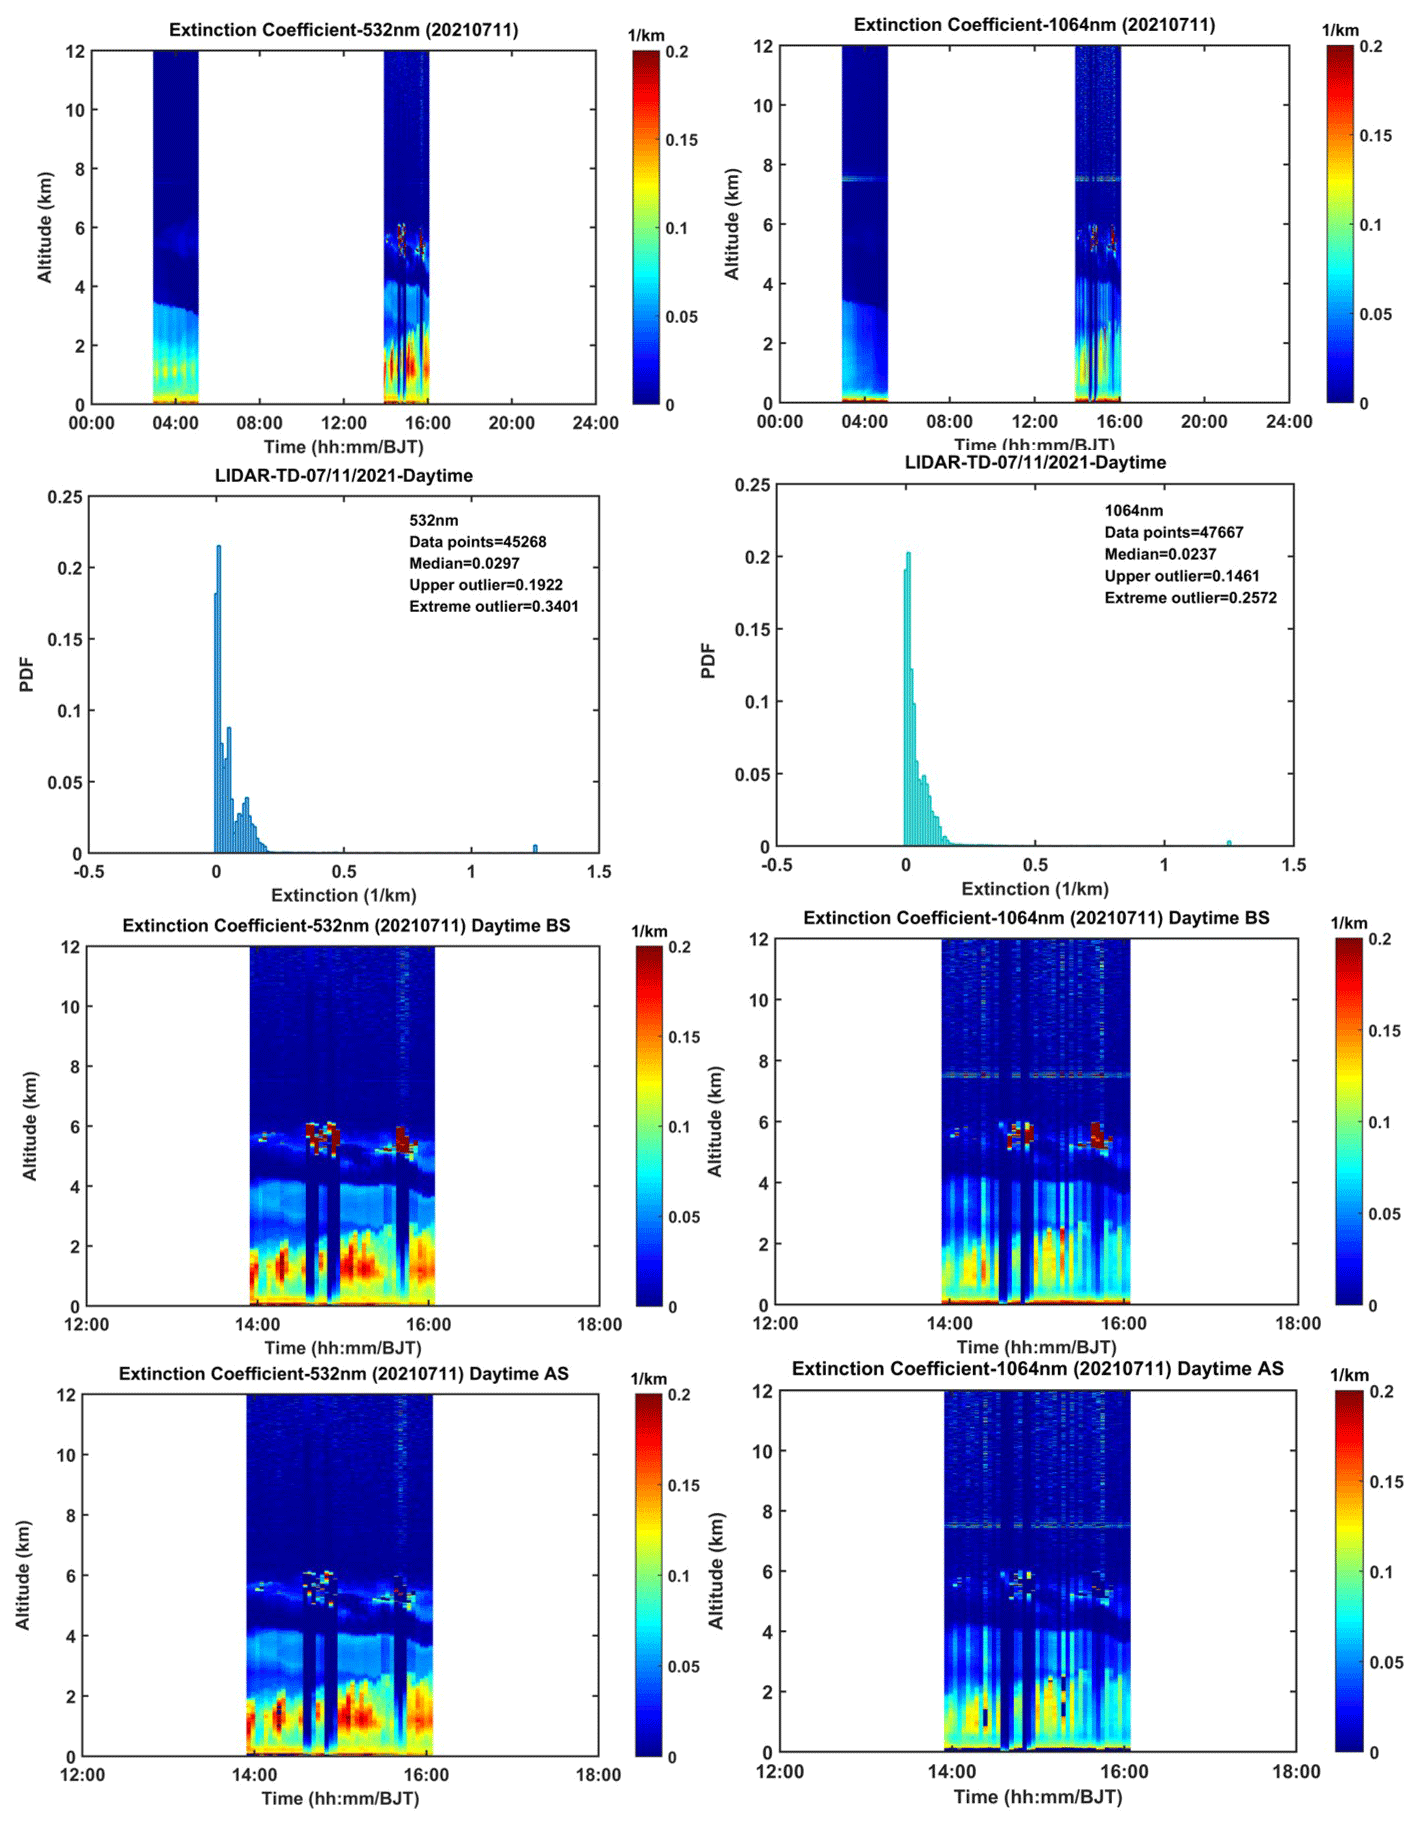
Figure 15Elimination of low-reliability aerosol target signals detected by ground-based lidar in the hinterland of the Taklimakan Desert.
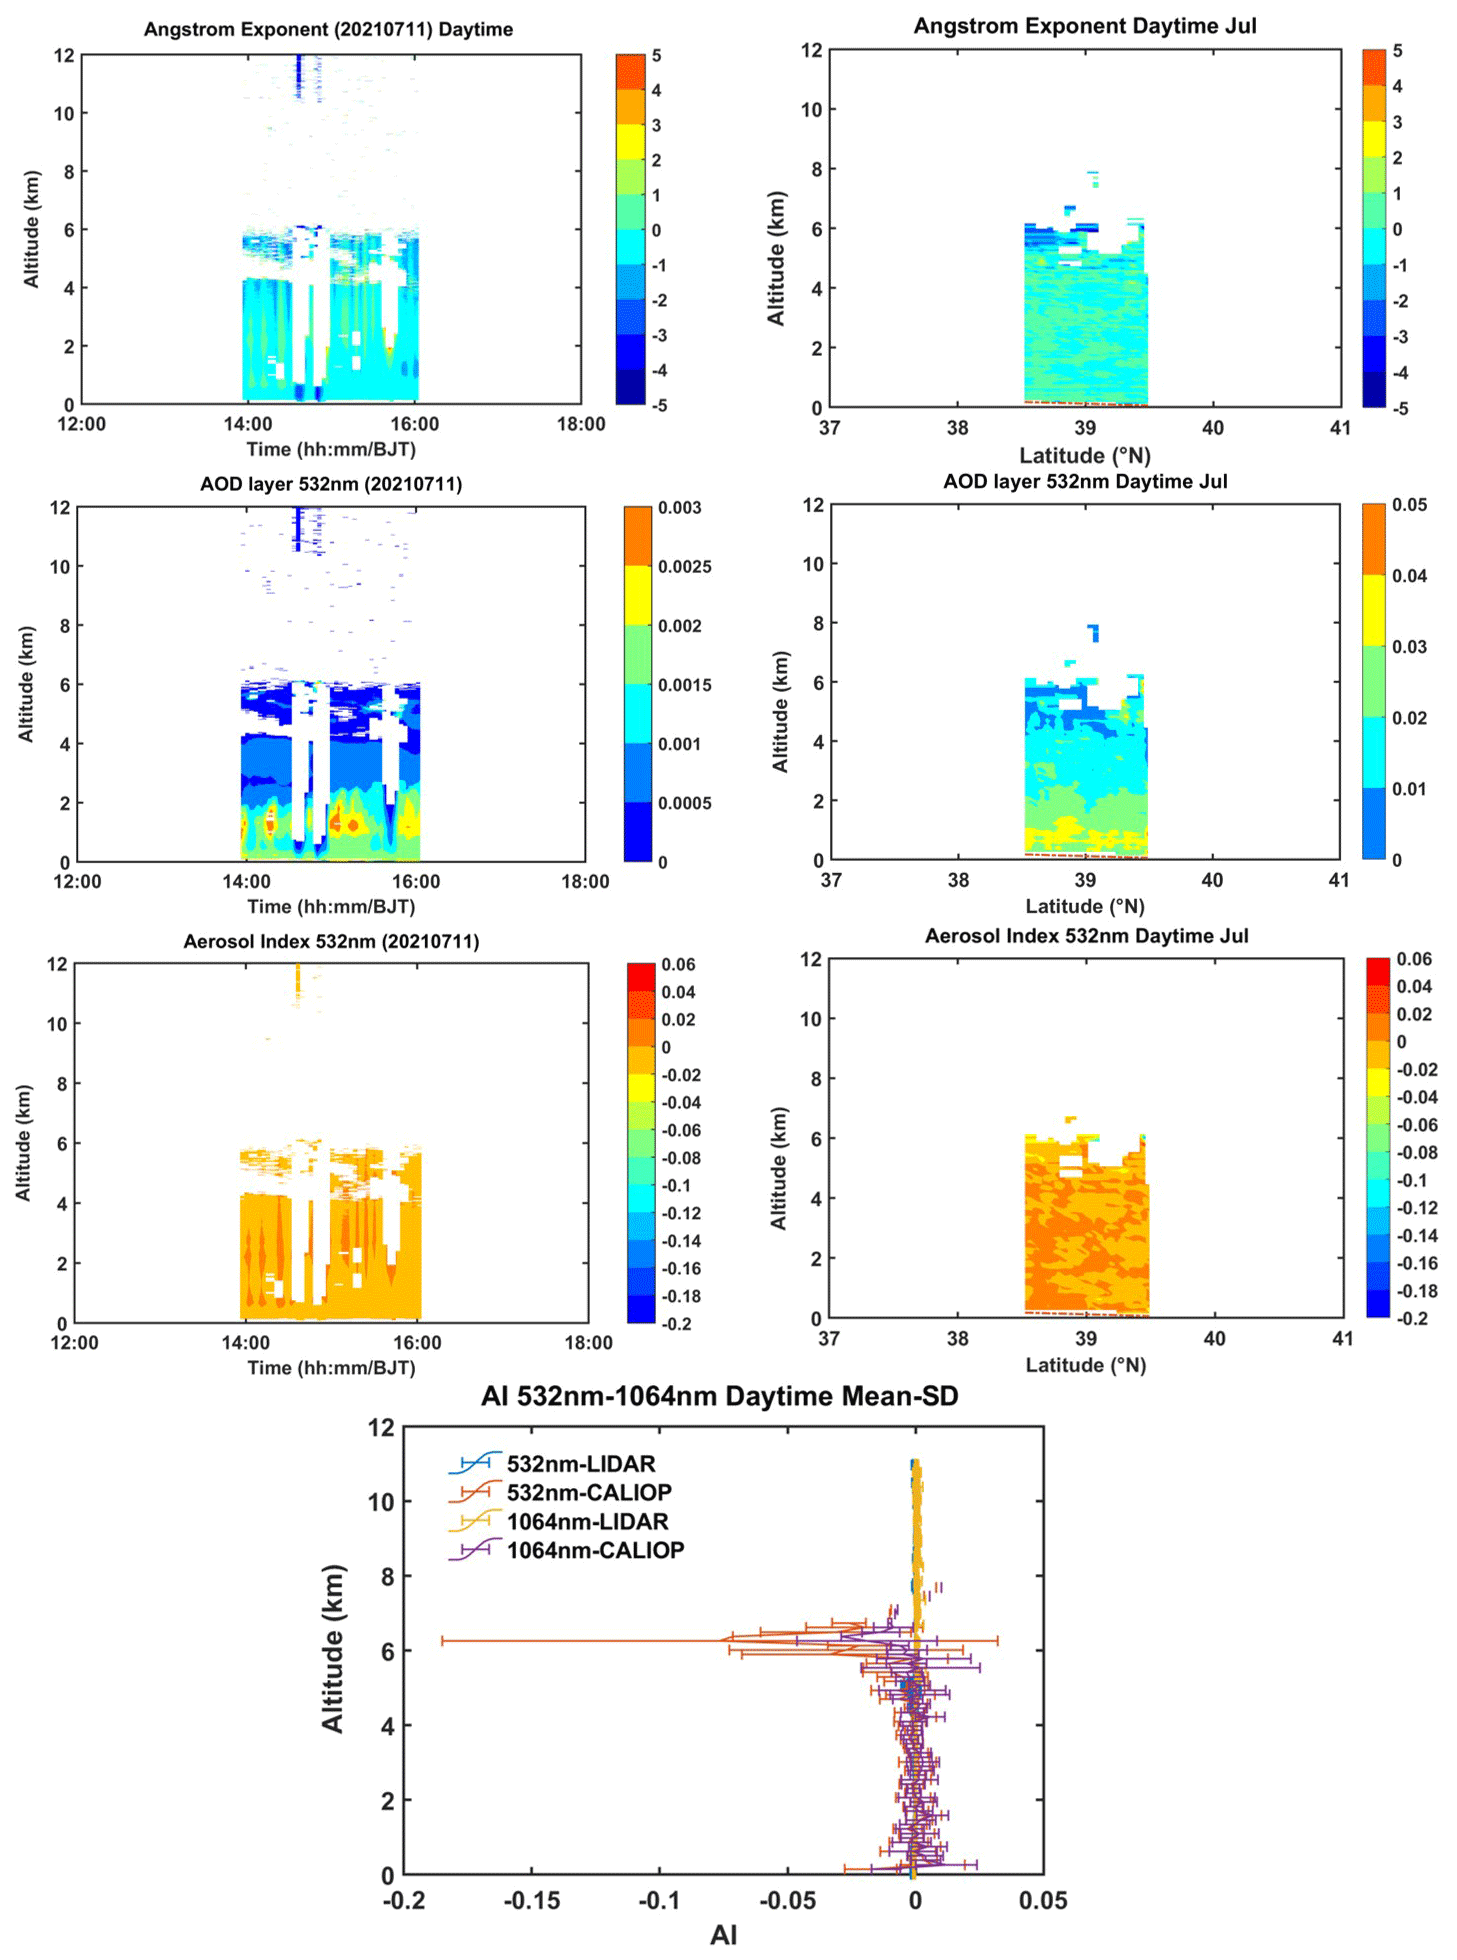
Figure 16Comparative verification of the AI of CALIPSO and ground-based lidar remote sensing over the Taklimakan Desert region.
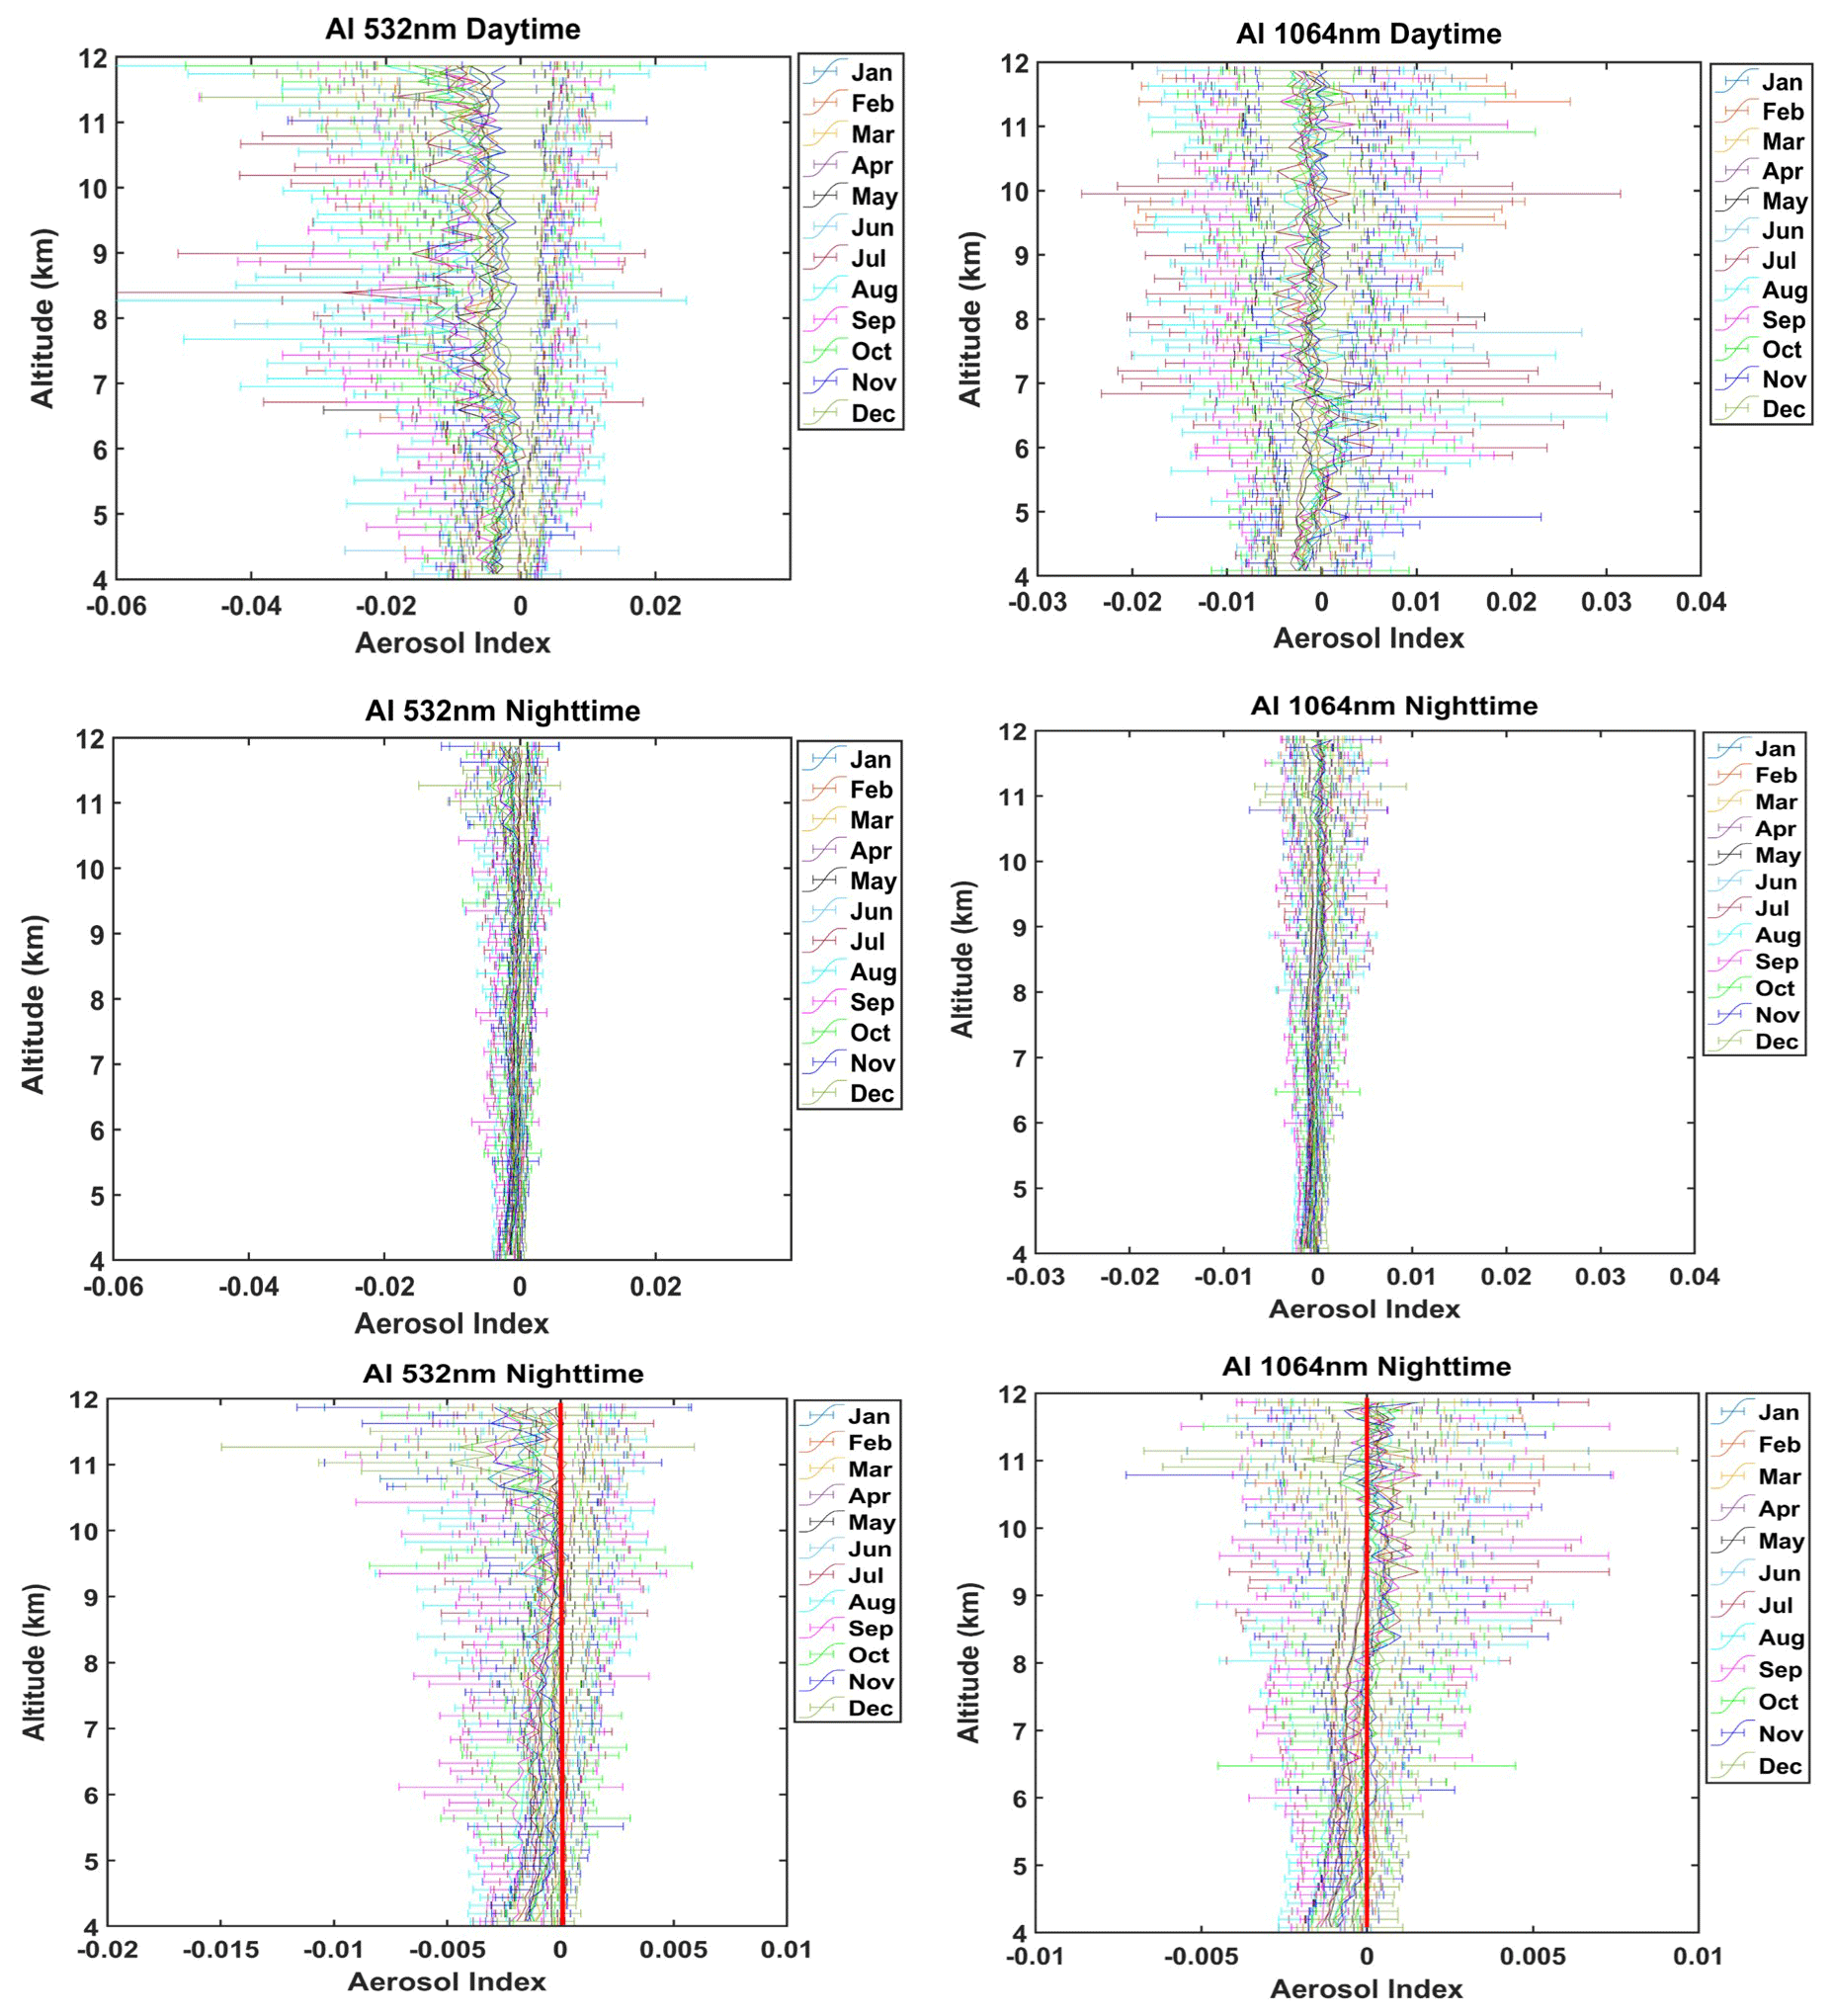
Figure 17Monthly mean changes of vertical structure characteristics of the AI (mean and standard deviation) over the TP during 2007–2020.
It needs to be pointed out that the case of ground-based lidar detection on 11 July 2021 is quite typical, but there is a significant deviation in satellite transit, and this process cannot be captured well. To maximize and better match this process, we take the ground-based lidar observation in the hinterland of the Taklimakan Desert as the centre (38.967° N, 83.65° E; 1099.3 m), select the 38.5–39.5° N and 83–84° E ranges, extract the ECs observed by CALIOP transit in this range during the daytime from 2007 to July 2020, and eliminate the LRAT. After averaging the optimized data, we further calculate the AE value (as shown in Fig. 16). Figure 16 depicts the detection results of ground-based lidar and CALIOP optimal crossing points and the comparison of calculated AI values. The AE values detected by ground-based lidar and CALIOP are mainly distributed between −1 and 1, and the proportion between −1 and 0 is the largest. The aerosol can be raised to a height of 6 km, and the higher concentration of aerosol is mainly concentrated below 2 km from the AOD vertical layer, showing a decreasing trend with the increase in height. AI values are primarily distributed between −0.02 and 0.02, and the average value and standard deviation trend of the AI change with height are also basically consistent. Generally, all those facts demonstrate the agreement of the AI dataset with the CALIOP and ground-based lidar. In addition, all the evidence shows that, after removing the LRAT, the optimized data can obtain aerosol characteristics with higher reliability.
Based on the monthly climatology AI product, we explored the average vertical structure characteristics of the AI over the TP during 2007–2020 (as shown in Fig. 17). AI values in the daytime and at night over the TP mainly fluctuate around 0, and the standard deviation increases with the increase in altitude. The trend of the AI changes with altitude is relatively consistent, and the standard deviation below 6 km is slight, indicating that the dispersion of aerosol particles is small. However, the fluctuation in the daytime is greater than that at night (the data quality at night is better than that in the daytime). In general, the detection results of 532 and 1064 nm can achieve complementary observation.
In general, the quality and robustness of the aerosol parameter product have improved for the EC and AI, with some issues that persist in the dataset, which we mention below.
As we do not have ground-based lidar detection data on the TP, we have selected ground-based lidar data from the centre of the Taklamakan Desert for verification and evaluation. The objectives of the verification and evaluation include the removal of low-reliability aerosol targets and the validation of the effectiveness and rationality of the constructed AI parameter results. Due to the limited detection data of ground-based lidar, we chose a typical aerosol process detected by ground-based lidar (11 July 2021), but it did not match well with the transit time and scanning area of the CALIPSO satellite, resulting in significant errors. Therefore, we choose to compare and verify the results of the average values of July in all years within the central area of the transit Taklamakan Desert detected by CALIPSO (see the green box on the left in Fig. 2). Minimize spatial errors caused by significant differences in spatial positions. This kind of error is inevitable in our data processing process and will affect the consistency of detection results to some extent.
In addition, although the monthly AI correction significantly improves the comparison between CALIPSO and MODIS, we note that a somewhat larger deviation may occur in winter, and the effect after correction in summer is the best and significant one, which may be related to the increased probability of mistaking clouds as aerosol particles due to more convective activities in summer. This helps us to refine our research on summer aerosols over the TP.
Data described in this work are available at https://doi.org/10.11888/Atmos.tpdc.300614 (Huang, 2023).
This present study is the first to report a long-term, advanced-performance, high-resolution, continuous, high-quality, and monthly climatology AI vertical structure from the CALIOP observation over the TP used to better understand aerosol radiation forcing against the background of accelerated climate change. Using the relationship developed when EC measurements are available, we screened the entire EC record. We assembled a climatology of high-altitude aerosol characteristics for daytime and nighttime from 2007 to 2020. In addition to providing a monthly climatology AI dataset for MODIS and ground-based lidar validation, our dataset also reveals the patterns and numbers of high-altitude vertical structure characteristics of the aerosol troposphere over the TP.
To produce accurate and higher reliability of AI values, we applied several correction procedures and rigorously checked them for data quality constraints during the long observation period spanning almost 14 years (2007–2020). Nevertheless, some uncertainties remain, mainly due to technical constraints as well as limited documentation of the measurements. Even though not completely accurate, this strategy is expected to at least reduce the inaccuracy of the computed characteristic value of aerosol optical parameters. Following this initial work, we obtained a vertical AI value with higher reliability. This provides information about the vertical structures of aerosol that could be used in climate models. The collection of more reliable and robust research datasets of aerosol characteristics in these extreme environments is the key basis for promoting comprehensive research on the energy balance of ground–atmosphere radiation over the Tibetan Plateau and even the global region. We expect that this dataset will help some current and future research to simulate the climate change of the monthly climatology. It will also help to update future datasets and study the interaction of aerosol, cloud, and precipitation, thus providing sufficient observation facts and bases.
Finally, it should be pointed out that the AI obtained in the ultraviolet channel can currently characterize both absorption and non-absorption aerosols. The AI obtained from our research work cannot effectively characterize the absorption and non-absorption of its aerosols, as the results we obtained are in the non-ultraviolet band range, which is also an area that we need to further explore in the future. However, the aerosol concentration represented by the vertical structure AI we obtained is not possessed by the column AOD. The significance of our work is that the AI with higher reliability obtained here can more effectively obtain aerosol concentration information and also presents a diversity of aerosol types at the vertical height over the TP. This is the main highlight of our research work. The reason why we use the AI to test the results of MODIS and ground lidar is to verify the effectiveness and reliability of the AI. Fortunately, the test results are very consistent and reasonable. Therefore, the AI of the physical meaning here can effectively characterize aerosol concentration information at vertical heights.
HP led the re-processing of the CALIOP, lidar, and MODIS measurements, data analysis, and preparation of the figures, with JH and JL both contributing to the design of the paper and progression of the figures and text of the article. ZH, MW, and TZ made the original lidar measurements. ZH, AM, and WH provided the dataset and advice on the re-processing of the lidar and CALIOP. KRK and FY contributed to either advising or coordinating the data recovery. All the co-authors wrote sections of the paper and/or reviewed drafts of the paper.
The contact author has declared that none of the authors has any competing interests.
Publisher's note: Copernicus Publications remains neutral with regard to jurisdictional claims made in the text, published maps, institutional affiliations, or any other geographical representation in this paper. While Copernicus Publications makes every effort to include appropriate place names, the final responsibility lies with the authors.
We are grateful to the CALIPSO (https://eosweb.larc.nasa.gov/, last access: 18 June 2022) and MODIS (https://ladsweb.modaps.eosdis.nasa.gov/, last access: 26 August 2022) instrument scientific teams at NASA for the provision of satellite data and the Belt and Road Lidar Network from Lanzhou University, China (http://ciwes.lzu.edu.cn/, last access: 20 December 2022), which are available online and formed the central database in the present work.
This work was financially sponsored by the Scientific and Technological Innovation Team (Tianshan Innovation Team) project of Xinjiang (grant no. 2022TSYCTD0007), the Second Tibetan Plateau Scientific Expedition and Research Program (STEP) (grant no. 2019QZKK0602), the Xinjiang Science Fund for Distinguished Young Scholars (grant no. 2022D01E07), the Xinjiang Uygur Autonomous Region Tianshan Talent Training Program Project (grant no. 2023TSYCQNTJ0007), the Natural Science Foundation of the Xinjiang Uygur Autonomous Region (grant no. 2022D01B74), the National Natural Science Foundation of China (grant no. 42005074), and the Scientific Research and Operation Cost Project of the Urumqi Institute of Desert Meteorology, China Meteorological Administration (grant no. IDM2020003).
This paper was edited by Jing Wei and reviewed by Tianning Su and two anonymous referees.
Boos, W. and Kuang, Z.: Dominant control of the South Asian monsoon by orographic insulation versus plateau heating, Nature, 436, 218–222, 2010.
Bucci, S., Cagnazzo, C., Cairo, F., Di Liberto, L., and Fierli, F.: Aerosol variability and atmospheric transport in the Himalayan region from CALIOP 2007–2010 observations, Atmos. Chem. Phys., 14, 4369–4381, https://doi.org/10.5194/acp-14-4369-2014, 2014.
Buchard, V., da Silva, A. M., Colarco, P. R., Darmenov, A., Randles, C. A., Govindaraju, R., Torres, O., Campbell, J., and Spurr, R.: Using the OMI aerosol index and absorption aerosol optical depth to evaluate the NASA MERRA Aerosol Reanalysis, Atmos. Chem. Phys., 15, 5743–5760, https://doi.org/10.5194/acp-15-5743-2015, 2015.
Carrió, G. G., van Den Heever, S. C., and Cotton, W. R.: Impacts of nucleating aerosol on anvil-cirrus clouds: A modeling study, Atmos. Res., 84, 111–131, 2007.
Chen, S., Huang, J., Zhao, C., Qian, Y., Leung, L. R., and Yang, B.: Modeling the transport and radiative forcing of Taklimakan dust over the Tibetan Plateau: A case study in the summer of 2006, J. Geophys. Res.-Atmos., 118, 797–812, 2013.
Chen, S., Zhang, R., Mao, R., Zhang, Y., Chen, Y., Ji, Z., Gong, Y., and Guan, Y.: Sources, characteristics and climate impact of light-absorbing aerosols over the Tibetan Plateau, Earth-Sci. Rev., 232, 104111, https://doi.org/10.1016/j.earscirev.2022.104111, 2022.
Chen, X., Zuo, H., Zhang, Z., Cao, X., Duan, J., Zhu, C., Zhang, Z., and Wang, J.: Full-coverage 250 m monthly aerosol optical depth dataset (2000–2019) amended with environmental covariates by an ensemble machine learning model over arid and semi-arid areas, NW China, Earth Syst. Sci. Data, 14, 5233–5252, https://doi.org/10.5194/essd-14-5233-2022, 2022.
Giles, D. M., Sinyuk, A., Sorokin, M. G., Schafer, J. S., Smirnov, A., Slutsker, I., Eck, T. F., Holben, B. N., Lewis, J. R., Campbell, J. R., Welton, E. J., Korkin, S. V., and Lyapustin, A. I.: Advancements in the Aerosol Robotic Network (AERONET) Version 3 database – automated near-real-time quality control algorithm with improved cloud screening for Sun photometer aerosol optical depth (AOD) measurements, Atmos. Meas. Tech., 12, 169–209, https://doi.org/10.5194/amt-12-169-2019, 2019.
Goldberg, D. L., Gupta, P., Wang, K., Jena, C., Zhang, Y., Lu, Z., and Streets, D. G.: Using gap-filled MAIAC AOD and WRF-Chem to estimate daily PM2.5 concentrations at 1 km resolution in the Eastern United States, Atmos. Environ., 199, 443–452, https://doi.org/10.1016/j.atmosenv.2018.11.049, 2019.
Guan, H., Chatfield, R. B., Freitas, S. R., Bergstrom, R. W., and Longo, K. M.: Modeling the effect of plume-rise on the transport of carbon monoxide over Africa with NCAR CAM, Atmos. Chem. Phys., 8, 6801–6812, https://doi.org/10.5194/acp-8-6801-2008, 2008.
Guan, H., Esswein, R., Lopez, J., Bergstrom, R., Warnock, A., Follette-Cook, M., Fromm, M., and Iraci, L. T.: A multi-decadal history of biomass burning plume heights identified using aerosol index measurements, Atmos. Chem. Phys., 10, 6461–6469, https://doi.org/10.5194/acp-10-6461-2010, 2010.
Hammer, M. S., Martin, R. V., Li, C., Torres, O., Manning, M., and Boys, B. L.: Insight into global trends in aerosol composition from 2005 to 2015 inferred from the OMI Ultraviolet Aerosol Index, Atmos. Chem. Phys., 18, 8097–8112, https://doi.org/10.5194/acp-18-8097-2018, 2018.
Hsu, N. C., Si-Chee, T., King, M. D., and Herman, J. R.: Aerosol properties over bright-reflecting source regions, IEEE T. Geosci. Remote, 42, 557–569, 2004.
Hu, Q., Wang, H., Goloub, P., Li, Z., Veselovskii, I., Podvin, T., Li, K., and Korenskiy, M.: The characterization of Taklamakan dust properties using a multiwavelength Raman polarization lidar in Kashi, China, Atmos. Chem. Phys., 20, 13817–13834, https://doi.org/10.5194/acp-20-13817-2020, 2020.
Hu, Y., Rodier, S., Xu, K., Sun, W., Huang, J., Lin, B., Zhai, P., and Josset, D.: Occurrence,liquid water content, and fraction of supercooled water clouds from combined CALIOP/IIR/MODIS measurements, J. Geophys. Res., 115, D00H34, https://doi.org/10.1029/2009JD012384, 2010.
Huang, J.: Dataset of characteristic parameters of tropospheric aerosols over the Qinghai Tibet Plateau (2007–2020), National Tibetan Plateau / Third Pole Environment Data Center [data set], https://doi.org/10.11888/Atmos.tpdc.300614, 2023.
Huang, J., Minnis, P., Chen, B., Huang, Z., Liu, Z., Zhao, Q., Yi, Y., and Ayers, J. K.: Long-range transport and vertical structure of Asian dust from CALIPSO and surface measurements during PACDEX, J. Geophys. Res.-Atmos., 113, https://doi.org/10.1029/2008JD010620, 2008.
Huang, L., Jiang, J. H., Tackett, J. L., Su, H., and Fu, R.: Seasonal and diurnal variations of aerosol extinction profile and type distribution from CALIPSO 5-year observations, J. Geophys. Res.-Atmos., 118, 4572–4596, 2013.
Immerzeel, W., Van Beek, L., and Bierkens, M.: Climate change will affect the Asian water towers, Science, 328, 1382–1385, 2010.
Iglewicz, B. and Hoaglin, D.: How to Detect and Handle Outliers, ASQC basic references in quality control, ASQC Quality Press, Milwaukee, 1993.
IPCC: Climate Change 2013: The Physical Science Basis, Contribution of Working Group I to the Fifth Assessment Report of the Intergovernmental Panel on Climate Change, edited by: Stocker, T. F., Qin, D., Plattner, G.-K., Tignor, M., Allen, S. K., Boschung, J., Nauels, A., Xia, Y., Bex, V., and Midgley, P. M., Cambridge University Press, Cambridge, United Kingdom and New York, NY, USA, 1535 pp., 2013.
IPCC: Climate Change 2021: The Physical Science Basis, Contribution of Working Group I to the Sixth Assessment Report of the Intergovernmental Panel on Climate Change, edited by: Masson-Delmotte, V., Zhai, P., Pirani, A., Connors, S. L., Péan, C., Berger, S., Caud, N., Chen, Y., Goldfarb, L., Gomis, M. I., Huang, M., Leitzell, K., Lonnoy, E., Matthews, J. B. R., Maycock, T. K., Waterfield, T., Yelekçi, O., Yu, R., and Zhou, B., Cambridge University Press, Cambridge, United Kingdom and New York, NY, USA, in press, https://doi.org/10.1017/9781009157896, 2021.
Jeong, M.-J. and Hsu, N. C.: Retrievals of aerosol single-scattering albedo and effective aerosol layer height for biomass-burning smoke: Synergy derived from “A-Train” sensors, Geophys. Res. Lett., 35, L24801, https://doi.org/10.1029/2008GL036279, 2008.
Kahn, R. A., Gaitley, B. J., Garay, M. J., Diner, D. J., Eck, T. F., Smirnov, A., and Holben, B. N.: Multiangle Imaging SpectroRadiometer global aerosol product assessment by comparison with the Aerosol Robotic Network, J. Geophys. Res.-Atmos., 115, D23209, https://doi.org/10.1029/2010jd014601, 2010.
Kim, M.-H., Omar, A. H., Tackett, J. L., Vaughan, M. A., Winker, D. M., Trepte, C. R., Hu, Y., Liu, Z., Poole, L. R., Pitts, M. C., Kar, J., and Magill, B. E.: The CALIPSO version 4 automated aerosol classification and lidar ratio selection algorithm, Atmos. Meas. Tech., 11, 6107–6135, https://doi.org/10.5194/amt-11-6107-2018, 2018.
Kojima, T., Buseck, P. R., Wilson, J. C., Reeves, J. M., and Mahoney, M. J.: Aerosol particles from tropical convective systems: Cloud tops and cirrus anvils, J. Geophys. Res.-Atmos., 109, https://doi.org/10.1029/2003JD004504, 2004.
Kovilakam, M., Thomason, L. W., Ernest, N., Rieger, L., Bourassa, A., and Millán, L.: The Global Space-based Stratospheric Aerosol Climatology (version 2.0): 1979–2018, Earth Syst. Sci. Data, 12, 2607–2634, https://doi.org/10.5194/essd-12-2607-2020, 2020.
Liou, K.: Influence of cirrus clouds on weather and climate processes: a global perspective, Mon. Weather Rev., 114, 1167–1199, 1986.
Liu, D., Wang, Z., Liu, Z., Winker, D., and Trepte, C.: A height resolved global view of dust aerosols from the first year CALIPSO lidar measurements, J. Geophys. Res., 113, D16214, https://doi.org/10.1029/2007JD009776, 2008.
Liu, P., Zhao, C., Liu, P., Deng, Z., Huang, M., Ma, X., and Tie, X.: Aircraft study of aerosol vertical distributions over Beijing and their optical properties, Tellus B, 61, 756–767, https://doi.org/10.1111/j.1600-0889.2009.00440.x, 2009.
Liu, Y., Hua, S., Jia, R., and Huang, J.: Effect of aerosols on the ice cloud properties over the Tibetan Plateau, J. Geophys. Res.-Atmos., 124, 9594–9608, 2019.
Liu, Y., Li, Y., Huang, J., Zhu, Q., and Wang, S.: Attribution of the Tibetan Plateau to northern drought, Nat. Sci. Rev., 7, 489–492, 2020.
Liu, Y., Huang, J., Wang, T., Li, J., Yan, H., and He, Y.: Aerosol-cloud interactions over the Tibetan Plateau: An overview, Earth-Sci. Rev., 234, 104216, https://doi.org/10.1016/j.earscirev.2022.104216, 2022.
Liu, Z., Liu, D., Huang, J., Vaughan, M., Uno, I., Sugimoto, N., Kittaka, C., Trepte, C., Wang, Z., Hostetler, C., and Winker, D.: Airborne dust distributions over the Tibetan Plateau and surrounding areas derived from the first year of CALIPSO lidar observations, Atmos. Chem. Phys., 8, 5045–5060, https://doi.org/10.5194/acp-8-5045-2008, 2008.
Liu, Z., Kar, J., Zeng, S., Tackett, J., Vaughan, M., Avery, M., Pelon, J., Getzewich, B., Lee, K.-P., Magill, B., Omar, A., Lucker, P., Trepte, C., and Winker, D.: Discriminating between clouds and aerosols in the CALIOP version 4.1 data products, Atmos. Meas. Tech., 12, 703–734, https://doi.org/10.5194/amt-12-703-2019, 2019.
Luo, H. and Yanai, M.: The large-scale circulation and heat sources over the Tibetan Plateau and surrounding areas during the early summer of 1979, Part II: Heat and moisture budgets, Mon. Weather Rev., 112, 966–989, 1984.
Matsuki, A., Iwasaka, Y., Osada, K., Matsunaga, K., Kido, M., Inomata, Y., Trochkine, D., Nishita, C., Nezuka, T., Sakai,T., Zhang,D., and Kwon, S. A.: Seasonal dependence of the long-range transport and vertical distribution of free tropospheric aerosols over east Asia: On the basis of aircraft and lidar measurements and isentropic trajectory analysis, J. Geophys. Res.-Atmos., 108, https://doi.org/10.1029/2002JD003266, 2003.
Molnar, P., Boos, W., and Battisti, D.: Orographic controls on climate and paleoclimate of Asia: thermal and mechanical roles for the Tibetan Plateau, Annu. Rev. Earth Planet. Sc., 38, 77–102, 2010.
Nakajima, T., Higurashi, A., Kawamoto, K., and Penner, J. E.: A possible correlation between satellite-derived cloud and aerosol microphysical parameters, Geophys. Res. Lett., 28, 1171–1174, https://doi.org/10.1029/2000GL012186, 2001.
Nieberding, F., Wille, C., Fratini, G., Asmussen, M. O., Wang, Y., Ma, Y., and Sachs, T.: A long-term (2005–2019) eddy covariance data set of CO2 and H2O fluxes from the Tibetan alpine steppe, Earth Syst. Sci. Data, 12, 2705–2724, https://doi.org/10.5194/essd-12-2705-2020, 2020.
Pan, H., Huo, W., Wang, M., Zhang, J., Meng, L., Kumar, K. R., and Devi, N. L.: Insight into the climatology of different sand-dust aerosol types over the Taklimakan Desert based on the observations from radiosonde and A-train satellites, Atmos. Environ., 238, 117705, https://doi.org/10.1016/j.atmosenv.2020.117705, 2020.
Qiu, J.: China: The third pole, Nature, 454, 393–396, https://doi.org/10.1038/454393a, 2008.
Rieger, L. A., Bourassa, A. E., and Degenstein, D. A.: Merging the OSIRIS and SAGE II stratospheric aerosol records, J. Geophys. Res.-Atmos., 120, 8890–8904, https://doi.org/10.1002/2015JD023133, 2015.
Rieger, L. A., Zawada, D. J., Bourassa, A. E., and Degenstein, D. A.: A Multiwavelength Retrieval Approach for Improved OSIRIS Aerosol Extinction Retrievals, J. Geophys. Res.-Atmos., 124, 7286–7307, https://doi.org/10.1029/2018JD029897, 2019.
Rossow, W. and Schiffer, R.: Advances in understanding clouds from ISCCP, B. Am. Meteorol. Soc., 80, 2261–2287, 1999.
Sasano, Y.: Tropospheric aerosol extinction coefficient profiles derived from scanning lidar measurements over Tsukuba, Japan from 1990 to 1993, Appl. Optics, 35, 4941–4952, 1996.
Seifert, P., Ansmann, A., Müller, D., Wandinger, U., Althausen, D., Heymsfield, A. J., Massie, S. T., and Schmitt, C.: Cirrus optical properties observed with lidar, radiosonde, and satellite over the tropical Indian Ocean during the aerosol-polluted northeast and clean maritime southwest monsoon, J. Geophys. Res.-Atmos., 112, https://doi.org/10.1029/2006JD008352, 2007.
Thomason, L. W. and Vernier, J.-P.: Improved SAGE II cloud/aerosol categorization and observations of the Asian tropopause aerosol layer: 1989–2005, Atmos. Chem. Phys., 13, 4605–4616, https://doi.org/10.5194/acp-13-4605-2013, 2013.
Torres, O., Bhartia, P. K., Herman, J. R., Ahmad, Z., and Gleason, J.: Derivation of aerosol properties from satellite measurements of backscattered ultraviolet radiation: Theoretical basis, J. Geophys. Res., 103, 17099–17110, https://doi.org/10.1029/98JD00900, 1998.
Torres, O., Tanskanen, A., Veihelmann, B., Ahn, C., Braak, R., Bhartia, P. K., Veefkind, P., and Levelt, P.: Aerosols and surface UV products from Ozone Monitoring Instrument observations: An overview, J. Geophys. Res., 112, D24S47, https://doi.org/10.1029/2007JD008809, 2007.
Twomey, S. A.: The influence of pollution on the shortwave albedo of clouds, J. Atmos. Sci., 34, 1149–1154, 1977.
Vernier, J. P., Fairlie, T. D., Natarajan, M., Wienhold, F. G., Bian, J., Martinsson, B. G., Crumeyrolle, S., Thomason, L. W., and Bedka, K. M.: Increase in upper tropospheric and lower stratospheric aerosol levels and its potential connection with Asian pollution, J. Geophys. Res.-Atmos., 120, 1608–1619, 2015.
Wan, B., Gao, Z., Chen, F., and Lu, C.: Impact of Tibetan Plateau surface heating on persistent extreme precipitation events in Southeastern China, Mon. Weather Rev., 145, 3485–3505, 2017.
Wei, X., Bai, K., Chang, N.-B., and Gao, W.: Multi-source hierarchical data fusion for high-resolution AOD mapping in a forest fire event, Int. J. Appl. Earth Obs., 102, 102366, https://doi.org/10.1016/j.jag.2021.102366, 2021.
Winker, D. M., Hunt, W. H., and McGill, M. J.: Initial performance assessment of CALIOP, Geophys. Res. Lett., 34, L19803, https://doi.org/10.1029/2007GL030135, 2007.
Winker, D. M., Vaughan, M. A., Omar, A., Hu, Y., Powell, K. A., Liu, Z., Hunt, W. H., and Young, S. A.: Overview of the CALIPSO mission and CALIOP data processing algorithms, J. Atmos. Ocean. Tech., 26, 2310–2323, 2009.
Wu, G. and Zhang, Y.: Tibetan Plateau forcing and the timing of the monsoon onset over South Asia and the South China Sea, Mon. Weather Rev., 126, 913–927, 1998.
Wu, G., Liu, Y., Zhang, Q., Duan, A., Wang, T., Wan, R., Liu, X., Li, W., Wang, Z., and Liang, X.: The influence of mechanical and thermal forcing by the Tibetan Plateau on Asian climate, J. Hydro. Meteor. Spec. Sect., 8, 770–789, 2007.
Wu, G., Liu, Y., Dong, B., Liang, X., Duan, A., Bao, Q., and Yu, J.: Revisiting Asian monsoon formation and change associated with Tibetan Plateau forcing: I. Formation, Clim. Dynam., 39, 1169–1181, 2012.
Wu, G., Duan, A., Liu, Y., Mao, J., Ren, R., Bao, Q., He, B., Liu, B., and Hu, W.: Tibetan Plateau climate dynamics: recent research progress and outlook, Natl. Sci. Rev., 2, 100–116, 2015.
Xu, C., Ma, Y. M., You, C., and Zhu, Z. K.: The regional distribution characteristics of aerosol optical depth over the Tibetan Plateau, Atmos. Chem. Phys., 15, 12065–12078, https://doi.org/10.5194/acp-15-12065-2015, 2015.
Xu, X., Lu, C., Shi, X., and Gao, S.: World water tower: an atmospheric perspective, Geophys. Res. Lett., 35, L20815, https://doi.org/10.1029/2008gl035867, 2008.
Yanai, M., Li, C., and Song, Z.: Seasonal heating of the Tibetan Plateau and its effects on the evolution of the Asian summer monsoon, J. Meteor. Soc. Japan, 70, 319–351, 1992.
Zhang, S., Huang, Z., Li, M., Shen, X., Wang, Y., Dong, Q., Bi, J., Zhang, J., Li, W., Li, Z., and Song, X.: Vertical structure of dust aerosols observed by a ground-based raman lidar with polarization capabilities in the center of the Taklimakan desert, Remote Sens., 14, 2461, https://doi.org/10.3390/rs14102461, 2022.
Zhang, S., Huang, Z., Alam, K., Li, M., Dong, Q., Wang, Y., Shen, X., Bi, J., Zhang, J., Li, W., Li, Z., Wang, W., Cui, Z., and Song, X.: Derived Profiles of CCN and INP Number Concentrations in the Taklimakan Desert via Combined Polarization Lidar, Sun-Photometer, and Radiosonde Observations, Remote Sens., 15, 1216, https://doi.org/10.3390/rs15051216, 2023.
Zhou, J., Yu, G., Jin, C., Qi, F., Liu, D., Hu, H., Gong, Z., Shi, G., Nakajima, T., and Takamura, T.: Lidar observations of Asian dust over Hefei, China in Spring 2000, J. Geophys. Res., 107, 4252, https://doi.org/10.1029/2001JD000802, 2002.