the Creative Commons Attribution 4.0 License.
the Creative Commons Attribution 4.0 License.
 | 22 Feb 2024
Four decades of global surface albedo estimates in the third edition of the CM SAF cLoud, Albedo and surface Radiation (CLARA) climate data record
Emmihenna Jääskeläinen
Viivi Kallio-Myers
We present the surface albedo data in the third edition of the CM SAF cLoud, Albedo and surface Radiation (CLARA) data record family. The temporal coverage of this edition is extended from 1979 until the near-present day. The core algorithms and data format remain unchanged from previous editions, but now white- and blue-sky albedo estimates are also available for the first time in CLARA data. We present an overview of the retrieval, followed by an assessment of the accuracy and stability of the data record, based on collocated comparisons with reference surface albedo measurements and intercomparisons with preceding satellite-based albedo data records. Specific attention is paid to addressing the spatial representativeness problem inherent in the “point-to-pixel” validation of satellite-based coarse surface albedo estimates against in situ measurements. We find the CLARA-A3 albedo data to match or improve upon the accuracy and robustness of the predecessor record (CLARA-A2), with good agreement found when compared to in situ measurements. In cases of a large bias, the spatial representativeness of the measurement site typically explains most of the increase. We conclude with a summarizing discussion on the observed strengths and weaknesses of the new data record, including guidance for potential users. The data are available at https://doi.org/10.5676/EUM_SAF_CM/CLARA_AVHRR/V003 (Karlsson et al., 2023b).
- Article
(10627 KB) - Full-text XML
-
Supplement
(1646 KB) - BibTeX
- EndNote


Energy from solar radiation is the principal energy source for Earth's climate and its ecosystems. At the surface level, the upwelling and downwelling (short-wave) solar fluxes and the thermal (long-wave) radiative fluxes combine to form the surface radiative energy budget (SRB), a key component of the climate system. Surface albedo (α) determines the fraction of the incident short-wave solar flux which is reflected away from Earth's surface and is therefore an important driver of the SRB. Here, we define albedo values as fractions between 0 and 1. Surface albedo magnitude is determined not only by the radiative properties of the surface over the examined wavelengths, but also the directionality of the incoming solar flux. Snow and sea ice are among the brightest natural surfaces. This also implies that, should they melt away, they are always replaced by much darker soil and open water, giving rise to the snow and ice albedo feedback (SIAF) where increasing heat absorption continues to feed additional melting (Budyko, 1969; Sellers, 1969). However, it is equally important to note that vegetation too drives changes in albedo and reacts to them (e.g. Tian et al., 2014; Beringer et al., 2005).
It is therefore clear that the surface albedo of Earth should be continuously monitored, particularly over the remote cryospheric domains where gains and losses in snow and ice may exert a substantial climatic influence. In practice, efficient and continuous monitoring of surface albedo at a global scale requires satellite observations. For applicability in climate-related studies, it is further required that the observations have multidecadal coverage, are carefully intercalibrated across sensor specimens, are processed into albedo estimates with consistent algorithms and auxiliary input data, and are finally carefully validated against reference observations to determine their quality.
To answer this need, the Satellite Application Facility on Climate Monitoring (CM SAF), a project of the European Organization for the Exploitation of Meteorological Satellites (EUMETSAT), produces and distributes decadal-scale climate data records (CDRs) from the longest continuous satellite data records available. Here, we present the third edition of global surface albedo data in the CLARA (CM SAF cLoud, Albedo and surface Radiation) data record family. CLARA-A3 (Karlsson et al., 2023b) is based on 4 decades of intercalibrated satellite observations from the AVHRR (Advanced Very High Resolution Radiometer) optical imagers, with full global coverage. The data record is produced and delivered in two components: the CDR which covers 1979–2020 and the Interim Climate Data Record (ICDR) which provides continuous updates to the CLARA-A3 record from 2021 until the near-present day. The essential description of the data record as a whole is available in Karlsson et al. (2023a) and is not repeated here. Here we instead focus on the surface albedo component of CLARA-A3. We begin by introducing the algorithms for the derivation of surface albedo estimates. Then, the performance of the data is evaluated against reference in situ observations, the stability and uncertainty of the data record are discussed, and finally we provide an intercomparison of the new data against the widely used MCD43 (Edition 6.1) and the predecessor CLARA-A2 data records. The results are then summarized in a discussion of the observed strengths and weaknesses of the new surface albedo data record.
The surface albedo estimates in the CLARA-A3 CDR are available as 5 d (pentad) or monthly means between January 1979 and December 2020, with a continuation through the ICDR. All the observations are from different members of the AVHRR spaceborne optical imager family; the observed radiances have been intercalibrated to eliminate inter-sensor jumps in the data record (after Heidinger et al., 2010). This preprocessing step is crucial for enabling climate trend studies for the derived geophysical variables. The data are provided on a global 0.25∘ lat–long grid, with the polar regions also covered by subsets on a 25 km resolution equal-area EASE2 grid. The core algorithm closely follows that of the predecessor records (Riihelä et al., 2013). Specifically, it is a sequential progression through topography and atmospheric corrections, bidirectional reflectance distribution function (BRDF) treatments, and the narrow-to-broadband conversion to short-wave broadband surface albedo. However, important expansions in scope and coverage are now available for the first time.
The primary change is that, in addition to the estimates for directional–hemispherical reflectance (DHR; also black-sky albedo) which formed the content of the predecessor CLARA albedo data, we now also provide the estimates for bidirectional reflectance under fully diffuse illumination (BHRISO; also white-sky albedo) and bidirectional reflectance under ambient illumination conditions (BHR; also blue-sky albedo). These variables are henceforth called SAL, WAL, and BAL, respectively. Conceptually, black-sky albedo would be observable in the absence of an atmosphere when all solar illumination comes from a single direction. Conversely, white-sky albedo would be observable only in cases where the incoming illumination is fully diffuse, i.e. evenly distributed from all directions in the sky. In real-world situations on Earth, neither extreme case is achievable, and the incoming illumination is a combination of direct and diffuse radiation fluxes. The blue-sky albedo is the parameter that seeks to estimate these cases.
Overviews of their retrieval process are available in the following section, with a complete description of all the algorithm details available in the Algorithm Theoretical Basis Document (ATBD) through the data record's DOI. For readers familiar with previous versions of the data record, a summary of changes in input and retrieval algorithms between CLARA-A3 and CLARA-A2 albedo data is shown in Table 1.
The data are provided in NetCDF-4 files, compliant with the Climate and Forecast (CF) metadata conventions (v1.7) as well as the NetCDF Attribute Convention for Data record Discovery (v.1.3).
Table 1Summary of algorithm and input changes between CLARA-A3 and CLARA-A2 climate data records for surface albedo.
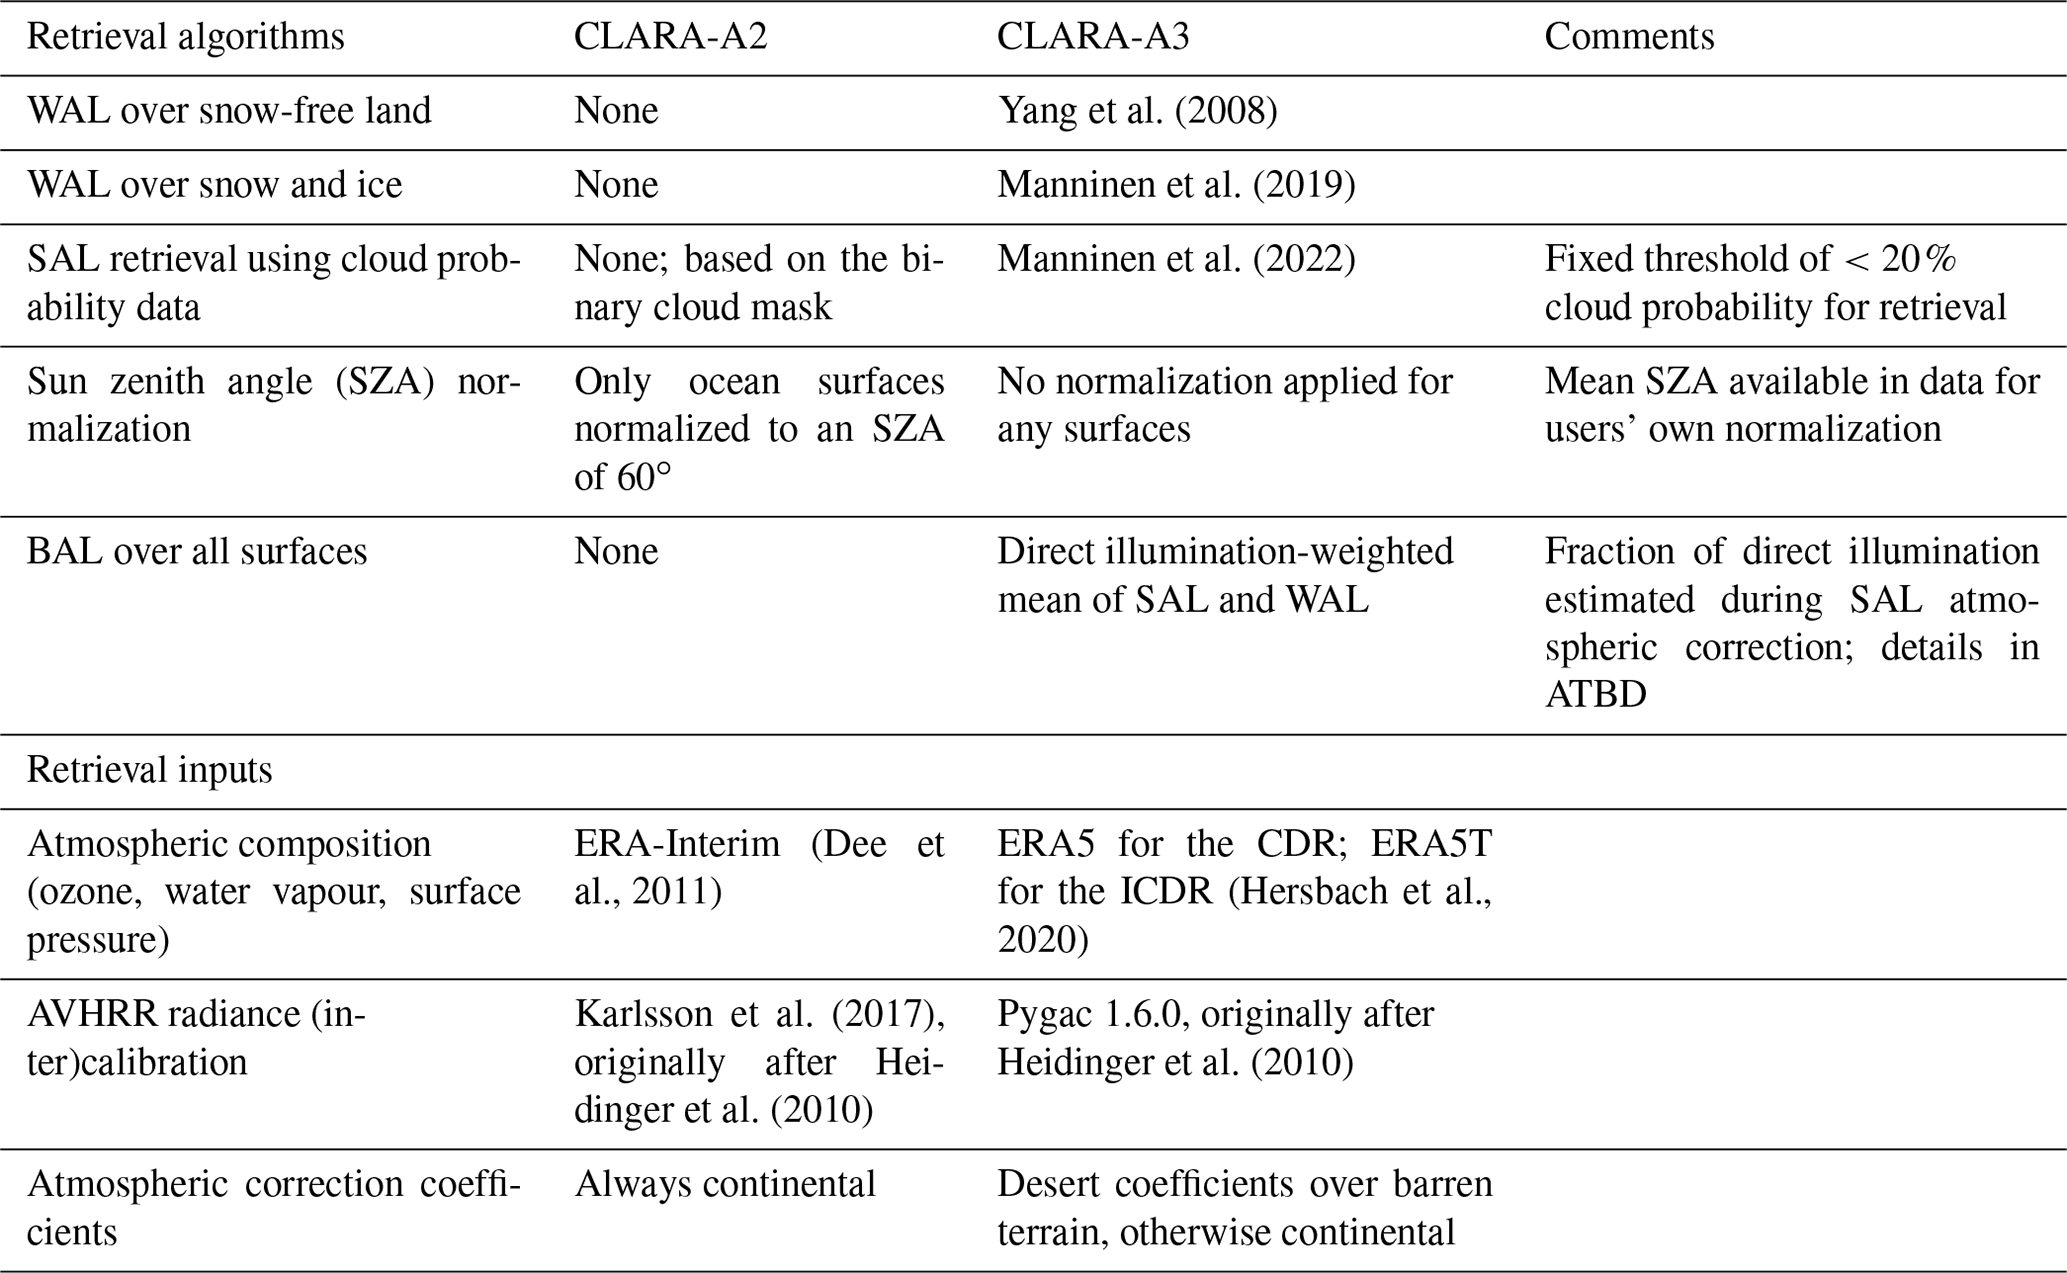
Figure 1a and c show examples of the monthly and pentad mean BAL from April 2015. Insufficient solar illumination prevents retrievals over Antarctica and near the North Pole, whereas the albedo of the Arctic sea ice in general is at or near its seasonal maximum. Figure 1b and d show the zonal means of SAL, WAL, and BAL for the month in question. Over the margins of the seasonal snow cover zone, Fig. 1 shows the mean of snowy and snow-free BAL weighted by the respective sampling. For SAL, separate data layers are provided for snow, ice, and snow-free albedo estimates. The principal variables of interest to users for SAL, WAL, and BAL are the combined data layers for mean surface albedo (identifier _all in data files), where snow and snow-free observations are combined as a weighted mean by counts of snow and snow-free observations (also provided in the data files).
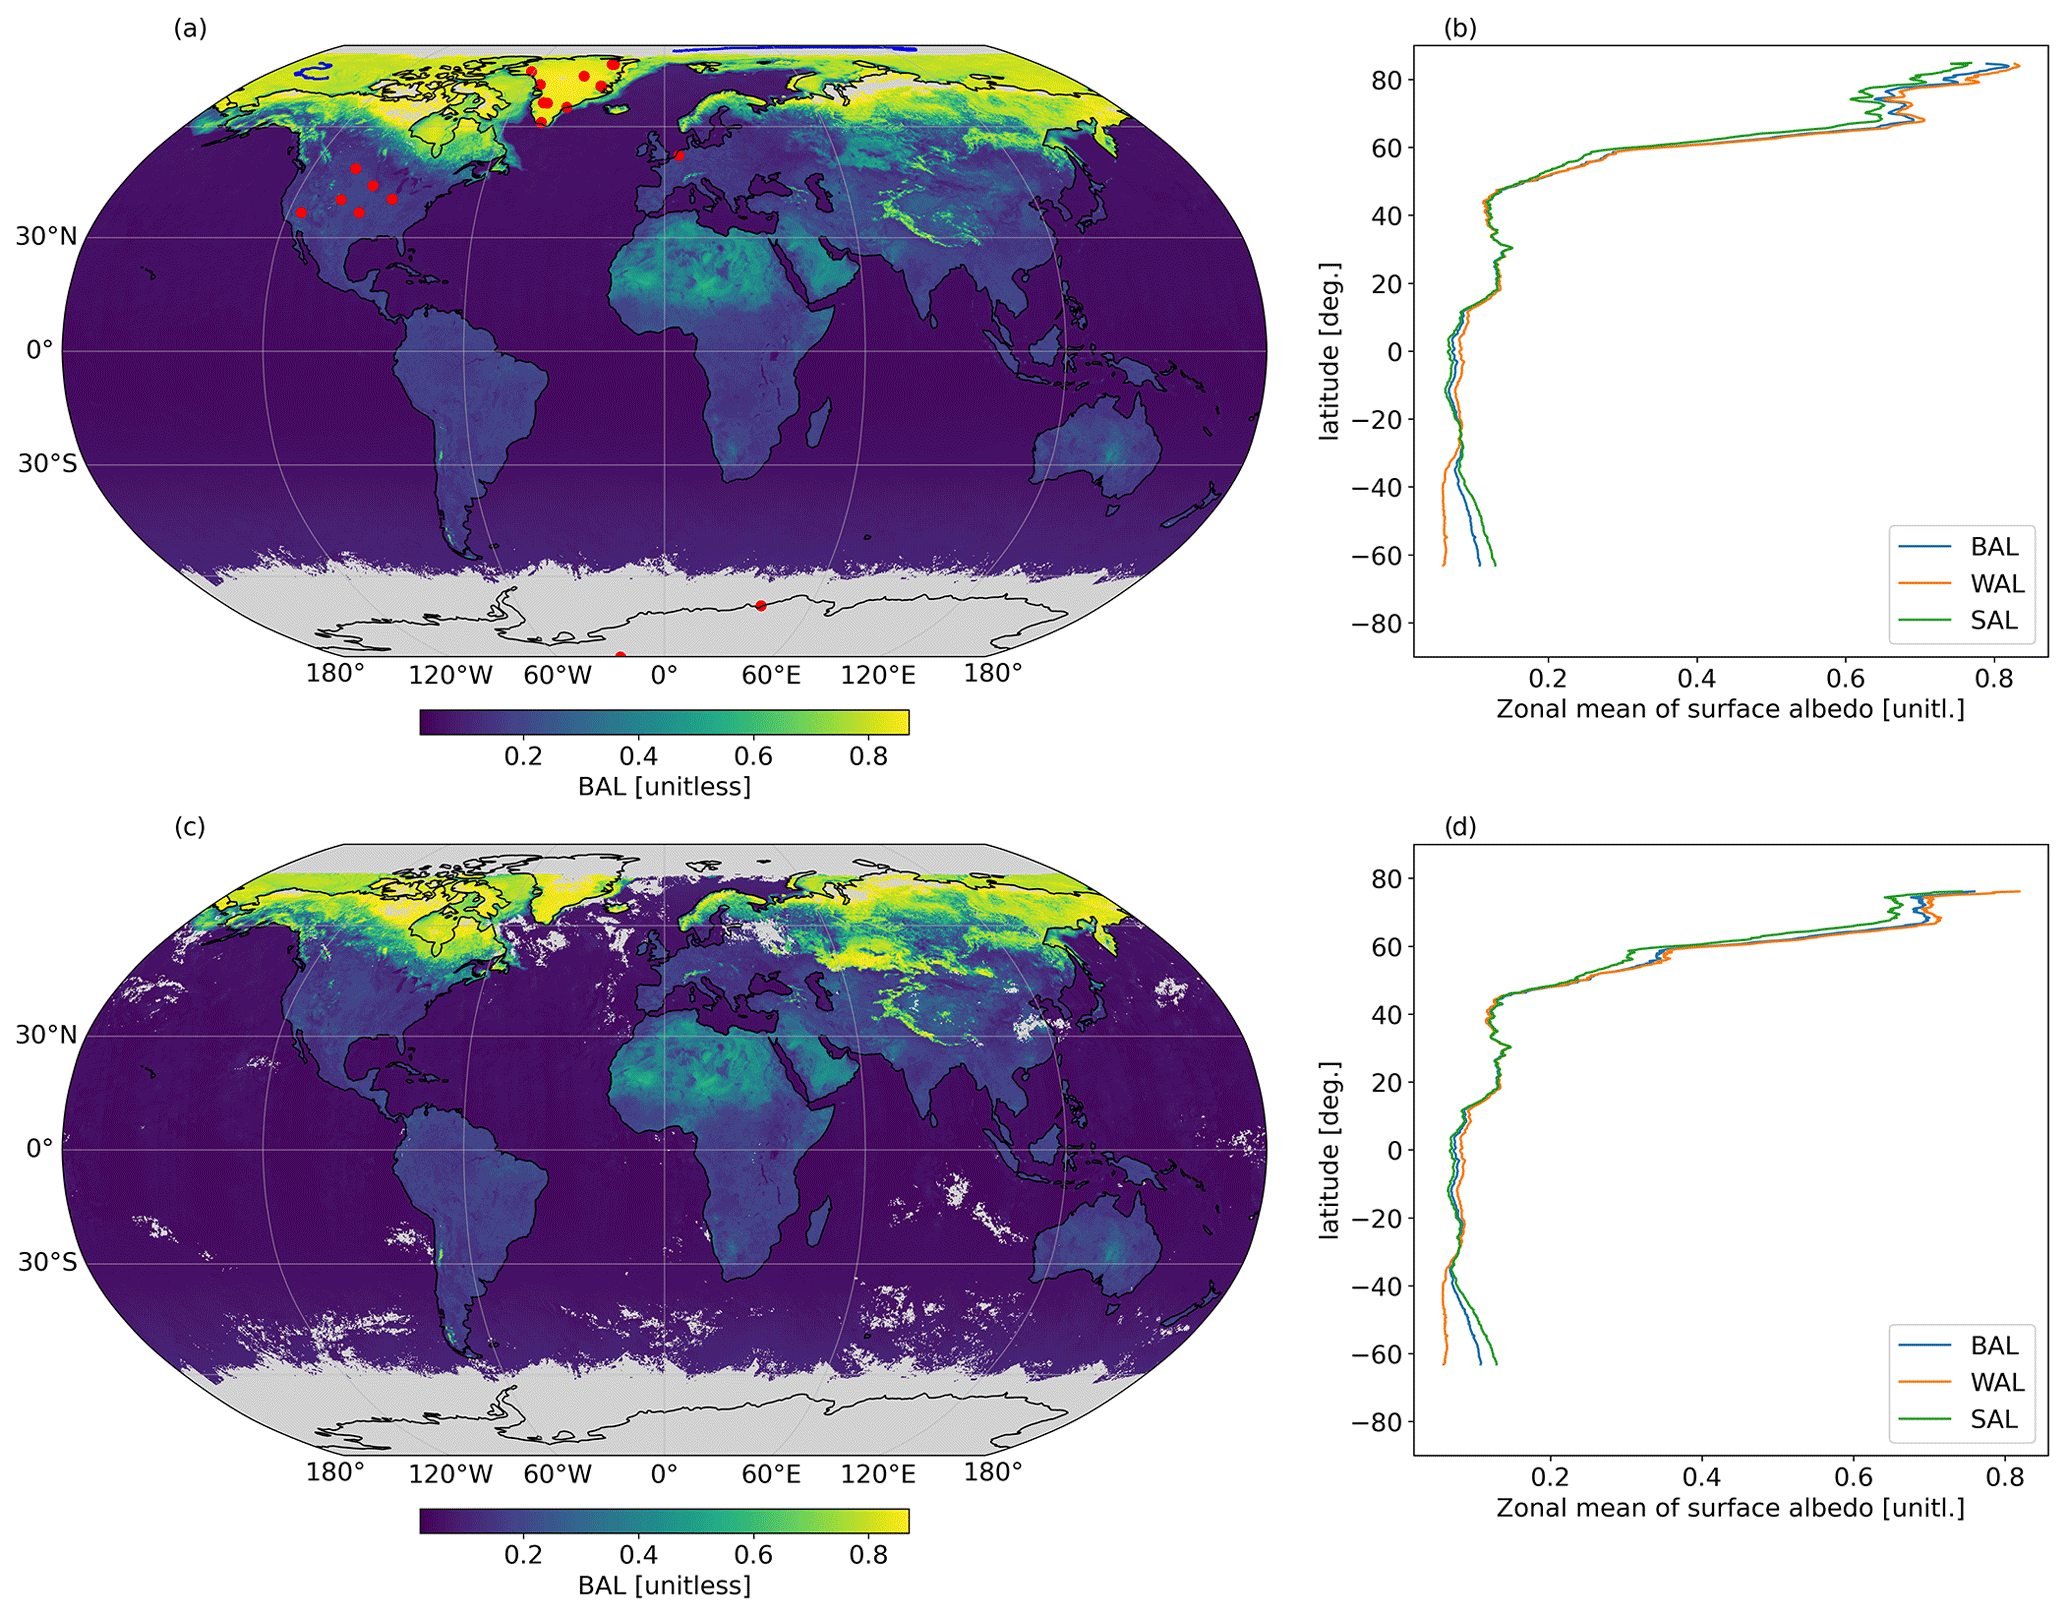
Figure 1(a) An example of the monthly mean blue-sky surface albedo (BAL) from April 2015. (b) The zonal means of the blue-sky (blue, thick), white-sky (WAL, orange), and black-sky (SAL, green) surface albedos. Subplots (c) and (d) show the same visualizations for the pentad mean starting on 1 April 2015. The red circles in subplot (a) further show the validation sites used in this study, and the blue lines show the drift tracks of the SHEBA and Tara-Arctic ice camps across the Arctic Ocean during the validation periods.
3.1 Black-sky albedo (SAL)
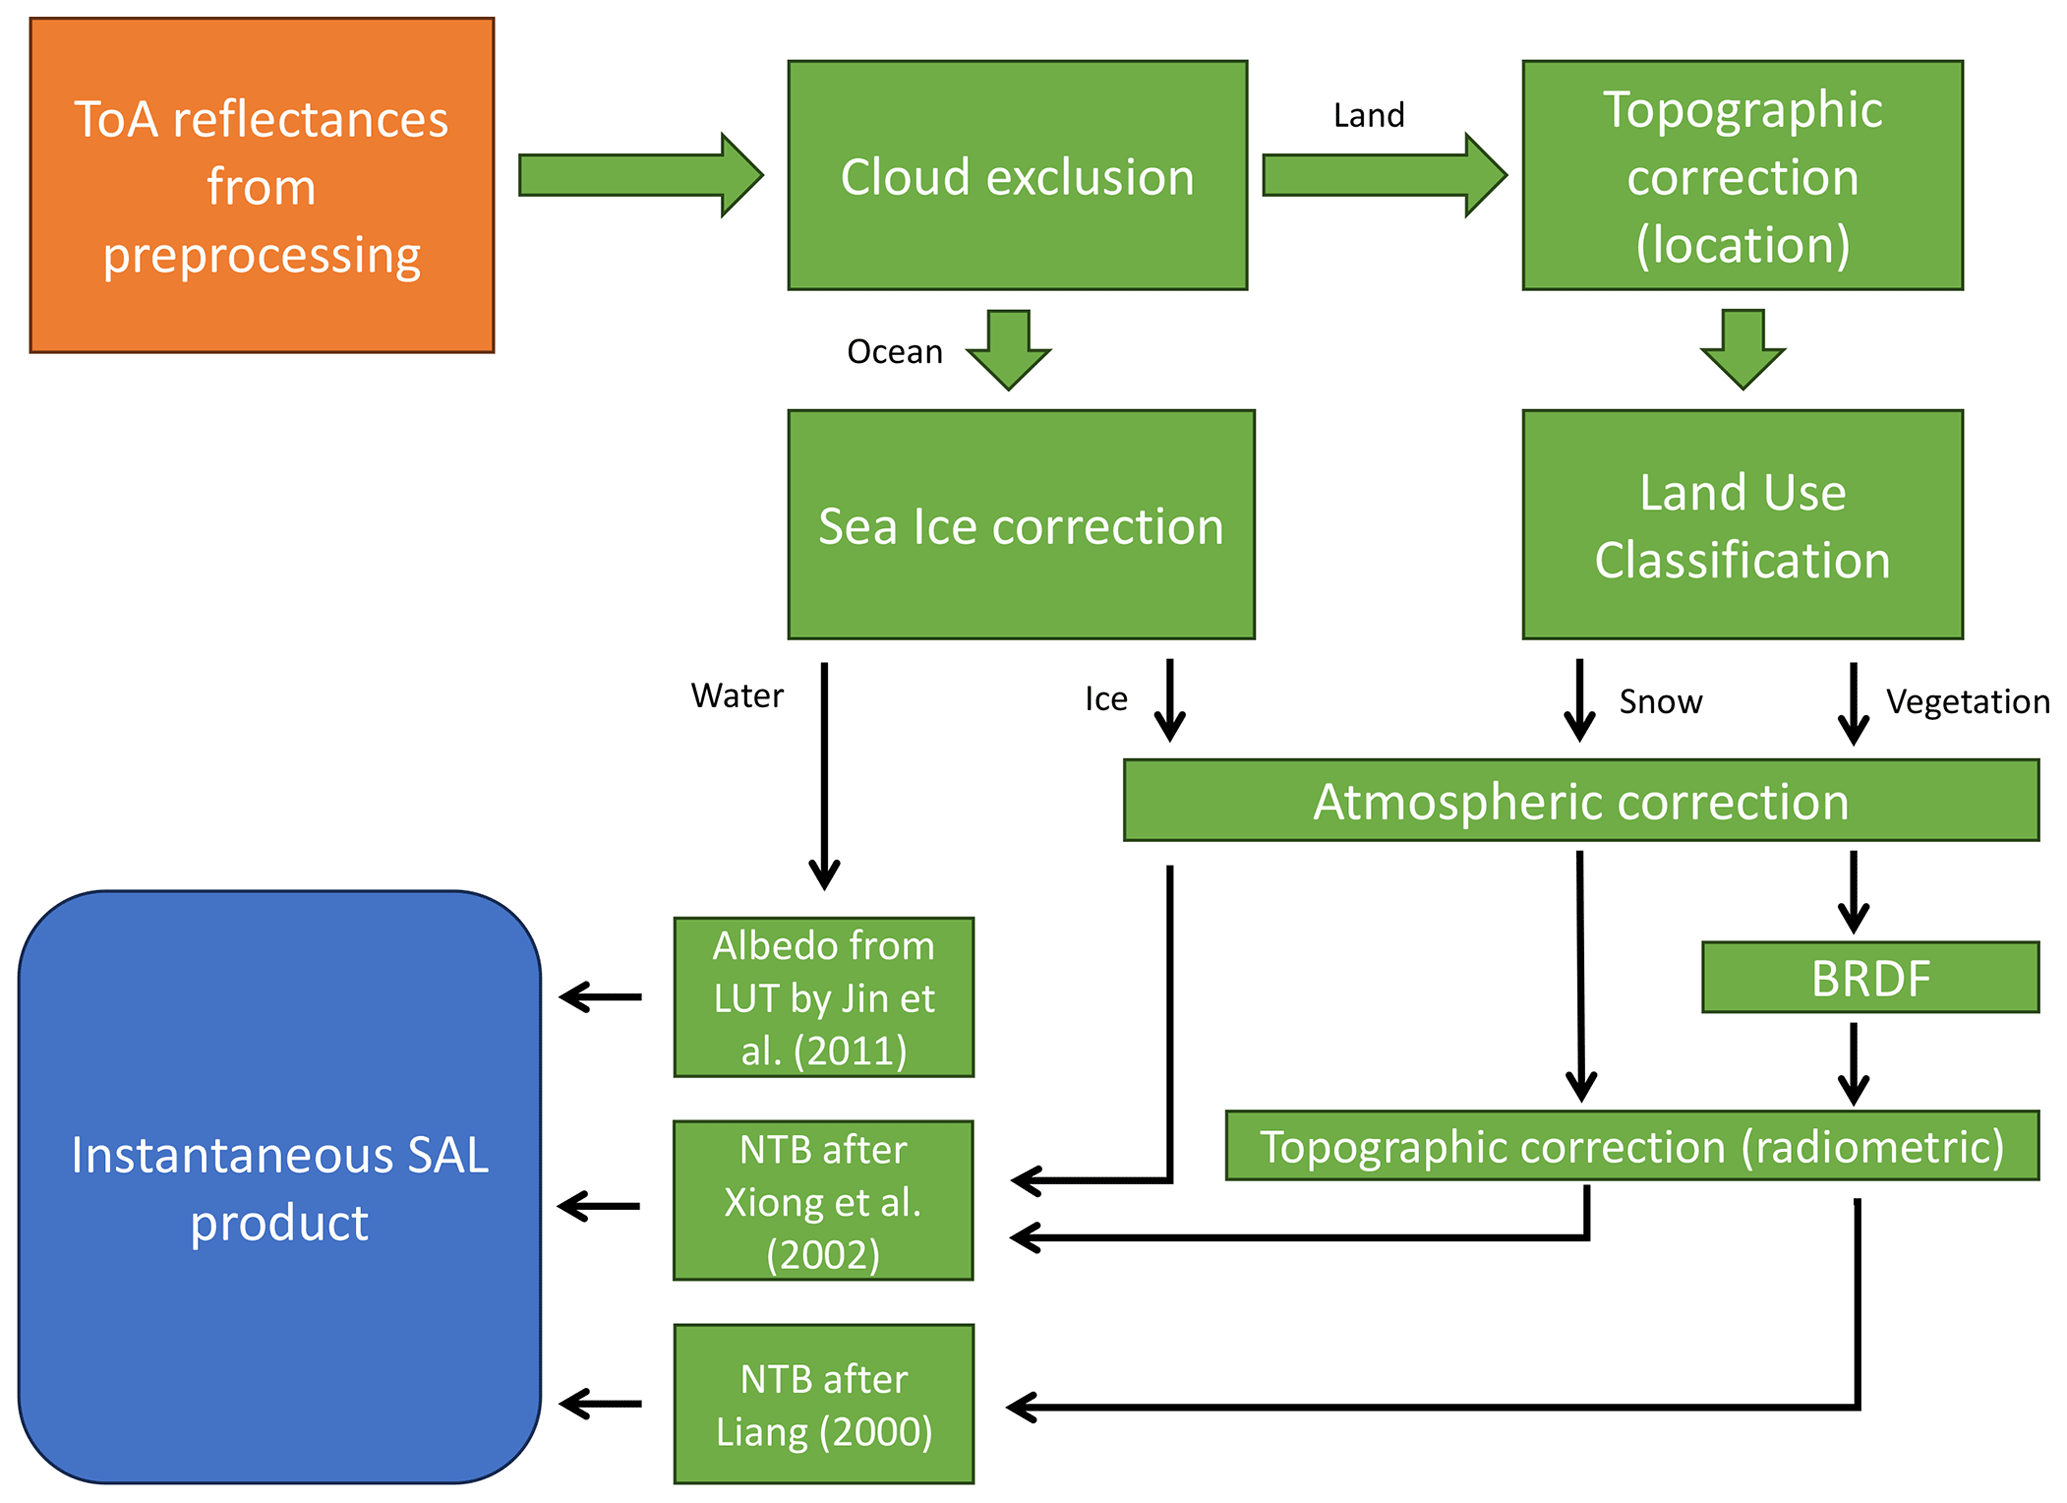
AVHRR channels 1 and 2, 0.58–0.68 µm (CH1) and 0.725–1 µm (CH2), respectively, are the radiance sources for SAL generation. The algorithm flow is outlined in Fig. 2. The first step towards the estimation of black-sky albedo is the identification and exclusion of cloudy and cloud-contaminated areas in the AVHRR imagery. The CLARA-A3 record provides probabilities of cloudiness for each imaged AVHRR pixel obtained through Bayesian classification (Karlsson et al., 2020). Choosing a threshold of cloud probability (CP) for discarding the observations is a trade-off between sampling density and robustness; extensive tests indicated that a universally applied threshold of 20 % cloud probability provides the best balance for SAL retrieval (Manninen et al., 2022). Furthermore, all observations with an unfavourable illumination/observation geometry (Sun zenith angle or viewing zenith angle ) are discarded. A flag for snow-covered terrain and sea ice (verified with Ocean and Sea Ice Satellite Application Facility (OSI SAF) sea ice concentration data) is also provided from the cloud processing (Karlsson et al., 2023a).
The topography correction for geolocation and radiometry in AVHRR imagery is applied exactly as in the predecessor CLARA records. As AVHRR geolocation is calculated on a geodesic reference ellipsoid (flat terrain), a combination of a sufficiently large elevation and viewing angle requires across-track shifting of pixels to obtain the true geolocation. A similar procedure is described in detail in Dech et al. (2021). Over sufficiently rugged terrain (the maximum of GTOPO30 slopes is larger than 5∘ in the Global Area Coverage (GAC) pixel, i.e. mountainous areas), further calculations attempt to improve the BRDF correction in image radiometry (atmospherically corrected surface reflectances) by accounting for the effects of view- or illumination-shadowed sub-slopes (Manninen et al., 2011), as calculated from DEM and imaging geometry, in each GAC-resolution AVHRR pixel to be corrected. The data sources are the Shuttle Radar Topography Mission (SRTM) DEM for latitudes between 60∘ N and 56∘ S and the GTOPO30 DEM elsewhere.
For the atmospheric correction necessary to reduce the satellite-observed top-of-atmosphere (ToA) reflectances to surface reflectances, we continue to apply the Simplified Method for Atmospheric Correction (SMAC; Rahman and Dedieu, 1993) model. The principal inputs required to describe the atmospheric composition are total column water vapour content, ozone content, surface pressure, and the aerosol optical depth (AOD) of the atmosphere at 550 nm wavelength. In the CLARA-A3 CDR, the data source for water vapour, ozone, and surface pressure was updated to the ERA5 atmospheric reanalysis (Hersbach et al., 2020). It should be noted that SMAC sacrifices precision for processing speed through the use of simplified and parameterized equations for the radiative transfer process. The impact increases with increasing solar or satellite zenith angles, meaning that the areas closest to the Sun zenith angle (SZA) cut-off of 70∘ have the highest probability of marked errors in the atmospheric correction phase of the algorithm.
For AOD over land surfaces, we continue to use the time series developed from Total Ozone Mapping Spectrometer (TOMS) and Ozone Monitoring Instrument (OMI) Aerosol Index (AI) observations (Jääskeläinen et al., 2017). Owing to caution related to potentially increased uncertainty in the UV-waveband observations of the OMI (Kleipool et al., 2022), AOD for the years 2015–2020 was treated as a day-of-year climatology based on data from 2005 to 2014. Furthermore, as SMAC has limitations in accuracy with high aerosol loading conditions, all AVHRR observations where the assigned (daily) AOD exceeds 1.0 are discarded. Over snow, ice, and water the fixed AOD of 0.1 was updated to 0.05 to better match common aerosol loading conditions over the polar regions during summer (Tomasi et al., 2012). We acknowledge that these choices hinder retrieval accuracy during rapidly changing aerosol loading conditions. However, as our temporal resolution is either 5 d or 1 month, the capacity for rapid change tracking is in any case only partial.
At this stage, the processing diverges for snow, ice, and snow-free land surfaces. We first consider snow-free land. The BRDF correction and conversion to narrowband surface albedos for AVHRR CH1 and CH2 continue to follow the kernel-based approach of Wu et al. (1995) and Roujean et al. (1992). The narrow-to-broadband conversion (NTBC) algorithm for the snow-free land surface also follows Liang (2001). The BRDF correction magnitude is land-cover-specific. The dominant land cover for each AVHRR observation is taken from a variety of land cover datasets: the USGS land cover for 1979–1997, GLC2000 for 1997–2002, GLOBCOVER2005 for 2002–2007, GLOBCOVER2009 for 2007–2012, and ESA LU CCI after 2012. Prior to use, the land cover data are mapped into coarse land cover archetypes (e.g. forest, grassland) to match the granularity of the BRDF model and to improve inconsistencies during shifts from one land cover data source to another.
Over snow and ice, the retrieval does not attempt a correction for BRDF effects in the level-2 (single-swath) processing. Instead, the atmospherically corrected surface reflectances are converted to broadband snow or ice reflectances following Xiong et al. (2002), noting that the NTBC algorithm also self-adapts to wet and dry snow or ice conditions. Then, the broadband reflectances are aggregated and averaged during level-3 processing, relying on dense angular sampling of the AVHRR sensor to cover the angular domains most relevant for bidirectional reflectance variation for snow and ice. There are two principal justifications for this choice. First, as seen in Fig. 3a, available clear-sky AVHRR observations over the polar regions (here a site on the Greenland Ice Sheet) cover the majority of the viewing hemisphere during the summer months. Keeping in mind that the reflectance signature of snow and ice is symmetric about the principal plane, we can see that the unsampled part of the viewing hemisphere is a relatively narrow angular domain about the cross-principal plane. In Fig. 3b, an illustration of angular variability in snow reflectance after recent modelling efforts by Jiao et al. (2019) confirms that this angular range contributes little to the overall angular reflectance signature of snow.
The second part of the justification for this simple method lies in the lack of universally applicable BRDF models valid for all naturally occurring snow and (sea) ice conditions. While clear progress has been made in BRDF treatments and albedo retrievals of optically deep snow cover (e.g. Jiao et al., 2019; Kokhanovsky et al., 2019; Kokhanovsky, 2021) as well as sea ice (Malinka et al., 2016; Pohl et al., 2020), the available methods either require a priori information or assumptions about the state of the snow or ice (e.g. a sufficient depth of snow) or are designed for more modern, higher-resolution optical spaceborne sensors such as the Medium Resolution Imaging Spectrometer (MERIS) or the Moderate Resolution Imaging Spectroradiometer (MODIS). While we acknowledge that the method chosen for CLARA retrievals cannot match the precision of specifically designed algorithms, we maintain that the snow and sea ice albedo estimates in CLARA-A3 are always based on realized AVHRR reflectances and will avoid retrieval errors resulting from choosing an inappropriate snow or ice BRDF model for the scene. This is particularly relevant for sea ice, where the surface conditions may be a composite of wet and dry snow, bare ice and the surface scattering layer (e.g. Smith et al., 2022), melt ponds, open water, and leads.
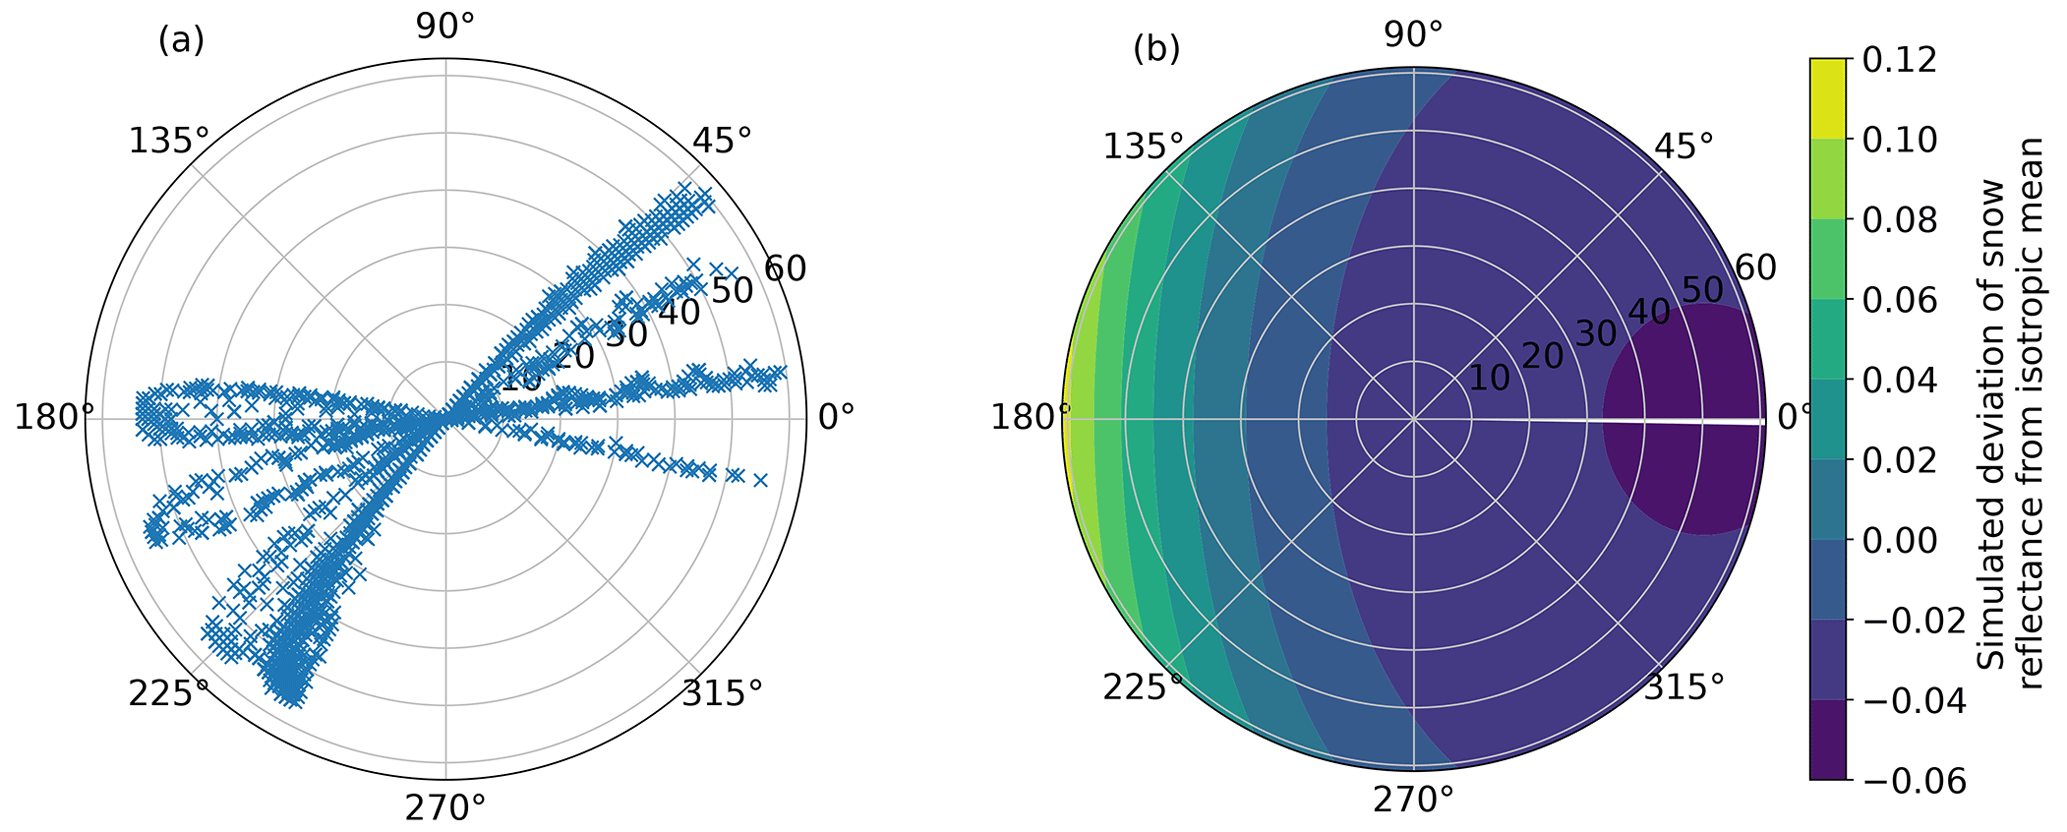
Figure 3(a) Satellite zenith and relative azimuth angles of successful CLARA-A3 SAL retrievals during 2020 at Summit Camp in Greenland. The polar plot shows viewing (satellite) zenith angles on the radial axis and relative azimuth angles on the angular axis. (b) An example of the deviation of angular snow reflectance from its isotropic mean is modelled by the snow kernel proposed by Jiao et al. (2019) with the same polar coordinates.
For water bodies, surface albedo is derived following Jin et al. (2011). Here, the primary drivers are wind speed and Sun zenith angle (for black-sky albedo). Wind speeds over global oceans are compiled from observations of the Scanning Multi-channel Microwave Radiometer (SMMR), Special Sensor Microwave Imager (SSM/I), and Special Sensor Microwave Imager Sounder (SSMIS) instrument series, supplemented with anemometer-based wind speed data (Tokinaga et al., 2022) and climatological values to fill gaps where needed. During the SMMR era of 1979–1984, wind speeds are available as monthly means (Wentz, 1997; Vazquez, 1997). Full details of these calculations are available in the ATBD.
Note that the AVHRR-observed reflectances are not used in the estimation of ocean surface albedo. The choice is justified by the relatively uniform behaviour of ocean albedo as a function of wind speed (in the absence of large chlorophyll concentrations, for which no global observational data exist reaching back to 1979) and the marked reduction in computational needs gained when deriving ocean albedo through this parameterized approach.
At this stage the estimation of black-sky albedo at the overpass or swath level is complete. The data are then transferred to the level-3 aggregation code, which first calculates statistical parameters of SAL (e.g. moments, standard deviation, skewness, and kurtosis) in each 0.25∘ or 25 km grid cell. The black-sky albedo parameters are finally corrected for effects of non-zero cloud probability (Manninen et al., 2022) and recorded as the spatiotemporal mean provided in the product files.
3.2 WAL
The white-sky albedo for snow-free land surfaces is derived from the estimated black-sky albedo and SZA following Yang et al. (2008):
where αblack is the SAL and θz is the solar zenith angle. The WAL over snow-free land is calculated during level-2 processing and is averaged to form the pentad and monthly means.
For snow-covered land and sea ice, WAL is estimated based on statistical relationships of black-sky and white-sky albedo parameters as observed in in situ measurements (Manninen et al., 2019). Only the temporal mean of white-sky albedo is derived, and the applied equation is
where is the temporal mean of SAL and refers to the median, σblack to the standard deviation, γ to the skewness, and β to the kurtosis of the black-sky albedo distribution. is the mean SZA of the period in radians.
The observed empirical relationships change with the presence of above-snow vegetation. Therefore, the following equation is applied for forested snow-covered areas (Manninen et al., 2019):
Snow-covered forests are identified from land cover and the snow cover flag. However, in sparse (boreal) forests the scene reflectance may still be too bright for the equation to be applicable. Therefore, the equation for snow-covered forest is applied only if the observed SAL is less than 0.5.
Finally, testing during the CDR processing indicated that the empirical nature of WAL retrieval led to a slight underestimation over the brightest snow surfaces but also overestimation over sea ice where the statistical parameter distributions differed from snow. Therefore, WAL over the brightest snow was bias-corrected with a multiplication factor of exp(0.1× WAL4), and WAL over sea ice was constrained to not exceed SAL by more than 10 % relative, consistent with results from prior studies (Key et al., 2001). Further details on WAL derivation are available in the ATBD.
3.3 BAL
The blue-sky surface albedo is estimated as (Lucht et al., 2000; Pinty et al., 2005; Schaepman-Strub et al., 2006; Román et al., 2010)
where fdir and fdiff are the fractions of direct and diffuse irradiance, respectively, so that . The equation requires simplifying assumptions about the properties of the incoming diffuse irradiance (Lucht et al., 2000; Pinty et al., 2005), leading typically to underestimations with high SZAs. However, given the conservative cut-off of 70∘ for SZA in CLARA-A3, use of this equation is justifiable.
Both fdir and fdiff must be estimated for all AVHRR-imaged scenes during daytime (whether clear or cloudy) in order to obtain realistic temporal means of real-world sky conditions for each aggregation period in question. SMAC-based estimates for these fractions are sufficiently accurate under clear-sky conditions, but for cloudy conditions we estimate them based on an observed sigmoid relationship between fdiff and the clearness index (Hofmann and Seckmeyer, 2017). We approximate the clearness index with CP (Karlsson et al., 2023a), obtaining the following parameterization for fdir:
The parameterization also depends on SZA (θz), so that the fdir variability under clear-sky conditions (CP =0) is realistic.
3.4 Data quality and uncertainty indicators
As the CLARA-A3 albedo retrieval approach is deterministic rather than probabilistic, the data do not contain direct grid-cell-specific error estimates. However, a wide array of data layers describing data quality is available. Here we highlight the three most important indicators of quality: sampling density, skewness, and kurtosis.
Figure 4a illustrates sampling density in the CLARA-A3 surface albedo CDR through the monthly mean of valid clear-sky GAC-resolution observations in each 0.25∘ grid cell at the global level. Variability in sampling at the global level relates primarily to changes in the AVHRR constellation; throughout the 1980s and 1990s, typically only one or two sensors were operational at any given time. In the 2000s, additions of secondary NOAA satellites in the morning and afternoon orbits and the launches of the AVHRR-carrying Metop weather satellites from 2006 onwards substantially increased the available sampling.
Given the reliance on dense sampling in the CLARA albedo estimates over snow and ice, the issue is particularly relevant over the polar regions. Figure 4b shows the mean GAC-resolution observation count over a small area of the Greenland Ice Sheet for each month in the CLARA-A3 CDR, where retrievals were possible given the prevailing solar geometry (marker colour). Between early spring or late autumn and midsummer, available sampling may change by a factor of 50 (counting GAC-resolution pixels). With low sampling, the angular coverage degrades, leading to larger biases in the albedo estimates. An example of sampling over tropical regions is provided in Fig. 4c, which shows the mean valid observation count over a region in central Africa. The region's sampling variability largely and naturally resembles the global mean sampling. The exceptions are the lowest sampling counts which occur in August due to the local aerosol loading growing too large for albedo retrievals, as described in Sect. 3.1. This results in data gaps over some of the area.
We highlight the relationship between retrieval stability and sampling in Fig. 5, which displays the deviation of the monthly mean BAL from the expected climatological surface albedos as a function of sampling and solar geometry over two homogeneous and flat areas: in Fig. 5a, a dry-snow region of the Greenland Ice Sheet; in Fig. 5b, a cropland–grassland region over the central United States. The climatological albedos are set to 0.85 for dry snow (Konzelmann and Ohmura, 1995) and 0.2 for a grassland–cropland mixture (He et al., 2014) and are adjusted for SZA variation following Briegleb et al. (1986). Given months of high sampling, BAL agrees very well with expectations. Over the ice sheet, the largest deviations occur during spring and autumn, where increased uncertainty in the atmospheric correction combines with solar geometry cut-offs in sampling, leading to a low number of available observations and therefore higher uncertainty. Most prior Arctic albedo studies using the predecessor CLARA records have only used data from May to August for this reason; the recommendation continues to hold for CLARA-A3. Figure 5 does not show 4 individual months over the ice sheet, when corrupted AVHRR data caused clearly erroneous retrievals. Their effect is discussed in Sect. 6: Discussion, strengths, and limitations of the CLARA data.
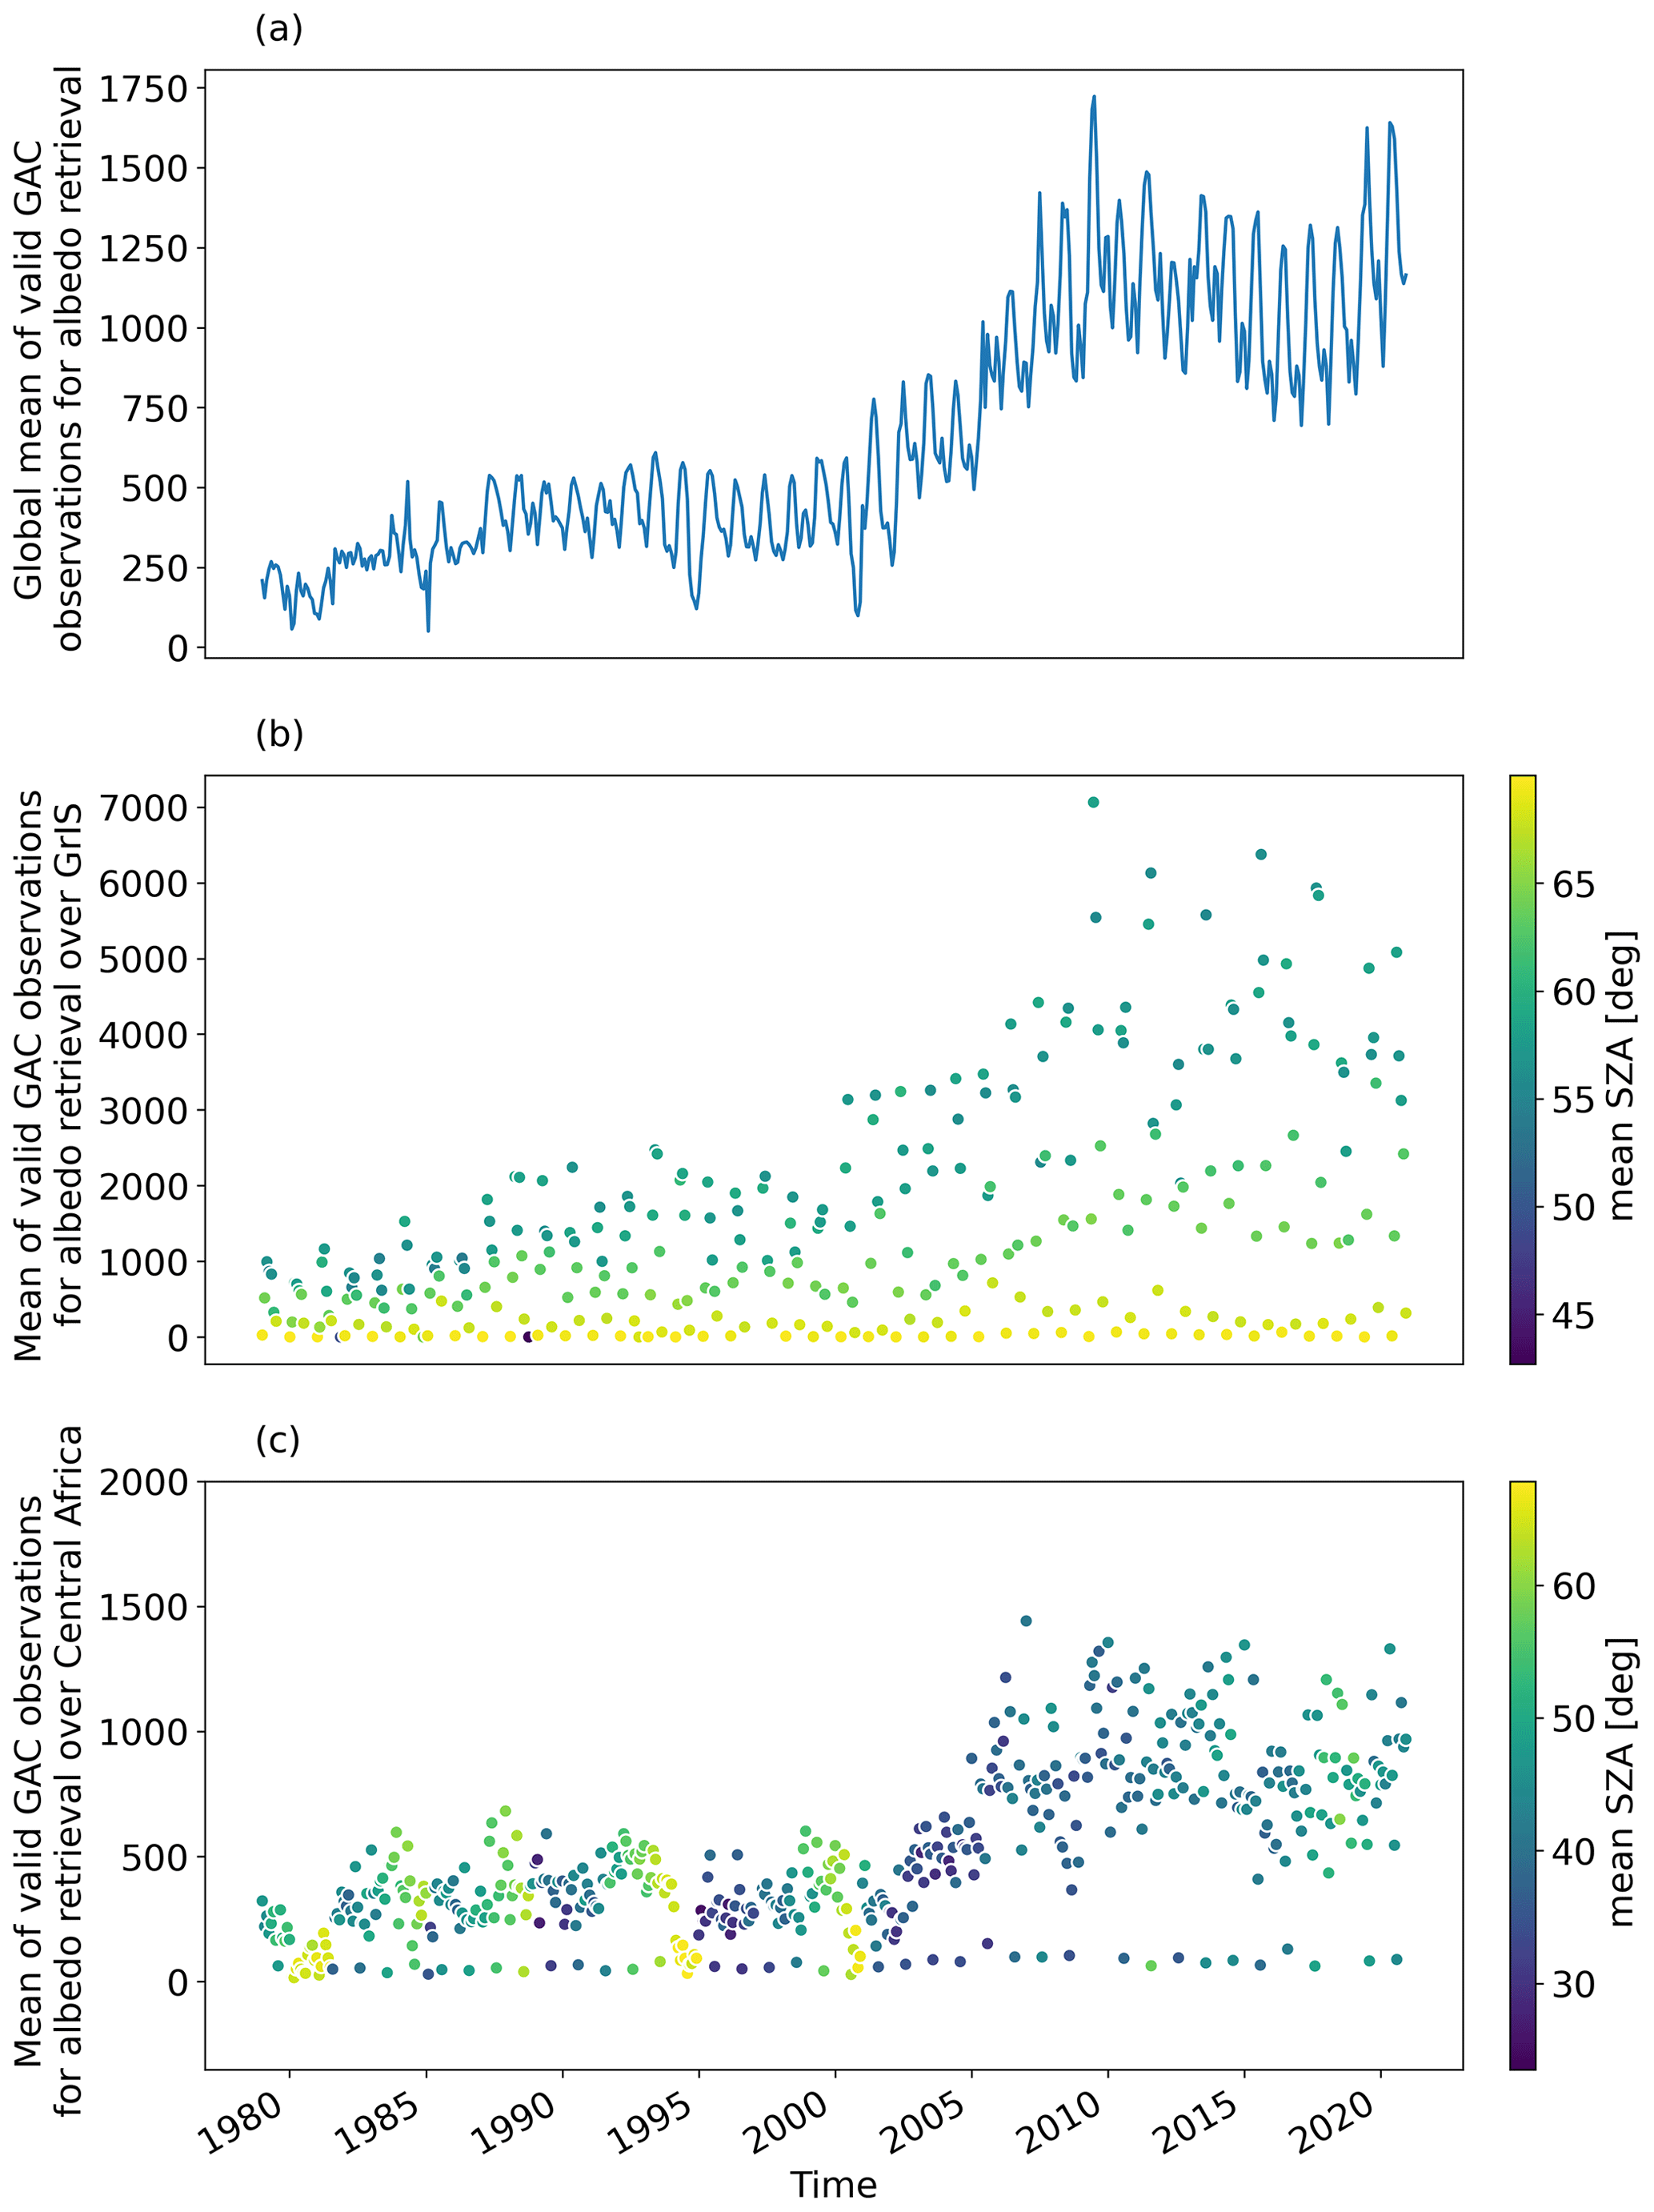
Figure 4(a) The global mean of valid clear-sky GAC-resolution AVHRR observations (NOBS) in the monthly mean SAL. (b) The mean number of valid observations over a small region in the central part of the Greenland Ice Sheet (72–74∘ N, 39–41∘ W). (c) The mean number of valid observations over a region in the central part of Africa (−2–0∘ N, 18–20∘ E). Each marker represents a monthly mean colour-coded by the mean Sun zenith angle (SZA) of the observations.
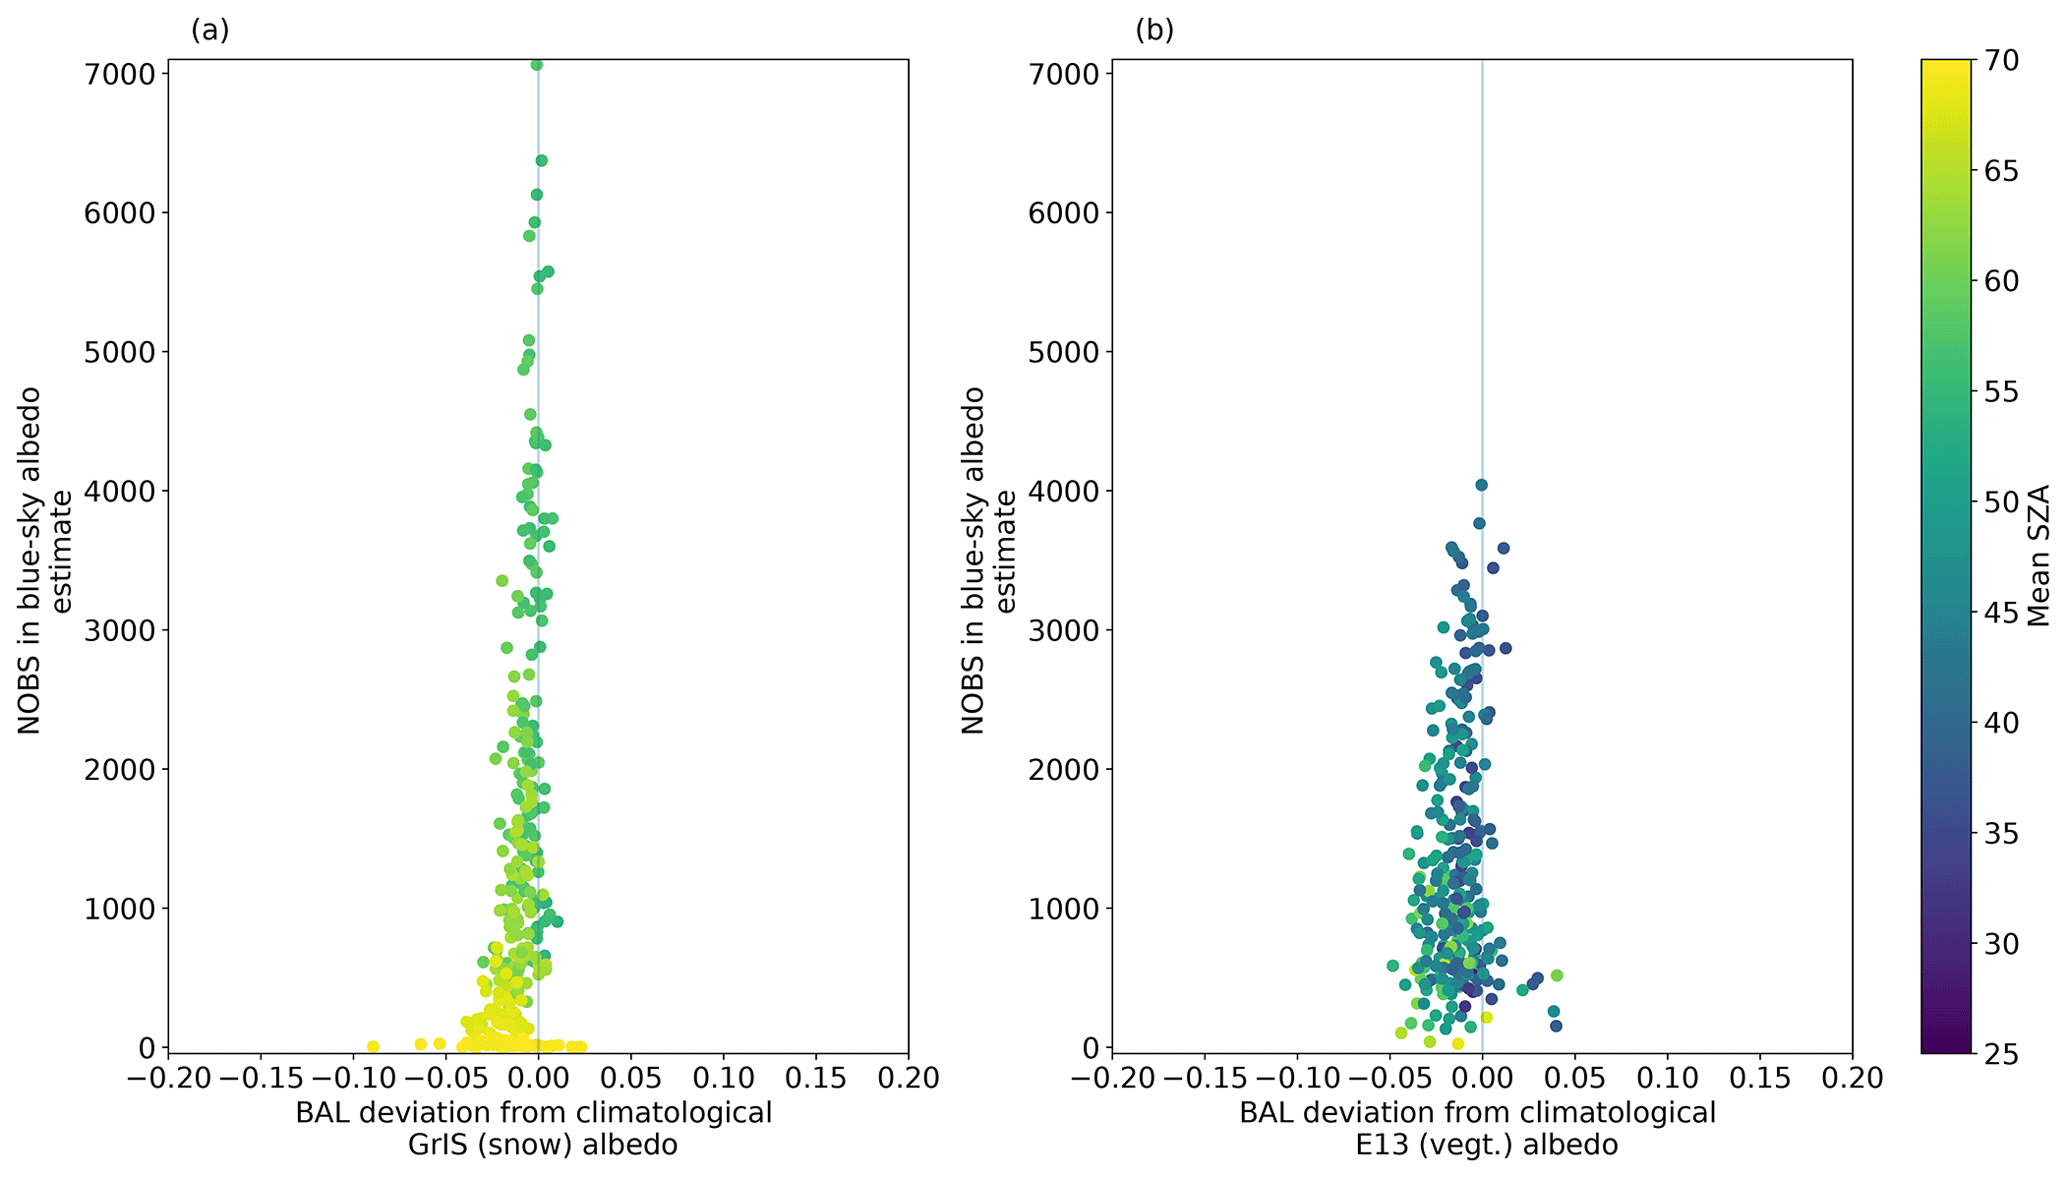
Figure 5(a) Deviation of the monthly mean BAL from climatologically expected surface albedos over the central Greenland Ice Sheet (GrIS) and the Kansas plains containing the E13 BSRN site (b) as a function of the sampling count and mean SZA (marker colour).
Results from a similar analysis for skewness and kurtosis over the same sites are shown in Supplement Fig. S1. Skewness describes the deviation of data from a normal distribution, both in the direction (tails on the left or right of the distribution centre) and the magnitude of the deviation. Kurtosis is a measure of the length of the distribution tails – only deviations more than 1 standard deviation away from the normal distribution centre contribute significantly to kurtosis. We see that very large skewness and kurtosis values are possible for the ice sheet area during months with mean SZAs close to cut-off and low sampling. Alongside low sampling counts, very large kurtosis and skewness are clearly indicators of low confidence in retrieval robustness. It is recommended that they should be examined and screened before using the data. Note that, over snow and ice, skewness and kurtosis are available only in the black-sky SAL data.
Over vegetated surfaces, very large skewness and kurtosis are generally not present except in outliers (Figs. S2 and S3). However, especially over high-latitude land or snow surfaces, persistent cloudiness and/or a low Sun elevation may create conditions of very low sampling and large skewness or kurtosis (Fig. S1). This may occur particularly in the pentad means, where the aggregation period is shorter.
3.5 The ICDR of CLARA-A3 surface albedos
The CLARA-A3 CDR is continued from 2021 to the near-present day as the ICDR retrieved with the same algorithms as the core CDR and is delivered in the same format. However, due to timeliness constraints, the atmospheric composition data used in SAL processing are changed from ERA5 to the continuously updated ERA5T reanalysis. AOD and ocean wind speed data are applied as daily climatologies, and the sea ice concentration data used to sanity-check cloud screening over sea ice regions are changed to OSI-401b. Additionally, the AVHRR radiances in the ICDR have not gone through the same level of intercalibration as the CDR, which is more stable apart from some issues in 2019 and 2020 (please see the Discussion section for details). A 6-month overlap period cross-check between the CDR and ICDR suggested that differences in surface albedo of 0.01–0.04 are common (Fig. S4), with larger differences possible for the brightest snow and ice. This behaviour points to the radiance calibration differences as the likeliest source of discrepancy. We note that the global mean difference in albedo between the CDR and ICDR was within 0.01 during the examined period.
Prior to release, the CLARA-A3 surface albedo CDR was validated against decade-spanning in situ measurements from the Baseline Surface Radiation Network (BSRN; Driemel et al., 2018), the Programme for Monitoring of the Greenland Ice Sheet (PROMICE; Fausto et al., 2021), and data from the Tara-Arctic (Vihma et al., 2008) and Surface Heat Budget of the Arctic Ocean (SHEBA; Perovich et al., 2002) drifting ice camps in the Arctic Ocean. Tables 2 and 3 list the locations of the BSRN and PROMICE sites and their periods of coverage. A separate validation report (VR) containing full details and results of the effort is available through the data record DOI. Here we present a summary of the most relevant findings, focusing on evaluation at the monthly mean time resolution; pentad mean performance is detailed in the Supplement. Retrieval accuracy is quantified through three metrics: mean relative bias (MBE, %), bias-corrected root mean square error (RMSE) as a measure of precision (bc-rms, unitless), and the decadal stability of bias, i.e. the temporal trend in bias as percent per decade.
For the validation of WAL and SAL estimates, the BSRN in situ measurements were filtered for the amounts of diffuse and direct incident solar flux, requiring more than 98 % diffuse and direct irradiance for the white- and black-sky validation. As PROMICE sites do not record the irradiance components, the division was instead made on observed cloud cover, with >0.99 and 0.0 as the requirements for white- and black-sky conditions. Strictly speaking, full or non-existent cloud cover does not necessarily equate to perfect diffuse or direct illumination conditions; thus, residual uncertainty in the comparativeness remains for WAL and SAL.
Table 2BSRN sites serving as reference surface albedo data sources.
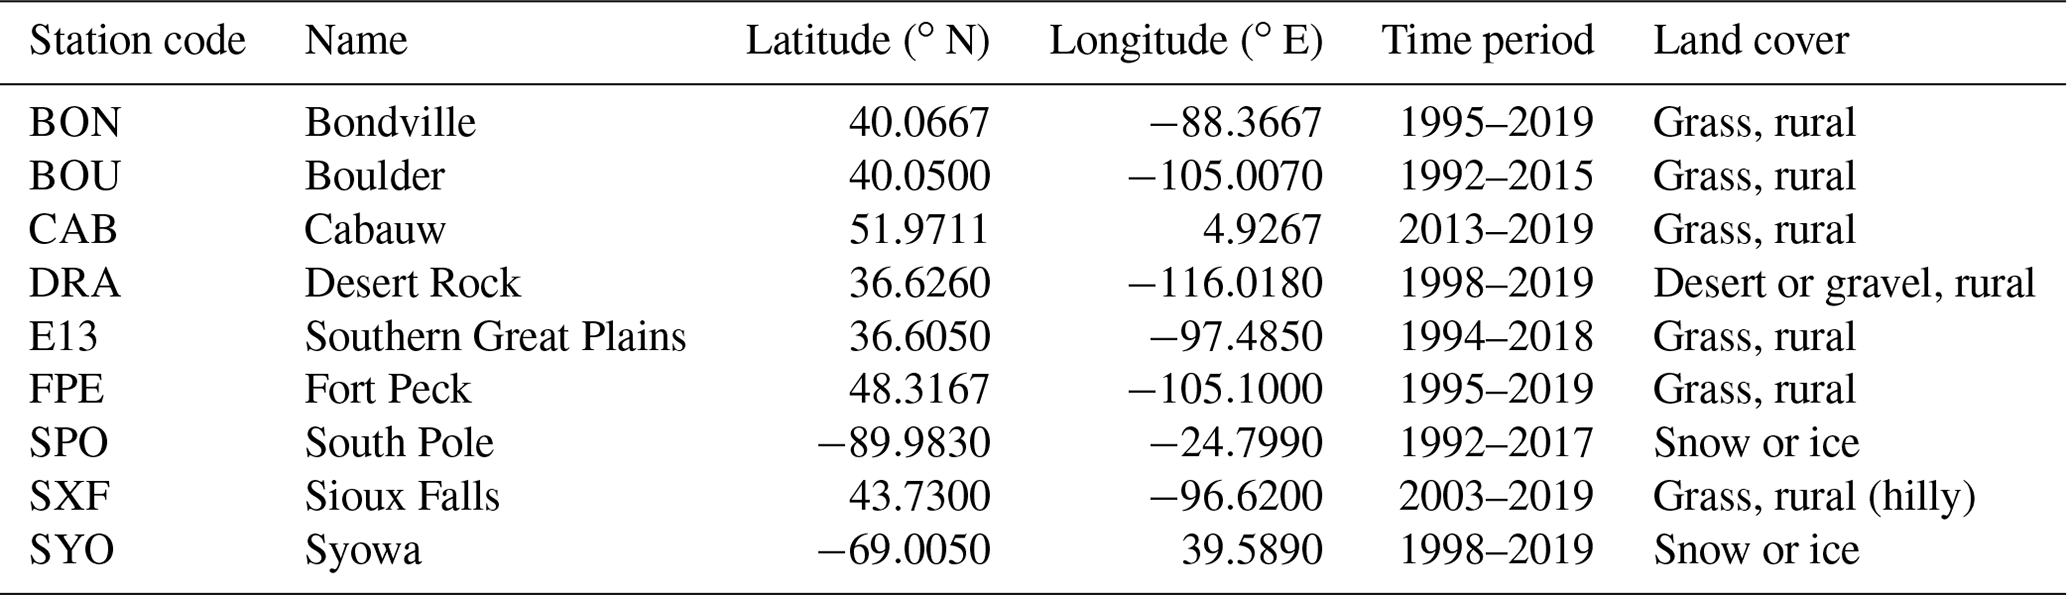
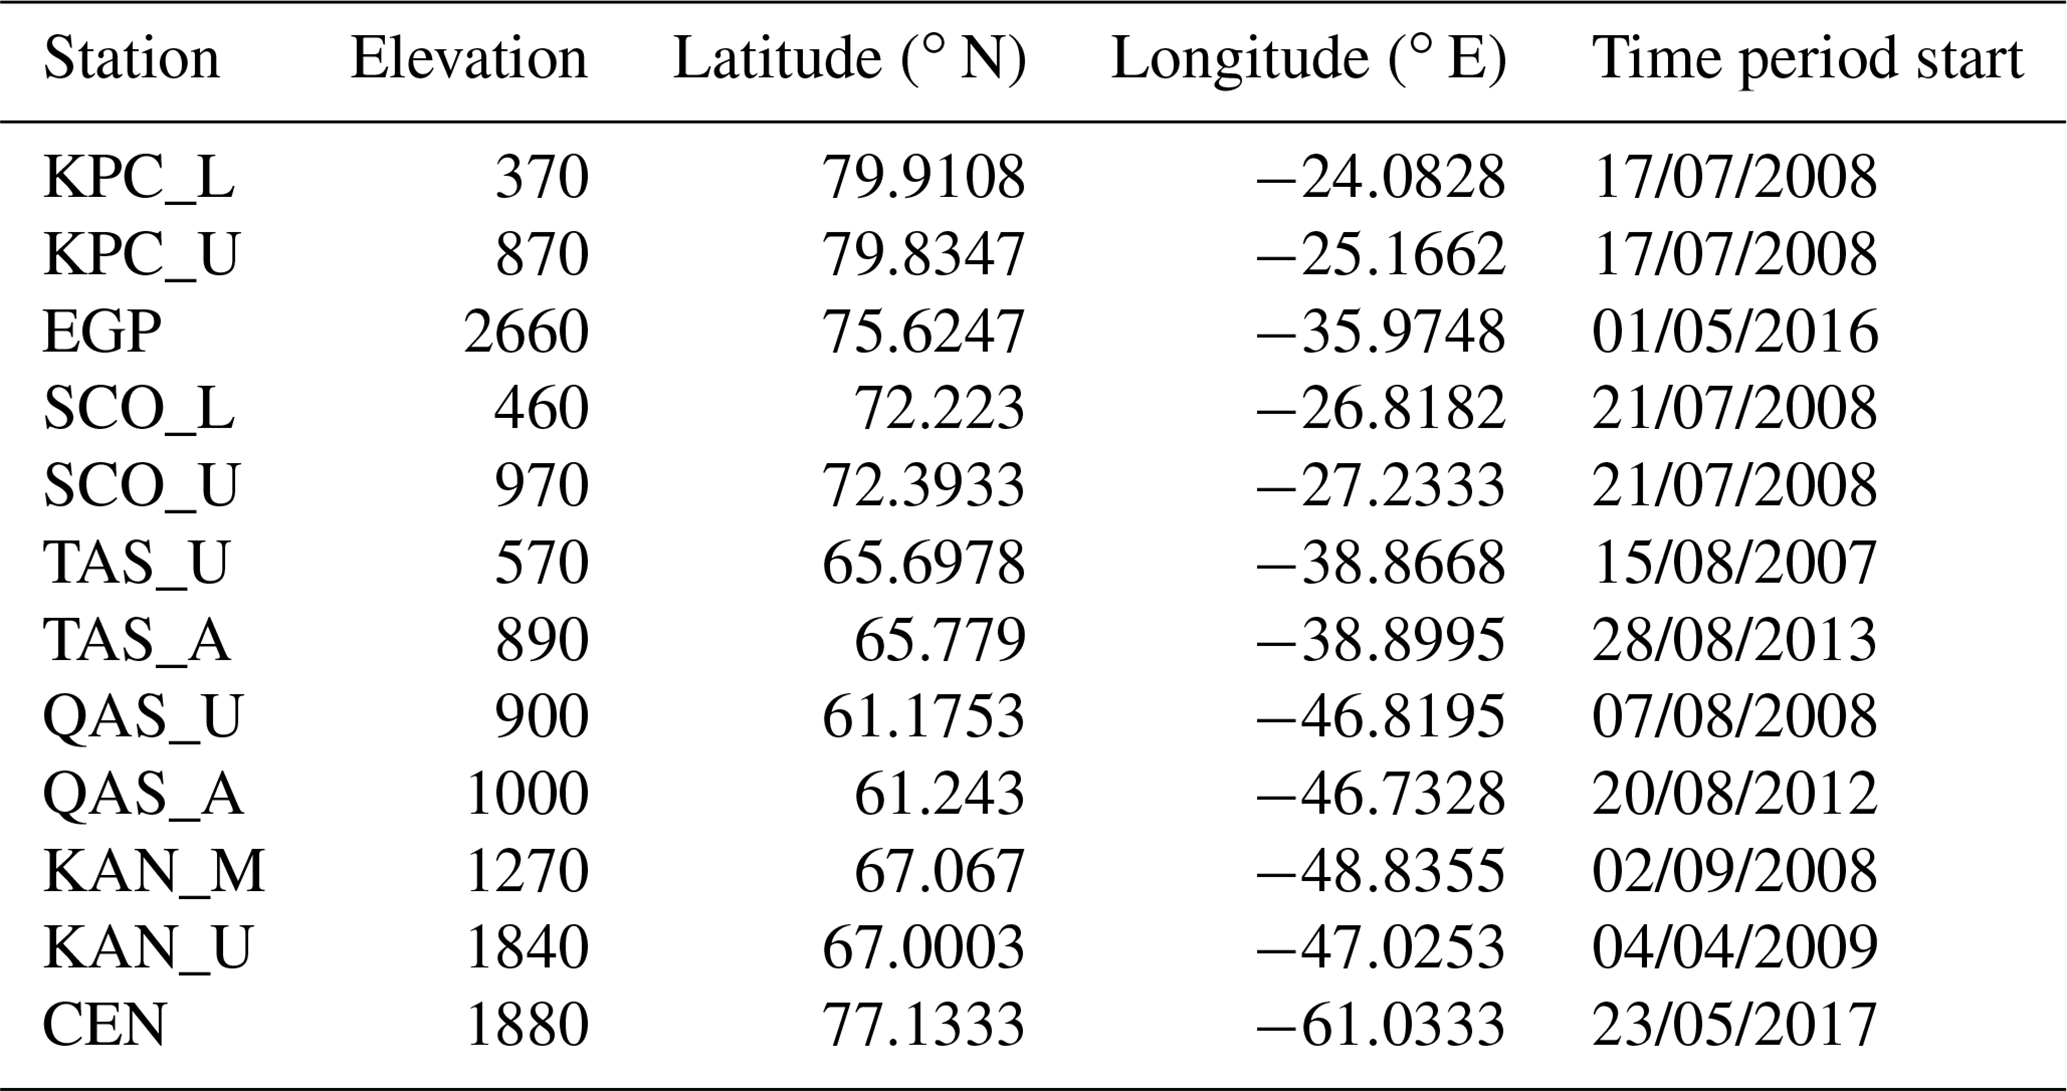
Table 3PROMICE sites serving as reference surface albedo data sources.
4.1 Representativeness
In situ measurements of surface albedo with precision radiometers with continuous maintenance and regular calibrations (as at e.g. the BSRN sites) offer the highest-quality reference data source for validation of satellite-based albedo estimates. However, the spatial footprint of these in situ measurements is of the order of tens to hundreds of metres, in stark contrast to the ∼4–10 km spatial resolution of a single AVHRR–GAC image pixel or the ∼25 km resolution of the grid cells in the aggregated averages. This “point-to-pixel” problem is a well-known challenge in the validation of satellite-based surface albedo as well as other surface parameters which can change rapidly in time and space (Wang et al., 2019). Without knowledge of how well or poorly the point-like measurement represents the area sampled by the satellite imager, it is difficult to assess whether agreements or disagreements between the satellite-based estimate and the reference measurement are indications of retrieval quality or simply manifestations of different measurement targets.
To investigate the impact of the spatial representativeness problem on the CLARA-A3 validation, we applied data from Google Earth Engine's Dynamic World (DW) dataset (Brown et al., 2022). Dynamic World provides continuously updated land cover data from Sentinel-2 at 10 m resolution at a comparable accuracy to ESA World Cover data (Venter et al., 2022). We extracted areas corresponding to 0.25∘/25 km CLARA-A3 grid cells containing BSRN or PROMICE sites from DW. By applying climatological mean albedos for each land cover class after He et al. (2014) and Trlica et al. (2017), we obtained first-order estimates for the “expected” mean blue-sky surface albedo (BAL) in each grid cell in question through simple averaging (applied climatological albedos in the Supplement). While approximative, these estimates allow us to study the difference between the highly localized in situ measurement and its surrounding area, thus providing the means to identify and exclude spatially unrepresentative sites from further analysis. Further, we would expect the CLARA-A3 mean BAL to fall between the in situ and expected values, depending on the accuracy of DW classifications and the validity of the climatological mean albedo for the actual surface conditions in each classified DW pixel. Figure S5 and the associated text in the Supplement describe the results of this analysis for the non-polar BSRN sites.
Out of the 13 examined non-coastal BSRN sites with long-term surface albedo measurements in Table 3, we conservatively classified 4 (ALE, GCR, GVN, and TOR) as being unrepresentative at our resolution, excluding them from the results. The sites which survived the screening are listed in Table 2. Our selection is broadly similar to results from prior assessments of representativeness such as Liu et al. (2017).
For the PROMICE sites in Greenland, the question of point-to-pixel representativeness is complex. For sites close to the ice sheet margins, the surface conditions are notoriously heterogeneous even at short distances from the site (e.g. Ryan et al., 2017). Available means do not allow for robust matching of surface conditions at each PROMICE site's measurement footprint against grid cell (mean) conditions over the decadal span of the in situ data. We therefore elected to simply classify the PROMICE sites according to the coverage of snow and ice in their CLARA grid cell, omitting sites with <90 % snow and ice coverage from further analysis. Table 3 lists the sites used in the validation after the screening.
4.2 Land
With their multidecadal temporal coverage and regular on-site monitoring, the spatially representative BSRN sites are the principal reference data source in this study. To enhance the temporal representativeness aspect of the validation, each site's coordinates were tracked during CLARA-A3 processing and the corresponding clear-sky level-2 (overpass) data were stored. This allowed us to match clear-sky overpasses exclusively with in situ data from the same time periods (15 min windows), ensuring a direct comparison in the temporal domain. The level-2 data contain valid albedo estimates over snow-free land surfaces for each individual overpass, thus also allowing us to examine retrieval accuracy in the GAC-resolution domain in addition to the grid cell domain whose spatial representativeness analysis was discussed above.
Figure 6 illustrates CLARA-A3 BAL bias over the BSRN sites. Figure 6a shows MBE as a function of the SZAs of all matched snow-free level-2 data over the seven sites listed in the figure. A slight tendency to overestimate the in situ albedo at low SZA is contrasted by a similar underestimation at high SZA. The increasing error tendencies towards high SZA justify the applied cut-off of 70∘ for SZA in the satellite observations. Figure 6b illustrates the representativeness relationship in the observed bias; the more similar the grid cell land cover to that being measured at the corresponding BSRN site, the lower the estimation bias in general. Finally, Fig. 6c shows the temporally resolved bias over each site, with annual and summer mean MBEs printed for easier reference. Here, the evaluation includes both snow-covered and snow-free periods, explaining most of the rapid bias variations at sites like FPE which experience seasonal snow cover.
Interestingly, at BOU and BON the summer mean biases are poor predictors of the annual bias. Wang et al. (2014) classified BON as poorly representative at the MODIS resolution level, which is consistent with the high annual bias seen here, although at our coarse grid cell scale the site appears more representative of its surroundings during summer. This variability leads us to conclude that representativeness should always be assessed at the specific resolution and grid cell extent being investigated and that the annual cycles of snow cover and vegetation phenology may produce markedly different estimation biases during different seasons.
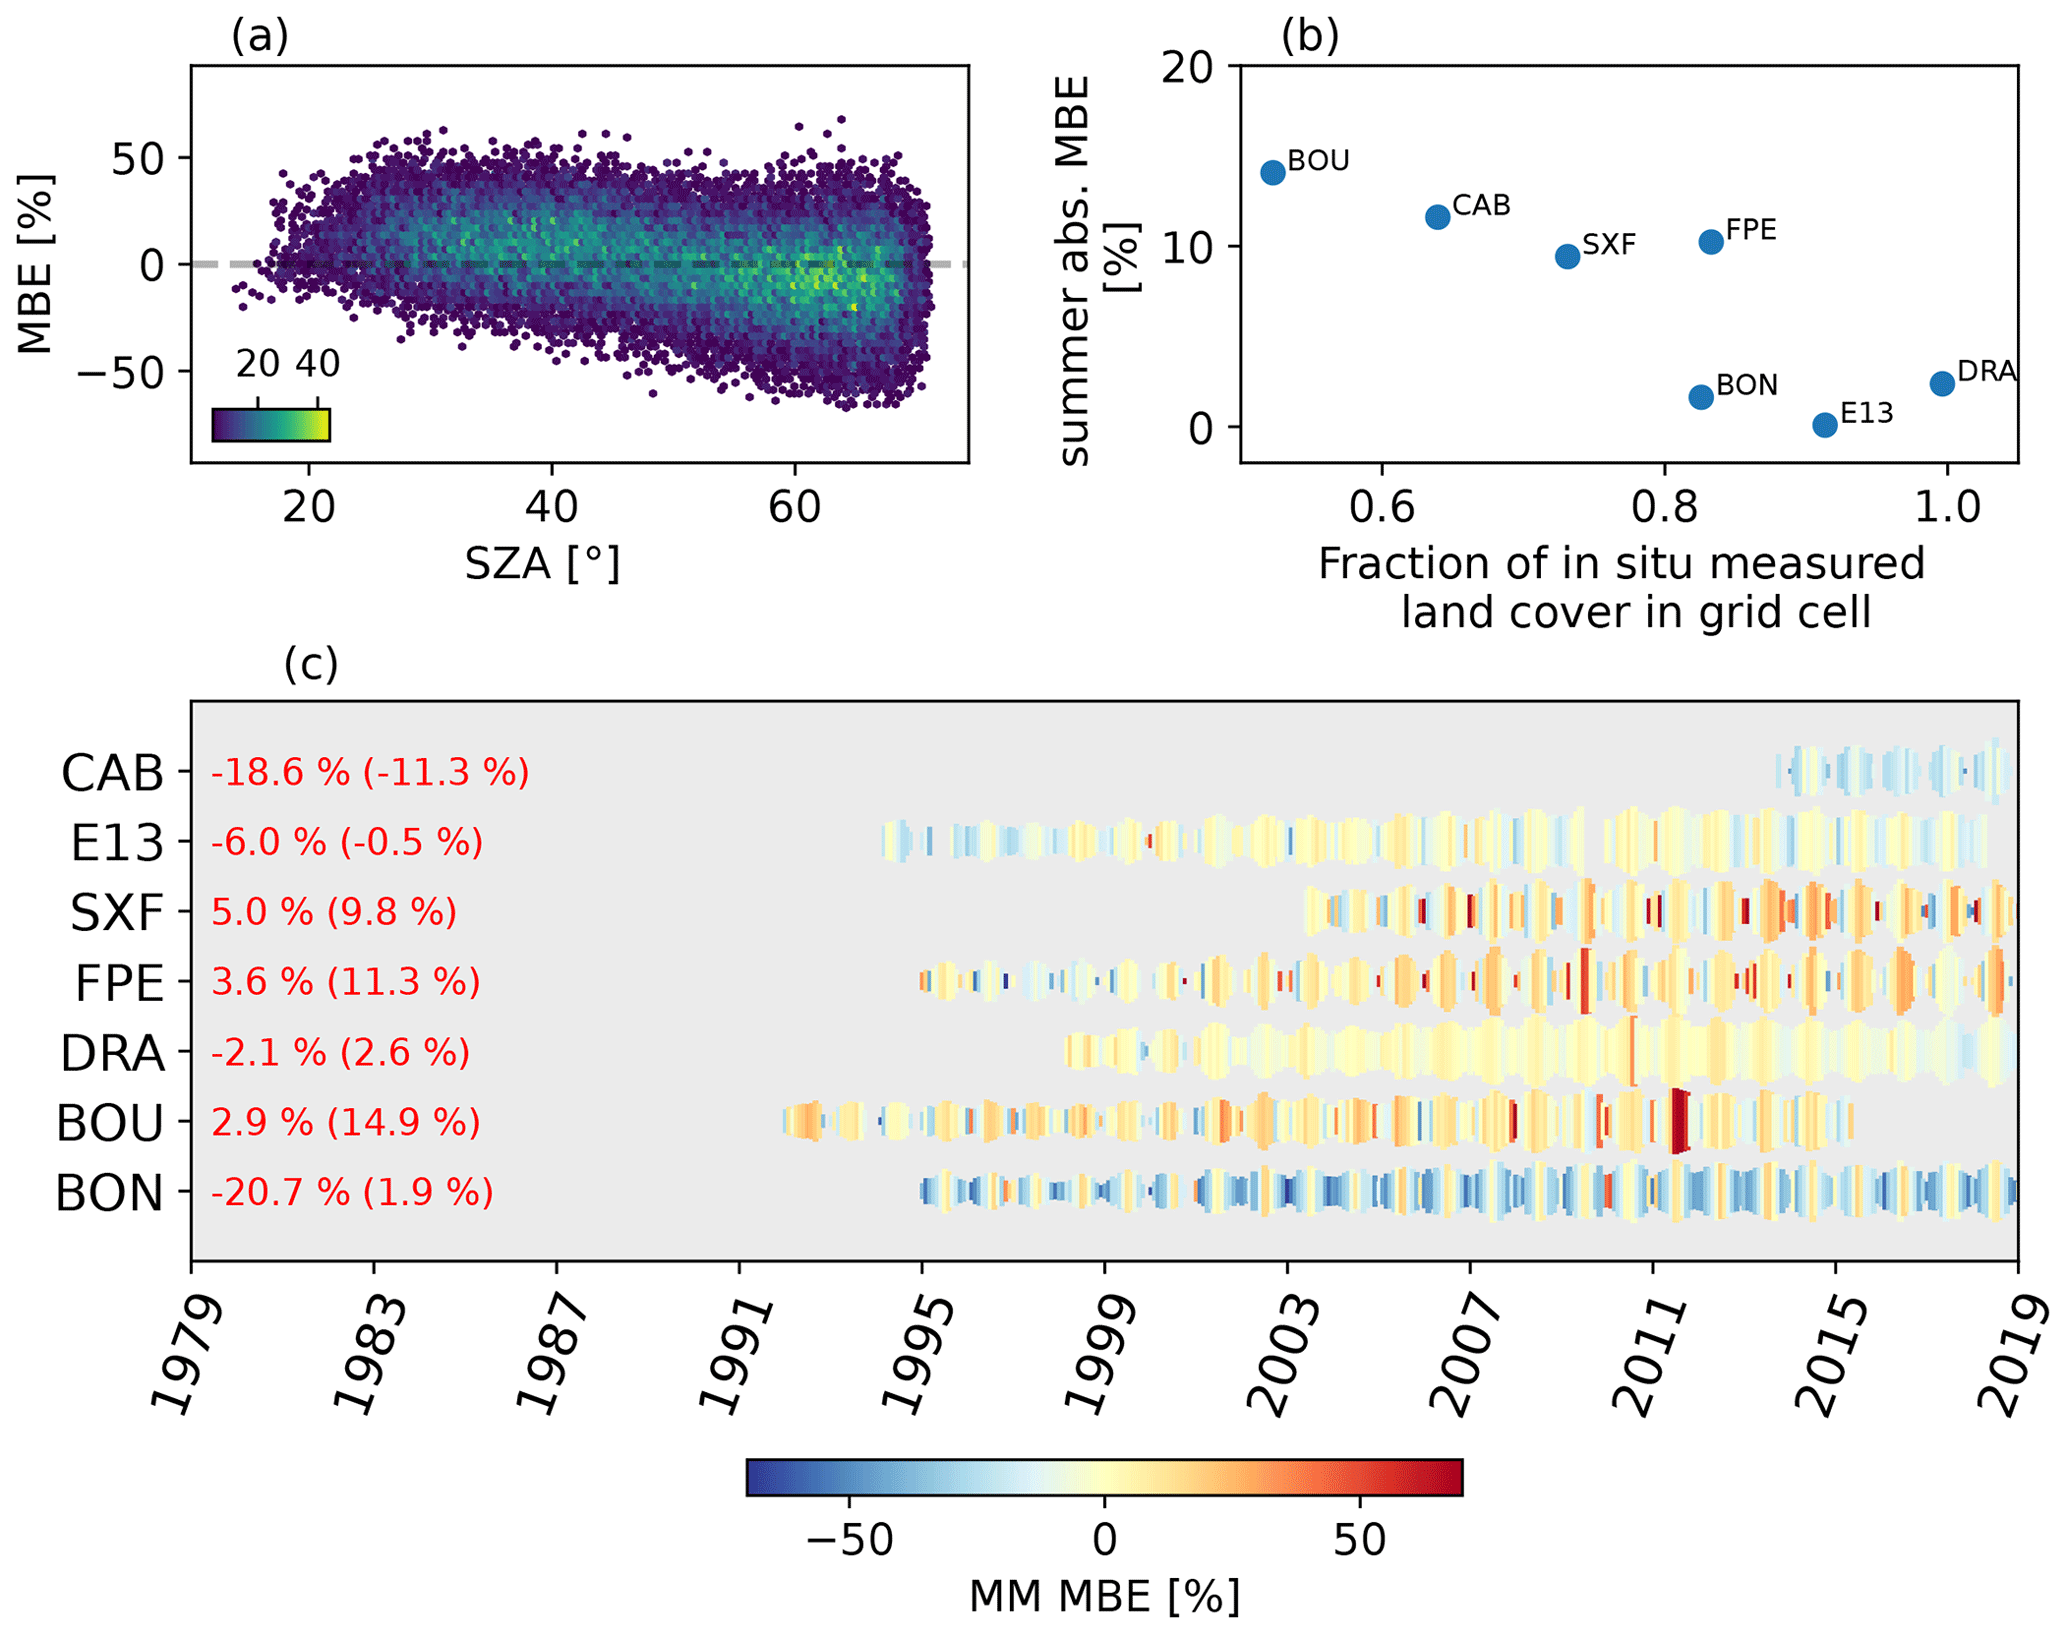
Figure 6(a) Relative retrieval error (MBE) as a function of SZA for all tracked level-2 snow-free BAL estimates over the representative land surface BSRN sites (N=93620). Outliers with more than five occurrences are omitted for clarity. (b) Mean absolute MBE of summer (JJA) CLARA level-3 (i.e. 0.25∘ resolution) data as a function of the fraction of land cover in the CLARA grid cell which matches the land cover being measured at the BSRN site. (c) Monthly mean MBE over the representative BSRN sites through time. The heights of the coloured markers indicate the number of valid clear-sky AVHRR data of each month. The text in red shows the annual mean MBE (summer MBE).
Figure 7 shows the site-averaged bias, precision, and stability for the seven representative BSRN land sites and all three albedo variables at both temporal resolutions (pentad and monthly means). Performance in bias (Fig. 7a) and stability (Fig. 7c) is generally good, as seen in Fig. 6. At CAB, the limited length of available in situ data (only about 6 years) likely affects both bias and stability estimates. Precision (Fig. 7b), quantified through bias-corrected RMSE, is where the “legacy” nature of AVHRR as a sensor and retrieval algorithm limitations combine to produce a performance that is notably, but not unexpectedly, inferior to data from more modern sensors such as MODIS (e.g. Wang et al., 2014). WAL precision tends to be lower than for SAL or BAL, also expectedly as WAL estimates are by nature derivatives of the clear-sky SAL retrievals, with typically higher and more variable biases. It should be noted that the in situ records are filtered separately for illumination conditions consistent with SAL, WAL, and BAL. Therefore, although BAL is a weighted mean of SAL and WAL, its metrics do not necessarily reflect a “midpoint” of WAL and SAL performance.
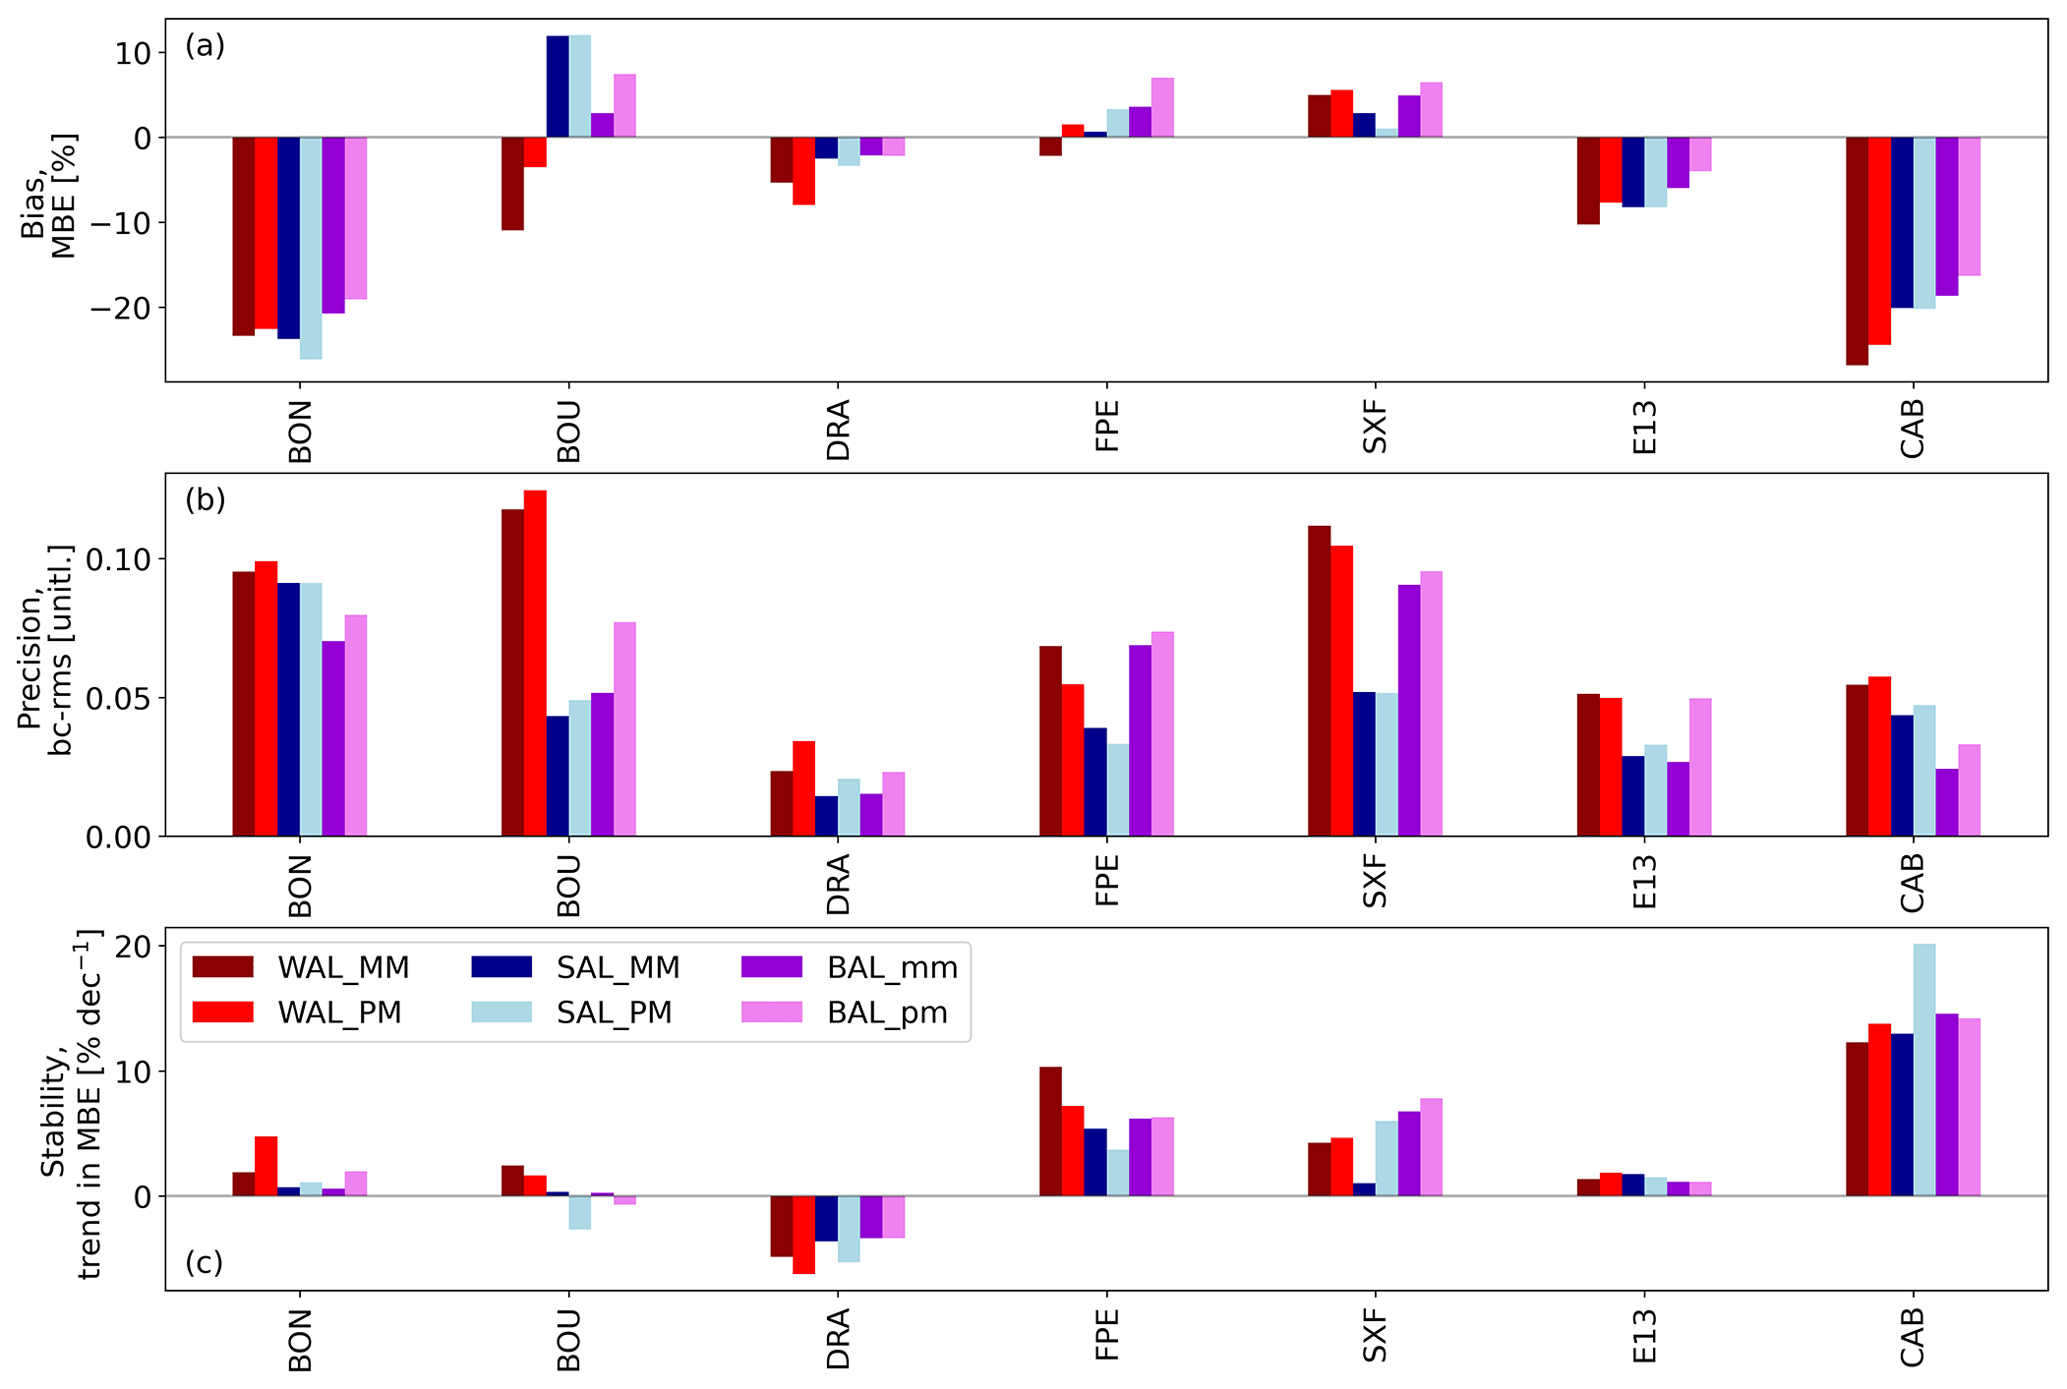
Figure 7Bias (MBE; a), precision (bc-rms; b), and stability (decadal trend in MBE; c) of the CLARA-A3 pentad and monthly mean albedo estimates over the representative BSRN land sites. Red represents WAL, blue SAL, and violet BAL. Dark colours indicate monthly means and light colours pentad means.
Nevertheless, long-term biases are generally stable, implying that the algorithm itself is stable and the AVHRR radiance intercalibration efforts (Karlsson et al., 2023a) have largely been successful during the evaluation period of 1995–2019 despite some issues in the latest years (details in the Discussion section). Figure 8a and b further illustrate retrievals against BSRN observations at the E13 and FPE sites, showing generally good consistency and stability throughout the coverage period.
Table 4Summary statistics for the evaluation categories and metrics of CLARA-A3 SAL, WAL, and BAL (respectively). Values shown are the means over all the valid reference data in each category. NA – not available.
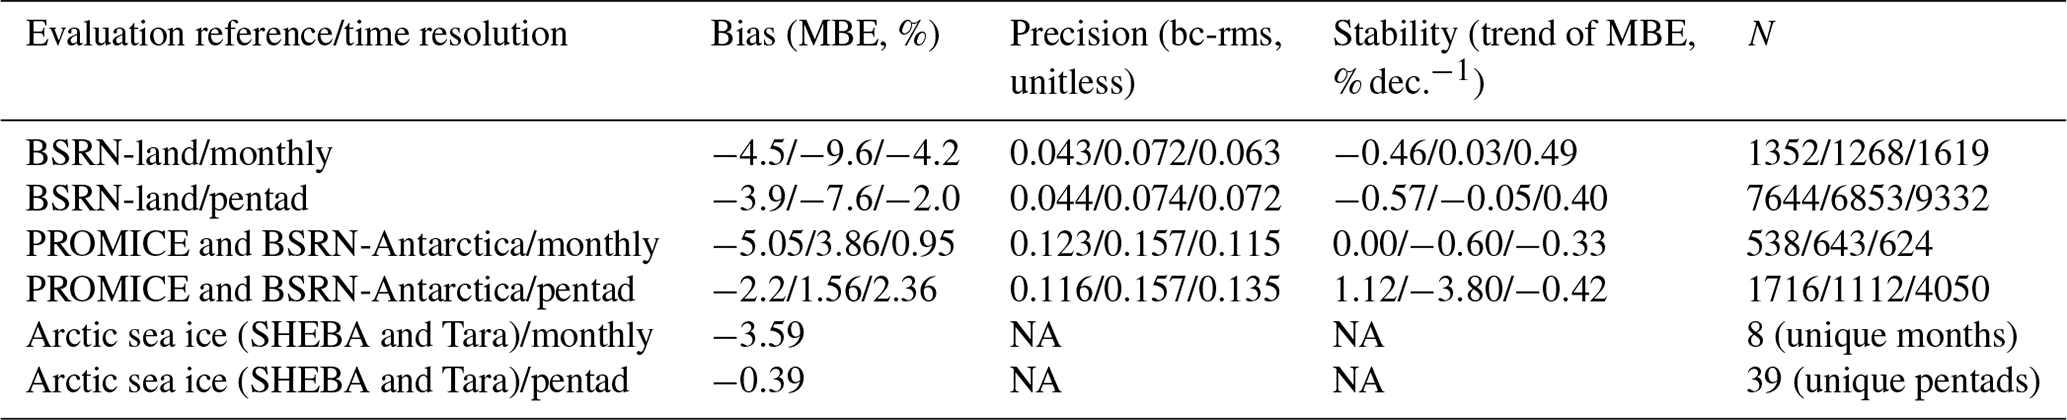
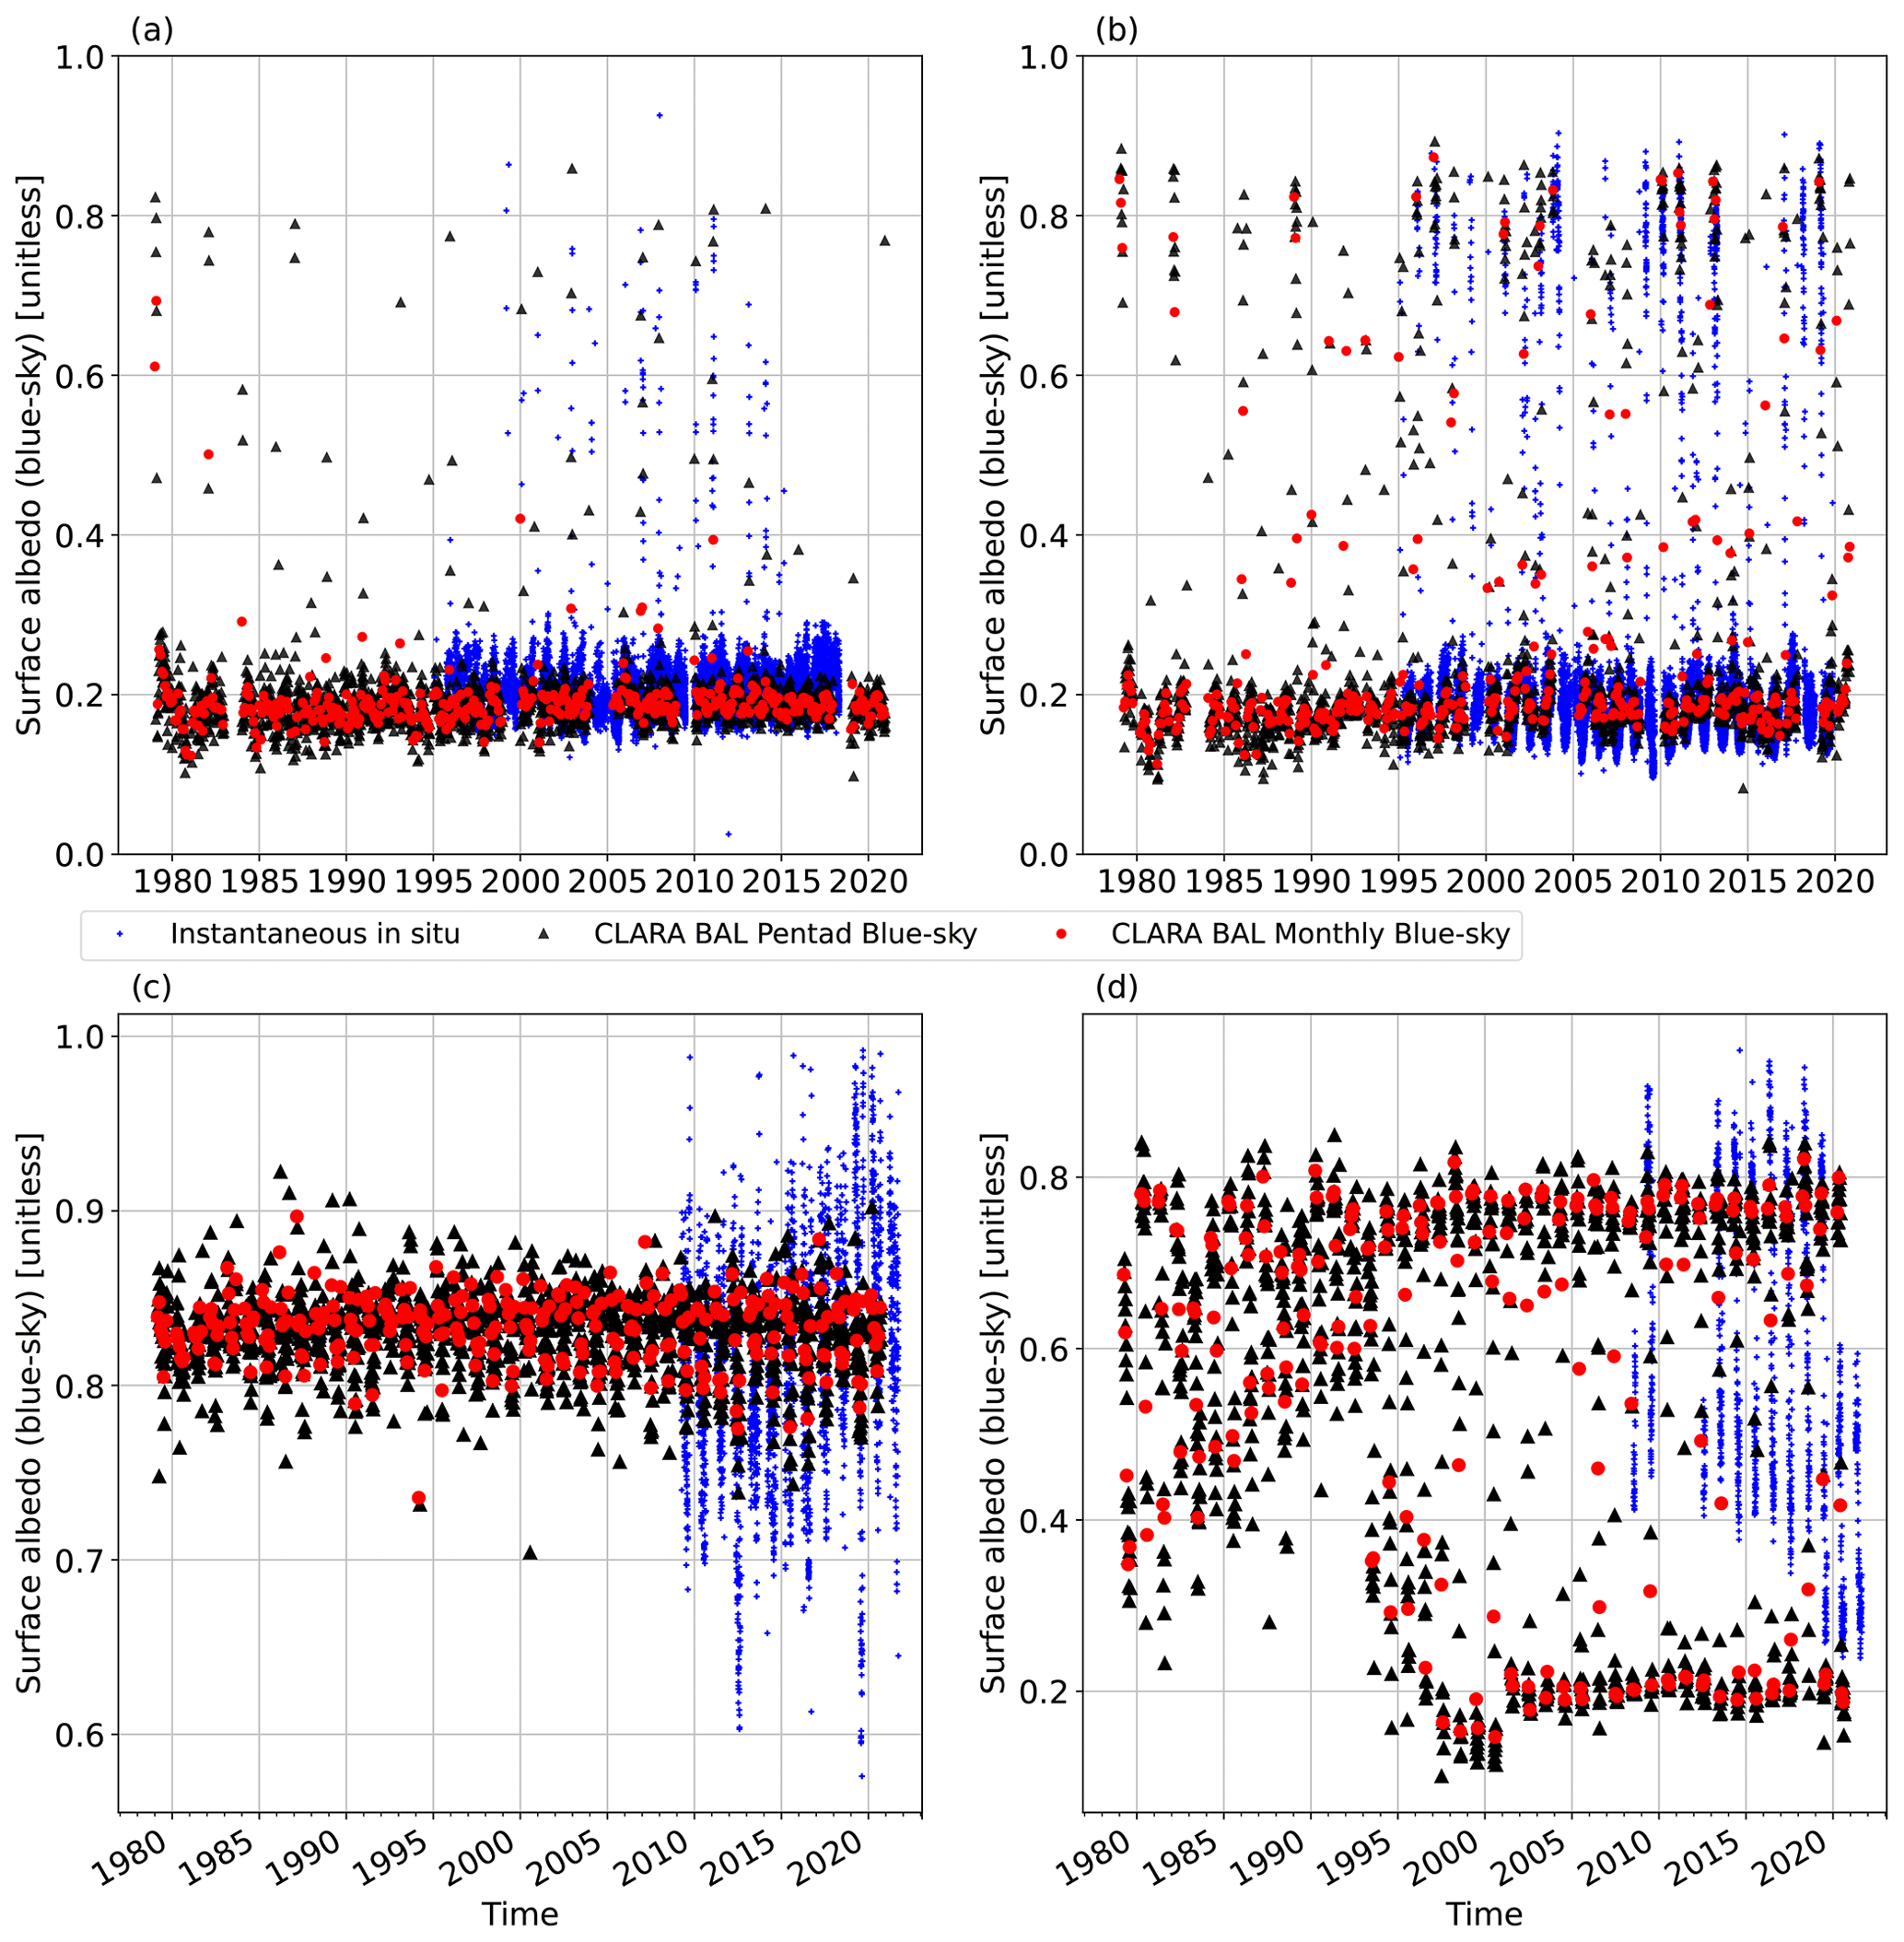
Figure 8Retrieved CLARA-A3 monthly means (red circles) and pentad means (black triangles) of BAL over the BSRN sites E13 (a) and FPE (b) as well as PROMICE ice sheet sites KAN_U (c) and KPC_L (d). Blue markers indicate in situ measured blue-sky albedos at sub-daily (BSRN) or daily (PROMICE) resolutions.
We next turn to the evaluation of retrieval accuracy over the cryospheric domain, which has been a prime application area for preceding CLARA albedo datasets.
4.3 Greenland Ice Sheet and Antarctica
Validation over the terrestrial cryospheric domain is focused on two in situ data sources: the PROMICE sites on the Greenland Ice Sheet and the Syowa (SYO) and South Pole (SPO) BSRN sites in Antarctica. Figure 8c and d show retrievals against in situ measurements at KAN_U and KPC_L as examples. KPC_L, being close to the ice sheet margin, exhibits very large variability in both in situ measured and satellite-retrieved blue-sky albedo. In particular, the late-summer CLARA retrievals result in very low surface albedo in the 25×25 km grid cell and marked underestimations against in situ observations, although we note that intensifying melt seasons also create a decreasing trend in the locally measured albedo towards the end of the analysed period. In contrast, the KAN_U site shows better stability due to better spatial representativeness and much more limited surface melt.
Figure 9 illustrates the mean performance metrics over these sites for the temporally aggregated WAL, SAL, and BAL. The overall picture is similar to the preceding BSRN analysis, with variable but generally low biases (Fig. 9a) and good stability (Fig. 9c). However, in precision (Fig. 9b), the performance is markedly lower regardless of the albedo variable being estimated, with the exceptions of sites deep within ice sheet interiors (CEN, EGP, KAN_U, SPO), where snow surface conditions have thus far remained primarily stable with minimal or no seasonal melt.
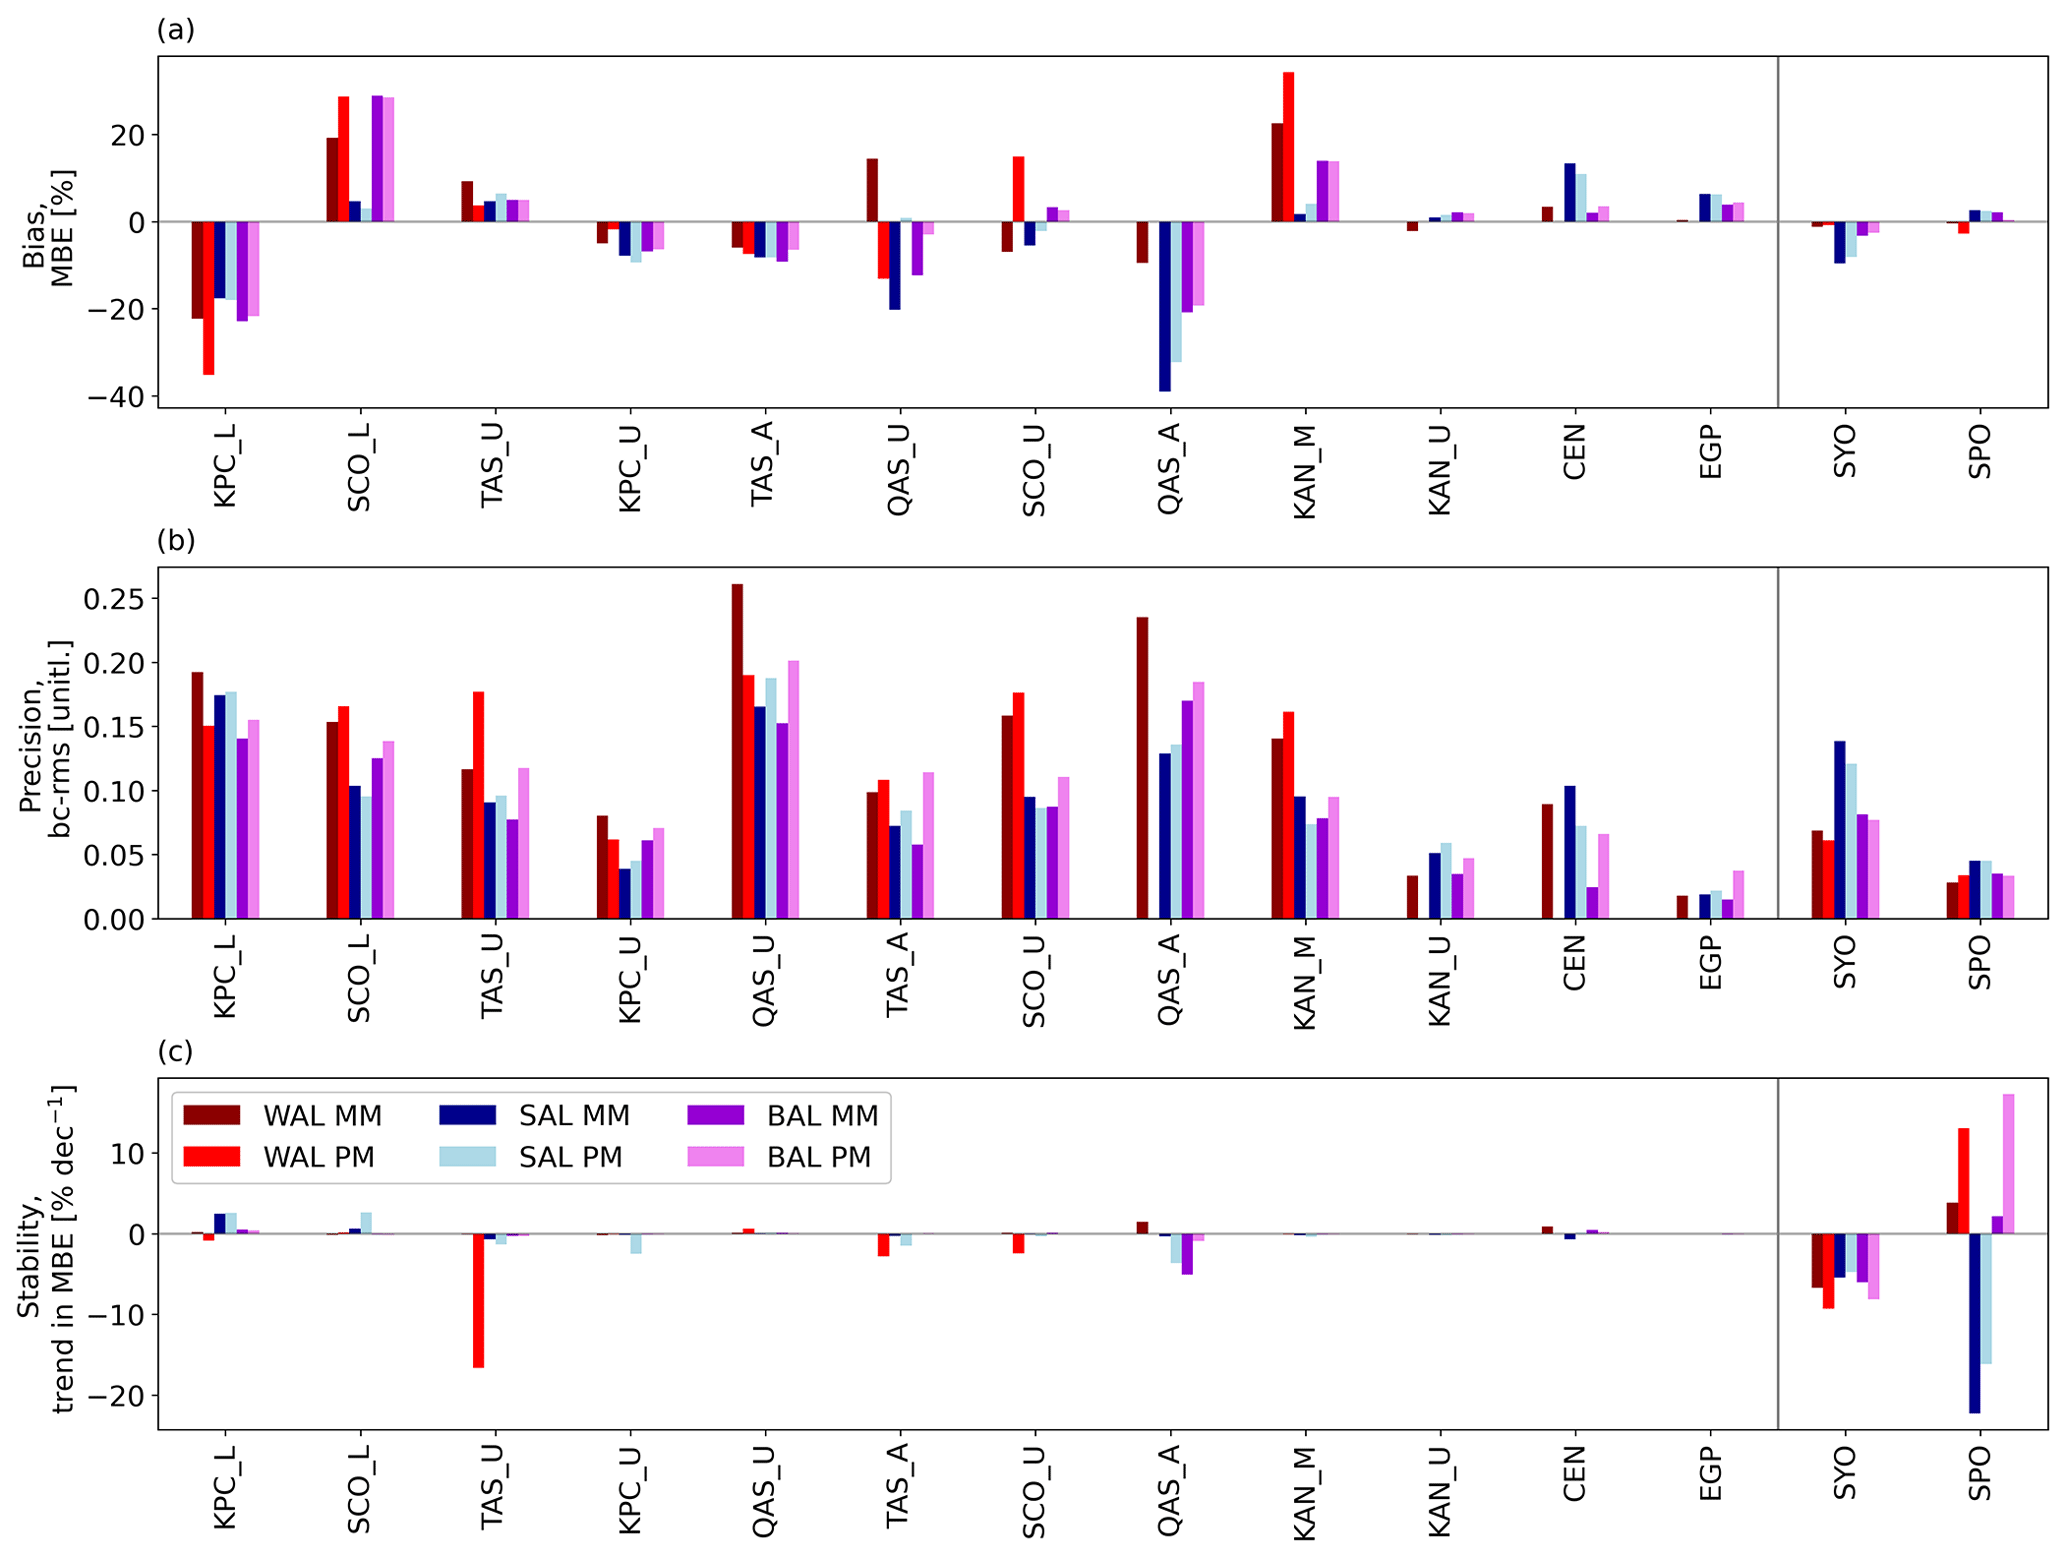
Figure 9Bias (MBE; panel a), precision (bc-rms; panel b), and stability (decadal trend in MBE; panel c) of the CLARA-A3 pentad and monthly mean albedo estimates over the PROMICE and BSRN snow or ice sites. Red represents WAL, blue SAL, and violet BAL. Dark colours indicate monthly means and light colours pentad means. SAL stability for EGP is not shown due to a very low number of available samples. The vertical grey line separates the PROMICE and BSRN sites.
For stability, TAS_U, SYO, and SPO stand out for specific reasons. Singular pentads with large errors affect the WAL PM stability at TAS_U markedly. At SYO, located on East Ongul Island off the Antarctic mainland, notable breakups of land-fast ice in the area in 2016 (Aoki, 2017) and again in 2017 (Nakamura et al., 2022) led to underestimations of in situ albedo at the grid cell scale. While these disturbances are sufficient to produce a notable trend in bias, we note that they are not statistically significant at the 95 % confidence interval. At SPO, the diffuse and direct illumination requirements for WAL and SAL matching led to very different samples of in situ observations, with WAL matchable only after the year 2000. As the measured albedo at the site had been notably low during 1995–1999 (∼0.8, typical mean of ∼0.85–0.9 afterwards), SAL had overestimated during the early part of the validation period. As this bias returned to low levels after 2000, a considerable negative trend in SAL bias was produced as a result. Figure S6 further illustrates MBEs as scatter plots over PROMICE sites and BSRN sites during snow cover periods.
4.4 Arctic sea ice
Over sea ice, we based the validation on reference data from two field campaigns which have provided in situ albedo measurements spanning a full Arctic summer season when satellite-based estimates are viable: SHEBA data cover the Arctic summer of 1998, and Tara-Arctic observations cover the summer of 2007. The recently concluded Multidisciplinary drifting Observatory for the Study of Arctic Climate (MOSAiC) campaign is not considered here as its data are not yet available. The observations from SHEBA and Tara-Arctic were of different designs: during SHEBA, albedo was measured on transects several hundred metres long, ensuring good spatial coverage but being temporally available only every few days. During Tara, measurements were at a single site but with continuous temporal coverage throughout the summer. Both ice camps drifted across the Arctic Ocean during their duration, resulting in the need to continuously update the CLARA grid cell matchups with the reference data geolocation. As coincident surface albedo coverage from satellites is limited to a single summer for both campaigns, we only evaluate bias and not precision or stability.
Figure 10 shows the in situ measured surface albedos and their corresponding CLARA-A3 estimates from the relevant grid cells over the Arctic Ocean. As described earlier, for SHEBA (Fig. 10a) the mapping is CLARA-based, with the transect locations during each CLARA pentad being matched with the grid cell containing them. For Tara (Fig. 10b), the mapping is based on finding the CLARA grid cell containing the ice camp separately for each hourly observation. This difference explains the enhanced smaller-scale variability in BAL estimates against Tara observations; the bias itself is of course also affected by the point-to-pixel evaluation itself. Nevertheless, the mean bias appears low against both in situ data, although the variability in the bias is considerable owing to the point-to-pixel challenges combined with the highly dynamic surface conditions over sea ice in the melting season. The CLARA estimates display a mean variation range between black- and white-sky albedos of 0.05–0.06, in accordance with the prior literature (Key et al., 2001). As expected, during the cloudy Arctic Ocean summers the BAL estimates typically tend towards WAL rather than SAL.
The comparison shown focuses on pentad means which are more capable of tracking the progress of summer melt across the sea ice zone. A similar evaluation of the monthly mean against Tara observations (Fig. S7) shows the development of a marked underestimation (10 %–15 %) during early summer as a result of the ice camp drifting into grid cells whose monthly mean conditions no longer matched local conditions at the measurement site. Likewise, the underestimation of BAL against SHEBA albedo in August is a persistent feature since CLARA-A1 and most likely reflects point-to-pixel comparison issues given that e.g. cloud screening has been enhanced in the current albedo processing scheme.
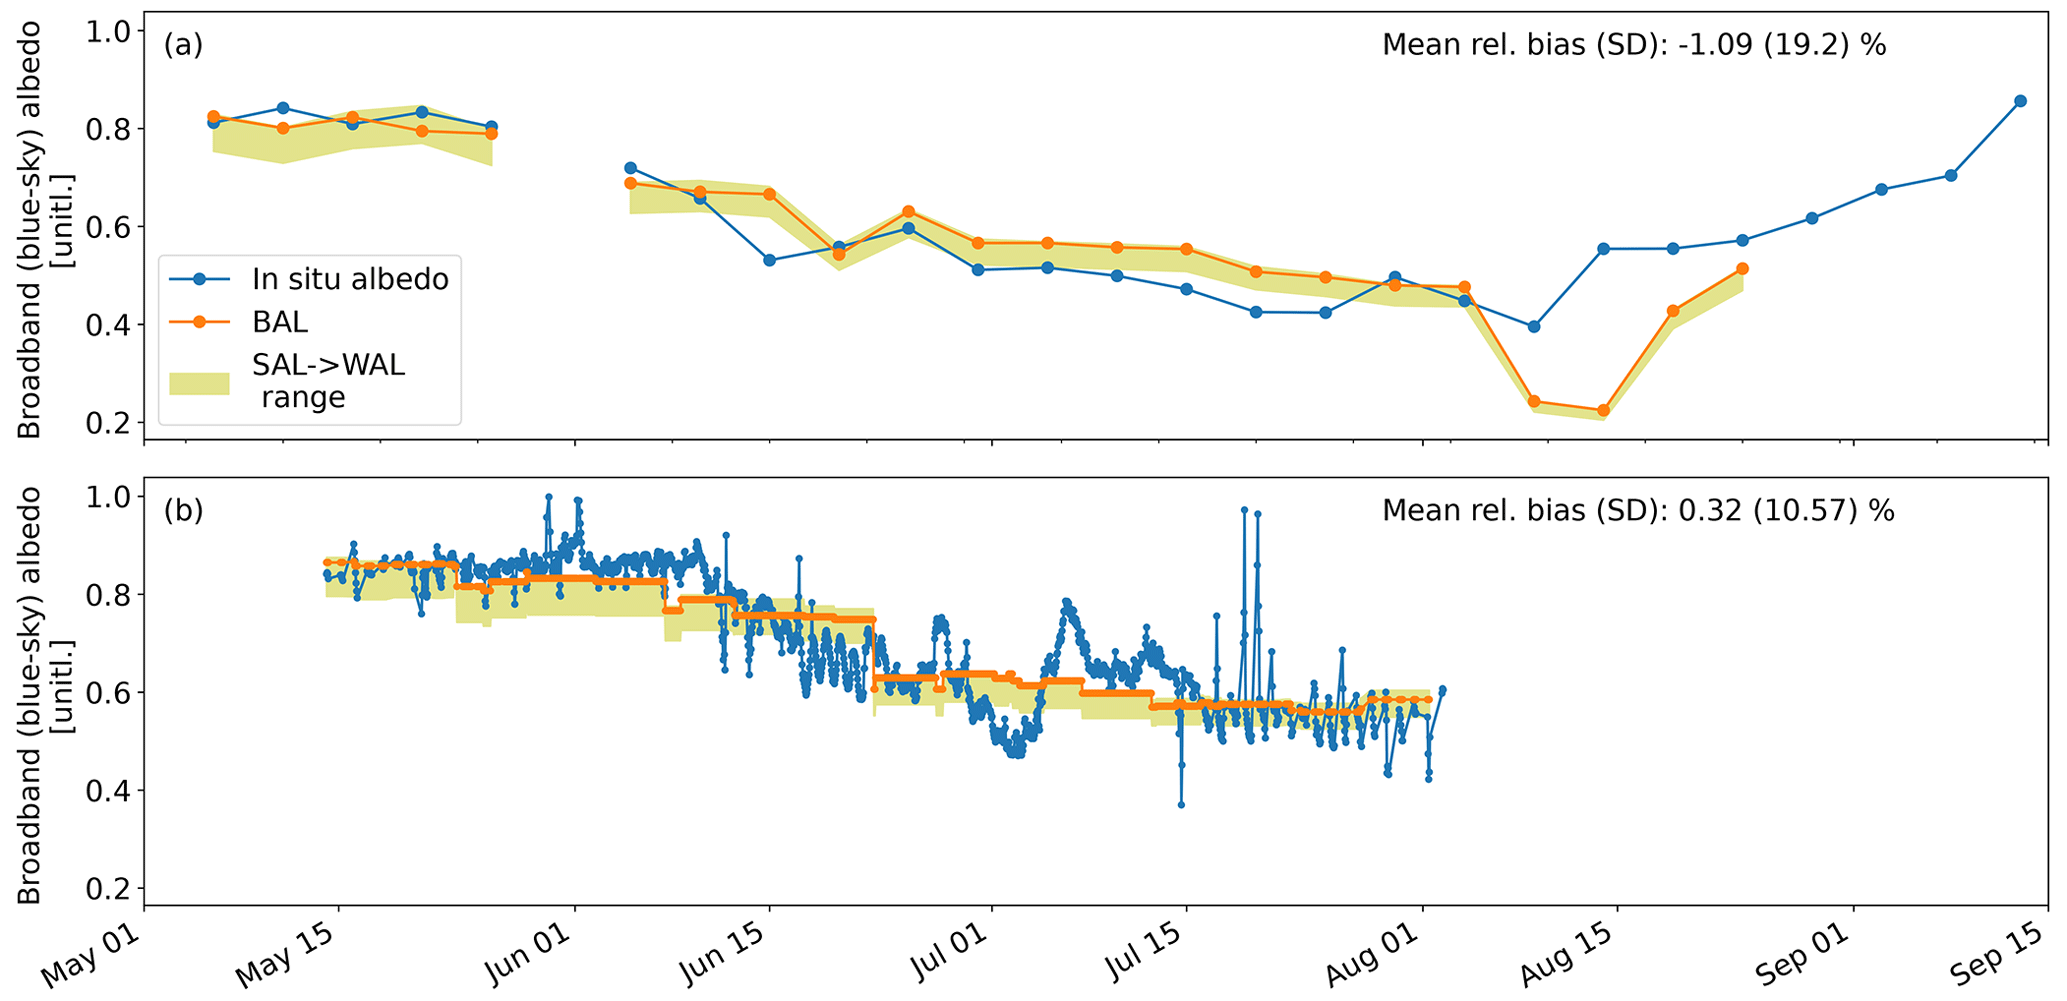
Figure 10In situ measured surface albedo of Arctic sea ice (blue) and the corresponding grid-cell-scale 5 d CLARA-A3 estimates (orange) for the (a) SHEBA expedition during summer 1998 and (b) for the Tara-Arctic expedition during summer 2007. The yellow shading illustrates the range between the associated grid cell's black-sky and white-sky CLARA albedo estimates for each sampled period.
Table 4 summarizes the results of the evaluation against in situ observations for the three albedo quantities. Regardless of the applied reference data, the bias is generally low (<10 % relative) and its decadal stability is good (<1 % dec.−1), except for SAL and WAL against BSRN-Antarctica. Conversely, precision is low for both the BSRN and PROMICE evaluations, although likely with a substantial contribution from point-to-pixel comparison issues as discussed earlier. We note that SAL performance is fully comparable with the predecessor data records CLARA-A1 and CLARA-A2, with similar performance now found for the new WAL and BAL estimates.
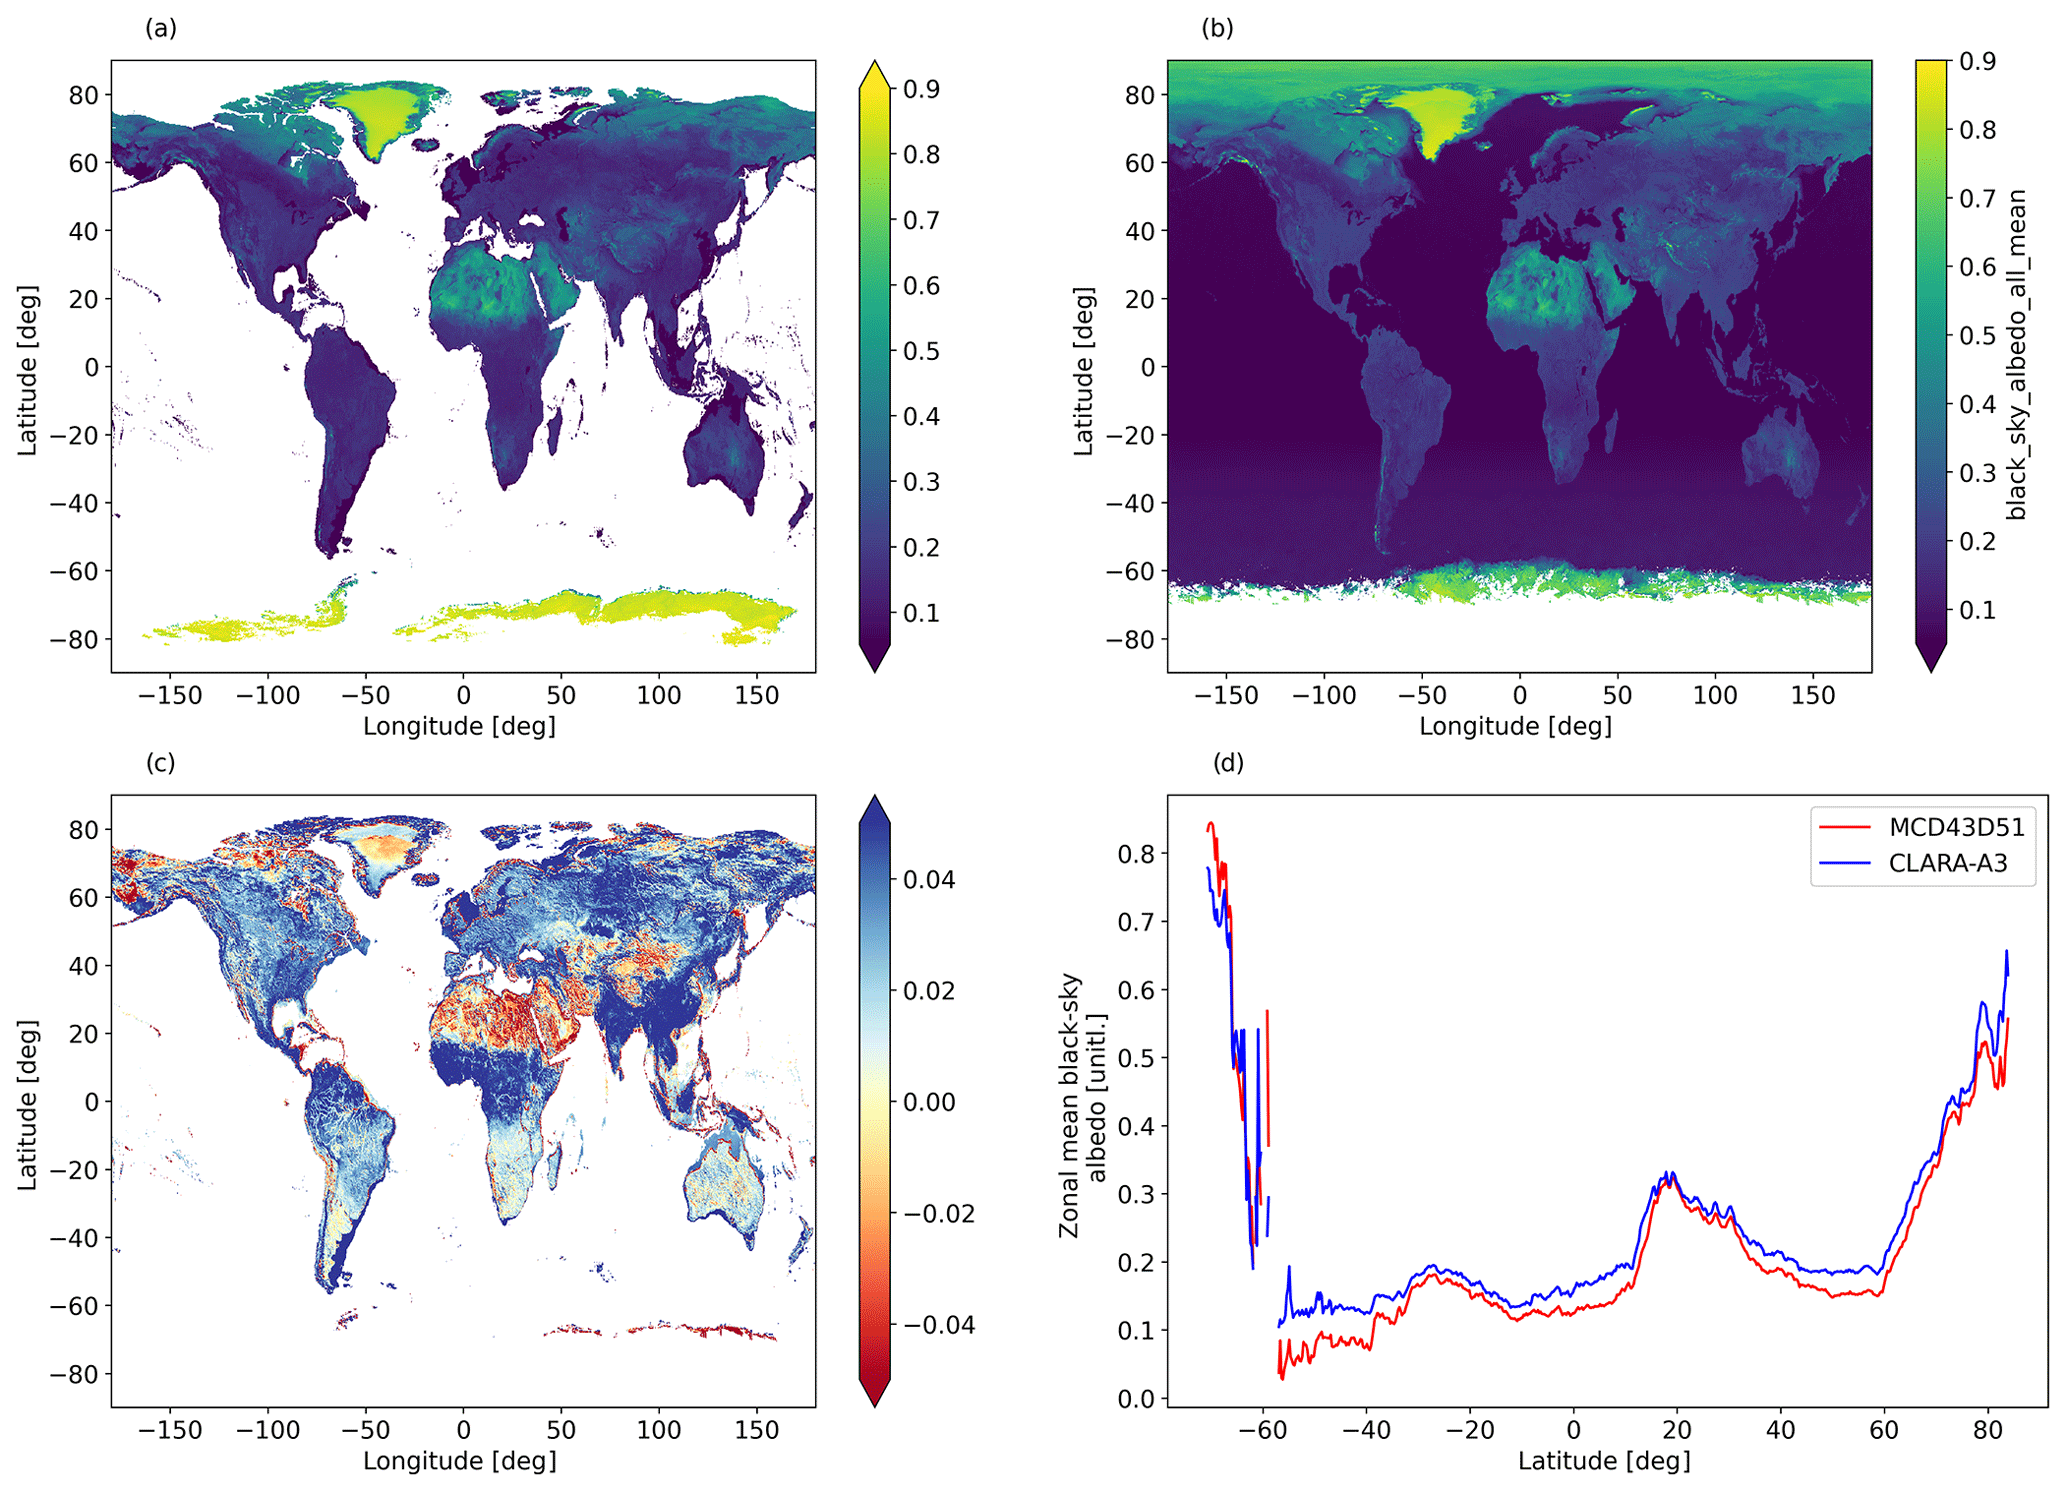
Figure 11Intercomparison of CLARA-A3 and MCD43D51 black-sky albedo estimates. The data shown correspond to the mean of April–September 2015. (a) MCD43D51, (b) CLARA-A3, (c) difference (CLARA-MCD43), and (d) zonal means of MCD43D51 and CLARA-A3.
To place the newest CLARA CDR on surface albedo in context, we carried out an intercomparison between it and two other surface albedo data records: the MODIS-based MCD43 (Collection 6.1; Schaaf and Wang, 2021) and the predecessor CLARA-A2 (Karlsson et al., 2017). The intercomparison considered black-sky albedo data between April and September 2015 from all the sources. The MODIS data are provided daily at 0.01∘ resolution and normalized to local solar noon conditions, requiring preprocessing to match the coarser CLARA estimates. MODIS albedo estimates were first quality-screened, accepting only the full inversion retrievals. The data were then bucket-resampled to the 0.25∘ CLARA grid and aggregated into monthly means. Then, both CLARA-A3 and MODIS aggregates were re-normalized to a common SZA of 60∘ using GLOBCOVER land cover data and the equation of Briegleb et al. (1986).
Figure 11 displays the intercomparison between MCD43 and CLARA-A3 as the period mean. In general, CLARA-A3 retrieves higher albedo over broadleaved (tropical) and deciduous forests, with croplands, grasslands, and shrublands being very similar to MCD43. Conversely, MCD43 albedos over barren and desert regions are higher than for CLARA-A3. These differences are highly similar to the those observed when comparing CLARA-A1 with MCD43 (Riihelä et al., 2013). Given the advances in CLARA retrievals and input data over the editions, it now seems likely that the differences are mainly attributable to core differences in the atmospheric and angular isotropy correction models used in these records. Indeed, the comparison between CLARA-A3 and its predecessor CLARA-A2 over the same period (Fig. S8) displays relatively close agreement, although we note that CLARA-A3 black-sky albedos over land and snow or ice surfaces are generally larger than in CLARA-A2. In particular, pre-melt Arctic sea ice and snow surfaces are now brighter by 0.02–0.05 on average. Interestingly, Antarctic sea ice is now dimmer in CLARA-A3, although the snow cover of Antarctica is slightly brighter in CLARA-A3 than in CLARA-A2. Given that the retrieval gives equivalent treatment to Arctic and Antarctic sea ice, it is likely that either cloud screening or the updated atmospheric composition from ERA5 plays a role in the change.
For a closer, spatiotemporally resolved look at the intercomparison, Fig. 12 shows the CLARA-A3 monthly means arrayed against corresponding MCD43D51 grid cell by grid cell during March–October 2015. Furthermore, panels b–e display the retrieved black-sky albedos over a selection of sites used in the CLARA-A3 validation. The results reflect those of Fig. 11, with CLARA-A3 typically retrieving higher black-sky albedo than MCD43 over vegetated land surfaces with albedo in the 0.1–0.25 range.
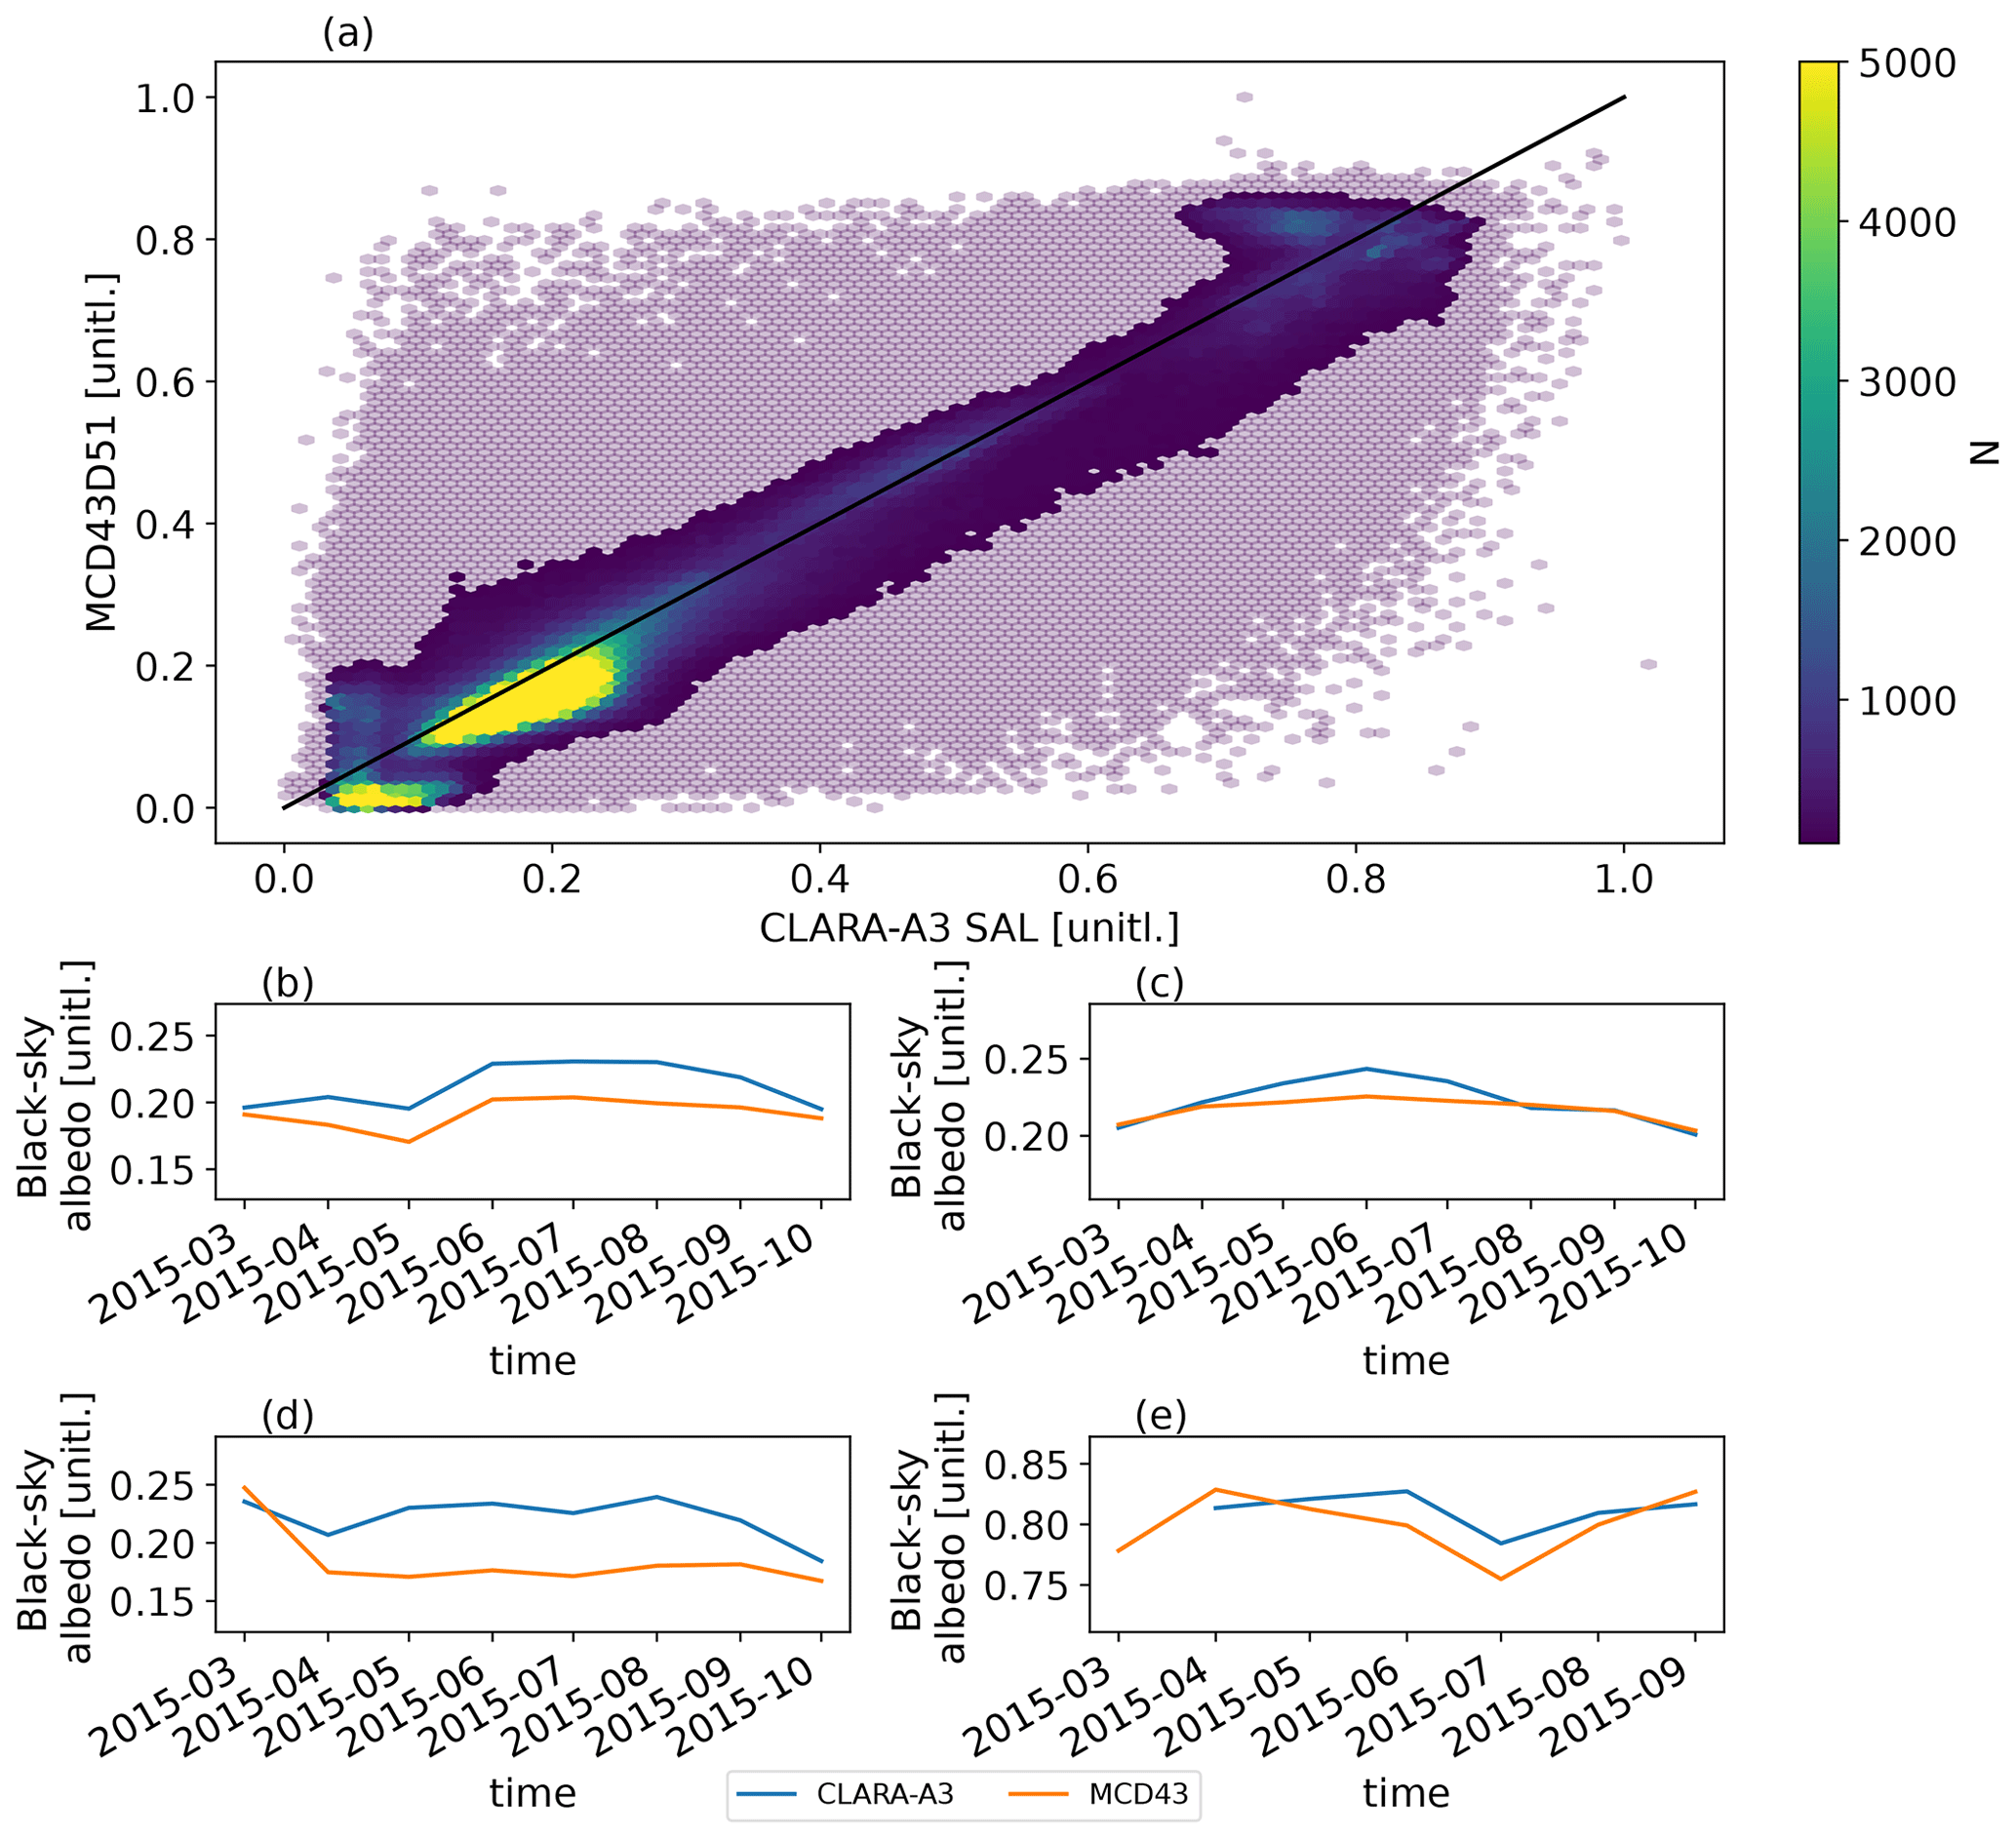
Figure 12(a) Density-coloured (semi-transparent for N<100) scatter plot of CLARA-A3 SAL monthly mean black-sky albedo (x axis) versus MCD43D51 (y axis) during March–October 2015 and time series representations of monthly mean black-sky albedo retrievals at selected BSRN and PROMICE sites (b) E13, (c) DRA, (d) BOU, and (e) CEN (ice sheet).
The surface albedo data record in CLARA-A3 has been shown to match or improve upon its predecessors in performance when evaluated against in situ observations or compared against other surface albedo data records. However, the data record also has its limitations. First, the relatively coarse spatiotemporal resolution requires careful consideration when applying the data to study any small-scale or rapid phenomena impacting albedo. Second, as discussed in Karlsson et al. (2023a), the intercalibration accuracy for AVHRR radiances from the newest sensor-carrying satellites such as Metop-C is likely lower for the last years of the CDR (2019 and 2020). While the impact manifests only partially in the albedo estimates where all available AVHRR observations are always used in unison, users are advised to consider 2019 and 2020 as having larger-than-normal retrieval uncertainty. Third, some periods of the record exhibit minor artefacts resulting from malformed AVHRR source data. During the early period of the CDR (pre-1990), some individual grid cells poleward of the SZA cut-off contain albedo estimates; these result from incorrectly geolocated AVHRR observations being placed there. Similarly, grid cells at the dateline in a few of the North Pole albedo subsets during spring may show anomalous estimates, likely from erroneous geolocations in source AVHRR data.
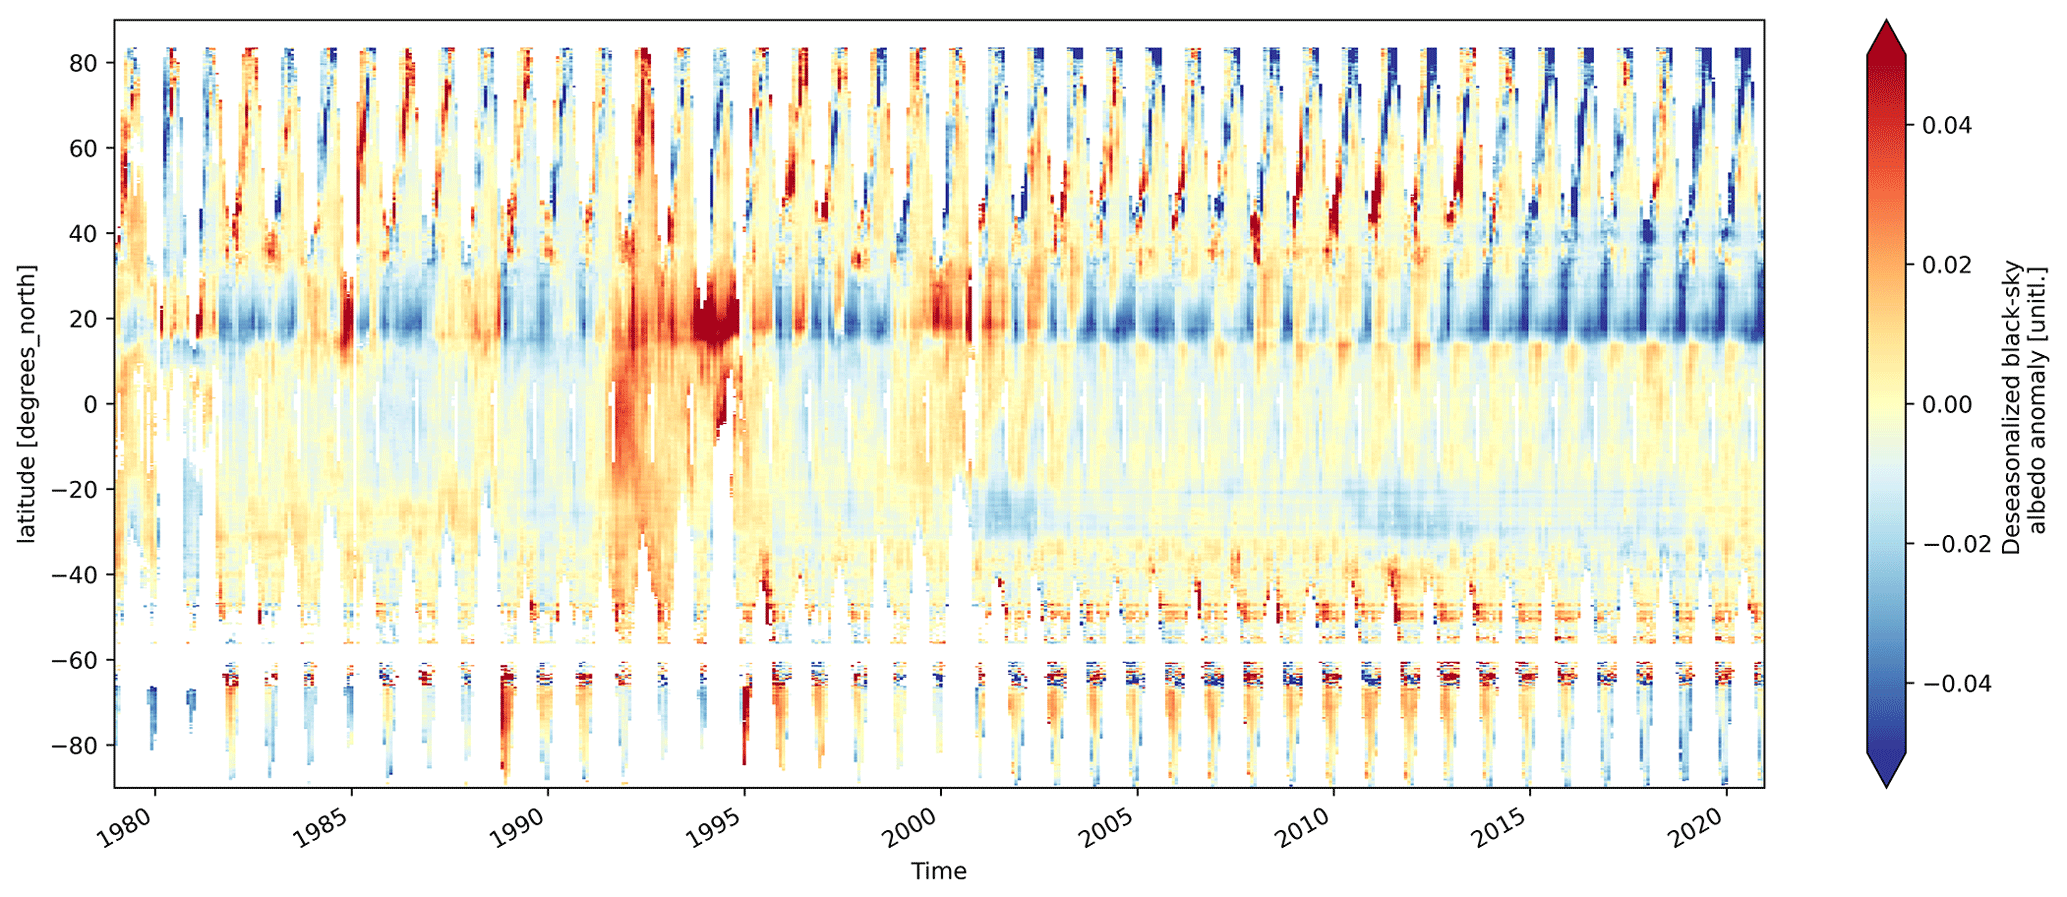
Figure 13Deseasonalized zonal monthly mean black-sky surface albedo anomalies against the 1982–1998 mean. Data are shown only for land and snow surfaces with >85 % zonal coverage during the evaluated month.
For the accuracy of the albedo data record (and trends therein), it is crucial to base the retrievals on an accurately intercalibrated AVHRR radiance data record. The high decadal stability over validation sites in CLARA-A3 albedo (Figs. 7 and 9) suggests that the radiances, the atmospheric composition inputs, and the retrieval algorithm itself are now generally stable, although the issue is likely different over regions with e.g. high and variable aerosol loading (see the VR for details).
We may also examine the stability of the CDR time series through visualization of deseasonalized anomalies against a reference period (1982–1998). Figure 13 illustrates these zonal mean anomalies for black-sky albedo across the CLARA-A3 CDR coverage. The reference period and figure style are chosen to resemble Fig. 11 of Riihelä et al. (2013) for easy comparison with CLARA-A1. Relative to CLARA-A1, the application of observation-based aerosol data and the robust ERA5-based atmospheric composition in CLARA-A3 clearly reduce mid-latitude albedo anomalies, although the impacts of the Mt. Pinatubo eruption of 1992 remain only partly compensated for. Over the polar regions, the associated positive albedo anomalies in 1992 may be physically motivated, as the stratospheric cooling following the eruption may well have favoured a cooler summer with inhibited surface melt, although assessing the atmospheric surface-level response to volcanic excitation remains challenging due to the internal variability of the climate models (Polvani et al., 2019). After 2015, the lack of variability in mid-latitude anomalies reflects the use of an aerosol climatology, although the polar anomalies of this period are fully consistent with observed gains and losses in polar snow and sea ice cover.
A principal design choice for CLARA albedo records has been the selection of 5 d of aggregated data (a pentad) as the shortest user-delivered temporal resolution. The implication here is that CLARA records cannot capture rapid surface albedo changes at shorter temporal scales. However, it has been shown that, when aided by fitting functions, CLARA pentad data are sufficiently well-resolved to study e.g. melt onset and progress effects on snow albedo (e.g. Anttila et al., 2018; Kouki et al., 2019). Importantly, the increasing sampling density during the CDR period (Fig. 4) likely enhances robustness in this regard for the later years of the time series. It is also important to note that data gaps will still occur in e.g. polar winter due to insufficient illumination, persistent cloudiness (at the pentad scale), or high aerosol loading conditions (AOD at 550 nm >1.0). Investigations into remedying gaps related to poor illumination or cloudiness with microwave remote sensing data are underway (Jääskeläinen et al., 2022).
The predecessor CLARA surface albedo records have seen a notable uptake for cryospheric studies (e.g. Kashiwase et al., 2017; Karlsson and Svensson, 2013; Cao et al., 2015; Guo et al., 2018; Light et al., 2015; Thackeray and Hall, 2019; Zhang et al., 2019). With its extended coverage, demonstrated stability, and improved cloud detection, we expect that CLARA-A3 will continue to serve as a useful resource, particularly for cryospheric investigations, with due attention given to its limitations. The performance of the new white- and blue-sky albedo estimates is fully consistent with the “core” black-sky albedo retrievals and should consequently broaden the array of potential application areas. Urraca et al. (2023) showed that the snow and ice albedo estimates in CLARA-A2 were closest to MODIS-based data. The applied algorithms are mature and calibration is well-known and stable, despite emergent calibration-related issues in the latest years of CLARA-A2. Given the updated calibration and continuity in the core retrieval algorithm from CLARA-A2 to CLARA-A3, this finding further reinforces the belief that CLARA-A3 will continue to prove of value for the cryospheric community in particular.
During the course of the data record preparation and evaluation, considerable attention was given to the performance assessment against in situ measurements, seeking to understand and explain the role that spatial representativeness (i.e. the point-to-pixel problem) plays in the observed differences. Available evidence supports the view that large biases typically result from poor comparability between the coarse-scale satellite estimate and the point-like in situ measurement, with the “true” SAL algorithm uncertainty being likely 10 %–15 % (relative) for typical atmospheric conditions. Although we endeavoured to gather the majority of decade-spanning and robust in situ albedo measurements for this study, it should be noted that emerging community-based validation tools like SALVAL (Sánchez-Zapero et al., 2023) could provide a future platform for undertaking performance assessments with well-defined consistent procedures, metrics, and reference observations for all participating data records, thus also facilitating their comparability.
The data record is distributed freely at https://doi.org/10.5676/EUM_SAF_CM/CLARA_AVHRR/V003 (Karlsson et al., 2023b).
We have presented a new global surface albedo data record spanning over 4 decades. The data record is a component of the third edition of the CLARA Climate Data Record family (CLARA-A3). It covers cryospheric, terrestrial, and oceanic domains at a spatiotemporal resolution which matches the preceding CLARA editions. Several improvements to the record are introduced: for the first time, we provide separate estimates for black-sky (SAL), white-sky (WAL), and blue-sky (BAL) surface albedos. The coverage is now extended to 1979–2020, with the continuously updated Interim Climate Data Record serving to continue coverage to the near-present day. The AVHRR radiance calibration is updated, the AVHRR constellation is expanded to include satellites not used in the preceding editions, and the cloud screening method is now based on probabilistic calculations. Also, alongside the albedo estimates, expanded retrieval quality data are now provided to facilitate masking and screening as appropriate for each application.
We have undertaken a broad effort to evaluate the accuracy and stability of the data record against a selection of high-quality in situ surface albedo measurements taken over terrestrial and cryospheric domains. From the results, we conclude that the mean bias in CLARA-A3 SAL, WAL, and BAL estimates is generally 10 %–15 % (relative) when spatial representativeness issues have been considered. The decadal stability of said bias is also high (<2 % dec.−1), although the coarse spatiotemporal resolution of CLARA does imply large scatter in retrieval errors across time and space (low precision). The observed performance matches or improves upon the predecessor CLARA albedo records. Furthermore, we observe good agreement with the corresponding albedo data from the MODIS-based MCD43 and the preceding CLARA-A2 records, though we note that CLARA-A3 is typically somewhat “brighter” than either of the other two. This is likely attributable to a combination of a higher base level in the new intercalibrated AVHRR radiance data, updated atmospheric composition data (from ERA5), and a new cloud-probability-based screening in CLARA-A3. An unexpected dimming in Antarctic sea ice albedo warrants further study to determine whether it represents reality or undetected retrieval artefacts.
We expect that the third edition of the CLARA surface albedo record, with expanded coverage and retrievals, will continue to serve as a useful data source, particularly for cryospheric studies. Together with the other components of CLARA-A3 which describe global cloud and radiative energy parameters, the SAL, WAL, and BAL estimates will contribute to a more complete understanding of the composition and evolution of Earth's global energy budget.
The supplement related to this article is available online at: https://doi.org/10.5194/essd-16-1007-2024-supplement.
AR carried out the analyses and wrote the majority of the manuscript. EJ prepared the AOD data record and contributed to the manuscript text. VKM wrote the code for the validation of the CLARA-A3 albedo data and contributed to the manuscript text.
The contact author has declared that none of the authors has any competing interests.
Publisher’s note: Copernicus Publications remains neutral with regard to jurisdictional claims made in the text, published maps, institutional affiliations, or any other geographical representation in this paper. While Copernicus Publications makes every effort to include appropriate place names, the final responsibility lies with the authors.
The authors gratefully acknowledge the work of the CM SAF Operations Team during the preparation and processing of the CLARA-A3 data records, in particular Diana Stein at the Deutscher Wetterdienst. The authors would also like to acknowledge the highly important work of Terhikki Manninen (retired) on the CLARA-A3 retrieval algorithms.
This paper was edited by Dalei Hao and reviewed by three anonymous referees.
Anttila, K., Manninen, T., Jääskeläinen, E., Riihelä, A., and Lahtinen, P.: The role of climate and land use in the changes in surface albedo prior to snow melt and the timing of melt season of seasonal snow in northern land areas of 40 N–80 N during 1982–2015, Remote Sens., 10, 1619, https://doi.org/10.3390/rs10101619, 2018.
Aoki, S.: Breakup of land-fast sea ice in Lützow-Holm Bay, East Antarctica, and its teleconnection to tropical Pacific sea surface temperatures, Geophys. Res. Lett., 44, 3219–3227, 2017.
Beringer, J., Chapin III, F. S., Thompson, C. C., and McGuire, A. D.: Surface energy exchanges along a tundra-forest transition and feedbacks to climate, Agr. Forest Meteorol., 131, 143–161, 2005.
Briegleb, B. P., Minnis, P., Ramanathan, V., and Harrison, E.: Comparison of regional clear-sky albedos inferred from satellite observations and model computations, J. Appl. Meteorol. Clim., 25, 214–226, 1986.
Brown, C. F., Brumby, S. P., Guzder-Williams, B., Birch, T., Hyde, S. B., Mazzariello, J., Czerwinski, W., Pasquarella, V. J., Haertel, R., Ilyushchenko, S., Schwehr, K., Weisse, M., Stolle, F., Hanson, C., Guinan, O., Moore, R., and Tait, A. M.: Dynamic World, Near real-time global 10 m land use land cover mapping, Sci. Data, 9, 251, https://doi.org/10.1038/s41597-022-01307-4, 2022.
Budyko, M. I.: The effect of solar radiation variations on the climate of the Earth, Tellus, 21, 611–619, 1969.
Cao, Y., Liang, S., Chen, X., and He, T.: Assessment of sea ice albedo radiative forcing and feedback over the Northern Hemisphere from 1982 to 2009 using satellite and reanalysis data, J. Climate, 28, 1248–1259, 2015.
Dee, D. P., Uppala, S. M., Simmons, A. J., Berrisford, P., Poli, P., Kobayashi, S., Andrae, U., Balmaseda, M. A., Balsamo, G., Bauer, P., Bechtold, P., Beljaars, A. C. M., van de Berg, L., Bidlot, J., Bormann, N., Delsol, C., Dragani, R., Fuentes, M., Geer, A. J., Haimberger, L., Healy, S. B., Hersbach, H., Hólm, E. V., Isaksen, L., Kållberg, P., Köhler, M., Matricardi, M., McNally, A. P., Monge-Sanz, B. M., Morcrette, J. -J., Park, B. -K., Peubey, C., de Rosnay, P., Tavolato, C., Thépaut, J. -N., and Vitart, F.: The ERA-Interim reanalysis: Configuration and performance of the data assimilation system, Q. J. Roy. Meteor. Soc., 137, 553–597, 2011.
Dech, S., Holzwarth, S., Asam, S.,Andresen, T., Bachmann, M., Boettcher, M., Dietz, A., Eisfelder, C., Frey, C., Gesell, G., Gessner, U., Hirner, A., Hofmann, M., Kirches, G., Klein, D., Klein, I., Kraus, T., Krause, D., Plank, S., Popp, T., Reinermann, S., Reiners, P., Roessler, S., Ruppert, T., Scherbachenko, A., Vignesh, R., Wolfmueller, M., Zwenzner, H., and Kuenzer, C.: Potential and Challenges of Harmonizing 40 Years of AVHRR Data: The TIMELINE Experience, Remote Sens., 13, 3618, https://doi.org/10.3390/rs13183618, 2021.
Driemel, A., Augustine, J., Behrens, K., Colle, S., Cox, C., Cuevas-Agulló, E., Denn, F. M., Duprat, T., Fukuda, M., Grobe, H., Haeffelin, M., Hodges, G., Hyett, N., Ijima, O., Kallis, A., Knap, W., Kustov, V., Long, C. N., Longenecker, D., Lupi, A., Maturilli, M., Mimouni, M., Ntsangwane, L., Ogihara, H., Olano, X., Olefs, M., Omori, M., Passamani, L., Pereira, E. B., Schmithüsen, H., Schumacher, S., Sieger, R., Tamlyn, J., Vogt, R., Vuilleumier, L., Xia, X., Ohmura, A., and König-Langlo, G.: Baseline Surface Radiation Network (BSRN): structure and data description (1992–2017), Earth Syst. Sci. Data, 10, 1491–1501, https://doi.org/10.5194/essd-10-1491-2018, 2018.
Fausto, R. S., van As, D., Mankoff, K. D., Vandecrux, B., Citterio, M., Ahlstrøm, A. P., Andersen, S. B., Colgan, W., Karlsson, N. B., Kjeldsen, K. K., Korsgaard, N. J., Larsen, S. H., Nielsen, S., Pedersen, A. Ø., Shields, C. L., Solgaard, A. M., and Box, J. E.: Programme for Monitoring of the Greenland Ice Sheet (PROMICE) automatic weather station data, Earth Syst. Sci. Data, 13, 3819–3845, https://doi.org/10.5194/essd-13-3819-2021, 2021.
Guo, H., Wang, X., Wang, T., Ma, Y., Ryder, J., Zhang, T., Liu, D., Ding, J., Li, Y., and Piao, S.: Spring snow-albedo feedback analysis over the Third Pole: results from satellite observation and CMIP5 model simulations, J. Geophys. Res.-Atmos., 123, 750–763, 2018.
He, T., Liang, S., and Song, D. X.: Analysis of global land surface albedo climatology and spatial-temporal variation during 1981–2010 from multiple satellite products, J. Geophys. Res.-Atmos., 119, 10–281, 2014.
Heidinger, A. K., Straka III, W. C., Molling, C. C., Sullivan, J. T., and Wu, X.: Deriving an inter-sensor consistent calibration for the AVHRR solar reflectance data record, Int. J. Remote Sens., 31, 6493–6517, 2010.
Hersbach, H., Bell, B., Berrisford, P., Hirahara, S., Horányi, A., Muñoz-Sabater, J., Nicolas, J., Peubey, C., Radu, R., Schepers, D., Simmons, A., Soci, C., Abdalla, S., Abellan, X., Balsamo, G., Bechtold, P., Biavati, G., Bidlot, J., Bonavita, M., De Chiara, G., Dahlgren, P., Dee, D., Diamantakis, M., Dragani, R., Flemming, J., Forbes, R., Fuentes, M., Geer, A., Haimberger, L., Healy, S., Hogan, R.J., Hólm, E., Janisková, M., Keeley, S., Laloyaux, P., Lopez, P., Lupu, C., Radnoti, G., de Rosnay, P., Rozum, I., Vamborg, F., Villaume, S., and Thépaut, J.-N.: The ERA5 global reanalysis, Q. J. Roy. Meteor. Soc., 146, 1999–2049, 2020.
Hofmann, M. and Seckmeyer, G.: A New Model for Estimating the Diffuse Fraction of Solar Irradiance for Photovoltaic System Simulations, Energies, 10, 248, https://doi.org/10.3390/en10020248, 2017.
Jääskeläinen, E., Manninen, T., Tamminen, J., and Laine, M.: The Aerosol Index and Land Cover Class Based Atmospheric Correction Aerosol Optical Depth Time Series 1982–2014 for the SMAC Algorithm, Remote Sens., 9, 1095, https://doi.org/10.3390/rs9111095, 2017.
Jääskeläinen, E., Manninen, T., Hakkarainen, J., and Tamminen, J.: Filling gaps of black-sky surface albedo of the Arctic sea ice using gradient boosting and brightness temperature data, Int. J. Appl. Earth Obs., 107, 102701, https://doi.org/10.1016/j.jag.2022.102701, 2022.
Jiao, Z., Ding, A., Kokhanovsky, A., Schaaf, C., Bréon, F.-M., Dong, Y., Wang, Z., Liu, Y., Zhang, X., Yin, S., Cui, L., Mei, L., and Chang, Y.: Development of a snow kernel to better model the anisotropic reflectance of pure snow in a kernel-driven BRDF model framework, Remote Sens. Environ., 221, 198–209, 2019.
Jin, Z., Qiao, Y., Wang, Y., Fang, Y., and Yi, W.: A new parameterization of spectral and broadband ocean surface albedo, Opt. Express, 19, 26429–26443, 2011.
Karlsson, J. and Svensson, G.: Consequences of poor representation of Arctic sea-ice albedo and cloud-radiation interactions in the CMIP5 model ensemble, Geophys. Res. Lett., 40, 4374–4379, 2013.
Karlsson, K.-G., Anttila, K., Trentmann, J., Stengel, M., Fokke Meirink, J., Devasthale, A., Hanschmann, T., Kothe, S., Jääskeläinen, E., Sedlar, J., Benas, N., van Zadelhoff, G.-J., Schlundt, C., Stein, D., Finkensieper, S., Håkansson, N., and Hollmann, R.: CLARA-A2: the second edition of the CM SAF cloud and radiation data record from 34 years of global AVHRR data, Atmos. Chem. Phys., 17, 5809–5828, https://doi.org/10.5194/acp-17-5809-2017, 2017.
Karlsson, K. G., Johansson, E., Håkansson, N., Sedlar, J., and Eliasson, S.: Probabilistic Cloud Masking for the Generation of CM SAF Cloud Climate Data Records from AVHRR and SEVIRI Sensors, Remote Sens., 12, 713, https://doi.org/10.3390/rs12040713, 2020.
Karlsson, K.-G., Stengel, M., Meirink, J. F., Riihelä, A., Trentmann, J., Akkermans, T., Stein, D., Devasthale, A., Eliasson, S., Johansson, E., Håkansson, N., Solodovnik, I., Benas, N., Clerbaux, N., Selbach, N., Schröder, M., and Hollmann, R.: CLARA-A3: The third edition of the AVHRR-based CM SAF climate data record on clouds, radiation and surface albedo covering the period 1979 to 2023, Earth Syst. Sci. Data, 15, 4901–4926, https://doi.org/10.5194/essd-15-4901-2023, 2023a.
Karlsson, K.-G., Riihelä, A., Trentmann, J., Stengel, M., Solodovnik, I., Meirink, J. F., Devasthale, A., Jääskeläinen, E., Kallio-Myers, V., Eliasson, S., Benas, N., Johansson, E., Stein, D., Finkensieper, S., Håkansson, N., Akkermans, T., Clerbaux, N., Selbach, N., Schröder, M., and Hollmann, R.: CLARA-A3: CM SAF cLoud, Albedo and surface RAdiation dataset from AVHRR data – Edition 3, Satellite Application Facility on Climate Monitoring [data set], https://doi.org/10.5676/EUM_SAF_CM/CLARA_AVHRR/V003, 2023b.
Kashiwase, H., Ohshima, K. I., Nihashi, S., and Eicken, H.: Evidence for ice-ocean albedo feedback in the Arctic Ocean shifting to a seasonal ice zone, Sci. Rep., 7, 8170, https://doi.org/0.1038/s41598-017-08467-z, 2017.
Key, J. R., Wang, X., Stoeve, J. C., and Fowler, C.: Estimating the cloudy-sky albedo of sea ice and snow from space, J. Geophys. Res.-Atmos., 106, 12489–12497, 2001.
Kleipool, Q., Rozemeijer, N., van Hoek, M., Leloux, J., Loots, E., Ludewig, A., van der Plas, E., Adrichem, D., Harel, R., Spronk, S., ter Linden, M., Jaross, G., Haffner, D., Veefkind, P., and Levelt, P. F.: Ozone Monitoring Instrument (OMI) collection 4: establishing a 17-year-long series of detrended level-1b data, Atmos. Meas. Tech., 15, 3527–3553, https://doi.org/10.5194/amt-15-3527-2022, 2022.
Kokhanovsky, A. A.: The Broadband Albedo of Snow, Front. Environ. Sci., 9,. https://doi.org/10.3389/fenvs.2021.757575, 2021.
Kokhanovsky, A., Lamare, M., Danne, O., Brockmann, C., Dumont, M., Picard, G., Arnaud, L., Favier, V., Jourdain, B., Le Meur, E., Di Mauro, B., Aoki, T., Niwano, M., Rozanov, V., Korkin, S., Kipfstuhl, S., Freitag, J., Hoerhold, M., Zuhr, A., Vladimirova, D., Faber, A.-K., Steen-Larsen, H. C., Wahl, S., Andersen, J. K., Vandecrux, B., van As, D., Mankoff, K. D., Kern, M., Zege, E., and Box, J. E.: Retrieval of snow properties from the Sentinel-3 Ocean and Land Colour Instrument, Remote Sens., 11, 2280, https://doi.org/10.3390/rs11192280, 2019.
Konzelmann, T. and Ohmura, A.: Radiative fluxes and their impact on the energy balance of the Greenland ice sheet, J. Glaciol., 41, 490–502, 1995.
Kouki, K., Anttila, K., Manninen, T., Luojus, K., Wang, L., and Riihelä, A.: Intercomparison of snow melt onset date estimates from optical and microwave satellite instruments over the northern hemisphere for the period 1982–2015, J. Geophys. Res.-Atmos., 124, 11205–11219, 2019.
Liang, S.: Narrowband to broadband conversions of land surface albedo I: Algorithms, Remote Sens. Environ., 76, 213–238, 2001.
Light, B., Dickinson, S., Perovich, D. K., and Holland, M. M.: Evolution of summer Arctic sea ice albedo in CCSM4 simulations: Episodic summer snowfall and frozen summers, J. Geophys. Res.-Oceans, 120, 284–303, 2015.
Liu, Y., Wang, Z., Sun, Q., Erb, A. M., Li, Z., Schaaf, C. B., Zhang, X., Román, M. O., Scott, R. L., Zhang, Q., Novick, K. A., Syndonia Bret-Harte, M., Petroy, S., and SanClements, M.: Evaluation of the VIIRS BRDF, Albedo and NBAR products suite and an assessment of continuity with the long term MODIS record, Remote Sens. Environ., 201, 256–274, 2017.
Lucht, W., Schaaf, C. B., and Strahler, A. H.: An algorithm for the retrieval of albedo from space using semiempirical BRDF models, IEEE T. Geosci. Remote, 38, 977–998, https://doi.org/10.1109/36.841980, 2000.
Malinka, A., Zege, E., Heygster, G., and Istomina, L.: Reflective properties of white sea ice and snow, The Cryosphere, 10, 2541–2557, https://doi.org/10.5194/tc-10-2541-2016, 2016.
Manninen, T., Andersson, K., and Riihelä, A.: Topography correction of the CM-SAF surface albedo product SAL, in: EUMETSAT Meteorological Satellite Conference Proceedings, Oslo, Norway, 5–9 September 2011, Poster #37, EUM P. 59, ISBN 978-92-9110-093-4, ISSN 1011-3932, Meteorological Conferences, EUMETSAT, 2011.
Manninen, T., Jääskeläinen, E., and Riihelä, A.: Black and white-sky albedo values of snow: In situ relationships for AVHRR-based estimation using CLARA-A2 SAL, Can. J. Remote Sens., 45, 350–367, 2019.
Manninen, T., Jääskeläinen, E., Siljamo, N., Riihelä, A., and Karlsson, K.-G.: Cloud-probability-based estimation of black-sky surface albedo from AVHRR data, Atmos. Meas. Tech., 15, 879–893, https://doi.org/10.5194/amt-15-879-2022, 2022.
Nakamura, K., Aoki, S., Yamanokuchi, T., and Tamura, T.: Interactive movements of outlet glacier tongue and landfast sea ice in Lützow-Holm Bay, East Antarctica, detected by ALOS-2/PALSAR-2 imagery, Science of Remote Sensing, 6, 100064, https://doi.org/10.1016/j.srs.2022.100064, 2022.
Perovich, D. K., Grenfell, T. C., Light, B., and Hobbs, P. V.: Seasonal evolution of the albedo of multiyear Arctic sea ice, J. Geophys. Res.-Oceans, 107, SHE-20, https://doi.org/10.1029/2000JC000438, 2002.
Pinty, B., Lattanzio, A., Martonchik, J. V., Verstraete, M. M., Gobron, N., Taberner, M., Widlowski, J.-L., Dickinson, R. E., and Govaerts, Y.: Coupling Diffuse Sky Radiation and Surface Albedo, J. Atmos. Sci., 62, 2580–2591, 2005.
Pohl, C., Istomina, L., Tietsche, S., Jäkel, E., Stapf, J., Spreen, G., and Heygster, G.: Broadband albedo of Arctic sea ice from MERIS optical data, The Cryosphere, 14, 165–182, https://doi.org/10.5194/tc-14-165-2020, 2020.
Polvani, L. M., Banerjee, A., and Schmidt, A.: Northern Hemisphere continental winter warming following the 1991 Mt. Pinatubo eruption: reconciling models and observations, Atmos. Chem. Phys., 19, 6351–6366, https://doi.org/10.5194/acp-19-6351-2019, 2019.
Rahman, H. and Dedieu, G.: SMAC: a simplified method for the atmospheric correction of satellite measurements in the solar spectrum, Remote Sens., 15, 123–143, 1994.
Riihelä, A., Manninen, T., Laine, V., Andersson, K., and Kaspar, F.: CLARA-SAL: a global 28 yr timeseries of Earth's black-sky surface albedo, Atmos. Chem. Phys., 13, 3743–3762, https://doi.org/10.5194/acp-13-3743-2013, 2013.
Román, M. O., Schaaf, C. B., Lewis, P., Gao, F., Anderson, G. P., Privette, J. L., Strahler, A. H., Woodcock, C. E., and Barnsley, M.: Assessing the coupling between surface albedo derived from MODIS and the fraction of diffuse skylight over spatially-characterized landscapes, Remote Sens. Environ., 114, 738–760, 2010.
Roujean, J. L., Leroy, M., and Deschamps, P. Y.: A bidirectional reflectance model of the Earth's surface for the correction of remote sensing data, J. Geophys. Res.-Atmos., 97, 20455–20468, 1992.
Ryan, J. C., Hubbard, A., Box, J. E., Brough, S., Cameron, K., Cook, J. M., Cooper, M., Doyle, S. H., Edwards, A., Holt, T., Irvine-Fynn, T., Jones, C., Pitcher, L. H., Rennermalm, A. K., Smith, L. C., Stibal, M., and Snooke, N.: Derivation of high spatial resolution albedo from UAV digital imagery: application over the Greenland Ice Sheet, Front. Earth Sci., 5, 40, https://doi.org/10.3389/feart.2017.00040, 2017.
Sánchez-Zapero, J., Martínez-Sánchez, E., Camacho, F., Wang, Z., Carrer, D., Schaaf, C., ... & Cosh, M.: Surface ALbedo VALidation (SALVAL) Platform: Towards CEOS LPV Validation Stage 4–Application to Three Global Albedo Climate Data Records, Remote Sens., 15, 1081, https://doi.org/10.3390/rs15041081, 2023.
Schaaf, C. and Wang, Z.: MODIS/Terra+Aqua BRDF/Albedo Black Sky Albedo Shortwave Daily L3 Global 30ArcSec CMG V061, NASA EOSDIS Land Processes DAAC [data set], https://doi.org/10.5067/MODIS/MCD43D51.061, 2021.
Schaepman-Strub, G., Schaepman, M. E., Painter, T. H., Dangel, S., and Martonchik, J. V.: Reflectance quantities in optical remote sensing – definitions and case studies, Remote Sens. Environ., 103, 27–42, 2006.
Sellers, W. D.: A global climatic model based on the energy balance of the earth-atmosphere system, J. Appl. Meteorol. Clim., 8, 392–400, 1969.
Smith, M. M., Light, B., Macfarlane, A. R., Perovich, D. K., Holland, M. M., and Shupe, M. D.: Sensitivity of the Arctic sea ice cover to the summer surface scattering layer, Geophys. Res. Lett., 49, e2022GL098349, https://doi.org/10.1029/2022GL098349, 2022.
Thackeray, C. W. and Hall, A.: An emergent constraint on future Arctic sea-ice albedo feedback, Nat. Clim. Change, 9, 972–978, 2019.
Tian, L., Zhang, Y., and Zhu, J.: Decreased surface albedo driven by denser vegetation on the Tibetan Plateau, Environ. Res. Lett., 9, 104001, https://doi.org/10.1088/1748-9326/9/10/104001, 2014.
Tokinaga, H. and National Center for Atmospheric Research Staff (Eds.): The Climate Data Guide: WASWind: Wave and Anemometer-based Sea Surface Wind, https://climatedataguide.ucar.edu/climate-data/waswind-wave-and-anemometer-based-sea-surface-wind (last access: 15 February 2024), 2022.
Tomasi, C., Lupi, A., Mazzola, M., Stone, R. S., Dutton, E. G., Herber, A., Radionov, V. F., Holben, B. N., Sorokin, M. G., Sakerin, S. M., Terpugova, S. A., Sobolewski, P. S., Lanconelli, C., Petkov, B. H., Busetto, M., and Vitale, V.: An update on polar aerosol optical properties using POLAR-AOD and other measurements performed during the International Polar Year, Atmos. Environ., 52, 29–47, 2012.
Trlica, A., Hutyra, L. R., Schaaf, C. L., Erb, A., and Wang, J. A.: Albedo, land cover, and daytime surface temperature variation across an urbanized landscape, Earth's Future, 5, 1084–1101, 2017.
Urraca, R., Lanconelli, C., Cappucci, F., and Gobron, N.: Assessing the Fitness of Satellite Albedo Products for Monitoring Snow Albedo Trends, IEEE T. Geosci. Remote Sens., 61, 4404817, https://doi.org/10.1109/TGRS.2023.3281188, 2023.
Vazquez, J.: Nimbus-7 SMMR Ocean Products: 1979–1984, PO.DAAC., CA, USA, [data set], https://doi.org/10.5067/SMMRN-2WAF0, 1997.
Venter, Z. S., Barton, D. N., Chakraborty, T., Simensen, T., and Singh, G.: Global 10 m Land Use Land Cover Datasets: A Comparison of Dynamic World, World Cover and Esri Land Cover, Remote Sens., 14, 4101, https://doi.org/10.3390/rs14164101, 2022.
Vihma, T., Jaagus, J., Jakobson, E., and Palo, T.: Meteorological conditions in the Arctic Ocean in spring and summer 2007 as recorded on the drifting ice station Tara, Geophys. Res. Lett., 35, https://doi.org/10.1029/2008GL034681, 2008.
Wang, Z., Schaaf, C. B., Strahler, A. H., Chopping, M. J., Román, M. O., Shuai, Y., Woodcock, C. E., Hollinger, D. Y., and Fitzjarrald, D. R.: Evaluation of MODIS albedo product (MCD43A) over grassland, agriculture and forest surface types during dormant and snow-covered periods, Remote Sens. Environ., 140, 60–77, 2014.
Wang, Z., Schaaf, C., Lattanzio, A., Carrer, D., Grant, I., Román, M., Camacho, F., Yu, Y., Sánchez-Zapero, J., and Nickeson, J.: Global Surface Albedo Product Validation Best Practices Protocol. Version 1.0, in:, Best Practice for Satellite Derived Land Product Validation, edited by: Wang, Z., Nickeson, J., and Román, M., p. 45, Land Product Validation Subgroup (WGCV/CEOS), https://doi.org/10.5067/DOC/CEOSWGCV/LPV/ALBEDO.001, 2019.
Wentz, F. J.: A well-calibrated ocean algorithm for SSM/I, J. Geophys. Res., 102, 8703–8718, 1997.
Wu, A., Li, Z., and Cihlar, J.: Effects of land cover type and greenness on advanced very high resolution radiometer bidirectional reflectances: Analysis and removal, J. Geophys. Res.-Atmos., 100, 9179–9192, 1995.
Yang, F., Mitchell, K., Hou, Y. T., Dai, Y., Zeng, X., Wang, Z., and Liang, X. Z.: Dependence of land surface albedo on solar zenith angle: Observations and model parameterization, J. Appl. Meteorol. Clim., 47, 2963–2982, 2008.
Xiong, X., Stamnes, K., and Lubin, D.: Surface albedo over the Arctic Ocean derived from AVHRR and its validation with SHEBA data, J. Appl. Meteorol. Clim., 41, 413–425, 2002.
Zhang, R., Wang, H., Fu, Q., Rasch, P. J., and Wang, X.: Unraveling driving forces explaining significant reduction in satellite-inferred Arctic surface albedo since the 1980s, P. Natl. Acad. Sci. USA, 116, 23947–23953, 2019.
- Abstract
- Introduction
- Data record description
- Algorithm overview
- Validation of CLARA-A3 surface albedo estimates against reference in situ measurements
- Intercomparison with MODIS-based MCD43 and predecessor CLARA-A2 surface albedo data records
- Discussion, strengths, and limitations of the CLARA data
- Data availability
- Conclusions
- Author contributions
- Competing interests
- Disclaimer
- Acknowledgements
- Review statement
- References
- Supplement