the Creative Commons Attribution 4.0 License.
the Creative Commons Attribution 4.0 License.
 | 06 Jan 2023
Gridded pollen-based Holocene regional plant cover in temperate and northern subtropical China suitable for climate modelling
Marie-José Gaillard
Xianyong Cao
Ulrike Herzschuh
Shinya Sugita
Yan Zhao
Chengbang An
Xiaozhong Huang
Yu Li
Hongyan Liu
Aizhi Sun
Yifeng Yao
We present the first gridded and temporally continuous quantitative pollen-based plant-cover reconstruction for temperate and northern subtropical China over the Holocene (11.7 ka to present) obtained by applying the Regional Estimates of VEgetation Abundance from Large Sites (REVEALS) model. The objective is to provide a dataset of pollen-based land cover for the last ca. 12 millennia that is suitable for palaeoclimate modelling and for the evaluation of simulated past vegetation cover from dynamic vegetation models and anthropogenic land-cover change (ALCC) scenarios. The REVEALS reconstruction was achieved using 94 selected pollen records from lakes and bogs at a 1∘ × 1∘ spatial scale and a temporal resolution of 500 years between 11.7 and 0.7 ka and in three recent time windows (0.7–0.35 ka, 0.35–0.1 ka, and 0.1 ka to present). The dataset includes REVEALS estimates of cover and their standard errors (SEs) for 27 plant taxa in 75 1∘ × 1∘ grid cells distributed within the study region. The 27 plant taxa were also grouped into 6 plant functional types and 3 land-cover types (coniferous trees CT, broadleaved trees BT, and C3 herbs/open land (C3H/OL)), and their REVEALS estimates of cover and related SEs were calculated. We describe the protocol used for the selection of pollen records and the REVEALS application (with parameter settings) and explain the major rationales behind the protocol. As an illustration, we present, for eight selected time windows, gridded maps of the pollen-based REVEALS estimates of cover for the three land-cover types (CT, BT, and C3H/OL). We then discuss the reliability and limitations of the Chinese dataset of Holocene gridded REVEALS plant cover, and its current and potential uses.
The dataset is available at the National Tibetan Plateau Data Center (TPDC; Li, 2022; https://doi.org/10.11888/Paleoenv.tpdc.272292).
- Article
(5417 KB) - Full-text XML
-
Supplement
(571 KB) - BibTeX
- EndNote


Vegetation has undergone changes all over the globe throughout the Holocene as a result of climate change from the early Holocene on and disturbance from anthropogenic activities from the mid-Holocene on (e.g. Stephens et al., 2019; Li et al., 2020; Marquer et al., 2017). Pollen data mapping can provide insights into temporal and spatial vegetation changes at broad continental scales (Huntley and Birks, 1983; Huntley and Webb, 1988; Ren and Zhang, 1998; Ren and Beug, 2002). However, the quantification of past vegetation changes based on fossil pollen data is necessary to answer specific research questions on the relationship between plant cover and e.g. climate or biodiversity. Techniques such as biomization (Prentice and Webb, 1998) and the modern analogue technique (MAT) (Overpeck et al., 1985) have been widely applied to reconstruct past continental-scale changes in vegetation cover. These techniques have the disadvantage that they cannot quantify the cover of individual plant taxa. In this paper, we present the first pollen-based quantitative reconstruction of Holocene plant-cover changes in temperate and northern subtropical China using the Regional Estimates of VEgetation Abundance from Large Sites (REVEALS) model (Sugita, 2007a).
The possible effects of anthropogenic land-cover (LC) transformation due to past land-use (LU) changes (LULC changes) on the Holocene climate is still an issue of debate (Harrison et al., 2020). Current earth system models (ESMs) take care of the climate–land vegetation interactions by coupling a dynamic vegetation model (DVM) with the climate model (e.g. Claussen et al., 2013; Lu et al., 2018; Wyser et al., 2020). DVMs simulate climate-induced (natural) vegetation. Therefore, past LULC changes have to be estimated to study their effect on past climate. The anthropogenic land-cover change (ALCC) scenarios most commonly used by palaeoclimate modellers are those from the HYDE database (Klein Goldewijk et al., 2017) and the KK10 dataset of past deforestation (Kaplan et al., 2009). These scenarios are based on a number of assumptions for population growth, per-capita land use, and other parameters that influenced land use over time in the past (e.g. Gaillard et al., 2010; Kaplan et al., 2017). Therefore, a current priority is to produce datasets of pollen- and archaeology-based data of past LU and LC that can be used in palaeoclimate modelling or the evaluation of DVMs and ALCCs (PAGES LandCover6k; Gaillard et al., 2015; Morrison et al., 2016; Harrison et al., 2020).
The only gridded pollen-based REVEALS reconstructions of plant cover created for the purpose of climate modelling published so far are those for NW-central Europe north of the Alps (five time windows of the Holocene) (Trondman et al., 2015) and for all of Europe through the Holocene (11.7 ka to present) (Githumbi et al., 2022a). A comparison of Trondman et al.'s (2015) reconstruction with the ALCC scenarios from HYDE 3.1 (Klein Goldewijk et al., 2011) and KK10 (Kaplan et al., 2009) suggests that the KK10-simulated deforestation is closer to the REVEALS estimates of open-land (OL) cover than the HYDE 3.1 deforestation (Kaplan et al., 2017). In a study using a regional climate model (Strandberg et al., 2014), it was found that the effect on mean summer and winter temperatures of anthropogenic deforestation equalling the KK10-simulated deforested land in Europe between 6 and 0.2 ka varied between ca. −1 and +1 ∘C depending on the season and geographical location. This indicates that LULC changes in the past did matter in terms of climate change, which was further confirmed in a recent palaeoclimate modelling study of the climate at 6 ka using the latest pollen-based REVEALS reconstruction of plant cover in Europe (Githumbi et al., 2022a; Strandberg et al., 2022). Given that the gridded REVEALS reconstructions are not continuous over space, i.e. only some of the grid cells have pollen-based REVEALS estimates of plant cover, such a dataset is comparable to a collection of point data in space. This implies that the REVEALS data need to be interpolated over space to produce a true gridded dataset with values of plant cover in all grid cells. Such interpolations were performed using the European gridded REVEALS reconstructions (e.g. Pirzamanbein et al., 2014; Githumbi et al., 2022b; Strandberg et al., 2022) and were used for the first time in climate modelling by Strandberg et al. (2022). Besides the gridded REVEALS reconstructions at the continental scale of Europe mentioned above, gridded REVEALS reconstructions along N-S and W-E transects throughout Europe between 11.7 ka and the present were used to disentangle the effects of climate and land-use change on Holocene vegetation (Marquer et al., 2017). Moreover, gridded maps of pollen-based REVEALS estimates of open-land cover in the Northern Hemisphere (N of 40∘) were published for a couple of Holocene time windows (Dawson et al., 2018).
Several reconstructions of the biomes (Ni et al., 2010, 2014) and vegetation cover (Tian et al., 2016) of China during the Holocene are available. However, these reconstructions do not provide quantitative information on the spatial extent of deforested land within woodland biomes or of vegetation types including both trees and herbs. Therefore, they are of limited value for use in palaeoclimate modelling or the evaluation of DVM-simulated vegetation cover or ALCC scenarios.
The dataset of gridded pollen-based REVEALS estimates of plant cover for temperate and northern subtropical China presented in this paper is based on the REVEALS estimates published in Li et al. (2020). It includes, for 25 consecutive time windows of the Holocene, cover estimates for 27 plant taxa that are further grouped into estimates of cover for 6 plant functional types (PFTs) and 3 land-cover types (LCTs), i.e. coniferous trees (CT), broadleaved trees (BT), and C3 herbs/open land (C3H/OL). PFTs are either single taxa (mainly genera, such as Pinus, Betula, etc.) or groups of taxa. The REVEALS estimates for the 27 plant taxa are the same as in Li et al. (2020), while the grouping of taxa into PFTs and LCTs is different. The latter is explained in the Methods section below. Here, we briefly describe the methods used and their rationales, present a selection of maps of the cover of CT, BT, and C3H/OL for eight time windows of the Holocene, and discuss the reliability and limitations of the dataset as well as its current and potential uses. The entire dataset is available at https://doi.org/10.11888/Paleoenv.tpdc.272292 (Li, 2022). The major differences between Li et al. (2020) and this paper are the purpose, the visualization of the data, and the discussion of the dataset. While Li et al. (2020) visualize the results over time for each reconstruction and focus on Holocene changes in open land versus woodland cover and their interpretation in terms of land-use and/or climate-induced changes, the major purpose of the present paper is to make the data available to users, in particular climate and vegetation modellers, and to explain their potential and limitations. Moreover, it visualizes the results spatially and only for a few selected times windows to essentially provide an illustration of the dataset that says more to the reader than an Excel file with numbers.
The application of the REVEALS model follows the protocol used for the REVEALS reconstructions performed in Europe (Mazier et al., 2012; Trondman et al., 2015) as closely as possible. This was done for the sake of consistency, to facilitate comparisons between regions and continents, and to fulfil the criteria required for a contribution to the Past Global Changes (PAGES) LandCover6k working group (2015–2021; https://pastglobalchanges.org/science/wg/former/landcover6k/intro, last access: 31 December 2022). For the full protocol of the REVEALS reconstructions for China, see Li et al. (2020).
2.1 Pollen data
The pollen records selected for this study are from the pollen-data archive published by Cao et al. (2013) and from individual contributors. The pollen-data archive includes over 230 pollen records for temperate and northern subtropical China covering all or parts of the Holocene. However, only 94 pollen records met the criteria required for a contribution to PAGES LandCover6k (Trondman et al., 2015; Githumbi et al., 2022a): i.e. the pollen records are from lake sediments and/or peat deposits in small to large basins, pollen identification is of good quality, their chronology is based on ≥3 dates (14C or other types of dates), and they have a temporal resolution of a minimum of two pollen counts per 500 years. All chronologies were carefully examined. If required, new age-depth models were established using the BACON software (Blaauw and Christen, 2011). Hereafter, all ages are given in ka (1000 years before present, BP, which is 1950 CE).
The metadata table (Table S1 in the Supplement) includes, for each pollen record/site, the vegetation zone, the number of the site group (Gr; explained below), the site name and its latitude, longitude, and elevation, the province, the site size (area and calculated radius) and type (lake or bog), the type of pollen data (original raw pollen counts or pollen counts calculated using information from published pollen diagrams), the dating method and number of dates, the timespan covered by the pollen record, the mean time resolution of the pollen counts, and the literature reference.
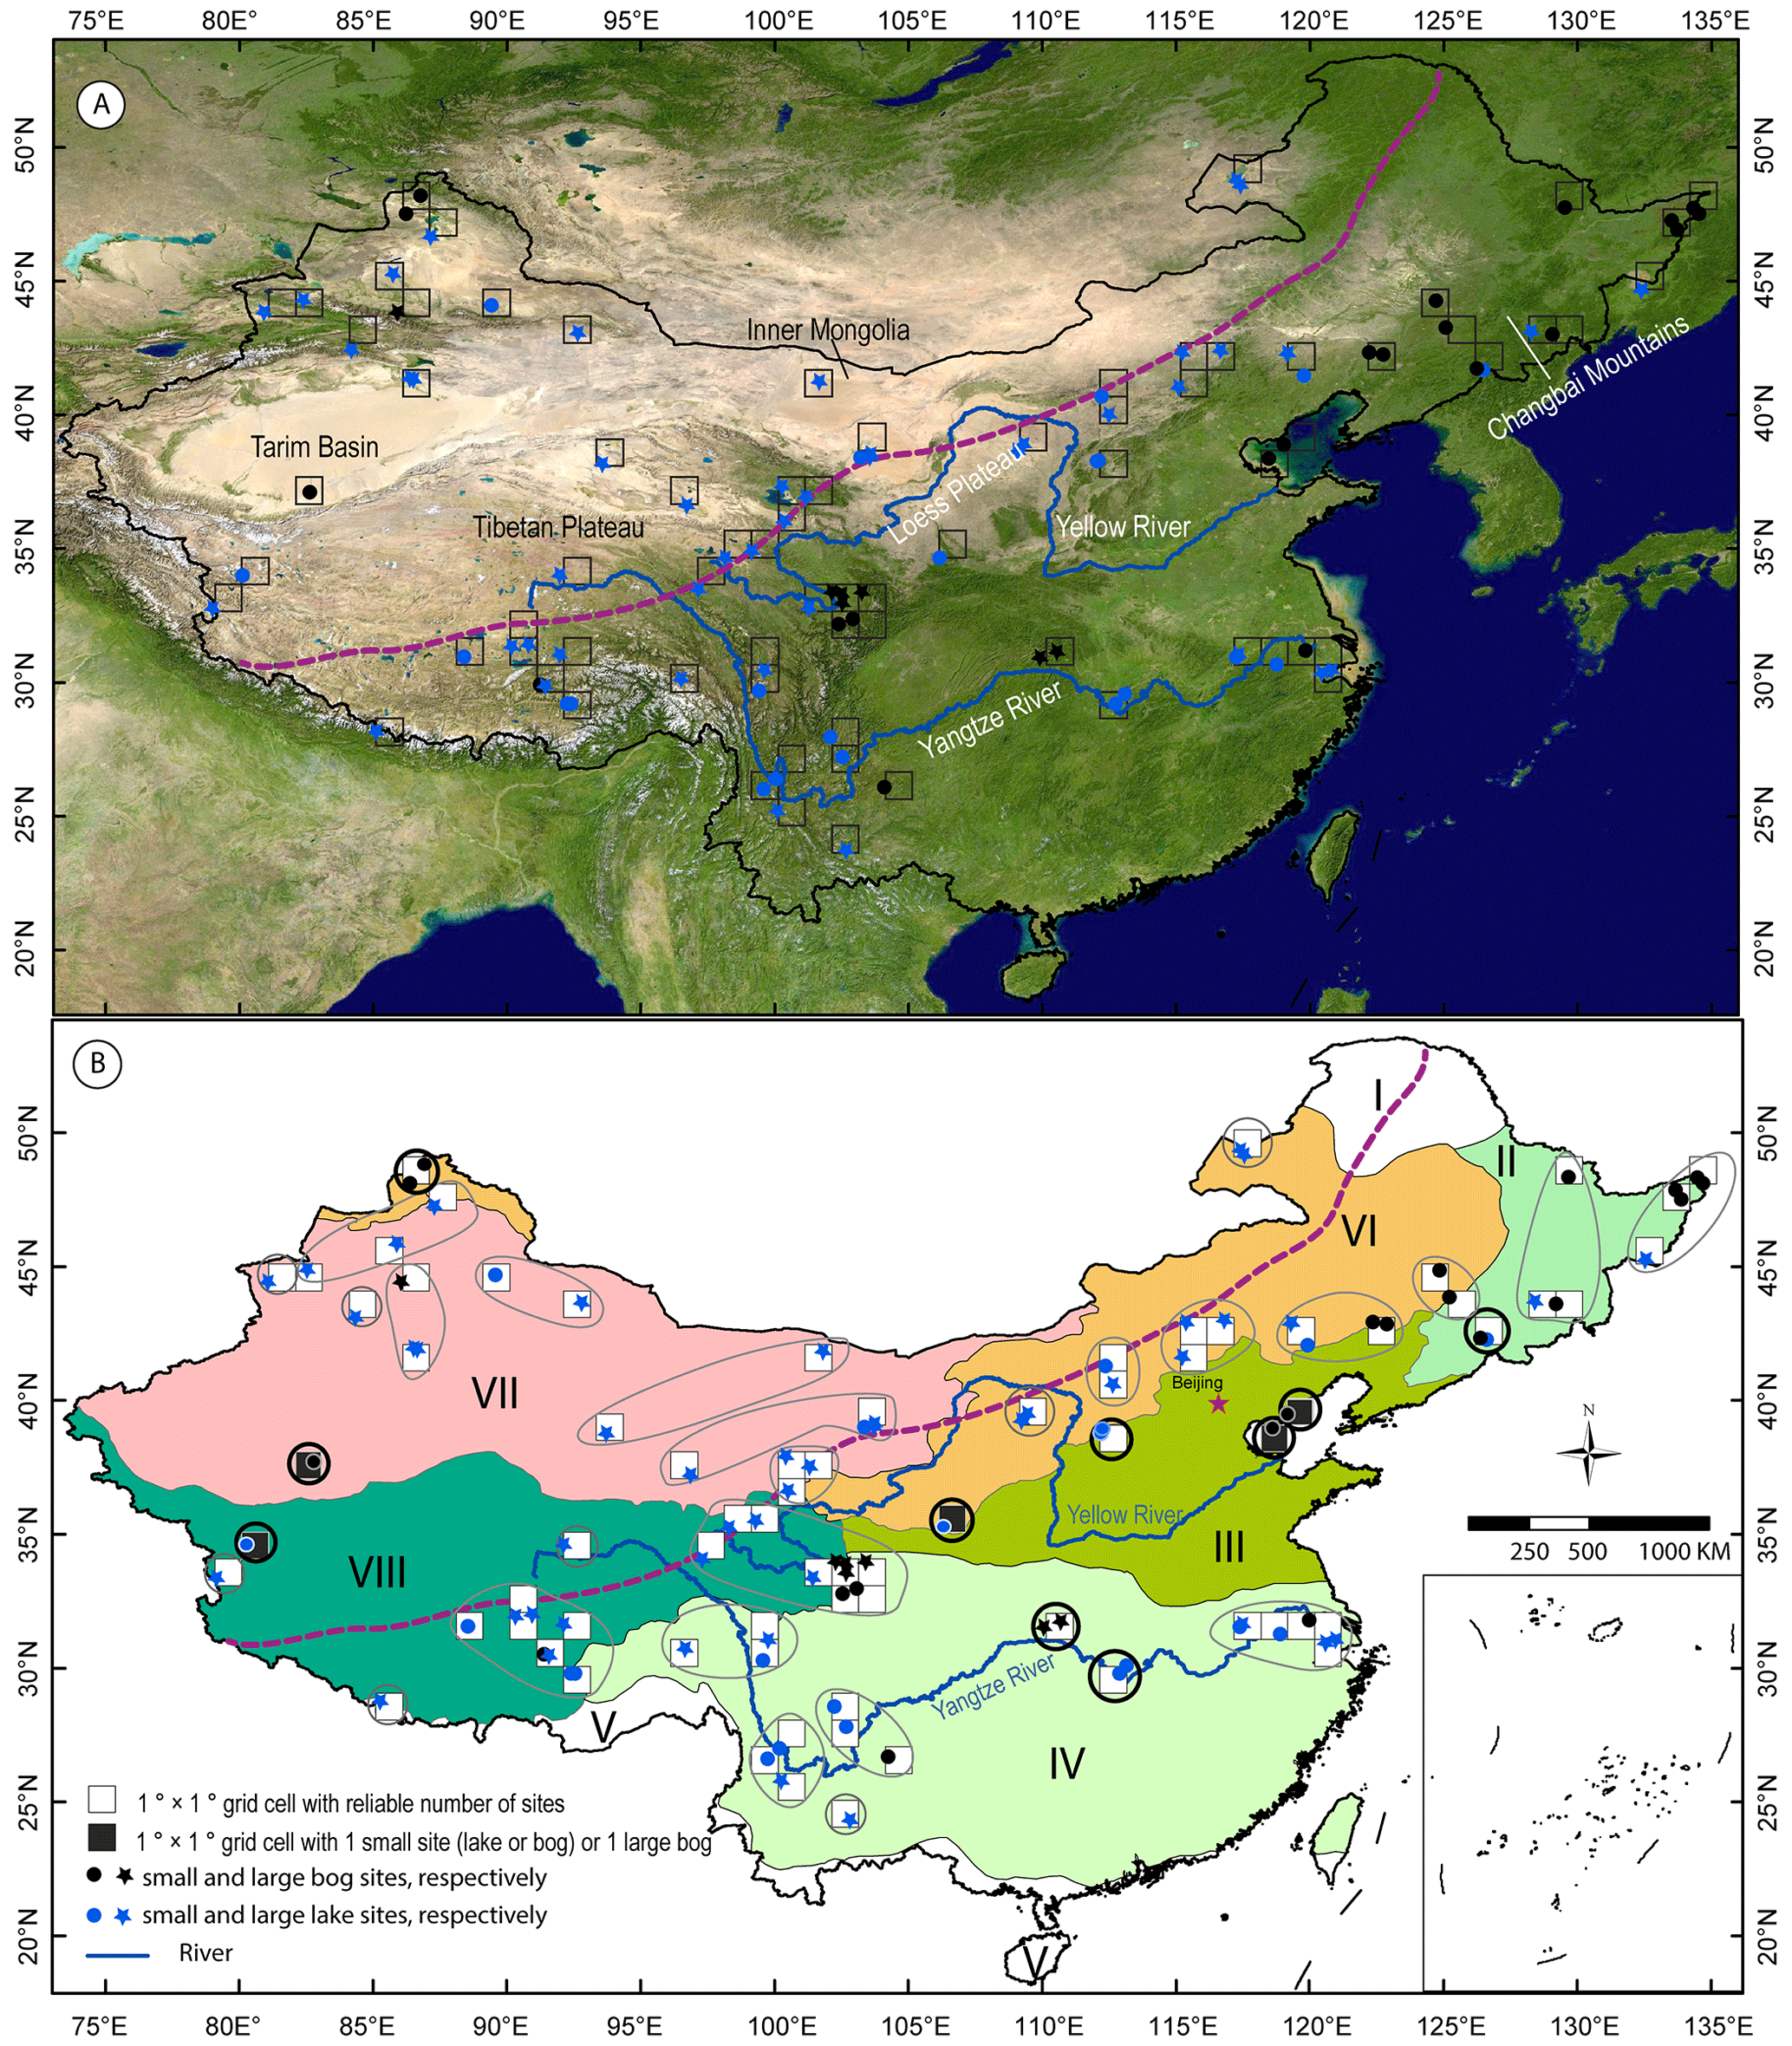
Figure 1Study region and selected Holocene pollen records. The dashed pink diagonal line indicates the modern Asian summer monsoon limit according to Chen et al. (2010). (a) Satellite image from PlanetObserver (© Google Earth image), showing the major mountains, rivers, and geographical regions mentioned in the text. (b) Map of vegetation zones in China following Hou (2019) (from Li et al., 2020, modified). The South China Sea Islands are shown according to China's government regulations. The REVEALS reconstructions represent plant cover in either a single grid cell or several grid cells. Grid cell reliability in terms of REVEALS estimates of plant cover is indicated by the fill colour: white for reliable reconstruction and black for less reliable reconstruction (five grid cells, also emphasized by a thick dark circle). Reconstructions based on two small sites (five white grid cells emphasized by a thick black circle) should also be considered with caution. For detailed explanations of reliability, see the main text. Roman numbers refer to vegetation zones: (I) boreal forest, (II) coniferous-deciduous mixed forest, (III) temperate deciduous forest, (IV) subtropical broadleaved evergreen and deciduous forest, (V) tropical monsoonal rainforest, (VI) temperate steppe, (VII) temperate desert, (VIII) highland vegetation.
2.2 The REVEALS model and rationales for the model-application protocol
A full description of the REVEALS model and its assumptions is published in Sugita (2007a). The model was developed to estimate plant cover at a regional scale using pollen data from large lakes. It is a modification of the R value model (Davis, 1963) that corrects pollen percentage biases caused by inter-taxonomic differences in pollen productivity and dispersion. Empirical tests in southern Sweden and northern America suggest that pollen records from lakes ≥50 ha in size provide reliable pollen-based REVEALS estimates of regional plant cover (Hellman et al., 2008a, b; Sugita et al., 2010). The rationales behind the general protocol used for the gridded REVEALS reconstructions are presented in detail in Mazier et al. (2012) and Trondman et al. (2015). The major rationales are those motivating the use of a 1∘ × 1∘ spatial resolution (grid-cell size), a 500 year time resolution (except for the three most recent time windows), and all suitable pollen records from large and small sites. The choice of the spatial scale is based on a test performed in southern Sweden demonstrating that REVEALS estimates of modern plant cover using pollen assemblages from surface lake sediments were in good agreement with the actual plant cover within areas of 50 km × 50 km and 100 km × 100 km (Hellman et al., 2008b). In addition, this spatial scale is appropriate for palaeoclimate modelling with either global or regional climate models (e.g. Strandberg et al., 2014, 2022). The time resolution is motivated by the influence of the size of pollen counts on the size of the standard errors (SEs) in REVEALS estimates. A time resolution of 500 years ensures that a maximum of the REVEALS reconstructions has a low SE and is still meaningful for the study of past land-cover changes over several millennia. As pollen counts are generally available at a higher time resolution for the last 1000 years, and because land-cover changes were often more rapid during the recent millennium than in earlier millennia, the lengths of the three most recent time windows were fixed to 350 (0.7–0.35 ka), 250 (0.35–0.1 ka), and 100+x years (0.1 ka to present (1950 CE + x years, where x is the number of years between 1950 CE and the year of coring)). The relevance and suitability of using pollen records from both large and small sites for REVEALS applications in order to increase the reliability of the pollen-based estimates of plant cover within each grid cell were confirmed by simulation tests in Sugita (2007a) and empirical tests in southern Sweden (Trondman et al., 2016) (see Li et al., 2020, for more details). In the absence of pollen records from large lakes, the larger the number of small sites (lakes or bogs), the better the REVEALS result. However, bogs (large and small) violate one of the assumptions of the REVEALS model, i.e. that no vegetation is growing on the deposition basin (Sugita, 2007a). Violation of this assumption has been shown to bias REVEALS results most significantly in the case of large bogs, while pollen records from multiple small bogs generally provide reliable estimates of plant cover (Mazier et al., 2012; Trondman et al., 2016).
Due to the low spatial density of the 94 selected pollen records in this study, the pollen records were grouped for the application of the REVEALS model within coherent regions with comparable biogeographical characteristics and similar vegetation histories (see Li et al., 2020, for details). This implies that, in these cases, the grid cells covered by a group of pollen sites (between two and eight grid cells, Fig. 1) have the same REVEALS estimates, i.e. the same mean vegetation cover (Figs. 2–4). This is a deviation from the standard protocol used in Europe, in which pollen records were never grouped within more than a single 1∘ × 1∘ grid cell. The reason for grouping pollen records over more than one grid cell (18 groups of grid cells, 57 of 75 grid cells in total) was to increase the reliability of the REVEALS estimates in areas with a sparse distribution of pollen records. The remaining 18 grid cells were isolated, i.e. no additional pollen record(s) were available in nearby grid cells, and the REVEALS application was performed for each grid cell separately. Eight of these grid cells include one or two large lakes and provide reliable REVEALS reconstructions of plant cover. The other 10 grid cells (emphasized by a thick black circle in Fig. 1b) include one or two small sites and therefore represent reconstructions that need to be considered with caution, of which five are based on one small site or bog site only and are labelled as being less reliable (black grid cells in Fig. 1b).
2.3 Parameter settings, REVEALS runs, and the calculation of cover for groups of plant taxa
The parameters needed to run the REVEALS model are the relative pollen productivity (RPP) estimates and their standard deviations (SDs), the fall speed of pollen (FSP), the maximum extent of regional vegetation (Zmax; km), the wind speed (m s−1), and atmospheric conditions (expressed by four parameters, i.e. vertical and horizontal diffusion coefficients, a dimensionless turbulence parameter, and wind speed; see Jackson and Lyford, 1999, for details). We used the mean RPP estimates along with their related SDs and the FSP of 27 plant taxa from the synthesis of available RPP estimates and FSP in temperate China (Li et al., 2018b), a Zmax of 100 km, a wind speed of 3 m s−1, and neutral atmospheric conditions. Note that, in contrast to Cao et al. (2019), Li et al. (2020) chose to use only RPP estimates obtained from pollen-vegetation datasets collected in temperate China. This implies that two important taxa in northwestern China are missing from the reconstruction, namely Abies and Picea. Cao et al. (2019) used the RPP estimates of Abies and Picea from Europe, assuming that differences in these species between Europe and China would not significantly influence their RPP. Given that this assumption has not been tested, we decided to apply the principle used in Li et al. (2020) to the dataset we are publishing here. The 27 taxa included in this REVEALS reconstruction account for >50 % of the total pollen from all pollen taxa in all records and for >80 % of the total pollen from all pollen taxa in most records.
Other parameters needed are the basin type (lake or bog) and its size (radius in m). We applied two models of pollen dispersion and deposition: the Prentice model (Prentice, 1985) for bogs and the Prentice–Sugita model (Sugita, 1993) for lakes.
Before running the REVEALS model, the pollen counts of each of the 27 plant taxa within each time window are summed in each pollen record. The REVEALS model is run separately with pollen records from bogs (using Prentice's model) and lakes (using the Prentice–Sugita model) for each group of pollen records. These model runs result in two different mean REVEALS estimates of cover (and their SEs) for the 27 plant taxa – one from bog(s) and one from lake(s). The standard deviations (SDs) of the RPP estimates are taken into account in the calculation of the REVEALS SEs, as well as are the number of pollen grains counted in the sample (Sugita, 2007a). The final mean REVEALS estimates of cover for the 27 plant taxa (from bog(s) + lake(s)) are then calculated. The SEs of the final mean REVEALS estimates for each group of pollen records are obtained using the delta method (Stuart and Ord, 1994) and derived from the sum of the within- and between-site variations in the REVEALS results in the grid cell (see Li et al., 2020, for details). The latest version of the REVEALS computer program, LRA.REVEALS.v6.2.4.exe (Shinya Sugita, unpublished), and example files are available at the link https://1drv.ms/u/s!AkY-0mVRwOaykdgmINfXVsC-4t4n5w?e=7U55hO (last access: 1 January 2023). It implements all the calculations mentioned above.
We also calculated the mean REVEALS estimates of cover (and their SEs) for groups of taxa, i.e. plant functional types (PFTs) and land-cover types (LCTs), for use in climate models and the evaluation of HYDE, KK10, and DVMs (see the Introduction). To do this, the 27 plants were harmonized with six PFTs defined for China by Ni et al. (2010, 2014) and with the three LCTs CT, BT, and C3H/OL (Table 1). Note that Li et al. (2020) used slightly different PFTs, where Cupressaceae, Poaceae, Cyperaceae, and Rosaceae were treated as separate PFTs to make it easier to interpret changes in the amount of conifers and herbs in terms of regional versus local – and natural versus anthropogenic – vegetation. Moreover, Rubiaceae and Elaeagnaceae were classified as temperate shade-tolerant broadleaved evergreen trees, and Castanea and Juglans were grouped with the herbs (open land) and anthropogenic indicators (including planted trees). In this paper, we use the PFT classification provided in Table 1, in which Cupressaceae are grouped together with Pinus as PFT TeNE (temperate shade-intolerant needle-leaved evergreen trees); Elaeagnaceae, Castanea, and Juglans are grouped along with broadleaved trees as PFT TeBS (temperate shade-tolerant broadleaved summer green trees); and Cyperaceae, Poaceae, Rosaceae, and Rubiaceae along with all herbs are grouped as PFT C3H/OL (C3 herbs/open land). We propose that this classification is more appropriate for use in climate modelling contexts than that used in Li et al. (2020), in which the major aim of the study was to interpret the pollen-based plant-cover reconstruction in terms of open-land versus woodland cover.
For more details on the parameter settings, REVEALS runs, models of pollen dispersion and deposition, and the delta method, the reader is referred to Li et al. (2020).
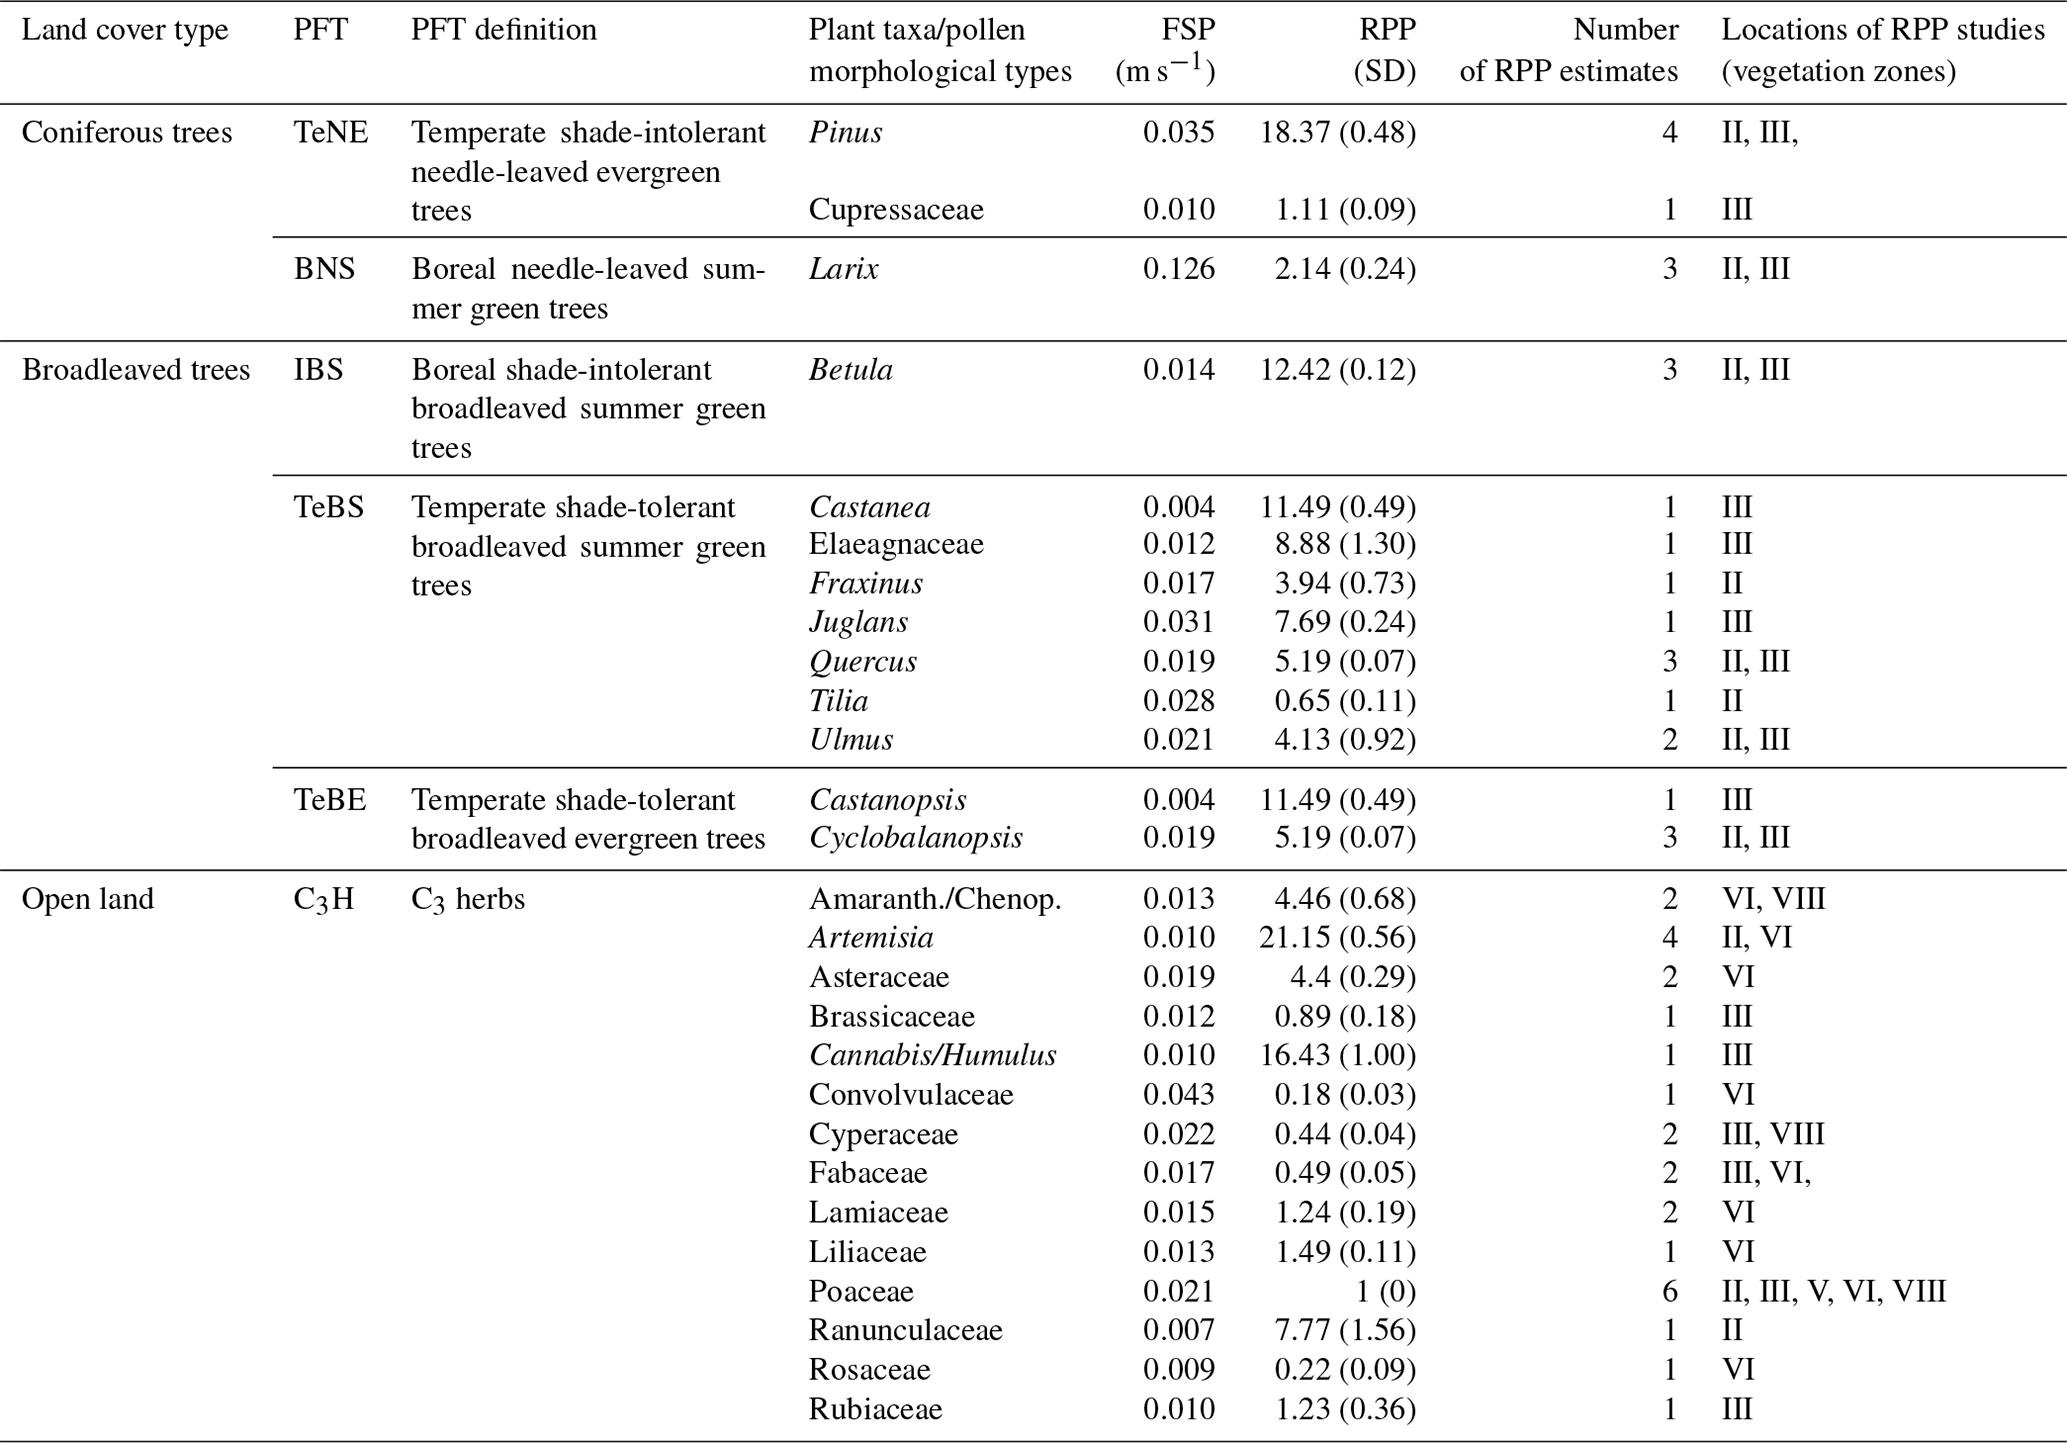
Table 1Aggregation of pollen morphological types into land-cover types (LCTs) and plant functional types (PFTs) (following Ni et al., 2010, 2014). The fall speed of pollen (FSP) is shown along with the mean relative pollen productivity (RPP) and its standard deviation (SD) in brackets (dataset Alt2 of Li et al., 2018b). The number of values available in the calculation of the mean RPP and the locations of the RPP studies in terms of vegetation zones are also provided. Roman numbers refer to the vegetation zones: (I) boreal forest, (II) coniferous-deciduous mixed forest, (III) temperate deciduous forest, (IV) subtropical broadleaved evergreen and deciduous forest, (V) tropical monsoonal rainforest, (VI) temperate steppe, (VII) temperate desert, (VIII) highland vegetation. Abbreviations: Amaranth.: Amaranthaceae; Chenop.: Chenopodiaceae.
2.4 Data format
The dataset of pollen-based REVEALS estimates of Holocene plant cover for temperate and northern subtropical China comprises four csv files with the REVEALS proportions of plant cover (and related SEs) in 75 1∘ × 1∘ grid cells and 25 time windows for 27 taxa (Data1.plants.csv), 6 PFTs classified as in Table 1 (Data2.6PFTs.csv), 3 land-cover types (Data3.LCTs.csv), and 10 PFTs classified as in Li et al. (2020) (Data4.10PFTs.csv). Two additional files complement the REVEALS dataset: a metadata file (Table S1; see Sect. 2.1 on pollen data for details) and a table providing details on the number and types of sites used in the REVEALS reconstruction for each grid cell and each time window (Table S2). The REVEALS excel data files and Tables S1 and S2 are available at https://doi.org/10.11888/Paleoenv.tpdc.272292 (Li, 2022).
Below, as an illustration, we describe maps of REVEALS reconstructed cover for the three land-cover types CT, BT, and C3H/OL in eight selected time windows of the Holocene that provide snapshots in time of significantly different land-cover type compositions between 11.7 ka and present. For each land-cover type, the maps are described from the oldest (11.7–11.2 ka) to the youngest (0.1 ka to present) map. The map of each time window is described in comparison to the map of the previous time window (e.g. the 9.7–10.2 ka map is described in comparison to the 11.7–11.2 ka map). Land-cover changes (decreases or increases) are expressed in absolute fractions, e.g. an increase by 20 % at 9.7–10.2 ka from a cover of 50 % of the grid cell at 11.7–11.2 ka implies that the cover at 9.7–10.2 BP is 70 % of the grid cell. The descriptions start with information extracted from Li et al. (2020) on the modern occurrence and Holocene history (in terms of pollen-based REVEALS cover) of the taxa constituent of the land-cover type in question.
3.1 Open land (C3H/OL; Fig. 2)
OL is the sum of the reconstructed cover of 14 herb taxa for which RPP estimates are available. Poaceae, Cyperaceae, Amaranthaceae/Chenopodiaceae, and Artemisia are often represented by high pollen percentages during the Holocene. Other herbs that can be relatively well represented during most of the Holocene are Asteraceae, Brassicaceae, Ranunculaceae, Rosaceae, and Rubiaceae. Pollen from Convolvulaceae, Fabaceae, Lamiaceae, and Liliaceae can be quite common over some periods of the Holocene, while Cannabis/Humulus is not common. Today, these herbs primarily characterize open vegetation, i.e. temperate xerophytic shrubland and grassland, desert, and tundra, as well as human-induced vegetation (cultivated and grazing land). The REVEALS reconstructions suggest that the cover of Poaceae, Cyperaceae, and Rosaceae during the Holocene is often equal to or larger than the cover of all remaining 11 herbs together, although the cover provided by Artemisia and Amaranthaceae/Chenopodiaceae can also be relatively large (Li et al., 2020).
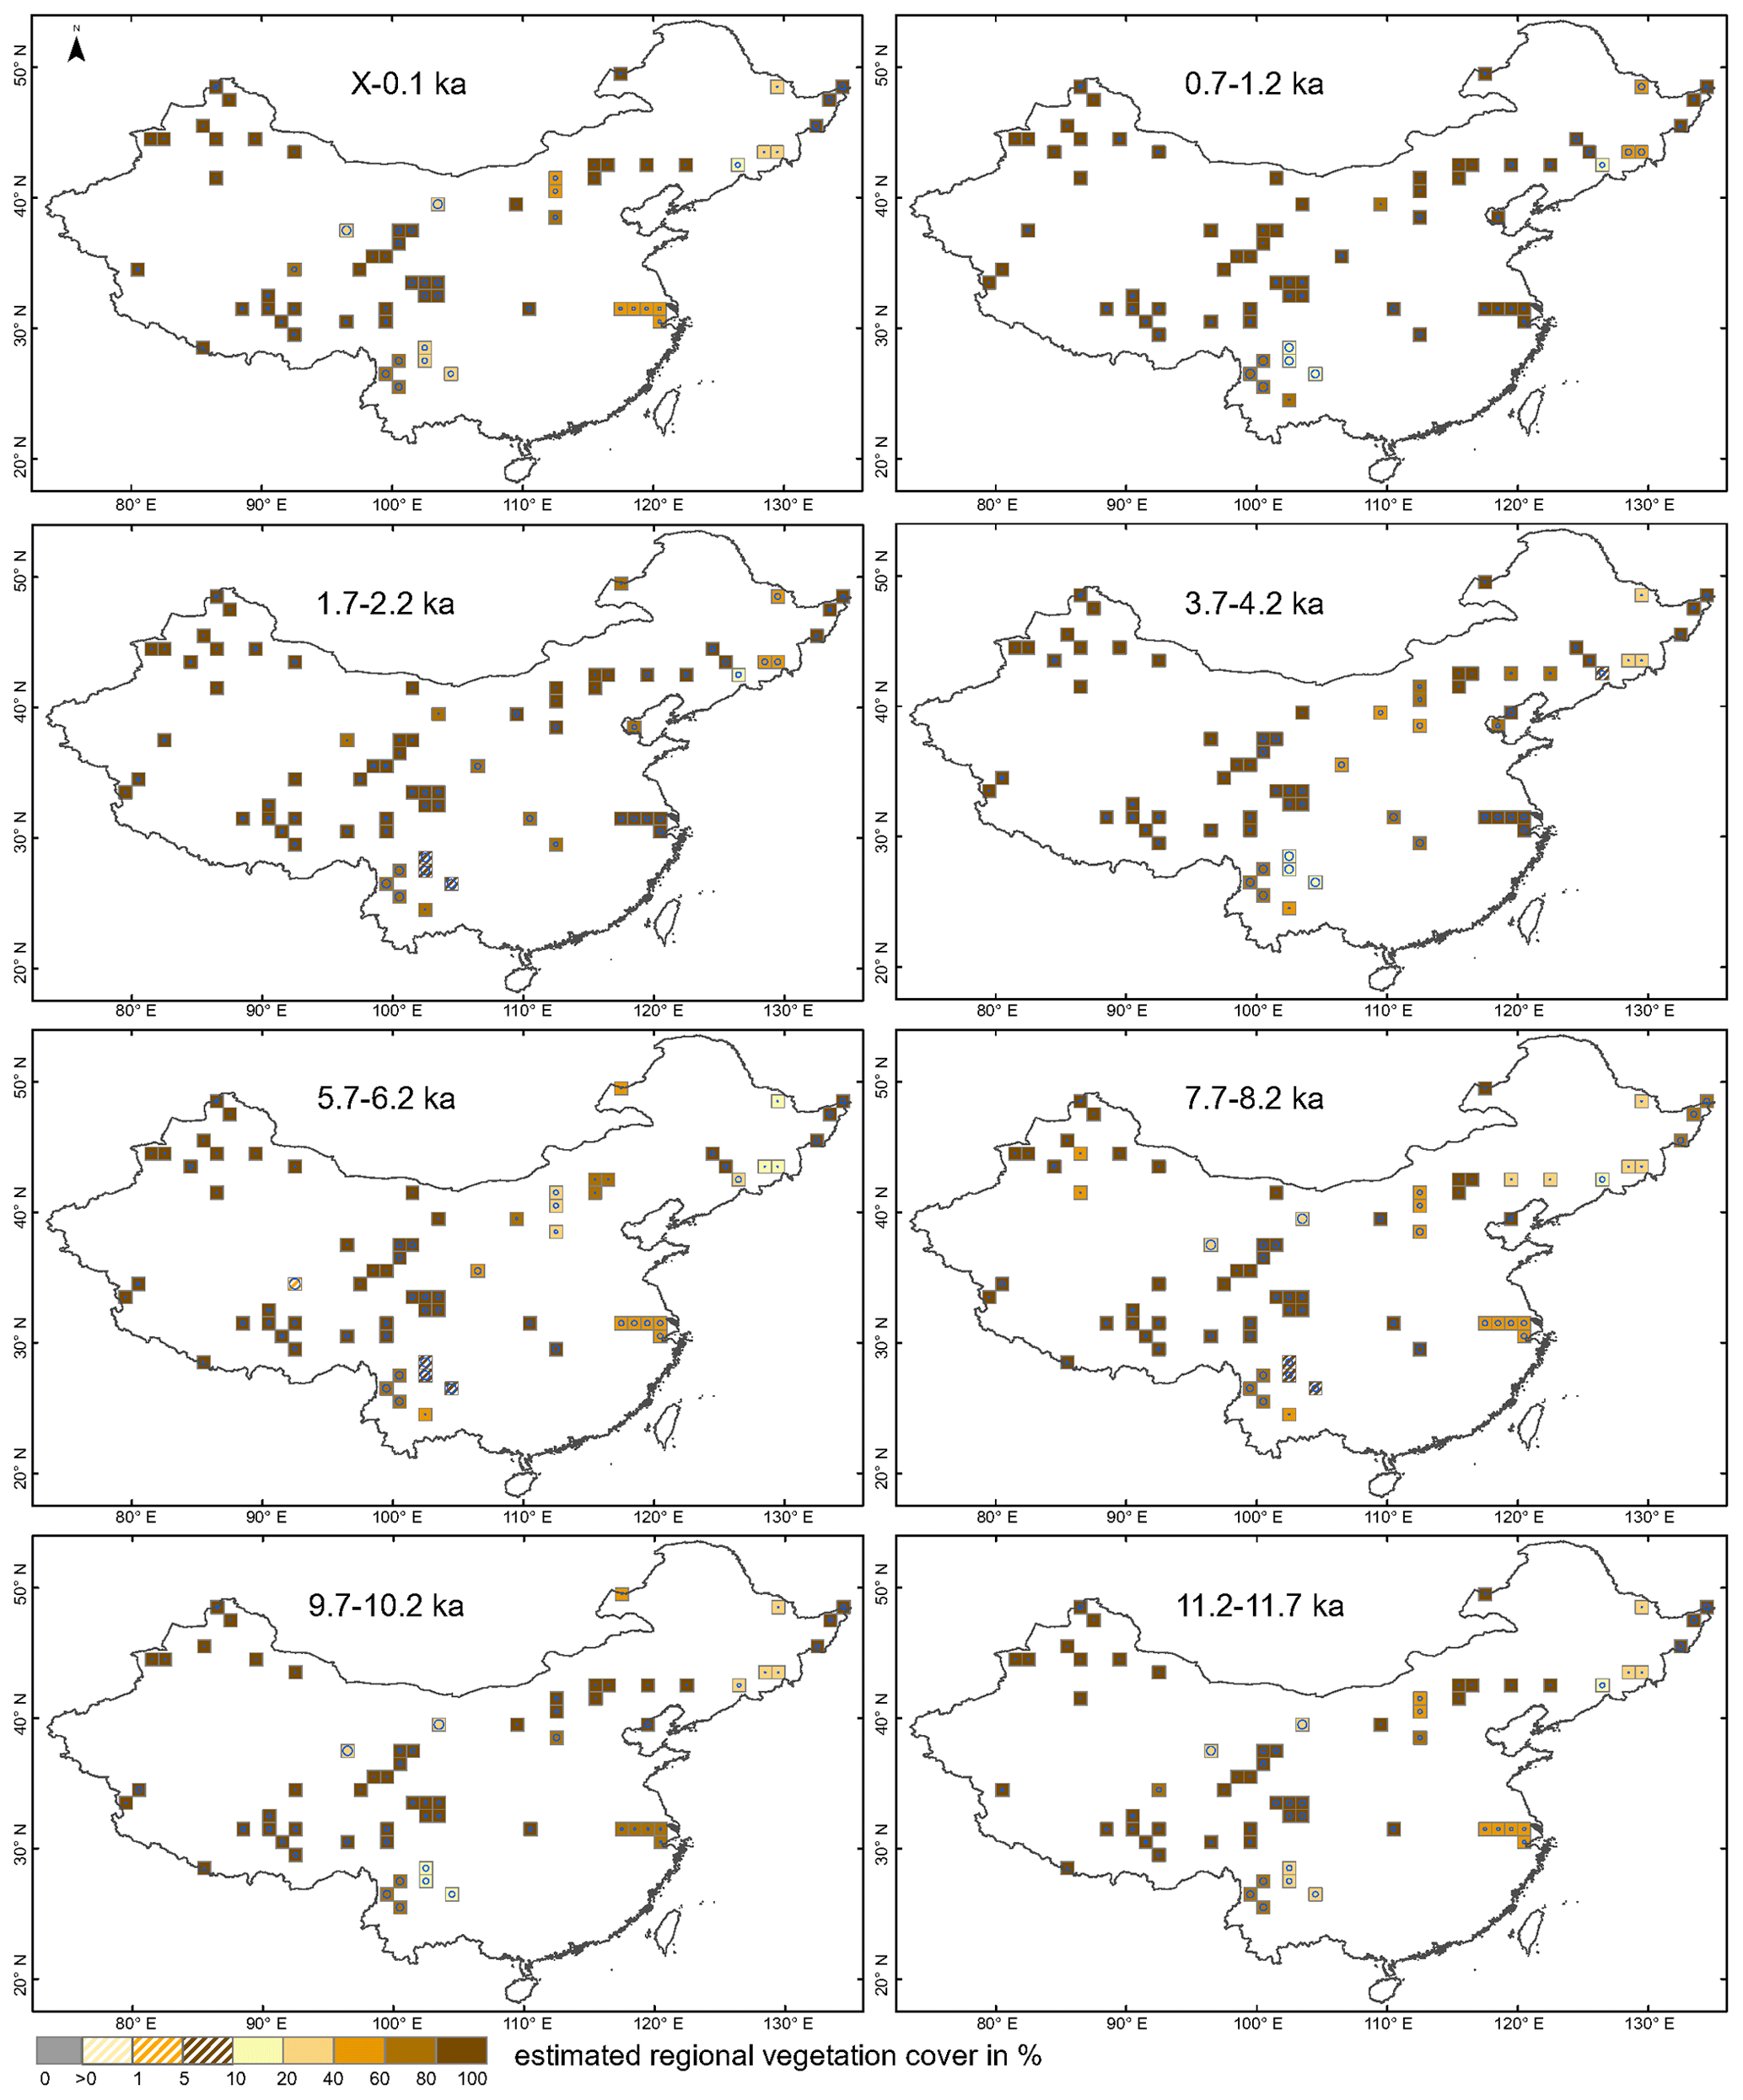
Figure 2Grid-based REVEALS estimates of C3 herbs/open land (C3H/OL) cover for eight selected time windows of the Holocene. Percentage cover in intervals of 1 % (>0 %–1 %), 4 % (>1 %–5 %), 5 % (>5 %–10 %), 10 % (>10 %–20 %), and 20 % (>20 %–100 %) is represented by increasingly dark colours from >0 %–1 % to >5 %–10 % and from >10 %–20 % to 80 %–100 %. Grid cells without pollen data for the time window but with pollen data in other time windows are shown in grey. Uncertainties in the REVEALS estimates are illustrated by blue circles of various sizes corresponding to the coefficient of variation (the standard error (SE) divided by the grid cell mean REVEALS estimate (RE)). If SE ≥ RE, the blue circle fills the entire grid cell. SE ≥ RE also implies that RE is not different from zero, which is the case primarily for low RE values.
The time window 11.7–11.2 ka is characterized by OL cover values of >80 % in most of northwestern China and the Tibetan Plateau. OL values of 40 %–60 % or 60 %–80 % are found in parts of southwestern China and Inner Mongolia. OL values of 40 %–60 % also occur in the lower reach of the Yangtze River region, and values of 20 %–40 % or 10 %–20 % in northeastern China. The time window 10.2–9.7 ka shows an increase in OL cover of 10 % in northeastern China and an increase to 60 %–80 % or >80 % in part of Inner Mongolia and the lower reaches of the Yangtze River basin, while a decrease by 20 % is seen in part of southwestern China. At 8.2–7.7 ka, the OL cover declines in most of the reconstructions, most drastically in parts of the Loess Plateau, central Inner Mongolia, and the lower reaches of the Yangtze River region, where OL decreases by 20 %–40 %, whilst a decrease by 10 %–20 % is seen in parts of northwestern China. At 6.2–5.7 ka, OL shows a further decrease by 20 % in Inner Mongolia, northeastern China, and southwestern China, and a decrease by 60 % on the central Tibetan Plateau. In contrast, an increase by 40 % is observed in part of northwestern China. At 4.2–3.7 ka, OL cover is >80 % in most of the regions of northwestern China. An increase by 50 % is observed in the lower reaches of the Yangtze River region and Inner Mongolia, by 20 % in part of the Loess Plateau and southwestern China, and by 10 %–20 % in part of northeastern China. In contrast, a decrease of OL cover by 10 %–30 % is seen in part of northeastern China. At 2.2–1.7 ka, OL cover increases in almost all regions, except for a decrease by 20 % in southwestern China. The increase in OL cover is 40 % in Inner Mongolia and Shanxi and 20 % in part of the Changbai Mountain region. Over the last ca. 100 years (0.1 ka to present), there has been no major change in OL cover except an increase by 10 % in southwestern China and a decrease by 20 % in part of northeastern China.
3.2 Coniferous trees (CT; Fig. 3)
CT is the sum of the reconstructed cover of three conifer taxa for which RPP estimates are available, Pinus and Cupressaceae (PFT TeNe) and Larix (PFT BNS) (Table 1). We chose to use only RPP values estimated in China (RPP synthesis of Li et al., 2018b) and, therefore, did not produce REVEALS estimates of the cover of Abies and Picea (Li et al., 2020). Today, these two taxa are common together with Pinus and Larix in the boreal forests and coniferous-broadleaved mixed woodlands (zones I and II, respectively). Abies and Picea also form woodland patches in the westernmost part of the subtropical broadleaved evergreen and deciduous forest (zone IV), and Abies and Pinus characterize the woodlands of the southwestern part of zone IV. Of the three conifer taxa for which REVEALS reconstructions are available, Pinus is the one with significant cover over most of the Holocene in all regions now characterized by coniferous woodland (or woodland patches) in central and eastern-northeastern China (Li et al., 2020). Pinus presents relatively large cover throughout the Holocene in the southwestern part of zone IV, the western part of zone VI, and the central part of zone II, while it presents lower cover in the eastern part of zone IV. Pinus provides some cover from 7 ka in the eastern part of zone VI and relatively high cover from 4.5 ka in the southeastern part of zone II and the eastern part of zone III. Significant cover of Cupressaceae was reconstructed for the early Holocene from some pollen records in the western part of zone IV and the easternmost part of zone VII (temperate desert), and for most of the Holocene in the western and northernmost parts of zone VI (temperate steppe) (Li et al., 2020). Larix is represented in zones II and VI (central and northernmost parts) by continuous high cover throughout the Holocene or the late Holocene only or by scattered occurrences of high cover over time (Li et al., 2020).
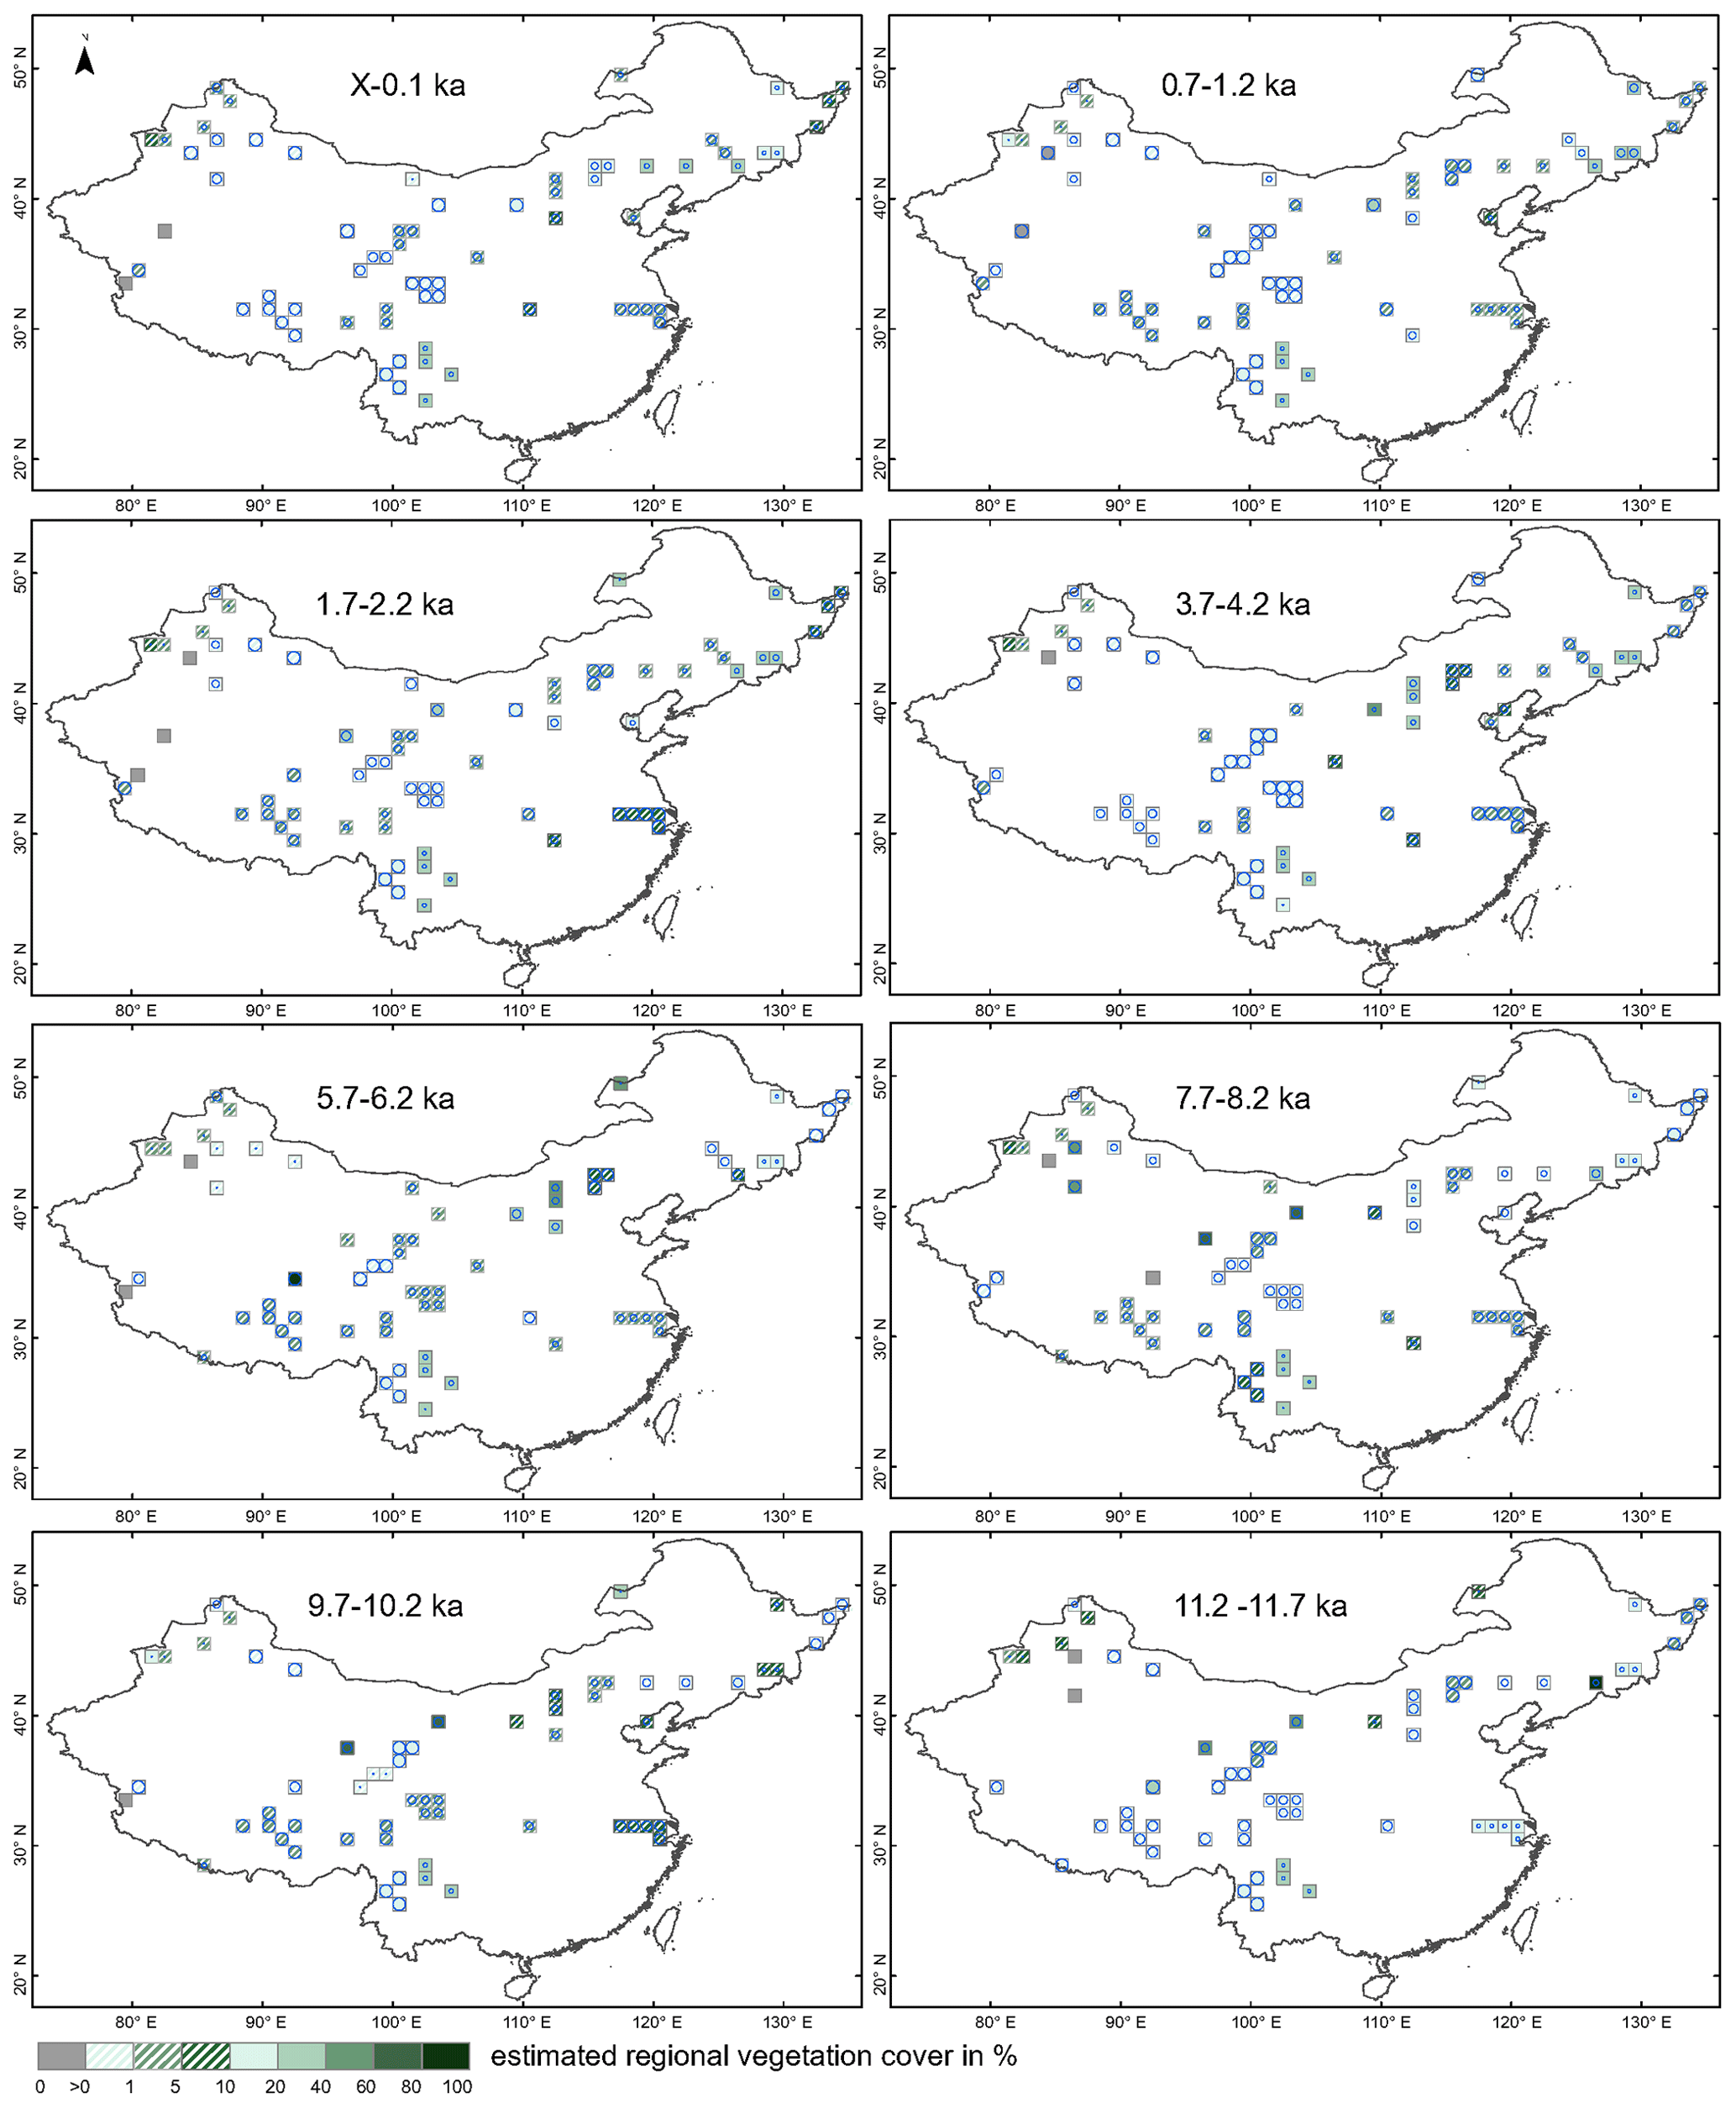
Figure 3Grid-based REVEALS estimates of coniferous tree (CT) cover for eight selected time windows of the Holocene. Percentage cover in intervals of 1 % (>0 %–1 %), 4 % (>1 %–5 %), 5 % (>5 %–10 %), 10 % (>10 %–20 %), and 20 % (>20 %–100 %) is represented by increasingly dark colours from >0 %–1 % to >5 %–10 % and from >10 %–20 % to 80 %–100 %. Grid cells without pollen data for the time window but with pollen data in other time windows are shown in grey. Uncertainties in the REVEALS estimates are illustrated by blue circles of various sizes corresponding to the coefficient of variation (the standard error (SE) divided by the grid cell mean REVEALS estimate (RE)). If SE ≥ RE, the blue circle fills the entire grid cell. SE ≥ RE also implies that RE is not different from zero, which is the case primarily for low RE values.
There is a consistent increase in CT cover in most grid cells over northern China during the first half of the Holocene, with maximum values occurring sometime between 8 and 5 ka (the timing depends on the region), before a steady decline in the values of CT cover. The time window 11.7–11.2 ka is characterized by CT cover values of over 80 % in part of northeastern China, 10 %–20 % or 20 %–40 % in southwestern China, and 10 %–20 % in the eastern part of northwestern China and in the lower reaches of the Yangtze River region. Elsewhere, CT cover is lower than 10 %. At 10.2–9.7 ka, the CT cover values decrease in almost all regions, with a declines by 10 % in the lower reaches of the Yangtze River and 10 %–20 % or 20 %–40 % in part of northwestern China. CT cover is slightly higher in the 8.2–7.7 ka time window in most of northeastern China (10 %–20 %), while a small drop is seen in the western part of southwestern China and the eastern part of northwestern China. The time window 6.2–5.7 ka is characterized by a decrease in CT cover by 10 %–20 % in northeastern China and by 40 % or 60 % in part of northwestern China. In contrast, CT cover increases by 20 %–40 % and ca. 5 % in Inner Mongolia and southwestern China, respectively. From 4.2–3.7 ka, CT cover exhibits a further decrease by a maximum of 20 % in most of Inner Mongolia and southwestern China. The CT cover at 2.2–1.7 ka is even lower, with declines by 10 % and >10 %–20 % occurring in the eastern part of northwestern China and the western part of northeastern China, respectively. There is, however, a slight increase in CT cover by 2 % in northwestern China and the lower reaches of the Yangtze River. At 1.2–0.7 ka, the CT cover decreases with 2 % on the Tibetan Plateau, in northwestern China, and the lower reaches of the Yangtze River. An increase in CT cover with ca. 10 % during the last century (0.1 ka to present) is found in southwestern, eastern, and most of northeastern China, while a decrease is seen in some parts of northeastern China.
3.3 Broadleaved trees (BT; Fig. 4)
BT is the sum of the reconstructed cover of 10 broadleaved tree taxa for which RPP estimates are available: Betula (PFT IBS), Castanea, Eleagnaceae, Fraxinus, Juglans, Quercus, Tilia, and Ulmus (PFT TeBS), and Castanopsis and Cyclobalanopsis (PFT TeBE) (Table 1). Betula presents significant cover throughout the Holocene in zone II and most of zone IV (Li et al., 2020). The summer green broadleaved tree taxa (TeBS) are characteristic of zones II, III, and IV, where they have relatively large cover throughout the Holocene, and of the southern border of vegetation zone VI, in particular through the mid-Holocene. The evergreen broadleaved tree taxa Castanopsis and Cyclobalanopsis are characteristic of vegetation zone IV and have relatively large cover in most of the zone (Li et al., 2020).

Figure 4Grid-based REVEALS estimates of broadleaved tree (BT) cover for eight selected time windows of the Holocene. Percentage cover in intervals of 1 % (>0 %–1 %), 4 % (>1 %–5 %), 5 % (>5 %–10 %), 10 % (>10 %–20 %), and 20 % (>20 %–100 %) is represented by increasingly dark colours from >0 %–1 % to >5 %–10 % and from >10 %–20 % to 80 %–100 %. Grid cells without pollen data for the time window but with pollen data in other time windows are shown in grey. Uncertainties in the REVEALS estimates are illustrated by blue circles of various sizes corresponding to the coefficient of variation (the standard error (SE) divided by the grid cell mean REVEALS estimate (RE)). If SE ≥ RE, the blue circle fills the entire grid cell. SE ≥ RE also implies that RE is not different from zero, which is the case primarily for low RE values.
The changes in cover of BT during the Holocene show similar trends to those for CT: a steady increase during the first half of the Holocene, with the highest values found in the time windows from 8.2–7.7 to 5.2–4.7 ka (depending on the region), followed by a steady decrease through the late Holocene. The oldest time window (11.7–11.2 ka) is characterized by the largest BT cover of the Holocene (>80 %) in northeastern China, and the second largest BT cover (20 %–40 %) in parts of Inner Mongolia and the lower reaches of the Yangtze River region. In contrast, the BT cover is <2 % in northwestern China and on the Tibetan Plateau. At 10.2–9.7 ka, the BT cover increases by ca. 10 % in part of northeastern China, while it decreases by 10 % in part of Inner Mongolia. An increase in BT cover by 10 % or 20 % in the time window 8.2–7.7 ka is seen in part of northeastern China and the lower reaches of the Yangtze River, while there is a decrease by 5 % in northeastern China. At 6.2–5.7 ka, BT cover decreases by 20 % in parts of central Inner Mongolia and southwestern China. Further decreases in cover by 20 %–30 % in the lower reaches of the Yangtze River and northeastern China and by 10 % in Inner Mongolia occur during 4.2–3.7 ka. BT cover further decreases at 2.2–1.7 ka by 10 % in the western and central parts of northeastern China, and at 1.2–0.7 ka by <10 %, 10 %, or 20 % in northeastern China and the lower reaches of the Yangtze River. In the last century (0.1 ka to present), BT cover has increased by 30 % and 20 % in the eastern part of northeastern China and in southwestern China, respectively. In contrast, the western part of northeastern China is characterized by a strong decrease in BT cover.
4.1 Accuracy and reliability of the REVEALS estimates of plant cover
For a detailed description of the accuracy and reliability of the REVEALS reconstructions, the reader is referred to Li et al. (2020). The quality of the REVEALS reconstructions is mainly reliant on the input data (pollen count quality and size), reliability of the chronologies of pollen records and the relative pollen productivities used, type and size of the pollen sites (lakes or bogs), number of pollen records used for reconstruction in each grid cell, and variation between pollen counts within a grid cell. The standard errors (SEs) of the REVEALS estimates are a measure of their accuracy and reliability. If SE < mean REVEALS estimate of cover, the result is considered to be reliable, which is the case for over 85 % of the reconstructions. If SE ≥ mean REVEALS estimate of cover, the result is not different from zero and is, therefore, not reliable. The latter occurs mainly in the lower reaches of the Yangtze River region.
Other issues may influence the reliability of the REVEALS estimates of plant cover. REVEALS was intended for pollen records from large lakes (Sugita, 2007a). Pollen records from bogs violate the model's assumption that no plants are growing on the surface of the deposition basin. Therefore, the local cover of major plant taxa such as Poaceae and Cyperaceae may bias pollen-based REVEALS estimates from bogs, in particular if the bog is large. This problem is discussed in detail in Li et al. (2020), where the cover of open land was considered to be overestimated in some grid cells due to this phenomenon, in particular in northeastern China. This issue and the theoretically inadequate application of REVEALS using a single pollen record from a small site (lake or bog) or a large bog in a grid cell are indicated as providing less reliable or unreliable REVEALS reconstructions of plant cover in Fig. 1 (black grid cells). Moreover, the number of sites and their type (lake or bog) and size (large or small) are provided for each site group (grid cell) and time window in Table S2. The uncertainty in the RPP estimates used is another factor influencing the reliability of the REVEALS reconstructions. We use the mean RPP estimates from the Chinese synthesis published in Li et al. (2018b). The assumptions are that the RPP estimates are constant through time and that the mean RPP estimates are a good approximation for the plant taxa over the entire study region. Although we do not know whether the RPP estimates were constant through the Holocene for the plant taxa used in the reconstructions, this assumption is necessary if we are to reconstruct changes in the abundance or absolute cover of plants from changes in pollen percentages over time (e.g. Birks and Birks, 1980; Sugita, 2007a). Mean RPP estimates are most reliable for large regions if they are based on a large number of RPP values that are well distributed within the study region, and if these values do not differ very significantly from each other. A measure of variability among RPP values is provided by the SD of the mean RPP, which is in turn imbedded in the REVEALS estimate's SE of a plant taxon's cover. However, none of the SDs are very large in relation to the mean RPP values we are using (Table 1). The SD is larger than a tenth of the mean RPP value for 10 of the 27 taxa used (i.e. Elaeagnaceae, Fraxinus, Tilia, Ulmus, Amaranthaceae/Chenopodiaceae, Brassicaceae, Convolvulaceae, and Ranunculaceae; Table 1); however, the SD is less than a fifth of the mean RPP value except for Fraxinus, Ulmus, Brassicaceae, and Ranunculaceae (the SD is ca. a fifth of the mean RPP), Rosaceae (the SD is ca. a third of the mean RPP) and Rubiaceae (the SD is ca. a quarter of the mean RPP). There is no way to measure the uncertainty that may be caused by the use of a mean RPP value based on too few RPP values, or RPP values that are not representative of all major vegetation zones of the study region. The number of values available in the calculation of the mean RPP estimates and the locations of the RPP studies in terms of vegetation zones are provided in Table 1. This information can be a means to identify RPP estimates that might be uncertain for REVEALS land-cover reconstructions in general or for certain regions in particular. At the time of the analysis, there was only one RPP value for 14 of the 27 taxa in this study, i.e. Cupressaceae, Castanea, Elaeagnaceae, Fraxinus, Juglans, Tilia, Castanopsis, Brassicaceae, Cannabis/Humulus, Convolvulaceae, Liliaceae, Ranunculaceae, Rosaceae, and Rubiaceae. Therefore, the REVEALS estimates for these taxa should be considered with caution. The REVEALS estimates for Castanopsis and Cyclobalanopsis are also uncertain because, in the absence of RPP estimates for these two taxa, we instead used the RPP estimates of Castanea and Quercus, respectively, assuming comparable pollen productivities for these taxa (see Li et al., 2020, for further details on this issue).
4.2 Limitations of the pollen-based REVEALS plant cover
The REVEALS model estimates the proportion of each plant taxon in relation to the total cover of all taxa with the RPP estimates available (in this case, 27 taxa) rather than its actual cover if all existing taxa could be considered. The same consideration is valid for the REVEALS cover of the three major land-cover types C3H/OL, CT, and BT. This is a serious caveat if the pollen taxa for which no RPP values are available represent a significant part of the pollen assemblages. In this first dataset of REVEALS land-cover estimates, our decision to use exclusively Chinese RPP estimates and, therefore, not to reconstruct the cover of Abies and Picea is a major issue. This may bias the results by overestimating the cover of C3H/OL in particular, but also that of BT. The latter needs to be kept in mind in the interpretation and use of the dataset for regions where Abies and Picea were common during part of or the entire Holocene, which was the case mainly in vegetation zones II and IV (see the results for CT for more details).
Another important caveat of all REVEALS reconstructions is that the cover of bare ground in a landscape cannot be inferred by the model. However, bare ground was (and still is) a significant portion of the land cover in regions characterized by desert, steppe, and high-altitude vegetation (zones VI, VII, and VIII in this study). So far, there has only been one attempt at estimating bare ground in the past (Sun et al., 2022). It used the modern relationship between tree pollen and the cover of bare ground in northern-central China and the modern analogue technique (MAT) to estimate the past cover of bare ground using fossil pollen records from the same region. The MAT-estimated cover of bare ground is then used to correct REVEALS-estimated plant cover from the same fossil pollen records. The results suggest that bare ground covered 40 % to 60 % of the land, and that the uncorrected REVEALS reconstructions overestimate the cover of trees by ca. 50 %, which can have implications if the pollen-based REVEALS land cover is used in palaeoclimate model experiments. In the context of palaeoclimate modelling, the interpretation of the open-land fraction (with or without bare ground) in terms of deforestation (a human-induced decrease in tree cover) remains problematic due to the possible occurrence of herb taxa in natural, climate-induced, and human-induced vegetation types, i.e. the reconstructed open-land cover can be either natural or human-induced or both. This issue is discussed thoroughly in Li et al. (2020), as is the difficulty of inferring the occurrence of past crops such as rice and millet from pollen records. Although pollen of cereals such as Triticum (wheat), Hordeum (barley), and Zea mays (corn) can be separated from pollen of wild grasses, a RPP value for these types of cereals could not be estimated in the study of Li et al. (2018b). Moreover, pollen grains from several crops belonging to the families Fabaceae, Brassicaceae, Asteraceae, and Apiaceae cannot be separated from the wild species (Ni et al., 2014). The interpretation of past changes in open-land cover needs to take into account the issues described above. This is a limitation of the gridded REVEALS land-cover dataset if used for the validation of ALCC scenarios and in studies of human-induced land-cover change as a climate forcing. An overestimation of deforestation in ALCCs can be detected in a comparison with REVEALS estimates of past open land, whereas an underestimation cannot be demonstrated (Harrison et al., 2020). This issue is particularly problematic in regions of northern China where steppes, desert, and meadows were dominant over most of the Holocene. Similar limitations exist for the gridded REVEALS land-cover datasets in Europe, although they are less serious, as early agriculture developed primarily on land where woodland was the natural climate-induced vegetation cover and only a small fraction of the continent was characterized by steppe vegetation (Trondman et al., 2015; Githumbi et al., 2022a; Strandberg et al., 2022).
The time resolution of the REVEALS reconstructions (500 years over most of the Holocene) is another limitation in terms of the quantification of land-cover change. A relatively low time resolution implies that major but rapid land-cover changes will be missed or underestimated, as they will be agglomerated into a mean cover over 500 years. The chosen time resolution is a compromise to improve the quality of the REVEALS estimates by increasing pollen sums for pollen records characterized by a low time resolution of pollen counts (i.e. decreasing the standard error of the reconstruction; see the Methods section for more details). Increasing the time resolution would be an advantage only for regions and periods of the Holocene for which most of the pollen records have a high time resolution.
Finally, half of the 36 REVEALS reconstructions are based on pollen records located within several adjacent 1∘ × 1∘ grid cells (a total of 57 1∘ × 1∘ grid cells divided into 18 groups of 2 to 5 grid cells; Fig. 1) rather than within single 1∘ × 1∘ grid cells (the other half of the reconstructions). This implies that these REVEALS estimates of cover represent a mean cover for areas of 1∘ × 2∘ to 1∘ × 5∘. The latter can be a limitation if the dataset of past land cover is used for studies in which the variability of plant cover at a 1∘ × 1∘ spatial scale is of importance. We opted for this deviation from the standard protocol (Trondman et al., 2015; Githumbi et al., 2022a) because of the low spatial density of pollen records in many parts of China and its negative consequence for the quality of the REVEALS reconstructions (see the Methods section for more details).
The quantitative reconstruction of land cover at regional to global scales is necessary for the study of climate–land cover interactions using both regional and global climate models, and for the evaluation of ALCC scenarios and dynamic vegetation models. This first dataset of REVEALS land cover for temperate and northern subtropical China is a contribution to PAGES LandCover6k, the purpose of which is to provide datasets of Holocene pollen-based land cover and archaeology-based land use that are useful for (palaeo)climate modelling (Gaillard et al., 2018; Harrison et al., 2020). Such datasets are an alternative to pollen-based reconstructions of vegetation cover using biomization (Prentice and Webb, 1998) or the modern analogue technique (Overpeck et al., 1985). REVEALS reconstructions have the advantage of providing estimates of cover for individual plant taxa that can be aggregated into cover of groups of taxa such as PFTs or land-cover units. They can be used for various purposes, such as the evaluation of scenarios of past deforestation (HYDE and KK) (Kaplan et al., 2017) or for comparison with simulations of past vegetation cover using dynamic vegetation models (Marquer et al., 2014, 2017). When used in climate modelling experiments that look into e.g. past human-induced land cover (or land use) as a climate forcing, the REVEALS plant-cover data need to be interpolated over all grid cells of the simulated geographical domain using, for instance, spatial statistics (e.g. Strandberg et al., 2022; see also the Introduction). Such studies have not been performed in China so far, although a comparison of the REVEALS reconstructions of open-land, CT, and BT cover presented here with HYDE 3.2 and KK10 is in progress. Further, studies attempting to disentangle the effects of climate and land-use change on plant cover through the Holocene or looking into changes in diversity indices based on REVEALS estimates of past plant cover (e.g. studies by Marquer et al., 2014, 2017, in Europe) would also be of great interest in a Chinese context. Another possible use of Holocene REVEALS-estimated plant cover is the comparison of regional plant-cover change with archaeological data to study the effect of large-scale changes in population growth and settlement patterns and density on vegetation cover in the past. A first attempt at such a comparison in eastern China has shown that phases of deforestation as interpreted from the REVEALS estimates of open-land cover between 6 and 3 ka are well correlated with changes in settlement densities over the same time period, as suggested by archaeological data and population growth based on 14C dates of archaeological artefacts (Li et al., 2018a).
All data files are available for public download at the National Tibetan Plateau Data Center (TPDC; https://doi.org/10.11888/Paleoenv.tpdc.272292; Li, 2022). For more details on the files available at the link, see Sect. 2.4 on the data format.
This paper describes the first dataset of Holocene gridded pollen-based REVEALS reconstructions of plant taxa at a 1∘ × 1∘ spatial scale and a continuous temporal scale of 500 years (350, 250, and 100+x years from 0.7 ka to 1950 CE + x years (x is the number of years between 1950 CE and the year of coring)). The reconstructions are based on 94 pollen records in temperate and northern subtropical China and include land-cover estimates for 27 plant taxa and aggregation to plant functional types and three land-cover types. The REVEALS model assumptions and the limitations of this particular application are clearly stated in order to facilitate a correct and cautious interpretation and assessment of the results. In particular, the consequences of the lack of estimates for the cover of two major conifer trees (Abies and Picea), bare ground, and crop land need to be taken into account in any studies using the dataset, in particular for vegetation zones II and IV (Abies, Picea) and VI, VII, and VIII (bare ground, crop land). Examples of its uses are the evaluation of model-simulated vegetation cover and deforestation from dynamic vegetation models and ALCC scenarios, respectively, as well as studies of past land-use change as a climate forcing during the Holocene. In all uses of the presented gridded REVEALS land-cover dataset, the limitations of the REVEALS reconstructions have to be taken into account carefully (see the Discussion section for more details). Reconstructions of plant cover at a local spatial scale can be of value in archaeological contexts. One of the input data required for the application of the LOcal Vegetation Estimates model (LOVE; Sugita, 2007b) to estimate local plant cover is the regional plant cover. The dataset of gridded REVEALS reconstructions may be a way to achieve reconstructions of local plant cover with the condition that the pollen records used for the LOVE application are not used in the REVEALS reconstructions of the dataset (Cui et al., 2013; Mazier et al., 2015).
This dataset is the first generation of gridded REVEALS Holocene land-cover reconstructions for China. We expect that, in the future, new generations of such datasets will develop, in which the quality and spatial extent of the REVEALS estimates will be further improved as more pollen records become available, and additional RPP studies will gradually increase both the number of RPP values per taxon and the number of taxa for which RPP estimates are available.
The supplement related to this article is available online at: https://doi.org/10.5194/essd-15-95-2023-supplement.
FL and MJG conceptualized and coordinated the study as a contribution to the PAGES working group “LandCover6k”. SS solved all specific issues related to the application of REVEALS in the context of China's vegetation history and available pollen records. FL, XC, UH, and JN were responsible for the collection of new pollen records from individual authors. YZ contributed several published and unpublished pollen records and made comments and edits to the manuscript. JN, CA, XH, YL, HL, AS, and YY contributed pollen data. FL had the major responsibility of handling pollen data files, collected related metadata, and performed the REVEALS application. FL and MJG are responsible for the paper's main objective and structure, FL prepared the first draft of the manuscript and all figures and tables, and finalized the manuscript for submission. MJG contributed to the text in all its versions and checked the content and English language of the final manuscript. All co-authors contributed comments about and corrections to the manuscript.
The contact author has declared that none of the authors has any competing interests.
Publisher's note: Copernicus Publications remains neutral with regard to jurisdictional claims in published maps and institutional affiliations.
We are grateful to all palynologists who contributed original pollen counts either to this work (Bo Cheng, Yaqin Hu, Jie Li, Shicheng Tao, YongBo Wang, Ruilin Wen, Qinghai Xu, and Zhuo Zheng) or to the pollen database published by Cao et al. (2013), from which we used a number of pollen records in this study.
This work is supported by the National Science Foundation of China (NSFC) (PI Furong Li) (grant no. 42101143) and funds from the Swedish Strategical Research Area ModEling the Regional and Global Ecosystem, MERGE (http://www.merge.lu.se/, last access: 3 January 2022) (Furong Li (until 2019) and Marie-José Gaillard). We also received financial support from the Swedish Foundation for International Cooperation in Research and Higher Education (STINT) and the NSFC (grant no. 41611130050) for a Sweden-China Exchange Grant 2016–2019 (PIs Marie-José Gaillard and Qinghai Xu). Furong Li (until 2020) and Marie-José Gaillard received support from the Faculty of Health and Life Sciences at Linnaeus University, Kalmar, Sweden. This study was undertaken as part of the Past Global Changes (PAGES) project and its working group LandCover6k that in turn received support from the Swiss National Science Foundation, the Swiss Academy of Sciences, the US National Science Foundation, and the Chinese Academy of Sciences.
This paper was edited by David Carlson and reviewed by Ralph Fyfe and two anonymous referees.
Birks, H. J. B. and Birks, H. H.: Quaternary palaeoecology, Edward Arnold, London, 289 pp., ISBN 0-7131-2781-3, 1980.
Blaauw, M. and Christen, J. A.: Flexible paleoclimate age-depth models using an autoregressive gamma process, Bayesian Anal., 6, 457–474, https://doi.org/10.1214/11-BA618, 2011.
Cao, X., Tian, F., Li, F., Gaillard, M.-J., Rudaya, N., Xu, Q., and Herzschuh, U.: Pollen-based quantitative land-cover reconstruction for northern Asia covering the last 40 ka cal BP, Clim. Past, 15, 1503–1536, https://doi.org/10.5194/cp-15-1503-2019, 2019.
Cao, X.-Y., Ni, J., Herzschuh, U., Wang, Y.-B., and Zhao, Y.: A late Quaternary pollen dataset from eastern continental Asia for vegetation and climate reconstructions: Set up and evaluation, Rev. Palaeobot. Palynol., 194, 21–37, https://doi.org/10.1016/j.revpalbo.2013.02.003, 2013.
Chen, F., Chen, J., Holmes, J., Boomer, I., Austin, P., Gates, J. B., Wang, N., Brooks, S. J., and Zhang, J.: Moisture changes over the last millennium in arid central Asia: a review, synthesis and comparison with monsoon region, Quaternary Sci. Rev., 29, 1055–1068, https://doi.org/10.1016/j.quascirev.2010.01.005, 2010.
Claussen, M., Bathiany, S., Brovkin, V., and Kleinen, T.: Simulated climate-vegetation interaction in semi-arid regions affected by plant diversity, Nat. Geosci., 6, 954–958, https://doi.org/10.1038/ngeo1962, 2013.
Cui, Q. Y., Gaillard, M. J., Lemdahl, G., Sugita, S., Greisman, A., Jacobson, G. L., and Olsson, F.: The role of tree composition in Holocene fire history of the hemiboreal and southern boreal zones of southern Sweden, as revealed by the application of the Landscape Reconstruction Algorithm: Implications for biodiversity and climate-change issues, The Holocene, 23, 1747–1763, https://doi.org/10.1177/0959683613505339, 2013.
Davis, M. B.: On the theory of pollen analysis, Am. J. Sci., 261, 897–912, 1963.
Dawson, A., Cao, X., Chaput, M., Hopla, E., Li, F., Edwards, M., Fyfe, R., Gajewski, K., Goring, S. J., Herzschuh, U., Mazier, F., Sugita, S., Williams, J., Xu, Q., and Gaillard, M.-J.: Finding the magnitude of human-induced Northern Hemisphere land-cover transformation between 6 and 0.2 ka BP, Past Global Changes Magazine, 26, 34–35, https://doi.org/10.22498/pages.26.1.34, 2018.
Gaillard, M.-J., Sugita, S., Mazier, F., Trondman, A.-K., Broström, A., Hickler, T., Kaplan, J. O., Kjellström, E., Kokfelt, U., Kuneš, P., Lemmen, C., Miller, P., Olofsson, J., Poska, A., Rundgren, M., Smith, B., Strandberg, G., Fyfe, R., Nielsen, A. B., Alenius, T., Balakauskas, L., Barnekow, L., Birks, H. J. B., Bjune, A., Björkman, L., Giesecke, T., Hjelle, K., Kalnina, L., Kangur, M., van der Knaap, W. O., Koff, T., Lagerås, P., Latałowa, M., Leydet, M., Lechterbeck, J., Lindbladh, M., Odgaard, B., Peglar, S., Segerström, U., von Stedingk, H., and Seppä, H.: Holocene land-cover reconstructions for studies on land cover-climate feedbacks, Clim. Past, 6, 483–499, https://doi.org/10.5194/cp-6-483-2010, 2010.
Gaillard, M.-J., Kleinen, T., Samuelsson, P., Nielsen, A. B., Bergh, J., Kaplan, J., Poska, A., Sandström, C., Strandberg, G., Trondman, A.-K., and Wramneby, A.: Causes of Regional Change–Land Cover, in: Second Assessment of Climate Change for the Baltic Sea Basin. Regional Climate Studies, edited by: The BACC II Author Team, Springer, Cham, https://doi.org/10.1007/978-3-319-16006-1_25, 2015.
Gaillard, M.-J., Morrison, K., Madella, M., and Whitehouse, N.: Past land-use and land-cover change: the challenge of quantification at the subcontinental to global scales, Pages Magazine, 26, 1, https://doi.org/10.22498/pages.26.1.3, 2018.
Githumbi, E., Fyfe, R., Gaillard, M.-J., Trondman, A.-K., Mazier, F., Nielsen, A.-B., Poska, A., Sugita, S., Woodbridge, J., Azuara, J., Feurdean, A., Grindean, R., Lebreton, V., Marquer, L., Nebout-Combourieu, N., Stančikaitė, M., Tanţău, I., Tonkov, S., Shumilovskikh, L., and LandClimII data contributors: European pollen-based REVEALS land-cover reconstructions for the Holocene: methodology, mapping and potentials, Earth Syst. Sci. Data, 14, 1581–1619, https://doi.org/10.5194/essd-14-1581-2022, 2022a.
Githumbi, E., Pirzamanbein, B., Lindström, J., Poska, A., Fyfe, R., Mazier, F., Nielsen, A. B., Sugita, S., Trondman, A.-K., Woodbridge, J., and Gaillard, M.-J.: Pollen-Based Maps of Past Regional Vegetation Cover in Europe Over 12 Millennia – Evaluation and Potential, Front. Ecol. Evol., 10, https://doi.org/10.3389/fevo.2022.795794, 2022b.
Harrison, S. P., Gaillard, M.-J., Stocker, B. D., Vander Linden, M., Klein Goldewijk, K., Boles, O., Braconnot, P., Dawson, A., Fluet-Chouinard, E., Kaplan, J. O., Kastner, T., Pausata, F. S. R., Robinson, E., Whitehouse, N. J., Madella, M., and Morrison, K. D.: Development and testing scenarios for implementing land use and land cover changes during the Holocene in Earth system model experiments, Geosci. Model Dev., 13, 805–824, https://doi.org/10.5194/gmd-13-805-2020, 2020.
Hellman, S., Gaillard, M.-J., Broström, A., and Sugita, S.: The REVEALS model, a new tool to estimate past regional plant abundance from pollen data in large lakes: validation in southern Sweden, J. Quaternary Sci., 23, 21–42, https://doi.org/10.1002/jqs.1126, 2008a.
Hellman, S. E. V., Gaillard, M.-J., Broström, A., and Sugita, S.: Effects of the sampling design and selection of parameter values on pollen-based quantitative reconstructions of regional vegetation: a case study in southern Sweden using the REVEALS model, Veg. Hist. Archaeobot., 17, 445–459, https://doi.org/10.1007/s00334-008-0149-7, 2008b.
Hou, X.: 1:1 million vegetation map of China, National Tibetan Plateau Data Center [data set], https://data.tpdc.ac.cn/zh-hans/data/eac4f2cf-d527-4140-a35d-79992957f043/ (last access: 6 January 2023), 2019.
Huntley, B. and Birks, H. J. B.: An atlas of past and present pollen maps for Europe: 0–13,000 years ago, Cambridge University Press, Cambridge, 1983.
Huntley, B. and Webb III, T.: Vegetation history, Dr W. Junk, Dordrecht, 803 ppp., ISBN 90-6193-188-6, 1988.
Jackson, S. T. and Lyford, M. E.: Pollen dispersal models in Quaternary plant ecology: Assumptions, parameters, and prescriptions, Bot. Rev., 65, 39–75, https://doi.org/10.1007/BF02856557, 1999.
Kaplan, J. O., Krumhardt, K. M., and Zimmermann, N.: The prehistoric and preindustrial deforestation of Europe, Quaternary Sci. Rev., 28, 3016–3034, https://doi.org/10.1016/j.quascirev.2009.09.028, 2009.
Kaplan, J. O., Krumhardt, K. M., Gaillard, M. J., Sugita, S., Trondman, A. K., Fyfe, R., Marquer, L., Mazier, F., and Nielsen, A. B.: Constraining the Deforestation History of Europe: Evaluation of Historical Land Use Scenarios with Pollen-Based Land Cover Reconstructions, Land, 6, 91, https://doi.org/10.3390/land6040091, 2017.
Klein Goldewijk, K., Beusen, A., van Drecht, G., and de Vos, M.: The HYDE 3.1 spatially explicit database of human-induced global land-use change over the past 12,000 years, Global Ecol. Biogeogr., 20, 73–86, https://doi.org/10.1111/j.1466-8238.2010.00587.x, 2011.
Klein Goldewijk, K., Beusen, A., Doelman, J., and Stehfest, E.: Anthropogenic land use estimates for the Holocene – HYDE 3.2, Earth Syst. Sci. Data, 9, 927–953, https://doi.org/10.5194/essd-9-927-2017, 2017.
Li, F.: Gridded pollen-based Holocene regional plant cover in temperate and northern subtropical China, National Tibetan Plateau Data Center [data set], https://doi.org/10.11888/Paleoenv.tpdc.272292, 2022.
Li, F., Cao, X., Herzschuh, U., Jia, X., Sugita, S., Tarasov, P., Wagner, M., Xu, Q., Chen, F., Sun, A., and Gaillard, M.-J.: What do pollen-based quantitative reconstructions of plant cover tell us about past anthropogenic deforestation in eastern china?, Pages Magazine, 26, 32–33, https://doi.org/10.22498/pages.26.1.32, 2018a.
Li, F., Gaillard, M.-J., Xu, Q., Bunting, M. J., Li, Y., Li, J., Mu, H., Lu, J., Zhang, P., Zhang, S., Cui, Q., Zhang, Y., and Shen, W.: A Review of Relative Pollen Productivity Estimates From Temperate China for Pollen-Based Quantitative Reconstruction of Past Plant Cover, Front Plant Sci. 9, 1214, https://doi.org/10.3389/fpls.2018.01214, 2018b.
Li, F., Gaillard, M.-J., Cao, X., Herzschuh, U., Sugita, S., Tarasov, P. E., Wagner, M., Xu, Q., Ni, J., Wang, W., Zhao, Y., An, C., Beusen, A. H. W., Chen, F., Feng, Z., Goldewijk, C. G. M. K., Huang, X., Li, Y., Li, Y., Liu, H., Sun, A., Yao, Y., Zheng, Z., and Jia, X.: Towards quantification of Holocene anthropogenic land-cover change in temperate China: A review in the light of pollen-based REVEALS reconstructions of regional plant cover, Earth-Sci. Rev., 203, 103119, https://doi.org/10.1016/j.earscirev.2020.103119, 2020.
Lu, Z., Miller, P. A., Zhang, Q., Zhang, Q., Wårlind, D., Nieradzik, L., Sjolte, J., and Smith, B.: Dynamic vegetation simulations of the mid-Holocene Green Sahara, Geophys. Res. Lett., 45, 8294–8303, https://doi.org/10.1029/2018GL079195, 2018.
Marquer, L., Gaillard, M.-J., Sugita, S., Trondman, A.-K., Mazier, F., Nielsen, A. B., Fyfe, R. M., Odgaard, B. V., Alenius, T., Birks, H. J. B., Bjune, A. E., Christiansen, J., Dodson, J., Edwards, K. J., Giesecke, T., Herzschuh, U., Kangur, M., Lorenz, S., Poska, A., Schult, M., and Seppä, H.: Holocene changes in vegetation composition in northern Europe: why quantitative pollen-based vegetation reconstructions matter, Quaternary Sci. Rev., 90, 199–216, https://doi.org/10.1016/j.quascirev.2014.02.013, 2014.
Marquer, L., Gaillard, M.-J., Sugita, S., Poska, A., Trondman, A.-K., Mazier, F., Nielsen, A. B., Fyfe, R. M., Jönsson, A. M., Smith, B., Kaplan, J. O., Alenius, T., Birks, H. J. B., Bjune, A. E., Christiansen, J., Dodson, J., Edwards, K. J., Giesecke, T., Herzschuh, U., Kangur, M., Koff, T., Latałowa, M., Lechterbeck, J., Olofsson, J., and Seppä, H.: Quantifying the effects of land use and climate on Holocene vegetation in Europe, Quaternary Sci. Rev., 171, 20–37, https://doi.org/10.1016/j.quascirev.2017.07.001, 2017.
Mazier, F., Gaillard, M. J., Kuneš, P., Sugita, S., Trondman, A. K., and Broström, A.: Testing the effect of site selection and parameter setting on REVEALS-model estimates of plant abundance using the Czech Quaternary Palynological Database, Rev. Palaeobot. Palynol., 187, 38–49, https://doi.org/10.1016/j.revpalbo.2012.07.017, 2012.
Mazier, F., Broström, A., Bragée, P., Fredh, D., Stenberg, L., Thiere, G., Sugita, S., and Hammarlund, D.: Two hundred years of land-use change in the South Swedish Uplands: comparison of historical map-based estimates with a pollen-based reconstruction using the landscape reconstruction algorithm, Veg. Hist. Archaeobot., 24, 555–570, https://doi.org/10.1007/s00334-015-0516-0, 2015.
Morrison, K., Gaillard, M. J., Madella, M., Whitehouse, N., and Hammer, E.: Land-use classification, Past Global Change Magazine, 24, 40–40, https://doi.org/10.22498/pages.24.1.40, 2016.
Ni, J., Yu, G., Harrison, S. P., and Prentice, I. C.: Palaeovegetation in China during the late Quaternary: Biome reconstructions based on a global scheme of plant functional types, Palaeogeogr. Palaeocl., 289, 44–61, https://doi.org/10.1016/j.palaeo.2010.02.008, 2010.
Ni, J., Cao, X., Jeltsch, F., and Herzschuh, U.: Biome distribution over the last 22,000 yr in China, Palaeogeogr. Palaeocl., 409, 33–47, https://doi.org/10.1016/j.palaeo.2014.04.023, 2014.
Overpeck, J. T., Webb Iii, T., and Prentice, I. C.: Quantitative interpretation of fossil pollen spectra: Dissimilarity coefficients and the method of modern analogs, Quaternary Res., 23, 87–108, https://doi.org/10.1016/0033-5894(85)90074-2, 1985.
Pirzamanbein, B., Lindström, J., Poska, A., Sugita, S., Trondman, A.-K., Fyfe, R., Mazier, F., Nielsen, A. B., Kaplan, J. O., Bjune, A. E., Birks, H. J. B., Giesecke, T., Kangur, M., Latałowa, M., Marquer, L., Smith, B., and Gaillard, M.-J.: Creating spatially continuous maps of past land cover from point estimates: A new statistical approach applied to pollen data, Ecol. Complex., 20, 127–141, https://doi.org/10.1016/j.ecocom.2014.09.005, 2014.
Prentice, I. C.: Pollen representation, source area, and basin size: Toward a unified theory of pollen analysis, Quaternary Res., 23, 76–86, https://doi.org/10.1016/0033-5894(85)90073-0, 1985.
Prentice, I. C. and Webb III, T.: BIOME 6000: reconstructing global mid-Holocene vegetation patterns from palaeoecological records, J. Biogeogr., 25, 997–1005, https://doi.org/10.1046/j.1365-2699.1998.00235.x, 1998.
Ren, G. and Beug, H.-J.: Mapping Holocene pollen data and vegetation of China, Quaternary Sci. Rev., 21, 1395–1422, https://doi.org/10.1016/S0277-3791(01)00119-6, 2002.
Ren, G. and Zhang, L.: A preliminary mapped summary of holocene pollen data for northeast China, Quaternary Sci. Rev., 17, 669–688, https://doi.org/10.1016/S0277-3791(98)00017-1, 1998.
Stephens, L., Fuller, D., Boivin, N., Rick, T., Gauthier, N., Kay, A., Marwick, B., Armstrong, C. G., Barton, C. M., Denham, T., Douglass, K., Driver, J., Janz, L., Roberts, P., Rogers, J. D., Thakar, H., Altaweel, M., Johnson, A. L., Sampietro Vattuone, M. M., Aldenderfer, M., Archila, S., Artioli, G., Bale, M. T., Beach, T., Borrell, F., Braje, T., Buckland, P. I., Jiménez Cano, N. G., Capriles, J. M., Diez Castillo, A., Çilingiroğlu, Ç., Negus Cleary, M., Conolly, J., Coutros, P. R., Covey, R. A., Cremaschi, M., Crowther, A., Der, L., di Lernia, S., Doershuk, J. F., Doolittle, W. E., Edwards, K. J., Erlandson, J. M., Evans, D., Fairbairn, A., Faulkner, P., Feinman, G., Fernandes, R., Fitzpatrick, S. M., Fyfe, R., Garcea, E., Goldstein, S., Goodman, R. C., Dalpoim Guedes, J., Herrmann, J., Hiscock, P., Hommel, P., Horsburgh, K. A., Hritz, C., Ives, J. W., Junno, A., Kahn, J. G., Kaufman, B., Kearns, C., Kidder, T. R., Lanoë, F., Lawrence, D., Lee, G.-A., Levin, M. J., Lindskoug, H. B., López-Sáez, J. A., Macrae, S., Marchant, R., Marston, J. M., McClure, S., McCoy, M. D., Miller, A. V., Morrison, M., Motuzaite Matuzeviciute, G., Müller, J., Nayak, A., Noerwidi, S., Peres, T. M., Peterson, C. E., Proctor, L., Randall, A. R., Renette, S., Robbins Schug, G., Ryzewski, K., Saini, R., Scheinsohn, V., Schmidt, P., Sebillaud, P., Seitsonen, O., Simpson, I. A., Sołtysiak, A., Speakman, R. J., Spengler, R. N., Steffen, M. L., Storozum, M. J., Strickland, K. M., Thompson, J., Thurston, T. L., Ulm, S., Ustunkaya, M. C., Welker, M. H., West, C., Williams, P. R., Wright, D. K., Wright, N., Zahir, M., Zerboni, A., Beaudoin, E., Munevar Garcia, S., Powell, J., Thornton, A., Kaplan, J. O., Gaillard, M.-J., Klein Goldewijk, K., and Ellis, E.: Archaeological assessment reveals Earth's early transformation through land use, Science, 365, 897–902, https://doi.org/10.1126/science.aax1192, 2019.
Strandberg, G., Kjellström, E., Poska, A., Wagner, S., Gaillard, M.-J., Trondman, A.-K., Mauri, A., Davis, B. A. S., Kaplan, J. O., Birks, H. J. B., Bjune, A. E., Fyfe, R., Giesecke, T., Kalnina, L., Kangur, M., van der Knaap, W. O., Kokfelt, U., Kuneš, P., Latałowa, M., Marquer, L., Mazier, F., Nielsen, A. B., Smith, B., Seppä, H., and Sugita, S.: Regional climate model simulations for Europe at 6 and 0.2 k BP: sensitivity to changes in anthropogenic deforestation, Clim. Past, 10, 661–680, https://doi.org/10.5194/cp-10-661-2014, 2014.
Strandberg, G., Lindström, J., Poska, A., Zhang, Q., Fyfe, R., Githumbi, E., Kjellström, E., Mazier, F., Nielsen, A., Sugita, S., Trondman, A.-K., Woodbridge, J., and Gaillard, M.-J.: Mid-Holocene European climate revisited: New high-resolution regional climate model simulations using pollen-based land-cover, Quaternary Sci. Rev., 281, 107431, https://doi.org/10.1016/j.quascirev.2022.107431, 2022.
Stuart, A. and Ord, J. K.: Kendall's Advanced Theory of Statistics. Vol. 1: Distribution Theory, 6th edn., Edward Arnold, London, 1994.
Sugita, S.: A model of pollen source area for an entire lake surface, Quaternary Res., 39, 239–244, https://doi.org/10.1006/qres.1993.1027, 1993.
Sugita, S.: Theory of quantitative reconstruction of vegetation I: pollen from large sites REVEALS regional vegetation composition, The Holocene, 17, 229–241, https://doi.org/10.1177/0959683607075837, 2007a.
Sugita, S.: Theory of quantitative reconstruction of vegetation II: all you need is LOVE, The Holocene, 17, 243–257, https://doi.org/10.1177/0959683607075838, 2007b.
Sugita, S., Parshall, T., Calcote, R., and Walker, K.: Testing the Landscape Reconstruction Algorithm for spatially explicit reconstruction of vegetation in northern Michigan and Wisconsin, Quaternary Res., 74, 289–300, https://doi.org/10.1016/j.yqres.2010.07.008, 2010.
Sun, Y., Xu, Q., Gaillard, M.-J., Zhang, S., Li, D., Li, M., Li, Y., Li, X., and Xiao, J.: Pollen-based reconstruction of total land-cover change over the Holocene in the temperate steppe region of China: An attempt to quantify the cover of vegetation and bare ground in the past using a novel approach, CATENA, 214, 106307, https://doi.org/10.1016/j.catena.2022.106307, 2022.
Tian, F., Cao, X., Dallmeyer, A., Ni, J., Zhao, Y., Wang, Y., and Herzschuh, U.: Quantitative woody cover reconstructions from eastern continental Asia of the last 22 kyr reveal strong regional peculiarities, Quaternary Sci. Rev., 137, 33–44, https://doi.org/10.1016/j.quascirev.2016.02.001, 2016.
Trondman, A. K., Gaillard, M. J., Mazier, F., Sugita, S., Fyfe, R., Nielsen, A. B., Twiddle, C., Barratt, P., Birks, H. J. B., Bjune, A. E., Björkman, L., Broström, A., Caseldine, C., David, R., Dodson, J., Dörfler, W., Fischer, E., van Geel, B., Giesecke, T., Hultberg, T., Kalnina, L., Kangur, M., van der Knaap, P., Koff, T., Kuneš, P., Lagerås, P., Latałowa, M., Lechterbeck, J., Leroyer, C., Leydet, M., Lindbladh, M., Marquer, L., Mitchell, F. J. G., Odgaard, B. V., Peglar, S. M., Persson, T., Poska, A., Rösch, M., Seppä, H., Veski, S., and Wick, L.: Pollen-based quantitative reconstructions of Holocene regional vegetation cover (plant-functional types and land-cover types) in Europe suitable for climate modelling, Global Change Biol., 21, 676–697, https://doi.org/10.1111/gcb.12737, 2015.
Trondman, A.-K., Gaillard, M.-J., Sugita, S., Björkman, L., Greisman, A., Hultberg, T., Lagerås, P., Lindbladh, M., and Mazier, F.: Are pollen records from small sites appropriate for REVEALS model-based quantitative reconstructions of past regional vegetation? An empirical test in southern Sweden, Veg. Hist. Archaeobot., 25, 131–151, https://doi.org/10.1007/s00334-015-0536-9, 2016.
Wyser, K., Kjellström, E., Koenigk, T., Martins, H., and Döscher, R.: Warmer climate projections in EC-Earth3-Veg: the role of changes in the greenhouse gas concentrations from CMIP5 to CMIP6, Environ. Res. Lett., 15, 054020, https://doi.org/10.1088/1748-9326/ab81c2, 2020.