the Creative Commons Attribution 4.0 License.
the Creative Commons Attribution 4.0 License.
 | 19 Dec 2023
CAMELS-CH: hydro-meteorological time series and landscape attributes for 331 catchments in hydrologic Switzerland
Martina Kauzlaric
Rosi Siber
Ursula Schönenberger
Pascal Horton
Jan Schwanbeck
Marius Günter Floriancic
Daniel Viviroli
Sibylle Wilhelm
Anna E. Sikorska-Senoner
Nans Addor
Manuela Brunner
Sandra Pool
Massimiliano Zappa
Fabrizio Fenicia
We present CAMELS-CH (Catchment Attributes and MEteorology for Large-sample Studies – Switzerland), a large-sample hydro-meteorological data set for hydrologic Switzerland in central Europe. This domain covers 331 basins within Switzerland and neighboring countries. About one-third of the catchments are located in Austria, France, Germany and Italy. As an Alpine country, Switzerland covers a vast diversity of landscapes, including mountainous environments, karstic regions, and several strongly cultivated regions, along with a wide range of hydrological regimes, i.e., catchments that are glacier-, snow- or rain dominated. Similar to existing data sets, CAMELS-CH comprises dynamic hydro-meteorological variables and static catchment attributes.
CAMELS-CH (Höge et al., 2023; available at https://doi.org/10.5281/zenodo.7784632) encompasses 40 years of data between 1 January 1981 and 31 December 2020, including daily time series of stream flow and water levels, and of meteorological data such as precipitation and air temperature. It also includes daily snow water equivalent data for each catchment starting from 2 September 1998. Additionally, we provide annual time series of land cover change and glacier evolution per catchment. The static catchment attributes cover location and topography, climate, hydrology, soil, hydrogeology, geology, land use, human impact and glaciers. This Swiss data set complements comparable publicly accessible data sets, providing data from the “water tower of Europe”.
- Article
(6224 KB) - Full-text XML
- BibTeX
- EndNote


Large-sample hydro-meteorological data sets are essential to understand differences in catchment behavior and to improve hydrological predictions under changing conditions. An important objective of catchment hydrology is to learn about differences between catchments to improve hydrological predictions in time, space and across scales (see Andréassian et al., 2009). This pertains to, for example, comparative hydrology (e.g. Falkenmark and Chapman, 1989), model regionalization (e.g. Parajka et al., 2005), catchment classification (e.g. Wagener et al., 2007), prediction in ungauged basins (e.g. Hrachowitz et al., 2013) and global trend analyses for hydro-meteorologic extremes and climate change impacts (Gudmundsson et al., 2019, 2021). The main types of required hydro-meteorological data include stream flow and its potential meteorological controls, such as precipitation, air temperature, potential evapotranspiration (ET) and other auxiliary variables such as humidity, solar radiation and wind speed. Ideally, these data are complemented by maps or statistics of the catchment features that are believed to exert primary controls on the hydrological processes and the water cycle, such as topography, geology, soils and land cover.
A seminal compilation of publicly available hydrologically relevant data for a large sample of catchments is the MOPEX data set which contains hydrologic and meteorological time series together with several static attributes for 438 catchments in the USA (Duan et al., 2006; Schaake et al., 2006). This work paved the way for the data set created by Newman et al. (2015), who extracted atmospheric forcing from different meteorologic data products for 671 USA catchments and combined this information with flow time series. Addor et al. (2017) complemented their data set with further static catchment attributes and created the first Catchment Attributes and MEteorology for Large-sample Studies (CAMELS) data set. It covers the continental USA and features catchments with minimal to no human impact.
Recently, the availability of open hydro-meteorological data sets improved tremendously due to the publication of similar data sets. All of these data sets cover a vast range of attributes for hundreds of catchments, typically within the national boundaries of respective countries or some in a transnational manner; some introduced further attributes, e.g., on human impact per catchment. The data set family was successively extended for Chile (CAMELS-CL; Alvarez-Garreton et al., 2018), Great Britain (CAMELS-GB; Coxon et al., 2020), Brazil (CAMELS-BR and CABra; Chagas et al., 2020; Almagro et al., 2021, respectively), Australia (CAMELS-AUS; Fowler et al., 2021) and central Europe (mainly Austria) (LamaH-CE; Klingler et al., 2021). The latest development along these lines is Caravan (Kratzert et al., 2023), an initiative combining all existing CAMELS data sets as well as LamaH and HYSETS (Arsenault et al., 2020) with global forcing and attributes data, yielding a more spatially consistent data set. Caravan also features a cloud-based platform enabling the fast extraction of forcing and attributes for any set of catchment polygons and the creation of Caravan extensions, e.g., for Denmark (Koch, 2022) and Israel (Efrat, 2023). Data sets for France (CAMELS-FR Andréassian et al., 2021) and Germany (CAMELS-DE Loritz et al., 2022) have been announced.
Large-sample catchment data proved extremely valuable for facilitating research and collaboration. These data sets have fostered many studies on large-sample hydrology, focusing on model benchmarking, catchment classification, regionalization, and prediction in ungauged basins (see Addor et al. (2020) for a review). Just to mention a few recent examples, they have been used to analyze and rank hydrologic signatures over hundreds of catchments (Addor et al., 2018), to benchmark machine learning models (Kratzert et al., 2019), to understand the mapping between catchment attributes and suitable model structures (Knoben et al., 2020), to investigate the inclusion of regional knowledge into hydrologic models (Gnann et al., 2021) or to regionalize hydrologic model parameters for improved predictions in ungauged catchments (Pool et al., 2021). Furthermore, CAMELS data were used to understand the correspondence between suitable model structures and observed hydro-meteorological signatures (David et al., 2022) and to demonstrate the performance of hybrid hydrologic models that combine physical principles with machine learning (Höge et al., 2022).
Open data sets have proved to be a remedy for several issues that hindered hydrologic research in the past. Among others, these are problems related to economics and ownership (Gupta et al., 2014), to difficulties in the process of searching, accessing and using relevant data, which caused redundant efforts, and limited research advances (e.g. Viglione et al., 2010; Beniston et al., 2012), or to basic scientific principles like reproducibility. Large-sample hydrology and, in particular, global analyses were often hampered in the past and it took initiatives like the compilation of stream flow indices for several thousand basins all over the globe (Do et al., 2018; Gudmundsson et al., 2018) or the first CAMELS data set for stream flow time series and additional data (Addor et al., 2017) to overcome such challenges and pave the way forward. At the scientific level, open research data initiatives are increasingly encouraged and previously unavailable data are becoming accessible through initiatives like this one. Like the other large-sample hydrology data sets before, CAMELS-CH follows the “FAIR Guiding Principles for scientific data management and stewardship” (Wilkinson et al., 2016).
Within the European water cycle, Switzerland is sometimes referred to as the “water tower of Europe” (Viviroli and Weingartner, 2004; Viviroli et al., 2004), being located in the middle of the western continent and being home to the largest share of the entire Alpine glacier mass. Major European rivers, such as the Rhine, Danube (Inn), Po (Ticino) and Rhône, have their headwaters in Switzerland and flow to the neighboring countries in the north (Germany), east (Austria), south (Italy) and west (France), respectively. Hydrologic Switzerland extends beyond the national boundaries and therefore comprises catchments both within political Switzerland and its vicinity, as shown in Fig. 1a.
Yet, this integral part of the hydrologic system of Europe is subject to marked changes. Naming just a few, there is a significant change in the local flora as “Alps turn more green” (Rumpf et al., 2022), pronounced snow cover reduction with more than 8 % per decade on average since the early 1970s (Matiu et al., 2021) and a loss of glacier mass that amounts to nearly 50 % since 1931 with nearly 30 % since 1980 alone (Mannerfelt et al., 2022). Stream flow patterns are changing, especially in mountainous basins, e.g., showing an increase in winter and spring discharge due to increasing temperatures (Birsan et al., 2005). Model-based hydrologic projections indicate a seasonal shift of the hydrologic cycle with decreasing summer runoff to increasing winter runoff for the coming decades (Köplin et al., 2012; Addor et al., 2014) with most drastic impacts in high-elevation regions (Muelchi et al., 2021). Looking at hydrologic extremes, it was shown that parts of Switzerland experienced a high frequency of flood events since about 1970 (Schmocker-Fackel and Naef, 2010). Projections indicate further changes in flood seasonality and increasing flood magnitudes, yet mostly decreasing flood volumes for the future (Köplin et al., 2013; Brunner et al., 2019a). Similarly, drought magnitudes are expected to change as a result of changes in their seasonality and generation processes, such as increasingly frequent snow melt deficits (Brunner et al., 2023).
All of these changes are direct effects of climate change that impact Switzerland and the water cycle of Europe in various ways. In Switzerland, both natural and human-made systems are often still adapted to an overall abundance of water and to seldom extremes throughout all seasons. Prospectively, they will have to adapt or be adjusted to the new conditions such as more frequent floods or water shortages (e.g., see Lanz, 2021). Climate change is likely to exert an heterogeneous impact on the water cycle, given the diversity of the Swiss landscape, ranging from the karstic regions in the northwest to the Alps in the south. Therefore, understanding the local impacts of climate change requires fine granularity studies that account for local catchment properties. Catchment-specific hydro-meteorological land use, snow and glacier data that cover decades are an important prerequisite to understand and predict the evolution of these changes and are considered to be important assets for climate impact assessments (e.g., Köplin et al., 2013).
With its 40 years of data, CAMELS-CH encompasses historic extreme events like the intense flooding in 2005 (Bezzola and Hegg, 2007), the snow-melting-enforced flooding in 1999 (Forster and Hegg, 2000) or the major drought of 2018 (Brunner et al., 2019b). Therefore, it represents an important resource to enable the investigation of hydrological regimes, potentially under changing conditions, and for addressing other issues related to the water cycle and water resources management.
For comparability to and compatibility with similar former data sets, CAMELS-CH resembles the general structure of already existing CAMELS data sets. We followed the structure of the British data set (cf. Coxon et al., 2020) to a large extent because of similarities in the presence of, for example, many populated basins, hydropower or reservoirs. In addition, we added information on snow coverage, glaciation and geology to account for the specifics of an Alpine region.
CAMELS-CH is a compilation of data from various sources. First, data were collected from Swiss federal agencies, namely the Federal Office for the Environment (FOEN, 2023), the Federal Office of Topography (swisstopo), the Swiss Federal Office of Energy (SFOE), and the Swiss Federal Office of Meteorology and Climatology (MeteoSwiss, 2023). Second, further data were obtained from Swiss research institutions and programs, i.e., the Swiss glacier inventory (GLAMOS, 2016) or the WSL Institute for Snow and Avalanche Research (SLF, 2023), with WSL being the Swiss Federal Institute for Forest, Snow and Landscape Research (WSL, 2023). Third, these data were complemented by resources from the European Union (EU) like different open-access data sets from Copernicus, the earth observation program of the EU, or by basin information from local agencies of the EU neighbor countries around Switzerland (specified in Appendix A1.1). Respective hydrologic data were collected and daily stream flow time series were aggregated from hourly data by, and are available from, Kauzlaric et al. (2023). Fourth, we complemented observation-based data by well-established and validated simulation-based products, i.e., hydro-meteorological time series simulated by the Precipitation Runoff Evapotranspiration Hydrotope (PREVAH) model (Viviroli et al., 2007), a distributed hydrological catchment modeling system that has been widely applied in Switzerland and other mountainous environments worldwide (e.g. Viviroli et al., 2009).
CAMELS-CH consists of catchment delineations, catchment time series with daily and annual resolution and static catchment attributes. These different data products are described in Sects. 4, 5 and 6, respectively. Direct links to all data resources that are available online are provided in Appendix A1.
CAMELS-CH comprises 298 river catchments and 33 lakes. While hydrologic Switzerland covers many more surface water bodies, the data set includes only those surface waters that are monitored by the FOEN (2023), that is, at this stage, it does not include any data from the Swiss Cantons, i.e., the member states of Switzerland. Of the total 298 catchments, 195 are located within the national boundaries of Switzerland (and the small state Liechtenstein, which is also covered by the FOEN). Most of the 33 lakes are inland waters with only four (Lake Geneva, Lake Maggiore, Lake Lugano and Lake Constance) extending to neighboring countries. We decided to include lakes in addition to river catchments to allow for more comprehensive analyses of the Swiss water cycle amid the high abundance of lakes in the country. With a few important exceptions, the lakes are regulated, i.e., their water level is managed (see Appendix A1.4 for further information). The other 103 catchments in the data set are located in the four neighboring EU countries (see Fig. 1a) – Austria (34 catchments), France (32), Germany (26) and Italy (11) – and are not monitored by the FOEN. Of the Austrian catchments, 15 coincide with those in LamaH-CE (see Appendix A1.1) which, in turn, includes parts of Switzerland and catchments of other countries along the Danube River system.
Figure 1Panel (a) shows a map of hydrologic Switzerland, covering political Switzerland and extending to neighboring countries, with all gauging stations of CAMELS-CH and delineations of the four major river basins of Inn, Po, Rhine and Rhône. Panel (b) shows mean daily specific discharge and upstream catchment area at gauging stations (lake and river gauging stations with only water level recordings not shown).
All catchment delineations within CAMELS-CH are provided in the Swiss coordinate system LV95 (sometimes also referred to as CH1903+). Those catchments within political Switzerland are based on the topographic delineation of catchments for Swiss water bodies by the FOEN (FOEN, 2020c, a). Note that, according to the FOEN, catchment outlet locations might not be fully identical to the gauging station positions. Yet, these are only minor discrepancies that do not restrict the usability of catchment-specific data series and the flow time series measured at the gauging stations. Catchment shapes outside of Switzerland are based on the EU-Hydro River Network database (EU-Hydro, 2020) and, when available, were complemented by geographic information from the same local agencies that provided discharge data (see Sect. 3).
Catchment sizes range over several orders of magnitude, from 0.6 km2 for the Sperbelgraben brook (gauge_id: 2282) to about 36 400 km2 for the Rhine River (at gauge_id: 2613) with a median of 194.9 km2. Many catchments are nested, hence their discharge time series might show high correlation. In order to analyze their hierarchy, we provide two attributes (h1 and h2) that are described and demonstrated for the example of the Thur River (at gauge_id: 2044) in Appendix B.
All catchment delineations are provided as shape files in CAMELS-CH. Similarly to other hydro-meteorological data sets mentioned above, the catchment delineations were used to aggregate basin-specific meteorologic forcing data grids and spatially distributed attributes. Note that, despite thorough inspection and manual adjustments where needed, errors due to inaccurately defined catchment boundaries (in particular for the smallest catchments) cannot be fully excluded and might pertain to any analysis conducted using CAMELS-CH.
Further information about catchments, for example, regarding catchment selection for rainfall-runoff analysis, can be found in the “readme.txt” file of the data set.
5.1 Daily time series
CAMELS-CH comprises an observation-based and a simulation-based set of hydro-meteorological time series as specified in Table 1 for a period from 1 January 1981 to 31 December 2020. Observed discharge and water level data were directly available from FOEN as time series recorded at the gauging stations. Yet, FOEN notes that data between 1 January 2019 and 31 December 2020 have not yet been validated at the time of their release in CAMELS-CH. Therefore, the observed data for these 2 years is provisional, although regular quality assessments minimize potential shortcomings. Hydrologic data for catchments outside of political Switzerland were provided as hourly time series by Kauzlaric et al. (2023) and were averaged to daily resolution. Further research on hydrometry and uncertainty of observed discharge time series in Switzerland is discussed and referenced in (Sect. 7.4).
Gridded observation-based data at daily resolution for precipitation, temperature and relative sunshine duration were obtained from MeteoSwiss. The spatial grid resolution is 2 km and each variable was aggregated using the catchment delineations introduced in Sect. 4, i.e., average precipitation, minimum, mean and maximum temperature and relative sunshine duration per catchment. The relative sunshine duration (rel_sun_dur) refers to the ratio between the effective sunshine duration (due to clouds or fog) and the maximum possible sunshine duration for a specific location on a certain day of the year. According to MeteoSwiss, sunshine is defined as solar irradiance ≥200 W m−2 and it is therefore used as a proxy for shortwave radiation intensity. Additional resources covering, for example, the accuracy and uncertainty of the variables provided by MeteoSwiss are referenced in Appendix A1.2.
Snow plays a crucial role in the hydrological cycle of Switzerland. Observation-based snow water equivalent (SWE) data were provided by the WSL Institute for Snow and Avalanche Research (SLF). (For information about the snow cover model and data assimilation method, refer to Magnusson et al., 2014.) Basin-specific time series were spatially aggregated from a simulated snow data grid with a 1 km resolution. The simulations were based on 345 monitoring stations and the high-resolution daily precipitation product by MeteoSwiss (RhiresD version 2; see Appendix A1.2). Note that snow water equivalent data are available only since 1 September 1998 and therefore do not cover the entire temporal extent of CAMELS-CH. Time series for basins smaller than 10 km2 were removed per SLF recommendations due to uncertainties in the generated SWE estimates. Above 3000 m a.s.l., no monitoring stations are available and SWE data in high-elevation basins are subject to large uncertainties and have to be treated accordingly when used in analyses and modeling tasks.
The observed time series data above are complemented by simulation-based time series products to bridge the spatial discrepancy between political and hydrologic Switzerland, to fill temporal gaps in observation-based time series and to provide further meteorological variables that are not obtainable as observation-based products. In Table 1, corresponding time series names end with “_sim”. Note that observation-based and simulation-based data series are clearly separated in the data set, e.g., no gaps in observed time series were closed using simulated data. Any joint utilization is up to the user and we recommend a clear indication of how the different data are used.
The simulation-based time series were obtained as follows: PREVAH model (Viviroli et al., 2009) simulations provide respective discharge time series and further simulated meteorologic variables are based on the PREVAH-internal WINMET tool that is used to pre-process and interpolate input variables for PREVAH. The observation-based meteorologic data by MeteoSwiss presented above served as input to WINMET and the simulated output was obtained on a spatial grid with 500 m resolution. The final time series were aggregated per basin in the same way as the observed data from MeteoSwiss. PREVAH computations were conducted on the computational cluster (“Hyperion”) of WSL (2023), i.e., 56 computational nodes each with 20 cores at 2.2 (3.1) GHz (1120 nodes total) and 64 GB of RAM. The simulation-based time series were obtained similarly to the data set by Zappa and Brunner (2019) which was used and described extensively in Brunner et al. (2019b). Yet, while there are 307 medium-sized catchments in Switzerland and the time between 1981 and 2018 was considered, here we cover the 331 CAMELS-CH basins as defined in Sect. 4 between 1 January 1981 and 31 December 2020.
All simulation-based variables are, of course, subject to assumptions and uncertainties introduced, for example, by the chosen interpolation methods for meteorological variables (see Table 1 in Viviroli et al., 2009), i.e., inverse distance weighting together with elevation-dependent regression. Yet, the simulation-based data are hydrologically validated (cf. Speich et al., 2015) and can serve as a benchmark for other modeling studies. Besides simulated streamflow, precipitation and temperature that are also available as observation-based time series, we provide simulation-based estimates only for wind speed and relative humidity as well as potential and actual evapotranspiration (ET). Potential ET is based on the Penman–Monteith equation without interception correction (cf. Gurtz et al., 1999) and adjusted to actual (real) ET using local moisture, soil and vegetation conditions. (For details see the referenced PREVAH model description in Appendix A1.3.) Furthermore, simulated radiation-related variables (radiation_sim in watts per square meter and sun_duration_sim in hours) complement the observation-based relative sunshine duration. Finally, two interception estimates are provided to describe the water balance at the soil surface underneath a plant canopy using so-called intercepted evapotranspiration (intercept_et_sim) and intercept storage (intercept_storage_sim) which are further specified in Appendix A1.3). The “Data source” column in Table 1 shows the exact reference of each hydro-meteorologic variable and the ending “_sim” in the time series name indicates those data sets that are based on simulations.
(FOEN, 2023)(Viviroli et al., 2007)(MeteoSwiss, 2023)(SLF, 2023)(WINMET tool; Viviroli et al., 2007)Table 1Catchment-specific hydro-meteorological variables available as daily time series in CAMELS-CH.
5.2 Annual time series
Glaciation and land cover have been undergoing considerable changes in certain basins over the past decades. Therefore, CAMELS-CH includes annual time series of both glacier and land cover attributes as specified in Table 2 for each catchment.
5.2.1 Glaciers
Glacier data within Switzerland are based on the Swiss Glacier inventory GLAMOS (Linsbauer et al., 2021) which is updated every few years. The attributes provided are interpolated linearly between the GLAMOS versions of 1973 and 2016. GLAMOS comprises data on glacier volumes and areas as well as shapefiles for each individual glacier. These glacier outlines were intersected with the catchment delineations (see Sect. 4) in order to aggregate the glacier volume and to obtain the glaciated area of the catchment.
For catchments in neighboring countries only the temporal development of glacier area is available based on the pan-European glacier inventories of the years 2003 and 2015 by Paul et al. (2011, 2019, 2020) that cover the entire Alpine region. Note several national glacier inventories were established as for France in 2006–2009 (Gardent et al., 2014) and Austria in 2012 (Fischer et al., 2015). However, to provide the best possible temporal and methodologic consistency, pan-European glacier inventories were used. The glacier inventory from 2003 is based on Landsat (Thematic Mapper; 30 m resolution). Sentinel-2 (S2; 10 m resolution) satellite data and former national glacier inventories as guidance to map the glacier outlines for the pan-European inventory of 2015 (see Paul et al., 2011, 2020). Note that there is also the Randolph glacier inventory (Pfeffer et al., 2014) available that is based on Landsat satellite data from 2003 and was used for CAMELS-CL (Alvarez-Garreton et al., 2018). Yet, while this might be a valuable resource for global analyses and certain regions, it is not the most accurate resource for the European Alps and it was therefore not used here.
The more recent glacier inventory of 2015 by Paul et al. (2020) is stated to be more accurate than the older inventory of 2003 due to the more precise data and more experience in mapping glacier outlines. This means, however, that certain glaciers present a slightly larger area in 2015 than in 2003 and appear to have grown over the years – opposite to the overall confirmed trend of glacier decline (Mannerfelt et al., 2022). This artifact is countered by transferring the area loss rates of Swiss glaciers of similar extent in GLAMOS to the affected glaciers. Starting from the year 2015, this rate was then used to estimate the areal development backward to 1980 and forward to 2021 for glaciers that apparently but unrealistically have grown. We acknowledge that this methodology might introduce further uncertainty because it is a strong simplification as it does not take into account glacier exposition, basin morphology, regional climate, etc. Yet, we consider GLAMOS data to be a highly accurate reference and to provide representative and, therefore, transferable trends for the evolution of glaciers in the European Alps.
CAMELS-CH provides annual time series for glacier area (glac_area), glacier mass (glac_mass) and glacier volume (glac_vol) for all glaciers within political Switzerland (see Table 2). In order to allow for relating Swiss glacier area to volume and mass during investigations, we decided not to aggregate the glacier areas from GLAMOS and from the pan-European glacier inventories for catchments that cross the borders of Switzerland. For these catchments and those that lie entirely outside of political Switzerland, we provide glacier areas as a separate variable glac_area_neighbours that can manually be aggregated with the GLAMOS-based glacier area.
5.2.2 Land cover
Land use changes were estimated based on the CORINE Land Cover (CLC) data sets (Büttner et al., 2004) from the European Copernicus program, with CORINE being an acronym for Coordination of Information on the Environment. This remote sensing program monitors, among many other things, the land cover distribution (e.g., urban, forest types, agriculture types) since 1985 over the larger European area. From this geo-referenced data, we aggregated areal percentages of each land cover type for all catchments. The accuracy of the CLC files is 100 m or better, with improving accuracy over the decades since the first CLC release. CLC data sets exist for the years 1990, 2000, 2006, 2012 and 2018. We applied linear interpolation between these time points to fill the years in between and repeated the value 2018 to fill in the last years. While the first CLC data set was released in 1990, data for Switzerland is only available since 2000 when the country joined the Copernicus program. Hence, for Swiss basins, annual data are available between 2000 and 2021 and for the neighboring countries’ basins, the annual time series start from 1990.
CAMELS-CH covers land cover percentages in the following categories: agriculture, forest (coniferous, deciduous and mixed), grass and herb vegetation, scrub vegetation, wetlands, ice and perpetual snow, inland water surface, rock (loose and solid), settlements/urban and unknown/blank. Note that there might be slight deviations between the values derived from the glacier data sources (see Sect. 5.2.1) with respect to the percentage of catchment area covered by ice and perpetual snow (ice_perc). This is due to deviating assessment techniques – CLC is only based on satellite data that might not distinguish as clearly between glacier and snow surfaces as it was done for the glacier inventories – therefore, we recommend using the glacier attributes for respective applications.
6.1 Location and topography
Location attributes were derived from data provided by the FOEN and comprise basic information about the country each gauging station is located in, its name and coordinates as well as the corresponding water body name and type (river or lake). As identifiers, we provide the unique four-digit gauge_id number in accordance with the FOEN notation and a six-letter identifier (id6) that is derived from water body name and gauge site name. The unique gauge_id numbers coincide with the numbers used by the FOEN for basins within political Switzerland starting with “2”. Correspondingly, we enumerated gauge_id numbers for Austria, France, Germany and Italy starting with “3”, “4”, “5” and “6”, respectively. This enumeration is CAMELS-CH specific, but all catchments can be uniquely identified in the data source by Kauzlaric et al. (2023) using the id6 identifier.
Topographic attributes include gauging station elevation, catchment area and statistical means of elevation and slope distributions of each basin. They were partially also provided by the FOEN and swisstopo or derived from the EU digital elevation model (25 m resolution; EU-Hydro, 2020) to have a unique source of information for Switzerland and the surrounding countries. For the catchments within political Switzerland, the obtained attributes were compared with swisstopo data, which revealed nearly identical estimates for the catchment-aggregated attributes provided in CAMELS-CH.
Further attributes on location and topography, e.g., catchment hierarchy or further specifics of hydrologic Switzerland covering several countries, are provided in Appendix B.
(FOEN, 2023)(swisstopo, 2015)(v1.1; EU-DEM, 2016)MeteoSwiss (2023, observation-based attributes)(WINMET tool; Viviroli et al., 2007, simulation-based attributes)FOEN (2023, observation-based attributes)(Viviroli et al., 2007, simulation-based attributes)Coxon et al. (2020)Coxon et al. (2020)Coxon et al. (2020)Tóth et al. (2017)(ESDD, 2013)(geo.admin.ch, 2016)(GDK, 2019)(Huscroft et al., 2018)(Hartmann and Moosdorf, 2012)(GLAMOS, 2016)Paul et al. (2019)(CLC, 2023)(eurostat, 2018)(SFOE, 2020)(SFOE, 2022)Table 2Catchment-specific static attributes available in CAMELS-CH with additional annual time series available for glacier and land cover attributes (see Sect. 5.2). (Note that with regard to the attribute class “Soil”, each soil type/property is accompanied by percentiles (5 %, 25 %, 50 %, 75 % and 90 %), distribution skewness and missing percentage across the catchment.)
6.2 Climate and hydrology
Climatic indices and hydrologic signatures were evaluated based on both observation- and simulation-based time series (see Table 1). For calculating both attribute categories, only complete observed hydrological years (1 October to 30 September of the following year) were used and up to 5 % of missing values were tolerated per hydrological year. Note that observed discharge is the most limiting variable. Hence, if discharge was only available for three hydrologic years for a certain basin to allow for the calculation of hydrologic signatures, the climatic indices were evaluated only for the same 3 years for the sake of consistency.
For the climatic indices, precipitation and temperature from both MeteoSwiss (obs) and WINMET (sim) were used. Yet, potential evapotranspiration estimates are only simulation-based (pet_sim). For the hydrologic signatures, observation-based precipitation data from MeteoSwiss were used together with discharge data by the FOEN. The simulation-based equivalents were based on PREVAH and WINMET data for both variables. Note that observation-based hydrologic signatures are not available for the lakes because only water level is recorded at these gauging stations. Using PREVAH, it was possible to generate discharge at these lake stations and hence hydrologic signatures are available for these simulation-based data. Generally, simulated time series of all variables are complete for all catchments. Hence, simulation-based attributes can serve as substitution for missing observation-based ones. A comparison between attributes derived from both sources is provided in Sect. 7.2.
In Table 2, we provide the same climatic and hydrologic attributes and the corresponding descriptions as in CAMELS-GB (covering 1970–2015) with the difference that we cover the period 1981–2020 and additionally report the start date, end date and number of years used for the calculations. (For further information on specific attributes, see Coxon et al., 2020.) Figure 1b shows the mean observed discharge at each gauging station normalized by the respective catchment area with the dot size indicating the magnitude of the catchment area. It can clearly be seen that at the boundaries of hydrologic Switzerland where the major rivers flow to neighboring countries, the catchment areas are largest, resembling the encompassing catchments indicated in Fig. 1a. For example, in the north, the gauging stations at the Rhine River cover about two-thirds of the entire hydrologic Switzerland.
6.3 Soil attributes
The soil attributes listed in Table 2 were calculated using two data sources covering the entire spatial extent of hydrologic Switzerland: the data set EU-SoilHydroGrids (3D soil hydraulic database of Europe) at 250 m spatial resolution (Tóth et al., 2017) and the European Soil Database Derived (ESDD) data at 1km spatial resolution (Hiederer, 2013a, b). Furthermore, we provide soil attributes based on the global SoilGrids data set at 250 m resolution (Hengl et al., 2017) in Appendix B. These attributes include soil_depth as an additional variable and second estimates for several variables in Table 2. Yet, the variables coarse_fragm_perc, porosity and conductivity are only available from the more comprehensive European data sets, which is why we selected these as primary data sources.
6.4 Hydrogeology
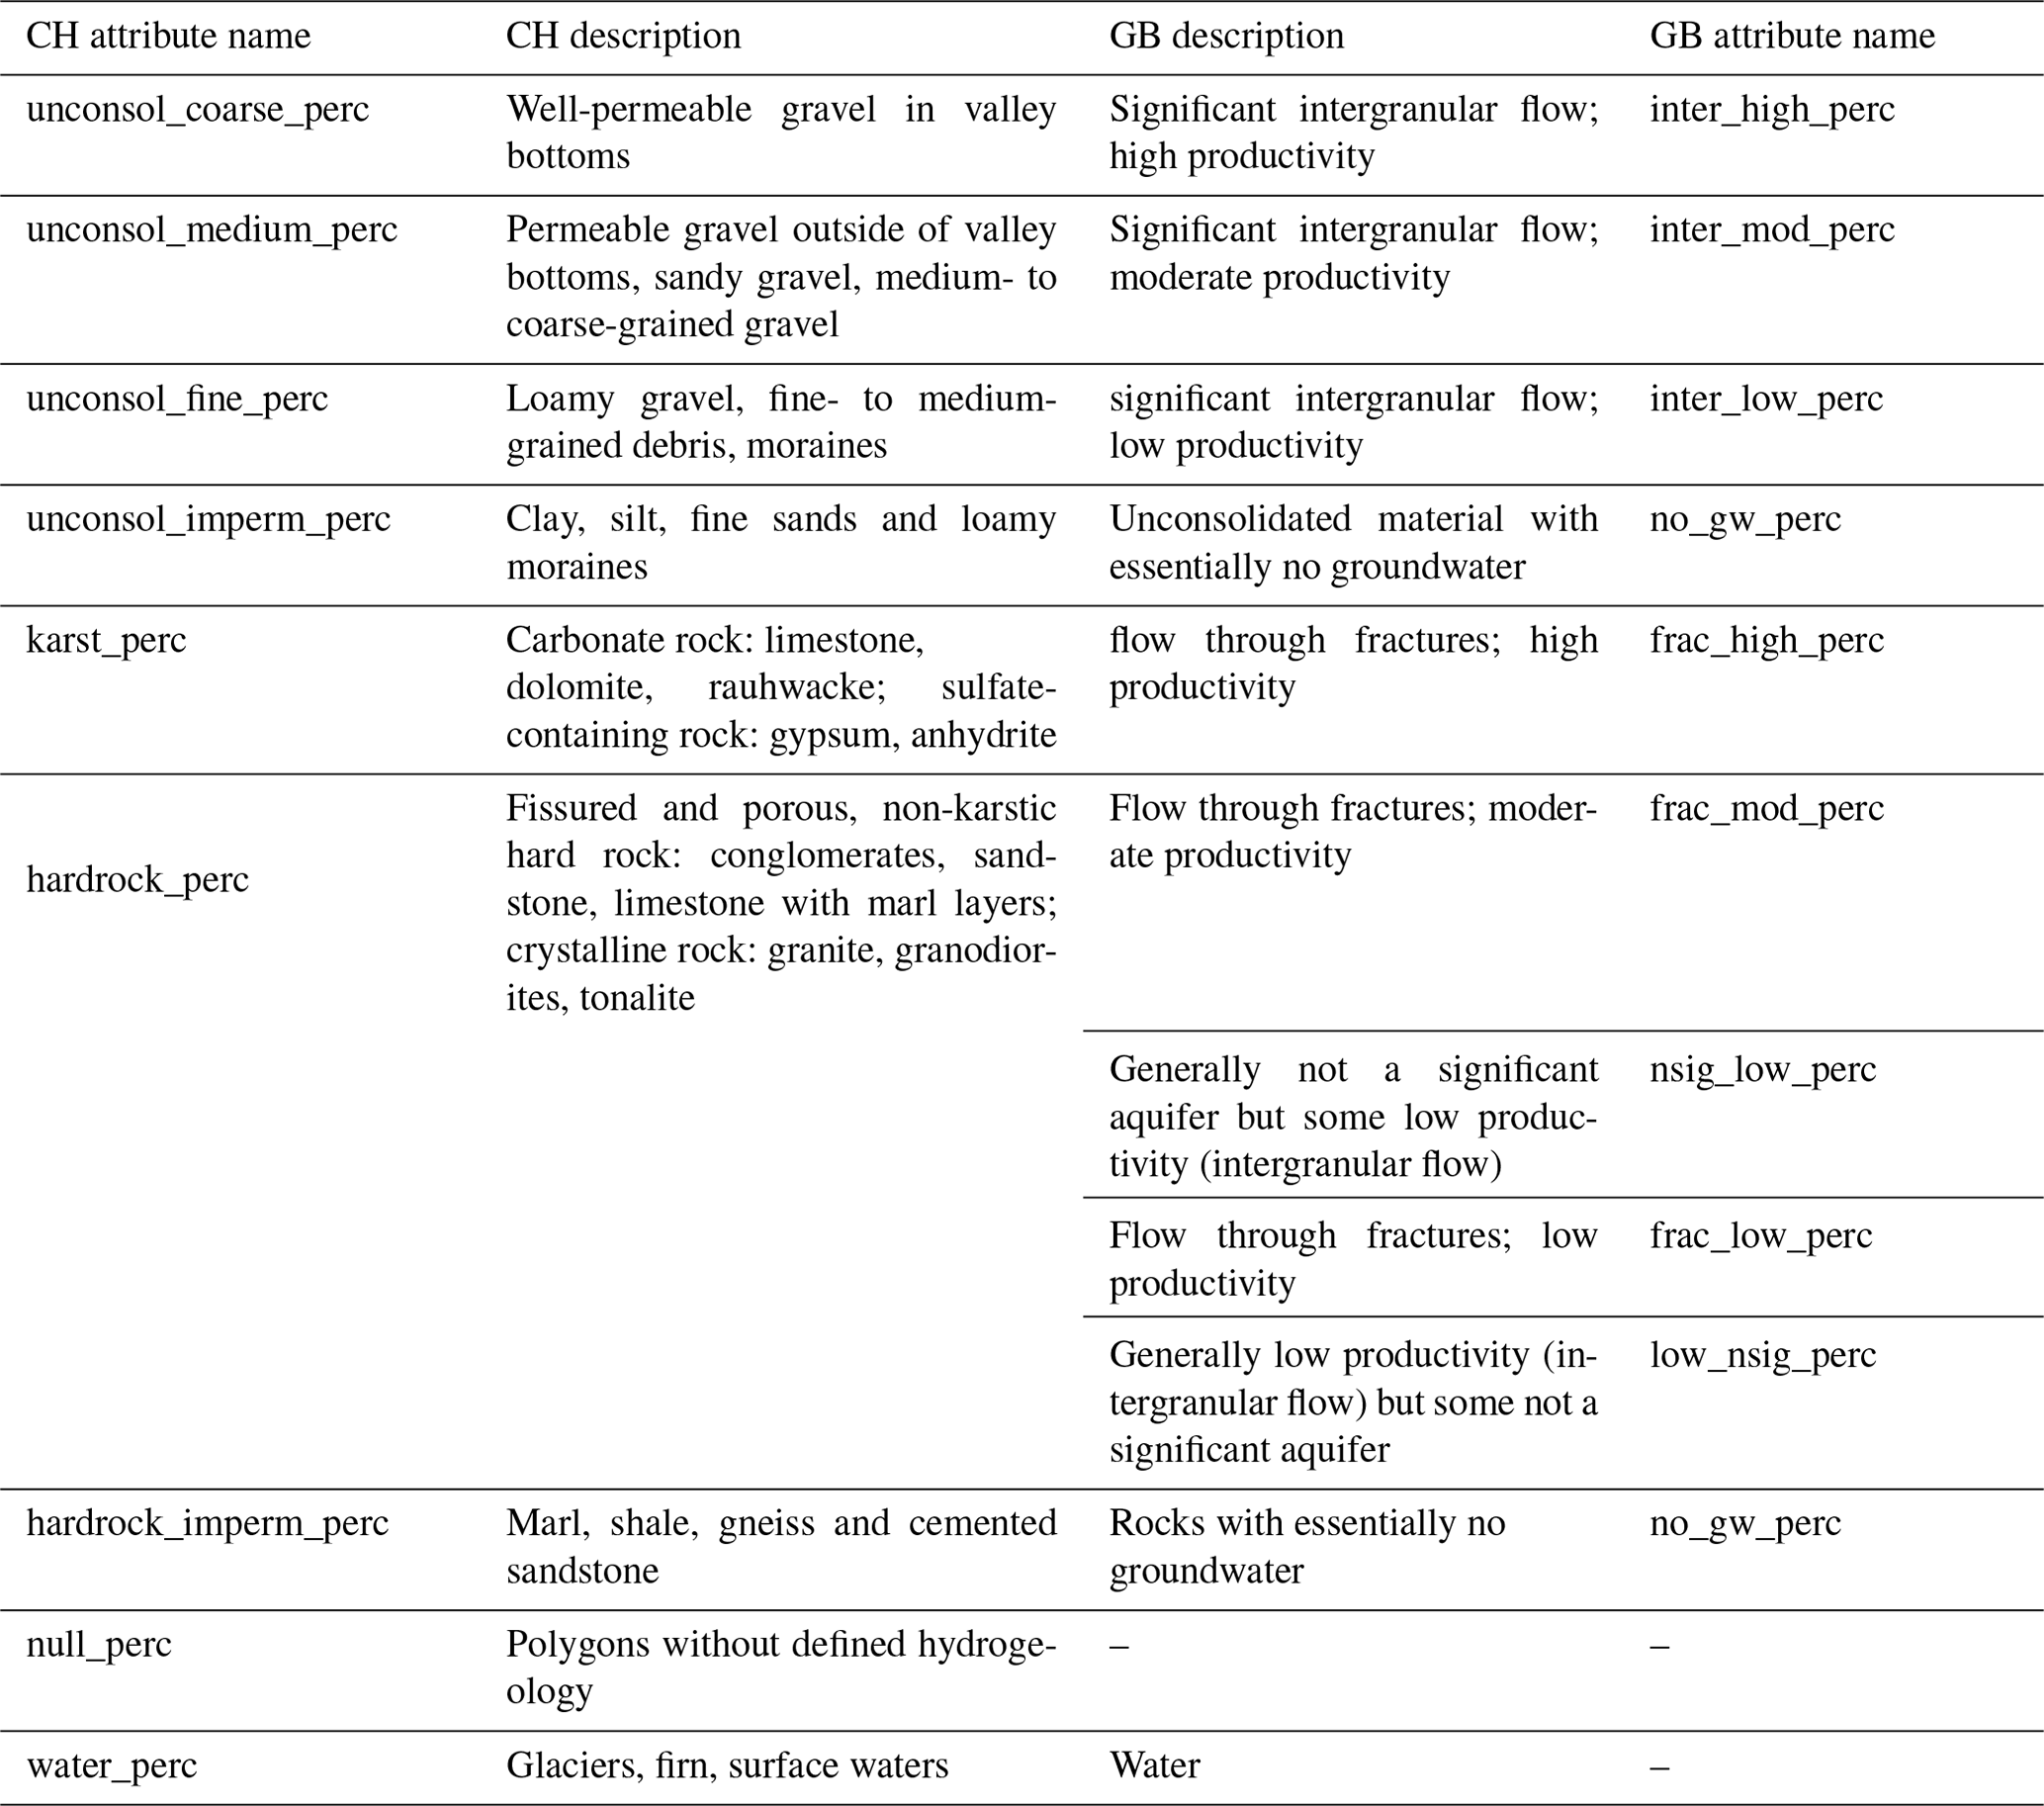
The hydrogeologic attributes as listed and described in Table 2 were primarily extracted from the hydrogeologic map of Switzerland (geo.admin.ch, 2016). This map covers the largest part of hydrologic Switzerland with the exception of some parts in the north. Hence, a hydrogeologic map of Germany (GDK, 2019) was used in addition to the Swiss data, which extends the hydrogeologic coverage and significantly improves the coverage of the spatial extent of karstic regions in the west and north. The remaining percentage per catchment not covered by any of the data sources is reported as “external”. Further information is available in Appendix A1.5, and Appendix A2 offers a direct correspondence between the variables listed here and those in CAMELS-GB (Coxon et al., 2020).
6.5 Geology
The Swiss landscape is dominated by the different Alpine geologies that were derived from different data sources: attributes from GLiM (global lithological map; Hartmann and Moosdorf, 2012) indicated by lowercase abbreviations (geo_su, geo_ss,...) provide a general geologic categorization of rock-type fractions (resolution at 0.5∘, ca. 1:3 750 000) and are typically sufficient for many hydrological applications. From the GLHYMPS 2.0 data set, (GLobal HYdrogeology MaPS 2.0; Huscroft et al., 2018) logarithmic permeability and porosity estimates are provided (average polygon size 100 km2). Both GLiM- and GLHYMPS-based variables were also used in the original CAMELS-US data set (Addor et al., 2017) which facilitates intercomparisons between data sets. Yet, note that with GLHYMPS version 2.0, a global surface mean logarithmic permeability, is estimated to be which is about one order of magnitude higher than the one estimated in version 1.0 (Gleeson et al., 2014). This has to be considered when comparing the geologic variables from CAMELS-CH with other CAMELS data sets.
For hydro(geo)logic purposes, hydraulic conductivity K (in m s−1) rather than log10_permeability k (in log10(m2)) might be of interest. Using approximations of the density of water (1000 kg m−3), gravitation (10 m s−2) and the viscosity of water (10−3 kg (m s)−1), hydraulic conductivity can be estimated via (see Gleeson et al., 2011). Further attributes that allow for more comprehensive investigations regarding the geology of Switzerland and are based on Swiss data sources are provided in Appendix B.
6.6 Glaciers and land cover
In addition to respective annual time series in Sects. 5.2.1 and 5.2.2, attributes for both glaciers and land cover are available as static attributes referring to the year 2000. If values from another year shall be used as static attributes, please refer to the annual time series per basin. Details about the glacier and land cover attributes and their data sources are given in Sect. 5.2.
6.7 Human Impact
Human impact attributes comprise the estimated population per catchment as well as data on reservoirs and hydropower. In order to have a unique data source for all catchments, population was derived from the EU Geostat data set (1 km2 grid resolution; eurostat, 2018) that also covers Switzerland. Reservoir (SFOE, 2020) and hydropower (SFOE, 2022) data were obtained from the Swiss Federal Office of Energy (SFOE) and only cover catchments within political Switzerland. Swiss reservoirs are mainly used for flood control, hydroelectricity and water supply. The hydropower plants supervised by SFOE have an installed capacity of at least 300 kW; smaller ones are not included here.
7.1 Annual time series: glacier areas
Within the family of CAMELS data sets, it is a novelty of CAMELS-CH to provide annual time series data for glaciers and land cover. Therefore, we demonstrate exemplarily which further types of analysis are thereby enabled: using the annual time series, it is possible to allocate glacier decline catchment-specifically between 1980 and 2020 in the Alps of hydrologic Switzerland. Figure 2a shows the areal extent of glacier per (sub-)catchments in 1980 and Fig. 2b clearly depicts the linear trend of glacier area loss over the four decades with 100 % referring to the glacier extent in 1980 as the reference level. All glaciers show considerable decline, yet, while some glaciers in basins disappeared nearly or entirely, others have lost less area.
Figure 2Glacier area evolution between 1980 and 2020 with (a) glacier area per (sub-)catchment in 1980, (b) relative individual declines and area-weighted mean (turquoise) over 40 years for all (sub-)catchments with reference year 1980, and (c) and (d) relative glacier area losses per catchment in 2000 and 2020, respectively, since 1980.
Figure 2c and d show the relative glacier loss in the years 2000 and 2020, respectively, and indicate that basins in the eastern Swiss Alps suffer from greater decline. It can be seen that those basins where glaciers have nearly or fully disappeared are located at the margins of the Alps which are generally smaller glaciers. The largest glaciers, located at high elevations in the western Alps, show losses up to 20 % in 2000 and up to 40 % in 2020. Yet, their masses have declined even more strongly with their areas being typically restricted by mountain ridges. Therefore, they loose height and shrink in volume and mass more than in area.
7.2 Hydrology and climate attributes from observed vs. simulated data
The observed mean specific discharge together with the area upstream to the respective gauging stations are shown in Fig. 1b. The largest major catchment of the Rhine River that covers large parts of hydrologic Switzerland is represented by the gauging stations in the north. The other three major rivers that flow to surrounding parts of Europe (Rhône, Po, and Inn) yield large dots at the respective gauging stations in the other three cardinal directions. Within Switzerland, the gauging stations typically cover smaller catchments. Most gauging stations depict a mean specific discharge in the medium category , with no general spatial pattern being visible for all categories.
Figure 3 depicts mean half-flow dates generated from both observation-based ( 3a) and simulation-based ( 3b) data. It nicely shows how in high-altitude, snow- (and in some cases glacier-) dominated catchments, it takes many more days since the beginning of the hydrologic year (always 1 October) until the cumulative discharge reaches half of the entire annual discharge, compared with low-altitude basins that are more rain dominated. The overall resemblance between the hfd_mean generated from observations and simulations is very high. Therefore, in such a case simulation-based attributes are suitable to complement observation-based attributes that might have gaps in certain catchments.
For observation-based and simulation-based runoff_ratio in Fig. 3c and d, respectively, this is not as clearly visible and complementary use has to be applied carefully. The simulation-based catchment indices show very similar values (between 0.5 and 1) all over hydrologic Switzerland, with a few highest values concentrated in the mountains (Fig. 3d). Contrarily, runoff ratios of the observed values (Fig. 3c) show a much larger variance including very low and large values. Runoff ratios larger than one typically indicate, for example, external inputs of water like extracted groundwater, water release for hydropower production, melting of snow or glaciers that are all not explicitly metered or publicly available. In mountainous regions, the estimation of the water balance is often challenging because water from mountains provides large (temporarily stored) fractions of precipitation to the total discharge of catchments in their vicinity (Viviroli and Weingartner, 2004). This process might not be fully accounted for in the simulation-based data. Furthermore, precipitation data can cause runoff ratios larger than one due to mainly two reasons: gauge undercatch (e.g., Kochendorfer et al., 2017) and, in particular for high-elevation catchments, a poor representation of the precipitation gauge network (e.g., Viviroli et al., 2011). A general estimation of accuracy and uncertainty in the precipitation data by MeteoSwiss can be found in the respectively referenced product sheet in Appendix A1.2.
Aridity values in Fig. 3e and f are between 0 and 1 and indicate that catchments in hydrologic Switzerland are energy limited (aridity <1) rather than water limited (aridity >1) which is expected. Simulation-based aridity in Fig. 3f shows a more even distribution than the observation-based attribute in Fig. 3e with fewer values towards the extremes 0 and 1. For example, they do not reflect the lowest aridity values in high altitudes. Therefore, whenever users of CAMELS-CH intend to complement observation-based with simulation-based attributes (hydrologic and likewise climatic), we recommend a thorough attribute-specific comparison and acknowledgment of potential discrepancies.
An extended comparison between the observation-based and simulation-based attributes of mean half-flow dates, runoff ratio and aridity is provided in Appendix A3. There, scatter and cumulative distribution plots for these three example attributes are shown in Fig. A1.
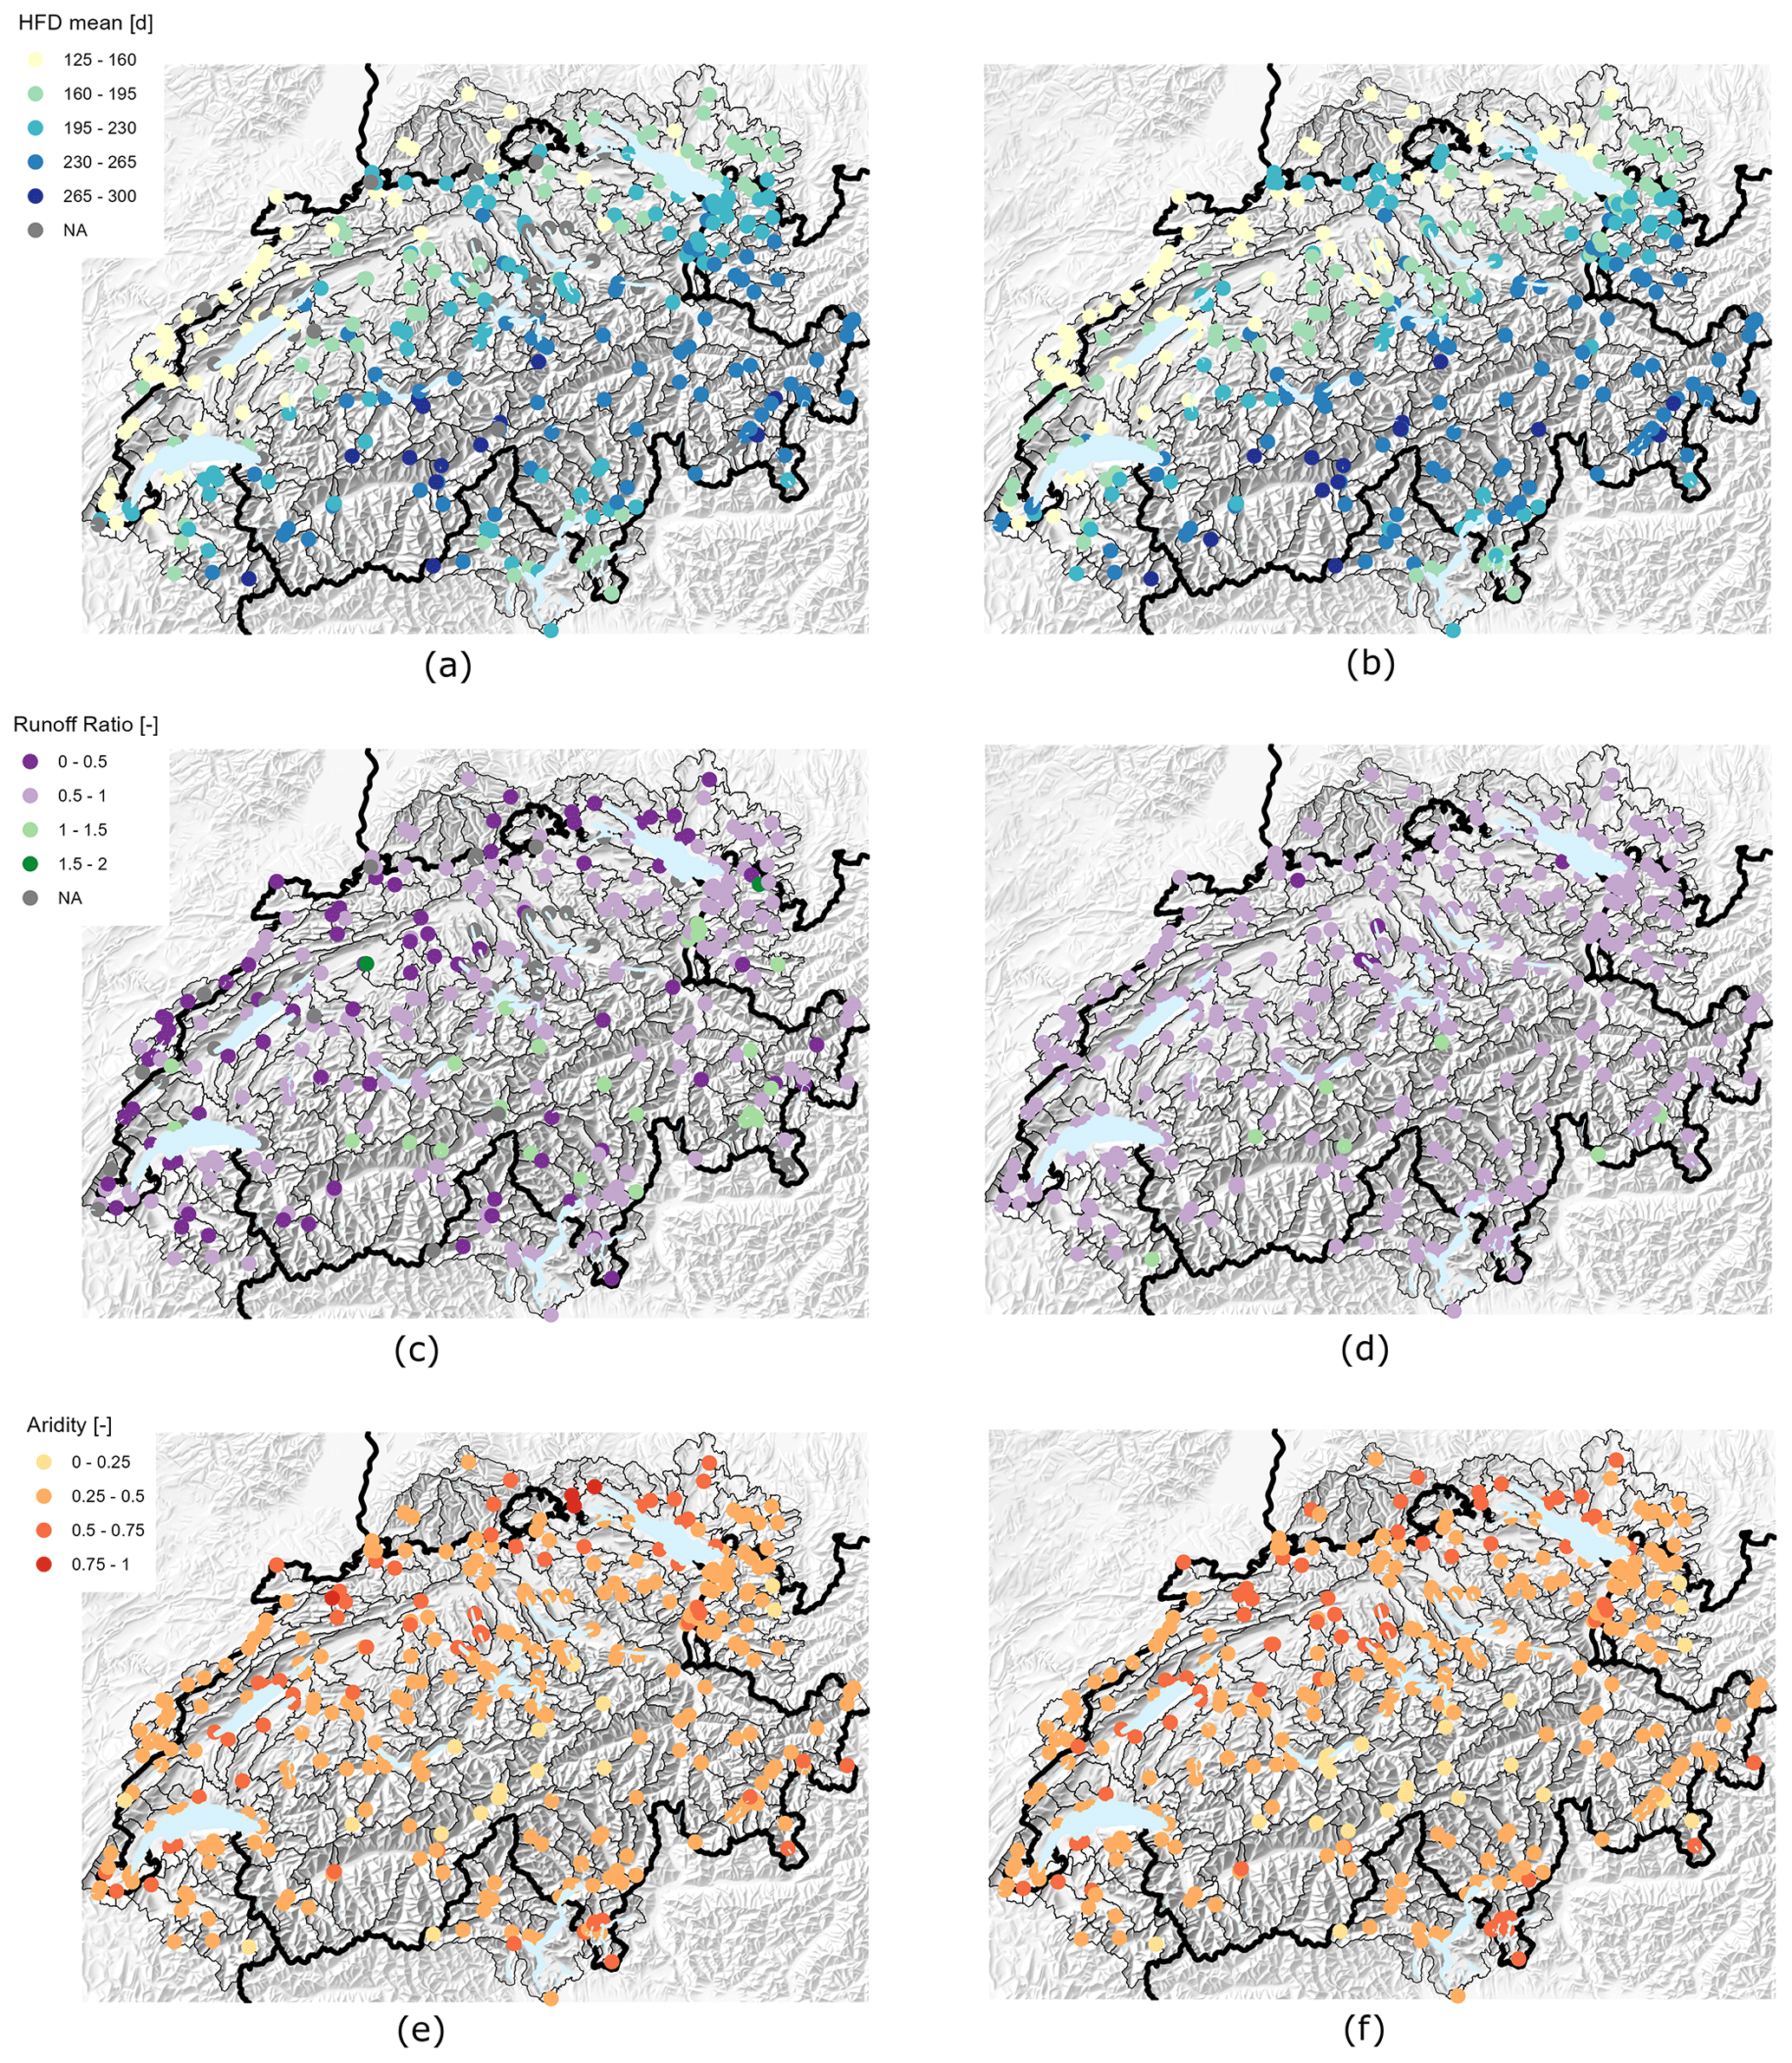
Figure 3Comparison of observation-based (a, c, e) and simulation-based (b, d, f) hydrologic signatures: mean half-flow date (a, b) and runoff ratio (c, d); climate index: aridity (e, f).
7.3 Bio-geographic regions
Regions in Switzerland can be distinguished according to their climate, flora and fauna, topography and/or geology. Political Switzerland comprises six of these so-called bio-geographic regions (see Appendix A1.6) and CAMELS-CH extends these to the neighboring countries, adding also the southern Black Forest as the seventh region as shown in Fig. 4a.
.
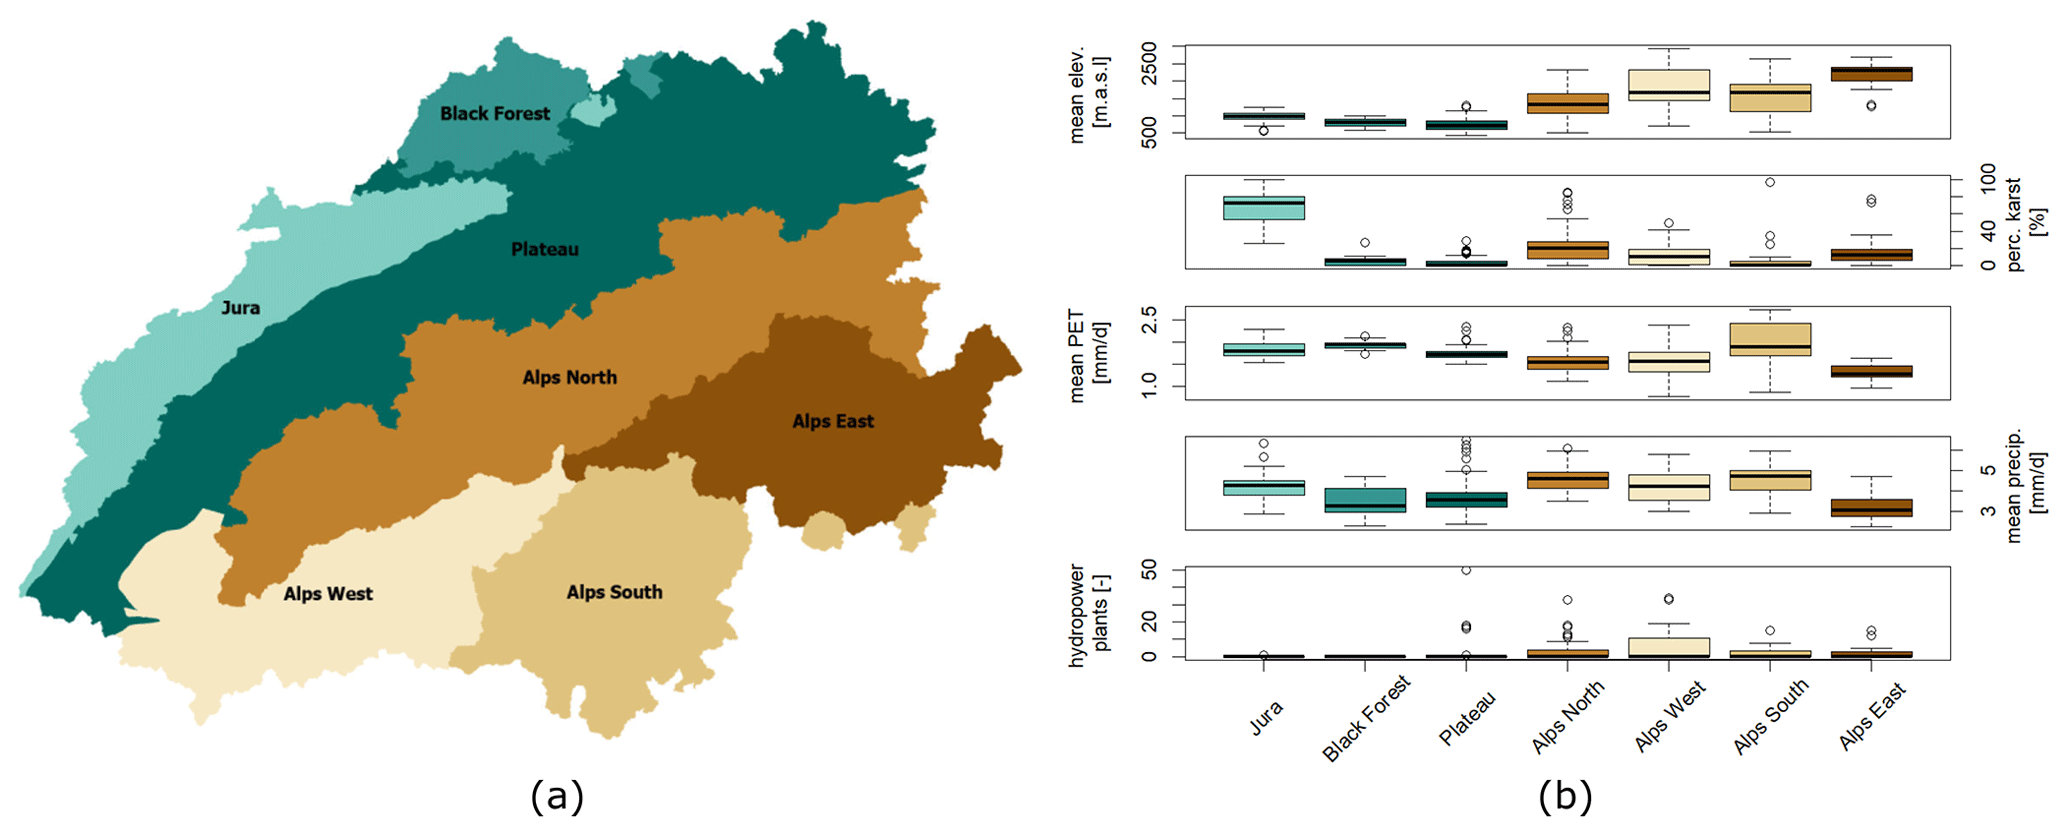
Figure 4Bio-geographic regions of hydrologic Switzerland (a) with respective regional distributions of, from top to bottom, mean elevation, percentage of karstified subsurface, mean potential evapotranspiration (PET), mean precipitation and the number of hydropower plants >300 kW capacity in (b). Layout inspired by Fig. 2 in Coxon et al. (2020)
Figure 4b depicts that, unsurprisingly, the regions in the northwest (Jura, Black Forest and Plateau) have a much lower mean elevation than the Alpine regions towards the southeast. Yet, catchments in valleys in the northern, western, and southern Alps reach similarly low elevation levels highlighting that there are large altitude differences in some of the Alpine basins. Note that the climate attribute fraction of precipitation falling as snow (frac_snow; not shown here) highly correlates with the mean elevation, with considerably more than 50 % of the annual precipitation falling as snow in some Alpine catchments. The Jura basin is famous for its carbonate rock formations showing very high percentages of karstified subsurface in some catchments which has to be considered for any hydrologic analysis in this region. Mean potential evapotranspiration (PET) appears to be rather similar in the low-altitude regions and in the northern Alps. Yet, within the western and southern Alps, catchments cover the entire range of low to high mean PET rates with the overall highest PET levels occurring in the south (Swiss Ticino and northern Italy). The mountainous eastern Alps basins generally have the lowest PET rates in hydrologic Switzerland. Mean precipitation shows that there is overall less rain and snow in the eastern Alps compared with all other Alpine regions, while the lower elevation catchments in the northwest are more similar, with only catchments in the Jura region showing higher values. Finally, most hydropower capacity is installed in the regions of the southwest to northeast diagonal (Plateau, Alps North and Alps West).
7.4 Hydrometry and uncertainty in hydrologic time series
Uncertainty in observed discharge and water level time series is caused by, for example, the technique used to record discharges or water levels, the extrapolation beyond the recording range or non-stationary conditions such as seasonal changes in vegetation or in sediment erosion. Usually, discharge is not directly measured but calculated via rating curves from water level time series that are much easier to measure at a high temporal resolution (Sikorska and Renard, 2017; McMillan et al., 2022). Rating curves must be established for each gauging station independently using pairs of water level and discharge records taken simultaneously directly at a river gauge. They allow conversion of continuous water level records into pseudo-observed discharge but are themselves subject to uncertainty (e.g., see Kiang et al., 2018), particularly for the range of low and high flows (Westerberg et al., 2016).
CAMELS-CH comprises both observed discharge and water level time series (see Table 1). Uncertainty estimates are provided for exemplary catchments in order to inform respective analyses but were not evaluated for each specific catchment. In a recent study on a limited number of Swiss catchments, Westerberg et al. (2022) investigated these uncertainty sources in three Swiss catchments (gauge_ids: 2034, 2450 and 2469) of different properties and regime types (one glaciated, i.e., gauge_id: 2469). Using historical rating curves used by FOEN and 150 water level-discharge pairs measured between 1980 and 2014, their uncertainties were estimated based on Monte Carlo sampling with the Voting Point likelihood method (McMillan and Westerberg, 2015). Uncertainty in discharge estimates was calculated for selected low-, medium- and high-flow quantiles, yielding half-widths of the 5 %–95 % uncertainty bounds for hourly Q10, Q80 and Q99.9 of on average ±22 %–30 %, ±10 %–12 % and ±8.6 %–20 %, respectively (see Table 2). Yet, due to a lack of data pairs in the high-flow range, corresponding estimates are vague. High-flow events occur rarely and gauging them accurately is extremely challenging. Hence, in a companion study, Staudinger and Viviroli (2020) refined the estimates for high-flow quantiles, showing that the half-widths of the 2.5 %–97.5 % uncertainty bounds for hourly Q99, Q99.9 and Q99.99 data were on average ±14 %, ±15 % and ±22 %, respectively. This analysis was based on the same three gauging stations and 11 others (gauge_ids: 2034, 2102, 2104, 2159, 2160, 2176, 2179, 2369, 2378, 2425, 2434, 2449, 2450, 2469) using the same method as in Westerberg et al. (2022).
Such rating curve uncertainties might further propagate to simulations of hydrological models if these were calibrated with respective data (Westerberg et al., 2022), which has to be taken into account when working with the PREVAH-generated discharge simulations here. Of course, also the meteorologic time series are subject to uncertainty. These uncertainties are further specified in the referenced data sources in Appendices A1.2 and A1.3, for observation- and simulation-based data, respectively.
CAMELS-CH and the Caravan extension are freely available at https://doi.org/10.5281/zenodo.7784632 (Höge et al., 2023). This corresponds to the CAMELS-CH code repository at https://github.com/camels-ch/camels (last access: 13 December 2023). Following FAIR data principles, we reference original data files (see also Appendix A1) and provide a transparent protocol of the applied data processing whenever possible at https://camels-ch.github.io/ (last access: 13 December 2023).
CAMELS-CH is the first freely available data set that covers the entirety of hydrologic Switzerland, providing data for 298 catchments and 33 lakes. The data set comprises hydro-meteorologic daily time series as well as annual time series of land cover and glacier data from 1980 to 2020. Furthermore, it contains catchment delineations and properties, including data on glaciation, reservoirs and hydropower which all play important roles in the Alpine water cycle.
Opportunities arise for eliciting long-term trends over decades for climate research for hydrologic Switzerland or for conducting short-term local water cycle analyses in particular basins. Investigating human impacts regarding land cover or reservoir and hydropower utilization is made possible as well as research on various subsurface properties and their relation to natural water flow and human water demand. CAMELS-CH can serve as a benchmark data set for improved modeling or analysis tools within Switzerland and also for other mountainous and alpine regions around the globe.
Within Switzerland's climate adaption strategy, water plays a key role (see Lanz, 2021). Hence, aside from many application scenarios discussed above, CAMELS-CH is meant to contribute to further hydrological and climatic research in Switzerland that supports decision processes on adapting the various natural and human-made parts of the water tower of Europe.
CAMELS-CH further bears the potential for extensions, for example, (i) refining of the temporal resolution from daily to hourly, e.g., based on the hourly discharge database HydroCH by Kauzlaric et al. (2023) (https://doi.org/10.5281/zenodo.7691294) who collected and homogenized data for hydrologic Switzerland; (ii) including cantonal data from rivers and streams not monitored by the FOEN; (iii) adding water quality and chemical data as it became available recently for the original CAMELS (US) data set (Sterle et al., 2022) and that would certainly contribute to water quality research in Switzerland; (iv) adding CAMELS-CH data to the hydrologic atlas of Switzerland (HADES: https://hydrologicalatlas.ch/; last accessed: 21 March 2023).
The similar format of all CAMELS data sets fosters ease of utilization and international standardization. As a direct step towards creating a global unified data resource, CAMELS-CH was integrated into the Caravan data set (Kratzert et al., 2023) as a contribution to the growing field of global hydro-meteorological research (see Höge et al., 2023).
A1 Additional online references
Additional information about data sources and corresponding URLs to the online resources used are listed below.
A1.1 Hydrologic discharge
Hydrologic discharge time series for catchments outside of political Switzerland available as download or received upon personal request (see Kauzlaric et al., 2023) from
-
Austria: Office of the Federal State of Vorarlberg, Division of Water Management, Bregenz (VRB, 2020, include personal request) and 15 catchments from LamaH (Klingler et al., 2021), i.e., gauge_ids: 3001, 3004, 3006, 3007, 3008, 3009, 3012, 3014, 3015, 3019, 3023, 3028, 3031, 3032 and 3033;
-
France: French database of discharge measurements (BanqueHydro, 2020);
-
Germany: State Agency for the Environment Baden-Württemberg – Hydrographic Service, Karlsruhe (LUBW, 2020) and Bavarian State Office for the Environment – Hydrographic Service, Munich (GKDB, 2020);
-
Italy: regional agency for environmental protection for the region Lombardia, Milano (ARPALombardia, 2020, include personal request) and Regional agency for environmental protection for the region Piemonte, Torino (ARPAPiemonte, 2020, include personal request).
A1.2 MeteoSwiss data products
Data product documentations by MeteoSwiss (2023) for
-
daily precipitation: https://www.meteoswiss.admin.ch/dam/jcr:4f51f0f1-0fe3-48b5-9de0-15666327e63c/ProdDoc_RhiresD.pdf (last access: 15 May 2023);
-
daily absolute temperature: https://www.meteoswiss.admin.ch/dam/jcr:818a4d17-cb0c-4e8b-92c6-1a1bdf5348b7/ProdDoc_TabsD.pdf (last access: 15 May 2023);
-
daily relative sunshine duration: https://www.meteoswiss.admin.ch/dam/jcr:981891db-30d1-47cc-a2e1-50c270bdaf22/ProdDoc_SrelD.pdf (last access: 15 May 2023).
A1.3 PREVAH manual
PREVAH (Viviroli et al., 2007) provides so-called intercepted evapotranspiration EI (intercept_et_sim in Table 1 and intercept storage Δ SI (intercept_storage_sim in Table 1) to describe the water balance at the soil surface underneath a plant canopy. With precipitation P (precipitation_sim in Table 1) entering the canopy, the available water amount for runoff generation Pb at the soil surface (as defined in Eq. 4.2-1 of the PREVAH model description below) is expressed as
Note that Δ SI is a state variable difference in millimeters that has to be calculated per day, while the other three variables are fluxes in millimeters per day. For illustration, see Fig. 4.2-1, the PREVAH model description, i.e., in Part II of Viviroli et al. (2007).
A1.4 Swiss lakes
Information about the regulation of Swiss lakes is provided via FOEN (2020b): unregulated lakes in the data set are Baldeggersee, Bodensee (Lake Constance), Lauerzersee, Sarnersee and Walensee. Note that their status might change in the future, for example, a flood relief tunnel is scheduled for completion on Lake Sarnersee in 2024, while a regulating weir is not planned there for the time being.
A1.5 Hydrogeology
The hydrogeological map of Switzerland (1:500 000; geo.admin.ch, 2016) covers the largest part of hydrologic Switzerland. The hydrogeologic map of Germany (1:250 000; GDK, 2019) was used as an extension to the north and west (product description available at https://www.bgr.bund.de/DE/Themen/Wasser/Projekte/laufend/Beratung/Huek200/huek200_projektbeschr.html; last access: 15 May 2023).
A2 Comparison of hydrogeologic attributes between CAMELS-CH and CAMELS-GB
Hydrogeologic attributes in CAMELS-CH were derived from local hydrogeologic maps so that attribute names remain similar. Directly relating them to their corresponding attributes in CAMELS-GB can be done using Table A1.
Table A1Hydrogeology attributes: comparison between CAMELS-CH and CAMELS-GB (Coxon et al., 2020)
A3 Contrasting hydrology and climate attributes from observed vs. simulated data
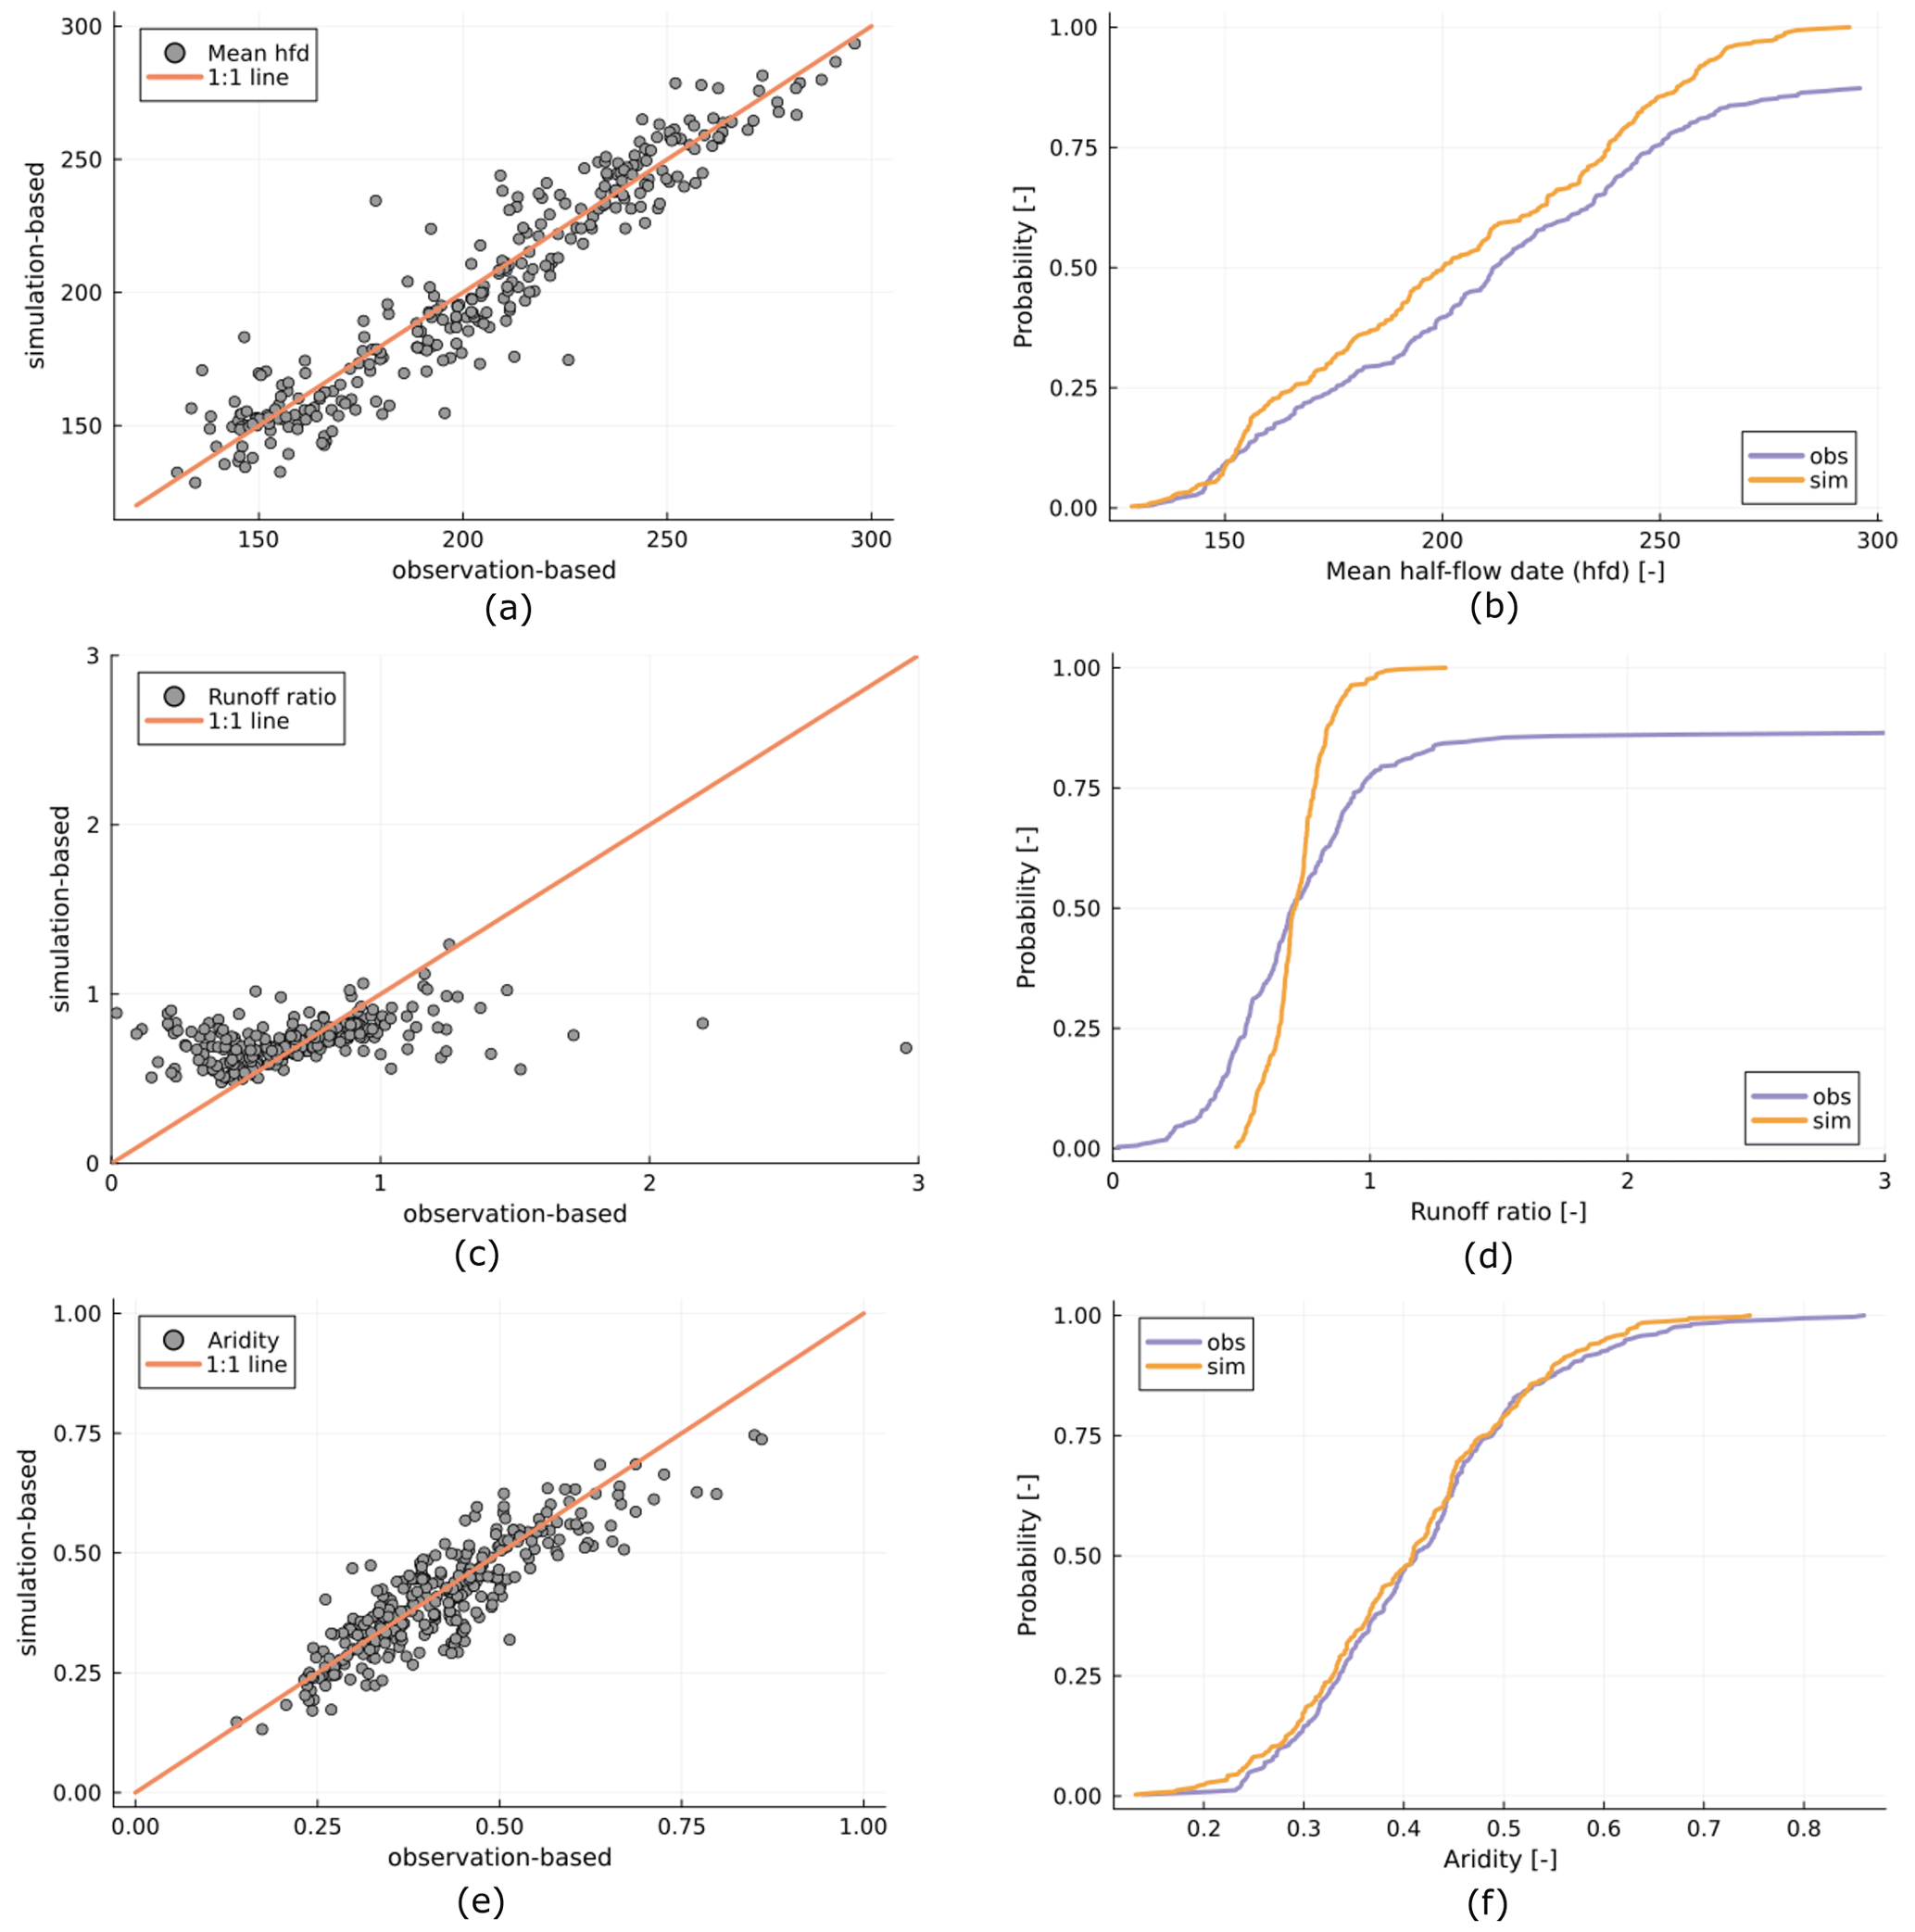
Figure A1Scatter plots (a, c, e) and cumulative distributions (b, d, f) comparison of hydrologic signatures mean half-flow date (a, b) and runoff ratio (c, d), and climate index aridity (e, f). Note that, for the runoff ratio figures (c, d), observation-based values >3 (gauge_id (value): 2079 (3.281), 5002 (3.65), 5006 (12.024)) were excluded from the plots. Cumulative distributions of observation-based values might not reach 1.00 probability due to non-availability of the respective attribute for certain catchments.
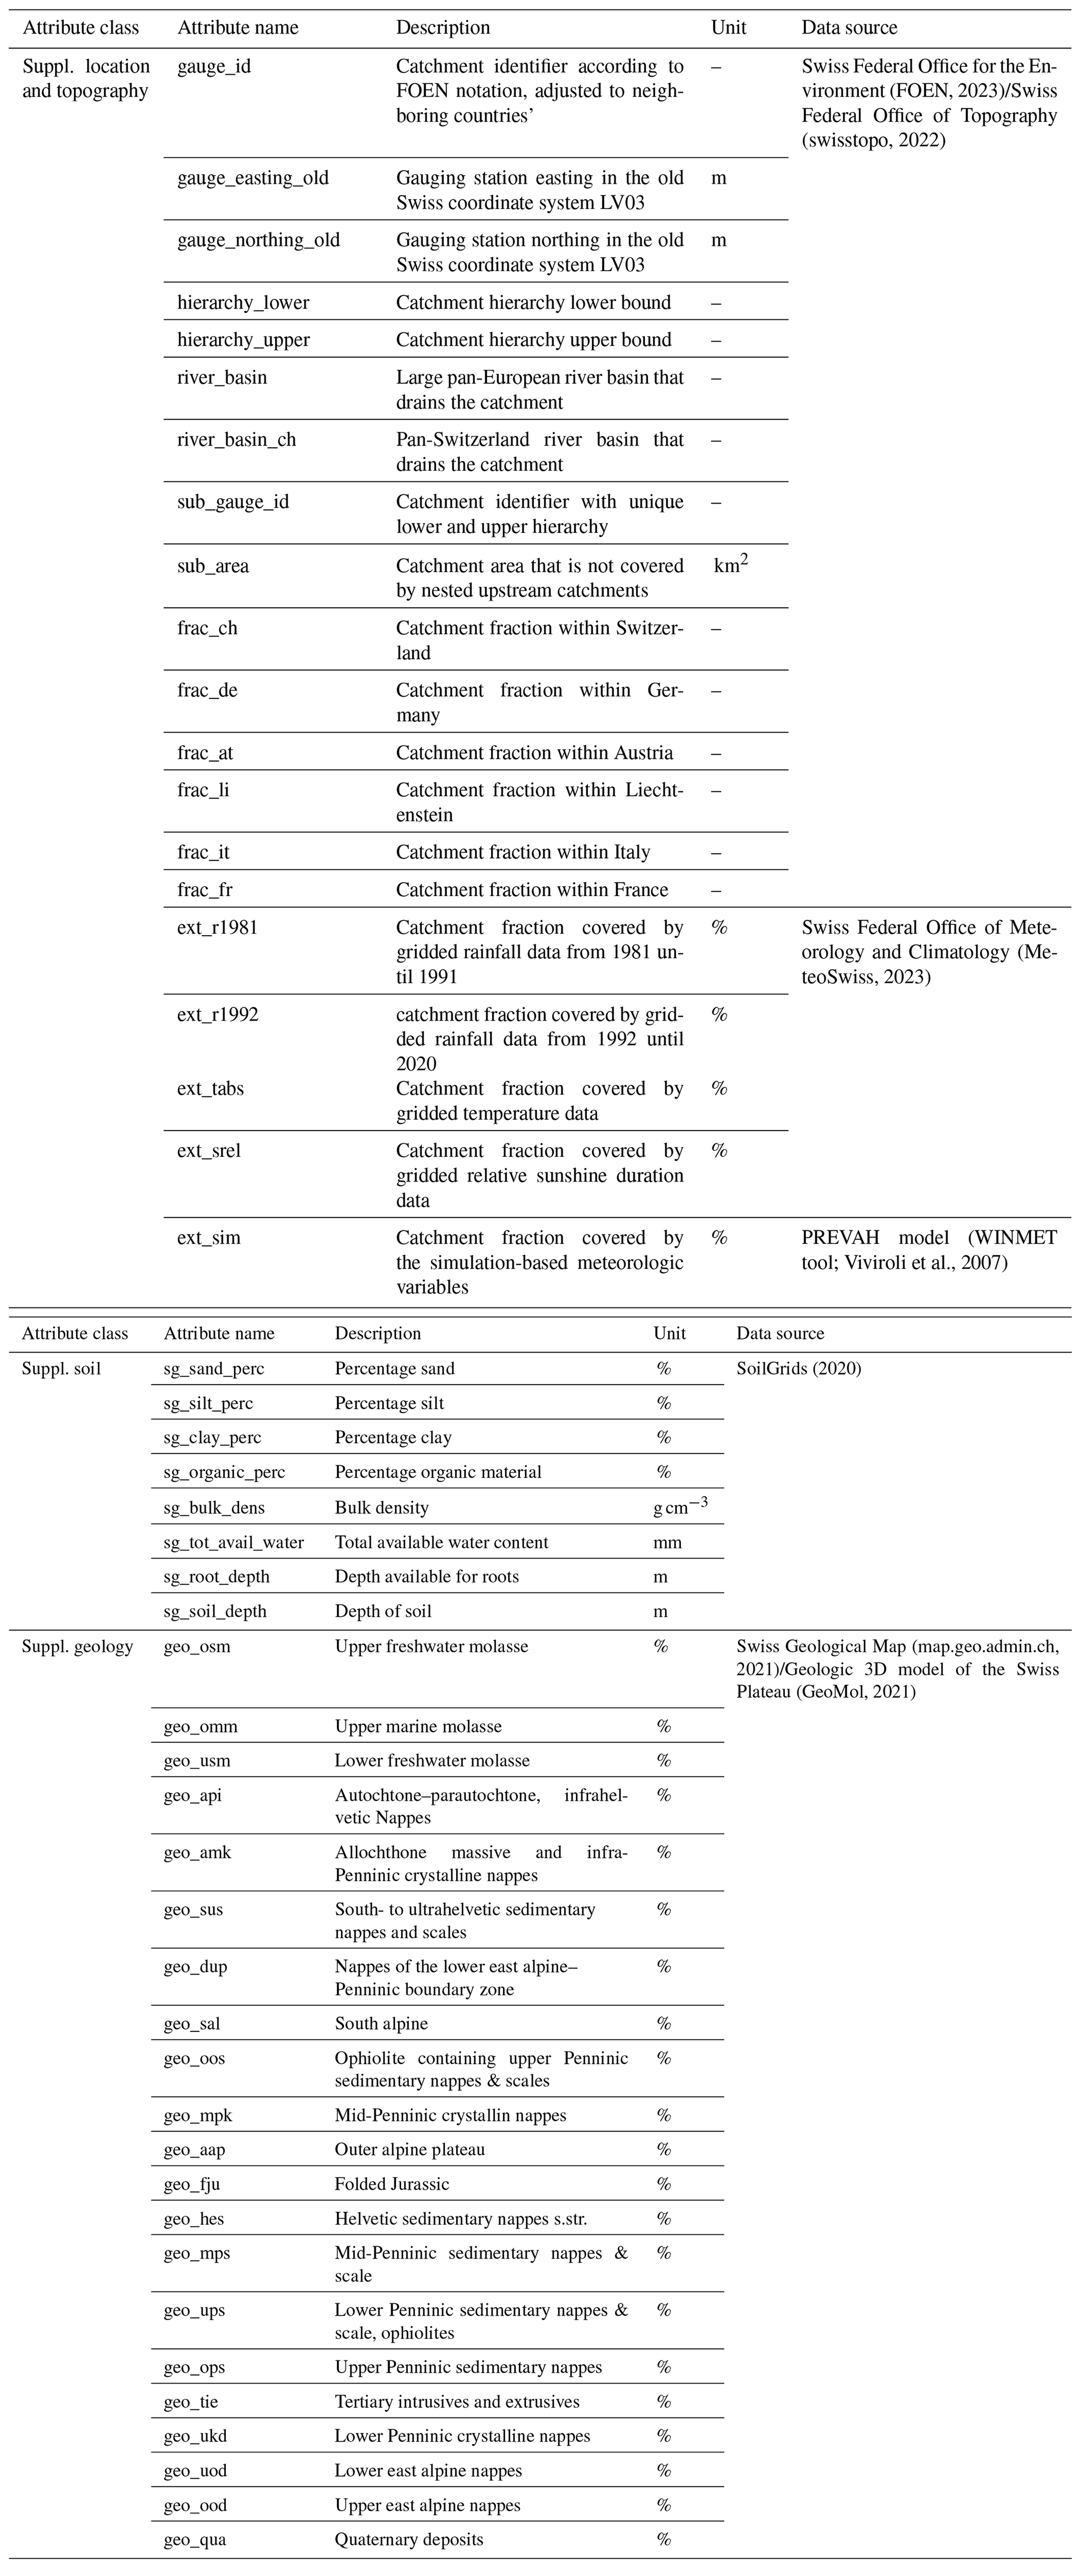
For the three categories “location and topography” (see Sect. 6.1), “soil” (see Sect. 6.3) and “geology” (see Sect. 6.5), we provide supplementary attributes to offer a more comprehensive coverage and to account for some specifics of Switzerland: regarding location and topography, note that the coordinate information on northing and easting above is provided in the Swiss reference system LV95. This is the coordinate system introduced in 1995. Yet, many public resources are still available in the old reference system LV03 (established in 1903). Hence, we additionally provide the old northing and easting values in the supplementary topography file. Furthermore, with many basins being nested and in order to account for the hierarchy between major rivers and minor streams and their tributaries, we provide two hierarchy numbers for bounding all connected stream parts. For example, the well-investigated Thur river (e.g., Abbaspour et al., 2007; Lopez et al., 2015; Doulatyari et al., 2017; Rössler et al., 2019; Dal Molin et al., 2020) with its length of 127 km and its catchment area (gauge_id: 2044) of 1702 km2 nests further basins and is itself part of larger ones. It has hierarchy_lower =159 as its lower hierarchy bound and hierarchy_upper =178 as its upper bound. All catchments that have their own lower bound hierarchy_lower between these two numbers are nested within the Thur basin. In this case, these are two catchments (gauge_id: 2386 with bounds 160 and 163, and gauge_id: 2181 with bounds 164 and 177) with the first one nesting one further catchment and the second one several others. To find all sub-catchments of a larger catchment C, the following relation is applicable: hierarchy_lower_C ≤ hierarchy_lower < hierarchy_upper_C. All catchments for which the hierarchy_lower in the center of the expression holds are sub-catchments of catchment C.
The supplementary topographic attributes sub_gauge_id and sub_area enable users to work with non-overlapping catchment parts. The sub_area of a catchment is the area within the full catchment that does not overlap with the areas of any nested upstream catchment. Some gauge_ids have the same catchment delineations and therefore the same hierarchy numbers. Then, they are assigned the same sub_gauge_id. For example, gauge_ids 2022 and 2074 both refer to different locations at the lake “Lago Maggiore” and have therefore the same hierarchies (lower: 519; upper: 520). Therefore, both were assigned the same sub_gauge_id, i.e., 2074. Further identical sub_gauge_id occur for gauge_ids 2026, 2027 and 2028 sharing sub_gauge_id = 2026 (all lake “Lac Léman”); for gauge_ids 2154 and 2642 sharing sub_gauge_id =2642 (both lake “Lac de Neuchâtel”); and for gauge_ids 2032 and 4010 sharing sub_gauge_id =4010 (both at lake “Bodensee” but 4010 referring to the river outflow gauging station). Identical sub_gauge_ids shall prevent that catchments be counted multiple times. For instance, when aggregating sub_areas, note that only the values with uniquely occurring sub_gauge_id shall be added (such that sub-catchments with identical hierarchies are only counted once). Then, the sum of these sub_areas for a certain gauge_id equals the full catchment area (see topographic attributes in Table 2).
As hydrologic Switzerland covers five countries, we also report the fractions of how much of each catchment area lies in the respective countries. We provide the areal percentage of each basin covered by the gridded meteorologic data products that were used to aggregate the basin-specific time series for precipitation, temperature and relative sunshine duration (MeteoSwiss) as well as all simulated variables (WINMET). The catchments within political Switzerland are well covered by all products, but several basins in the neighboring countries lack coverage by certain MeteoSwiss data. Note that for precipitation the spatial coverage was extended from political to hydrologic Switzerland in 1992. Therefore, some catchments have a ext_r1981 of zero but are well covered for ext_r1992. Yet, while observed precipitation is available for many basins, some lack observation-based temperature and relative sunshine duration data. However, simulated data time series can be used to fill such gaps.
Supplementary attributes for soil are derived from the global SoilGrid database (Hengl et al., 2017) and more detailed geological attributes were obtained from Swiss data sources, i.e., from the Swiss Geological Map (map.geo.admin.ch, 2021) and the GeoMol database (GeoMol, 2021). The respective variables (geo_OSM, geo_OMM,...) provide greater detail with respect to geologic formations across the country. While the Swiss mountainous regions are dominated by crystalline, sedimentary (central Alps) and karstified formations (north of the Swiss Plateau) the Swiss Plateau is dominated by different layers of molasse. These molasse layers differ in origin (marine and freshwater sources) and physical properties, and were shown to be good predictors of hydrological behavior in previous studies (e.g., Carlier et al., 2018; Floriancic et al., 2022).
(FOEN, 2023)(swisstopo, 2022)(MeteoSwiss, 2023)(WINMET tool; Viviroli et al., 2007)SoilGrids (2020)(map.geo.admin.ch, 2021)(GeoMol, 2021)Table B1Supplementary catchment-specific static attributes. (Note that with regard to the attribute class “Suppl. soil”, each soil type/property is accompanied by percentiles (5 %, 25 %, 50 %, 75 % and 90 %), distribution skewness and missing percentage across the catchment.)
MH initiated and managed the CAMELS-CH project and corresponding online repositories, prepared and processed data, created most figures and wrote most of the manuscript. MK, RS, US, PH and JS were part of the core team that prepared and processed data, created maps, maintained the Github repository and documentation, and supported the manuscript writing. All other authors suggested improvements and made additions to the manuscript, as well as provided data and expertise for specific topics: MGF (geology), DV (hydrogeology), SW (glaciers outside of Switzerland), AESS (hydrometry), MB (reservoirs and human impact), SP (hydrology and climate), and (PREVAH simulations). FF and MH acquired funding. NA and FF advised on the project. All authors contributed to finalizing the manuscript.
The contact author has declared that none of the authors has any competing interests.
Publisher’s note: Copernicus Publications remains neutral with regard to jurisdictional claims made in the text, published maps, institutional affiliations, or any other geographical representation in this paper. While Copernicus Publications makes every effort to include appropriate place names, the final responsibility lies with the authors.
We thank the various Swiss institutions FOEN/BAFU, MeteoSwiss, swisstopo, SLF (Tobias Jonas) and GLAMOS (Matthias Huss) for providing observation-based data and expertise. We also acknowledge the Copernicus program https://www.copernicus.eu/en (last access: 15 May 2023) as a great resource and thank the data-providing agencies in Austria, France, Germany and Italy for their support. We express our gratitude to Bettina Schaefli (University of Bern, head of the Swiss Hydrologic Commission), Peter Reichert (professor emeritus, former Eawag), Jan Seibert and Marc Vis (Universität Zürich), Paolo Burlando (ETH Zürich), Paolo Benettin (EPFL), James Kirchner (ETH Zürich) and Christian Stamm (Eawag) for supporting the CAMELS-CH initiative from an early stage. Finally, we thank Corinna Frank (WeGaw SA), Franziska Clerc-Schwarzenbach, Rosanne Lane and one anonymous reviewer for their helpful feedback.
This paper was edited by Sibylle K. Hassler and reviewed by Rosanna Lane and Yanchen Zheng.
Abbaspour, K. C., Yang, J., Maximov, I., Siber, R., Bogner, K., Mieleitner, J., Zobrist, J., and Srinivasan, R.: Modelling hydrology and water quality in the pre-alpine/alpine Thur watershed using SWAT, J. Hydrol., 333, 413–430, https://doi.org/10.1016/j.jhydrol.2006.09.014, 2007. a
Addor, N., Rössler, O., Köplin, N., Huss, M., Weingartner, R., and Seibert, J.: Robust changes and sources of uncertainty in the projected hydrological regimes of Swiss catchments, Water Resour. Res., 50, 7541–7562, https://doi.org/10.1002/2014WR015549, 2014. a
Addor, N., Newman, A. J., Mizukami, N., and Clark, M. P.: The CAMELS data set: catchment attributes and meteorology for large-sample studies, Hydrol. Earth Syst. Sci., 21, 5293–5313, https://doi.org/10.5194/hess-21-5293-2017, 2017. a, b, c
Addor, N., Nearing, G., Prieto, C., Newman, A., Le Vine, N., and Clark, M. P.: A ranking of hydrological signatures based on their predictability in space, Water Resour. Res., 54, 8792–8812, 2018. a
Addor, N., Do, H. X., Alvarez-Garreton, C., Coxon, G., Fowler, K., and Mendoza, P. A.: Large-sample hydrology: recent progress, guidelines for new datasets and grand challenges, Hydrolog. Sci. J., 65, 712–725, https://doi.org/10.1080/02626667.2019.1683182, 2020. a
Almagro, A., Oliveira, P. T. S., Meira Neto, A. A., Roy, T., and Troch, P.: CABra: a novel large-sample dataset for Brazilian catchments, Hydrol. Earth Syst. Sci., 25, 3105–3135, https://doi.org/10.5194/hess-25-3105-2021, 2021. a
Alvarez-Garreton, C., Mendoza, P. A., Boisier, J. P., Addor, N., Galleguillos, M., Zambrano-Bigiarini, M., Lara, A., Puelma, C., Cortes, G., Garreaud, R., McPhee, J., and Ayala, A.: The CAMELS-CL dataset: catchment attributes and meteorology for large sample studies – Chile dataset, Hydrol. Earth Syst. Sci., 22, 5817–5846, https://doi.org/10.5194/hess-22-5817-2018, 2018. a, b
Andréassian, V., Perrin, C., Berthet, L., Le Moine, N., Lerat, J., Loumagne, C., Oudin, L., Mathevet, T., Ramos, M.-H., and Valéry, A.: HESS Opinions ”Crash tests for a standardized evaluation of hydrological models”, Hydrol. Earth Syst. Sci., 13, 1757–1764, https://doi.org/10.5194/hess-13-1757-2009, 2009. a
Andréassian, V., Delaigue, O., Perrin, C., Janet, B., and Addor, N.: CAMELS-FR: A large sample, hydroclimatic dataset for France, to support model testing and evaluation, in: EGU General Assembly Conference Abstracts, EGU21–13349, online, 19–30 April 2021. a
ARPALombardia: ACQUA E IDROLOGIA, https://www.arpalombardia.it/dati-e-indicatori/acqua-e-idrologia/ (last access: 11 December 2023), 2020. a
ARPAPiemonte: Rete Idrologica, https://www.arpa.piemonte.it/rischi_naturali/snippets_arpa_graphs/map_meteoweb/?rete=stazione_meteorologica (last access: 11 December 2023), 2020. a
Arsenault, R., Brissette, F., Martel, J.-L., Troin, M., Lévesque, G., Davidson-Chaput, J., Gonzalez, M. C., Ameli, A., and Poulin, A.: A comprehensive, multisource database for hydrometeorological modeling of 14,425 North American watersheds, Sci. Data, 7, 243, https://doi.org/10.1038/s41597-020-00583-2, 2020. a
BanqueHydro: Hydro Portail, https://www.hydro.eaufrance.fr/ (last access: 15 May 2023), 2020. a
Beniston, M., Stoffel, M., Harding, R., Kernan, M., Ludwig, R., Moors, E., Samuels, P., and Tockner, K.: Obstacles to data access for research related to climate and water: implications for science and EU policy-making, Environ. Sci. Policy, 17, 41–48, https://doi.org/10.1016/j.envsci.2011.12.002, 2012. a
Bezzola, G. and Hegg, C.: Ereignisanalyse Hochwasser 2005, Teil 1–Prozesse, Schäden und erste Einordnung, Umwelt-Wissen Nr. 0707, Bundesamt für Umwelt BAFU und Eidg, Tech. rep., Forschungsanstalt WSL, Bern, https://www.bafu.admin.ch/bafu/de/home/themen/naturgefahren /publikationen-studien/publikationen/ereignisanalyse-hochwasser-2005-prozesse-schaeden-und-erste-einordnungen.html (last access: 2 March 2023), 2007. a
Birsan, M.-V., Molnar, P., Burlando, P., and Pfaundler, M.: Streamflow trends in Switzerland, J. Hydrol., 314, 312–329, https://doi.org/10.1016/j.jhydrol.2005.06.008, 2005. a
Brunner, M. I., Hingray, B., Zappa, M., and Favre, A.-C.: Future Trends in the Interdependence Between Flood Peaks and Volumes: Hydro-Climatological Drivers and Uncertainty, Water Resour. Res., 55, 4745–4759, https://doi.org/10.1029/2019WR024701, 2019a. a
Brunner, M. I., Liechti, K., and Zappa, M.: Extremeness of recent drought events in Switzerland: dependence on variable and return period choice, Nat. Hazards Earth Syst. Sci., 19, 2311–2323, https://doi.org/10.5194/nhess-19-2311-2019, 2019b. a, b
Brunner, M. I., Götte, J., Schlemper, C., and Van Loon, A. F.: Hydrological Drought Generation Processes and Severity Are Changing in the Alps, Geophys. Res. Lett., 50, e2022GL101776, https://doi.org/10.1029/2022GL101776, 2023. a
Büttner, G., Feranec, J., Jaffrain, G., Mari, L., Maucha, G., and Soukup, T.: The CORINE land cover 2000 project, EARSeL eProceedings, 3, 331–346, 2004. a
Carlier, C., Wirth, S. B., Cochand, F., Hunkeler, D., and Brunner, P.: Geology controls streamflow dynamics, J. Hydrol., 566, 756–769, https://doi.org/10.1016/j.jhydrol.2018.08.069, 2018. a
Chagas, V. B. P., Chaffe, P. L. B., Addor, N., Fan, F. M., Fleischmann, A. S., Paiva, R. C. D., and Siqueira, V. A.: CAMELS-BR: hydrometeorological time series and landscape attributes for 897 catchments in Brazil, Earth Syst. Sci. Data, 12, 2075–2096, https://doi.org/10.5194/essd-12-2075-2020, 2020. a
CLC: CORINE land cover, https://land.copernicus.eu/en/products/corine-land-cover, last access: 29 September 2023. a
Coxon, G., Addor, N., Bloomfield, J. P., Freer, J., Fry, M., Hannaford, J., Howden, N. J. K., Lane, R., Lewis, M., Robinson, E. L., Wagener, T., and Woods, R.: CAMELS-GB: hydrometeorological time series and landscape attributes for 671 catchments in Great Britain, Earth Syst. Sci. Data, 12, 2459–2483, https://doi.org/10.5194/essd-12-2459-2020, 2020. a, b, c, d, e, f, g, h, i
Dal Molin, M., Schirmer, M., Zappa, M., and Fenicia, F.: Understanding dominant controls on streamflow spatial variability to set up a semi-distributed hydrological model: the case study of the Thur catchment, Hydrol. Earth Syst. Sci., 24, 1319–1345, https://doi.org/10.5194/hess-24-1319-2020, 2020. a
David, P. C., Chaffe, P. L., Chagas, V. B., Dal Molin, M., Oliveira, D. Y., Klein, A. H., and Fenicia, F.: Correspondence Between Model Structures and Hydrological Signatures: A Large-Sample Case Study Using 508 Brazilian Catchments, Water Resour. Res., 58, e2021WR030619, https://doi.org/10.1029/2021WR030619, 2022. a
Do, H. X., Gudmundsson, L., Leonard, M., and Westra, S.: The Global Streamflow Indices and Metadata Archive (GSIM) – Part 1: The production of a daily streamflow archive and metadata, Earth Syst. Sci. Data, 10, 765–785, https://doi.org/10.5194/essd-10-765-2018, 2018. a
Doulatyari, B., Betterle, A., Radny, D., Celegon, E. A., Fanton, P., Schirmer, M., and Botter, G.: Patterns of streamflow regimes along the river network: The case of the Thur river, Environ. Modell. Softw., 93, 42–58, https://doi.org/10.1016/j.envsoft.2017.03.002, 2017. a
Duan, Q., Schaake, J., Andréassian, V., Franks, S., Goteti, G., Gupta, H., Gusev, Y., Habets, F., Hall, A., Hay, L., Hogue, T., Huang, M., Leavesley, G., Liang, X., Nasonova, O., Noilhan, J., Oudin, L., Sorooshian, S., Wagener, T., and Wood, E.: Model Parameter Estimation Experiment (MOPEX): An overview of science strategy and major results from the second and third workshops, J. Hydrol., 320, 3–17, https://doi.org/10.1016/j.jhydrol.2005.07.031, 2006. a
Efrat, M.: Caravan extension Israel – Israel dataset for large-sample hydrology, Zenodo, https://doi.org/10.5281/zenodo.7758516, 2023. a
ESDD: European Soil Database Derived data, https://esdac.jrc.ec.europa.eu/content/european-soil-database-derived-data (last access: 15 May 2023), 2013. a
EU-DEM: Copernicus DEM, https://spacedata.copernicus.eu/collections/copernicus-digital-elevation-model (last access: 11 December 2023), 2016. a
EU-Hydro: EU-Hydro River Network Database, https://land.copernicus.eu/imagery-in-situ/eu-hydro/eu-hydro-river-network-database (last access: 15 May 2023), 2020. a, b
eurostat: Geostat, (EU), https://ec.europa.eu/eurostat/web/gisco/geodata/reference-data/population-distribution-demography/geostat (last access: 15 May 2023), 2018. a, b
Falkenmark, M. and Chapman, T.: Comparative hydrology: An ecological approach to land and water resources, Unesco, 1989. a
Fischer, A., Seiser, B., Stocker Waldhuber, M., Mitterer, C., and Abermann, J.: Tracing glacier changes in Austria from the Little Ice Age to the present using a lidar-based high-resolution glacier inventory in Austria, The Cryosphere, 9, 753–766, https://doi.org/10.5194/tc-9-753-2015, 2015. a
Floriancic, M. G., Spies, D., van Meerveld, I. H. J., and Molnar, P.: A multi-scale study of the dominant catchment characteristics impacting low-flow metrics, Hydrol. Process., 36, e14462, https://doi.org/10.1002/hyp.14462, 2022. a
FOEN: Topographical catchments of hydrometric gauging stations, https://www.bafu.admin.ch/bafu/en/home/topics/water/state/maps/geodata/the-hydrometric-gauging-station-catchments-in-switzerland.html (last access: 15 May 2023), 2020a. a
FOEN: Important lake regulations, https://www.bafu.admin.ch/bafu/de/home/themen/naturgefahren/dossiers/seeregulierung/wichtige-seeregulierungen.html (last access: 15 May 2023), 2020b. a
FOEN: Topographical catchments of Swiss waterbodies, https://www.bafu.admin.ch/bafu/de/home/themen/wasser/zustand/karten/geodaten/einzugsgebietsgliederung-schweiz.html (last access: 15 May 2023), 2020c. a
FOEN: Die biogeographischen Regionen der Schweiz, https://www.bafu.admin.ch/bafu/en/home/topics/landscape/publications-studies/publications/die-biogeographischen-regionen-der-schweiz.html (last access: 15 May 2023), 2022. a
FOEN: Federal Office for the Environment, https://www.bafu.admin.ch/bafu/en/home.html (last access: 15 May 2023), 2023. a, b, c, d, e, f
Forster, F. and Hegg, C.: Die Hochwasser vom Mai 1999: eine Analyse anhand von hydrologischen Messungen in kleinen Einzugsgebieten | The Flood Events of May 1999: an Analysis Based on Hydrologic Measurements in Small Catchments, Schweizerische Zeitschrift fur Forstwesen, 151, 183–191, https://doi.org/10.3188/szf.2000.0183, 2000. a
Fowler, K. J. A., Acharya, S. C., Addor, N., Chou, C., and Peel, M. C.: CAMELS-AUS: hydrometeorological time series and landscape attributes for 222 catchments in Australia, Earth Syst. Sci. Data, 13, 3847–3867, https://doi.org/10.5194/essd-13-3847-2021, 2021. a
Gardent, M., Rabatel, A., Dedieu, J.-P., and Deline, P.: Multitemporal glacier inventory of the French Alps from the late 1960s to the late 2000s, Global Planet. Change, 120, 24–37, https://doi.org/10.1016/j.gloplacha.2014.05.004, 2014. a
GDK: Hydrogeological Map of Germany (1:250'000), https://gdk.gdi-de.org/geonetwork/srv/api/records/61ac4628-6b62-48c6-89b8-46270819f0d6 (last access: 15 May 2023), 2019. a, b, c
geo.admin.ch: Groundwater Resources 500, http://map.geo.admin.ch/?layers=ch.swisstopo.geologie-hydrogeologische_karte-grundwasservorkommen (last access: 15 May 2023), 2016. a, b, c
GeoMol: A geological 3D model of the Swiss Plateau, https://www.swisstopo.admin.ch/en/knowledge-facts/geology/geological-data/3d-geology/deep/geomol.html (last access: 15 May 2023), 2021. a, b
GKDB: Gewässerkundlicher Dienst Bayern, https://www.gkd.bayern.de/en/rivers/discharge/tables (last access: 15 May 2023), 2020. a
GLAMOS: Swiss Glacier Inventory, https://glamos.ch/en/downloads#inventories/B82-14 (last access: 15 May 2023), 2016. a, b
Gleeson, T., Smith, L., Moosdorf, N., Hartmann, J., Dürr, H. H., Manning, A. H., van Beek, L. P. H., and Jellinek, A. M.: Mapping permeability over the surface of the Earth, Geophys. Res. Lett., 38, L02401, https://doi.org/10.1029/2010GL045565, 2011. a
Gleeson, T., Moosdorf, N., Hartmann, J., and van Beek, L. P. H.: A glimpse beneath earth's surface: GLobal HYdrogeology MaPS (GLHYMPS) of permeability and porosity, Geophys. Res. Lett., 41, 3891–3898, https://doi.org/10.1002/2014GL059856, 2014. a
Gnann, S. J., McMillan, H. K., Woods, R. A., and Howden, N. J.: Including regional knowledge improves baseflow signature predictions in large sample hydrology, Water Resour. Res., 57, e2020WR028354, https://doi.org/10.1029/2020WR028354, 2021. a
Gudmundsson, L., Do, H. X., Leonard, M., and Westra, S.: The Global Streamflow Indices and Metadata Archive (GSIM) – Part 2: Quality control, time-series indices and homogeneity assessment, Earth Syst. Sci. Data, 10, 787–804, https://doi.org/10.5194/essd-10-787-2018, 2018. a
Gudmundsson, L., Leonard, M., Do, H. X., Westra, S., and Seneviratne, S. I.: Observed Trends in Global Indicators of Mean and Extreme Streamflow, Geophys. Res. Lett., 46, 756–766, https://doi.org/10.1029/2018GL079725, 2019. a
Gudmundsson, L., Boulange, J., Do, H. X., Gosling, S. N., Grillakis, M. G., Koutroulis, A. G., Leonard, M., Liu, J., Schmied, H. M., Papadimitriou, L., Pokhrel, Y., Seneviratne, S. I., Satoh, Y., Thiery, W., Westra, S., Zhang, X., and Zhao, F.: Globally observed trends in mean and extreme river flow attributed to climate change, Science, 371, 1159–1162, https://doi.org/10.1126/science.aba3996, 2021. a
Gupta, H. V., Perrin, C., Blöschl, G., Montanari, A., Kumar, R., Clark, M., and Andréassian, V.: Large-sample hydrology: a need to balance depth with breadth, Hydrol. Earth Syst. Sci., 18, 463–477, https://doi.org/10.5194/hess-18-463-2014, 2014. a
Gurtz, J., Baltensweiler, A., and Lang, H.: Spatially distributed hydrotope-based modelling of evapotranspiration and runoff in mountainous basins, Hydrol. Process., 13, 2751–2768, 1999. a
Hartmann, J. and Moosdorf, N.: The new global lithological map database GLiM: A representation of rock properties at the Earth surface, Geochem. Geophy. Geosy., 13, Q12004, https://doi.org/10.1029/2012GC004370, 2012. a, b
Hengl, T., Mendes de Jesus, J., Heuvelink, G. B. M., Ruiperez Gonzalez, M., Kilibarda, M., Blagotić, A., Shangguan, W., Wright, M. N., Geng, X., Bauer-Marschallinger, B., Guevara, M. A., Vargas, R., MacMillan, R. A., Batjes, N. H., Leenaars, J. G. B., Ribeiro, E., Wheeler, I., Mantel, S., and Kempen, B.: SoilGrids250m: Global gridded soil information based on machine learning, PLOS ONE, 12, 1–40, https://doi.org/10.1371/journal.pone.0169748, 2017. a, b
Hiederer, R.: Mapping soil properties for Europe – spatial representation of soil database attributes, EUR26082EN Scientific and Technical Research Series, 47 pp., Publication Office of the European Union, https://doi.org/10.2788/94128, 2013a. a
Hiederer, R.: Mapping soil typologies – spatial decision support applied to European Soil Database, EUR25932EN Scientific and Technical Research Series, 47 pp., Publication Office of the European Union, https://doi.org/10.2788/87286, 2013b. a
Höge, M., Scheidegger, A., Baity-Jesi, M., Albert, C., and Fenicia, F.: Improving hydrologic models for predictions and process understanding using neural ODEs, Hydrol. Earth Syst. Sci., 26, 5085–5102, https://doi.org/10.5194/hess-26-5085-2022, 2022. a
Höge, M., Kauzlaric, M., Siber, R., Schönenberger, U., Horton, P., Schwanbeck, J., Floriancic, M. G., Viviroli, D., Wilhelm, S., Sikorska-Senoner, A. E., Addor, N., Brunner, M., Pool, S., Zappa, M., and Fenicia, F.: Catchment attributes and hydro-meteorological time series for large-sample studies across hydrologic Switzerland (CAMELS-CH), version 0.1, Zenodo, https://doi.org/10.5281/zenodo.7957061, 2023. a, b, c
Hrachowitz, M., Savenije, H., Blöschl, G., McDonnell, J., Sivapalan, M., Pomeroy, J., Arheimer, B., Blume, T., Clark, M., Ehret, U., Fenicia, F., Freer, J. E., Gelfan, A., Gupta, H. V., Hughes, D. A., Hut, R. W., Montanari, A., Pande, S., Tetzlaff, D., Troch, P. A., Uhlenbrook, S., Wagener, T., Winsemius, H. C., Woods, R. A., Zehe, E., and Cudennec, C.: A decade of Predictions in Ungauged Basins (PUB) – a review, Hydrolog. Sci. J., 58, 1198–1255, 2013. a
Huscroft, J., Gleeson, T., Hartmann, J., and Börker, J.: Compiling and Mapping Global Permeability of the Unconsolidated and Consolidated Earth: GLobal HYdrogeology MaPS 2.0 (GLHYMPS 2.0), Geophys. Res. Lett., 45, 1897–1904, https://doi.org/10.1002/2017GL075860, 2018. a, b
Kauzlaric, M., Schürmann, S., Ummel, D., and Zischg, A.: Hourly discharge database HydroCH, Zenodo, https://doi.org/10.5281/zenodo.7691294, 2023. a, b, c, d, e
Kiang, J. E., Gazoorian, C., McMillan, H., Coxon, G., Le Coz, J., Westerberg, I. K., Belleville, A., Sevrez, D., Sikorska, A. E., Petersen-Øverleir, A., Reitan, T., Freer, J., Renard, B., Mansanarez, V., and Mason, R.: A Comparison of Methods for Streamflow Uncertainty Estimation, Water Resour. Res., 54, 7149–7176, https://doi.org/10.1029/2018WR022708, 2018. a
Klingler, C., Schulz, K., and Herrnegger, M.: LamaH-CE: LArge-SaMple DAta for Hydrology and Environmental Sciences for Central Europe, Earth Syst. Sci. Data, 13, 4529–4565, https://doi.org/10.5194/essd-13-4529-2021, 2021. a, b
Knoben, W. J., Freer, J. E., Peel, M., Fowler, K., and Woods, R. A.: A brief analysis of conceptual model structure uncertainty using 36 models and 559 catchments, Water Resour. Res., 56, e2019WR025975, https://doi.org/10.1029/2019WR025975, 2020. a
Koch, J.: Caravan extension Denmark – Danish dataset for large-sample hydrology, Zenodo, https://doi.org/10.5281/zenodo.7396466, 2022. a
Kochendorfer, J., Rasmussen, R., Wolff, M., Baker, B., Hall, M. E., Meyers, T., Landolt, S., Jachcik, A., Isaksen, K., Brækkan, R., and Leeper, R.: The quantification and correction of wind-induced precipitation measurement errors, Hydrol. Earth Syst. Sci., 21, 1973–1989, https://doi.org/10.5194/hess-21-1973-2017, 2017. a
Köplin, N., Schädler, B., Viviroli, D., and Weingartner, R.: Relating climate change signals and physiographic catchment properties to clustered hydrological response types, Hydrol. Earth Syst. Sci., 16, 2267–2283, https://doi.org/10.5194/hess-16-2267-2012, 2012. a
Köplin, N., Schädler, B., Viviroli, D., and Weingartner, R.: The importance of glacier and forest change in hydrological climate-impact studies, Hydrol. Earth Syst. Sci., 17, 619–635, https://doi.org/10.5194/hess-17-619-2013, 2013. a
Kratzert, F., Klotz, D., Shalev, G., Klambauer, G., Hochreiter, S., and Nearing, G.: Towards learning universal, regional, and local hydrological behaviors via machine learning applied to large-sample datasets, Hydrol. Earth Syst. Sci., 23, 5089–5110, https://doi.org/10.5194/hess-23-5089-2019, 2019. a
Kratzert, F., Nearing, G., Addor, N., Erickson, T., Gauch, M., Gilon, O., Gudmundsson, L., Hassidim, A., Klotz, D., Nevo, S., Shalev, G., and Matias, Y.: Caravan-A global community dataset for large-sample hydrology, Sci. Data, 10, 61, https://doi.org/10.1038/s41597-023-01975-w, 2023. a, b
Köplin, N., Schädler, B., Viviroli, D., and Weingartner, R.: Seasonality and magnitude of floods in Switzerland under future climate change, Hydrolog. Process., 28, 2567–2578, https://doi.org/10.1002/hyp.9757, 2013. a
Lanz, K.: Auswirkungen des Klimawandels auf die Wasserwirtschaft der Schweiz. Eine Studie im Rahmen des NCCS Themenschwerpunktes Hydrologische Grundlagen zum Klimawandel Hydro-CH2018 des National Centre For Climate Services, Beiträge zur Hydrologie der Schweiz, 43, https://scnat.ch/de/uuid/i/7ba3924a-b845-56aa-b35a-48b60638fc1a-Auswirkungen_des_Klimawandels_auf_die_Wasserwirtschaft_der_Schweiz (last access: 11 December 2023), 2021. a, b
Linsbauer, A., Huss, M., Hodel, E., Bauder, A., Fischer, M., Weidmann, Y., Bärtschi, H., and Schmassmann, E.: The New Swiss Glacier Inventory SGI2016: From a Topographical to a Glaciological Dataset, Front. Earth Sci., 9, 704189, https://doi.org/10.3389/feart.2021.704189, 2021. a
Lopez, M. G., Wennerström, H., Nordén, L., and Seibert, J.: Location and density of rain gauges for the estimation of spatial varying precipitation, Geografiska Annaler: Series A, Phys. Geogr., 97, 167–179, https://doi.org/10.1111/geoa.12094, 2015. a
Loritz, R., Stölzle, M., Guse, B., Kiesel, J., Haßler, S., Mälicke, M., Tarasova, L., Heidbüchel, I., Ebeling, P., Hauffe, C., Müller-Thomy, H., Jehn, F. U., Brunner, M., Götte, J., and Rohini, K.: CAMELS-DE: Initiative für einen konsistenten, frei verfügbaren Datensatz für hydro-meteorologische Analysen in Einzugsgebieten in Deutschland, Zenodo, https://doi.org/10.5281/zenodo.6517142, 2022. a
LUBW: Hydrologische Landespegel, http://udo.lubw.baden-wuerttemberg.de/public/p/pegel_messwerte_leer (last access: 15 May 2023), 2020. a
Magnusson, J., Gustafsson, D., Hüsler, F., and Jonas, T.: Assimilation of point SWE data into a distributed snow cover model comparing two contrasting methods, Water Resour. Res., 50, 7816–7835, https://doi.org/10.1002/2014WR015302, 2014. a
Mannerfelt, E. S., Dehecq, A., Hugonnet, R., Hodel, E., Huss, M., Bauder, A., and Farinotti, D.: Halving of Swiss glacier volume since 1931 observed from terrestrial image photogrammetry, The Cryosphere, 16, 3249–3268, https://doi.org/10.5194/tc-16-3249-2022, 2022. a, b
map.geo.admin.ch: Geology 500, (1:500 000), https://map.geo.admin.ch/?topic=geol&lang=en&bgLayer=ch.swisstopo.pixelkarte-grau&layers=ch.swisstopo.geologie-geologische_karte&catalogNodes=1786,1787 (last access: 15 May 2023), 2021. a, b
Matiu, M., Crespi, A., Bertoldi, G., Carmagnola, C. M., Marty, C., Morin, S., Schöner, W., Cat Berro, D., Chiogna, G., De Gregorio, L., Kotlarski, S., Majone, B., Resch, G., Terzago, S., Valt, M., Beozzo, W., Cianfarra, P., Gouttevin, I., Marcolini, G., Notarnicola, C., Petitta, M., Scherrer, S. C., Strasser, U., Winkler, M., Zebisch, M., Cicogna, A., Cremonini, R., Debernardi, A., Faletto, M., Gaddo, M., Giovannini, L., Mercalli, L., Soubeyroux, J.-M., Sušnik, A., Trenti, A., Urbani, S., and Weilguni, V.: Observed snow depth trends in the European Alps: 1971 to 2019, The Cryosphere, 15, 1343–1382, https://doi.org/10.5194/tc-15-1343-2021, 2021. a
McMillan, H. K. and Westerberg, I. K.: Rating curve estimation under epistemic uncertainty, Hydrolog. Process., 29, 1873–1882, https://doi.org/10.1002/hyp.10419, 2015. a
McMillan, H. K., Coxon, G., Sikorska-Senoner, A. E., and Westerberg, I. K.: Impacts of observational uncertainty on analysis and modelling of hydrological processes: Preface, Hydrolog. Process., 36, e14481, https://doi.org/10.1002/hyp.14481, 2022. a
MeteoSwiss: Federal Office of Meteorology and Climatology, https://www.meteoswiss.admin.ch/#tab=forecast-map (last access: 15 May 2023), 2023. a, b, c, d, e
Muelchi, R., Rössler, O., Schwanbeck, J., Weingartner, R., and Martius, O.: River runoff in Switzerland in a changing climate – runoff regime changes and their time of emergence, Hydrol. Earth Syst. Sci., 25, 3071–3086, https://doi.org/10.5194/hess-25-3071-2021, 2021. a
Newman, A. J., Clark, M. P., Sampson, K., Wood, A., Hay, L. E., Bock, A., Viger, R. J., Blodgett, D., Brekke, L., Arnold, J. R., Hopson, T., and Duan, Q.: Development of a large-sample watershed-scale hydrometeorological data set for the contiguous USA: data set characteristics and assessment of regional variability in hydrologic model performance, Hydrol. Earth Syst. Sci., 19, 209–223, https://doi.org/10.5194/hess-19-209-2015, 2015. a
Parajka, J., Merz, R., and Blöschl, G.: A comparison of regionalisation methods for catchment model parameters, Hydrol. Earth Syst. Sci., 9, 157–171, https://doi.org/10.5194/hess-9-157-2005, 2005. a
Paul, F., Frey, H., and Le Bris, R.: A new glacier inventory for the European Alps from Landsat TM scenes of 2003: challenges and results, Ann. Glaciol., 52, 144–152, https://doi.org/10.3189/172756411799096295, 2011. a, b
Paul, F., Rastner, P., Azzoni, R. S., Diolaiuti, G., Fugazza, D., Le Bris, R., Nemec, J., Rabatel, A., Ramusovic, M., Schwaizer, G., and Smiraglia, C.: Glacier inventory of the Alps from Sentinel-2, shape files, PANGAEA, https://doi.org/10.1594/PANGAEA.909133, 2019. a, b
Paul, F., Rastner, P., Azzoni, R. S., Diolaiuti, G., Fugazza, D., Le Bris, R., Nemec, J., Rabatel, A., Ramusovic, M., Schwaizer, G., and Smiraglia, C.: Glacier shrinkage in the Alps continues unabated as revealed by a new glacier inventory from Sentinel-2, Earth Syst. Sci. Data, 12, 1805–1821, https://doi.org/10.5194/essd-12-1805-2020, 2020. a, b, c
Pfeffer, W. T., Arendt, A. A., Bliss, A., Bolch, T., Cogley, J. G., Gardner, A. S., Hagen, J.-O., Hock, R., Kaser, G., Kienholz, C., Miles, E. S., Moholdt, G., Mölg, N., Paul, F., Radić, V., Rastner, P., Raup, B. H., Rich, J., and Sharp, M. J.: The Randolph Glacier Inventory: a globally complete inventory of glaciers, J. Glaciol., 60, 537–552, https://doi.org/10.3189/2014JoG13J176, 2014. a
Pool, S., Vis, M., and Seibert, J.: Regionalization for Ungauged Catchments – Lessons Learned From a Comparative Large-Sample Study, Water Resour. Res., 57, e2021WR030437, https://doi.org/10.1029/2021WR030437, 2021. a
Rumpf, S. B., Gravey, M., Brönnimann, O., Luoto, M., Cianfrani, C., Mariethoz, G., and Guisan, A.: From white to green: Snow cover loss and increased vegetation productivity in the European Alps, Science, 376, 1119–1122, 2022. a
Rössler, O., Kotlarski, S., Fischer, A. M., Keller, D., Liniger, M., and Weingartner, R.: Evaluating the added value of the new Swiss climate scenarios for hydrology: An example from the Thur catchment, Climate Services, 13, 1–13, https://doi.org/10.1016/j.cliser.2019.01.001, 2019. a
Schaake, J., Cong, S., and Duan, Q.: US MOPEX data set, Tech. rep., Lawrence Livermore National Lab. (LLNL), Livermore, CA (United States), 2006. a
Schmocker-Fackel, P. and Naef, F.: Changes in flood frequencies in Switzerland since 1500, Hydrol. Earth Syst. Sci., 14, 1581–1594, https://doi.org/10.5194/hess-14-1581-2010, 2010. a
SFOE: Water retaining facilities subject to federal supervision, https://www.bfe.admin.ch/bfe/en/home/supply/statistics-and-geodata/geoinformation/geodata/water/water-retaining-facilities-subject-to-federal-supervision.html (last access: 15 May 2023), 2020. a, b
SFOE: Hydropower plants: statistics, https://www.bfe.admin.ch/bfe/en/home/supply/statistics-and-geodata/geoinformation/geodata/water/hydropower-plants-statistics.html (last access: 15 May 2023), 2022. a, b
Sikorska, A. E. and Renard, B.: Calibrating a hydrological model in stage space to account for rating curve uncertainties: general framework and key challenges, Adv. Water Resour., 105, 51–66, https://doi.org/10.1016/j.advwatres.2017.04.011, 2017. a
SLF: WSL Institute for Snow and Avalanche Research, https://www.slf.ch/en/index.html (last access: 15 May 2023), 2023. a, b
SoilGrids: Digital soil mapping, version 2.0, https://soilgrids.org/ (last access: 15 May 2023), 2020. a
Speich, M. J., Bernhard, L., Teuling, A. J., and Zappa, M.: Application of bivariate mapping for hydrological classification and analysis of temporal change and scale effects in Switzerland, J. Hydrol., 523, 804–821, https://doi.org/10.1016/j.jhydrol.2015.01.086, 2015. a
Staudinger, M. and Viviroli, D.: Extremhochwasser an der Aare. Detailbericht A Projekt EXAR. Hydrometeorologische Grundlagen, Tech. rep., Geographisches Institut Universität Zürich, Zürich, https://doi.org/10.5167/uzh-201388, 2020. a
Sterle, G., Perdrial, J., Li, L., Adler, T., Underwood, K., Rizzo, D., Wen, H., and Harpold, A.: CAMELS-Chem: Augmenting CAMELS (Catchment Attributes and Meteorology for Large-sample Studies) with Atmospheric and Stream Water Chemistry Data, Hydrol. Earth Syst. Sci. Discuss. [preprint], https://doi.org/10.5194/hess-2022-81, in review, 2022. a
swisstopo: Swiss Map Vector, https://www.swisstopo.admin.ch/de/geodata/maps/smv.html (last access: 15 May 2023), 2015. a
swisstopo: Geodata and applications, https://www.swisstopo.admin.ch/en/geodata.html (last access: 15 May 2023), 2022. a
Tóth, B., Weynants, M., Pásztor, L., and Hengl, T.: 3D soil hydraulic database of Europe at 250 m resolution, Hydrolog. Process., 31, 2662–2666, https://doi.org/10.1002/hyp.11203, 2017. a, b
Viglione, A., Borga, M., Balabanis, P., and Blöschl, G.: Barriers to the exchange of hydrometeorological data in Europe: Results from a survey and implications for data policy, J. Hydrol., 394, 63–77, 2010. a
Viviroli, D. and Weingartner, R.: The hydrological significance of mountains: from regional to global scale, Hydrol. Earth Syst. Sci., 8, 1017–1030, https://doi.org/10.5194/hess-8-1017-2004, 2004. a, b
Viviroli, D., Weingartner, R., and Hauser, F.: Hydrologische Bedeutung des europäischen Alpenraums, Hydrological Atlas of Switzerland, Plate 6.4, https://hydrologicalatlas.ch/products/printed-issue/water-balance/plate-6-4 (last access: 11 December 2023), 2004. a
Viviroli, D., , Gurtz, J., and Zappa, M.: The Hydrological Modelling System PREVAH), Geographica Bernensia, Bern, https://doi.org/10.4480/GB2022.P40, 2007. a, b, c, d, e, f, g, h
Viviroli, D., Zappa, M., Gurtz, J., and Weingartner, R.: An introduction to the hydrological modelling system PREVAH and its pre- and post-processing-tools, Environ. Modell. Softw., 24, 1209–1222, https://doi.org/10.1016/j.envsoft.2009.04.001, 2009. a, b, c
Viviroli, D., Archer, D. R., Buytaert, W., Fowler, H. J., Greenwood, G. B., Hamlet, A. F., Huang, Y., Koboltschnig, G., Litaor, M. I., López-Moreno, J. I., Lorentz, S., Schädler, B., Schreier, H., Schwaiger, K., Vuille, M., and Woods, R.: Climate change and mountain water resources: overview and recommendations for research, management and policy, Hydrol. Earth Syst. Sci., 15, 471–504, https://doi.org/10.5194/hess-15-471-2011, 2011. a
VRB: Vorarlberg Wasserwirtschaft, https://vorarlberg.at/-/viid-abteilung-wasserwirtschaft-unsere-aufgaben (last access: 15 May 2023), 2020. a
Wagener, T., Sivapalan, M., Troch, P., and Woods, R.: Catchment classification and hydrologic similarity, Geography compass, 1, 901–931, 2007. a
Westerberg, I. K., Wagener, T., Coxon, G., McMillan, H. K., Castellarin, A., Montanari, A., and Freer, J.: Uncertainty in hydrological signatures for gauged and ungauged catchments, Water Resour. Res., 52, 1847–1865, https://doi.org/10.1002/2015WR017635, 2016. a
Westerberg, I. K., Sikorska-Senoner, A. E., Viviroli, D., Vis, M., and Seibert, J.: Hydrological model calibration with uncertain discharge data, Hydrolog. Sci. J., 67, 2441–2456, https://doi.org/10.1080/02626667.2020.1735638, 2022. a, b, c
Wilkinson, M. D., Dumontier, M., Aalbersberg, I. J., Appleton, G., Axton, M., Baak, A., Blomberg, N., Boiten, J.-W., da Silva Santos, L. B., Bourne, P. E., Bouwman, J., Brookes, A. J., Clark, T., Crosas, M., Dillo, I., Dumon, O., Edmunds, S., Evelo, C. T., Finkers, R., Gonzalez-Beltran, A., Gray, A. J. G., Groth, P., Goble, C., Grethe, J. S. Heringa, J., ’t Hoen, P. A. C., Hooft, R., Kuhn, T., Kok, R., Kok, J., Lusher, S. J., Martone, M. E., Mons, A., Packer, A. L., Persson, B., Rocca-Serra, P., Roos, M., van Schaik, R., Sansone, S.-A., Schultes, E., Sengstag, T., Slater, T., Strawn, G., Swertz, M. A., Thompson, M., van der Lei, J., van Mulligen, E., Velterop, J., Waagmeester, A., Wittenburg, P., Wolstencroft, K., Zhao, J., and Mons, B.: The FAIR Guiding Principles for scientific data management and stewardship, Sci. Data, 3, 1–9, 2016. a
WSL: Swiss Federal Institute for Forest, Snow and Landscape Research, https://www.wsl.ch/en/index.html (last access: 15 May 2023), 2023. a, b
Zappa, M. and Brunner, M.: Hydro-meteorological simulations for the period 1981–2018 for Switzerland, EnviDat, https://doi.org/10.16904/envidat.76, 2019. a
- Abstract
- Introduction
- Motivation
- Data sources and providers
- Catchments
- Time series
- Catchment attributes
- Data analysis and discussion
- Code and data availability
- Conclusions
- Appendix A: Additional information on attributes
- Appendix B: Supplementary catchment attributes
- Author contributions
- Competing interests
- Disclaimer
- Acknowledgements
- Review statement
- References