the Creative Commons Attribution 4.0 License.
the Creative Commons Attribution 4.0 License.
 | 13 Dec 2023
The first map of crop sequence types in Europe over 2012–2018
Nicolas Guilpart
Marie-Hélène Jeuffroy
Crop diversification is considered a key element of agroecological transition, whereas current dominant cropping systems are known to rely on only a few crop species – like cereals in Europe. To assess the benefits of crop diversification at a large scale, an accurate description of current crop sequences is required as a baseline. However, such a description is lacking at the scale of Europe. Here, we developed the first map of dominant crop sequences in Europe for the period 2012–2018. We used the Land Use Cover Area frame statistical Survey (LUCAS) dataset that provides temporally incomplete (2012, 2015 and 2018) land cover information from a stable grid of points covering Europe. Eight crop sequence types were identified using hierarchical clustering implemented on LUCAS data and mapped over Europe. We show, in France, that the relative importance of these eight crop sequence types (as estimated from LUCAS data) was highly consistent with those derived from an almost spatially exhaustive temporally complete national dataset (the French Land Parcel Identification System) for the same period, thus validating the method and typology for this country. Land use (i.e. crop production area) derived from our map of dominant crop sequences was also highly consistent with land use reported by official statistics at both national and European levels, validating the approach at a European scale. This first map of dominant crop sequences in Europe should be useful for future studies dealing with agricultural issues that are sensitive to crop rotations. The map of dominant crop sequence types in Europe derived from our work is available at https://doi.org/10.5281/zenodo.7016986 (Ballot et al., 2022).
- Article
(7033 KB) - Full-text XML
-
Supplement
(914 KB) - BibTeX
- EndNote


Crop diversification – the increase in crop diversity from the field to national scales – is considered a key element of agroecological transition (Kremen et al., 2012; Lechenet et al., 2016; Renard and Tilman, 2021; Wezel et al., 2014), whereas current crop sequences are short and specialised in many parts of the world (Meynard et al., 2018; Salembier et al., 2016; Schott et al., 2010; Stein and Steinmann, 2018). Indeed, crop diversification supports a number of ecosystem services, with positive effects on crop yield, soil fertility, nutrient cycling, carbon sequestration, climate and water regulation, pest control, biodiversity and pollination (Beillouin et al., 2019, 2021a; Tamburini et al., 2020). Strategies of crop diversification practices include crop rotation, cultivar mixture, cover crops, intercropping and agroforestry. Among these strategies, diversifying the crop sequence is of particular interest in order to (i) increase nutrient availability and limit fertiliser requirements (e.g. by the inclusion of legume crops), (ii) favour soil protection and conservation by enhancing soil cover, (iii) promote natural regulation of pests and diseases by avoiding the presence of successive host crops and (iv) reduce weed infestation (Wezel et al., 2014). The term “crop sequence” refers to the sequence of crops grown in succession in the same field over a given period of time (Dury et al., 2012). A crop sequence is then defined by the nature of its crops and their order of succession. Based on this definition, the temporal frequencies of crops are key features of a crop sequence. The term “crop rotation” is also commonly used to refer to the sequence of crops grown in succession in the same field (Bullock, 1992) but includes a notion of cyclicality (e.g. rotation length) – at least to some degree (Castellazzi et al., 2008). Hereafter, we use the term crop sequence rather than crop rotation because we consider a fixed period of time (i.e. 2012–2018), focus on temporal frequencies of crops and do not analyse cyclicality in crop sequences.
Aiming at leveraging benefits from diversifying crop sequences, several foresight studies have assessed scenarios for the future of agriculture in which crop sequences are modified to increase the services they provide (Billen et al., 2021; Poux and Aubert, 2018) or scenarios of organic farming expansion where significant differences in crop rotations between conventional and organic agriculture are acknowledged (Barbieri et al., 2017, 2019, 2021). A robust assessment of benefits expected from crop diversification at a large scale requires an accurate description of current crop sequences as a baseline. Indeed, several ecosystem services provided by diversified farming systems depend on the pre-crop effect and thus need to know precisely the nature of the crops successively grown on the same field (Bennett et al., 2012). However, such a description is still lacking for Europe for at least two reasons: (i) existing datasets at the European scale, e.g. the Land Use Cover Area frame statistical Survey (LUCAS) dataset, provide information about land use categories and crop species cultivated on agricultural land but no information about crop sequences because data are not available every year (e.g. the LUCAS dataset provides information every 3 years); (ii) even if national and sub-national datasets describing crop sequences are available in some European Union (EU) state members, e.g. the Land Parcel Identification System in France (Levavasseur et al., 2016), a lack of harmonisation (e.g. spatial and temporal resolution or nomenclature) between these datasets makes them difficult to use in a cross-analysis. This situation has resulted in the production of regional to national studies of crop sequences (Levavasseur et al., 2016; Peltonen-Sainio and Jauhiainen, 2019; Stein and Steinmann, 2018; Xiao et al., 2014) but has hampered any analysis at the scale of the EU. Such an analysis would be useful, especially in the context of the EU's Farm to Fork strategy, in which the adoption of more diverse crop rotations is encouraged (European Commission, 2022). To overcome this problem, we developed an original method that combines European-level and national-level datasets to create a map of current dominant crop sequences at the European level. We show that the temporally incomplete (i.e. every 3 years) information on crop sequences provided by the LUCAS dataset can be used to derive robust estimates of crop frequencies in the sequence when compared to crop frequencies derived from a temporally complete national-level dataset. We acknowledge that this approach does not allow us to capture the exact order of crops in the succession. Nonetheless, it allows us to capture crop frequencies, which are a key feature of crop sequences (Castellazzi et al., 2008; Peltonen-Sainio and Jauhiainen, 2019).
2.1 Method overview
The purpose of this work is to map current dominant crop sequences from the European LUCAS dataset. For this study, the multi-year harmonised data from d'Andrimont et al. (2020) were used. As this dataset is temporally incomplete (observations of land use on fixed points only every 3 years), we proceeded in three steps (Fig. 1) to assess how this incomplete information could be used to describe the diversity and localisation of major crop sequences across Europe. First, we filtered the LUCAS data by selecting points under non-perennial agricultural land cover. For each of these points, we calculated frequencies of eight crops or groups of crops across 2012, 2015 and 2018 (the last 3 years of observation). For example, a point identified as wheat in 2012 and as corn in 2015 and 2018 was converted into cereal frequency =0.33 and corn frequency =0.67. Second, based on this set of eight variables, LUCAS points were classified into eight groups (hereafter referred to as crop sequence types) by combining principal component analysis (PCA) with hierarchical clustering. Third, we assessed the consistency of this classification against crop sequences derived with the quasi-exhaustive yearly French Land Parcel Identification System (LPIS) and with the Eurostat crop production data. All data sources used in this study are detailed in Table 1.
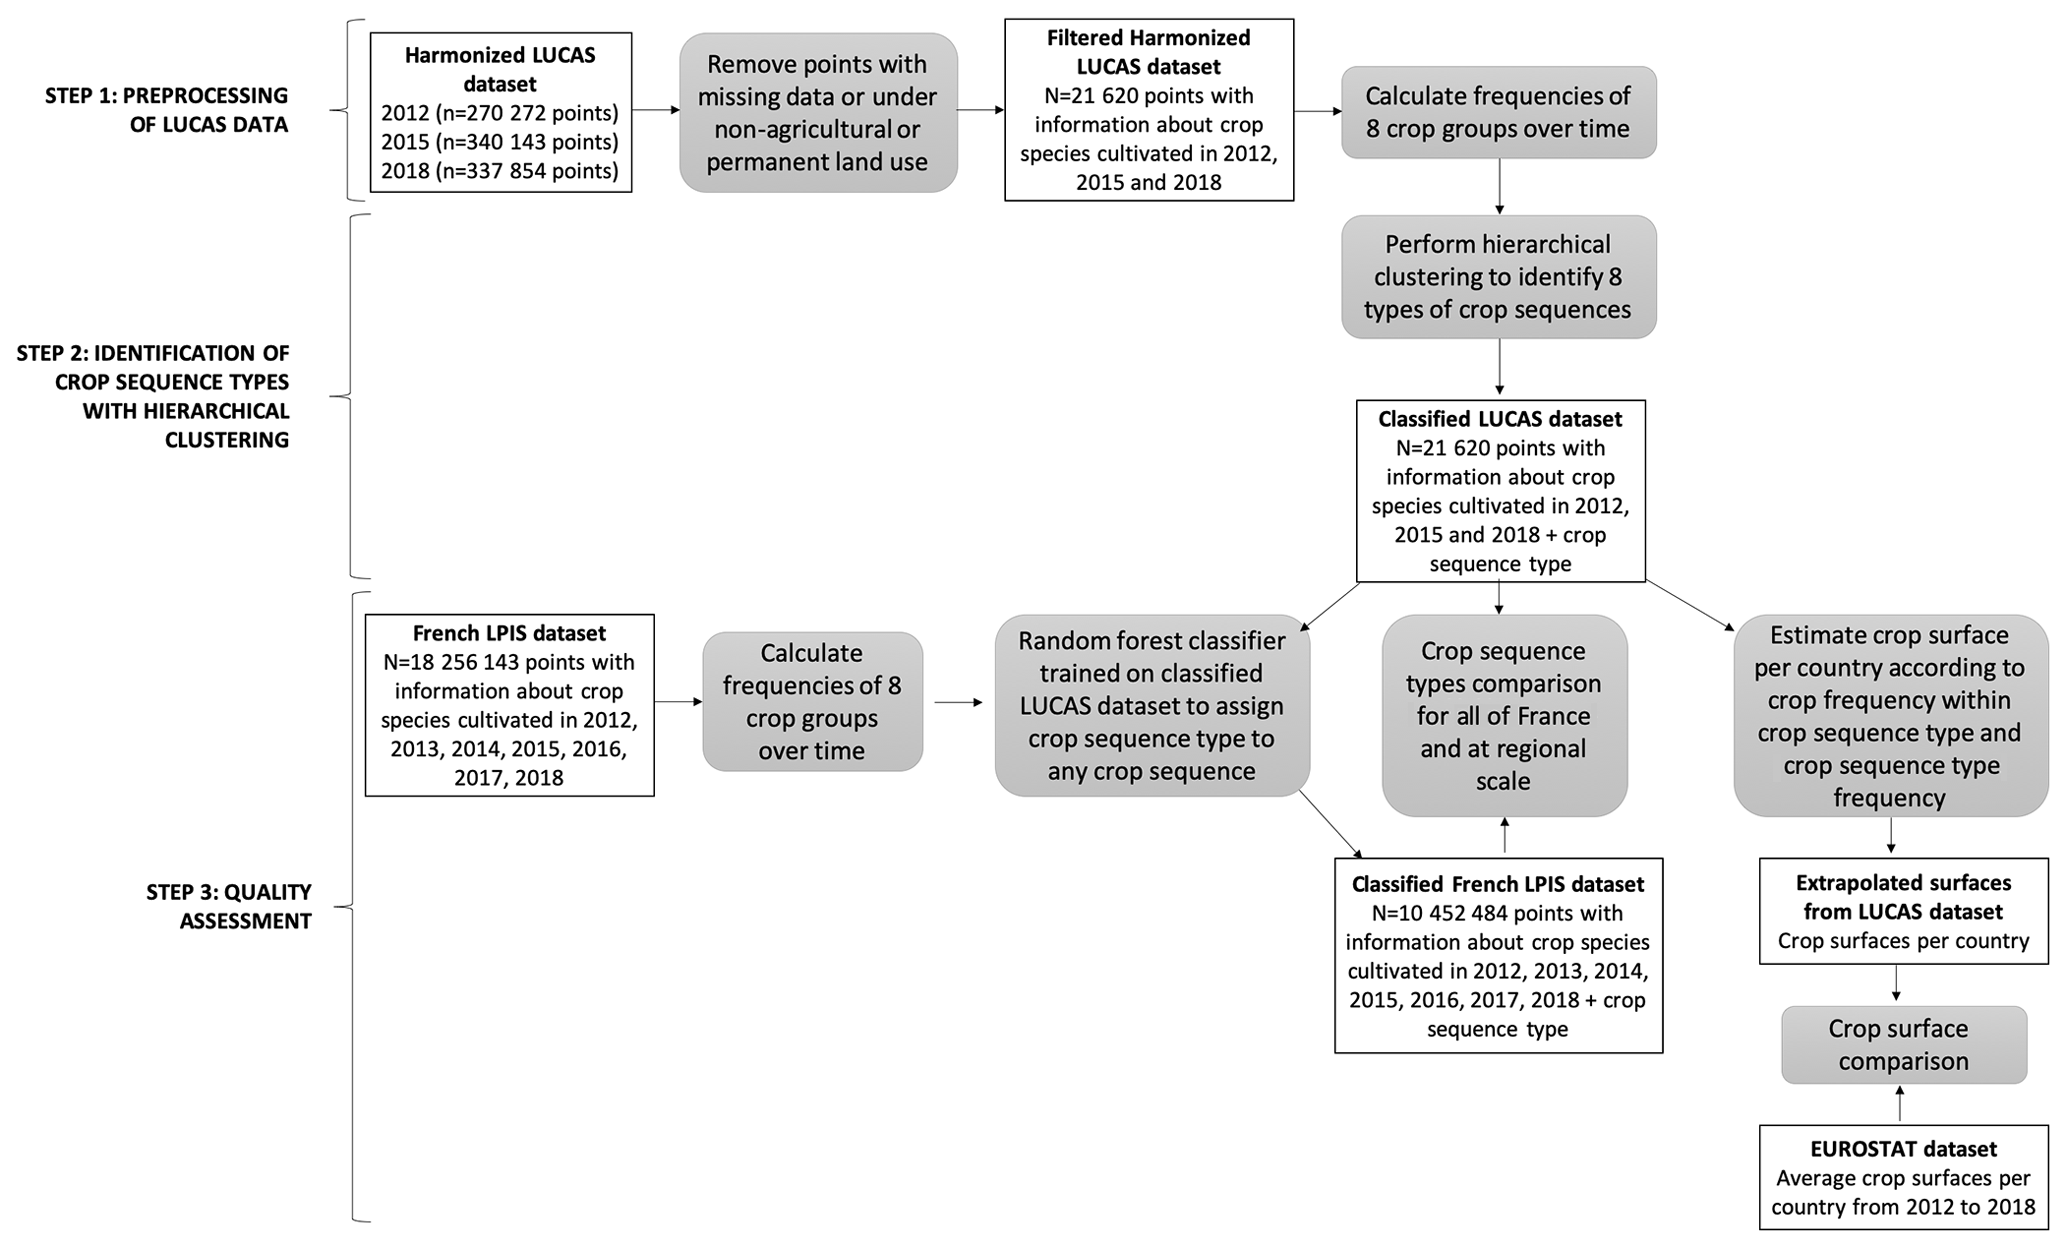
Figure 1Workflow diagram for developing spatially explicit maps of dominant crop sequences across Europe.
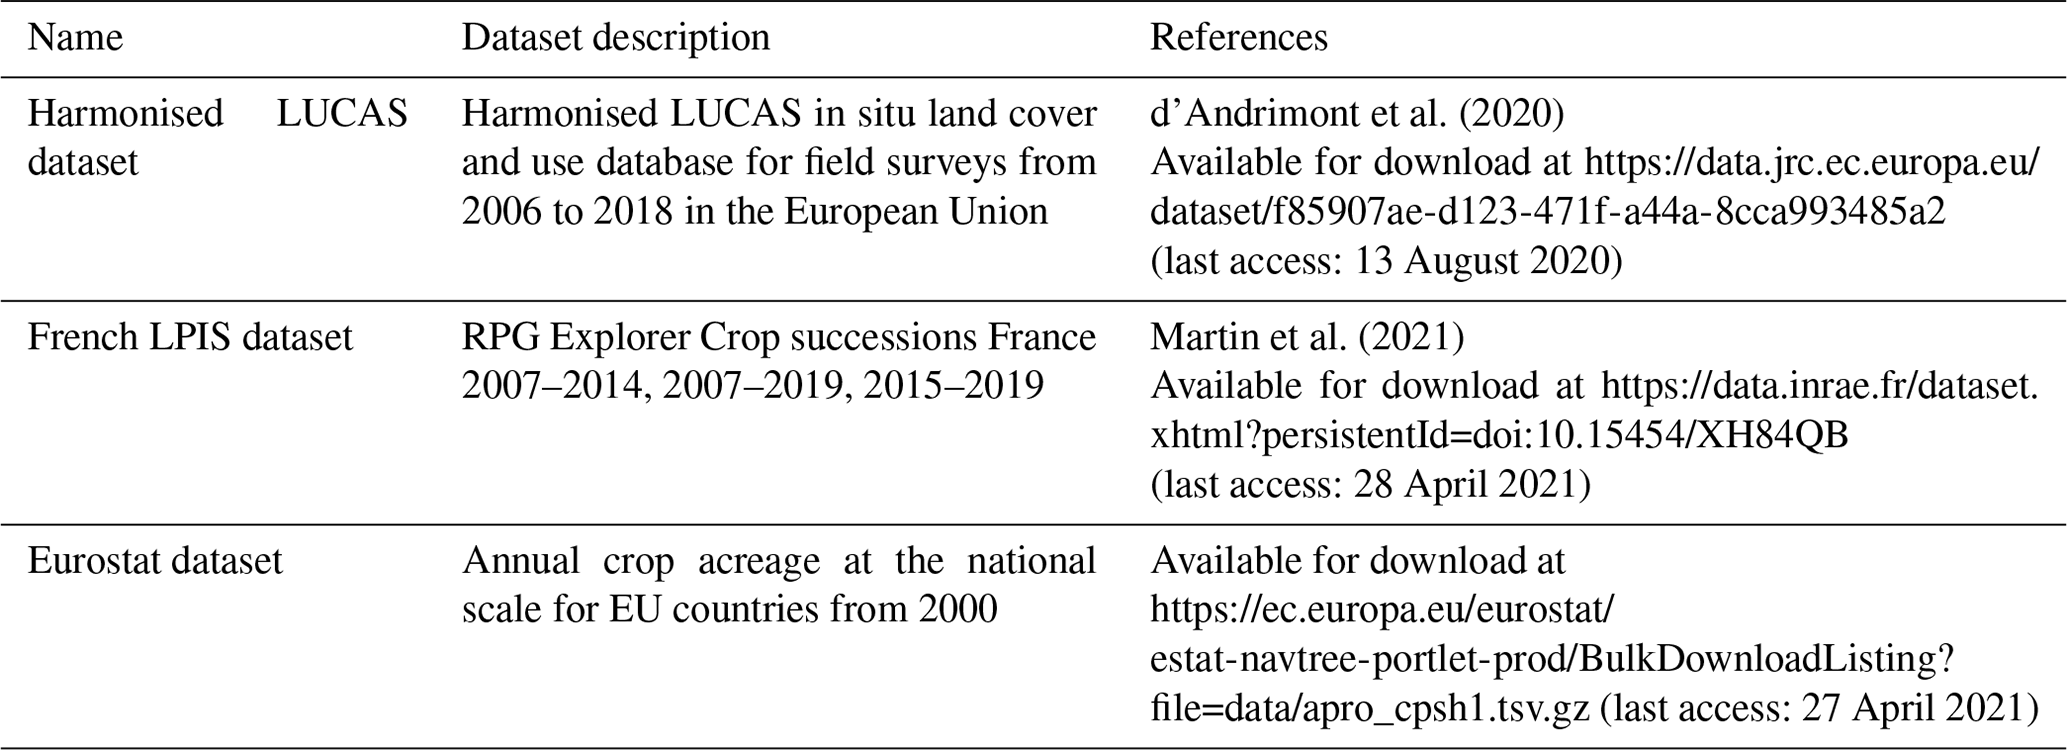
2.2 Data sources
2.2.1 The LUCAS dataset
The LUCAS dataset is an in situ land cover (i.e. physical cover observed at the earth's surface, e.g. cereals, root crops, fodder crops) and land use (i.e. socio-economic function of the observed earth's surface, e.g. agriculture, industry, residential) observation carried out on approximately 300 000 points sampled from a stable grid of around 1 100 000 points across Europe every 3 years since 2006. The last observation campaign was carried out in 2018. The work presented here is based on the harmonised LUCAS database developed by d'Andrimont et al. (2020), which gathered, in a unique dataset, all the information collected from the beginning of this survey (Table 1). All 28 EU member states are represented in this dataset, except Croatia and Malta. Montenegro, which is not a member state, is also represented, as well as the United Kingdom, which is no longer a member state. Thus, “Europe” will be used hereafter to refer to the spatial scope of this study.
2.2.2 The French LPIS dataset
The French LPIS dataset is based on yearly declarations made by farmers in compliance with Common Agricultural Policy subsidies. Starting from 2008, it has provided annual almost spatially exhaustive information on land use for agricultural land, detailing 28 crop categories until 2014 and approximately 300 from 2015. Until 2014, information was collected at the block scale. Each block can enclose one or more agricultural parcels and thus one or more crops with a declared area for each one but no geolocalisation within the block. Due to parcel reconfiguration from one year to another, it is not straightforward to know pluriannual crop sequences from the French LPIS dataset for years older than 2015. For our study, we used the RPG Explorer Crop successions France version 2.0 dataset developed by Martin et al. (2021, Table 1). This dataset compiles all annual LPIS data for France into a unique dataset of crop sequences for more than 18 million fields over the period 2012–2018 and associated areas. It also relies on an algorithm which identifies the most likely crop sequence when more than one crop is declared for one given block. This dataset represents the most exhaustive dataset of crop sequences in France in terms of both spatial and temporal resolution.
2.2.3 The Eurostat dataset
The Eurostat crop production dataset provides harmonised information about annual crop-specific acreage per country from the year 2000 (EUROSTAT, 2023, Table 1). The crop statistics are collected by the National Statistical Institutes and/or Ministries of Agriculture using several statistical methods: sample surveys, administrative sources and expert estimates. Most often a combination of several methods is used. Eurostat is independent of LUCAS data.
2.3 Identification and mapping of dominant crop sequence types in the EU based on LUCAS data
2.3.1 Preprocessing of LUCAS and French LPIS data
From the harmonised LUCAS database (d'Andrimont et al., 2020), we selected points with observations for the three most recent campaigns at the time of this study (i.e. 2012, 2015 and 2018). We assumed the 7-year time period to be long enough to encompass the durations of the main crop rotations, and thus we do not consider older campaigns (i.e. 2006 and 2009), which may be outdated for representing current crop sequences. Another reason why we considered only the three most recent campaigns is that, if the whole 2006–2018 period was considered, only 9094 points would have remained with information about crops cultivated in 2006, 2009, 2012, 2015 and 2018. This choice would also have limited the analysis to 11 of the 27 EU countries (i.e. Belgium, Czechia, Germany, Spain, France, Hungary, Italy, Luxembourg, the Netherlands, Poland and Slovakia).
We discarded points labelled as non-agricultural use or permanent agricultural use (e.g. orchards, vineyards) in at least 1 year among 2012, 2015 and 2018 (i.e. land cover (LC) not included in land cover classifications B11 to B55). As an exception, we also conserved 2609 points identified as permanent grasslands in 2018 (i.e. LC E20) but identified as non-permanent agricultural uses in 2012 or 2015, as they may be the result of a confusion between temporary and permanent grasslands during observation. This resulted in a dataset of 21 620 points with information about crops cultivated in 2012, 2015 and 2018. Thus, each point is associated with a single (temporally incomplete) crop sequence.
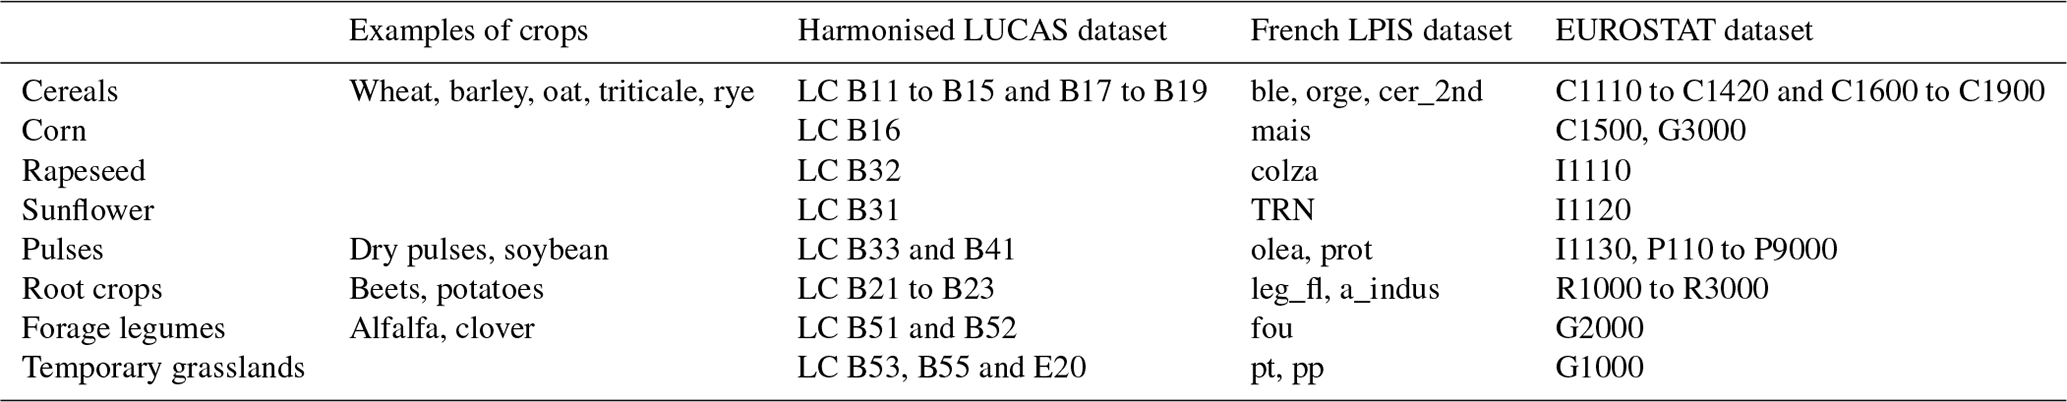
Depending on the purpose of an analysis, crop sequences can be described in many different ways, including length and flexibility of rotation (Castellazzi et al., 2008), nature and function of crops or crop groups (Barbieri et al., 2017; Videla-Mensegue et al., 2022), diversity of crops or crop groups (Beillouin et al., 2021b; Tamburini et al., 2020), diversity of sowing dates (Weisberger et al., 2019), order of succession of crops within the sequence (Peltonen-Sainio et al., 2019) and temporal frequency or return time of crops within the sequence (Nowak et al., 2022). Given the characteristics of the LUCAS dataset, the exact order of crop succession within the sequences could not be described, nor could the variety of sowing dates (e.g. the LUCAS dataset provides no information about whether the crop is sown in autumn or spring). Therefore, we chose to describe current dominant crop sequences by the temporal frequencies, over 3 years (i.e. 2012, 2015 and 2018), of eight crops or groups of crops described below. This choice is a compromise between addressing common issues related to crop rotations (e.g. nitrogen management and the role of legumes) and avoiding unnecessary complexity. These eight groups were defined based on two criteria: (i) their agronomic relevance and (ii) their importance in terms of cultivated area in Europe. The groups considered were (i) cereals (i.e. wheat, barley, oat, triticale and rye, corresponding to LC B11 to B19 except B16 in the LUCAS dataset nomenclature), (ii) corn (LC B16), (iii) rapeseed (LC B32), (iv) sunflower (LC B31), (v) pulses (i.e. dry pulses and soybean, corresponding to LC B33 and B41), (vi) root crops (i.e. beets and potatoes, corresponding to LC B21 to B23), (vii) forage legumes (i.e. alfalfa and clover, corresponding to LC B51 and B52) and (viii) temporary grassland (LC B53, B55 and E20, Table 2). As these eight groups did not encompass all the land cover categories, the sum of (groups of) crop frequencies may be lower than 1 for each point.
Table 2Grouping of land cover categories considered for crop sequence classification from the harmonised LUCAS dataset and correspondence to the French LPIS and EUROSTAT datasets used for validation.
In order to serve the quality assessment step, the French LPIS dataset was preprocessed in the same way. First, fields under perennial use were discarded. Then, (groups of) crop frequencies were calculated for each field.
2.3.2 Identification of crop sequence types with hierarchical clustering
PCA was performed with the PCA() function of the R package FactoMineR v2.1 (Lê et al., 2008) on all eight variables describing temporal frequencies of cereals, rapeseed, sunflower, pulses, corn, root crops, forage legumes and temporary grassland. Seven components displayed eigenvalues higher than or close to 1, totalling more than 99 % of variance (Fig. 2a). These seven components were used as inputs for a hierarchical clustering performed with the HCPC() function from the same R package. Inertia gain displayed a clear break from eight to nine (Fig. 2b), and thus eight groups of crop sequences (crop sequence types) were considered. A crop sequence type has thus been assigned to all points considered. To analyse the geographical distribution of dominant crop sequences, observed locations of these eight crop sequence types were mapped across Europe.
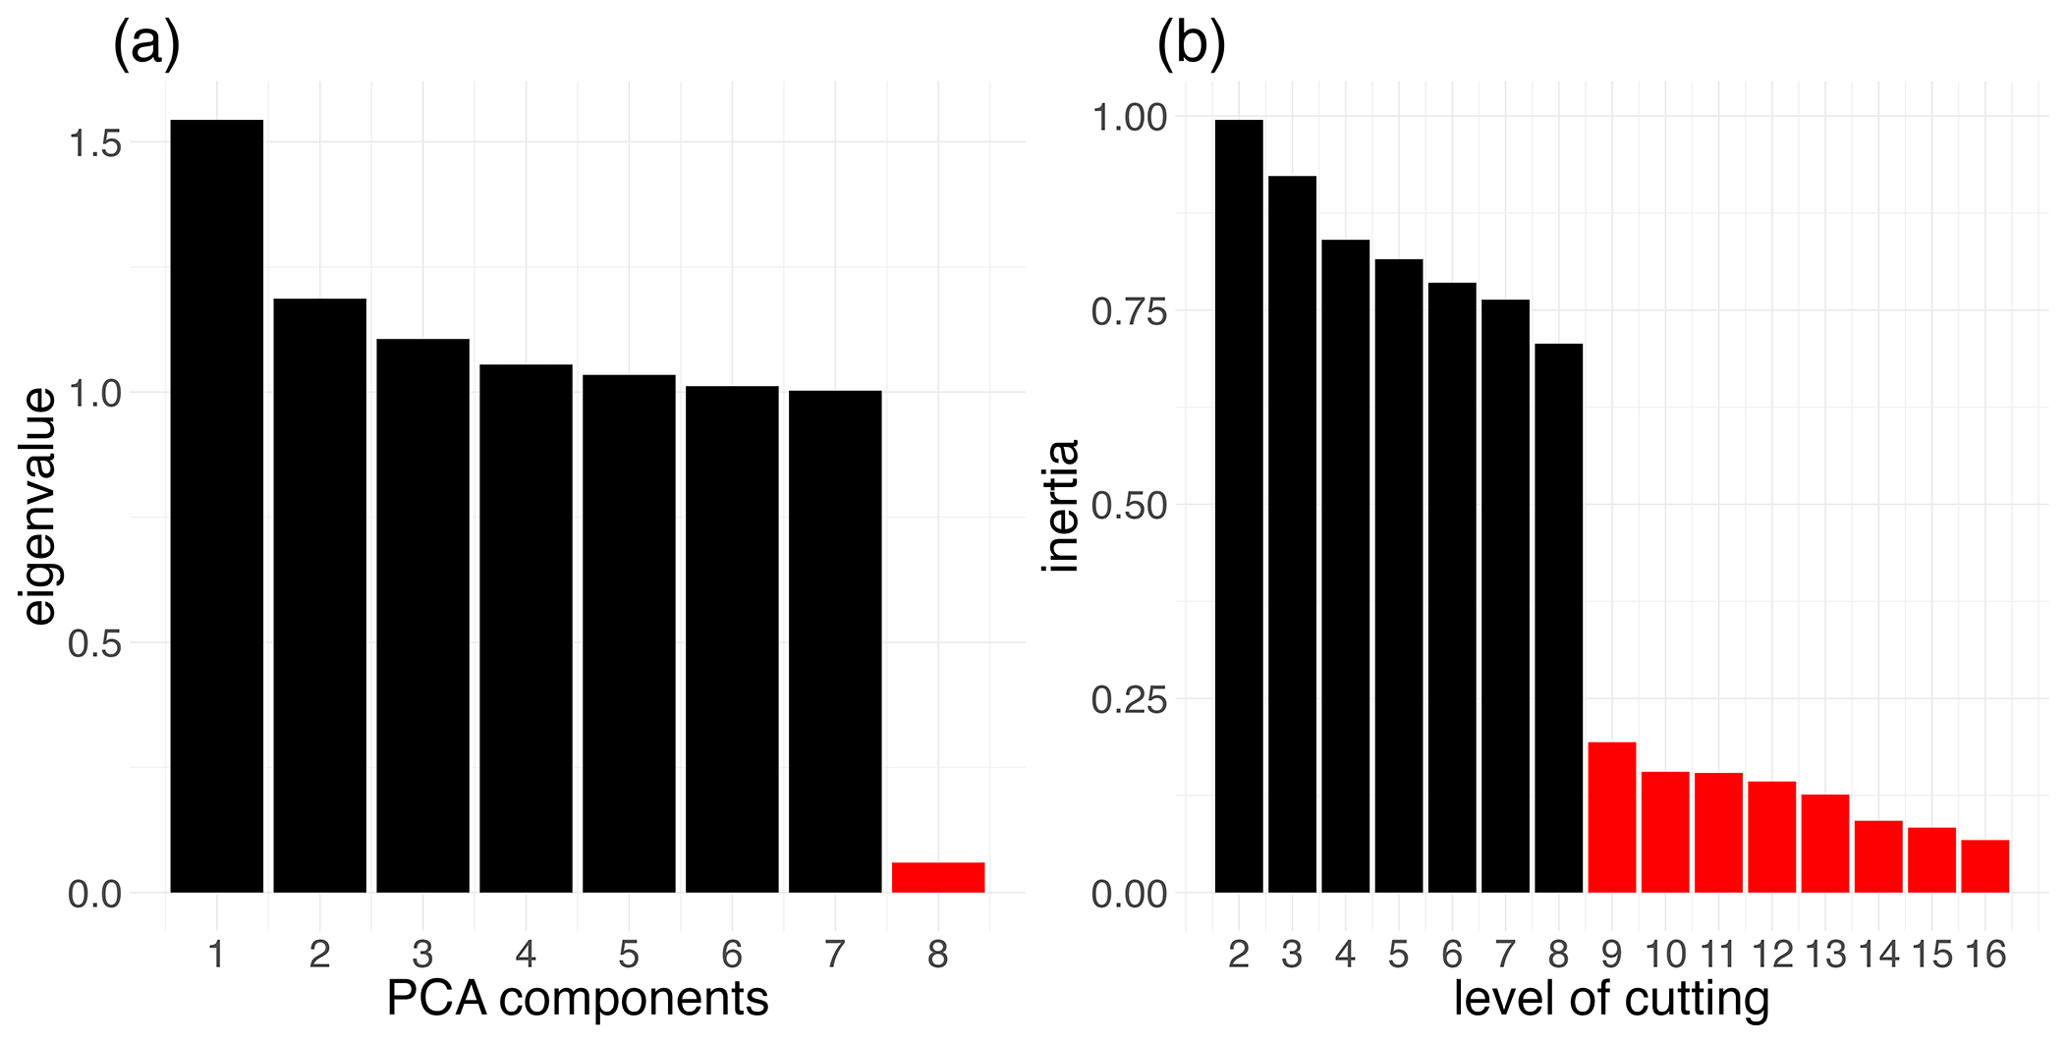
Figure 2Identification of crop sequence types based on the LUCAS dataset. (a) Eigenvalues of the components from the principal component analysis. (b) Inertia gain according to the level of cutting. The hierarchical clustering is performed on 43 291 points from the harmonised LUCAS dataset for the years 2012, 2015 and 2018, based on the frequency of eight crop groups (see the text for details).
2.3.3 Quality assessment
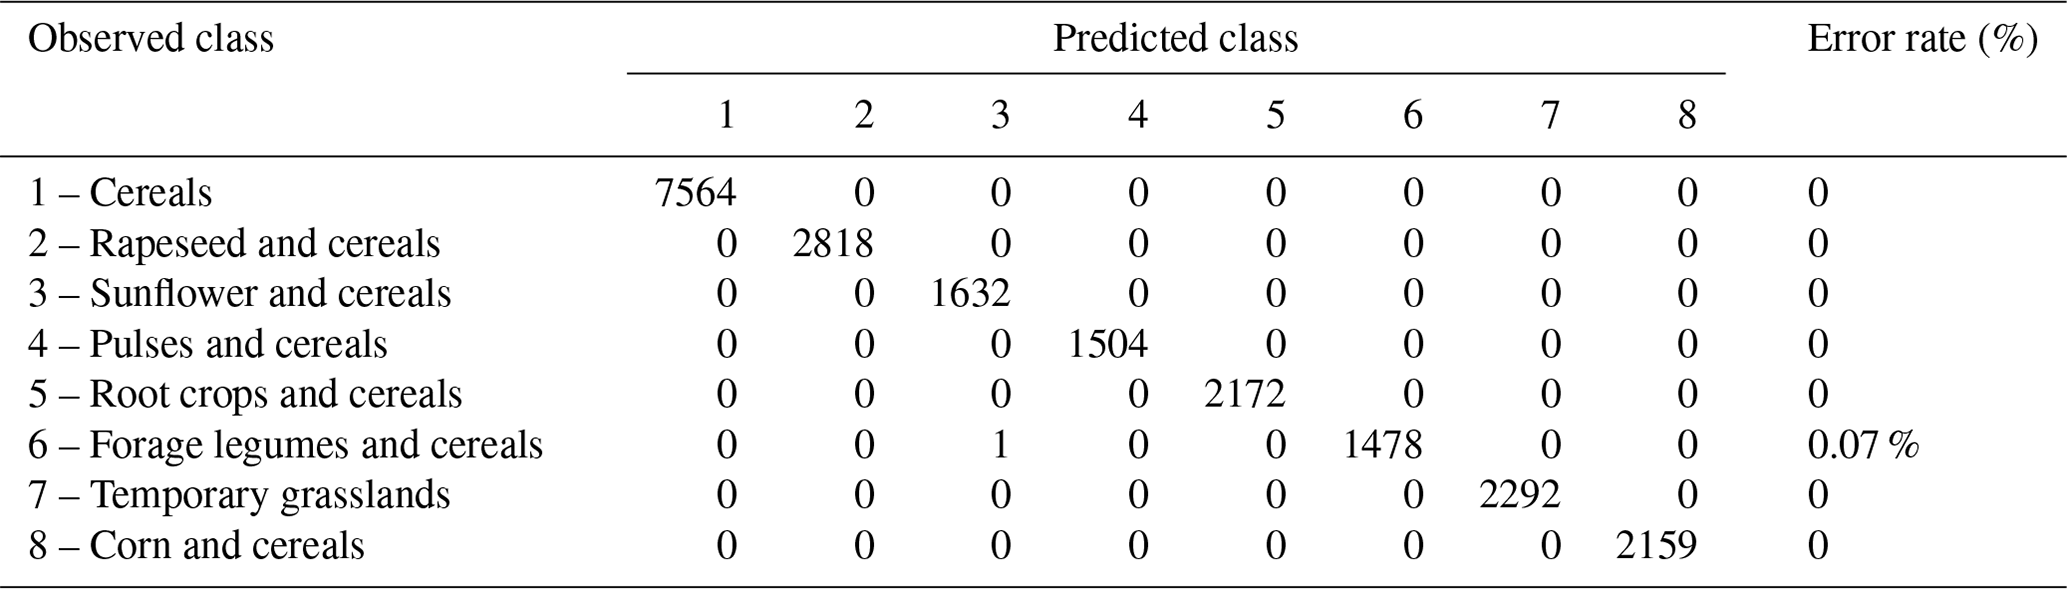
The crop sequence types derived from incomplete temporal sequences (LUCAS dataset) were compared to crop sequence types derived from complete temporal sequences based on the French LPIS dataset. The French LPIS dataset represents the best available data for spatial distributions of crops in France in terms of spatial and temporal resolutions, spatial coverage and disaggregation by crop type, with a coverage higher than 98 % for all field crops or 92 % for temporary grasslands (Cantelaube and Lardot, 2022; Guilpart et al., 2022). With this aim, a three-step procedure was followed. First, a random forest (RF) model was trained on LUCAS data to predict crop sequence types from crop (or crop group) frequencies (i.e. a total of eight predictors). The RF model was fitted using the randomForest() function of the R package randomForest v4.6.14 (Liaw and Wiener, 2002), with default settings (i.e. 500 trees, two variables randomly sampled as candidates at each split). The RF model showed good performances, as indicated by an out-of-bag (OOB) error rate lower than 0.1 % (Table 4). Each tree of our RF model is constructed based on a random sample of the observations generated by bootstrap. The observations that are not part of the bootstrap sample are referred to as OOB observations, which are used to estimate the prediction error (the so-called OOB error). The OOB error is considered a good measure of the true prediction error (Matthew, 2011; Janitza and Hornung, 2018). Second, the RF model was applied to French LPIS data to classify observed crop sequences into the eight crop sequence types. Third, the crop sequence type distributions derived from the LUCAS dataset and predicted from the French LPIS dataset were compared at the national and regional levels in France. This allowed us to check whether the lower temporal and spatial resolutions of the LUCAS dataset led to some bias in the identification of crop sequence types and their geographical distribution.
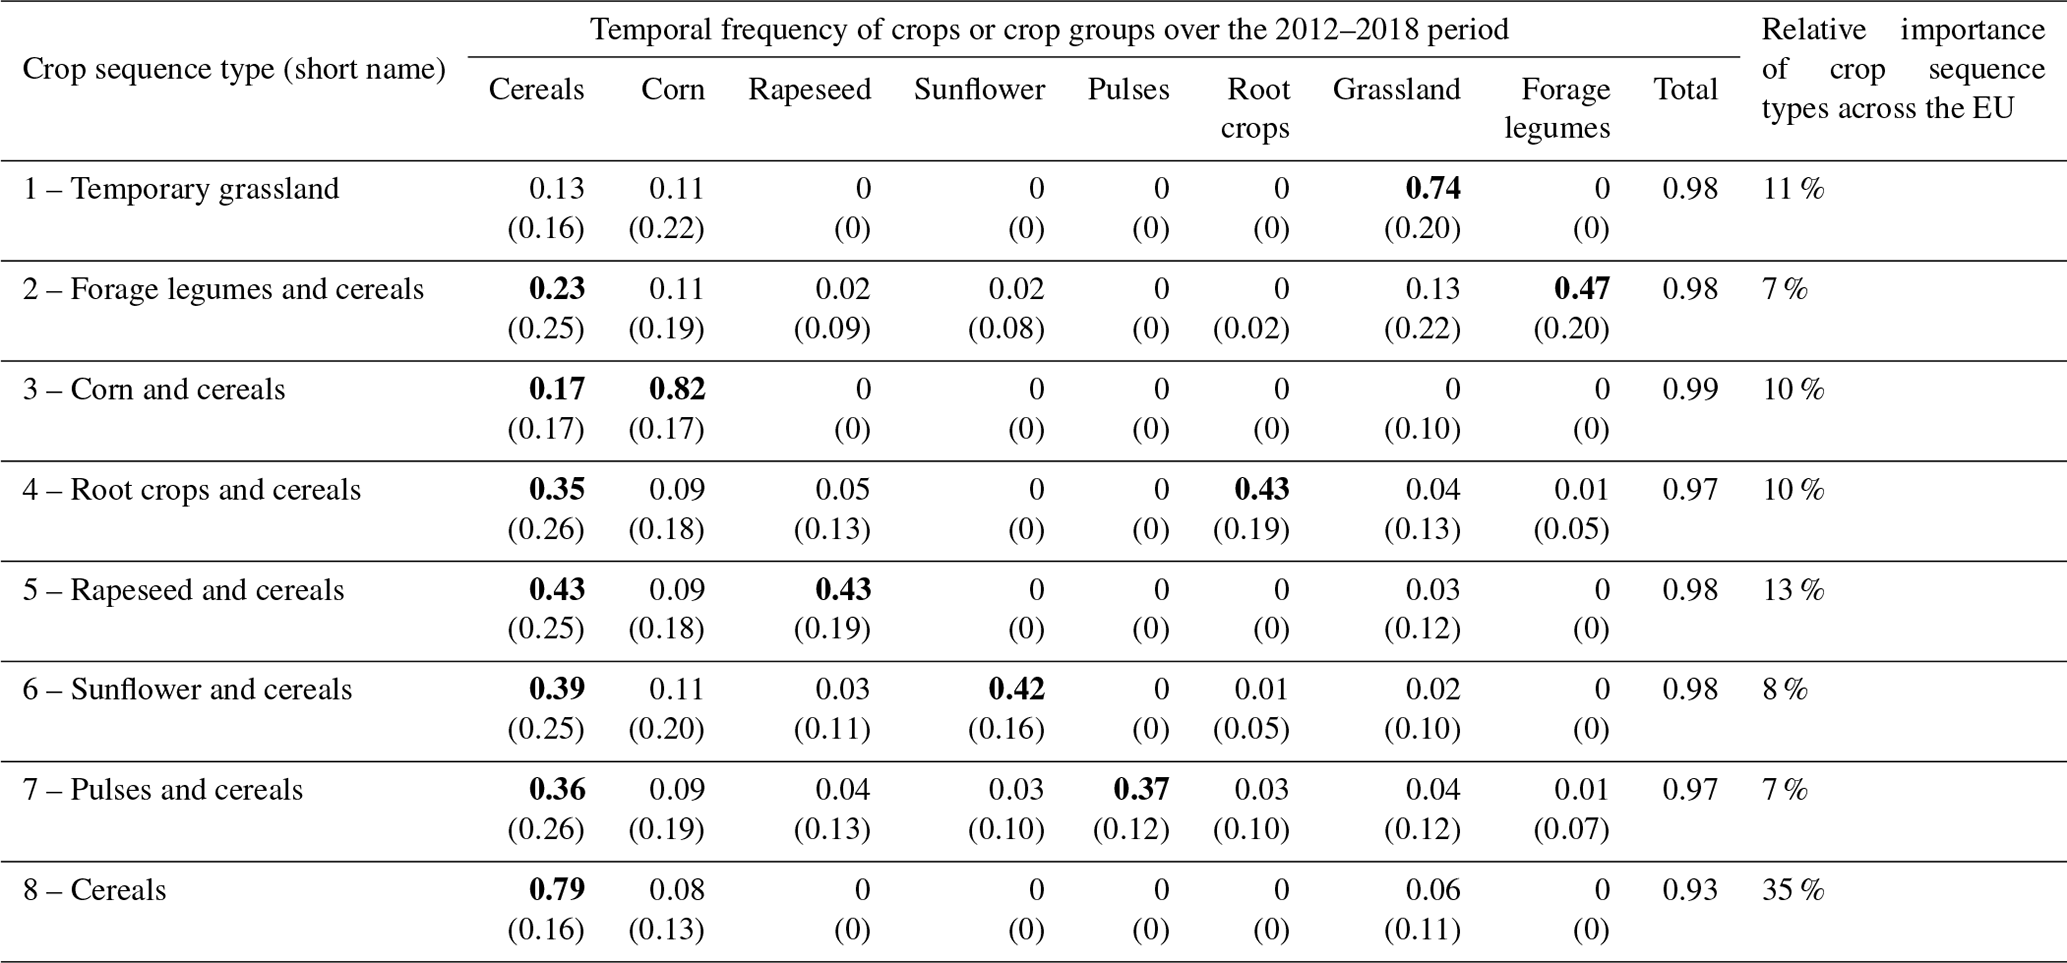
Table 3Average temporal frequency of crops or crop groups within each crop sequence type. Values in bold indicate the dominant (or two dominant) crop(s) or group(s) of crops in the crop sequence type. Values in brackets indicate standard deviations.
To ensure that the map of crop sequence types presented in this paper could be used as a baseline in studies assessing scenarios for the future of agriculture in Europe, it appears essential to assess its consistency with observed land use. With this aim, average crop or crop group harvested areas between 2012 and 2018 were calculated from (i) their temporal frequencies within the crop sequence types derived from the LUCAS dataset, (ii) the relative importance (i.e. spatial frequency) of crop sequence types and (iii) the total arable land area following Eq. (1):
Fj is the spatial frequency of crop sequence type j, and Fi,j is the temporal frequency of (group of) crop i within crop sequence type j. This calculation was applied for each country in Europe, at the national level, and compared to crop or crop group harvested areas reported by Eurostat (2023). Relative importances of crop sequence types were calculated according to the number of points and without consideration of the field area. Indeed, the harmonised LUCAS dataset provides information about the sizes of the surveyed parcels in hectares, but this information is limited to four categories (i.e. < 0.5, 0.5–1, 1–10 and > 10 ha) that were not relevant to weight relative importance.
3.1 Eight types of crop sequences identified based on the LUCAS dataset
Eight different types of crop sequences were identified based on the LUCAS dataset (Table 3). One crop sequence type largely dominates in terms of relative importance within Europe: it accounts for 35 % of LUCAS points and is dominated by cereals (79 %), followed by corn (8 %) and grasslands (6 %). Then comes a group of four crop sequence types of moderate relative importance, each one representing 10 % to 13 % of LUCAS points. This group includes a crop sequence type dominated by rapeseed (43 %) and cereals (43 %); a second one dominated by grasslands (74 %), cereals (13 %) and corn (11 %); a third one dominated by root crops (43 %) and cereals (35 %); and a fourth one dominated by corn (82 %) and cereals (17 %). The remaining three crop sequence types can be considered minor as they individually account for less than 10 % of LUCAS points. This includes a crop sequence type dominated by sunflower (42 %) and cereals (39 %), a second one dominated by pulses (37 %) and cereals (36 %) and a third one dominated by forage legumes (47 %) and cereals (23 %).
Two (groups of) crops are present in all crop sequence types: cereals and corn (Table 2). This highlights the central role of these crops in crop rotations in Europe. On the other hand, pulses, and to a lesser extent sunflower, root crops and forage legumes, appear in only a few (i.e. one to three) crop sequence types. Some crop sequence types show a high degree of diversity, like the “pulses and cereals” in which all (groups of) crops are represented, while some others are much less diverse, like the “cereals” and “corn and cereals” types. These two crop sequence types account for almost half (45 %) of all LUCAS points and are composed of cereals and corn by more than 90 %.
If all the LUCAS campaigns available were considered (i.e. 2006–2018), the classification would have resulted in the same eight types of crop sequences. The eight types would not have ranked in the same order regarding their relative importance. Their relative importance would have changed slightly: 26 instead of 35 % for a cereal-dominated crop sequence type (same ranking), 17 instead of 8 % for sunflower and cereals (second instead of sixth place), 16 instead of 10 % for corn and cereals (third instead of fifth place), 13 instead of 11 % for a temporary grassland-dominated crop sequence type (fourth instead of third place), 8 instead of 13 % for rapeseed and cereals (fifth instead of second place), 8 instead of 10 % for root crops and cereals (sixth instead of fourth place), 7 % for pulses and cereals (relative importance and ranking unchanged) and 6 instead of 7 % for forage legumes and cereals (ranking unchanged). These differences were consistent as 16 of the 27 countries were discarded when we only considered points with observations for all the 2006–2018 LUCAS campaigns.
3.2 Quality assessment
3.2.1 Incomplete temporal crop sequences are good proxies of complete temporal crop sequences at the national and regional scales in France
On average at the national scale in France, the relative importance of crop sequence types estimated from the LUCAS dataset is in good agreement (R2=0.75, root mean square error RMSE = 0.04) with estimates based on the French LPIS dataset, with no systematic bias (Figs. 3 and S1 in the Supplement). However, estimates based on the LUCAS dataset underestimate the proportion of the “grasslands” crop sequence type (−9 %) and slightly overestimate the proportion of the “corn and cereals” (+3 %), “cereals” (+2.5 %), “pulses and cereals” (+2 %) and “sunflower and cereals” (−2 %) ones.
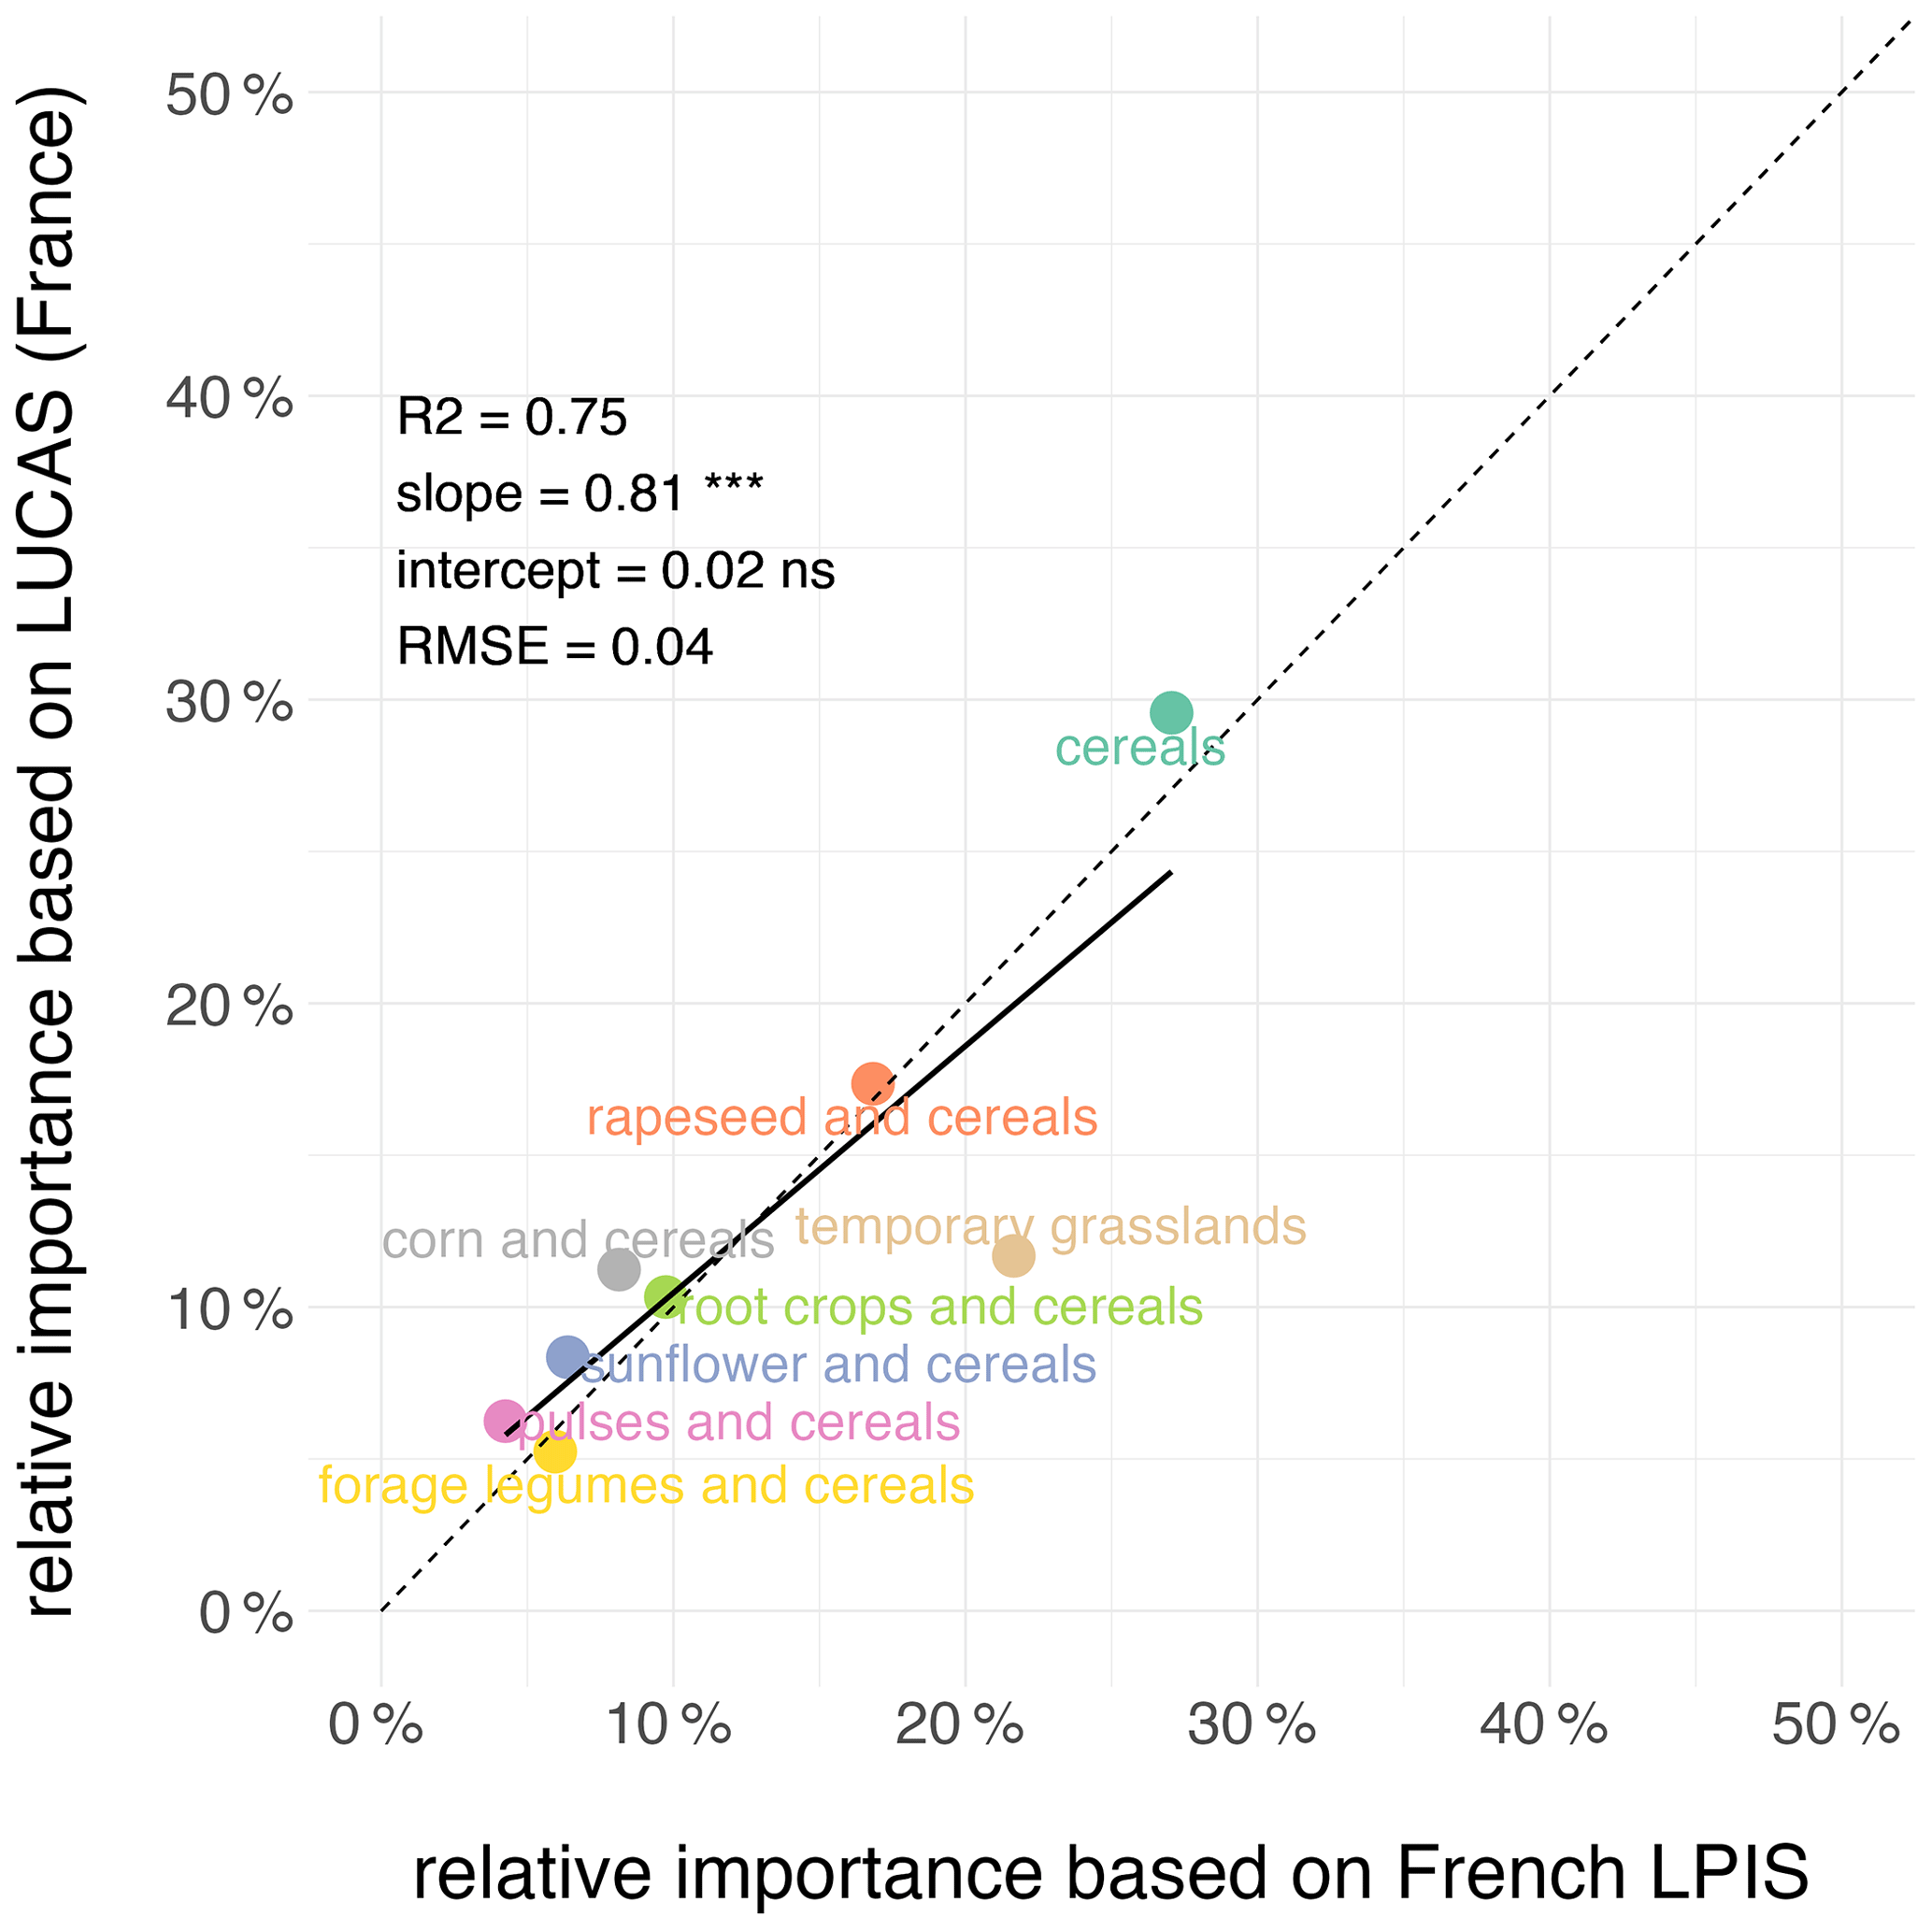
Figure 3Comparison of the relative importance of crop sequence types derived from the LUCAS and French LPIS datasets at the national scale in France. The dotted line denotes the 1:1 line. Also shown are the fitted linear regression model and the associated slope and intercept. RMSE: root mean square error.
At the regional scale, the agreement between the relative importance of crop sequence types derived from the LUCAS or French LPIS datasets remains good but varies by crop group (Fig. 4). The crop sequence types “sunflower and cereals”, “root crops and cereals”, “rapeseed and cereals”, “forage legumes and cereals” and “corn and cereals” show the best agreement, with high R2 (higher than 0.8), low RMSE (lower than 0.1) and no systematic bias, whereas the crop sequence type “pulses and cereals” shows the lowest agreement (R2=0.37, RMSE = 0.04). Underestimation of the crop sequence type “grasslands”, especially for regions where relative importance is high, and overestimation of the crop sequence type “cereals” are confirmed but for regions where relative importance is low.
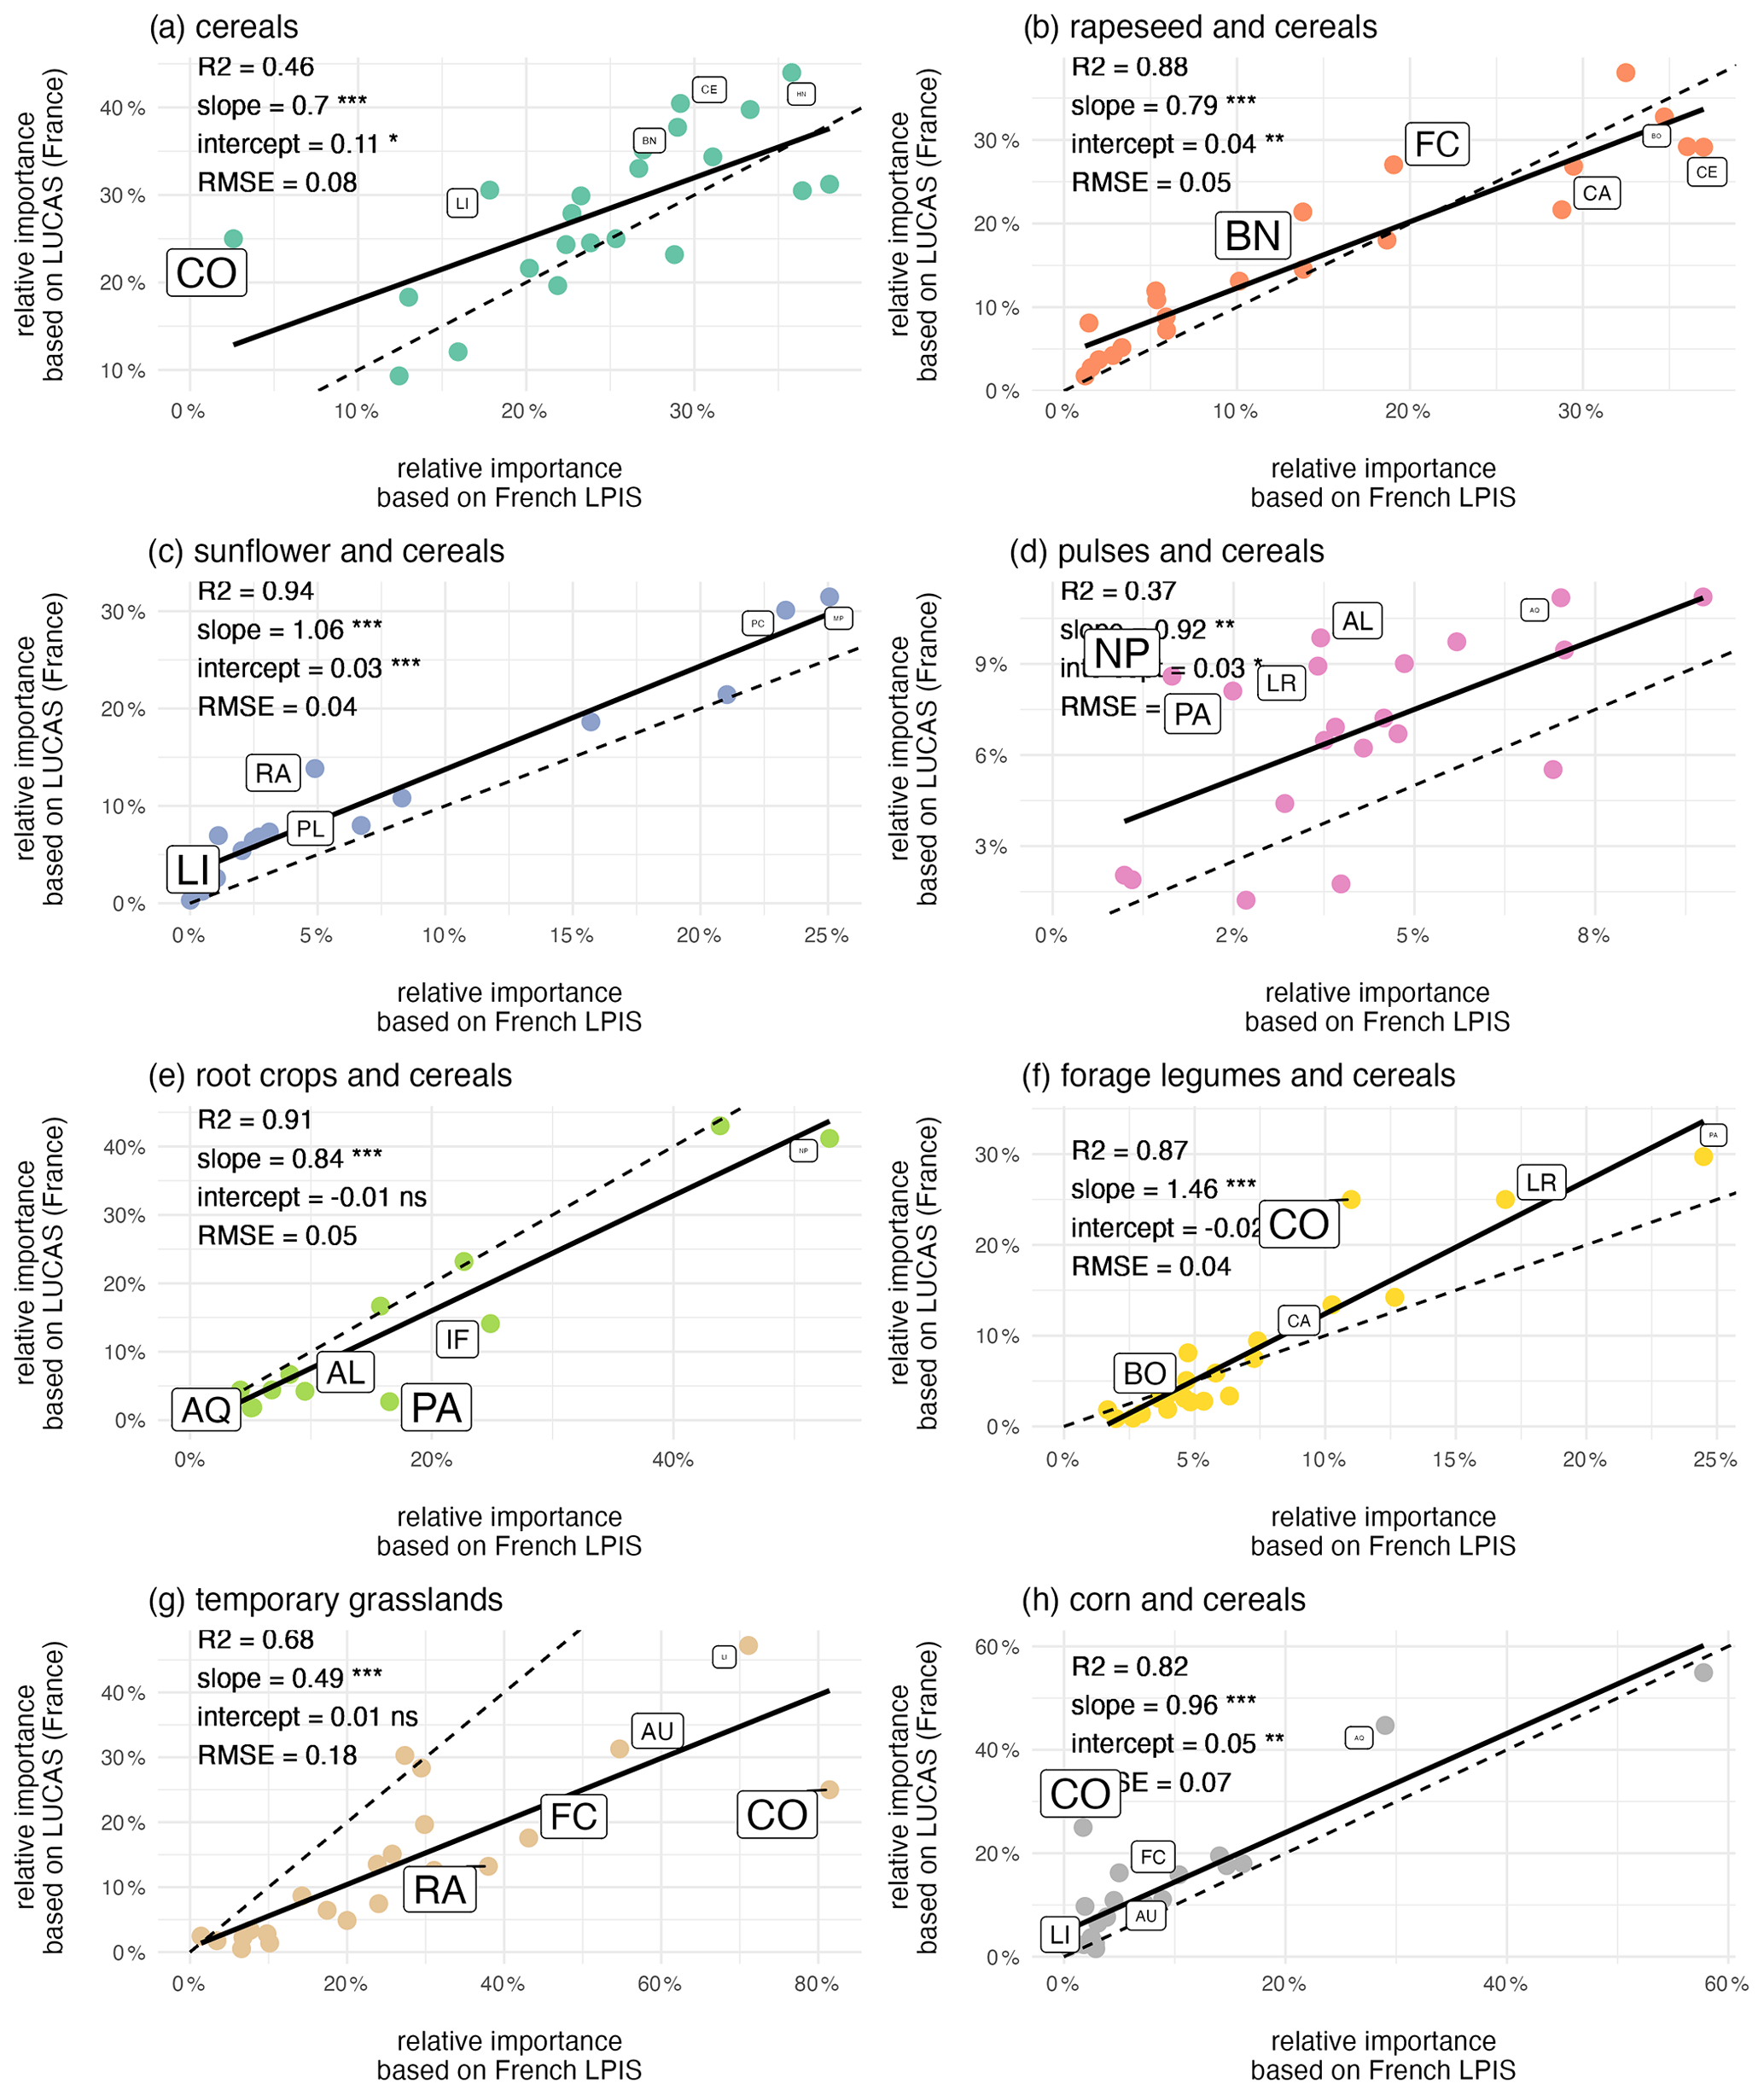
Figure 4Comparison of the relative importance of crop sequence types derived from the LUCAS and French LPIS datasets for the 22 regions in France. The dotted line denotes the 1:1 line. Also shown are the fitted linear regression models and the associated slopes and intercepts. Labels identify the five regions with the highest difference between predicted and observed areas (the font size is proportional to the area difference relative to the observed area). AL: Alsace, AQ: Aquitaine, AU: Auvergne, BN: Basse-Normandie, BO: Bourgogne, BR: Bretagne, CE: Centre, CA: Champagne-Ardenne, CO: Corse, FC: Franche-Comté, HN: Haute-Normandie, IF: Île-de-France, LR: Languedoc-Roussillon, LI: Limousin, LO: Lorraine, MP: Midi-Pyrénées, NP: Nord-Pas-de-Calais, PL: Pays de la Loire, PI: Picardie, PC: Poitou-Charentes, PA: Provence-Alpes-Côte d'Azur, RA: Rhône-Alpes.
Overall, regional differences in crop sequence types are well captured with the LUCAS dataset, as shown by two conclusions. First, any given crop sequence type may have a low relative importance in one region and a high one in another. This range of relative importance across regions is well captured by estimates derived from the LUCAS dataset for all crop sequence types (Figs. 4, S2). Second, regional specificities in terms of dominant crop sequence types are also well captured by LUCAS data (Fig. S2). For example, the Picardie region is dominated by the three crop sequence types “root crops and cereals”, “cereals” and “rapeseed and cereals”, while the Aquitaine region is dominated by the crop sequence types “corn and cereals” and “sunflower and cereals”.
3.2.2 Land use derived from crop sequence types is in good agreement with land use reported by official statistics at national and EU levels
Comparison of crop harvested areas derived either from crop sequence types or from official statistics (EUROSTAT, 2022) shows good agreement at the European scale (Fig. 5), with R2 higher than 0.99 and with no bias. Comparison for each country of the EU (Fig. 6) reveals good levels of correlation between areas derived from crop sequence types and areas reported by Eurostat, with R2 ranging from 0.71 for temporary grasslands to 0.98 for cereals, rapeseed or pulses. Nevertheless, some crop–country combinations display bad agreement between estimated and observed harvested areas (Fig. S3). Harvested areas of forage legumes are overestimated in Greece, France and Romania, whereas they are underestimated in Germany and Italy. Regarding corn, harvested area is overestimated for Sweden, Lithuania, Spain and the United Kingdom but is underestimated for Hungary and Romania. For root crops, harvested areas are also underestimated for Cyprus, Montenegro, Portugal, Belgium and the Netherlands. Sunflower harvested area is overestimated in Spain and is underestimated for Romania. Cereal harvested area is overestimated for the Netherlands but is underestimated for Spain. Temporary grassland harvested area is overestimated for Romania, Spain, Portugal and Germany.
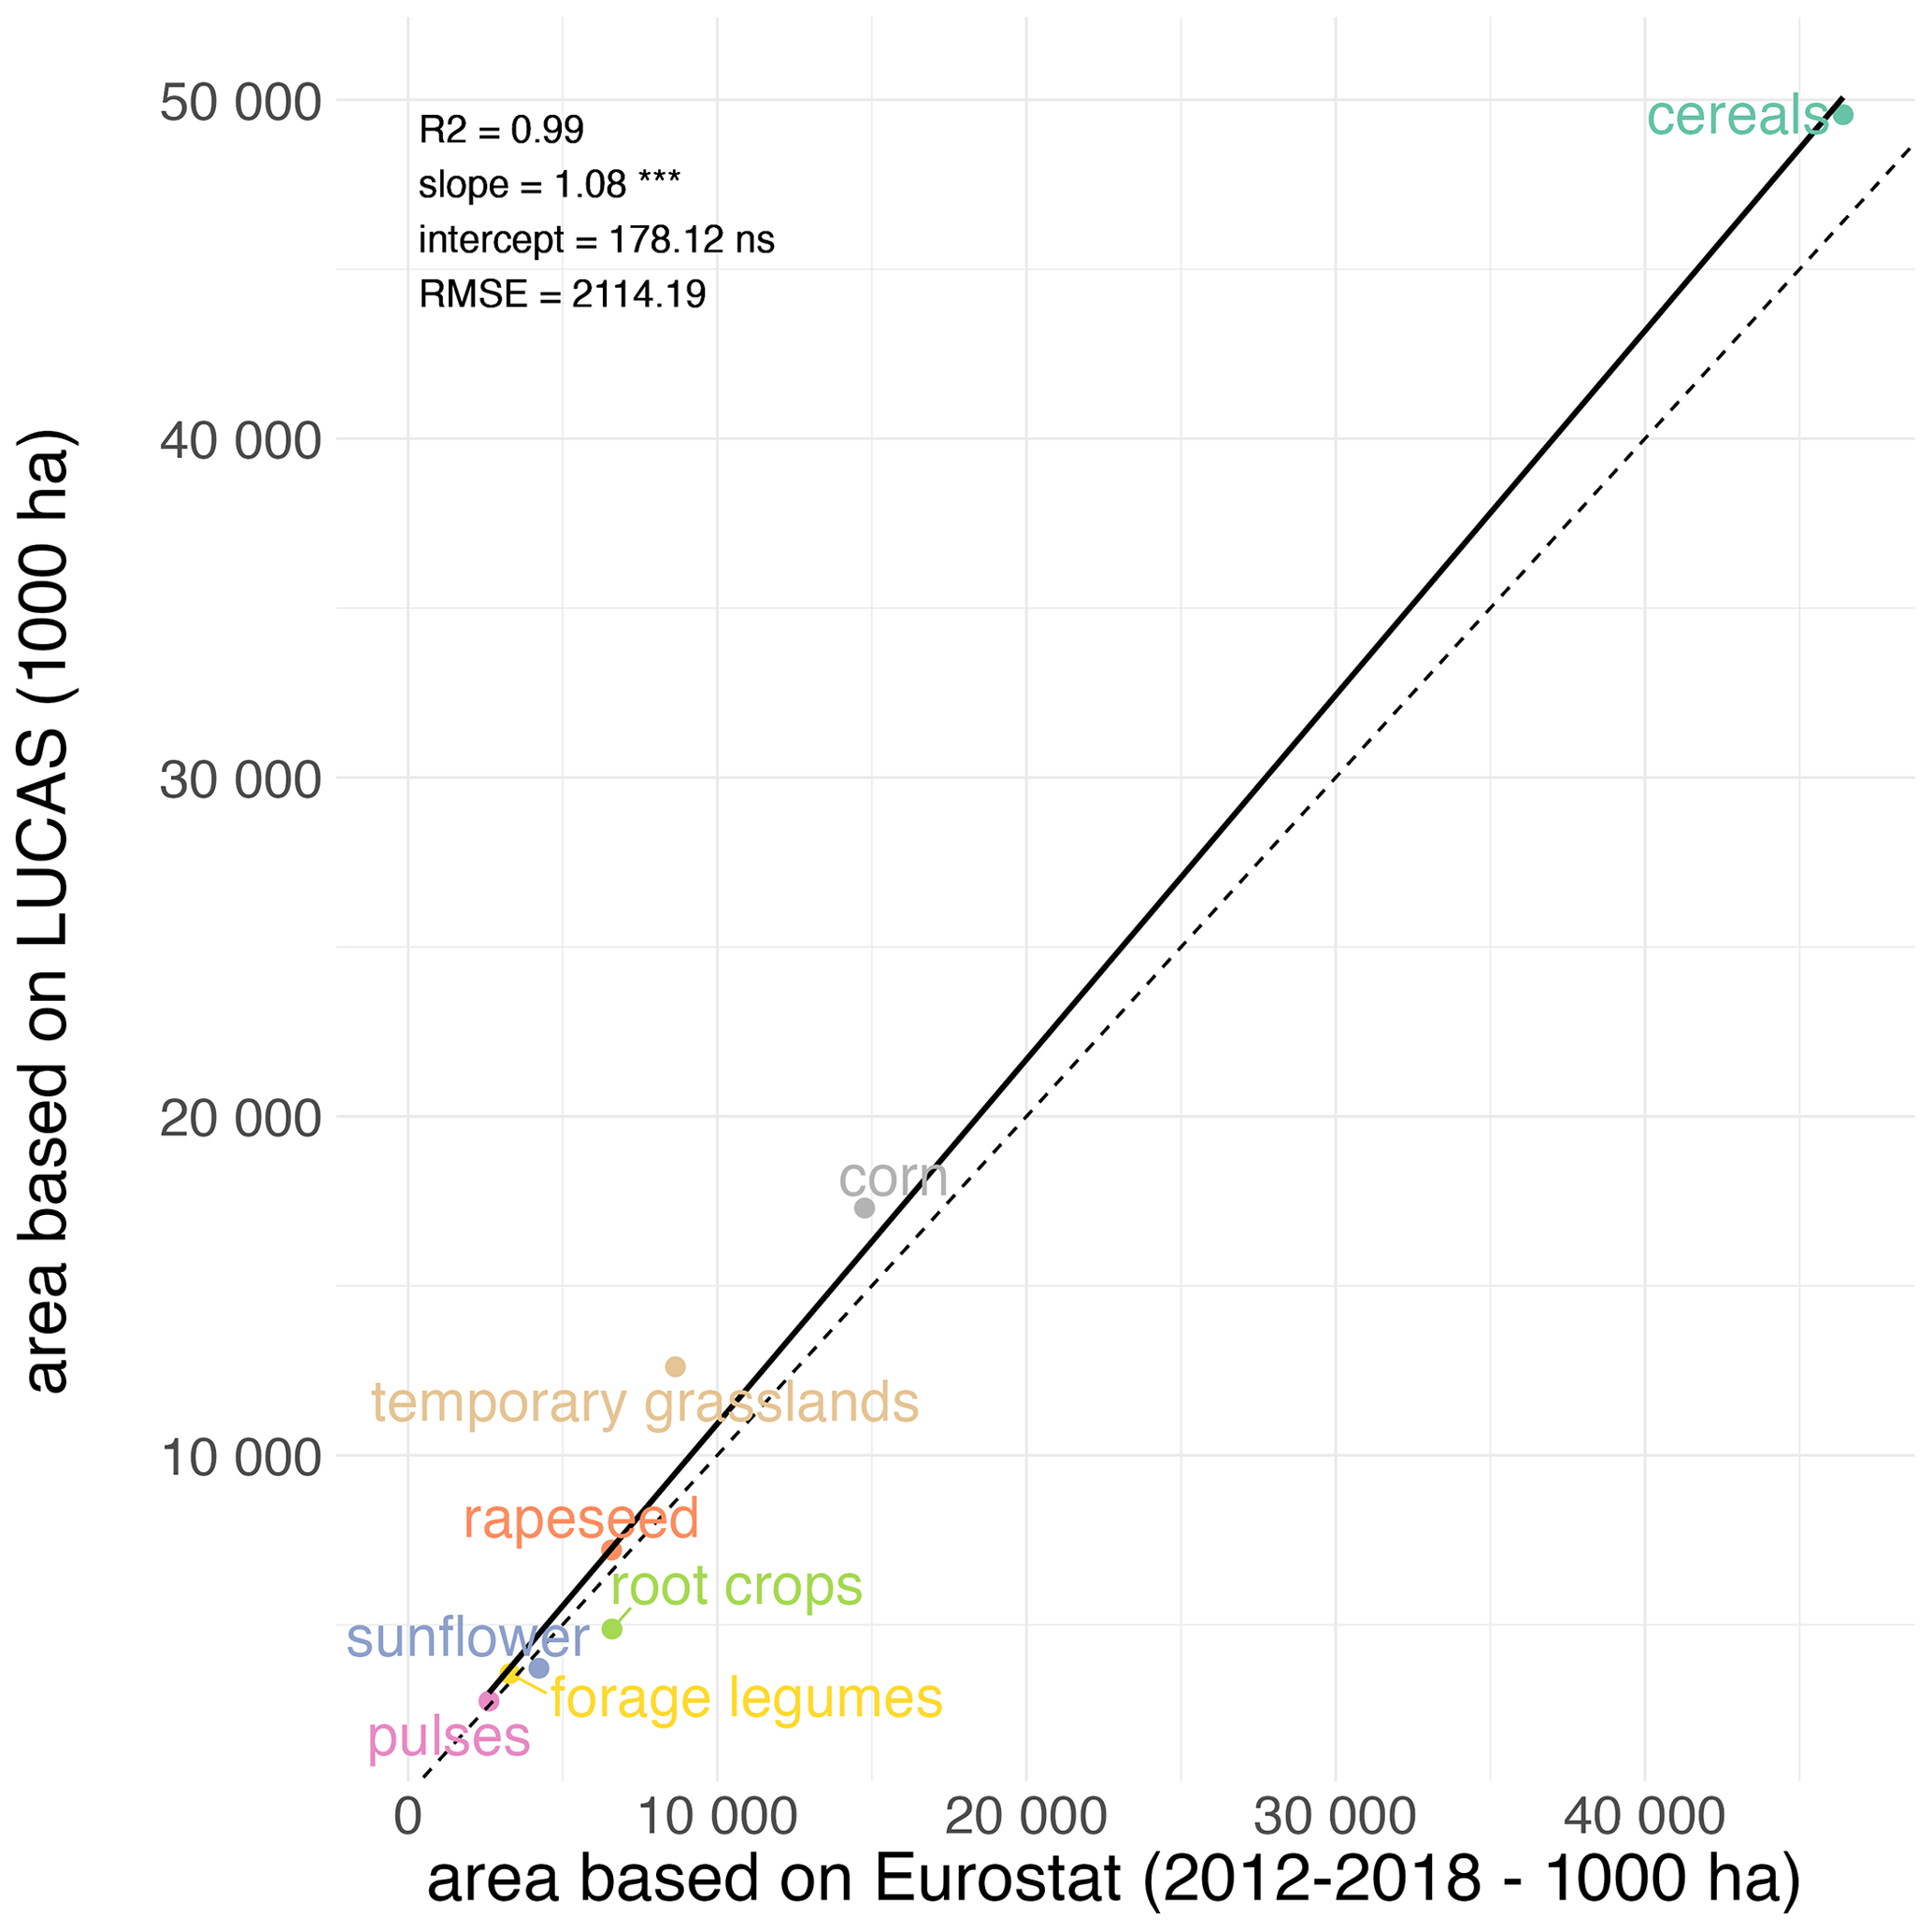
Figure 5Comparison of harvested areas reported by Eurostat and derived from crop sequence types based on the LUCAS dataset at the European scale. The dotted line denotes the 1:1 line. Also shown are the fitted linear regression model and the associated slope and intercept.
3.3 Spatial distribution of crop sequence types in Europe
The maps of crop sequence types presented in Figs. 7 and 8 show a strong spatial pattern of crop sequence type distribution in the EU. The crop sequence types “grasslands”, “corn and cereals”, “cereals” and, to a lesser extent, “pulses and cereals” and “forage legumes and cereals” are present in all EU countries, whereas the other crop sequence types are concentrated in specific parts of Europe. Indeed, “rapeseed and cereals” and “root crops and cereals” are mainly found in the north of France, Belgium, the Netherlands, Germany, Czechia and Poland, whereas “sunflower and cereals” is mainly found in the south of France, Spain, Hungary, Bulgaria and Romania. These differences are best highlighted when looking at the latitudinal distribution of crop sequence types shown in Fig. 9. Indeed, “grasslands”, “pulses and cereals” and “cereals” are found in a wide range of latitudes (from 40 to 60∘ N), while other crop sequence types are limited to narrower ranges of latitudes, with some in the north, like “root crops and cereals”, concentrated between 50 and 55∘ N and some in the south, like “sunflower and cereals”, concentrated between 40 and 50∘ N. Most crop sequence types display regions in which they are more concentrated, like the north of France and Belgium for “root crops and cereals” or central Italy for “forage legumes and cereals”. However, the “pulses and cereals” crop sequence type seems more regularly distributed from 40 to 60∘ N. Several crop sequence types coexist in most regions. For example, all crop sequence types except “sunflower and cereals” and “forage legumes and cereals” are found in the very north of France (Fig. 8). It is well known that temporal and spatial crop diversities are not independent of each other (Aramburu Merlos and Hijmans, 2020). Therefore, it is expected that a crop sequence type characterised by a high temporal frequency of a given (group of) crop(s) will be frequent where this (group of) crop(s) is widely cultivated. For example, crop sequences including corn can only be observed where corn is grown. However, knowing where corn is grown does not say anything about the crop sequence in which corn is cultivated. Of course, knowing which other crops are grown in the same area as corn can inform us about possible crop sequences, but this is not sufficient. Our results provide a good example: many crop sequence types coexist in the very north of France (temporary grasslands, corn and cereals, root crops and cereals, rapeseed and cereals, pulses and cereals, and cereals). As a consequence, cereals (e.g. wheat) can be found in very specialised crop sequences (e.g. the “cereals” crop sequence type), moderately diversified crop sequences (e.g. the “root crops and cereals” crop sequence type) and diversified crop sequences (e.g. the “pulses and cereals” crop sequence type). This demonstrates that specialised crop sequences can still occur in areas where a substantial diversity of crops is cultivated, and this cannot be inferred from land use (e.g. individual crop maps of “rotation heads”) only.
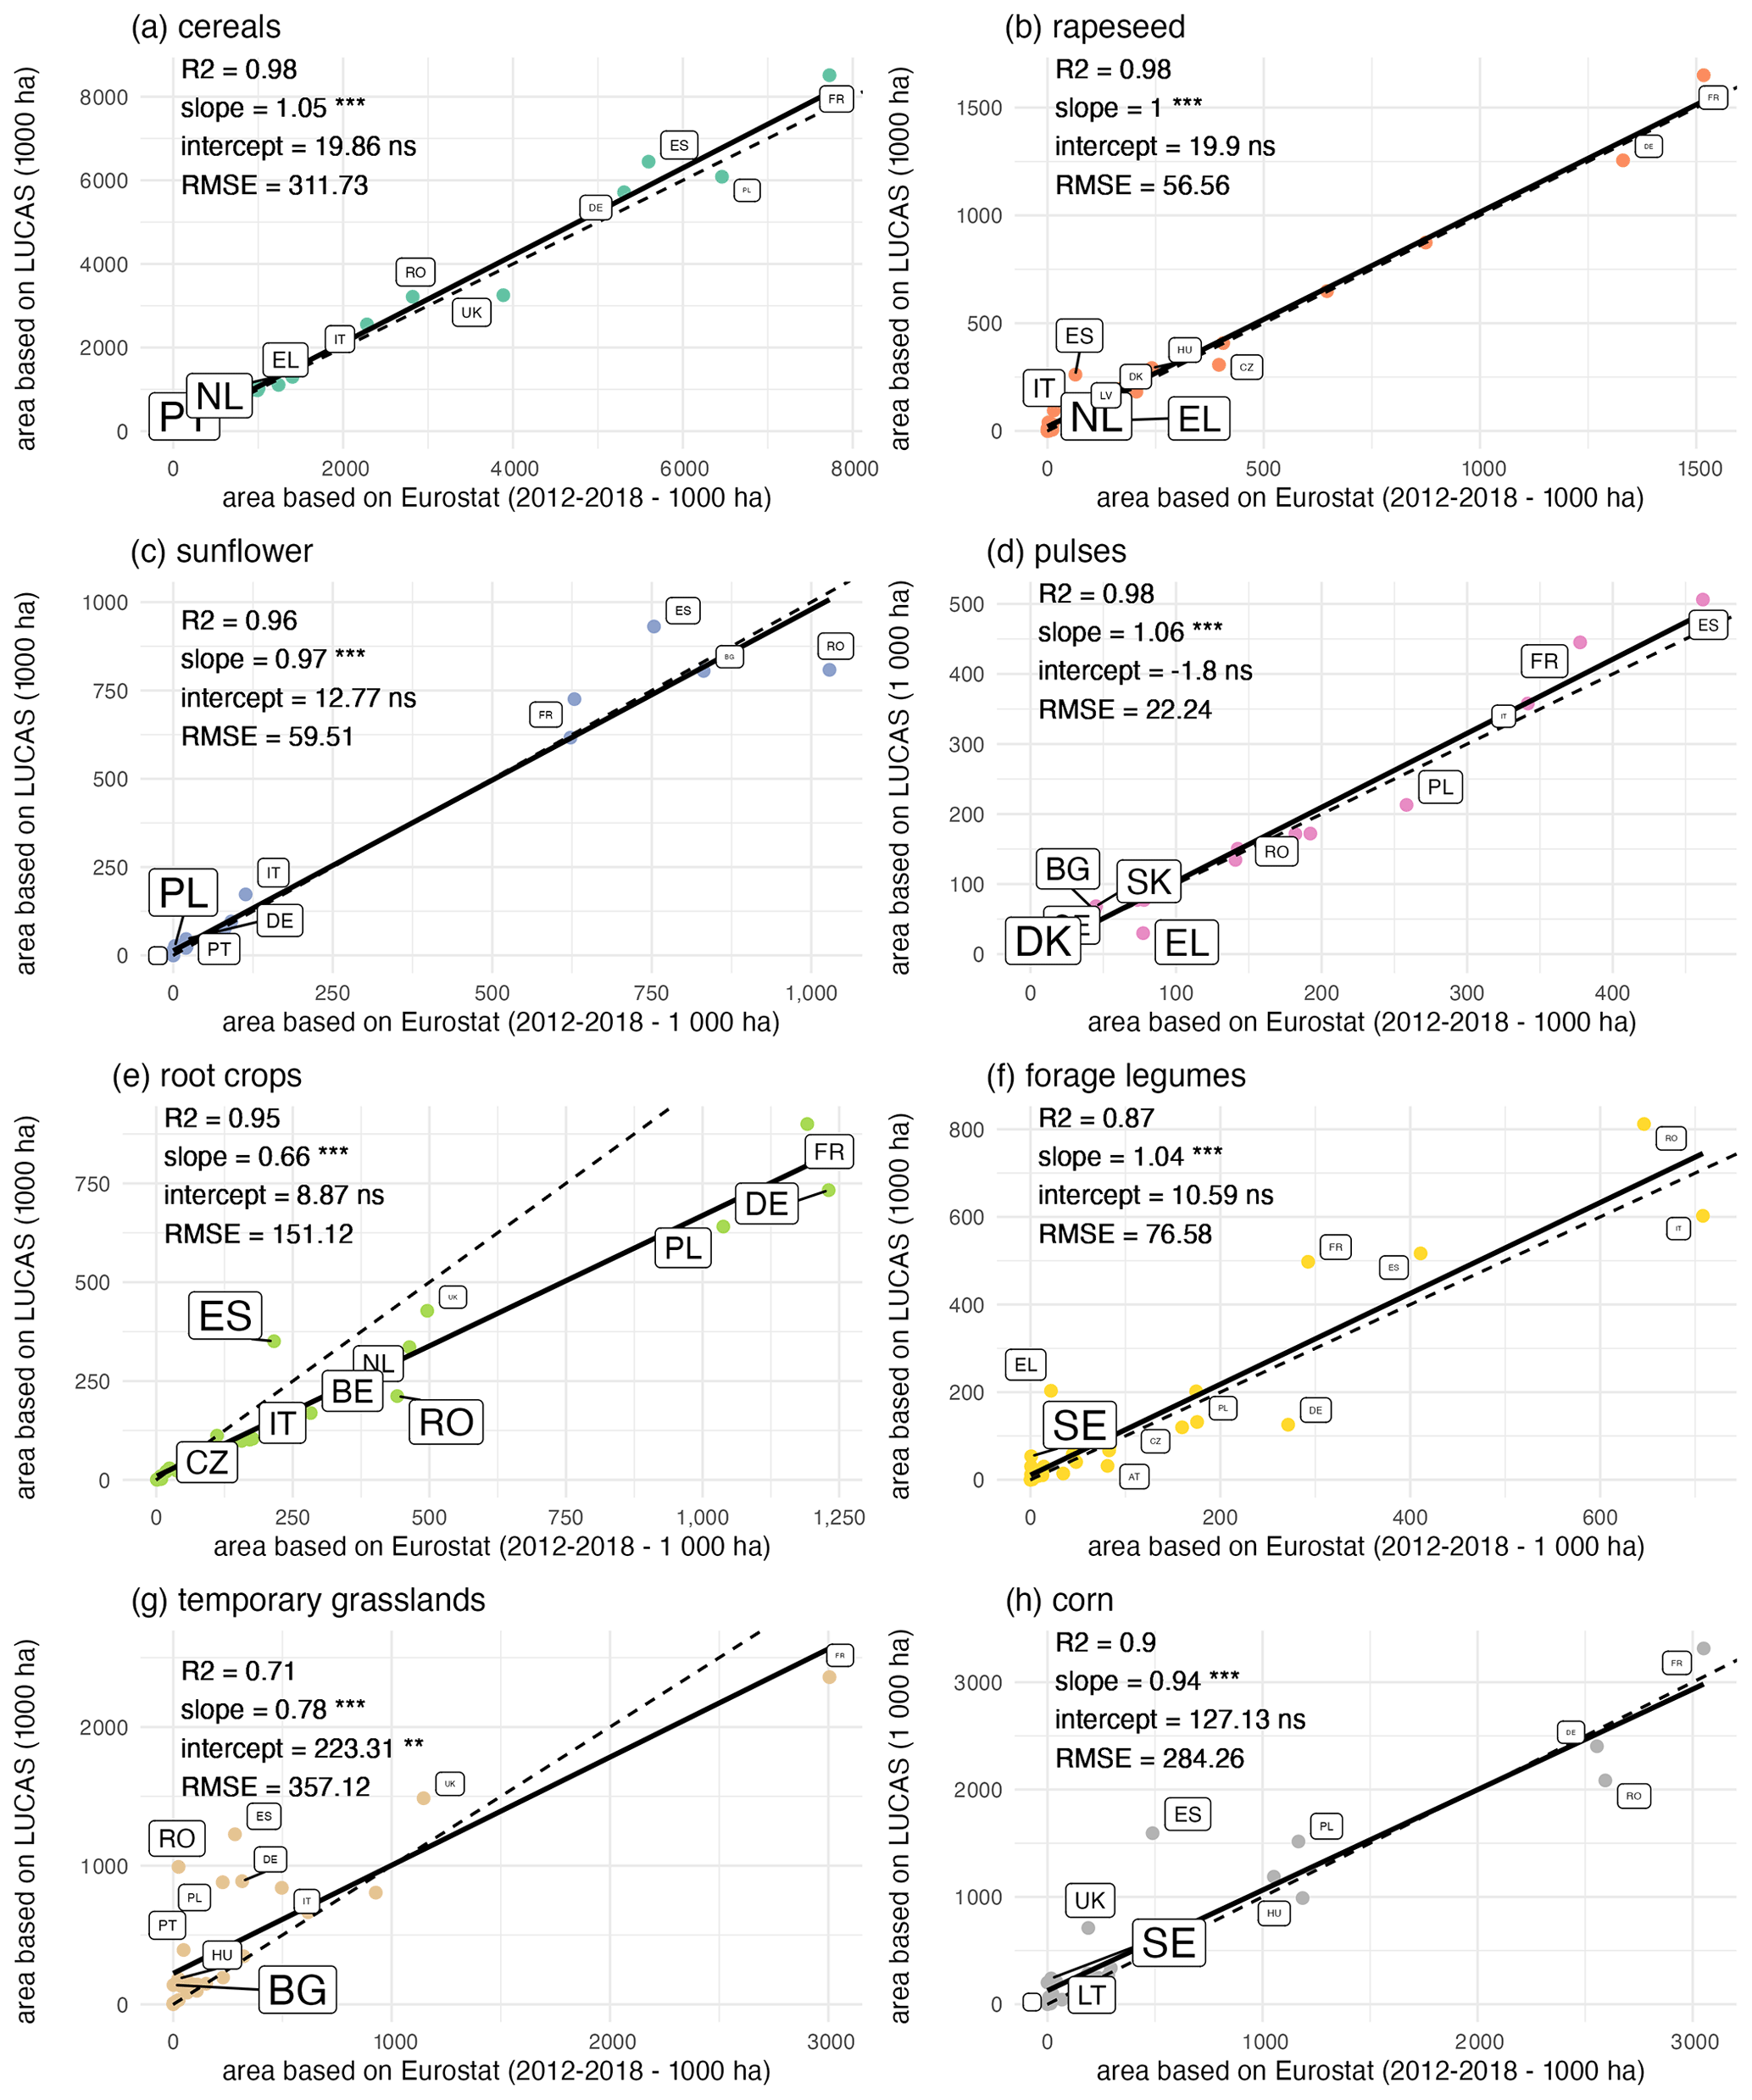
Figure 6Comparison of harvested areas reported by Eurostat and derived from the crop sequence types based on the LUCAS dataset for the various countries in Europe. The dotted line denotes the 1:1 line. Also shown are the fitted linear regression models and the associated slopes and intercepts. Labels identify the 10 countries with the highest difference between predicted and observed areas (the font size is proportional to the area difference relative to the observed area). AT: Austria, BE: Belgium, BG: Bulgaria, CY: Cyprus, CZ: Czechia, DE: Germany, DK: Denmark, EE: Estonia, EL: Greece, ES: Spain, FI: Finland, FR: France, HU: Hungary, IE: Ireland, IT: Italy, LT: Lithuania, LU: Luxembourg, LV: Latvia, MT: Montenegro, NL: Netherlands, PL: Poland, PT: Portugal, RO: Romania, SE: Sweden, SI: Slovenia, SK: Slovakia, UK: United Kingdom.
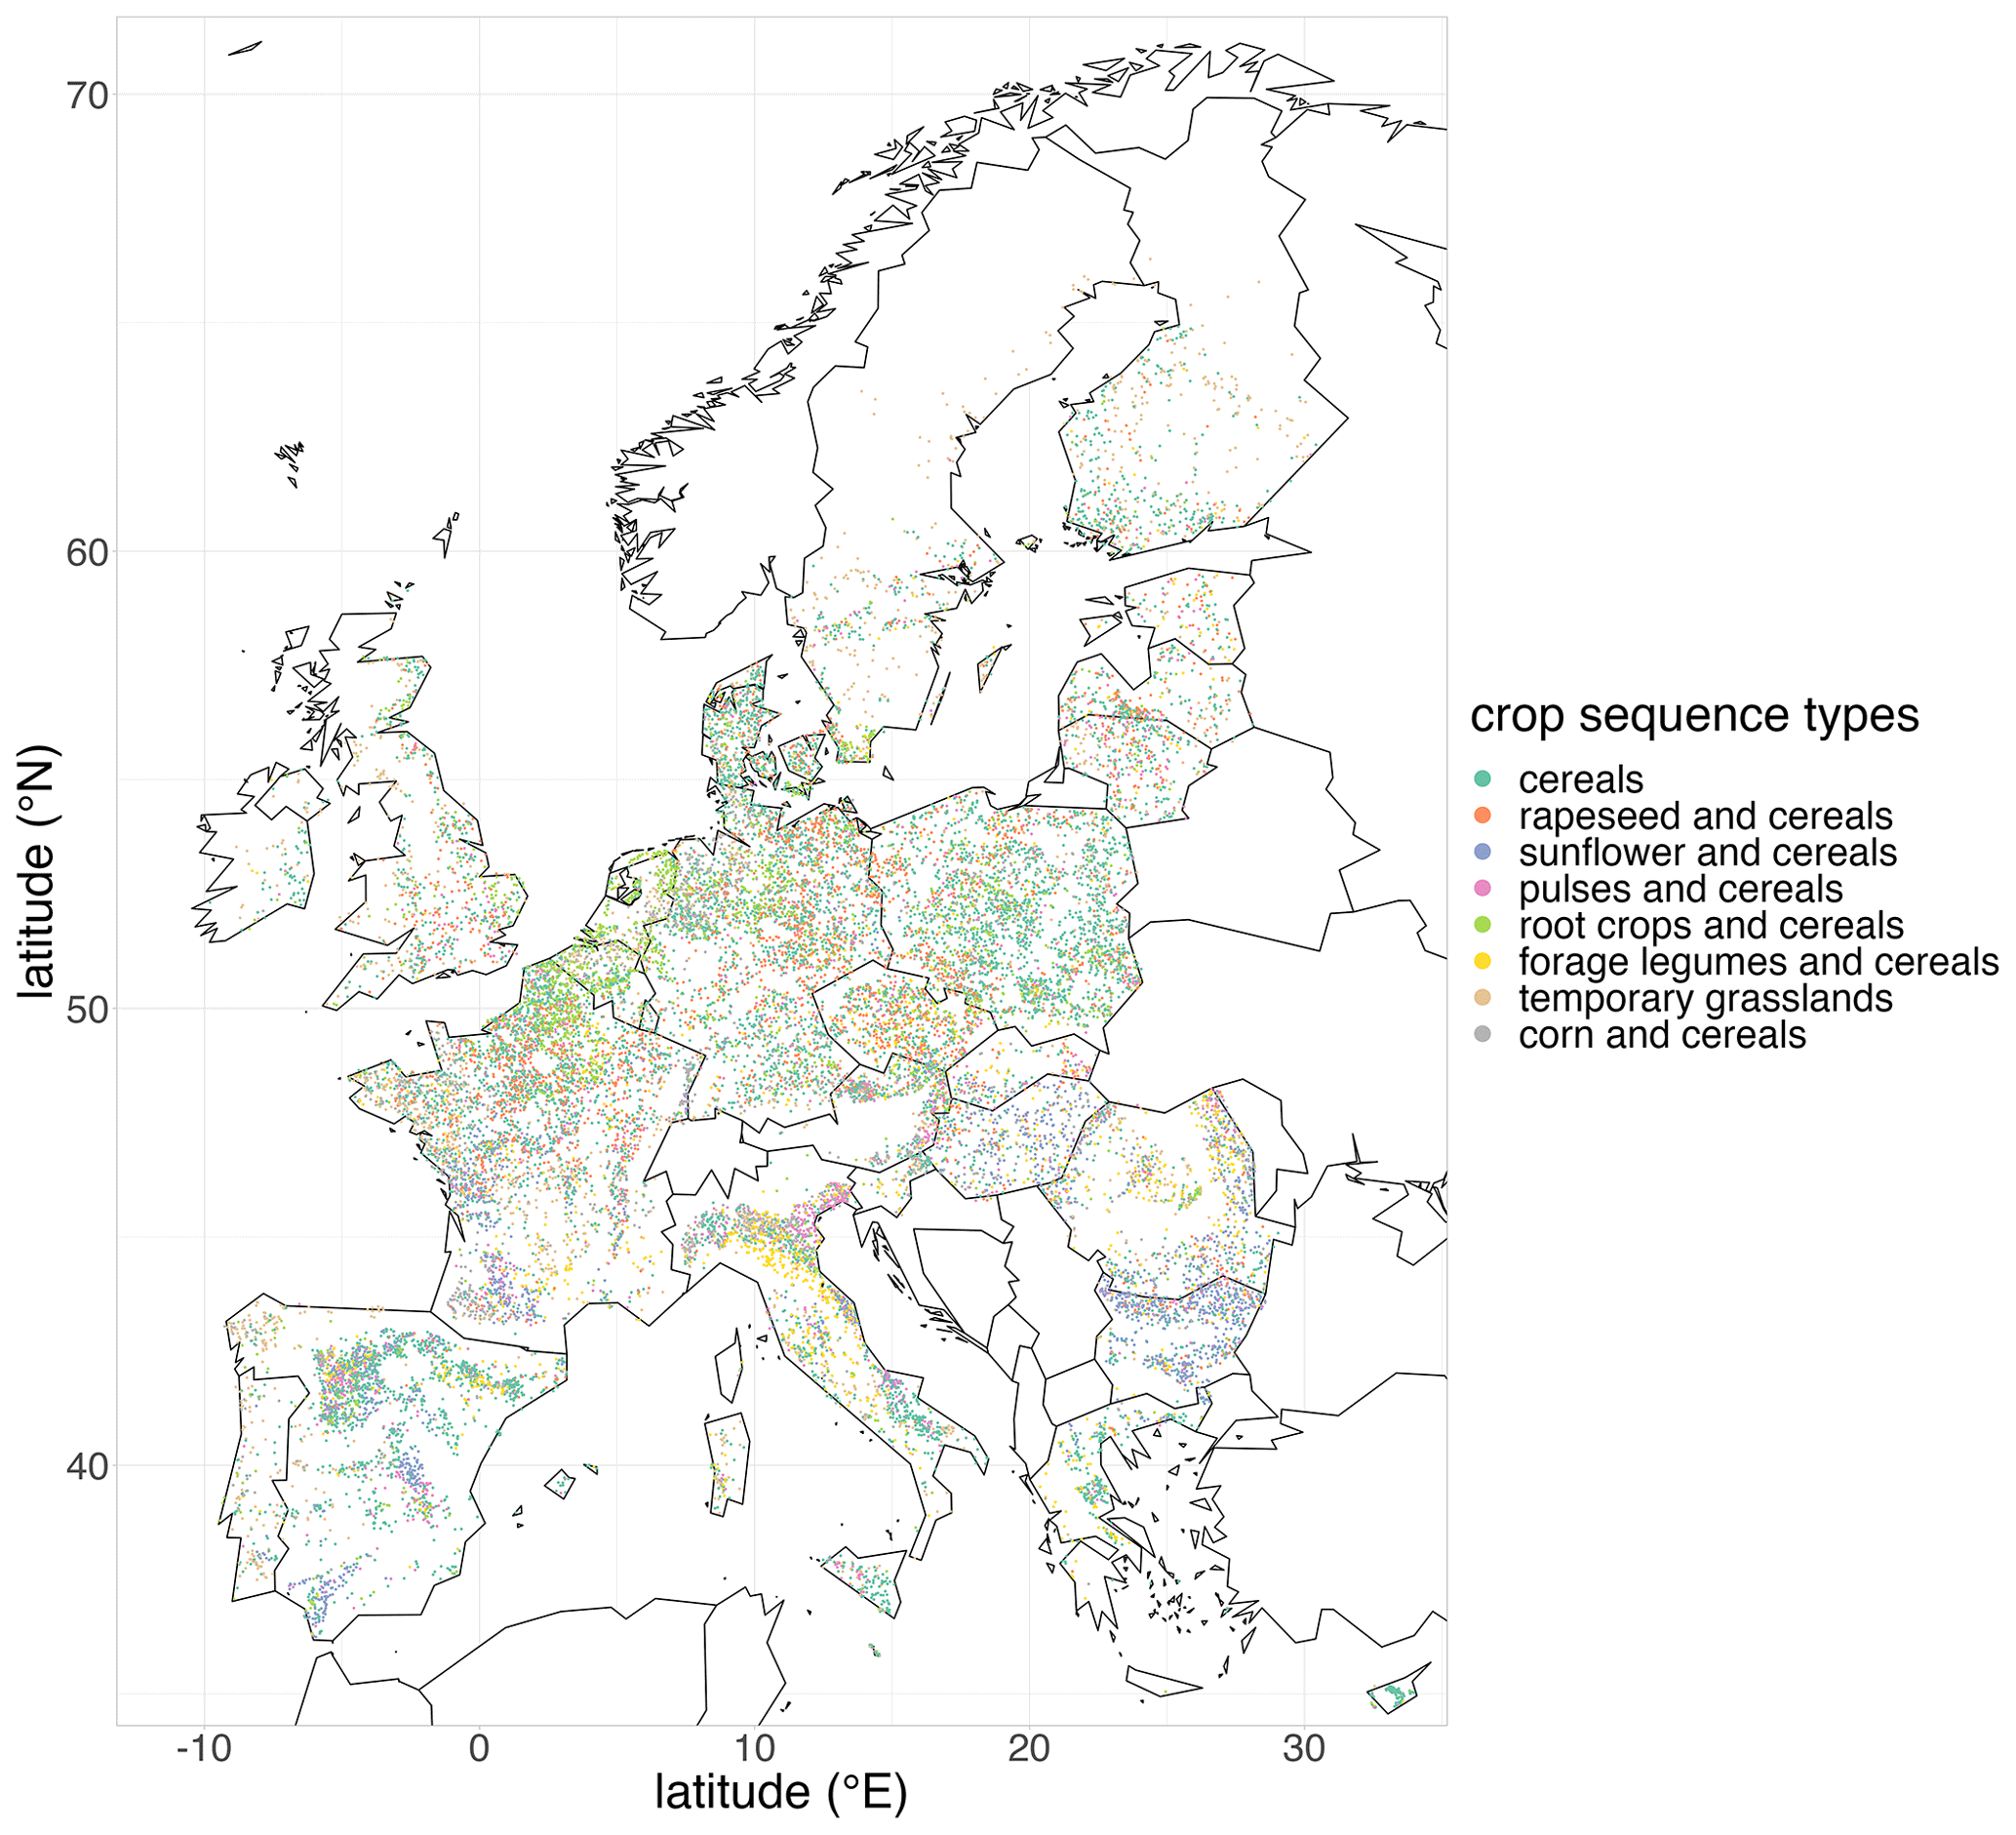
Figure 7Map of crop sequence types in Europe based on the LUCAS dataset. Note that crop sequence types have been given short names that reflect dominant crops or crop groups within the sequence. For example, the crop sequence type “grasslands” also includes cereals and corn, but these crops are less frequent in the sequence. The composition of each crop sequence type in terms of temporal frequencies of (groups of) crops is presented in Table 2.
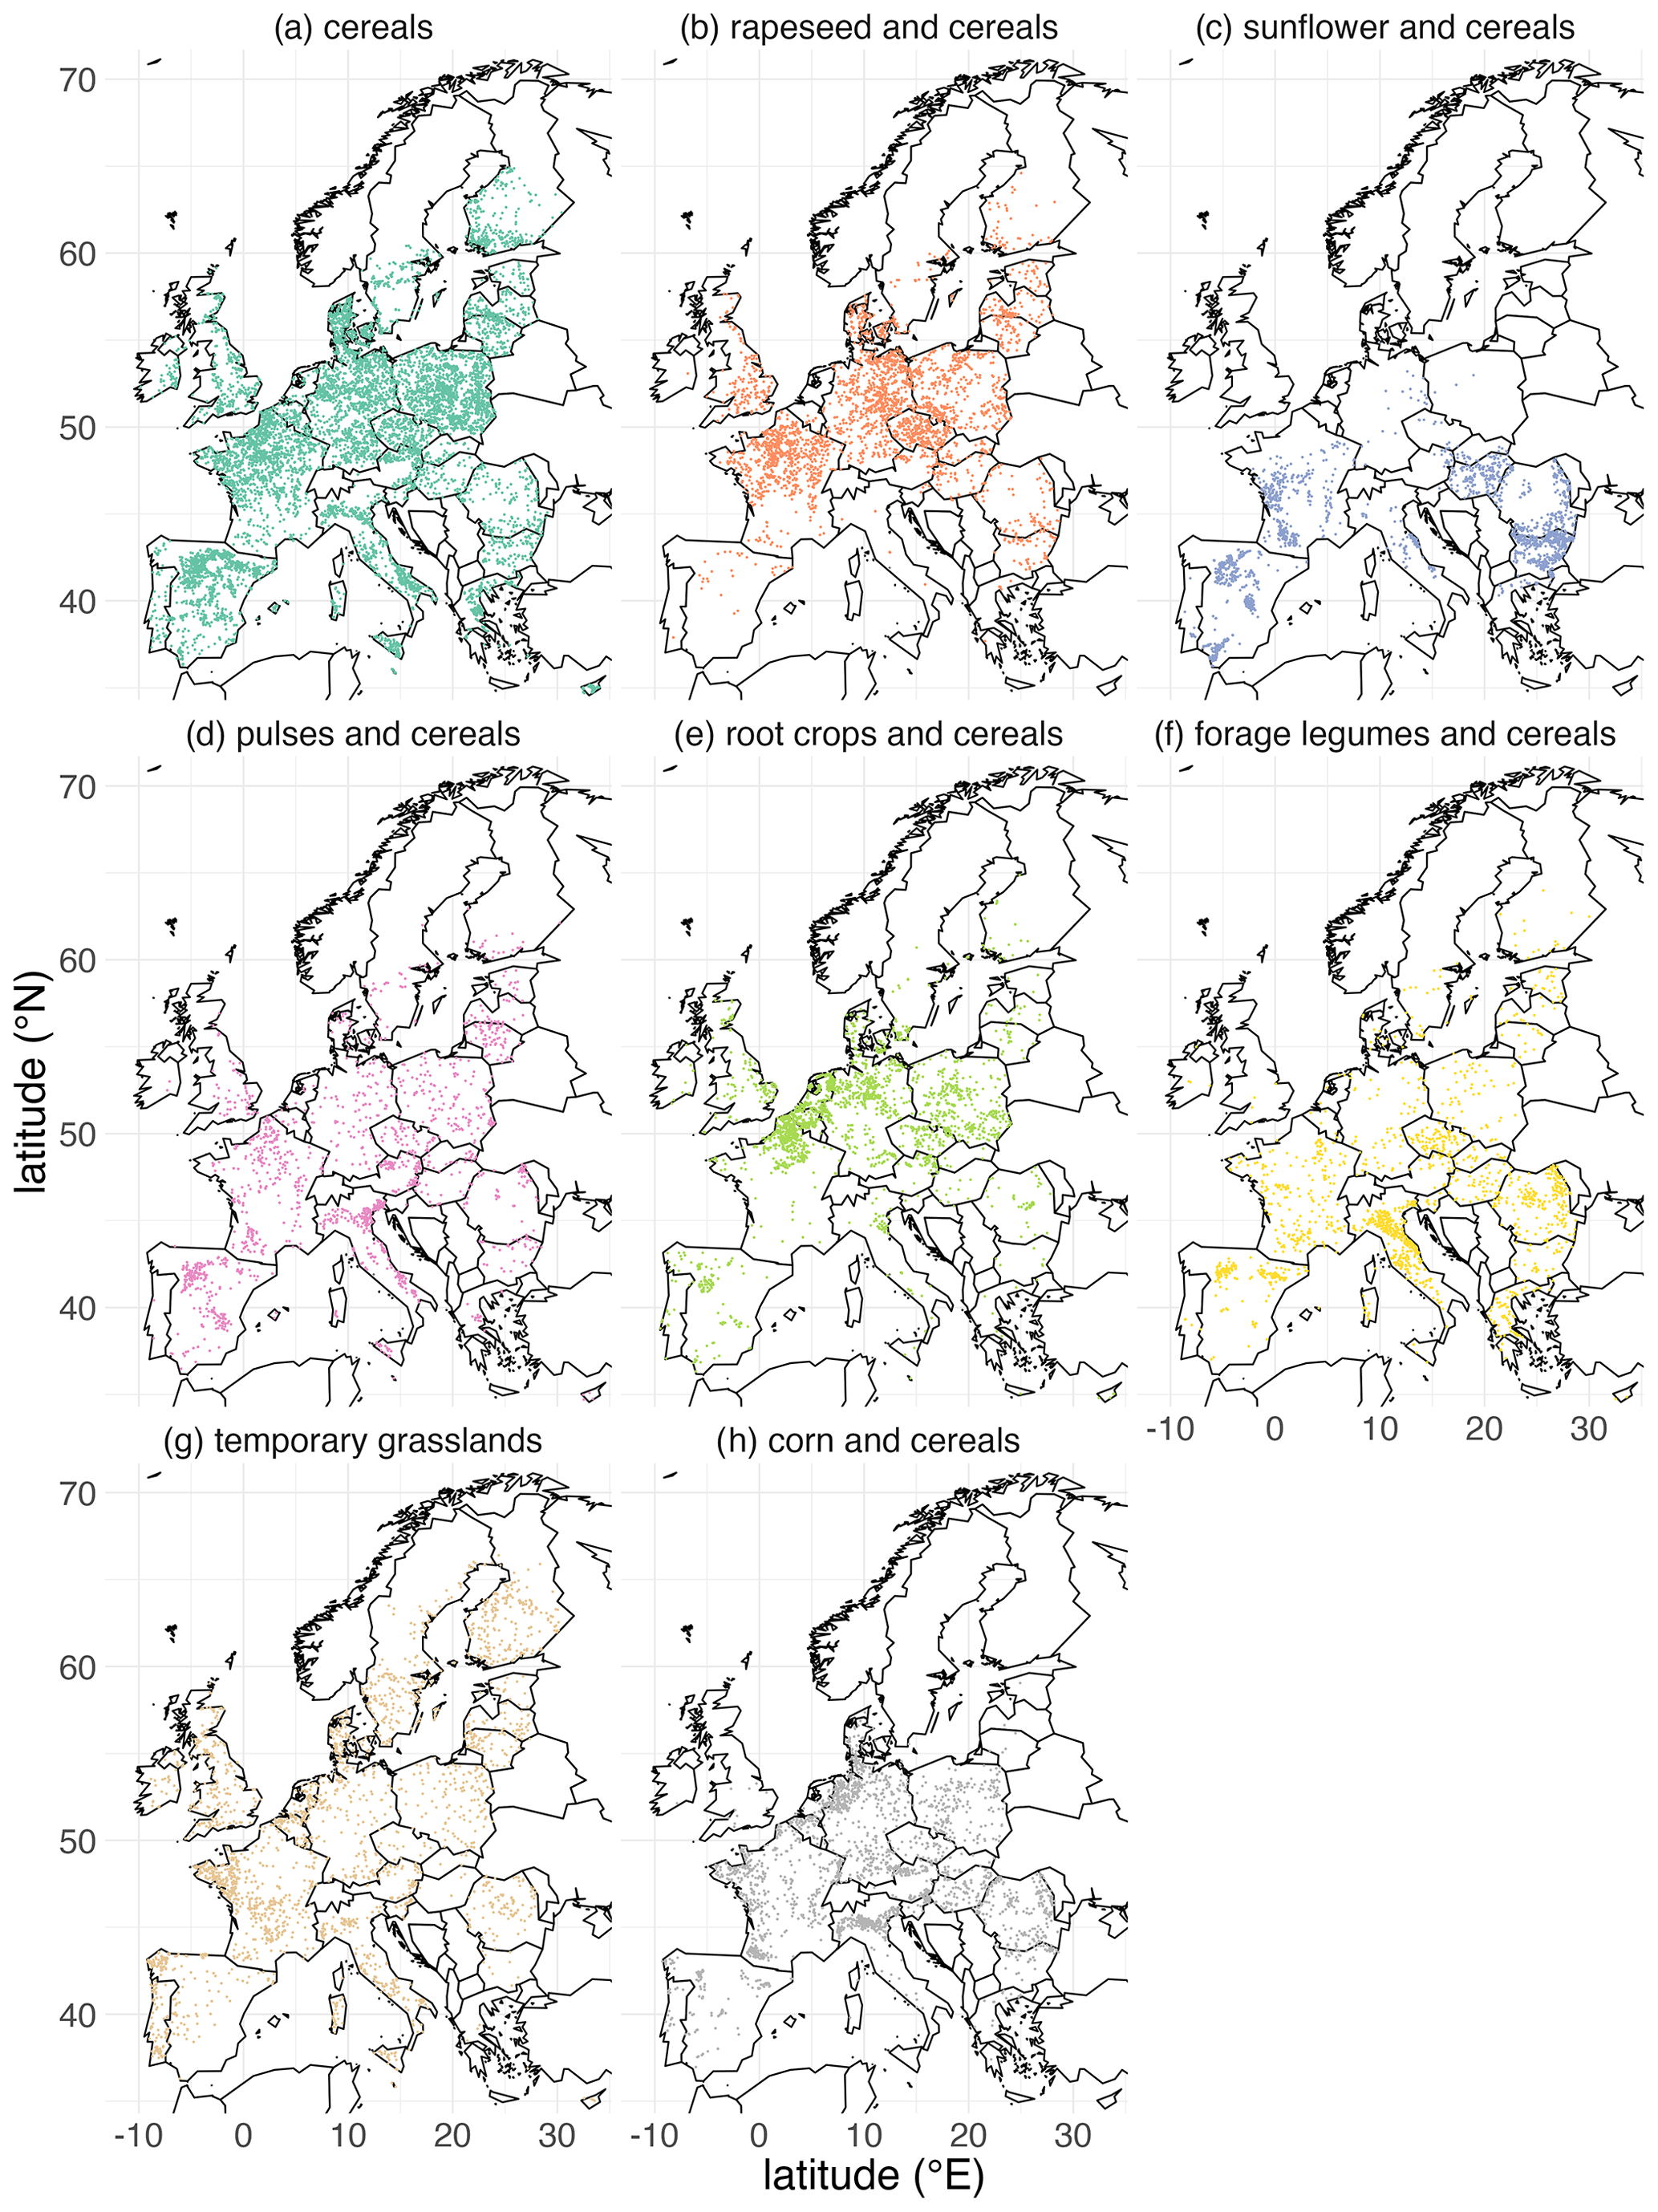
Figure 8Individual maps of crop sequence types in Europe based on the LUCAS dataset. Note that crop sequence types have been given short names that reflect dominant crops or groups of crops within the sequence. For example, the crop sequence type “grasslands” also includes cereals and corn, but these crops are less frequent in the sequence. The composition of each crop sequence type in terms of temporal frequencies of (groups of) crops is presented in Table 2.
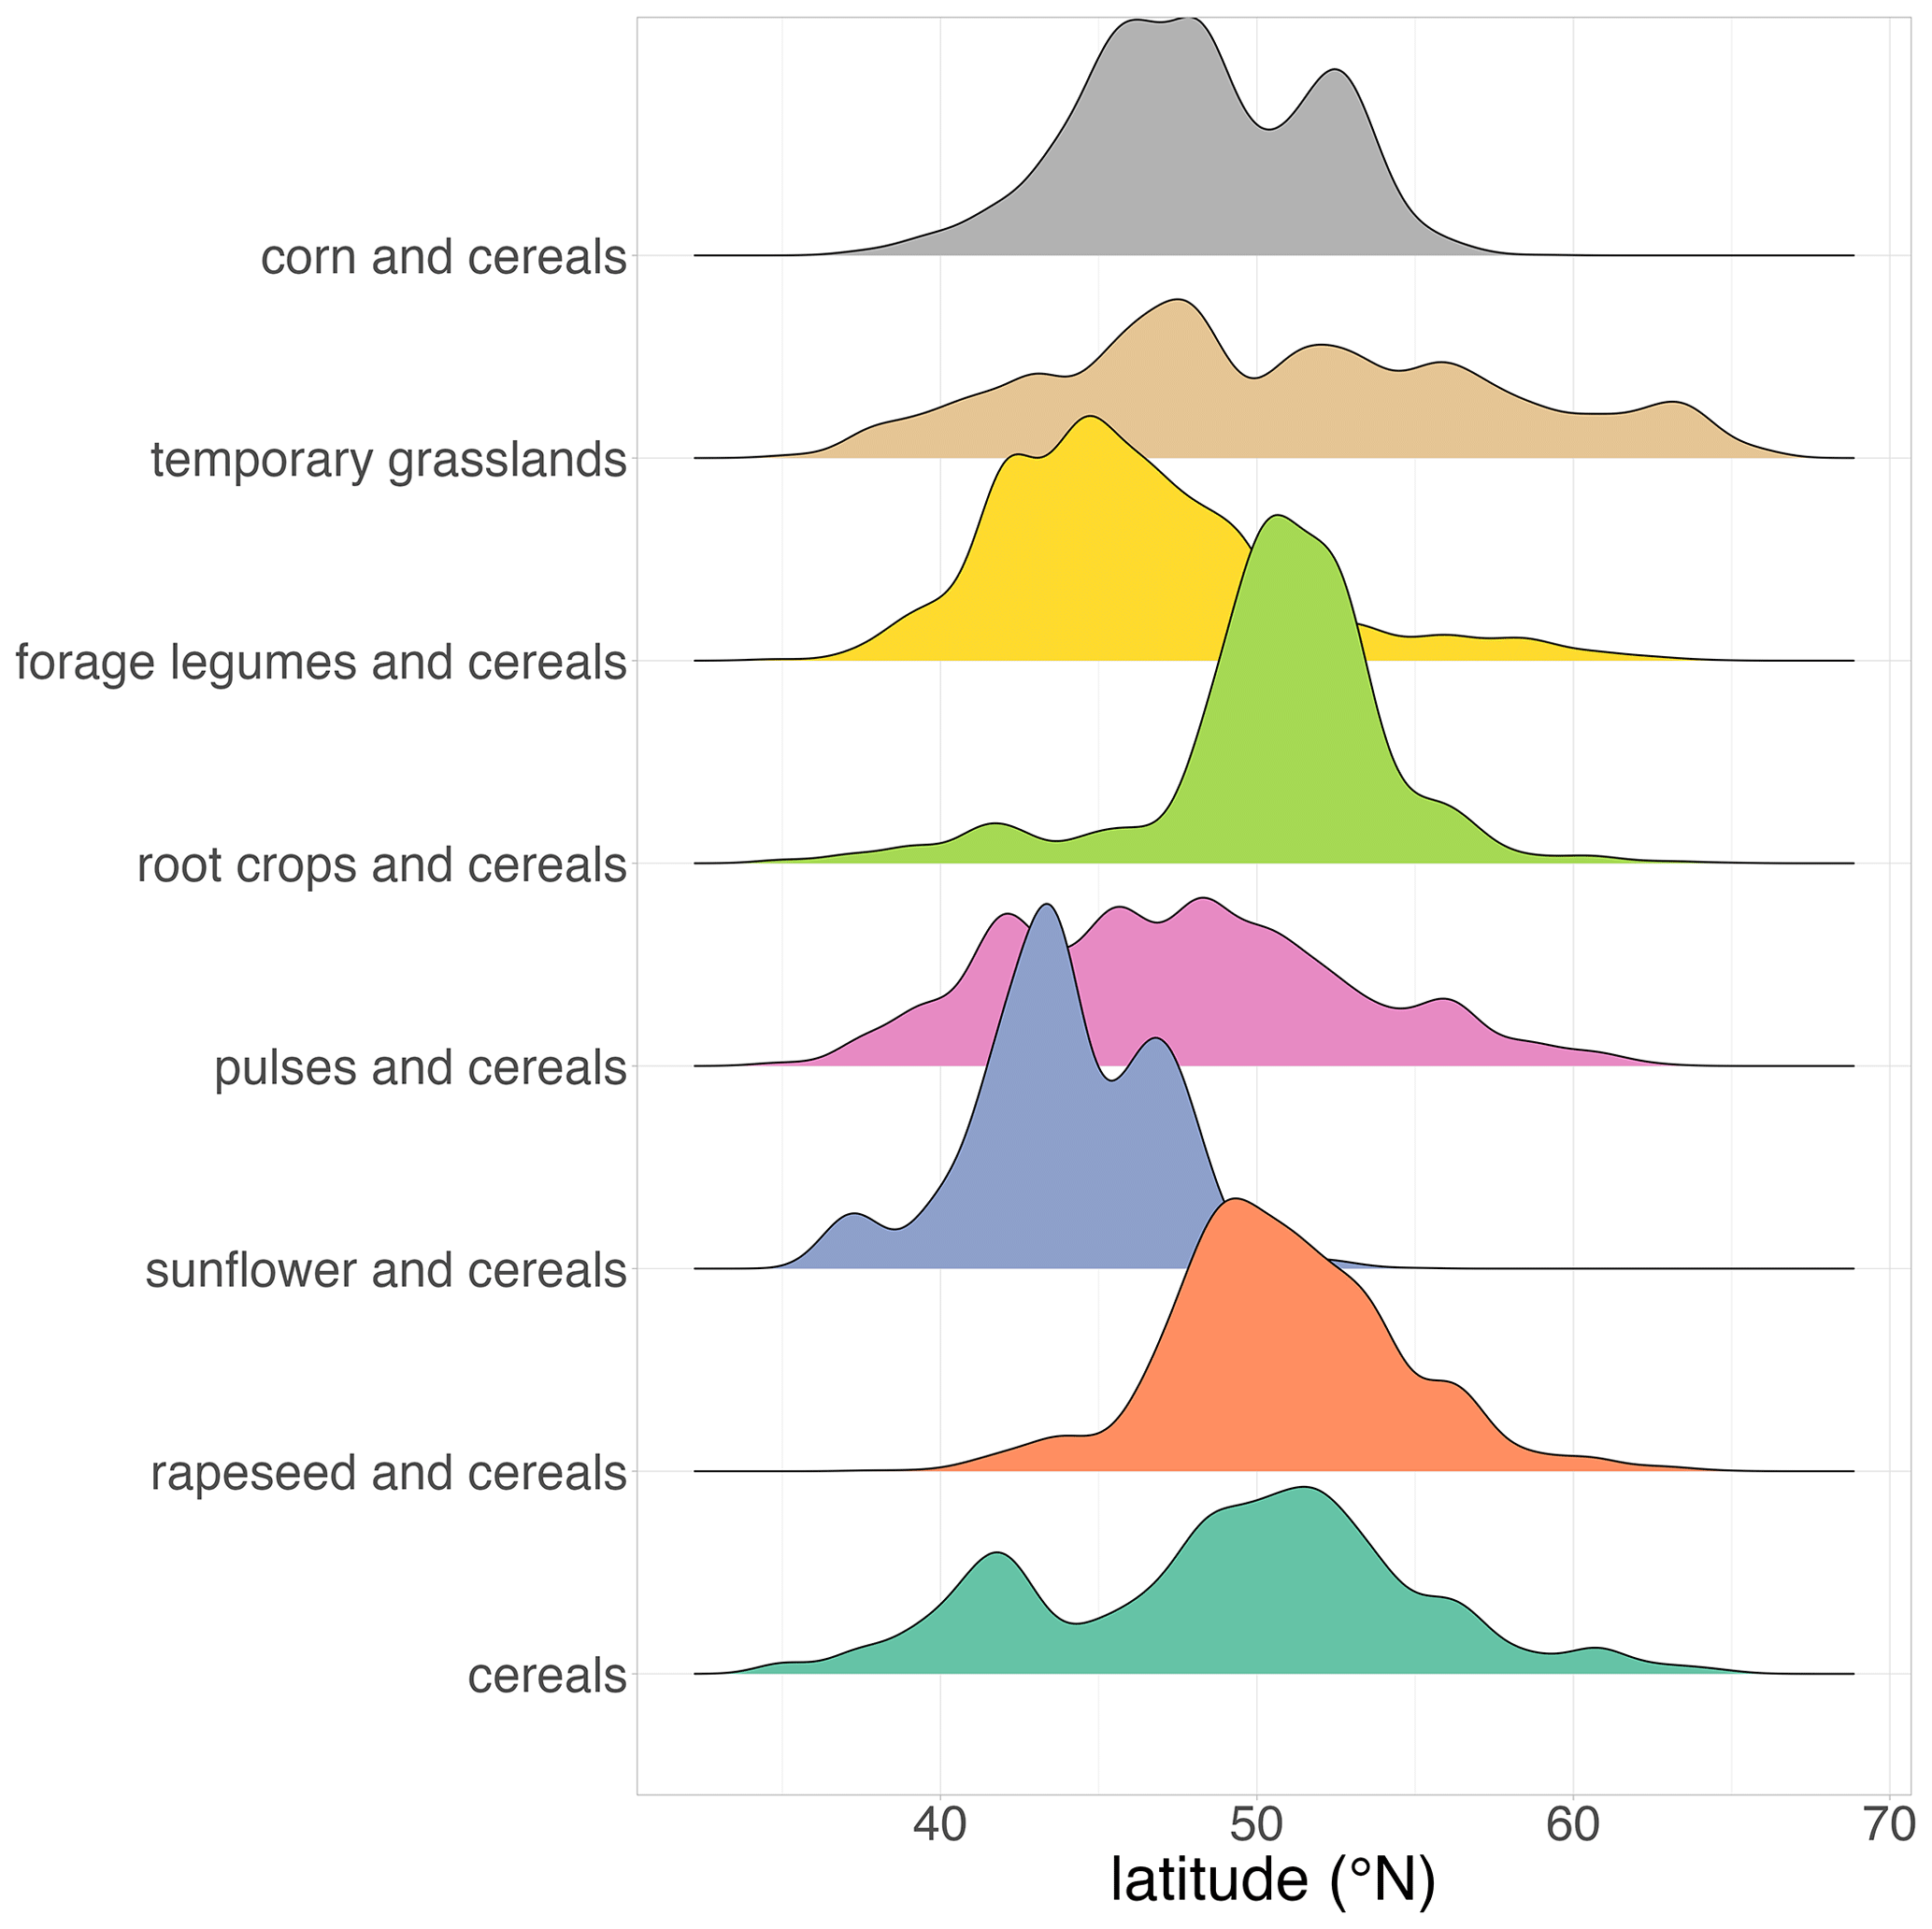
Figure 9Latitudinal distribution of crop sequence types based on the LUCAS dataset. Note that crop sequence types have been given short names that reflect dominant crops or groups of crops within the sequence. For example, the crop sequence type “grasslands” also includes cereals and corn, but these crops are less frequent in the sequence. The composition of each crop sequence type in terms of temporal frequencies of (groups of) crops is presented in Table 2.
Data described in this paper can be accessed at https://doi.org/10.5281/zenodo.7016986 (Ballot et al., 2022).
Code used to produce the data described in this paper as well as to create the figures and tables can be accessed at https://doi.org/10.5281/zenodo.7018283 (Ballot and Guilpart, 2022).
6.1 On the quality of the map of crop sequence types
The maps of crop sequence types derived from our study fill an important void in our knowledge of the spatial distribution of crop sequences in Europe. Despite them being based on incomplete data in both time and space (the LUCAS dataset), these maps have been shown to represent well the distribution of crop sequence types in France at both national and regional scales when compared to an almost spatially exhaustive dataset of temporally complete crop sequences. This consistency shows that the temporally incomplete information from LUCAS (i.e. only three crops known – 2012, 2015 and 2018 – from a 7-year crop sequence) is a good proxy to temporally complete crop sequences at regional to national scales, although individual sequence classification at the field scale may be prone to some bias. At least three different types of bias at the individual field level can be identified.
First, let us consider a 3-year cereal–beet–potato rotation, which is quite common in north-western Europe. This rotation may appear in the LUCAS dataset as cereal–cereal–cereal, beet–beet–beet or potato–potato–potato, depending on the crop at the time of observation, and may therefore be classified as the “cereals” or “root crops and cereals” crop sequence type. However, we believe that this individual field classification bias does not affect our results at larger scales, as all survey points are not likely to be synchronised in terms of crop sequence.
Second, the comparison with the French LPIS dataset revealed an underestimation of grassland crop sequences, which led to an overestimation of other crop sequence types (Fig. 3). A possible explanation for this underestimation could be the inability of the 3 sample years available in the LUCAS dataset (i.e. 2012, 2015 and 2018) to capture the full diversity of longer crop rotations, such as rotations including temporary grassland. For example, let us consider a cyclical crop rotation starting in 2012 with 3 years of consecutive grassland followed by wheat, wheat, maize and barley. Then, observations in 2012, 2015 and 2018 would be grassland, wheat and barley respectively, yielding a proportion of grassland of one-third instead of one-half. Another possible explanation could be that temporary grassland may sometimes be confused with permanent grassland during LUCAS observations as well as during farmer declarations in the French LPIS. In the LUCAS dataset, we decided to consider as temporary grasslands points observed as permanent grassland in 2018 but as non-perennial agricultural cover in 2012 and 2015. These points are more likely temporary grasslands confused with permanent ones. However, they could also be actual permanent grasslands after a perennial change in land use between 2015 and 2012. This may contribute to the underestimation of crop sequences with temporary grassland importance. As highlighted by previous research (e.g. Martin et al., 2020), crop sequences with temporary grasslands provide specific services such as carbon sequestration, biodiversity conservation or weed control. Future users of our dataset should therefore be aware that this underestimation of the importance of crop sequences with temporary grasslands may result in underestimation of such services as well as overestimation of the production from other overestimated crops.
Third, the reliability of our validation dataset also needs to be discussed. The French LPIS dataset is based on farmers' declarations, which may not be 100 % correct. The RPG Explorer algorithm, which compiles LPIS annual raw data into multi-annual crop sequence data, has been validated. However, it cannot be 100 % correct when identifying the most likely crop sequence and when more than one crop is declared per block. A robust estimation of farmer declaration error and how it could propagate to the crop sequence is challenging and could not be done in this study. However, to date, the dataset we used has been the most complete one regarding crop sequences in France.
Table 5Spatial sampling effort of LUCAS data by country. The sampling effort is quantified as the number of LUCAS points for which observations are available in 2012, 2015 and 2018 per unit area of arable land in 2018 by country as reported by EUROSTAT (2023).
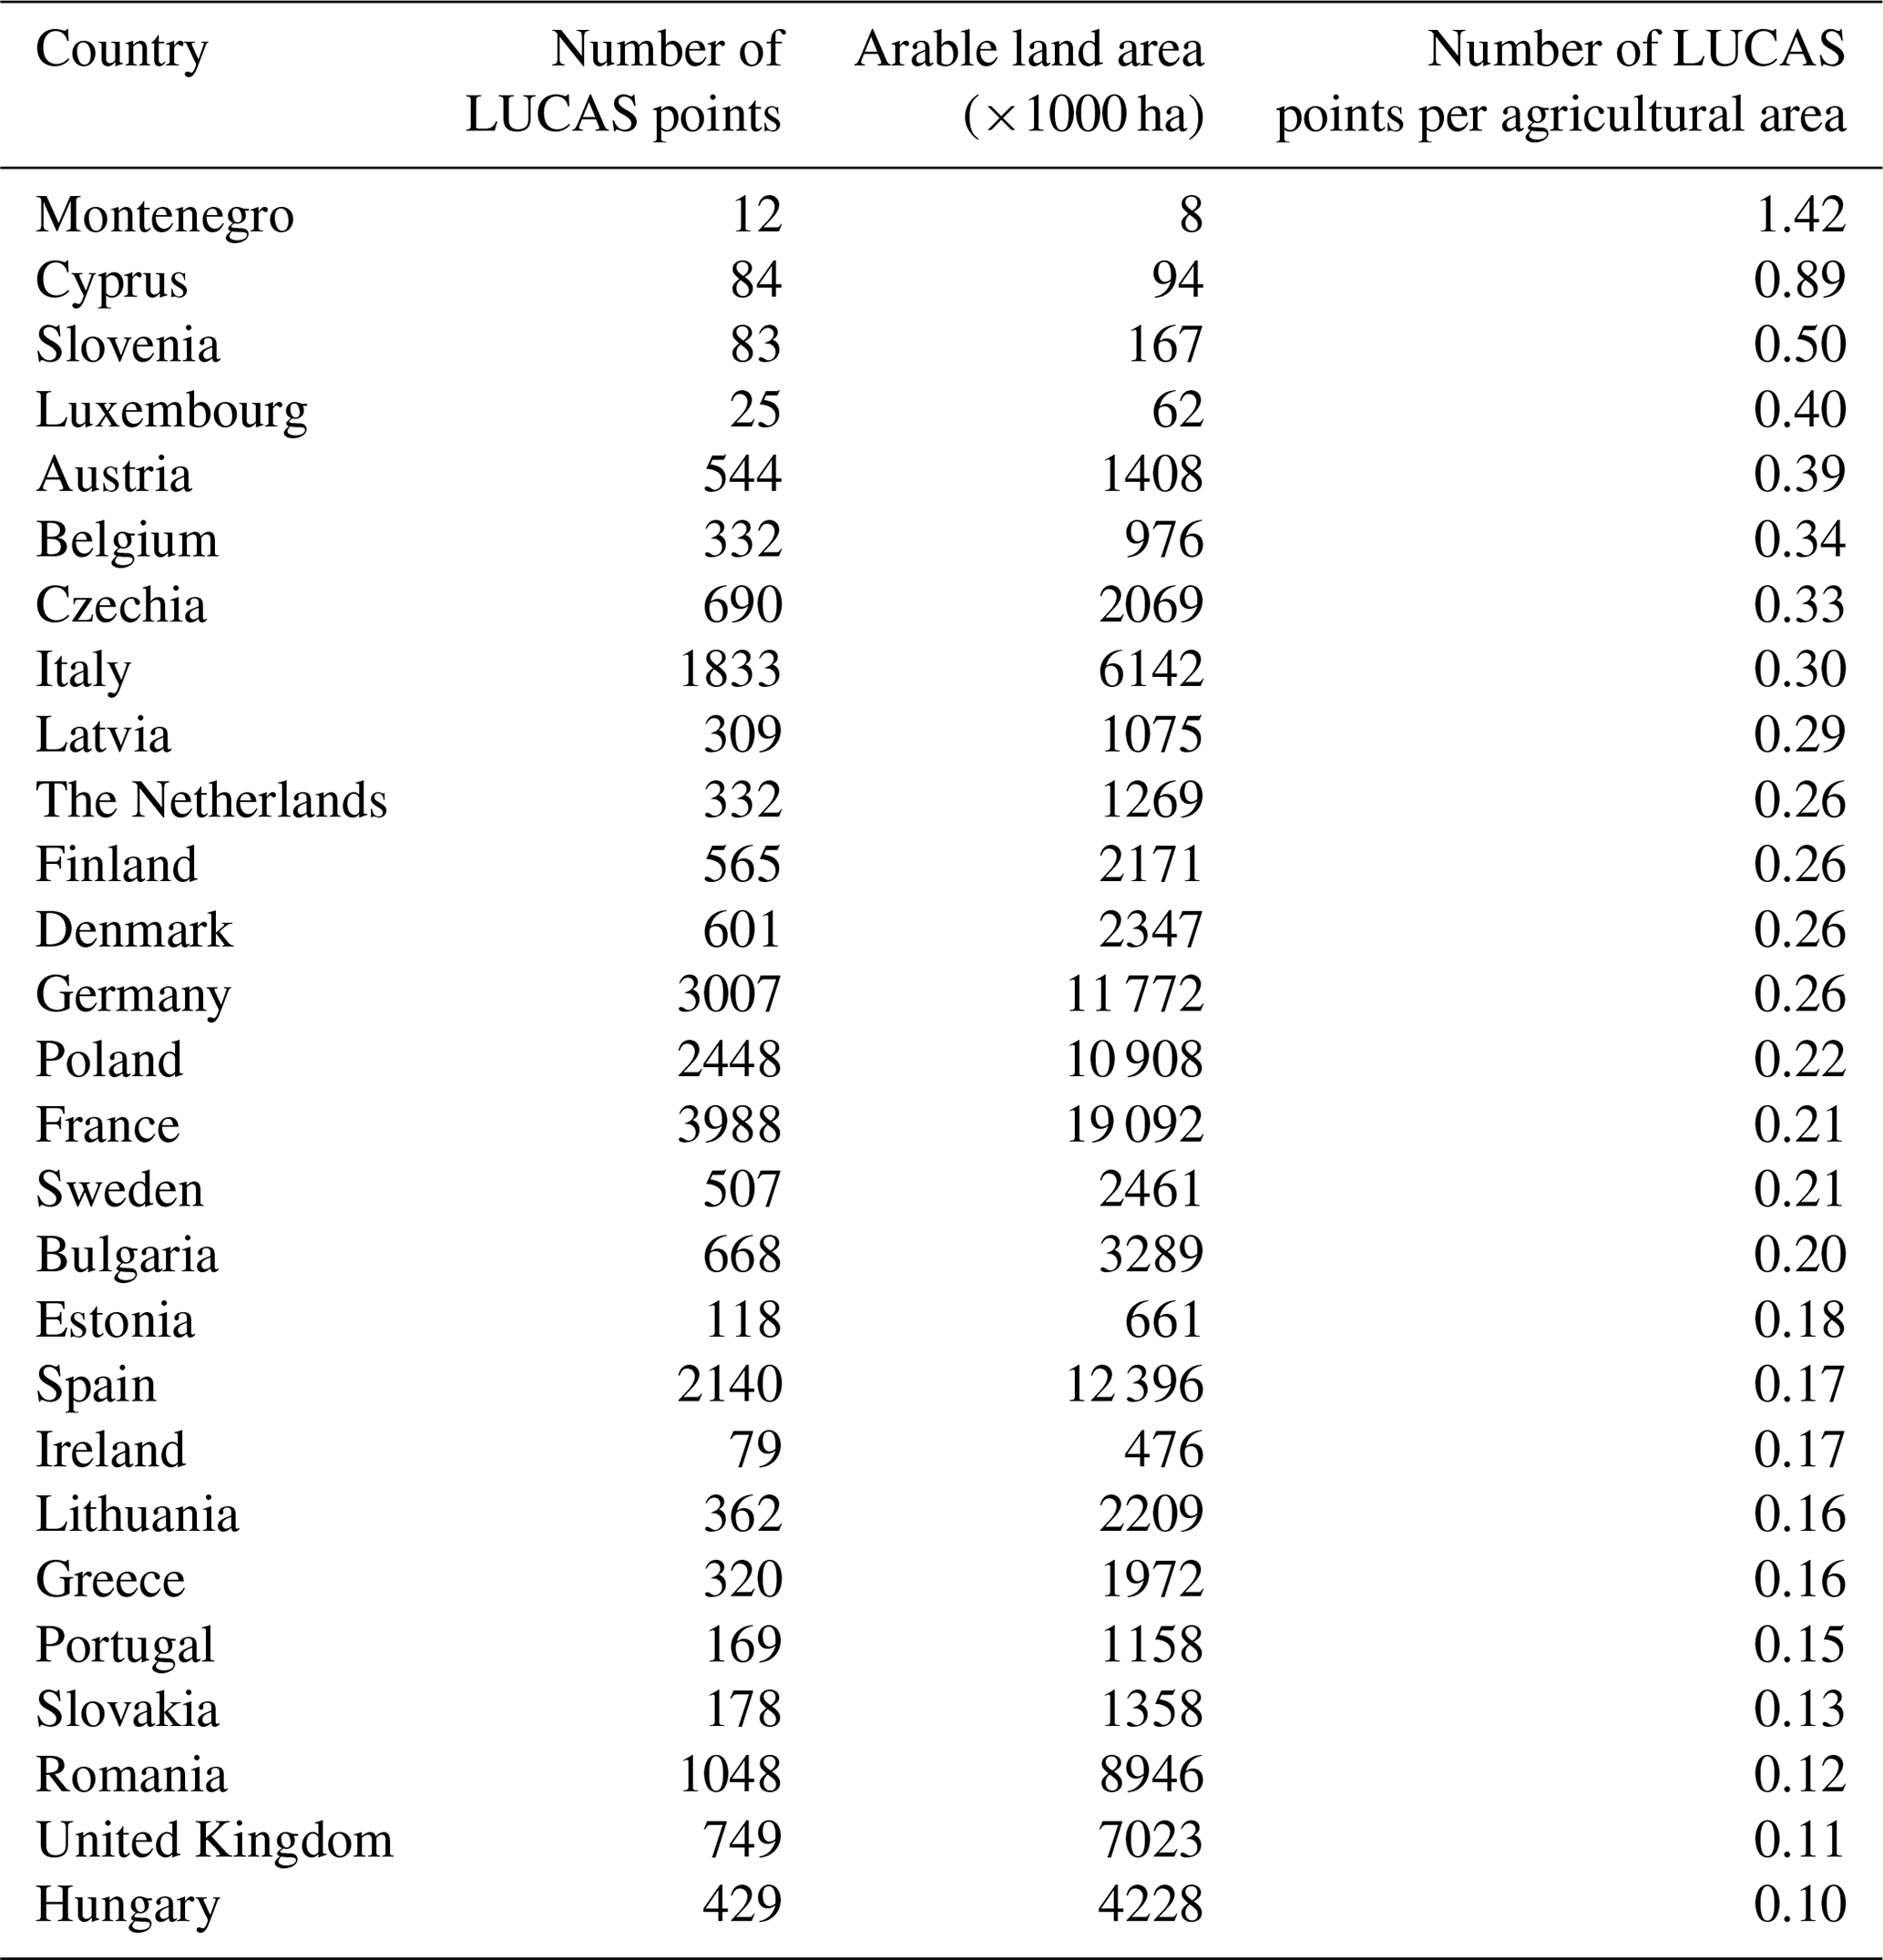
The comparison between land use derived from our map of crop sequence types and land use derived from official statistics revealed good consistency at the European level, except for some crop–country combinations. This could be partly explained by the spatial sampling effort of LUCAS data, which can be quantified as the number of LUCAS points per unit area of cropland by country. Analysis of this variable revealed important variation across countries, with the spatial sampling effort ranging from 0.10 (Hungary) to 1.42 (Montenegro) points per thousand hectares of cropland, with a median of 0.22 (Table 5). The accuracy of the map of crop sequence types should therefore be analysed in the light of this varying spatial sampling effort. For example, our results pointed to harvested areas overestimated or underestimated for most (groups of) crops for Romania, which displays a sampling effort lower than the median (0.12). On the other hand, Montenegro displays the highest sampling effort (1.42) but also an important discrepancy between estimated and observed harvested areas. Indeed, this high sampling rate hides a low number of observations (12) for small arable land. Thus, the map accuracy may be limited either by a low sampling effort or by a low number of observations in small-sized countries.
Lastly, we note that the quality assessment of our map of crop sequence types in the EU would benefit from comparisons with other datasets at national or sub-national levels in other countries. Nevertheless, we highlight that all crop sequence types are present in France, allowing for a complete quality assessment over the eight crop sequence types.
6.2 Perspectives
We assume our maps of crop sequences to be useful for future studies dealing with agricultural issues that are sensitive to crop rotations, including nature-based pest control (Lechenet et al., 2016), pesticide use intensity (Jacquet et al., 2011), nitrogen management and cycling (De Notaris et al., 2018), biodiversity (Li et al., 2021), soil carbon sequestration (King and Blesh, 2018), water resource management (Yang et al., 2015) and crop yield (Bennett et al., 2012). We also highlight that the methodology presented in this paper that leverages temporally incomplete information about crop sequences based on the LUCAS dataset can be adapted to specific objectives of future studies. For example, looking at the specific place of soybean within crop sequences in the EU would probably require us to consider this crop specifically instead of as part of the group “pulses”. Different indicators could also be calculated to describe different facets of crop sequences relevant to different ecosystem services. For example, the diversity of crop sowing dates is relevant to weed control (Weisberger et al., 2019), the crop functional diversity is relevant to nitrogen cycling when considering legume and non-legume crops (Zhao et al., 2022), the phylogenetic crop species diversity might be relevant or not to the control of pests and diseases depending on whether considered crop species are hosts of the same pests and diseases or not (e.g. wheat and barley vs. wheat and soybean) (Beillouin et al., 2021a), and the share of summer and winter crops is relevant to water management as water demand is usually higher during the summer. Here we chose the eight crops or groups of crops for their relevance to major agronomic issues (see Methods, Sect. 2.3.1). Cereals (wheat, barley, oat, triticale, rye) are all species of the Poaceae family, sharing similar features regarding their effects on crop sequences. For example, they all have straws with a relatively high C:N ratio, which contributes to limiting nitrogen availability for the subsequent crop when not exported from the field (Justes et al., 2009). Pulses (e.g. pea, faba bean, soybean) are all from the Fabaceae family and have the ability to fix nitrogen from the atmosphere, so that they are usually not fertilised with nitrogen and contribute to increasing nitrogen availability to subsequent crops thanks to the relatively low C:N ratio of their crop residues (Guinet et al., 2020). Root crops (beets and potatoes) may have a specific effect on the topsoil and subsoil structure as belowground organs are harvested (Gabarron-Galeote et al., 2019). Corn, sunflower and rapeseed are three widely grown crops and have specific characteristics, including low pesticide use for sunflower, high insecticide use for rapeseed (Urruty et al., 2016) and high irrigation requirements for maize, especially in the south of Europe (Senthilkumar et al., 2015). Forage legumes and temporary grasslands are commonly cultivated for at least 2 or 3 years and present numerous benefits, including controlling weeds (Martin et al., 2020).
We hope the methodology developed here will stimulate a more detailed description of crop sequences, in both time and space, and their effect on agricultural production and sustainability in future studies.
The supplement related to this article is available online at: https://doi.org/10.5194/essd-15-5651-2023-supplement.
RB and MHJ initiated the research. RB, MHJ and NG designed the research. RB performed the analysis with the help of NG. RB and NG wrote the manuscript with contributions from MHJ.
The contact author has declared that none of the authors has any competing interests.
Publisher's note: Copernicus Publications remains neutral with regard to jurisdictional claims made in the text, published maps, institutional affiliations, or any other geographical representation in this paper. While Copernicus Publications makes every effort to include appropriate place names, the final responsibility lies with the authors.
This work was supported by the LegValue project funded by the European Union's Horizon 2020 research and innovation programme under grant agreement no. 727672. Access to some confidential data, on which this work is based, has been made possible within a secure environment offered by CASD – Centre d'accès sécurisé aux données (ref. 10.34724/CASD).
This research has been supported by the European Union's Horizon 2020 framework programme (LegValue grant no. 727672).
This paper was edited by Chaoqun Lu and reviewed by three anonymous referees.
Aramburu Merlos, F. and Hijmans, R. J.: The scale dependency of spatial crop species diversity and its relation to temporal diversity, P. Natl. Acad. Sci. USA, 117, 26176–26182, https://doi.org/10.1073/pnas.2011702117, 2020.
Ballot, R. and Guilpart, N.: Code to classify harmonised LUCAS database by crop sequence type (1.2), Zenodo [code], https://doi.org/10.5281/zenodo.8123139, 2022.
Ballot, R., Guilpart, N., and Jeuffroy, M. H.: Harmonised LUCAS database classified by crop sequence type (1.0), Zenodo [data set], https://doi.org/10.5281/zenodo.7016987, 2022.
Barbieri, P., Pellerin, S., and Nesme, T.: Comparing crop rotations between organic and conventional farming, Sci. Rep., 7, 1–10, https://doi.org/10.1038/s41598-017-14271-6, 2017.
Barbieri, P., Pellerin, S., Seufert, V., and Nesme, T.: Changes in crop rotations would impact food production in an organically farmed world, Nat. Sustain., 2, 378–385, https://doi.org/10.1038/s41893-019-0259-5, 2019.
Barbieri, P., Pellerin, S., Seufert, V., Smith, L., Ramankutty, N., and Nesme, T.: Global option space for organic agriculture is delimited by nitrogen availability, Nat. Food, 2, 363–372, https://doi.org/10.1038/s43016-021-00276-y, 2021.
Beillouin, D., Ben-ari, T., and Makowski, D.: Evidence map of crop diversification strategies at the global scale, Environ. Res. Lett., 14, 123001, https://doi.org/10.1088/1748-9326/ab4449, 2019.
Beillouin, D., Ben-Ari, T., Malézieux, E., Seufert, V., and Makowski, D.: Positive but variable effects of crop diversification on biodiversity and ecosystem services, Glob. Change Biol., 27, 4697–4710, https://doi.org/10.1111/gcb.15747, 2021a.
Beillouin, D., Pelzer, E., Baranger, E., Carrouée, B., Cernay, C., de Chezelles, E., Schneider, A., and Jeuffroy, M. H.: Diversifying cropping sequence reduces nitrogen leaching risks, Field Crops Res., 272, 108268, https://doi.org/10.1016/j.fcr.2021.108268, 2021b.
Bennett, A. J., Bending, G. D., Chandler, D., Hilton, S., and Mills, P.: Meeting the demand for crop production: the challenge of yield decline in crops grown in short rotations, Biol. Rev., 87, 52–71, https://doi.org/10.1111/j.1469-185X.2011.00184.x, 2012.
Billen, G., Aguilera, E., Einarsson, R., Garnier, J., Gingrich, S., Grizzetti, B., Lassaletta, L., Le Noë, J., and Sanz-Cobena, A.: Reshaping the European agro-food system and closing its nitrogen cycle: The potential of combining dietary change, agroecology, and circularity, One Earth 4, 839–850, https://doi.org/10.1016/j.oneear.2021.05.008, 2021.
Bullock, D. G.: Crop rotation, CRC Cr. Rev. Plant Sci., 11, 309–326, https://doi.org/10.1080/07352689209382349, 1992.
Cantelaube, P. and Lardot, B.: Construction d'une Base de Données Géographiques à Échelle Fine Exhaustive Sur l'occupation Agricole Du Sol: Le “ RPG Complété ”, Partie 2: Attribution Des Cultures Aux Parcelles Susceptibles d'accueillir Les Surfaces Agricoles Hors RPG, https://hal.inrae.fr/hal-03818008, 2022.
Castellazzi, M. S., Wood, G. A., Burgess, P. J., Morris, J., Conrad, K. F., and Perry, J. N.: A systematic representation of crop rotations, Agr. Syst., 97, 26–33, https://doi.org/10.1016/j.agsy.2007.10.006, 2008.
d'Andrimont, R., Yordanov, M., Martinez-Sanchez, L., Eiselt, B., Palmieri, A., Dominici, P., Gallego, J., Reuter, H. I., Joebges, C., Lemoine, G., and van der Velde, M.: Harmonised LUCAS in-situ land cover and use database for field surveys from 2006 to 2018 in the European Union, Sci. Data, 7, 1–15, https://doi.org/10.1038/s41597-020-00675-z, 2020.
De Notaris, C., Rasmussen, J., Sørensen, P., and Olesen, J. E.: Nitrogen leaching: A crop rotation perspective on the effect of N surplus, field management and use of catch crops, Agr. Ecosyst. Environ., 255, 1–11, https://doi.org/10.1016/j.agee.2017.12.009, 2018.
Dury, J., Schaller, N., Garcia, F., Reynaud, A., and Bergez, J. E.: Models to support cropping plan and crop rotation decisions. A review, Agron. Sustain. Dev., 32, 567–580, https://doi.org/10.1007/s13593-011-0037-x, 2012.
European Commission – Farm to fork strategy: for a fair, healthy and environmentally-friendly food system, https://food.ec.europa.eu/horizontal-topics/farm-fork-strategy_en, last access: 26 August 2022.
EUROSTAT – Crop production (apro_cp), Reference Metadata in Euro SDMX Metadata Structure (ESMS), https://ec.europa.eu/eurostat/cache/metadata/en/apro_cp_esms.htm#stat_process1667900362727, last access: 27 February 2023.
Gabarron-Galeote, M. A., Hannam, J. A., Mayr, T., and Jarvis, P. J.: BEETSOIL: a decision support tool for forecasting the impact of soil conditions on sugar beet harvest, Soil Till. Res., 191, 131–141, https://doi.org/10.1016/j.still.2019.04.001, 2019.
Guilpart, N., Bertin, I., Valantin-Morison, M., and Barbu, C. M.: How much agricultural land is there close to residential areas? An assessment at the national scale in France, Build. Environ., 226, 109662, https://doi.org/10.1016/j.buildenv.2022.109662, 2022.
Guinet, M., Nicolardot, B., and Voisin, A.-S.: Provision of contrasted nitrogen-related ecosystem services among grain legumes, Agron. Sustain. Dev., 40,33, https://doi.org/10.1007/s13593-020-00637-0, 2020.
Jacquet, F., Butault, J.-P., and Guichard, L.: An economic analysis of the possibility of reducing pesticides in French field crops, Ecol. Econ., 70, 1638–1648, https://doi.org/10.1016/j.ecolecon.2011.04.003, 2011.
Janitza, S. and Hornung, R.: On the overestimation of random forest's out-of-bag error, PloS one, 13, e0201904, https://doi.org/10.1371/journal.pone.0201904, 2018.
Justes, E., Mary, B., and Nicolardot, B.: Quantifying and modelling C and N mineralization kinetics of catch crop residues in soil: parameterization of the residue decomposition module of STICS model for mature and non mature residues, Plant Soil, 325, 171–185, https://doi.org/10.1007/s11104-009-9966-4, 2009.
King, A. E. and Blesh, J.: Crop rotations for increased soil carbon: perenniality as a guiding principle, Ecol. Appl., 28, 249–261, https://doi.org/10.1002/eap.1648, 2018.
Kremen, C., Iles, A., and Bacon, C.: Diversified Farming Systems: An Agroecological, Systems-based Alternative to Modern Industrial Agriculture, Ecol. Soc., 17, 44, https://doi.org/10.5751/ES-05103-170444, 2012.
Lê, S., Josse, J., and Husson, F.: FactoMineR: an R package for multivariate analysis, J. Stat. Softw., 25, 1–18, https://doi.org/10.18637/jss.v025.i01, 2008.
Lechenet, M., Makowski, D., Py, G., and Munier-Jolain, N.: Profiling farming management strategies with contrasting pesticide use in France, Agric. Syst., 149, 40–53, https://doi.org/10.1016/j.agsy.2016.08.005, 2016.
Levavasseur, F., Martin, P., Bouty, C., Barbottin, A., Bretagnolle, V., Thérond, O., Scheurer, O., Piskiewicz, N.: RPG Explorer: A new tool to ease the analysis of agricultural landscape dynamics with the Land Parcel Identification System, Comput. Electron. Agr., 127, 541–552, https://doi.org/10.1016/j.compag.2016.07.015, 2016.
Li, M., Guo, J., Ren, T., Luo, G., Shen, Q., Lu, J., Guo, S., and Ling, N.: Crop rotation history constrains soil biodiversity and multifunctionality relationships, Agr. Ecosyst. Environ., 319, 107550, https://doi.org/10.1016/j.agee.2021.107550, 2021.
Liaw, A. and Wiener, M.: Classification and regression by randomForest, R News, 2, 18–22, 2002.
Martin, G., Durand, J.-L., Duru, M., Gastal, F., Julier, B., Litrico, I., Louarn, G., Médiène, S., Moreau, D., Valentin-Morison, M., Novak, S., Parnaudeau, V., Paschalidou, F., Vertès, F., Voisin, A.-S., Cellier, P., and Jeuffroy, M.-H.: Role of ley pastures in tomorrow's cropping systems. A review, Agron. Sustain. Dev., 40, 17, https://doi.org/10.1007/s13593-020-00620-9, 2020.
Martin, P., Rabenandrasana, N., Poméon, T., and Serard, P.: RPG Explorer Crop successions France 2007–2014, 2007–2019, 2015–2019 v2, DEP_NO_asp_filiation_19_07_seqs.csv, https://doi.org/10.15454/XH84QB, 2021.
Matthew, W.: Bias of the random forest out-of-bag (OOB) error for certain input parameters, Open J. Stat., 1, 3, https://doi.org/10.4236/ojs.2011.13024, 2011.
Meynard, J.-M., Charrier, F., Fares, M., Le Bail, M., Magrini, M.-B., Charlier, A., and Messean, A.: Socio-technical lock-in hinders crop diversification in France, Agron. Sustain. Dev., 38, 54, https://doi.org/10.1007/s13593-018-0535-1, 2018.
Nowak, B., Michaud, A., and Marliac, G.: Assessment of the diversity of crop rotations based on network analysis indicators, Agr. Syst., 199, 103402, https://doi.org/10.1016/j.agsy.2022.103402, 2022.
Peltonen-Sainio, P. and Jauhiainen, L.: Unexploited potential to diversify monotonous crop sequencing at high latitudes, Agr. Syst., 174, 73–82, https://doi.org/10.1016/j.agsy.2019.04.011, 2019.
Peltonen-Sainio, P., Jauhiainen, L., Honkavaara, E., Wittke, S., Karjalainen, M., and Puttonen, E.: Pre-crop values from satellite images for various previous and subsequent crop combinations, Front. Plant Sci., 10, 1–13, https://doi.org/10.3389/fpls.2019.00462, 2019.
Poux, X. and Aubert, P.-M.: An agroecological Europe in 2050: multifunctional agriculture for healthy eating, Findings from the Ten Years For Agroecology (TYFA) modelling exercise, Study No. 09/18, Paris, ISSN 2258-7535, 2018.
Renard, D. and Tilman, D.: Cultivate biodiversity to harvest food security and sustainability, Curr. Biol., 31, R1154–R1158, https://doi.org/10.1016/j.cub.2021.06.082, 2021.
Salembier, C., Elverdin, J. H., and Meynard, J.-M.: Tracking on-farm innovations to unearth alternatives to the dominant soybean-based system in the Argentinean Pampa, Agron. Sustain. Dev., 36, 1, https://doi.org/10.1007/s13593-015-0343-9, 2016.
Schott, C., Mignolet, C., and Meynard, J.-M.: Les oléoprotéagineux dans les systèmes de culture: évolution des assolements et des successions culturales depuis les années 1970 dans le bassin de la Seine, OCL, 17, 276–291, https://doi.org/10.1051/ocl.2010.0334, 2010.
Senthilkumar, K., Bergez, J.-E., and Leenhardt, D.: Can farmers use maize earliness choice and sowing dates to cope with future water scarcity? A modelling approach applied to south-western France, Agr. Water Manage., 152, 125–134, https://doi.org/10.1016/j.agwat.2015.01.004, 2015.
Stein, S. and Steinmann, H.-H.: Identifying crop rotation practice by the typification of crop sequence patterns for arable farming systems – A case study from Central Europe, Eur. J. Agron., 92, 30–40, https://doi.org/10.1016/j.eja.2017.09.010, 2018.
Tamburini, G., Bommarco, R., Wanger, T. C., Kremen, C., van der Heijden, M. G. A., Liebman, M., and Hallin, S.: Agricultural diversification promotes multiple ecosystem services without compromising yield, Sci. Adv., 6, 45, https://doi.org/10.1126/SCIADV.ABA1715, 2020.
Urruty, N., Deveaud, T., Guyomard, H., and Boiffin, J.: Impacts of agricultural land use changes on pesticide use in French agriculture, Eur. J. Agron., 80, 113–123, https://doi.org/10.1016/j.eja.2016.07.004, 2016.
Videla-Mensegue, H., Caviglia, O. P., and Sadras, V. O.: Functional crop types are more important than diversity for the productivity, profit and risk of crop sequences in the inner Argentinean Pampas, Agr. Syst., 196, 103333, https://doi.org/10.1016/j.agsy.2021.103333, 2022.
Weisberger, D., Nichols, V., and Liebman, M.: Does diversifying crop rotations suppress weeds? A meta-analysis, PLoS ONE 14, 1–12, https://doi.org/10.1371/journal.pone.0219847, 2019.
Wezel, A., Casagrande, M., Celette, F., Vian, J.-F., Ferrer, A., and Peigné, J.: Agroecological practices for sustainable agriculture, A review, Agron. Sustain. Dev., 34, 1–20, https://doi.org/10.1007/s13593-013-0180-7, 2014.
Xiao, Y., Mignolet, C., Mari, J. F., and Benoît, M.: Modeling the spatial distribution of crop sequences at a large regional scale using land-cover survey data: A case from France, Comput. Electron. Agr., 102, 51–63, https://doi.org/10.1016/j.compag.2014.01.010, 2014.
Yang, X., Chen, Y., Pacenka, S., Gao, W., Ma, L., Wang, G., and Steenhuis, T. S.: Effect of diversified crop rotations on groundwater levels and crop water productivity in the North China Plain, J. Hydrol., 522, 428–438, https://doi.org/10.1016/j.jhydrol.2015.01.010, 2015.
Zhao, Y., Tian, Y., Li, X., Song, M., Fang, X., Jiang, Y., and Xu, X.: Nitrogen fixation and transfer between legumes and cereals under various cropping regimes, Rhizosphere, 22, 100546, https://doi.org/10.1016/j.rhisph.2022.100546, 2022.