the Creative Commons Attribution 4.0 License.
the Creative Commons Attribution 4.0 License.
 | 08 Dec 2023
Hyperspectral reflectance of pristine, ocean weathered and biofouled plastics from a dry to wet and submerged state
Robin V. F. de Vries
Shungudzemwoyo P. Garaba
Sarah-Jeanne Royer
High-quality spectral reference libraries are important for algorithm development and identification of diagnostic optical characteristics of target objects in earth observation monitoring applications. We present additional measurements conducted using hyperspectral sensor technologies in a laboratory and an outdoor setting to further extend high-quality data as well as diversity in available open-access spectral reference libraries. These observations involved gathering hyperspectral single-pixel-point and multipixel optical properties of a diverse set of plastic materials (e.g., ropes, nets, packaging, and personal protective equipment). Measurements of COVID-19 personal protective equipment were conducted to also further expand spectral reference datasets that could be useful in remote sensing the mismanaged waste in the natural environment that was generated during the pandemic. The sample set consisted of virgin polymers and ocean weathered and artificially biofouled objects of varying apparent colors, shapes, forms, thicknesses, and opacity. A Spectral Evolution spectroradiometer was used to collect hyperspectral reflectance single-pixel-point information from 280 to 2500 nm. Imaging was also performed using a Specim IQ hyperspectral camera from 400 to 1000 nm. Sampling underwater was completed in intervals of 0.005–0.215 m within a depth range covering 0.005–0.715 m. All optical measurements are available in open access for the laboratory experiment via https://doi.org/10.4121/769cc482-b104-4927-a94b-b16f6618c3b3 (de Vries and Garaba, 2023) and an outdoor campaign involving the biofouling samples via https://doi.org/10.4121/7c53b72a-be97-478b-9288-ff9c850de64b (de Vries et al., 2023).
- Article
(19242 KB) - Full-text XML
- BibTeX
- EndNote


Aquatic plastic waste is a threat to the socioeconomics and health state of the blue planet (Barboza et al., 2018; Beaumont et al., 2019; UNEP, 2021). Therefore, it is essential to have an interdisciplinary strategy for understanding the challenges and complexities related to global pollution by plastic waste. Among key approaches of scientific evidence-based research, remote sensing has emerged as a potential tool that could support monitoring the sources and sinks of this aquatic plastic waste (Maximenko et al., 2019; Van Sebille et al., 2020; Martínez-Vicente et al., 2019). The potential application of remote sensing technologies is ongoing, and promising findings have been reported from laboratory or mesocosm (Goddijn-Murphy and Dufaur, 2018; Garaba et al., 2021), ship (de Vries et al., 2021), aircraft (Garaba et al., 2018), satellite-based studies (Park et al., 2021; Topouzelis et al., 2019), and sensitivity analyses that combine laboratory measurements with full radiative transfer computations to the top of the atmosphere (Garaba and Harmel, 2022).
At present, optical-based remote sensing methodologies gather multi- or hyperspectral radiometric quantities to investigate and determine diagnostic reflectance characteristics specific to plastic-based materials found in aquatic litter. The unique optical features in the visible to longwave infrared spectrum are essential as they help in developing algorithms for detecting or distinguishing plastics from other optically active components of the natural environment (Garaba et al., 2020; Tasseron et al., 2021a; Guffogg et al., 2021). Furthermore, collecting diverse measurements is important in further expanding open-access spectral reference libraries considering the variability of optically active materials in the natural environment. Such diverse and extensive spectral reference libraries composed of well-curated end-member information are invaluable. They can be used to match unknown spectra with known materials using robust statistical methods that evaluate the similarity in signal shape of the observed samples. Beyond spectral matching techniques, depth-related spectral reflectance datasets may be useful in methodology development for improved understanding of potential relationships with other physical parameters such as the buoyancy or windage effects on remote sensing of plastic litter. To this end, there are ongoing efforts to produce high-quality open-access spectral reference libraries to fill the scientific data gaps (Table 1).
Among recent studies (Table 1), submerged plastics were examined up to limited maximum depth ranges of 0.08 and 0.32 m (Leone et al., 2023; Knaeps et al., 2021). These depth ranges fall short of the reported surface layer top 5 m of the open ocean whereby most of the plastic litter has been harvested (Kooi et al., 2016; Law et al., 2014). It is therefore important to further explore the changes in optical properties of various plastics with depth considering the physiochemical diversity of the objects and transparency of the ocean in various geographic locations. Additionally, to improve the radiative transfer model solutions we therefore extended submerged observations to 0.715 m at finer resolution intervals to also support remote sensing sensitivity studies. The study of Leone et al. (2023) was conducted in parallel with this study, and the pristine plastic samples used in their study were created and provided by the authors of this study to enable intercomparison between datasets. Parallel measurement campaigns with identical samples can assist other researchers in the comparison of setups and bring valuable insights into the implications of study and instrumentation design.
In this study, we present a unique dataset that further expands on variability in existing open-access measurements by (i) increasing the depth resolution, including ranges at which submerged plastics were investigated, (ii) assessing the optical characteristics of active or freshly biofouled plastic samples, (iii) investigating reflectance properties using artificial laboratory-based as well as natural light in outdoor settings, (iv) sampling a diverse set of materials ranging from pristine, ocean weathered plastics to personal protective equipment, and (v) using a synergy of advanced technologies from imaging to point measurement tasks. The metadata attached to the measurements obtained in our study are anticipated to be of additional value in radiative transfer simulations aimed at understanding how remote sensing efforts could be affected by biofouling and the submersion of polymers.
Table 1Comparison of open-access spectral reference libraries containing plastic materials.

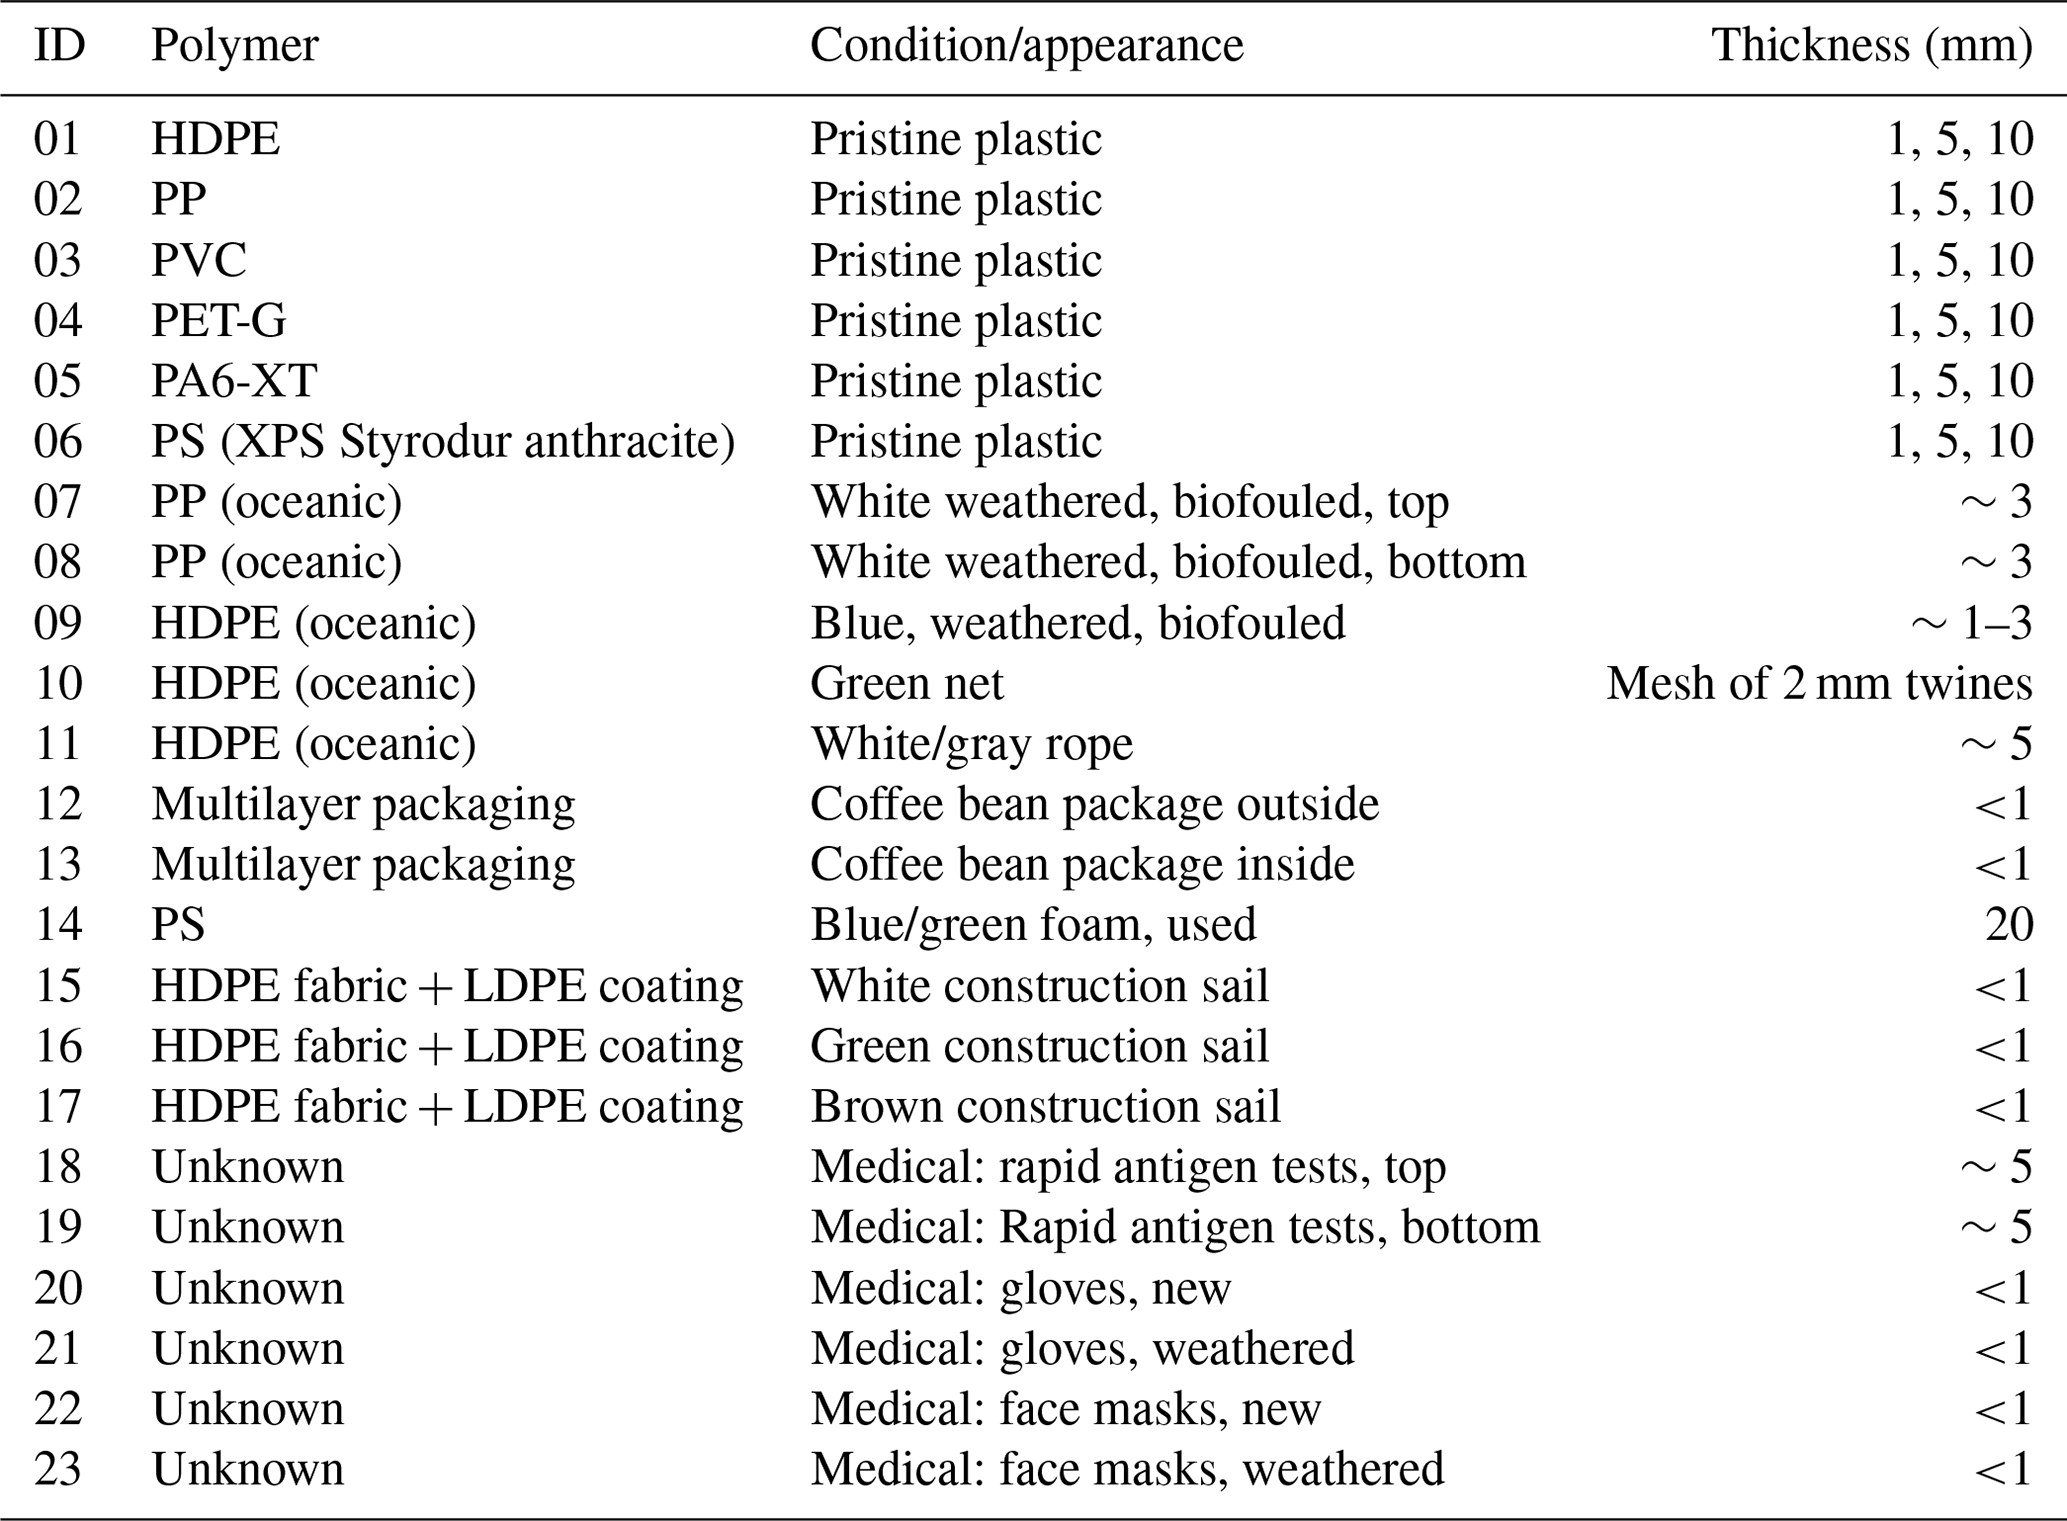
a Imaging and b point measurements. c Variation in sample thickness related to pristine samples. ABS: terpolymer lustran 752; FEP: fluorinated ethylene propylene Teflon; LDPE: low-density polyethylene; HDPE: high-density polyethylene; PA6: polyamide 6; PA6.6: polyamide 66; PA6-XT: polyamide 6 extruded; PE: polyethylene; PET: polyethylene terephthalate; PETa: polyethylene terephthalate amorphous; PETc: polyethylene terephthalate crystalline; PET-G: polyethylene terephthalate glycol; PMMA: polymethyl methacrylate; PO: polyolefin; PP: polypropylene; PS: polystyrene; PVC: polyvinyl chloride; and TPe: thermoplastic elastomers; XPS: expanded polystyrene.
2.1 Indoor laboratory experiment
2.1.1 Samples
A set of pristine plastics were selected as standard reference samples (Table 2; Fig. A1). The pristine samples included high-density polyethylene (HDPE), polypropylene (PP), polyvinylchloride (PVC), polyamide 6 (PA6), polyethylene terephthalate glycol (PET-G), and expanded polystyrene (XPS). The thickness of these pristine samples was 1, 5, and 10 mm for all materials. The polymer materials were chosen based on occurrence in rivers and oceans (e.g., Lebreton et al., 2018; GESAMP, 2019). These pristine samples had a fixed length and width of 0.3 × 0.3 m and were sourced from Steon Engineering Plastics in the Netherlands. XPS Styrodur® was obtained from Van Beek Art Supplies in the Netherlands.
Weathered fishing nets and plastic fragments (white and blue), harvested by The Ocean Cleanup System 001/B from the Great Pacific Garbage Patch (GPGP) in 2019 were included in the sample set for this study (Table 2; Fig. A1). A multilayer packaging bag was also included as weathered household waste.
The amount of waste associated with the COVID-19 pandemic was also considered relevant because the number of single-use items that were likely mismanaged could end up in the natural environment (Benson et al., 2021). The common single-use personal protective equipment was considered to be blue surgical gloves, surgical masks, and rapid antigen tests (RATs) (Table 2; Fig. A1).
Table 2Overview of pristine (1–6) harvested and weathered (7–16) samples. All pristine materials were square plates measuring 0.3 × 0.3 m. The other materials were irregular in shape but made large enough to ensure 100 % pixel coverage for the spectroradiometer.
2.1.2 Experimental setup
Single-pixel-point measurements were completed using a hyperspectral Spectral Evolution SR-3501 (SEV) spectroradiometer from the ultraviolet (UV; 280 nm) to shortwave infrared (SWIR; 2500 nm) wavelength with an 8∘ field-of-view lens attached. The sensor observes a circle-shaped pixel, centered in the middle of the sample, with an increasing diameter dependent on the height (h) that is the sensor-to-sample distance. Here the fixed sensor-to-water-surface distance was 0.398 m and the field of view α=8∘. Optical refraction effects in the water–air interface were presumed negligible because all observations were made from the nadir at a 0∘ viewing angle and in calm water conditions. The maximum swath size was reached at the 0.715 m depth and the radius was calculated using Eq. (1),
Relative reflectance was automatically determined at interpolated 1 nm spectral resolution by white referencing using a SphereOptics Zenith Polymer® SG3120 ≈99 % full material PTFE standard panel, consistent with prior studies (Knaeps et al., 2021; Leone et al., 2023; Garaba et al., 2021). White referencing was applied near the sample in a flat position and repeated regularly to optimize measurements. Stability of the halogen lamp was assumed to be sufficient for the indoor observations and relatively comparable to outdoor measurements using ambient sunlight. Each measurement was an average of 20 continuous scans. Reference true color images were obtained using a Nikon Coolpix W300 16 megapixel(MP) digital camera for each sample, except for the six homogeneous pristine plastic samples. The design and schematics, including photos of the indoor laboratory setup, are presented in Fig. 1.
From a subset of the studied materials, we collected imagery using a SPECIM IQ CMOS hyperspectral camera covering a wavelength range of 400–1000 nm with a spectral resolution of 7 nm. The camera consists of a 1.3 MP imager with a 40∘ field of view and a 5 MP viewfinder camera. SPECIM IQ imaging was done remotely using a USB connection to obtain real-time true color images and initiate hyperspectral imaging via the SPECIM IQ Studio version 2019.05.29.2 software. White referencing to determine relative reflectance was completed using a standard white panel supplied by SPECIM IQ. The experimental setup, including the captured hyperspectral and viewfinder RGB images, is shown in Fig. 2.
2.1.3 Sample fixation and submergence
As illustrated in Fig. 1, an aluminum pipe connected the sample holder to the main frame, allowing depth adjustments by unclamping, moving, and clamping the cylinder. The structure also provided movable mounting points for the spectroradiometer and imaging sensors. The frame itself could move along two rails on top of the tank. MOTIP black primer was sprayed on the frame to mitigate background or stray light. The target area was illuminated by two ARRI Arrilite 750 Plus 575 W HPL halogen tungsten lamps positioned at 1.80 m above ground level directed at ∼ 45∘ off the nadir on both sides of the tank (Fig. 1). A 0.3 × 0.3 m sample holder fixed the samples at progressive depths. To prevent sample buckling and consequent irregularities in the depth measurement, thin samples were further fixed by a glass window on top. All samples were supported by a 0.3 × 0.3 × 0.05 m black aluminum plate. The black aluminum plate was first abrased by 300-grain sandpaper, cleaned, degreased, and painted with a base layer of MOTIP EAN 8711347206407 black primer and then two layers of the blackest acrylic paint in the world, Black 3.0. The tank was filled with freshwater.
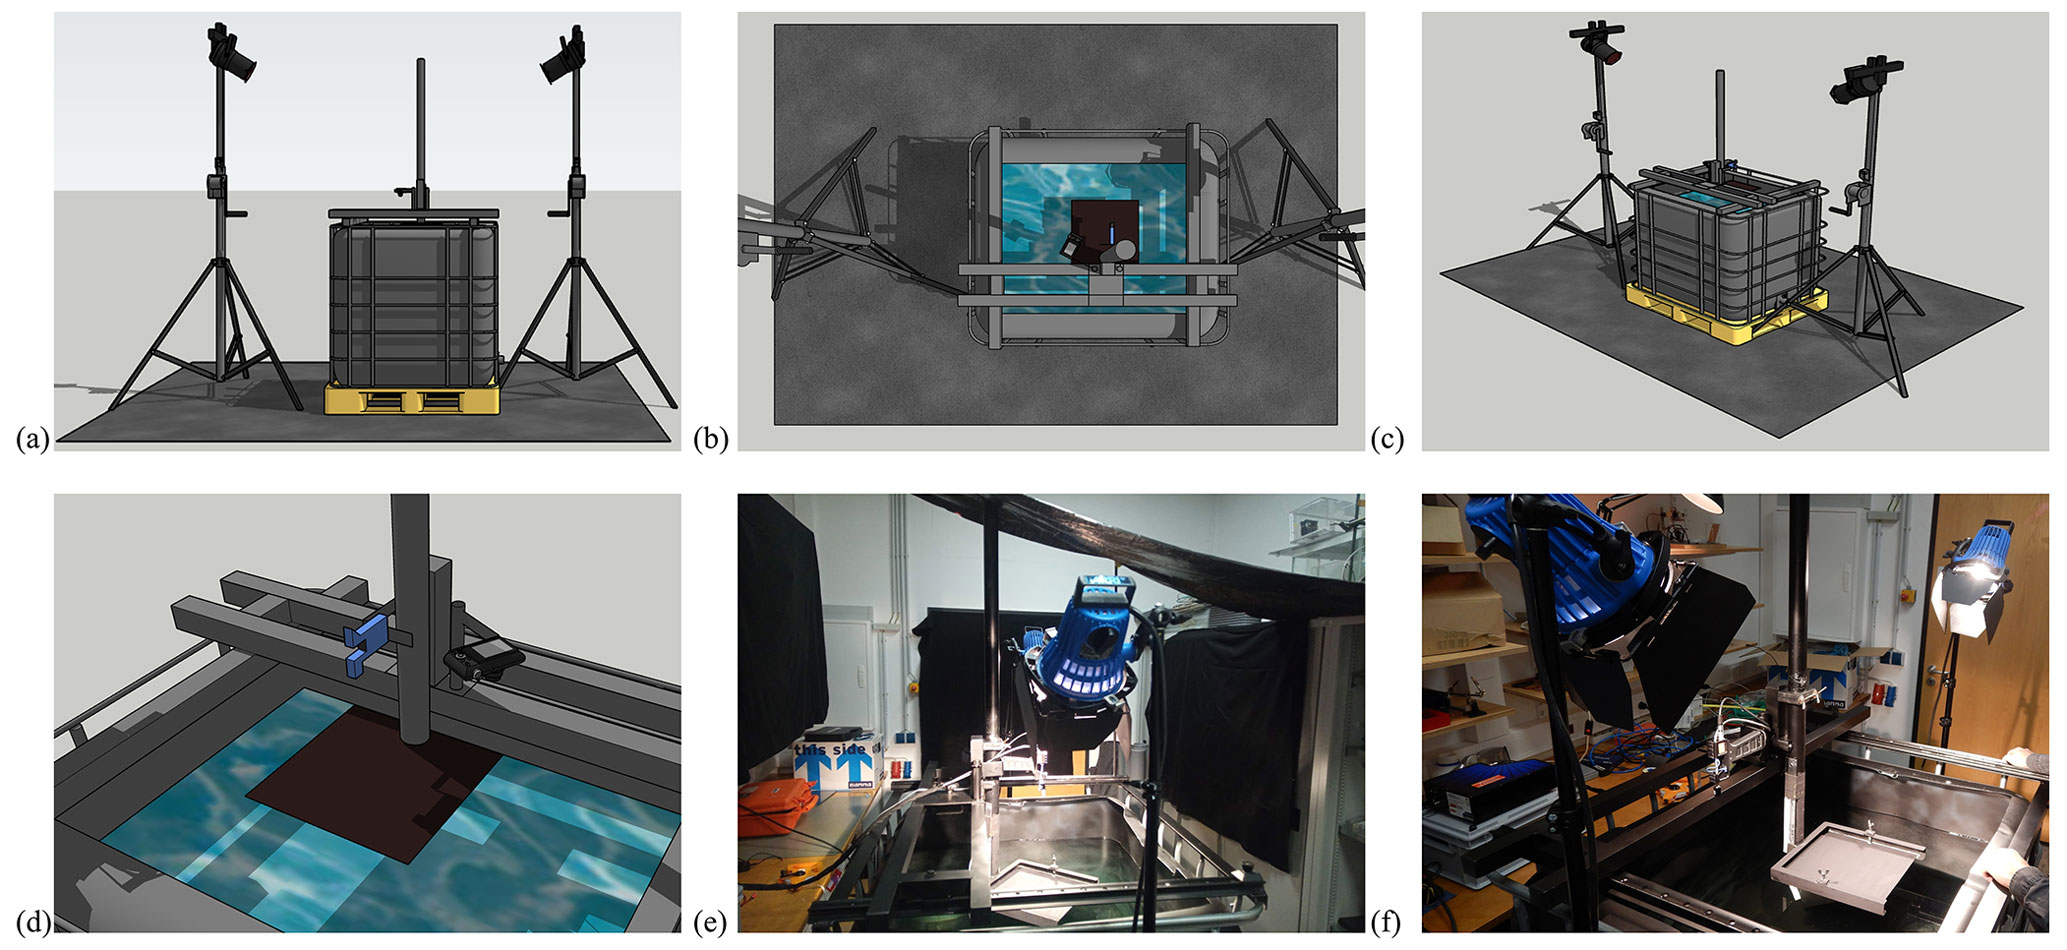
Figure 1Panels (a–d) show the schematics and (e, f) true color photos of the laboratory-based experimental setup with a dark container used to store the freshwater for submerged reflectance measurements. Background walls and frames were covered with dark fabric to mitigate stray light. Halogen tungsten lamps were used to provide artificial lighting above the tank at a ∼ 45∘ nadir viewing angle.
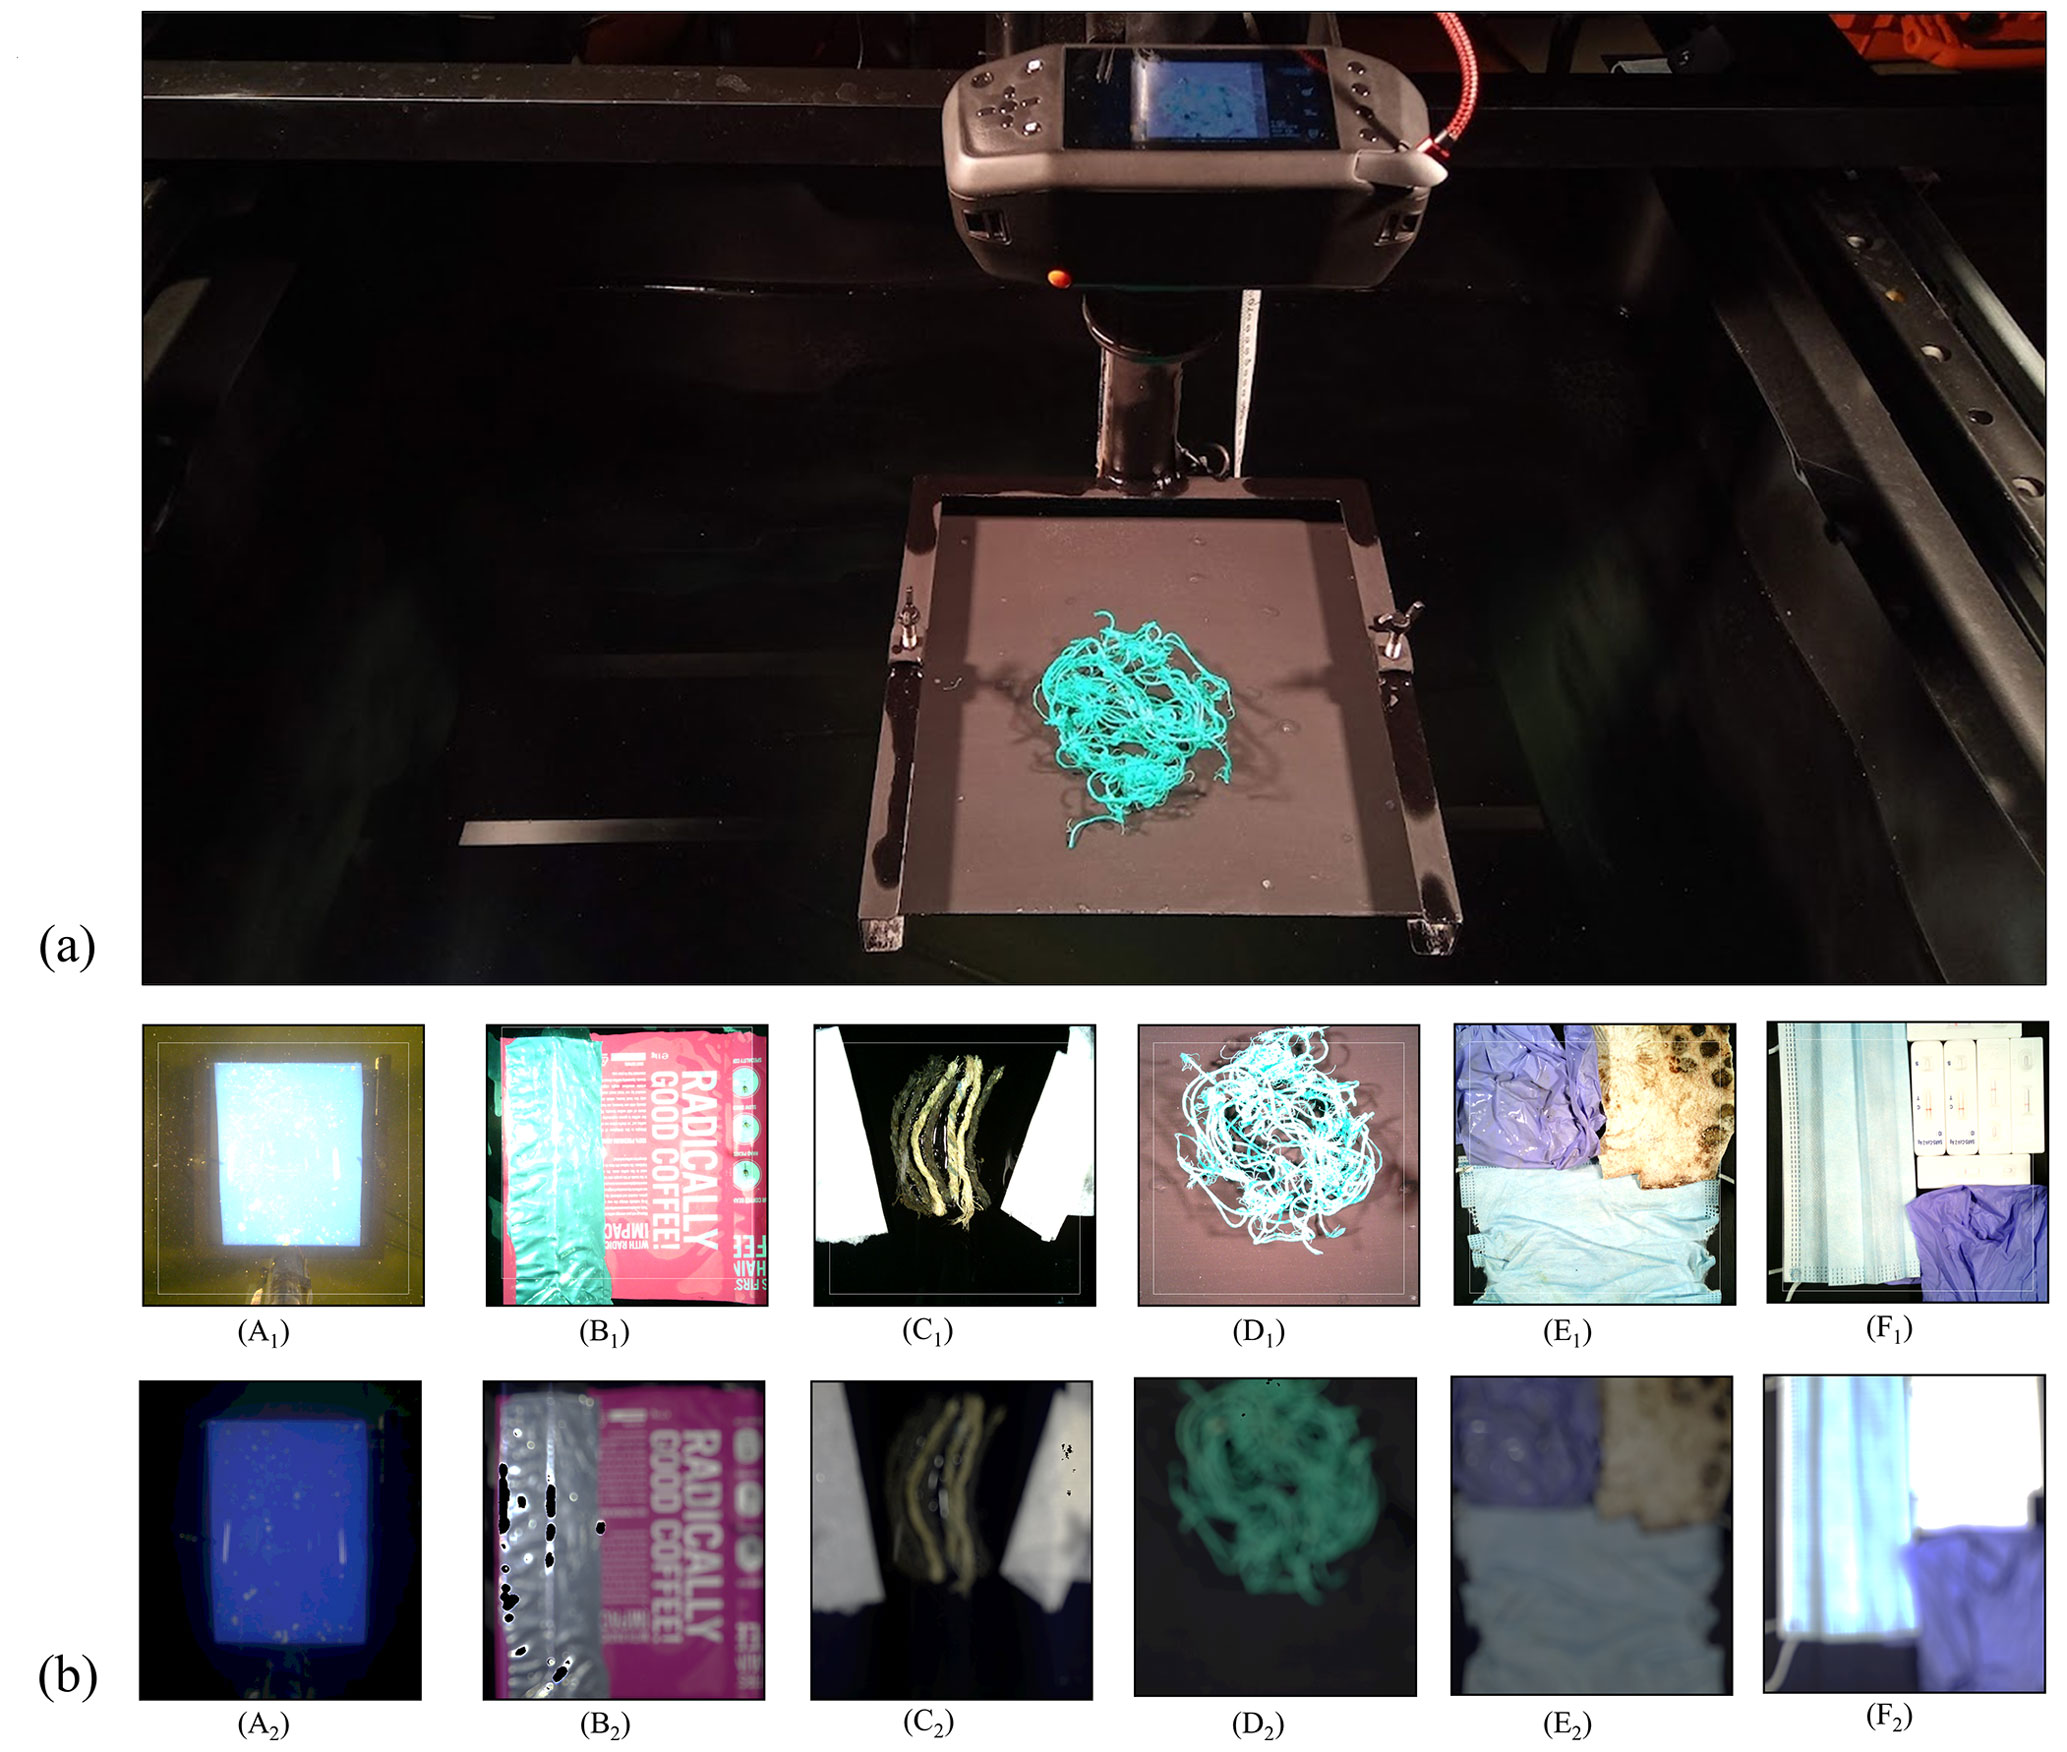
Figure 2Panel (a) shows the SPECIM IQ camera, positioned over one of the samples, and (b) the samples that were recorded by the SPECIM IQ. Subscript (1) denotes the image taken from the viewfinder and subscript (2) denotes the RGB composite from the SPECIM hypercube. The samples were as follows: weathered ocean blue plastic front side (A); multilayer packaging, inside and outside combined (B); ocean rope (C); ocean green net (D); a composite of old medical gloves, an old medical face mask, and white ocean plastic (E); and a composite of a new face mask, a new medical glove, and rapid antigen tests (F).
2.1.4 Sampling procedures
Observations involved taking a measurement starting with the dry samples followed by intervals of submersion to depth, then finally just an above-water scenario of the wet target. The protocol was adopted from a prior study (Knaeps et al., 2021).
2.1.5 Processing, data structures, and analyses of measurements
Raw data files from spectral measurements were converted into a PostgreSQL 14 database. The data structure was generated to combine all essential metadata (Fig. 3). Custom scripts in Python 3.8.8 with Matplotlib 3.3.4 and Pandas 1.2.4 libraries were used to visualize the data. No additional processing was applied to the data.
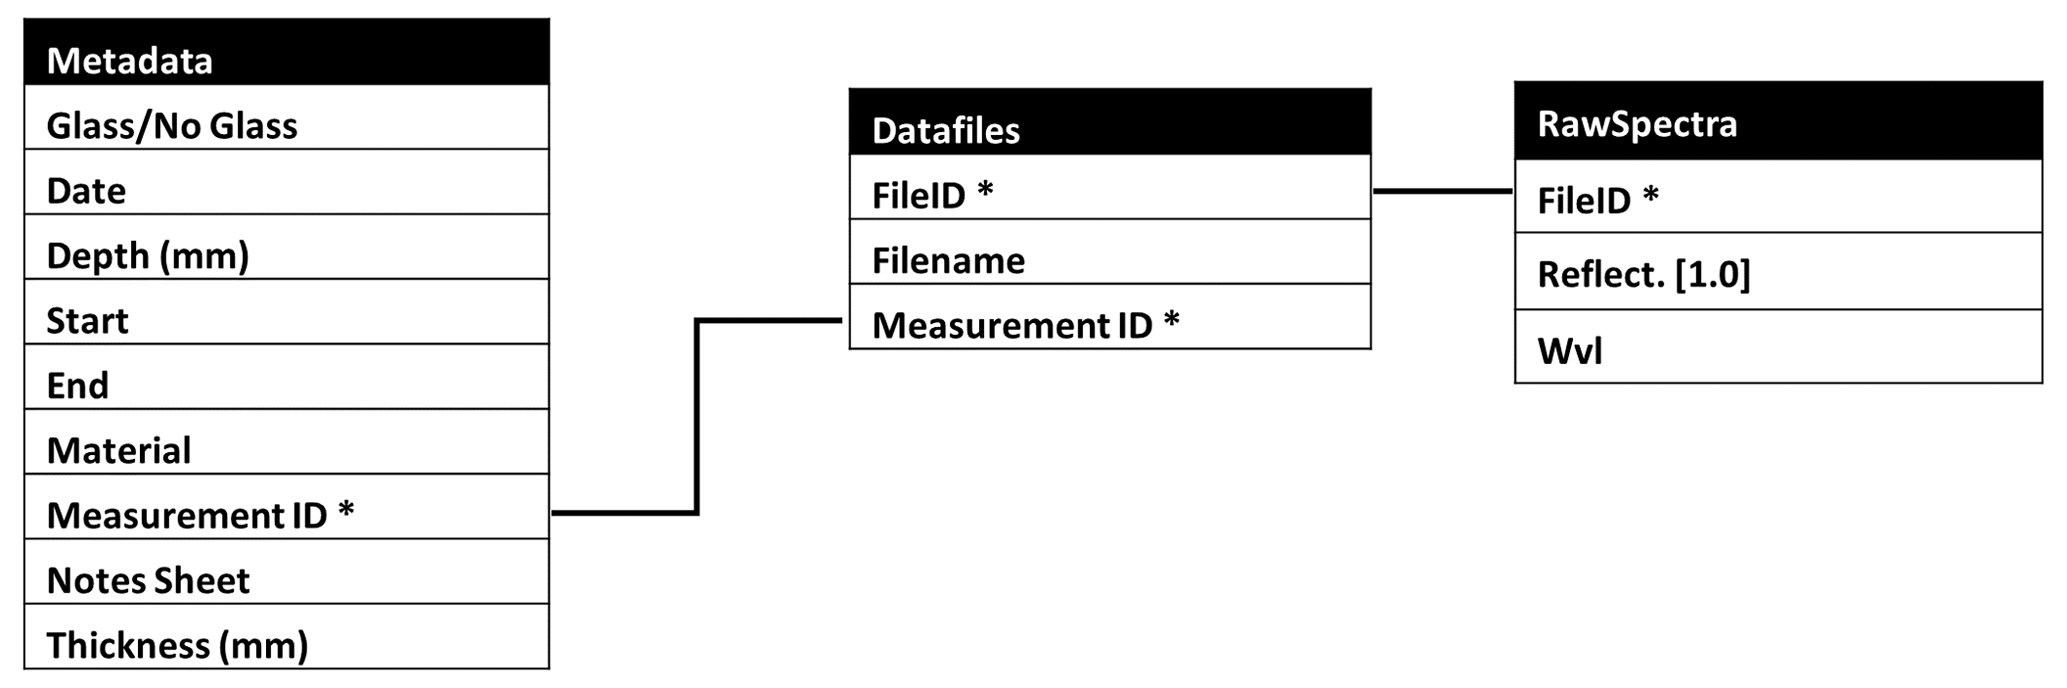
Figure 3Data structure diagram for the hyperspectral measurement dataset. The table “RawSpectra” contains the full set of raw data tables, concatenated from individual data files. The Metadata table contains the registration for each measurement and is linked to the RawSpectra through the Datafiles table. A measurement ID from the Metadata table can have multiple FileIDs in the datafiles table. This also allows easy selection and aggregation of duplicate measurements for averaging and statistics.
2.2 Outdoor mesocosm campaign
2.2.1 Samples and biofouling
Biofouling is ubiquitous in all-natural aquatic environments, but replicating it is a challenging task that requires a delicate balance of environmental parameters. To understand how biofouling influences the detectability of plastics from remote sensing optical technologies, we conducted a long-term mesocosm experiment within a flow-through aquaculture system on the subtropical island of O'ahu in Hawai'i, USA. The samples were pristine panels of HDPE, PP, PVC, PA6, PET-G, and XPS, similar to polymers described before (Sect. 2.1.1). The panels were kept submerged in seawater to allow the biofilm to grow for 88 d from 15 June to 11 September 2022 (Fig. 4). During the incubation time, environmental parameters, such as pH, chlorophyll-a (Chl-a), salinity, nitrates, and phosphates, were monitored weekly while light properties (ultraviolet A (UVA), ultraviolet B (UVB), and photosynthetically active radiation (PAR)), dissolved oxygen, seawater temperature, and air temperature were recorded at higher temporal resolutions (days to minutes).
After the incubation period of 88 d, the samples were carefully transported from the flow-through aquaculture system in containers filled with seawater to the study site. Since the measurement campaign took place at a different location and due to the fragility of the biofilm and quick disintegration and decomposition when left out of the water, the samples were submerged in an adjacent seawater tidal canal to preserve the biofilm intact during the experiment. Each panel surface was observed to exhibit a unique biofilm distribution (Fig. A2).
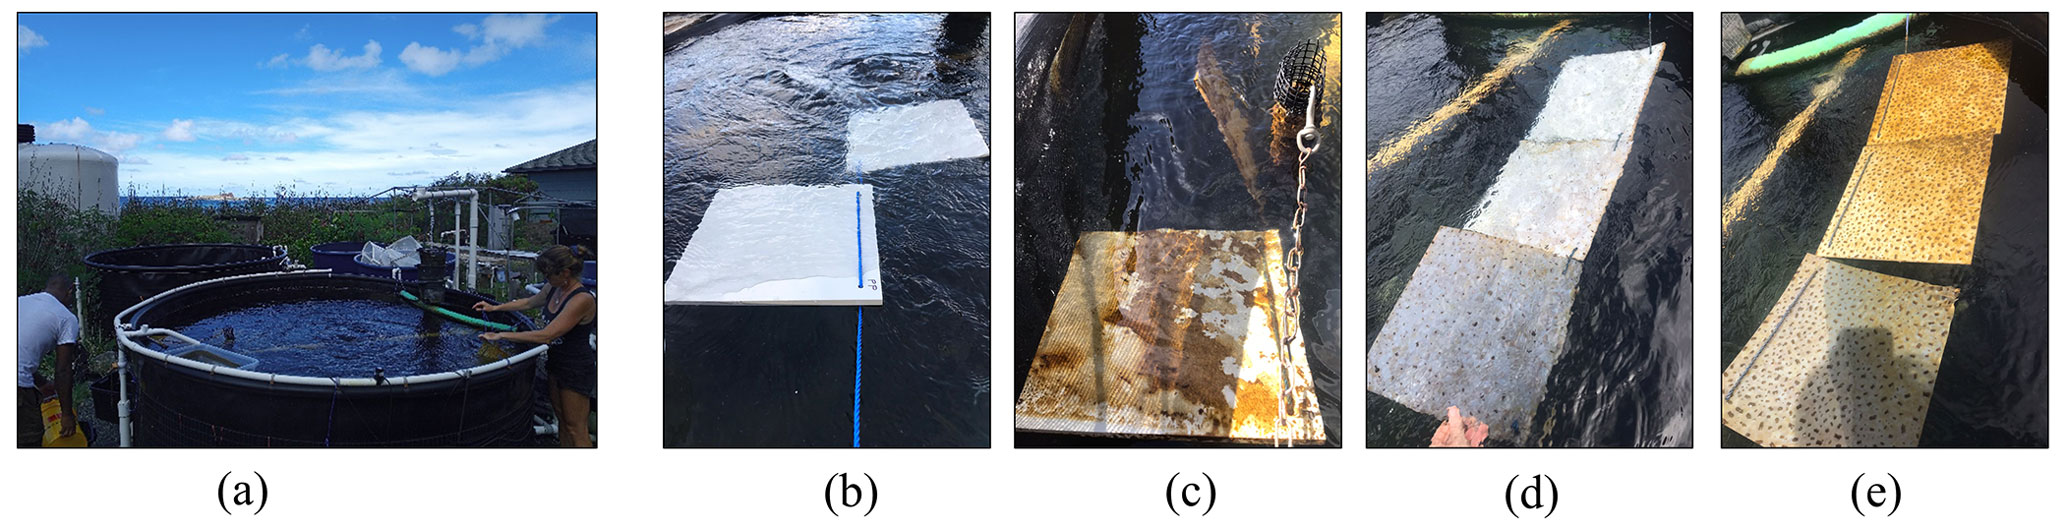
Figure 4An overview of the biofouling tank (a). The sample biofouling process: (b) pristine samples are mounted in the tank; (c) the samples after a week of submersion, showing a biofilm which detached easily; (d) the bottom (facing the tank) of a sample set after 3 months of biofouling; and (e) the top (facing the sky) of the sample set after 3 months of biofouling.
2.2.2 Experimental setup
A customized, cylindrical water tank was constructed and filled with freshwater instead of the same seawater from the mesocosm experiment due to experimental constraints. Any measurement uncertainties resulting from the immediate transfer of the samples from seawater into freshwater including sampling, although not evaluated, were assumed minimal. Hyperspectral point and multipixel measurements were conducted during daylight from 08:00 to 16:00 local time between 12 and 16 September 2022 on O'ahu, Hawai'i, USA (Fig. 5). The outdoor measurements of the samples at 0, 5, 50, and 250 mm water depth were completed using the SEV spectroradiometer. However, the degree of buoyancy and fragility of the 1 mm thick XPS sample did not allow submersion, and hence measurements were only conducted at the surface. The panels were fixated by a U-shaped bracket (Fig. 5a). Before collecting the spectral measurements, water layer depth was recorded with a ruler (Fig. 5a, b). The relative reflectance measurements were collected under natural sunlight and white referencing was performed with the SphereOptics Zenith Polymer® SG3120 ≈99 % full material PTFE standard panel before each measurement. The sky conditions ranged from clear skies to scattered clouds during the outdoor campaign. Measurements were only collected when the conditions were relatively uniform (i.e., steady state cloud cover, or a steady window of clear sky). After the collection of all spectral reflectance measurements, the biofilm was carefully removed for further analysis (Fig. 5c). The fore optic on the SEV was a 5∘ field-of-view lens and each measurement was an average of 20 scans (Fig. 5d). The distance from the sensor to the water surface was 13 cm. The SPECIM IQ collected additional hypercube data of the biofouled samples at all water depths except above water (Fig. 5e).
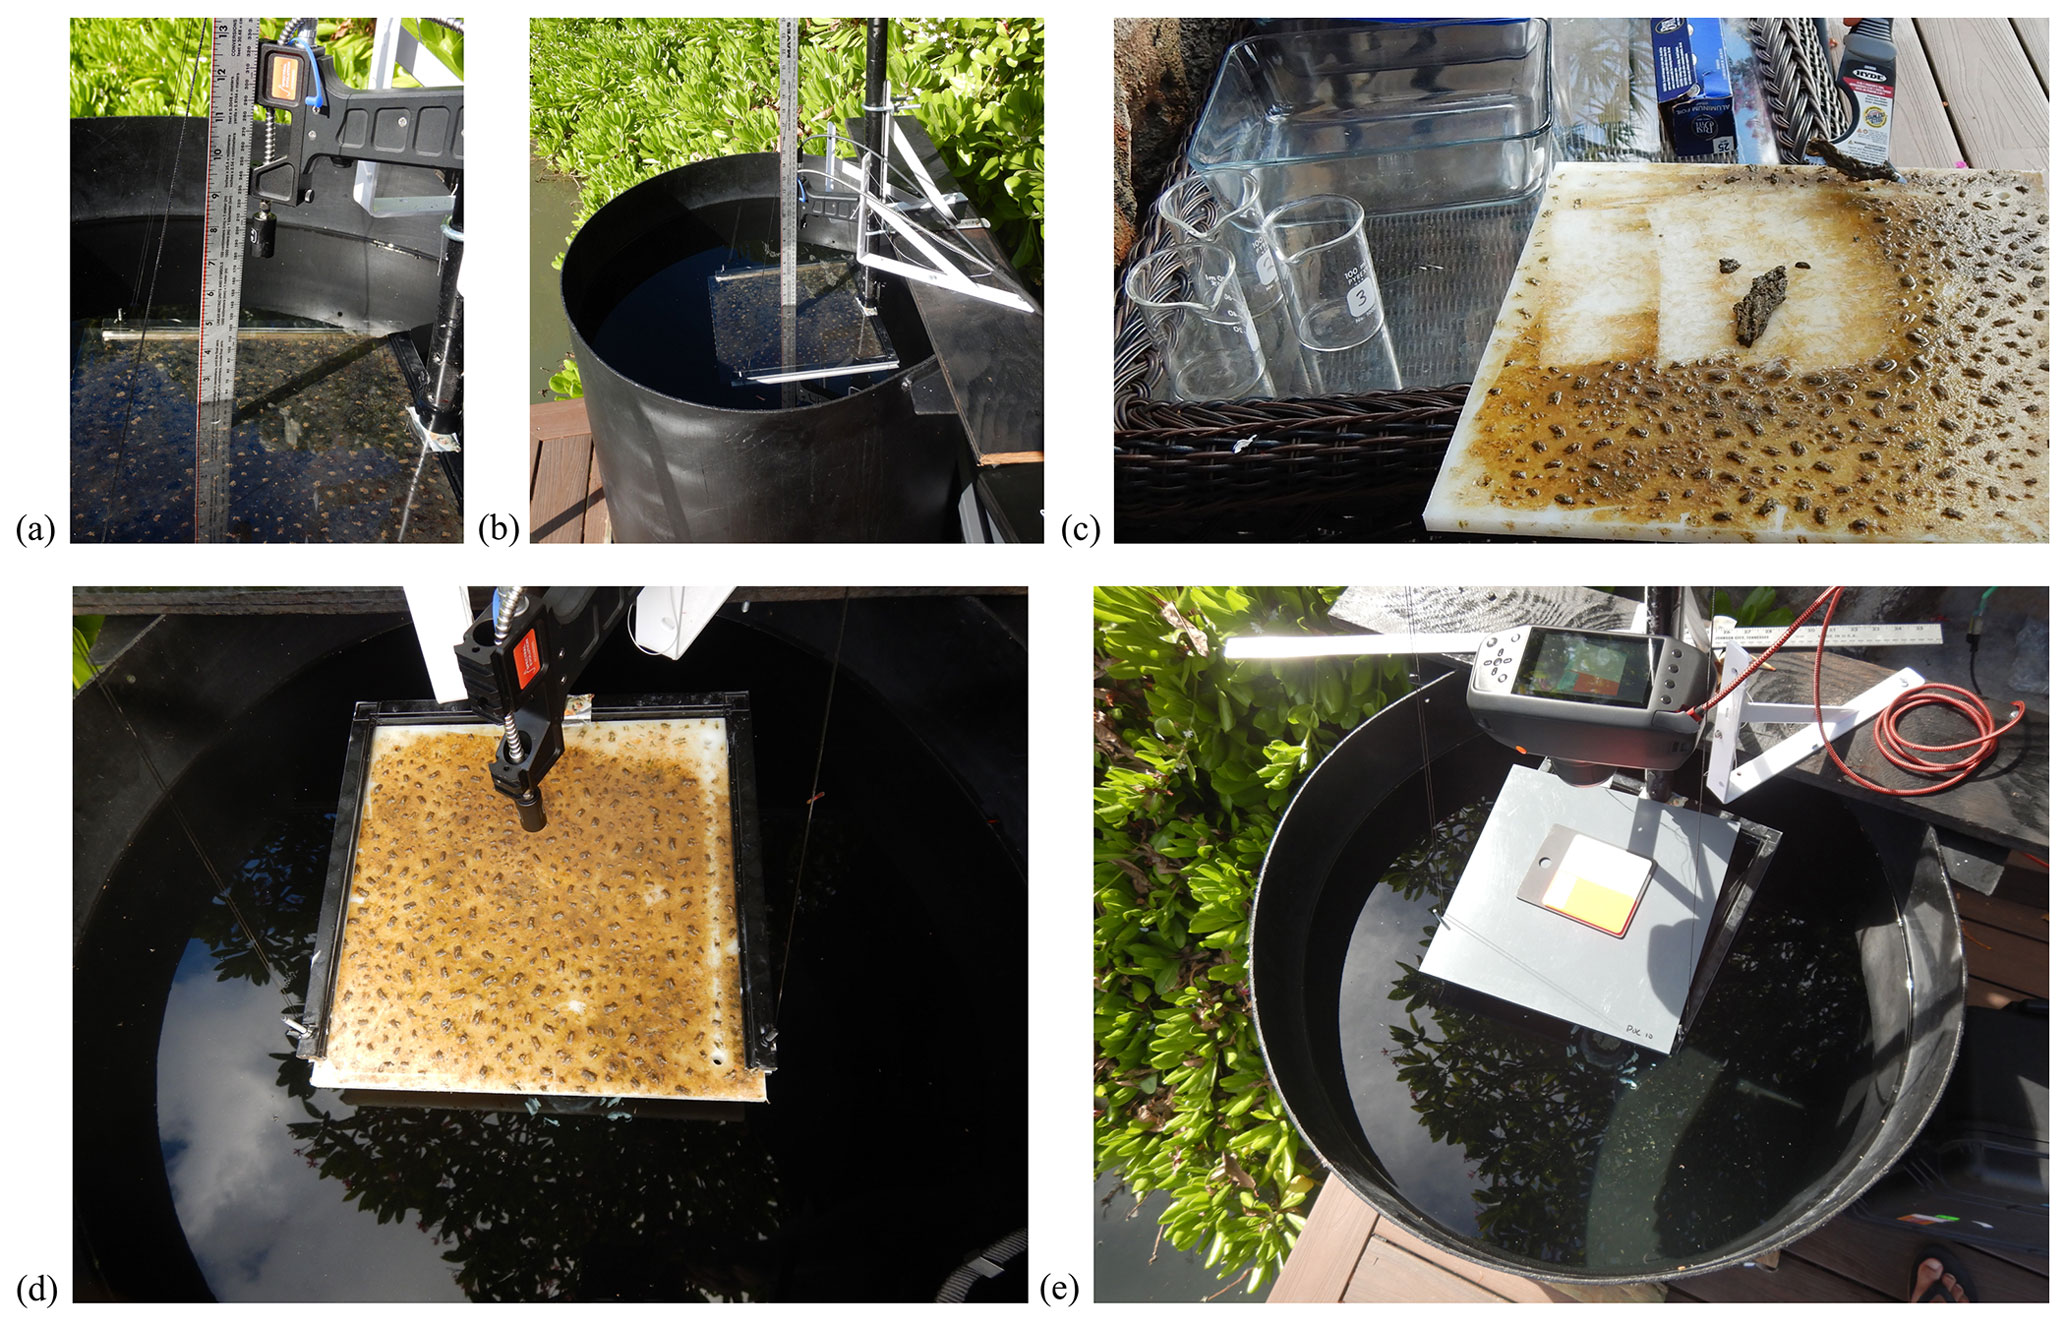
Figure 5Panels (a, b) show the depth of submersion and distance of the SEV lens to target measurements, (c) collection of biofilm to determine the biofilm mass for all the biofouled samples, (d) biofouled sample placed in position for SEV reflectance measurements, and (e) the SPECIM IQ camera collecting with a standard reference target.
2.2.3 Biofilm mass and thickness
A portable NiceGoodz electronic scale was used to determine the wet mass of the biofilm after removal from each panel (Fig. 5c). Additionally, the thickness of the biofilm was estimated using a micrometer at three sample points. The pristine sample thickness was also recorded for reference against the manufacturer-reported thicknesses of the samples.
3.1 SEV point measurements
3.1.1 Pristine samples (indoor campaign)
The spectral reflectance curves of the HDPE, PVC, PET-G, PA6, PP, and XPS panels with varying thicknesses and observed at depth are presented below (Figs. 6 and 8), starting from a dry state just above the water surface (depth = 0 mm) followed by submerged observations. For more detail, Figs. 7 and 9 display the surface-level spectral reflectance of each material, including the confidence interval and individual measurement lines. In this section of the results and each of the following sections, each of the spectral reflectance curves is the average from a set of five measurements, unless stated otherwise. An increase in material thickness was revealed to cause an enhancement in the magnitude of detected reflectance for HDPE and PA6, but this was less pronounced in the other pristine plastics (Figs. 6 and 8). It was also noted that for the thickest HDPE and PA6 samples, the inherent absorption features were enhanced in the near-surface water (0–50 mm) compared with thin samples. These PA6 and HDPE samples were semi-transparent which could influence these optical characteristics related to a direct correlation between thickness and signal magnitude. However, the fully transparent PET-G samples do not share the monotonic relationship between thickness and reflectance. Dark or transparent polymers tend to have a weak spectral reflectance, even above water (e.g., XPS), which becomes weaker when submerged. Generally, the diagnostic absorption features appeared weak or relatively small in the SWIR for most thin plastics. This may have an impact on detectability in a noisy environment with other bright objects (e.g., with intense surface reflected glint, sea foam, or breaking waves) or when the plastic pixel coverage is low.
We observed that the strong absorption of water in SWIR significantly affected the magnitude of reflectance measured for the pristine samples with rapid loss of signal in the top layer (0–50 mm). From a first glance across all different polymer types, the SWIR (>1000 nm) part of the signal disappears beyond 50 mm water depth, while the visible domain (400–700 nm) remains present until the maximum depth of 70 cm. Even at 5 mm water depth, the spectral reflectance shape changes noticeably from the dry measurement for all polymer types investigated.
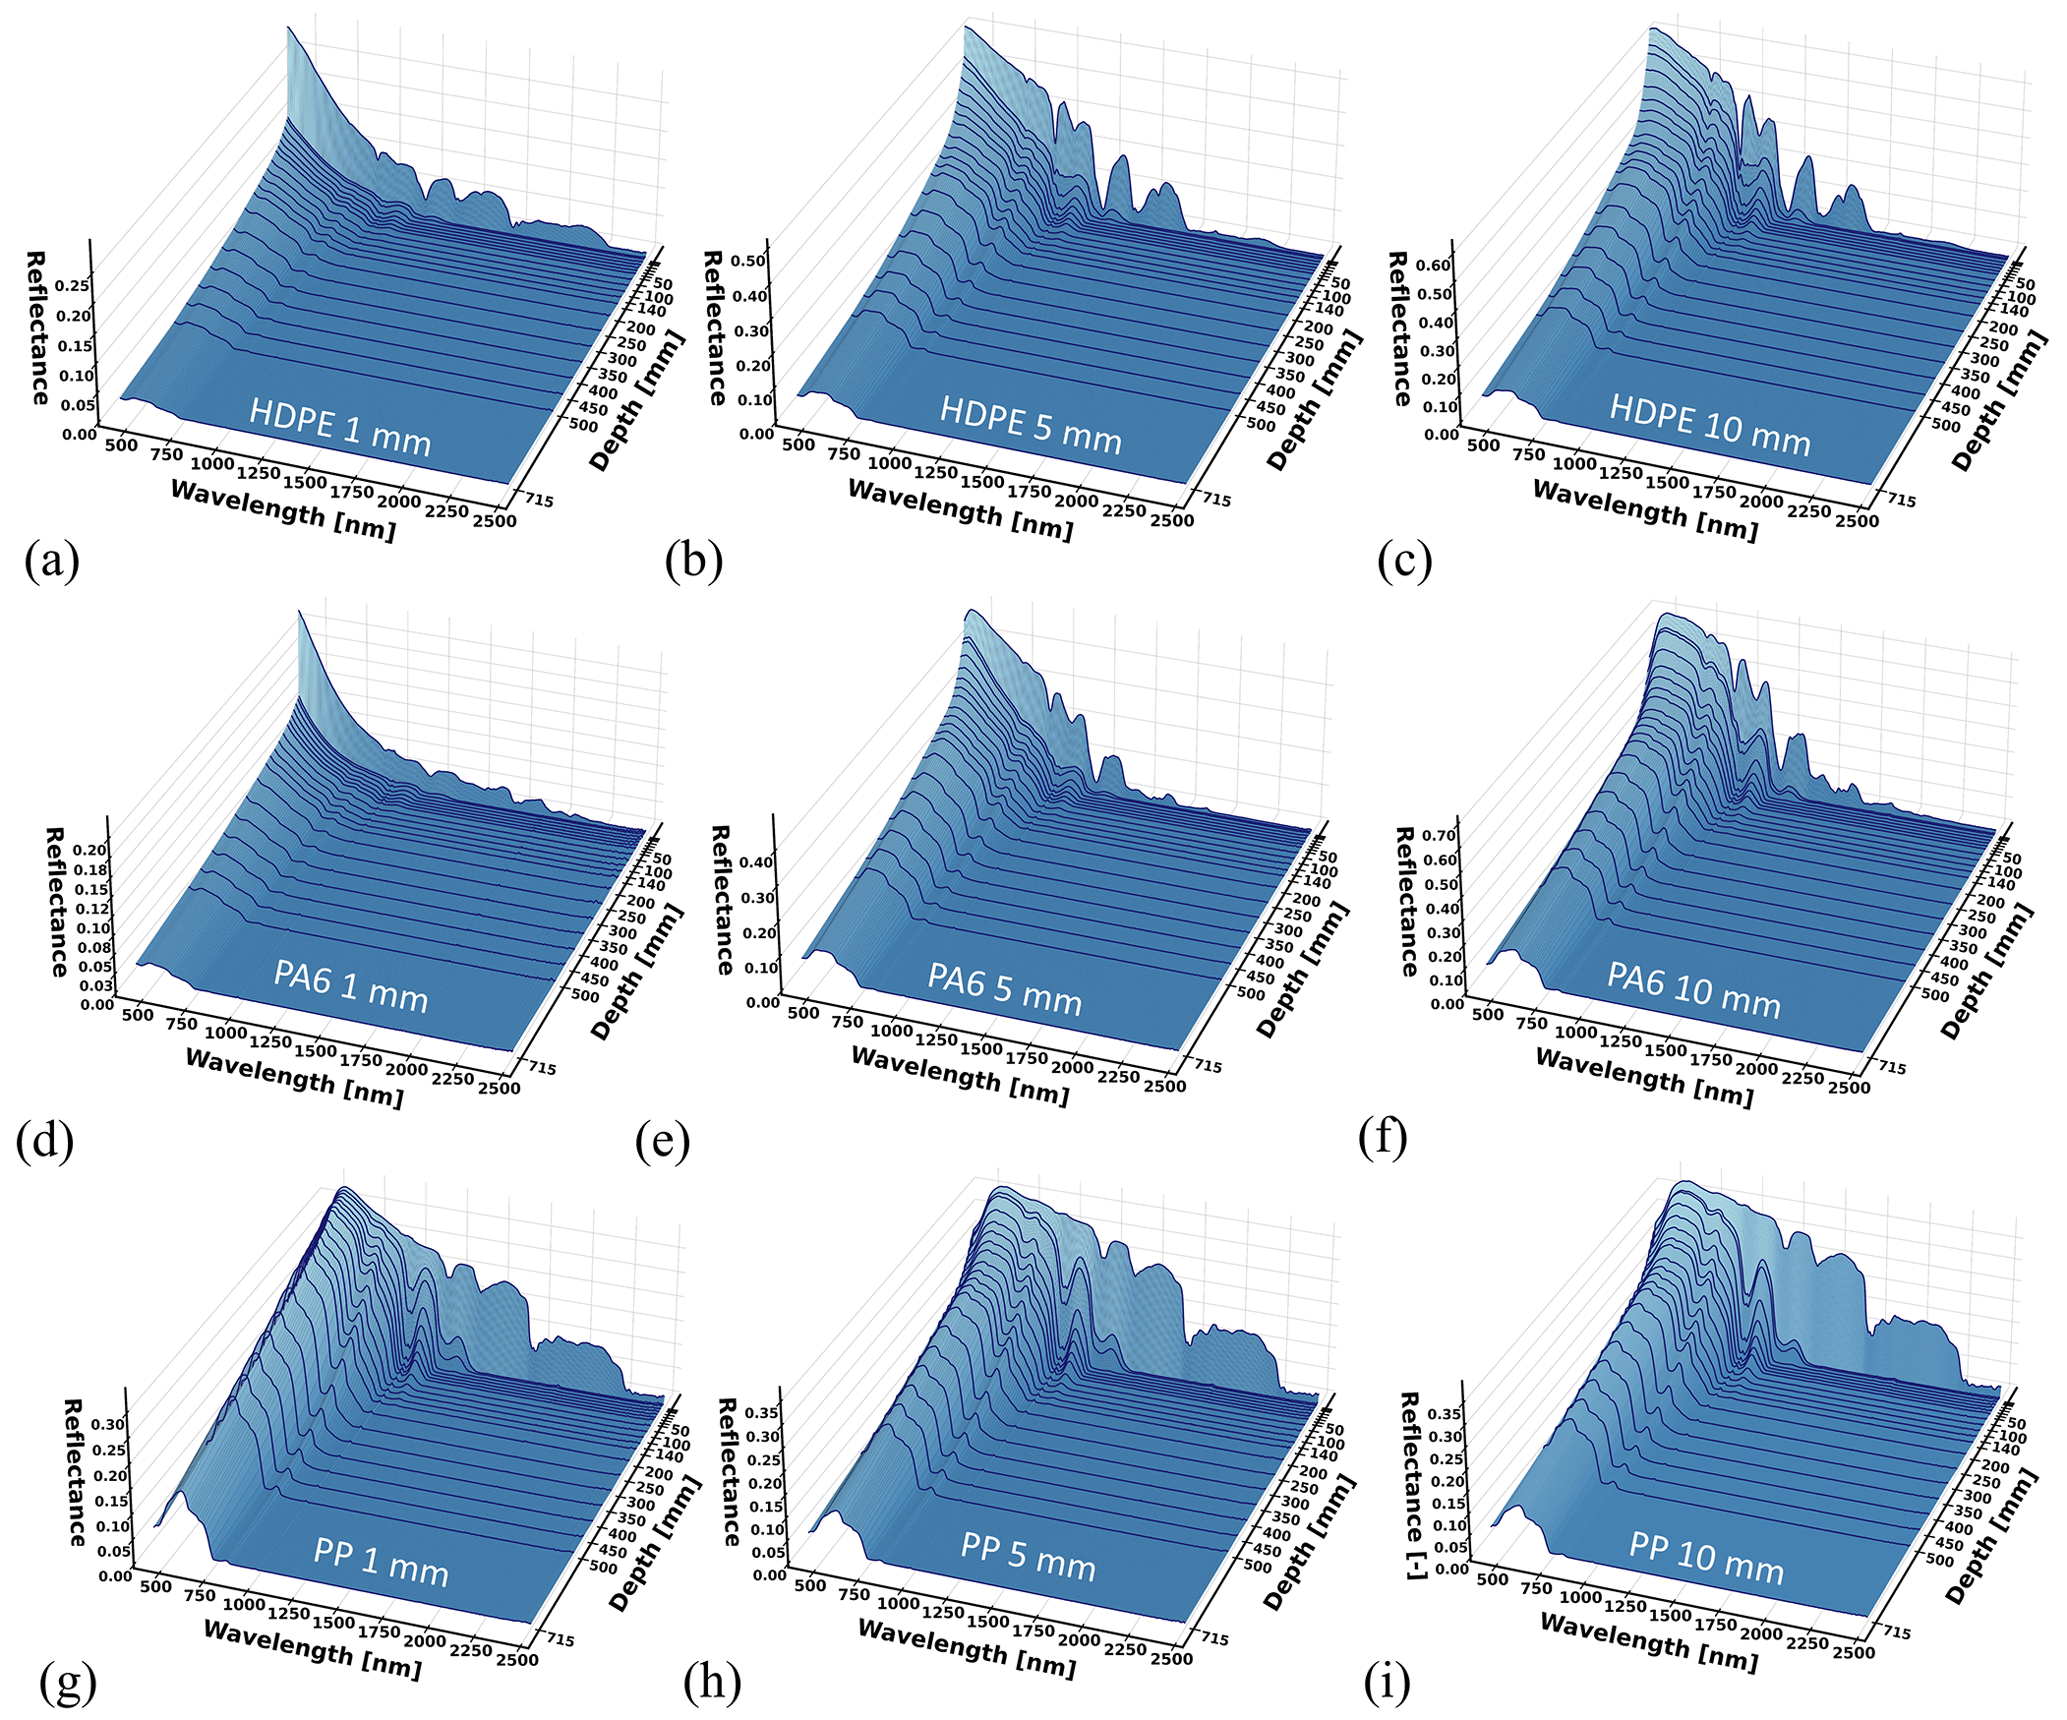
Figure 6Spectral reflectance at varying depths for (a–c) HDPE, (d–f) PA6, and (g–i) PP for panel thickness ranging between 1 and 10 mm. Each reflectance curve is the average of five measurements.
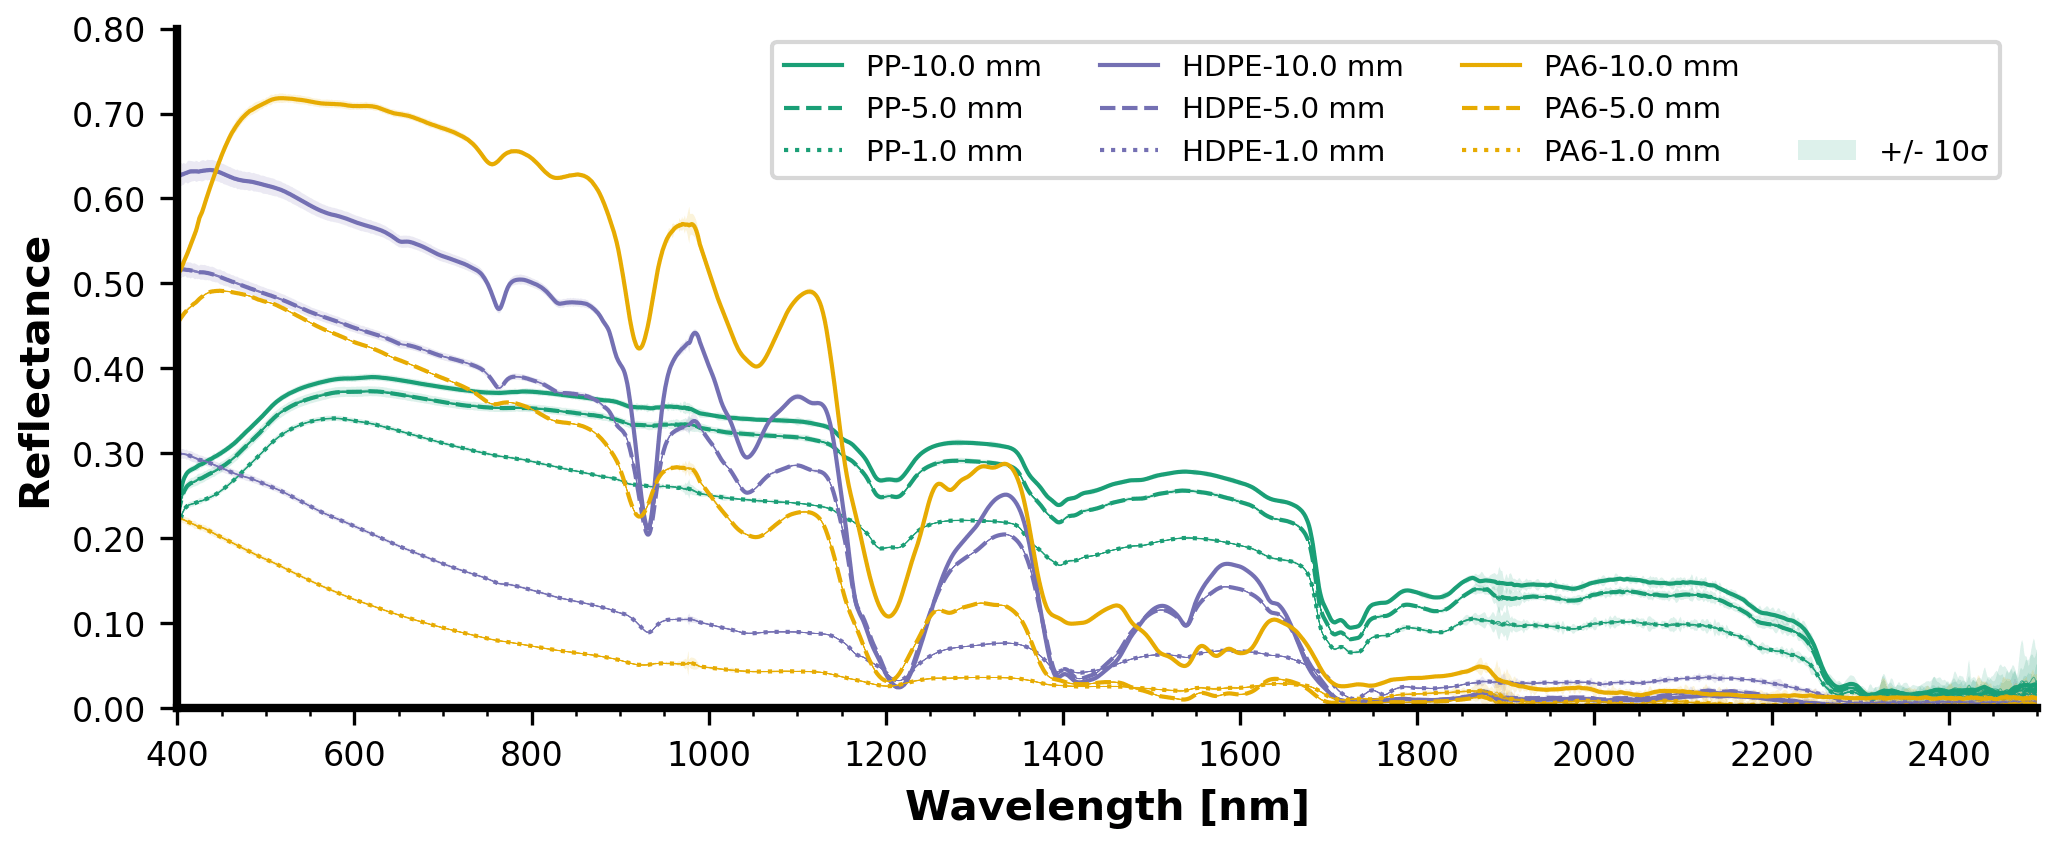
Figure 7Surface-level spectral reflectance of PP, HDPE, and PA6 panels with varying thickness. Each curve is the average with the shading representing the 10σ confidence interval.
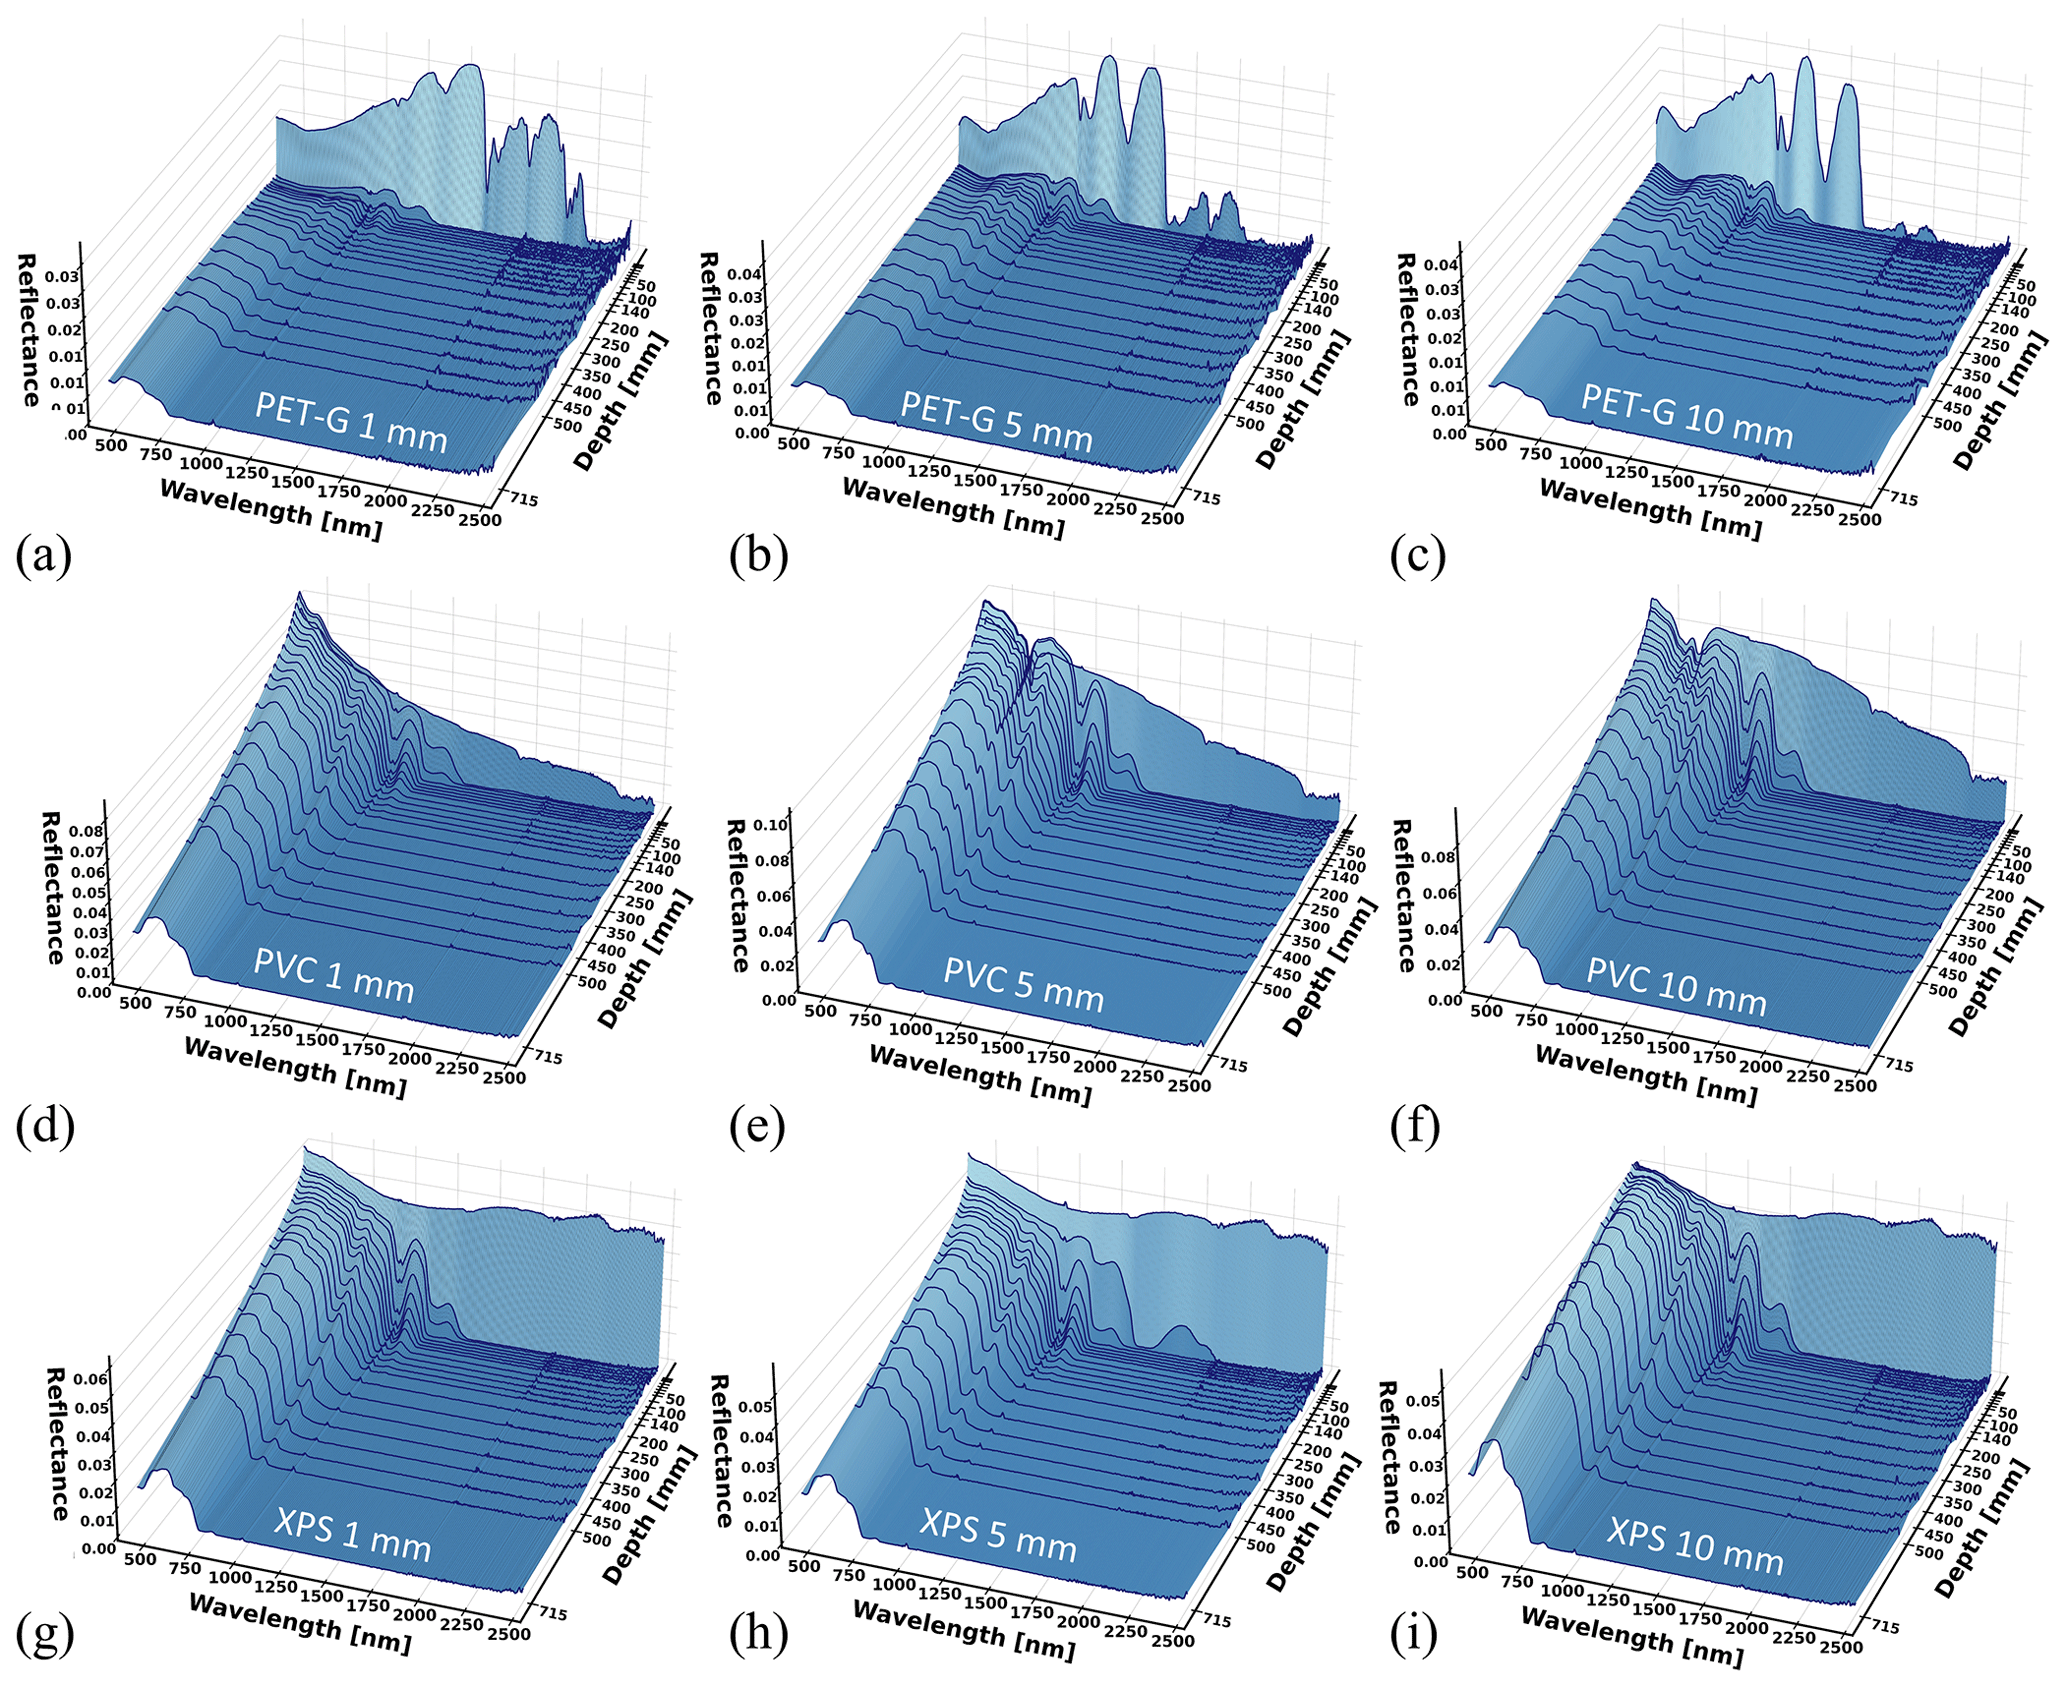
Figure 8Spectral reflectance at varying depths for (a–c) PET-G, (d–f) PVC, and (g–i) XPS for panel thickness ranging between 1 and 10 mm. Each reflectance curve is the average of five measurements.
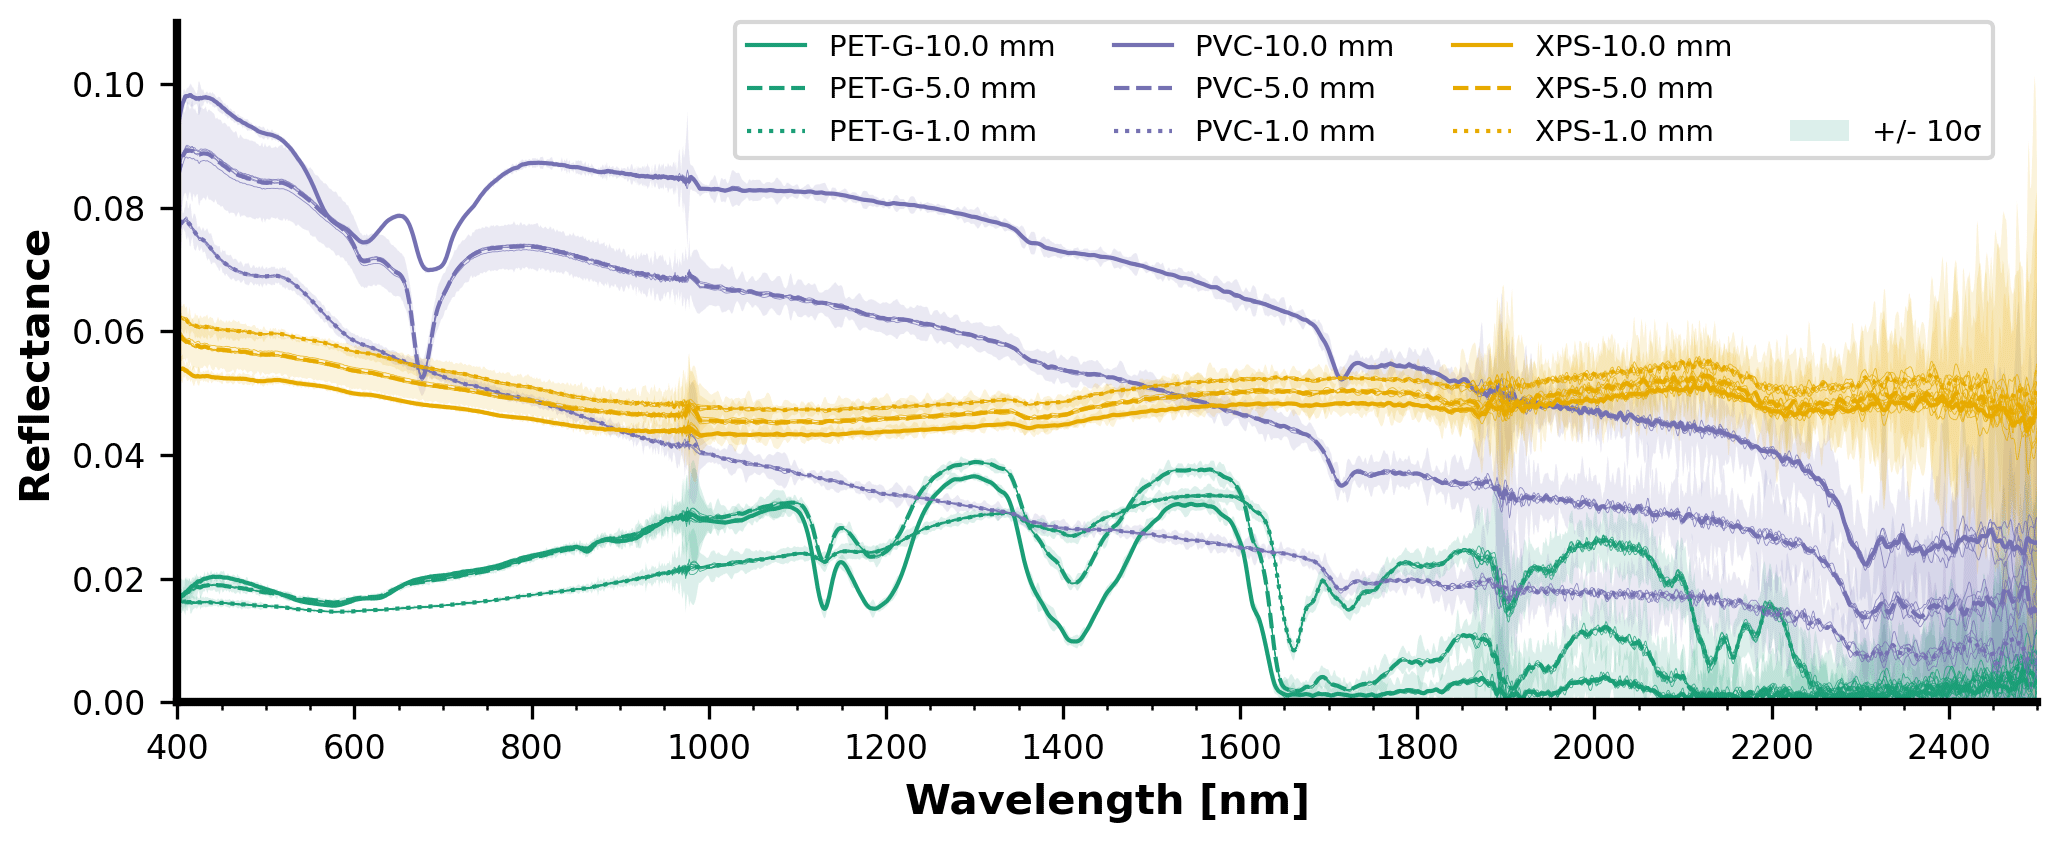
Figure 9Surface-level spectral reflectance of PET-G, PVC, and XPS panels with varying thickness. Each curve is the average with the shading representing the 10σ confidence interval.
3.1.2 Construction materials as well as multilayer and ocean-harvested weathered plastics (indoor campaign)
Weathered materials were also measured and these included multilayer packaging (both sides), blue weathered ocean plastic, white weathered ocean plastic, green ocean net, and weathered ocean rope. The spectral reflectance curves per depth are displayed in Fig. 10. A special case appears in Fig. 10a (inside of the multilayer sample): around 500 nm, the reflectance increases with depth, mostly between 200 and 500 mm depth. This effect could be caused by variations of the lighting and viewing geometry with depth, combined with specular light reflection on the sample's aluminum coating. For extra detail, Fig. 11 displays the surface-level spectral reflectance of every material in Fig. 10.
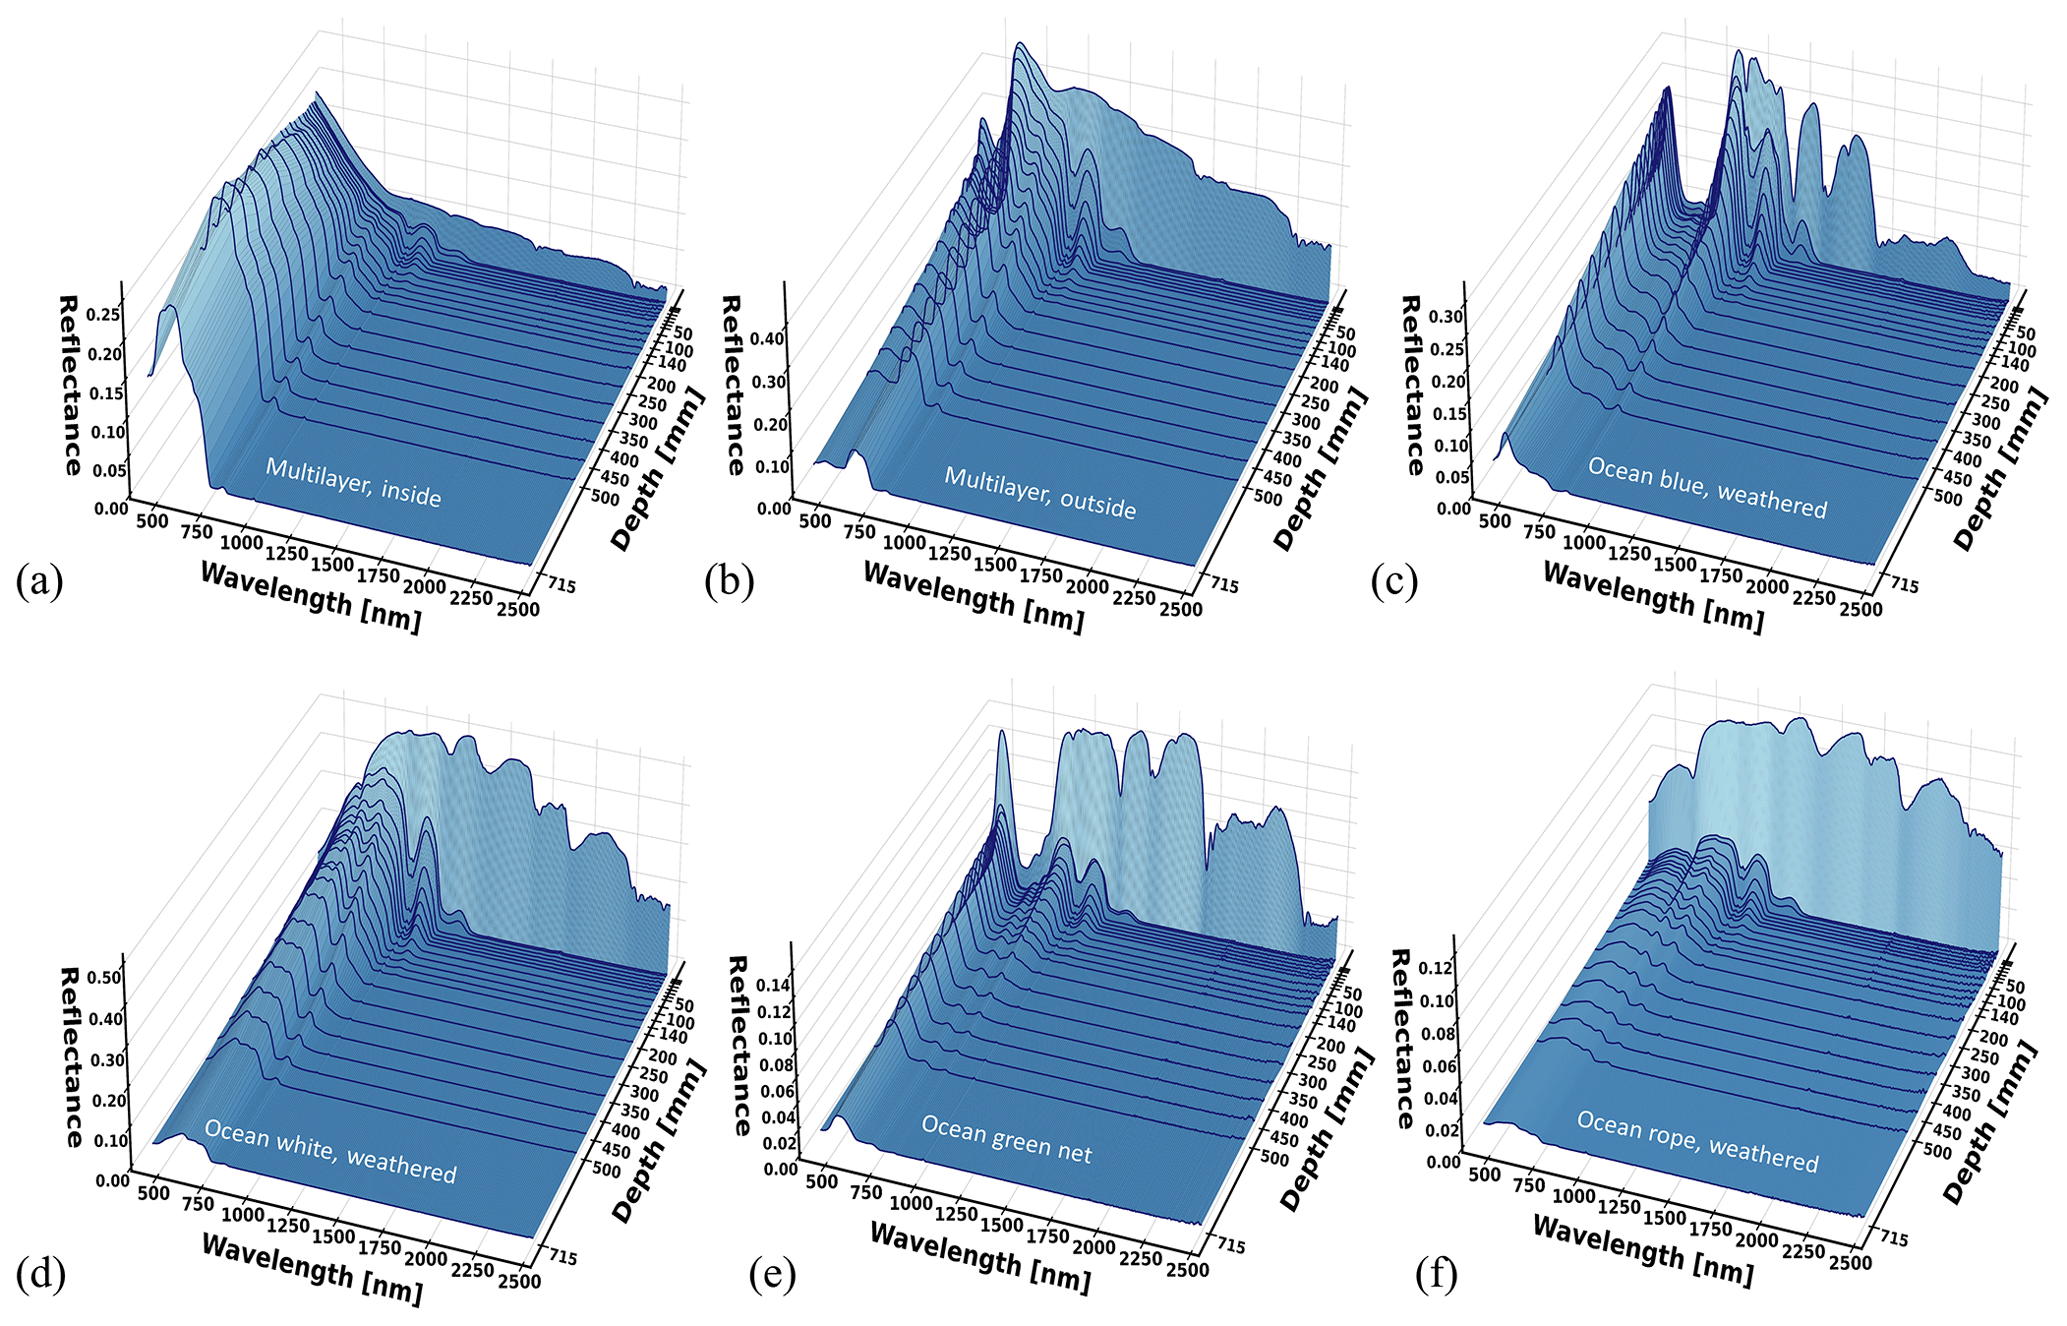
Figure 10Spectral reflectance at varying depths for (a, b) multilayer inside and outside, (c) blue weathered ocean plastic, (d) white weathered biofouled dried ocean plastic, (e) a piece of green ocean net, and a (f) weathered piece of ocean rope.
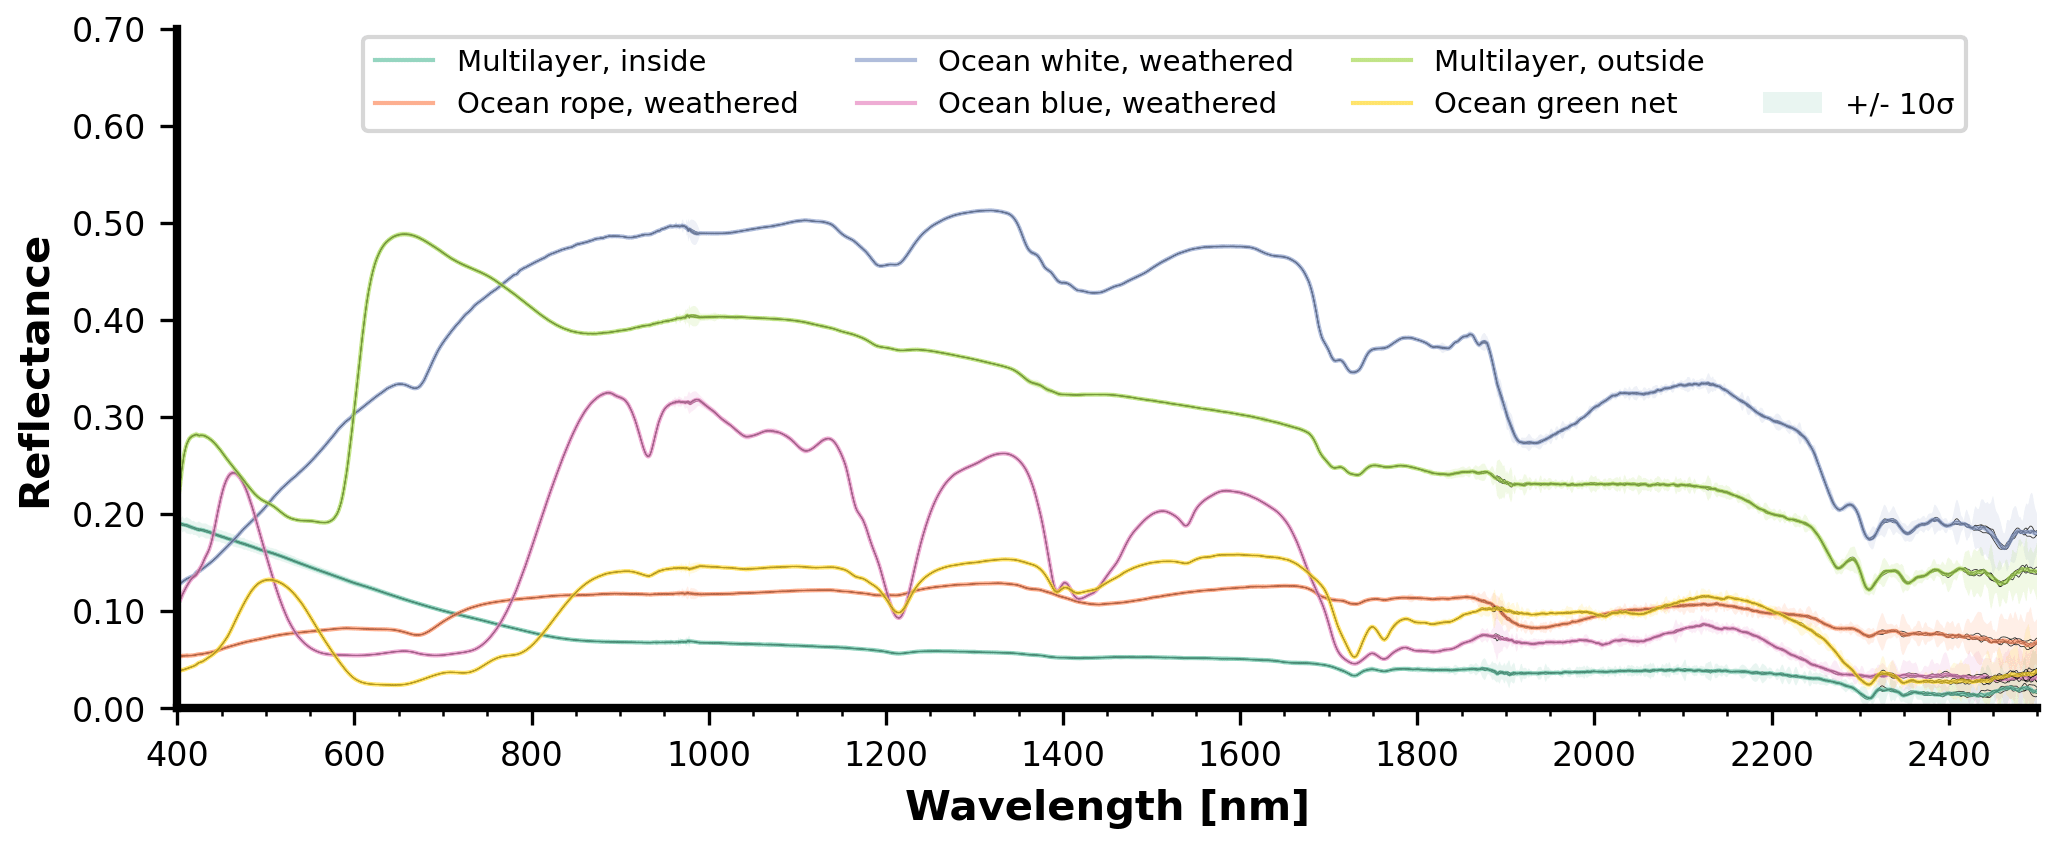
Figure 11Surface-level spectral reflectance of multilayer, blue weathered ocean plastic, white weathered biofouled dried ocean plastic, weathered green ocean net, and weathered ocean rope with varying thickness. Each curve is the average with the shading representing the 10σ confidence interval.
Blue foam as well as white, brown, and green sail pieces (items 14–17 in Table 2) spectral reflectance measurements were only done in the dry state for comparison purposes (Fig. 12). These weathered sailing pieces and a blue object were measured as representative items from nautical mismanaged waste. As can be seen in Fig. A1, each sample of this group is large enough to fully cover the sensor pixel swath. Peaks in the visible spectrum matched the apparent colors, e.g., blue foam (∼ 450 nm) and green sail (∼ 550 nm). The blue foam had the highest reflectance in the SWIR while the lowest reflectance appeared with the green sail. The reflectance magnitude differed among the investigated materials in the NIR and SWIR due to the various physical characteristics of the samples including material thickness (e.g., the sails were a film-like material, the blue foam being a solid), polymer types, as well as apparent color of the samples (e.g., the green sail being a darker material than the brown and white sails). The apparent object color has been shown to influence the spectral shape and magnitude of plastics from the NIR and SWIR in a previous study (Garaba et al., 2021).
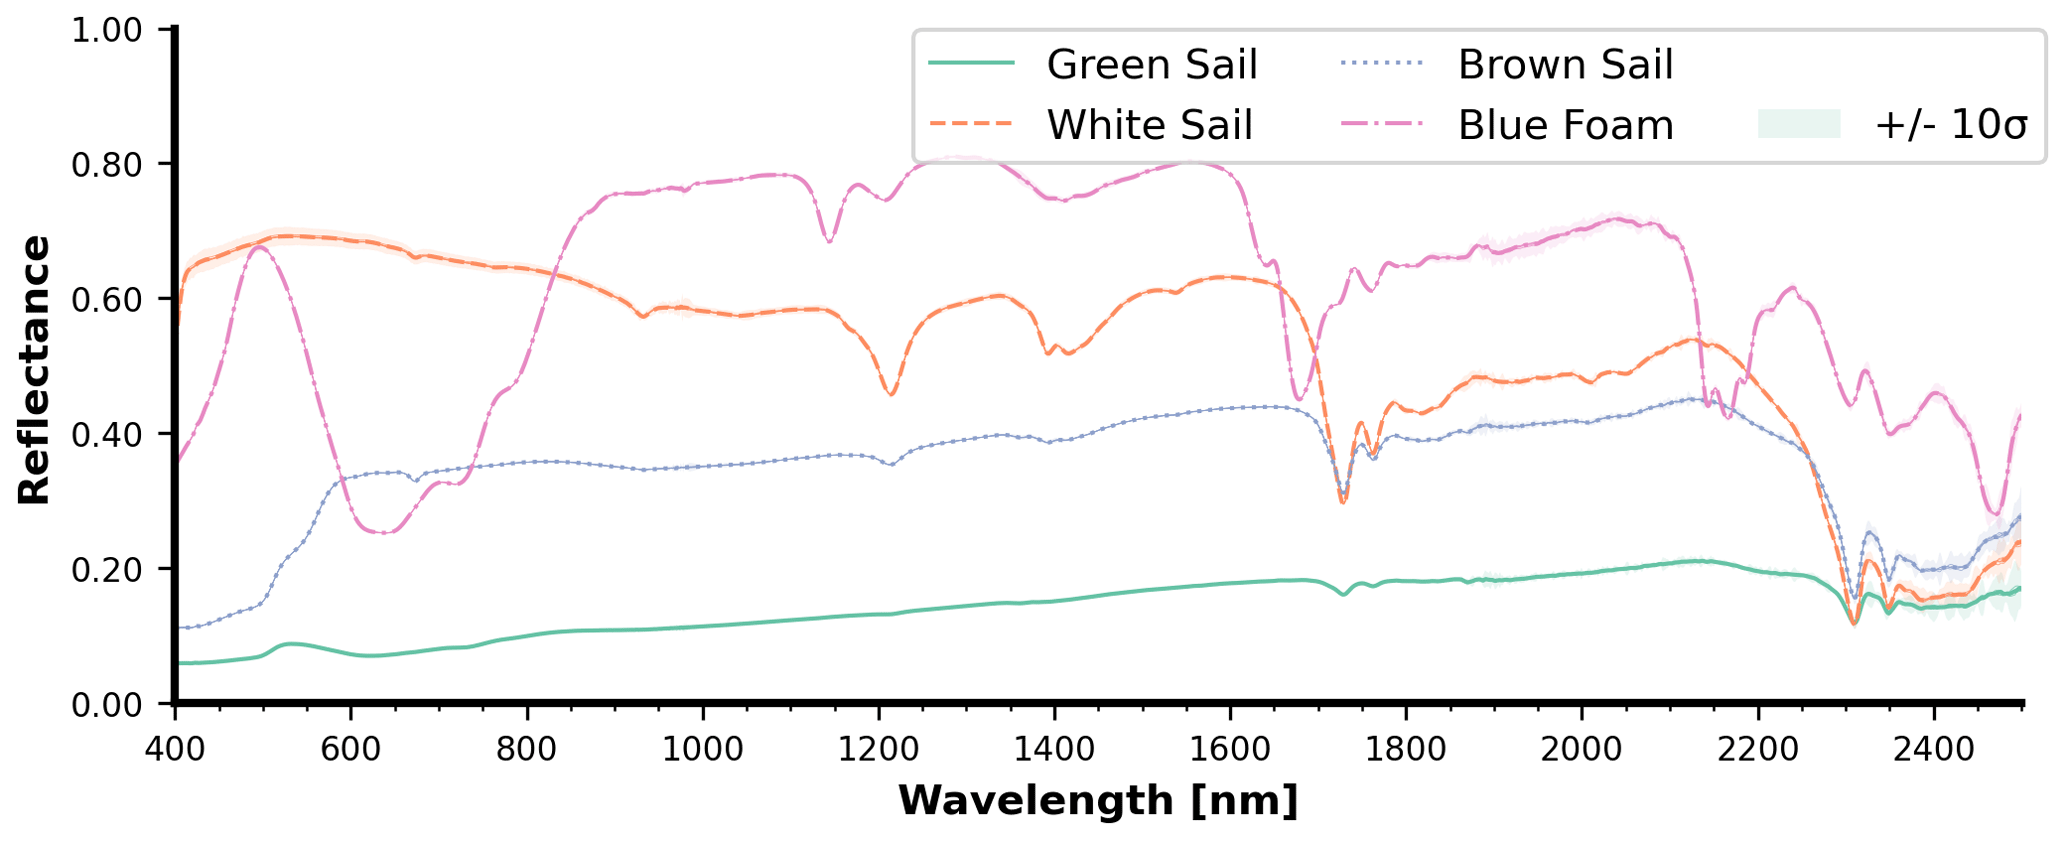
Figure 12Spectral reflectance of dry sailing-related objects: (a) white sail, sample ID 15 in Fig. A1; (b) brown sail, sample ID 17 in Fig. A1; (c) green sail, sample ID 16 in Fig. A1; and (d) blue foam, sample ID 14 in Fig. A1. Each curve is the average with the shading representing the 10σ confidence interval.
3.1.3 COVID-19-related medical personal protective equipment (Indoor Campaign)
Figure 13 presents an overview of the spectral reflectances for the different COVID-19-related medical personal protective equipment (PPE). Overall, the spectral reflectance values of weathered face masks and gloves are visibly lower than those of the new samples. An aged, soaked medical glove has overall lower reflectance values than a dried, new glove. Outside of the water tank, measurements for the face masks (Fig. 13b) were collected for both dry and soaked states. For the masks, soaking noticeably decreased the reflectance values for wavelengths above 1200 nm. This effect becomes stronger when combined with the aging of the samples. Soaking of the weathered face mask even before submersion almost completely negates spectral reflectance values in most of the SWIR bands. Most of the remaining SWIR spectral reflectance is brought close to zero at 50 mm submersion depth. Finally, the measurements of RATs (Fig. 13c) that were only taken above the water surface reveal a small difference in reflectance for the top and bottom faces. The RATs spectral reflectance curves show absorption features around 1150, 1250, and 1650 nm.
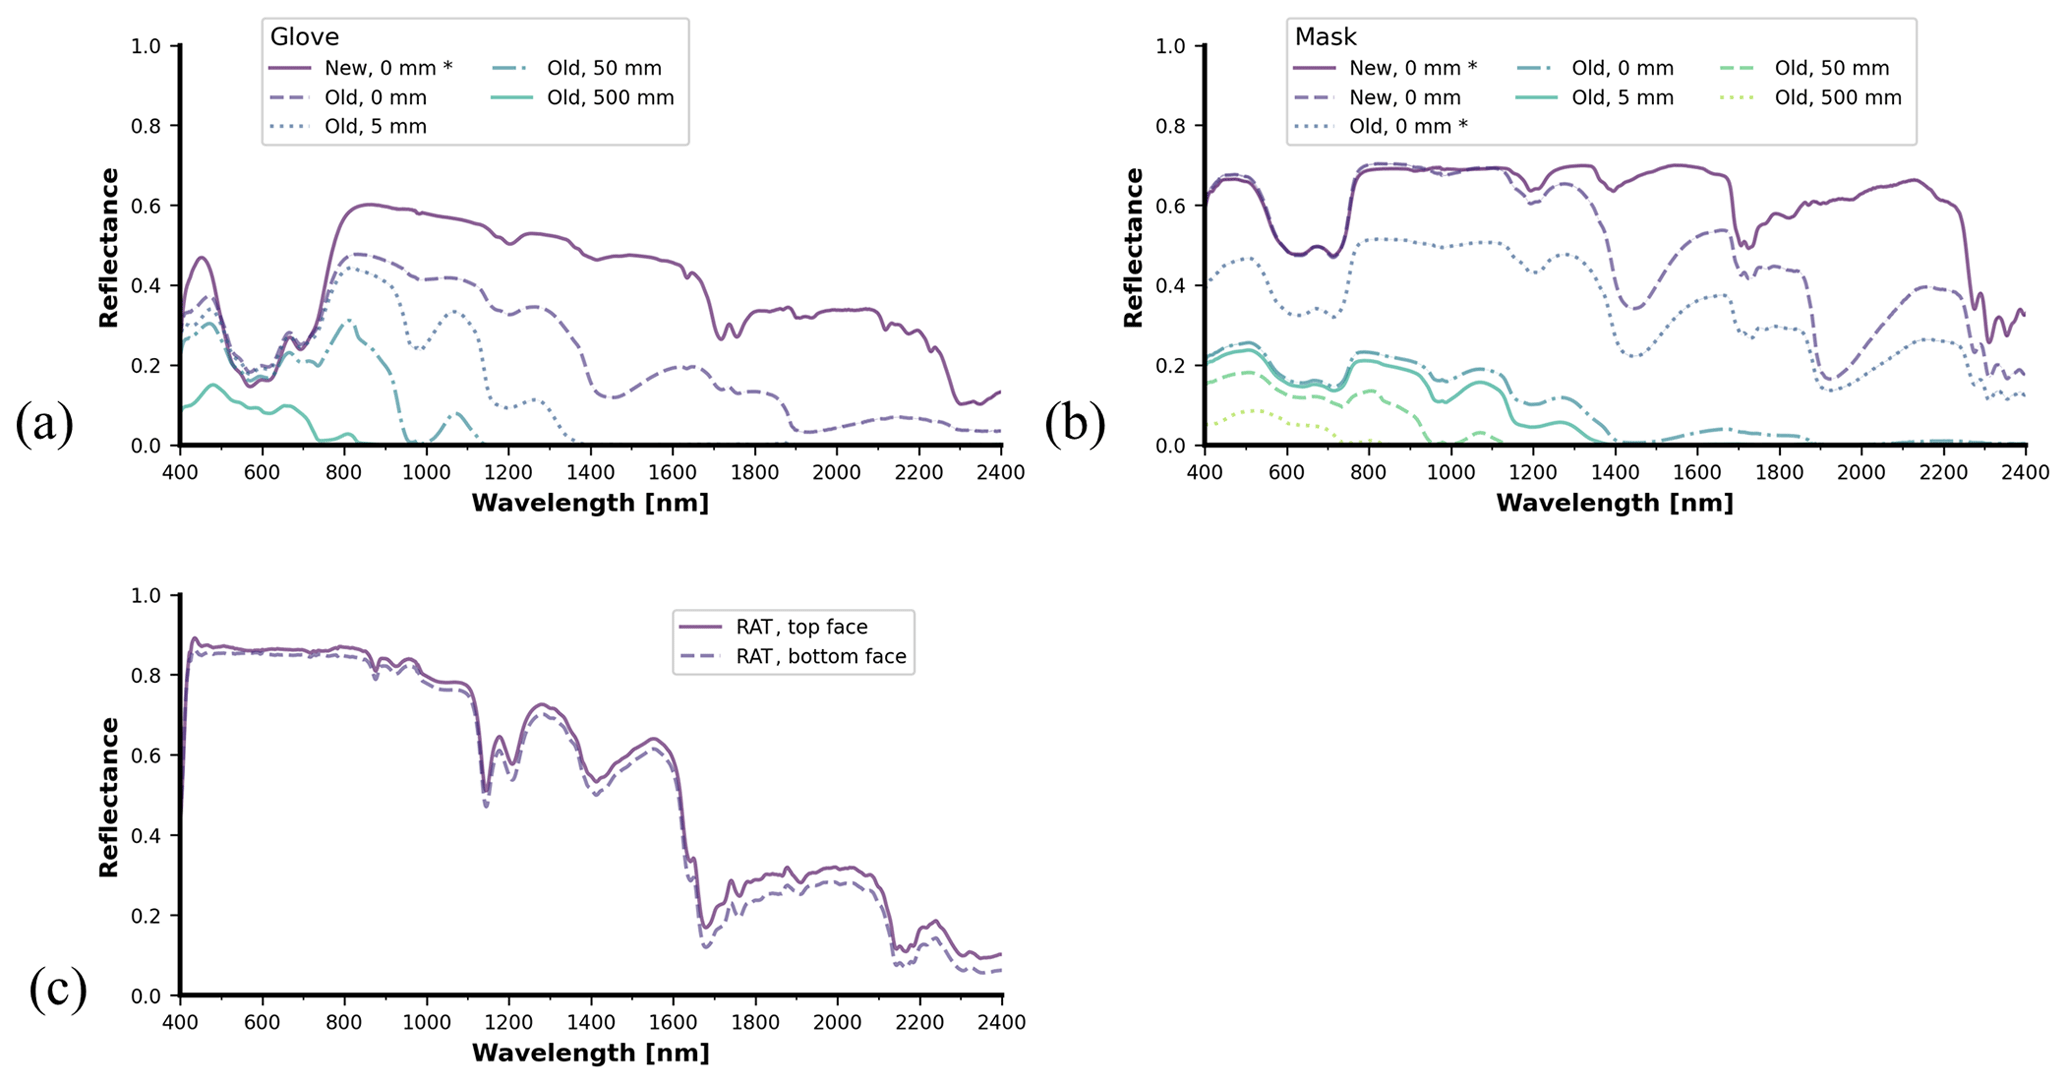
Figure 13Spectral reflectance data from COVID-19-related medical waste in varying conditions: old and new surgical gloves from 0 to 500 mm depth (a), old and new medical masks from 0 to 500 mm depth (b), and rapid antigen tests (c). For medical masks and gloves, the asterisk denotes that a sample was dry or fully drained after submersion. Note that this study examines only one type of medical glove and one type of medical mask.
3.1.4 Blank measurements (indoors and outdoors)
For the indoor campaign, blank measurements were obtained by taking reflectance measurements with no sample in the sample holder. The three types of indoor blank measurements conducted were with water only, the sample holder plate without a glass window, and the sample holder plate with a glass window (Fig. 14). The water alone shows negligible reflectance over the observed spectrum. The presence of the sample holder was noted to have a reflectance contribution of at most 0.05 in the infrared light. Over most of the spectrum, the reflectance values of the sample holder with the glass window are lower than the reflectance values of the sample holder without the glass window. Blank measurements were also collected separately during the outdoor mesocosm campaign. However, no holder plate was used. Therefore, the outdoor mesocosm blank measurements simplify to only the water background (Fig. 14).
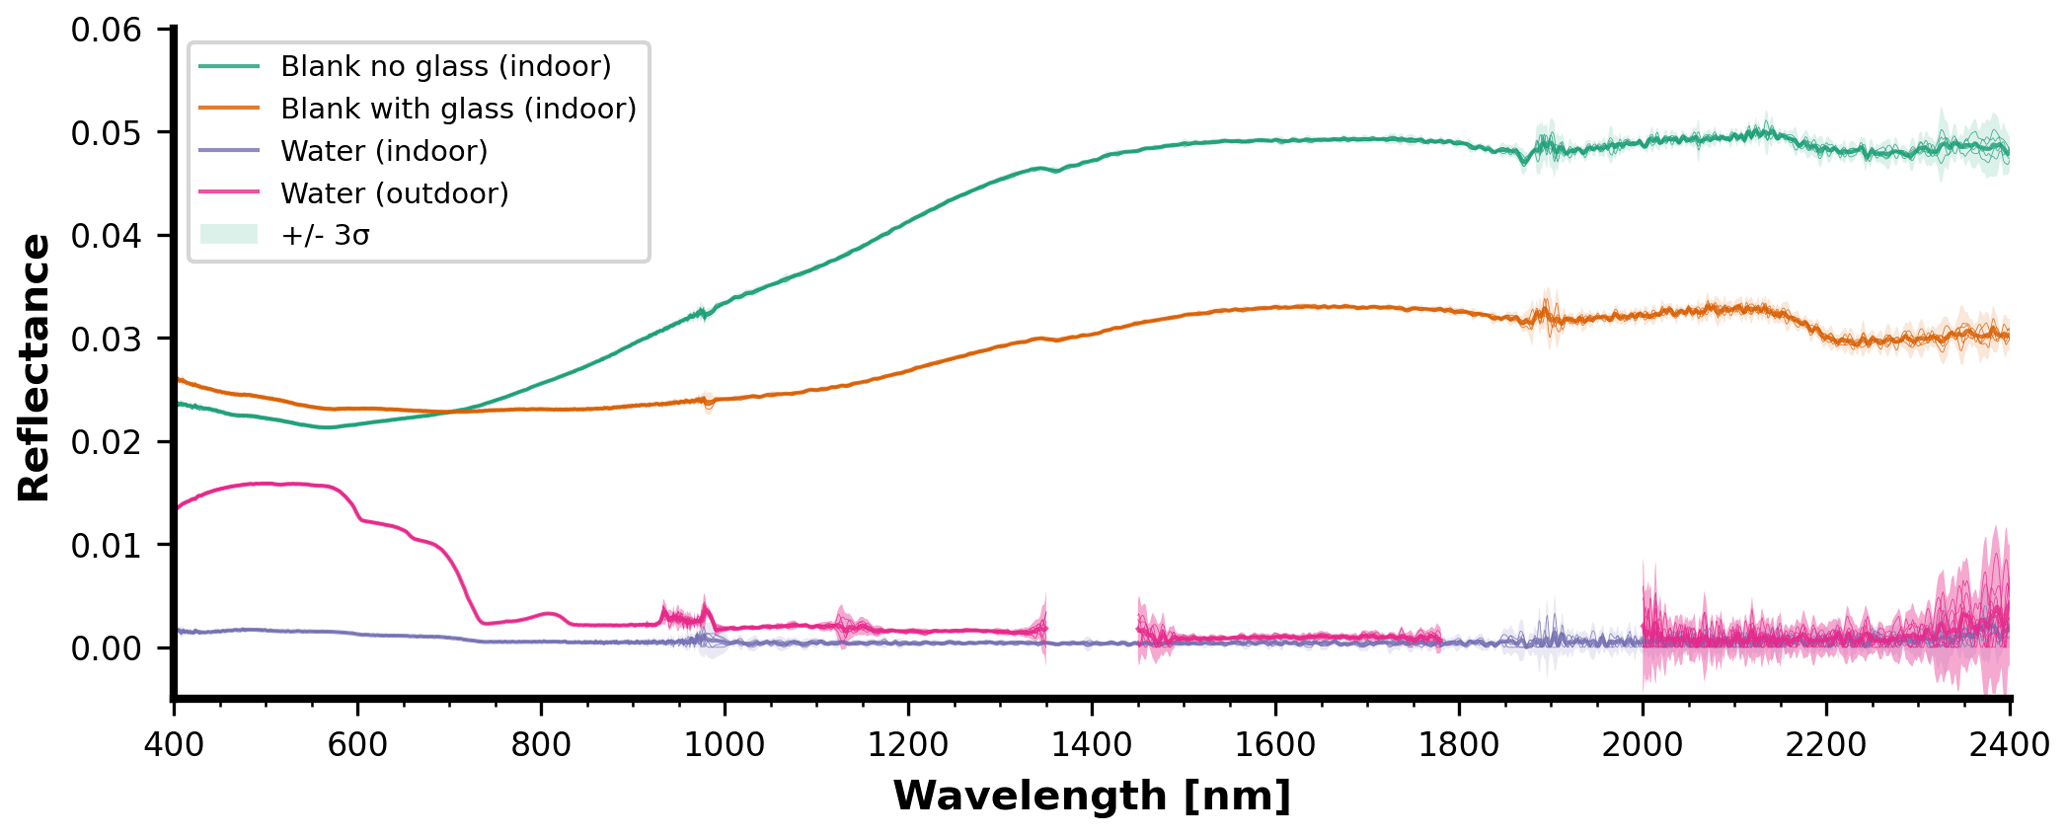
Figure 14Comparison of different blank measurements above water, for both the indoor laboratory and the outdoor mesocosm campaign. All sample measurements during the indoor laboratory campaign were taken with the “glass” or “no glass” option, depending on the required setup. The black background plate has a higher reflectance than water. All measurements reported in this paper are raw reflectance measurements, meaning that the blank signal can still be subtracted to obtain material-specific reflectances with higher accuracy. Each curve is the average with the shading representing the 3σ confidence interval.
3.1.5 Biofouled samples (outdoor mesocosm)
The wet mass and thickness of the biofilm on the pristine samples exhibit a direct positive relationship (Table 3). Biofilm thickness increased with sample thickness for HDPE, PP, and PA6. However, the variation in biofilm with substrate thickness seemed to be unclear for the other three polymers. The thickest and heaviest biofilm was found on the 10 mm HDPE samples.
Figure 15 compares the spectral reflectance of biofouled versus pristine samples for all the samples of 10 mm thickness. The shading around the lines indicates the standard deviation obtained from the ensemble of five measurements. In the case of Fig. 15a, variability in the sky cover influenced the five measurements belonging to the biofouled measurement at 0 mm depth. This effect mainly impacts the reflectance magnitude but leaves the shape of the spectral reflectance curve unaltered. The same confidence intervals are also generated for the other subfigures but are nearly invisible due to very low signal variability during most of the measurements. The spectral reflectance shape in the SWIR (>1000 nm) domain remains largely unchanged. In contrast, most of the impact occurs in the visible spectrum (400–700 nm). Although the biofilm thickness varied among the different samples, this effect occurred for all samples, being most pronounced for HDPE (Fig. 15a), PS (Fig. 15b), and PA6 (Fig. 15f). PET-G (Fig. 15c) provides an exception in this case, as the biofouled sample was more reflective across the whole spectrum. Biofouled PP (Fig. 15d) and PVC (Fig. 15e) also both showed a higher SWIR reflectance compared with the pristine samples. By comparing with the 50 mm depth measurement, it becomes clear that water depth plays the strongest part in reflectance attenuation above 1000 nm. None of the samples had extremely thick biofouling. Biofilms in the GPGP are expected to be even less significant in thickness and mass due to the oligotrophic marine environment in the open ocean. Yet, the biofilm grown on the samples in this study was relatively thick and representative of high-nutrient environments.
Table 3Biofilm layer thicknesses and wet mass pristine plastic samples investigated between 12 and 16 September 2022 in Honolulu, Hawai'i, USA.
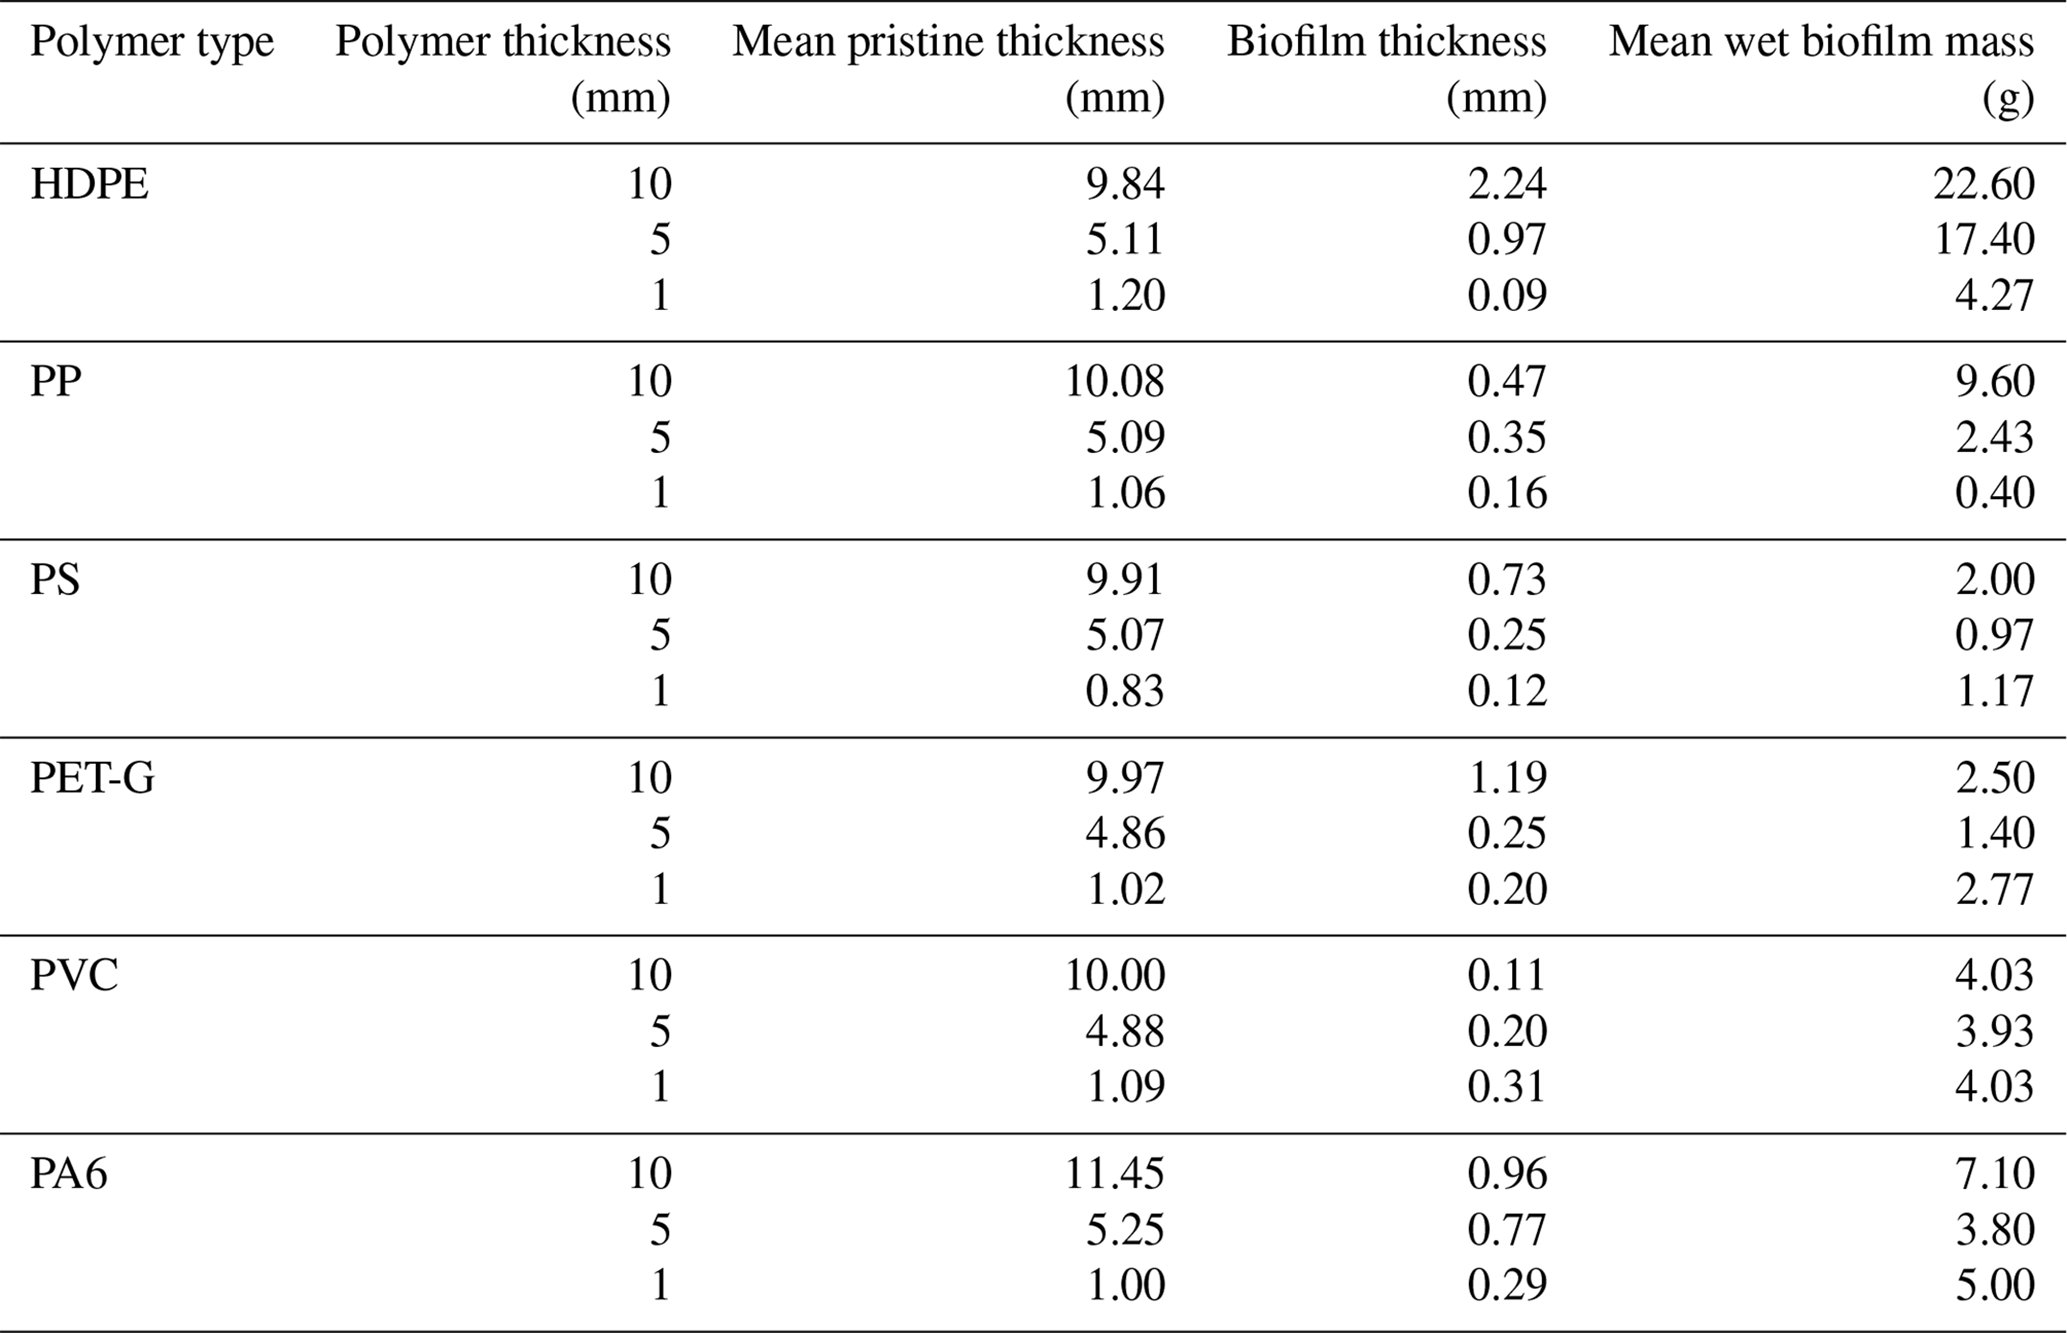
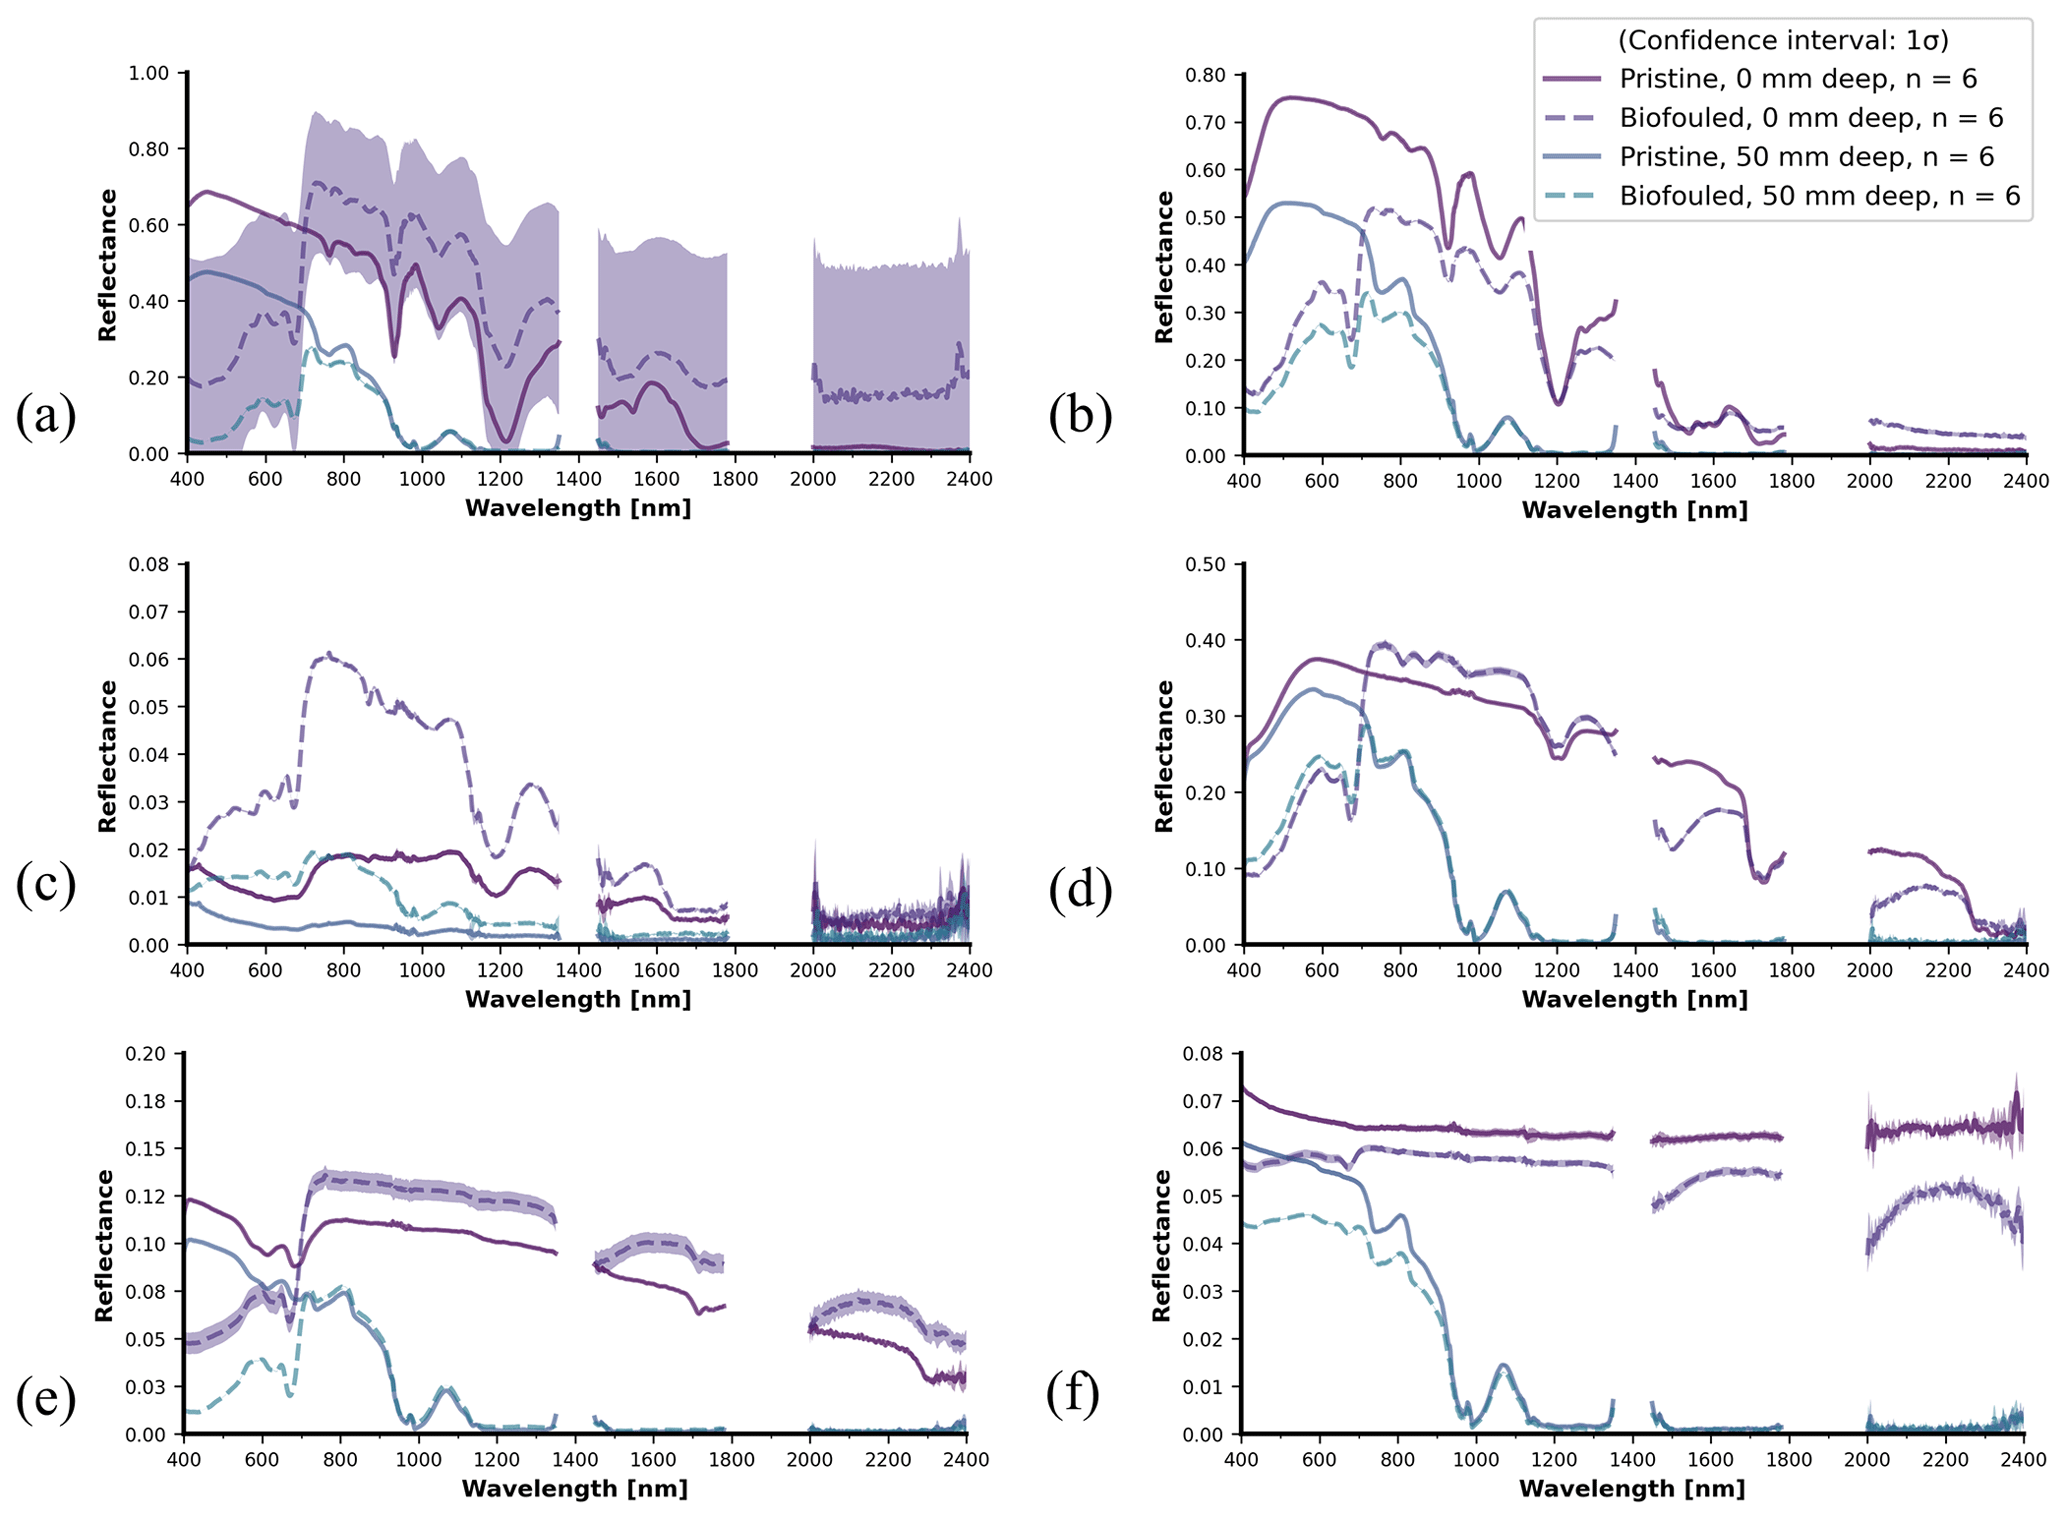
Figure 15Panel (a) shows 10 mm thickness HDPE, pristine and biofouled. The main difference occurs in the visible spectrum (400–700 nm), which is relatively dark. The biofilm does not obscure any of the typical spectral features. Panel (b) shows 10 mm thickness PA6, pristine and biofouled. Here, the biofilm generally decreases the spectral reflectance magnitude, with the strongest diminishing effect in the visible (400–700) spectrum. Nevertheless, the spectral reflectance shape beyond 700 nm changes minimally. Panel (c) shows 10 mm thickness PET-G, pristine and biofouled. The reflectance magnitude increases considerably across the entire spectrum for the biofouled sample compared with the pristine sample. Panel (d) shows 10 mm thickness PP, pristine and biofouled. The main difference occurs in the visible spectrum (400–700 nm), which is relatively dark. Spectral features are not influenced by the biofilm. Panel (e) shows 10 mm thickness PVC, pristine and biofouled. The biofilm mostly decreases the spectral reflectance magnitude in the visible (400–700 nm) spectrum. The spectral reflectance shape beyond 700 nm changes minimally. Panel (f) shows 10 mm thickness XPS, pristine and biofouled. Only minimal differences occur, mainly in the <700 nm part of the spectrum.
3.2 Specim IQ hypercubes (indoor campaign)
Figure 16 presents an example of several spectra obtained from the Specim IQ hypercube data: the dark background (A), a medical face mask (B), a medical glove (C), the marine-harvested and weathered white PP plastic (D), and the biofouled PP sample (E). The displayed reflectance curves are obtained by averaging the data from 10 pixels in the sampled image. Between the curves, we can distinguish the relatively high reflectance of the biofouled PP sample. Because the SPECIM IQ range is limited to 400–1000 nm, no information could be derived about the SWIR diagnostic features. Indeed, it is important to highlight that the SPECIM IQ data is unique and offers some groundwork including the potential to further examine spatial heterogeneity of spectral reflectance on irregular samples. Figure 16 also includes the mean and standard deviation of each sample, each obtained from an ensemble of 10 points extracted from the sample hypercube.
When comparing Fig. 16 with the point measurement data in Fig. 11 (weathered white plastic), Fig. 13 (medical PPE), and Fig. 15d (biofouled HDPE), the spectral reflectance magnitudes are different. Observing the spread in individual measurement lines in Fig. 16, the difference in reflectance magnitudes is likely caused by differences in sampling location. The SPECIM IQ reflectance curves are based on the mean of a point ensemble, while an SEV point measurement is based on the average of the sensor pixel swath.
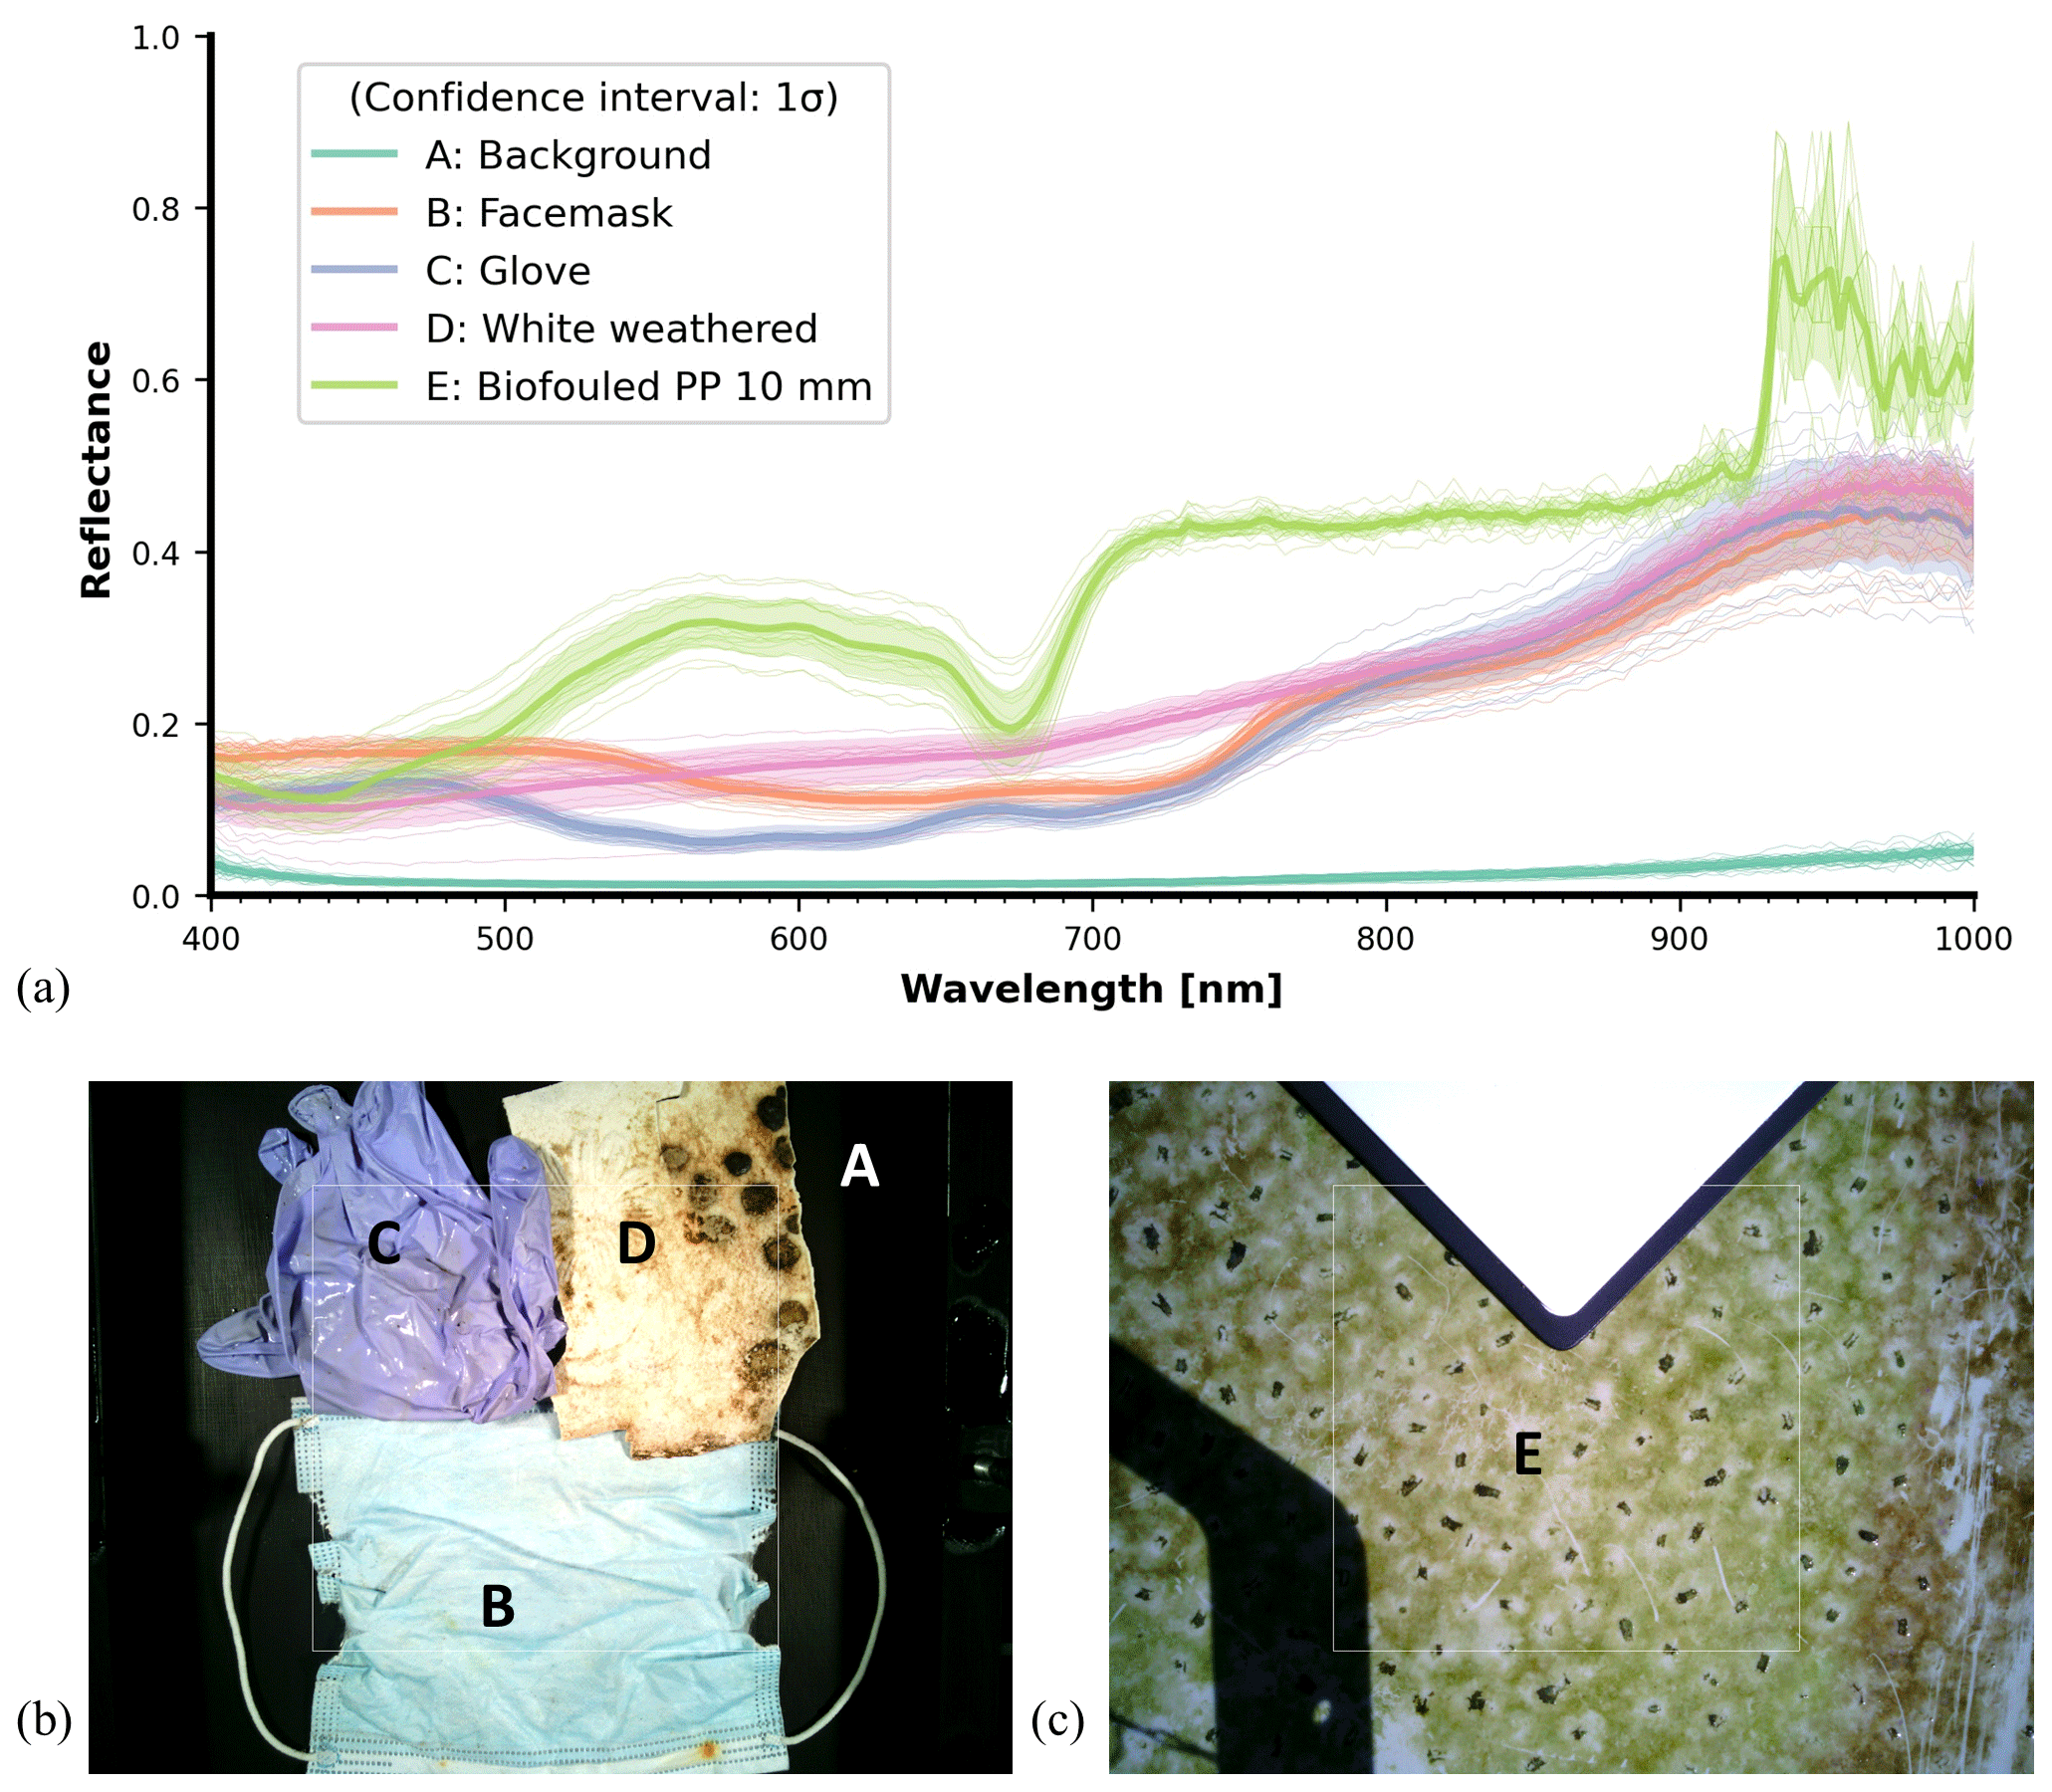
Figure 16Panel (a) shows example spectra, aggregated from the SPECIM IQ hypercube data. For each of the spectral reflectance curves, at least 10 points were sampled from the hypercube. The confidence intervals are obtained as the standard deviation of the data points across each sample. Panel (b) shows the multimaterial sample, which is represented by line plots A–D. Panel (c) shows an additional 10 mm thickness biofouled PP sample, represented by curve E. Each curve is the average with the shading representing the 1σ confidence interval.
The indoor laboratory data are available in open access through https://doi.org/10.4121/769cc482-b104-4927-a94b-b16f6618c3b3 (de Vries and Garaba, 2023). The outdoor experiment involving the biofouling samples is available at https://doi.org/10.4121/7c53b72a-be97-478b-9288-ff9c850de64b (de Vries et al., 2023).
This study presents and describes an open-access spectral reflectance dataset that was collected in an indoor and outdoor laboratory setting. This dataset provides an opportunity for the scientific community to further examine the relation between submersion in the water column, material properties, biofouling, and key diagnostic wavelengths for plastic marine litter.
Additionally, the data visualizations conducted here have already prompted several observations: first, water depth has a strong influence on the spectral reflectance, as expected. Several diagnostic wavelengths in the SWIR spectrum become obscured at shallow (50 mm) water depths. Second, the material thickness influences the magnitude and contrast of spectral reflectance for several polymer types. The relation between material thickness and reflectance was strongest for HDPE and PA6. Finally, biofouling had a mixed effect on the spectral reflectance magnitude, depending on the material type and wavelength. However, the biofilm did not impact the shape of the spectral reflectance curve significantly in the SWIR. Water depth and material thickness appeared to remain the most significant factors for the spectral reflectance of floating and submerged plastic marine litter.
From a wider perspective and in comparison with recent comparable studies, the dataset presented in this study brings additional detail and range to the domain of hyperspectral remote sensing of plastic marine litter, by including COVID-19-related samples, ocean-harvested samples from the GPGP, live microcosm measurements, and imaging. Furthermore, the inclusion of standardized pristine plastic samples is expected to increase comparability with other studies that have used the same standardized sample set. The hypercube scans of the heterogeneous samples are intended to further enrich the dataset by enabling inspection of the spectral effects of spatial heterogeneity in material aging and biofouling.
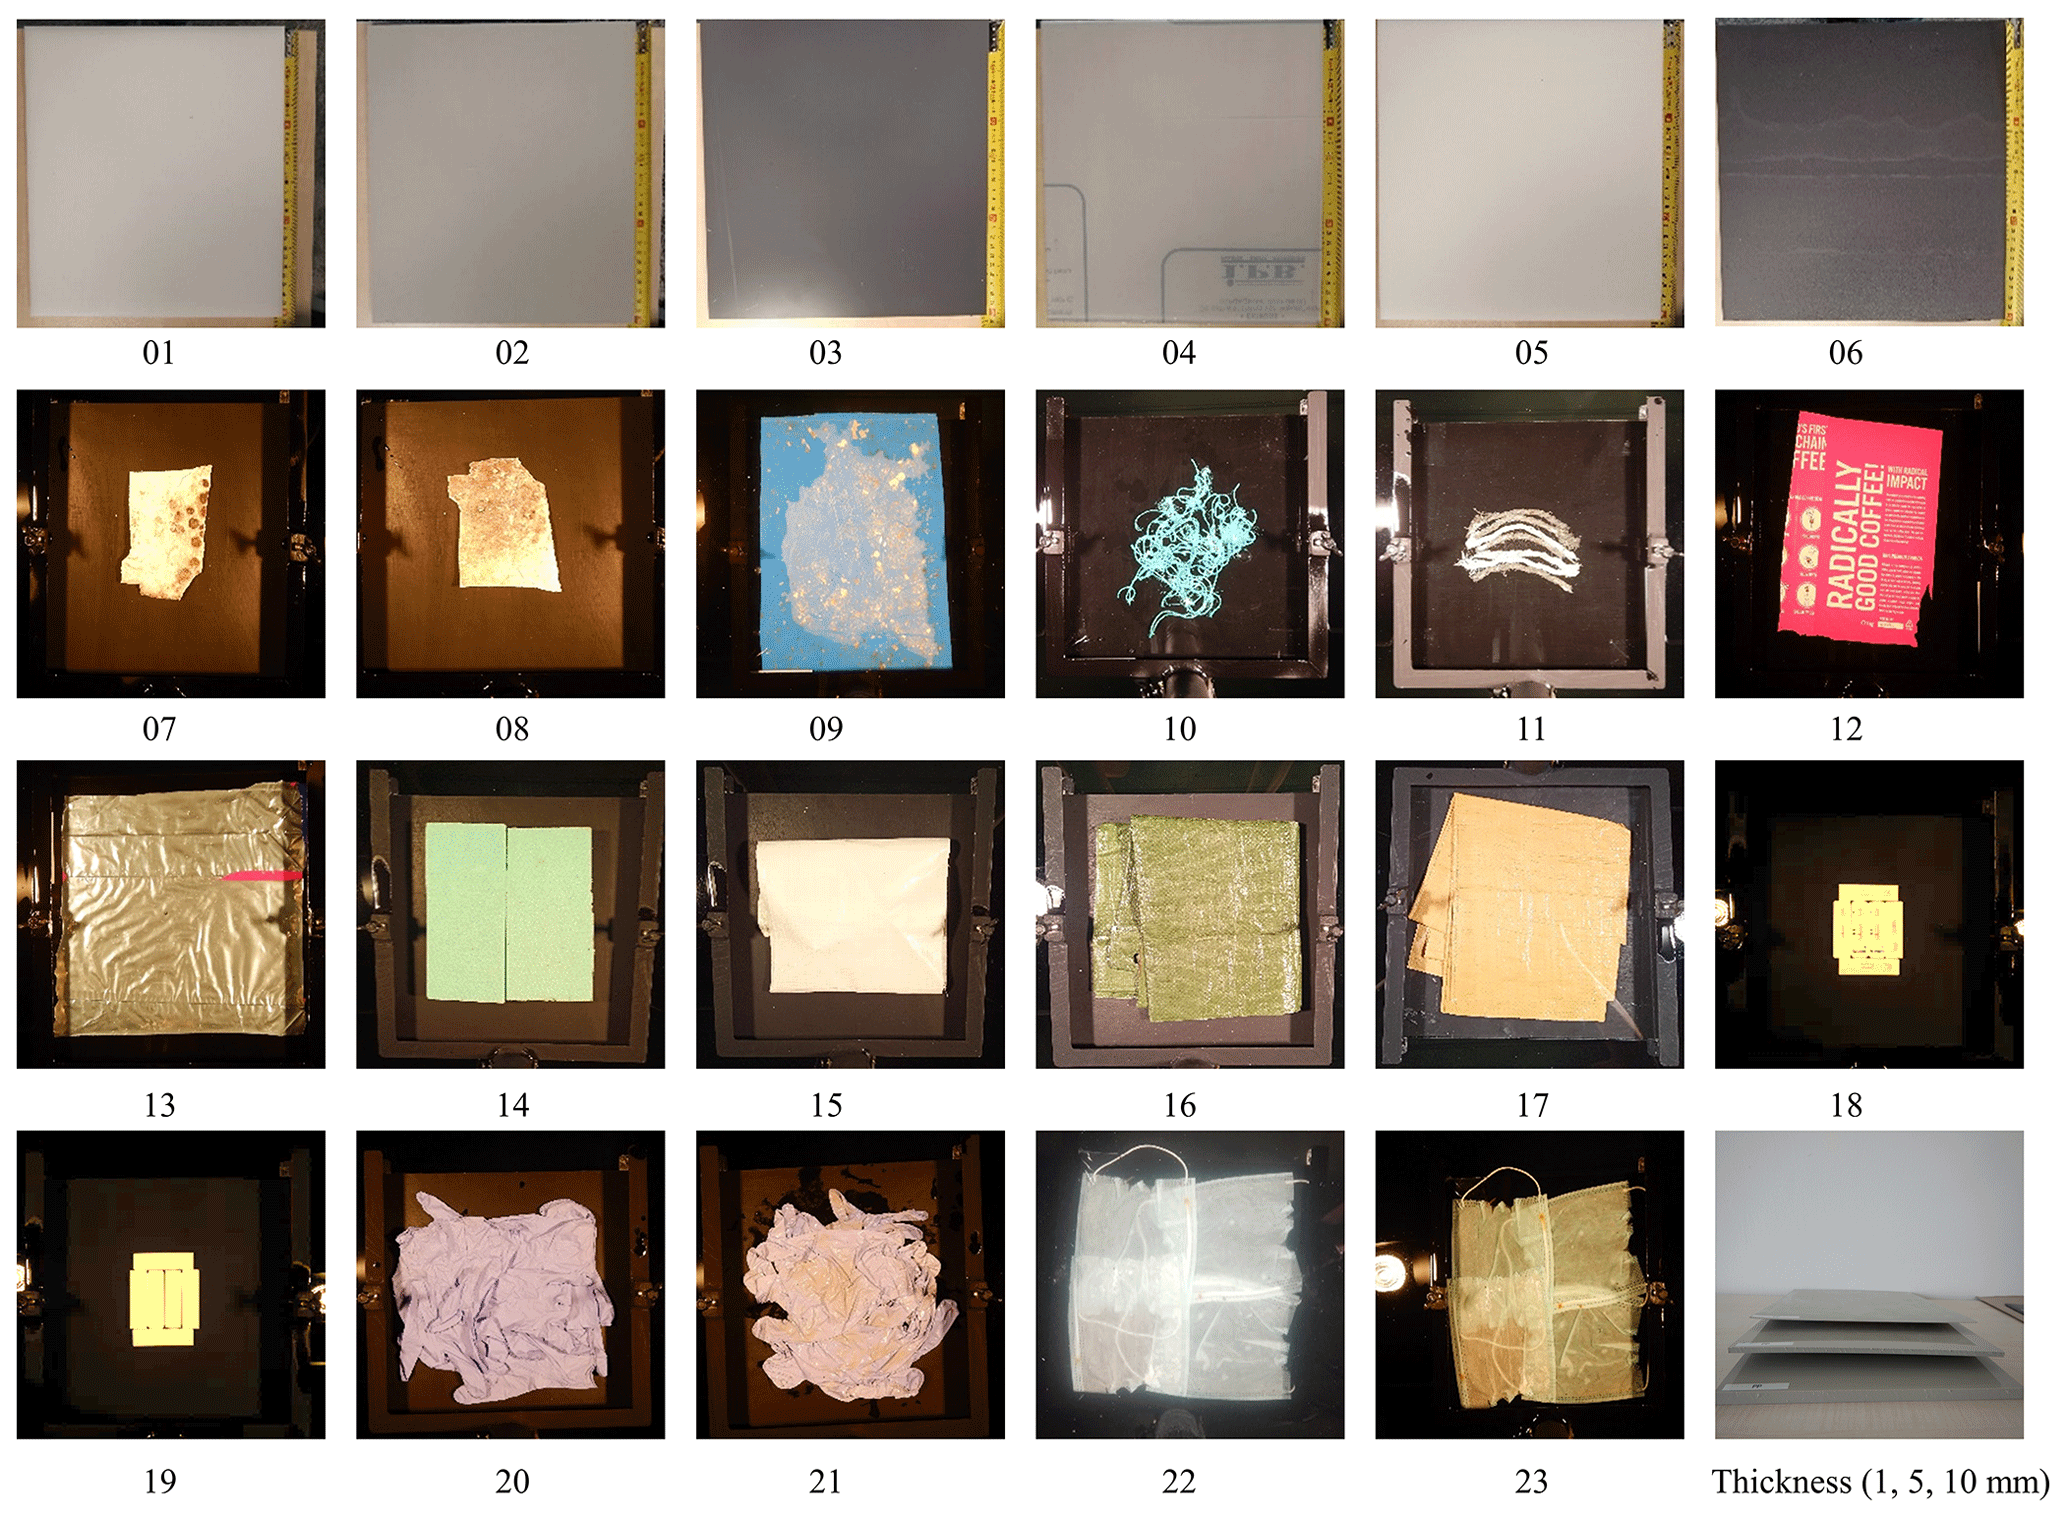
Figure A1Overview photos of the sampled pristine (01–06) and weathered (07–23) plastics observed in August to September 2021 during the reflectance measurement campaign.
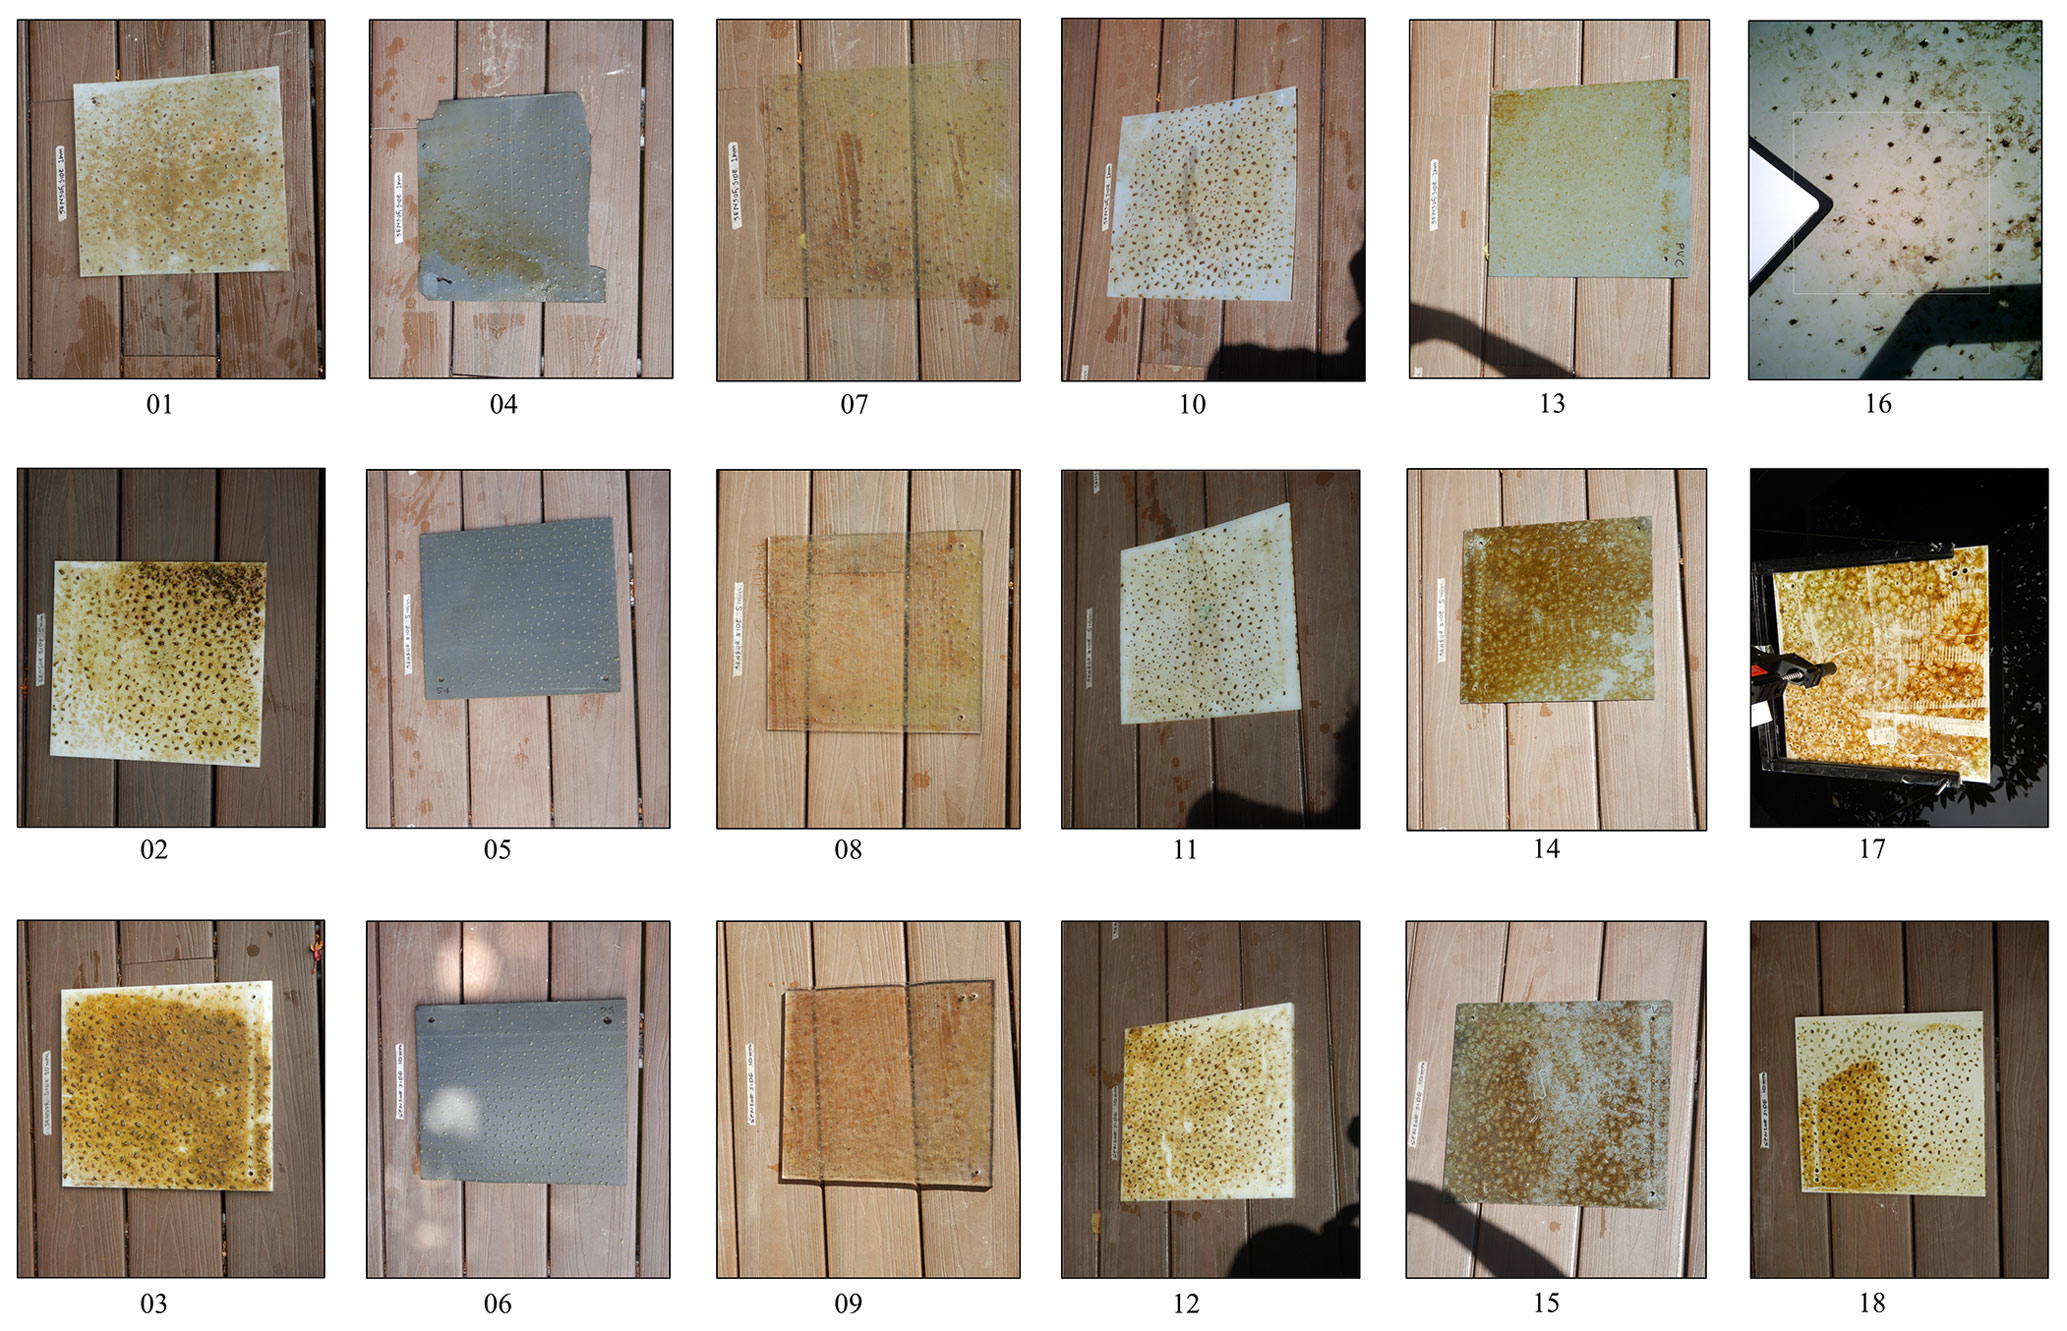
Figure A2Overview of biofouled samples used in the outdoor measurement campaign: HDPE (01–03), XPS (04–06), PET-G (07–09), PA6 (10–12), PVC (13–15), and PP (16–18). Rows from top to bottom denote 1, 5, and 10 mm thickness, respectively. For PP 1 mm (16), the viewfinder preview of the SPECIM IQ camera was used as the overview image was missing.
Figure B1 displays the time series data of the environmental variables during the biofouling microcosm: air temperature, UV irradiance, PAR density, and seawater temperature.
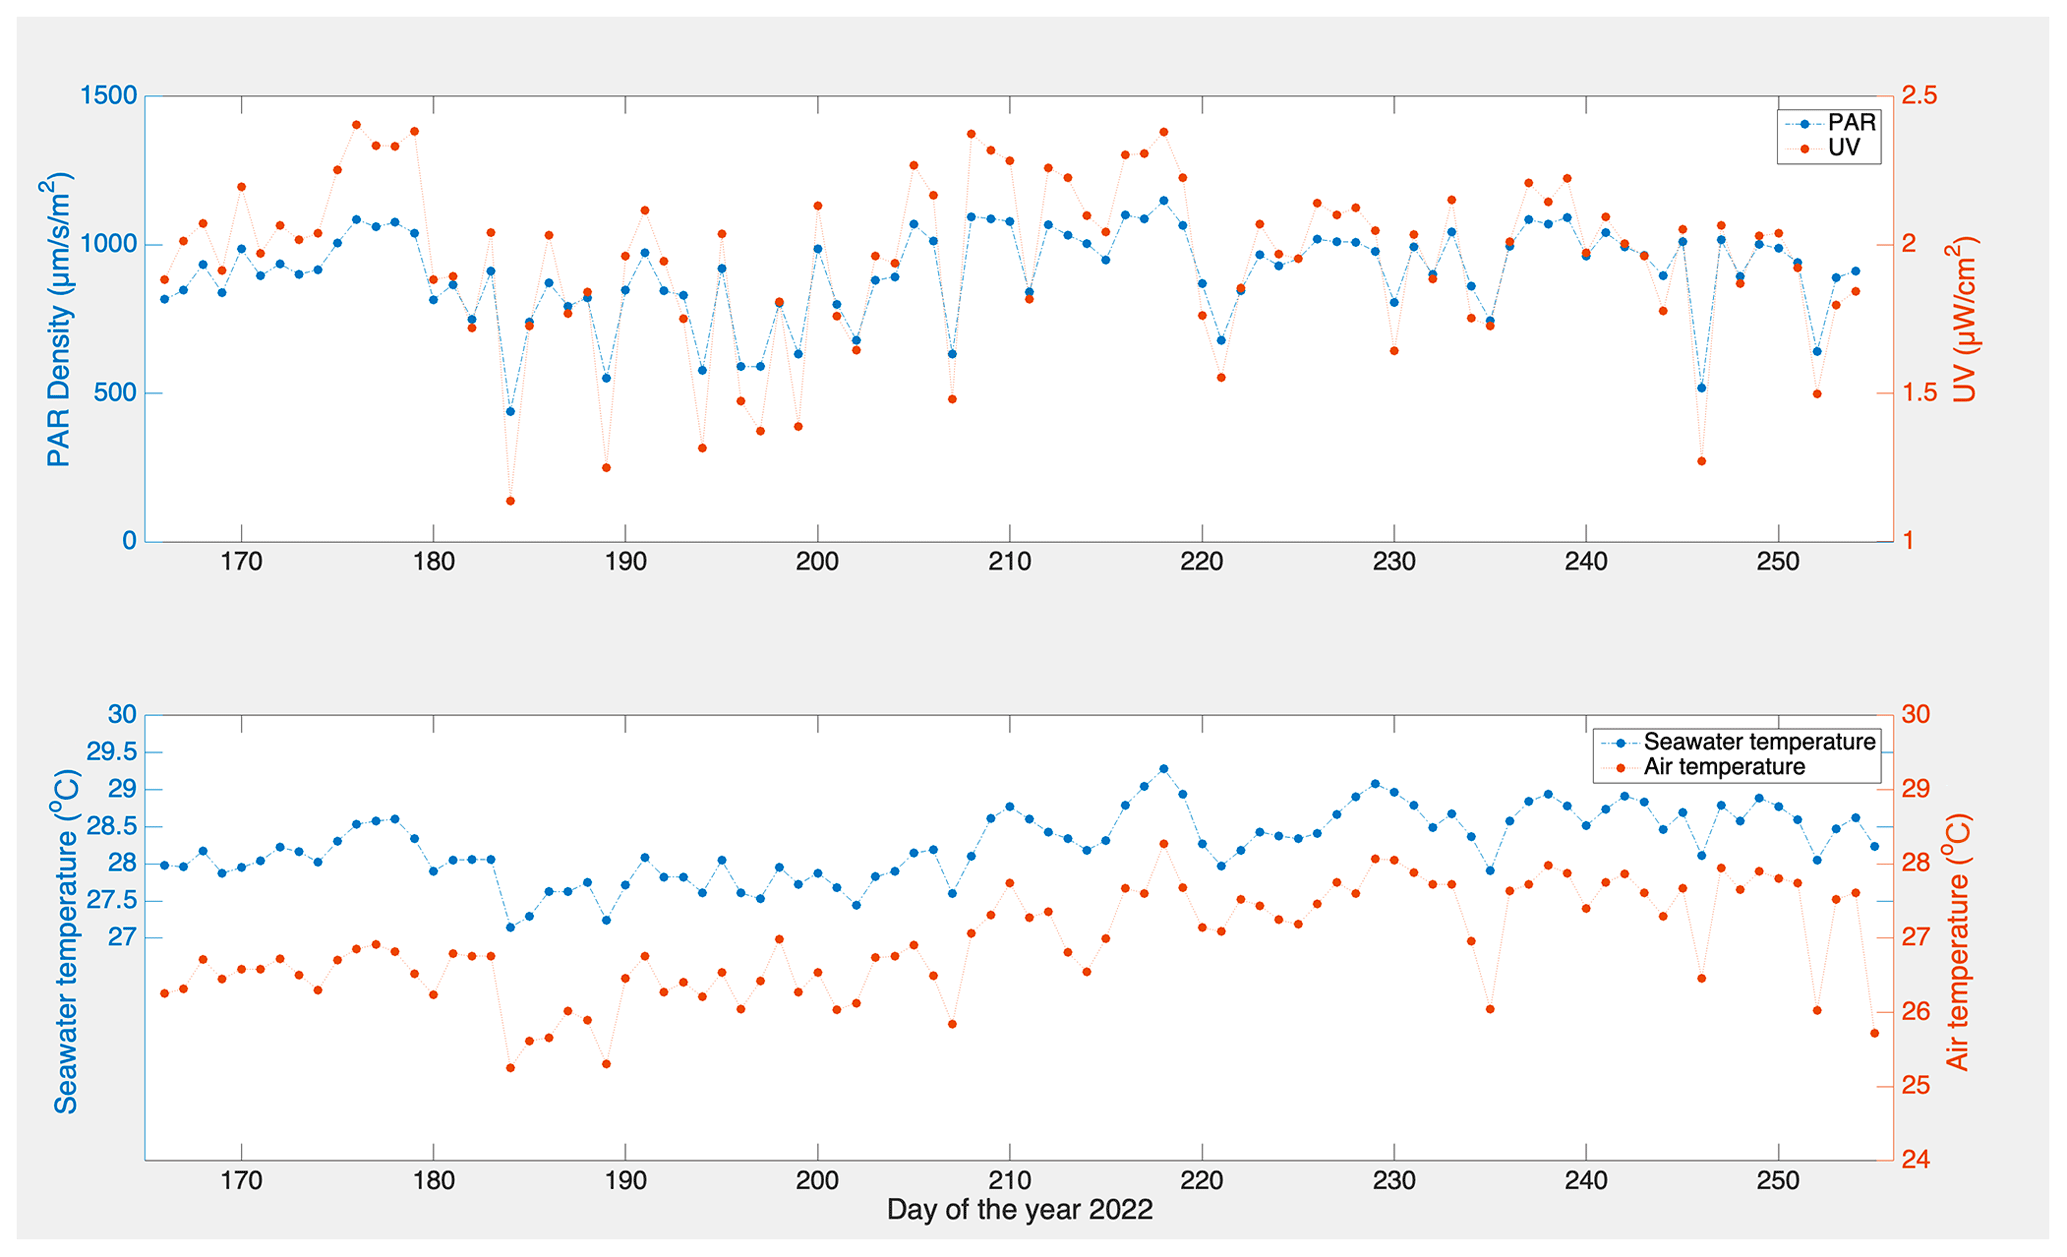
Figure B1Daily average of the ultraviolet radiation (UV), photosynthetically active radiation (PAR), seawater, and air temperature measurements (∘C) of the microcosm experiment from 15 June to 11 September 2022 during local daytime from sunrise to sunset.
Table C1Detailed characteristics of the biofilm on the biofouling microcosm experiment.
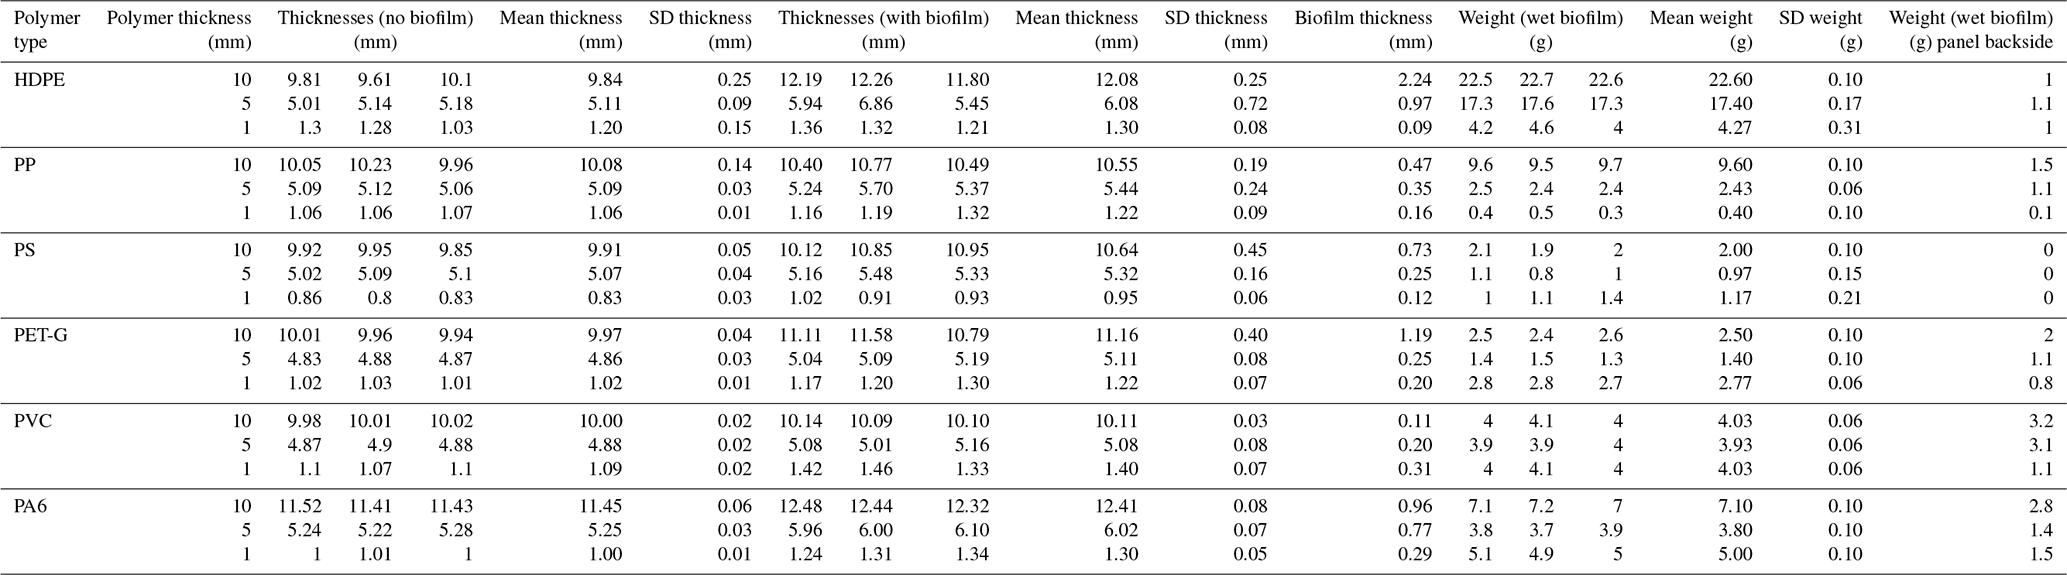
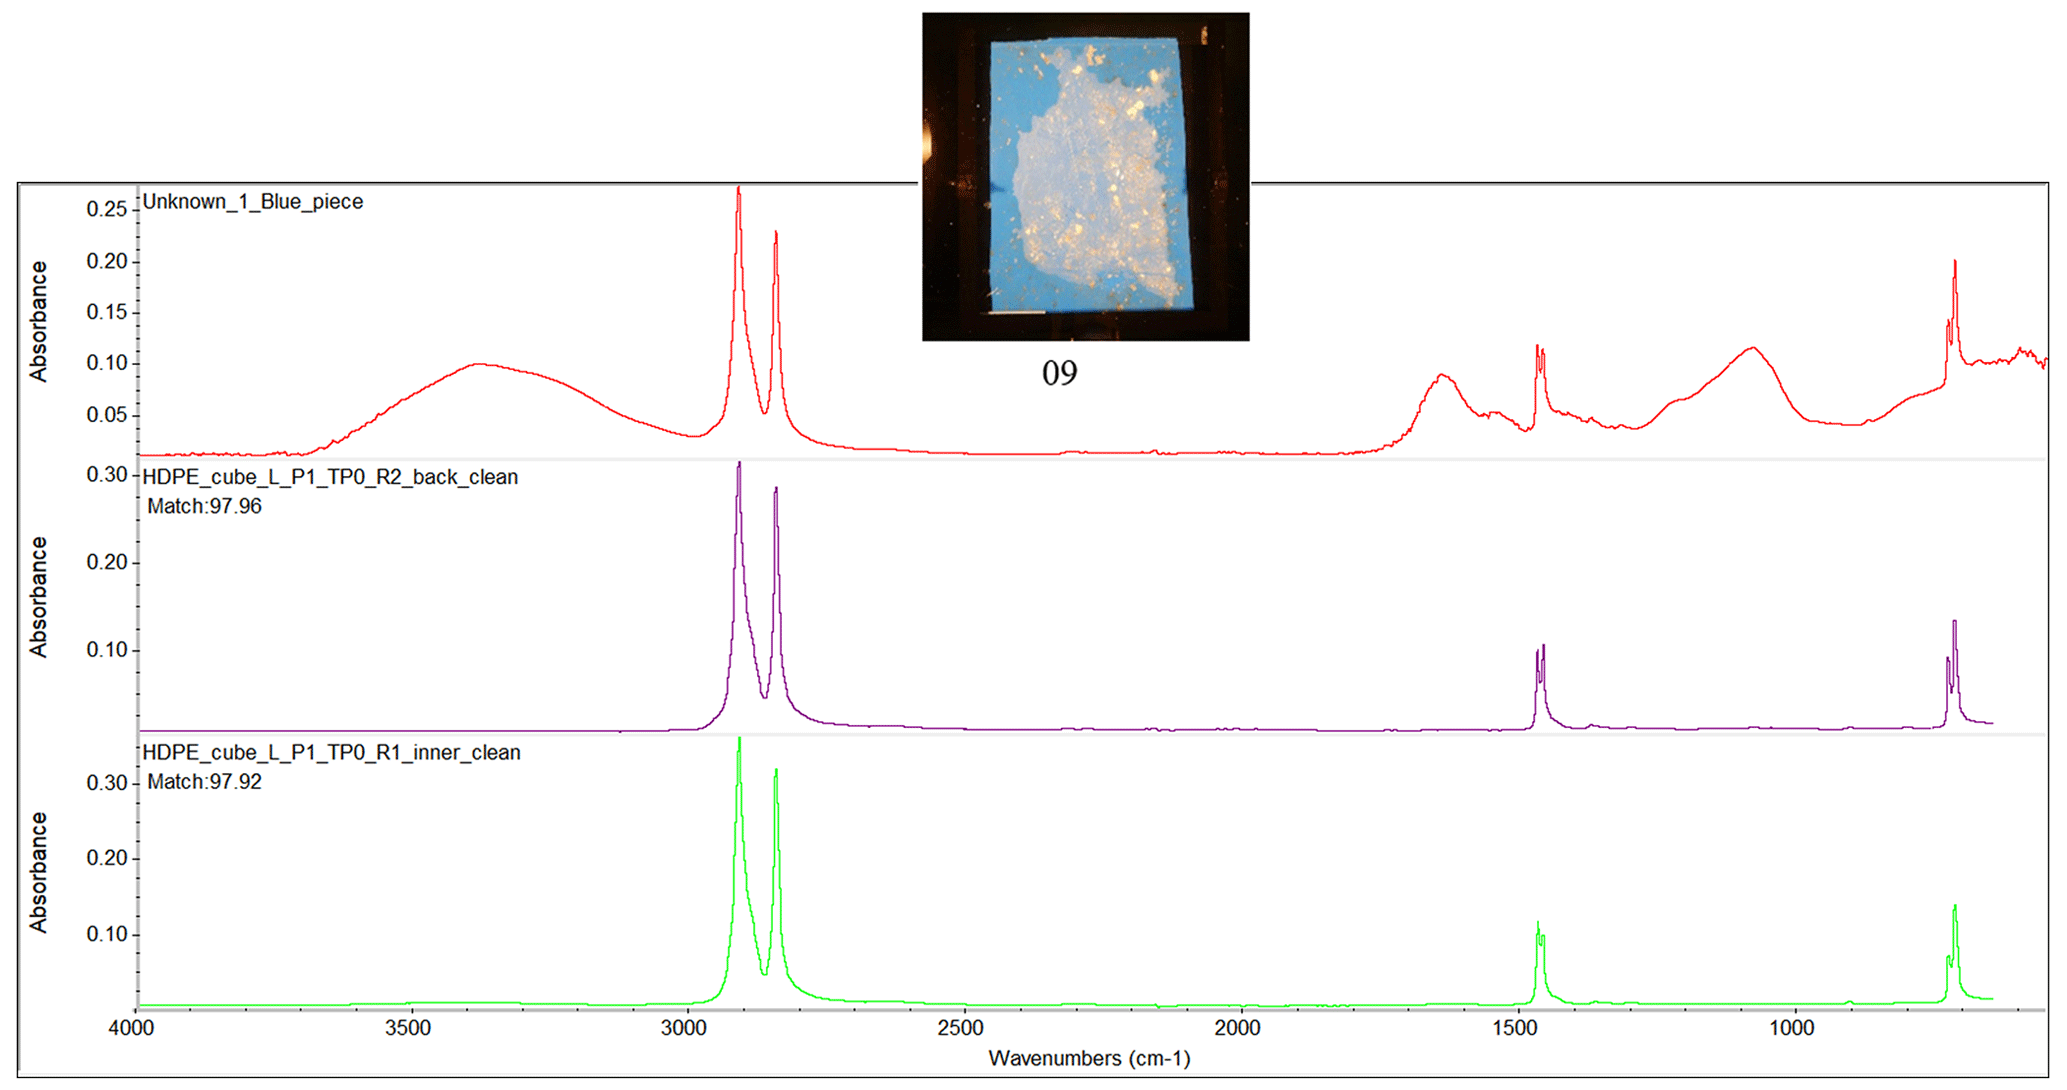
Figure D1Fourier transform infrared (FTIR) spectrum of the ocean-harvested blue piece of plastic, indicating a match with HDPE.
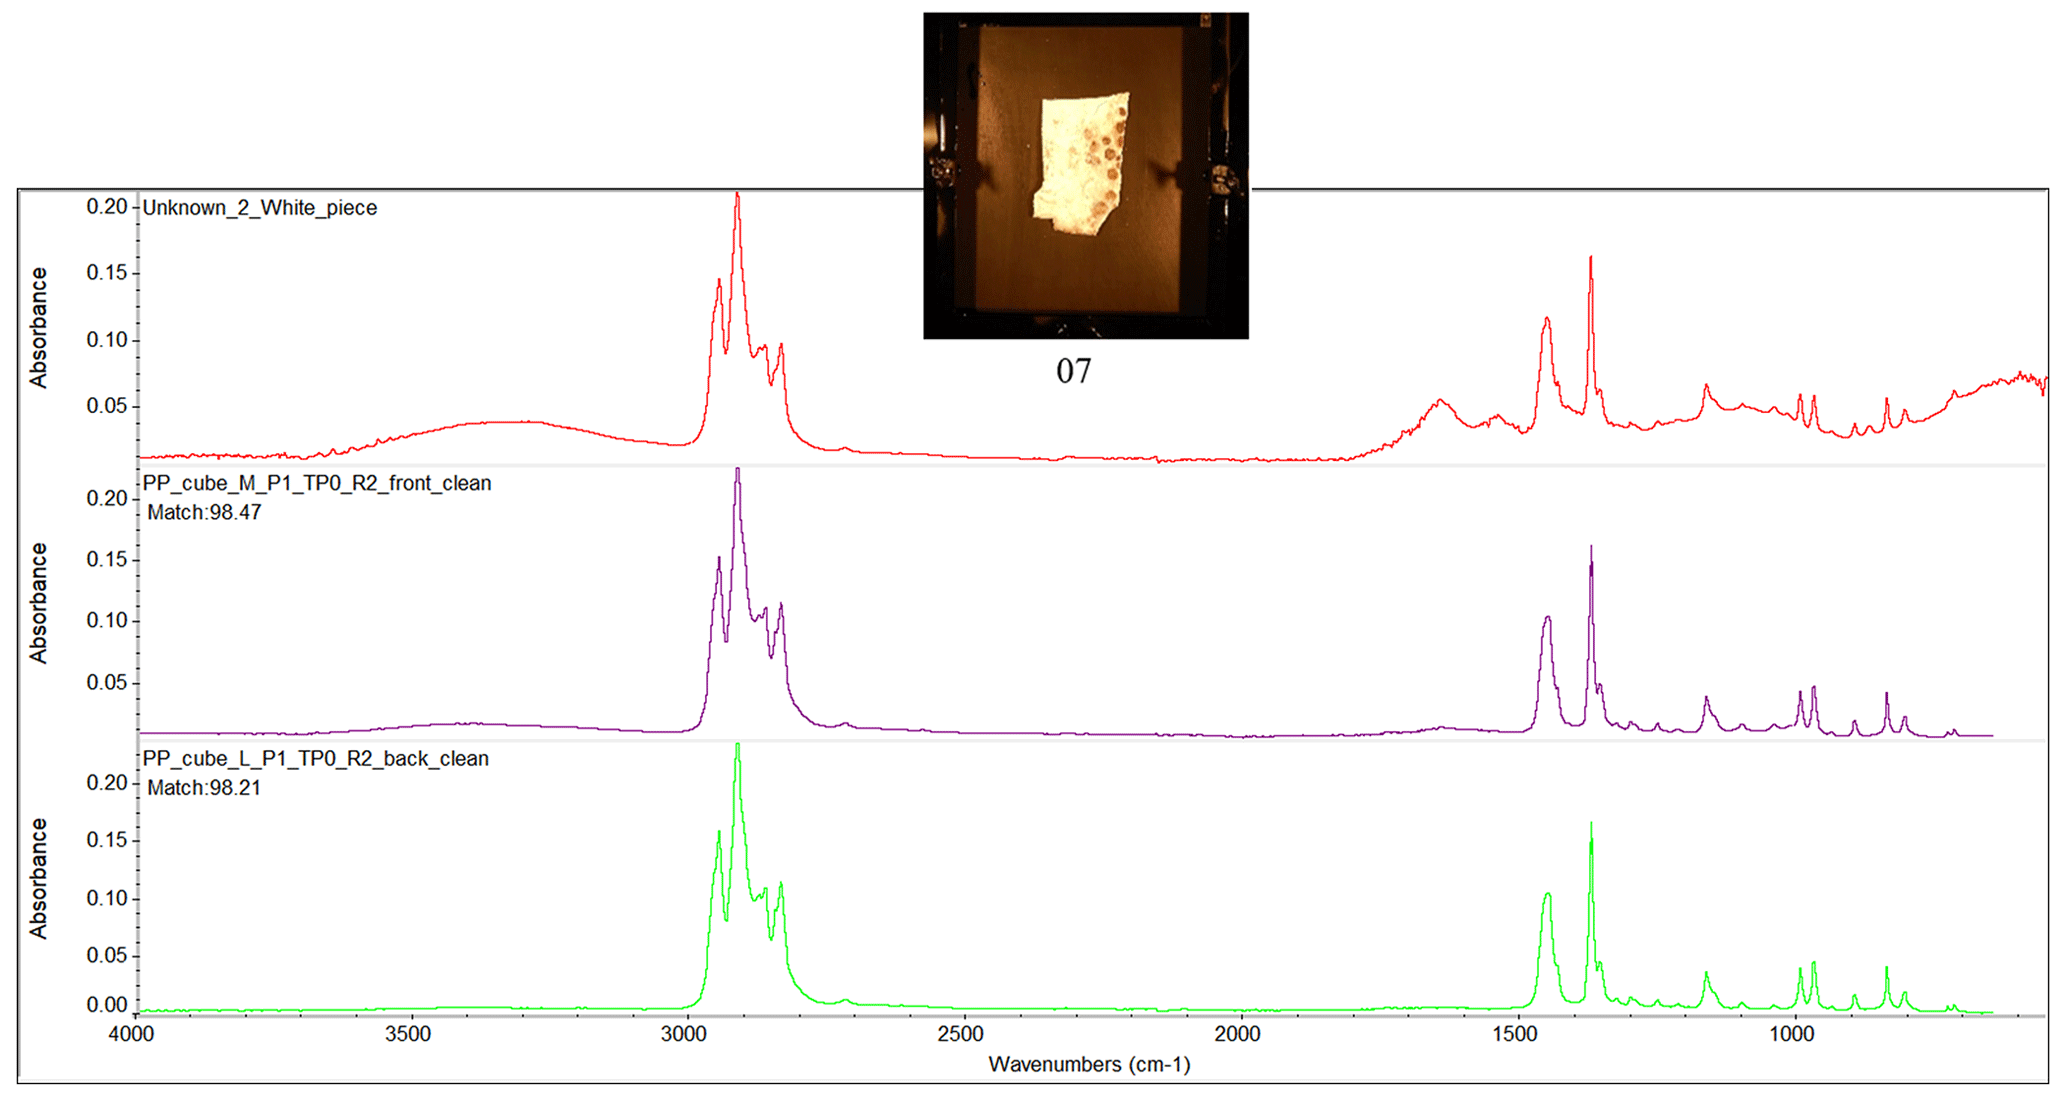
Figure D2FTIR spectrum of the ocean-harvested white piece of plastic, indicating a match with PP.
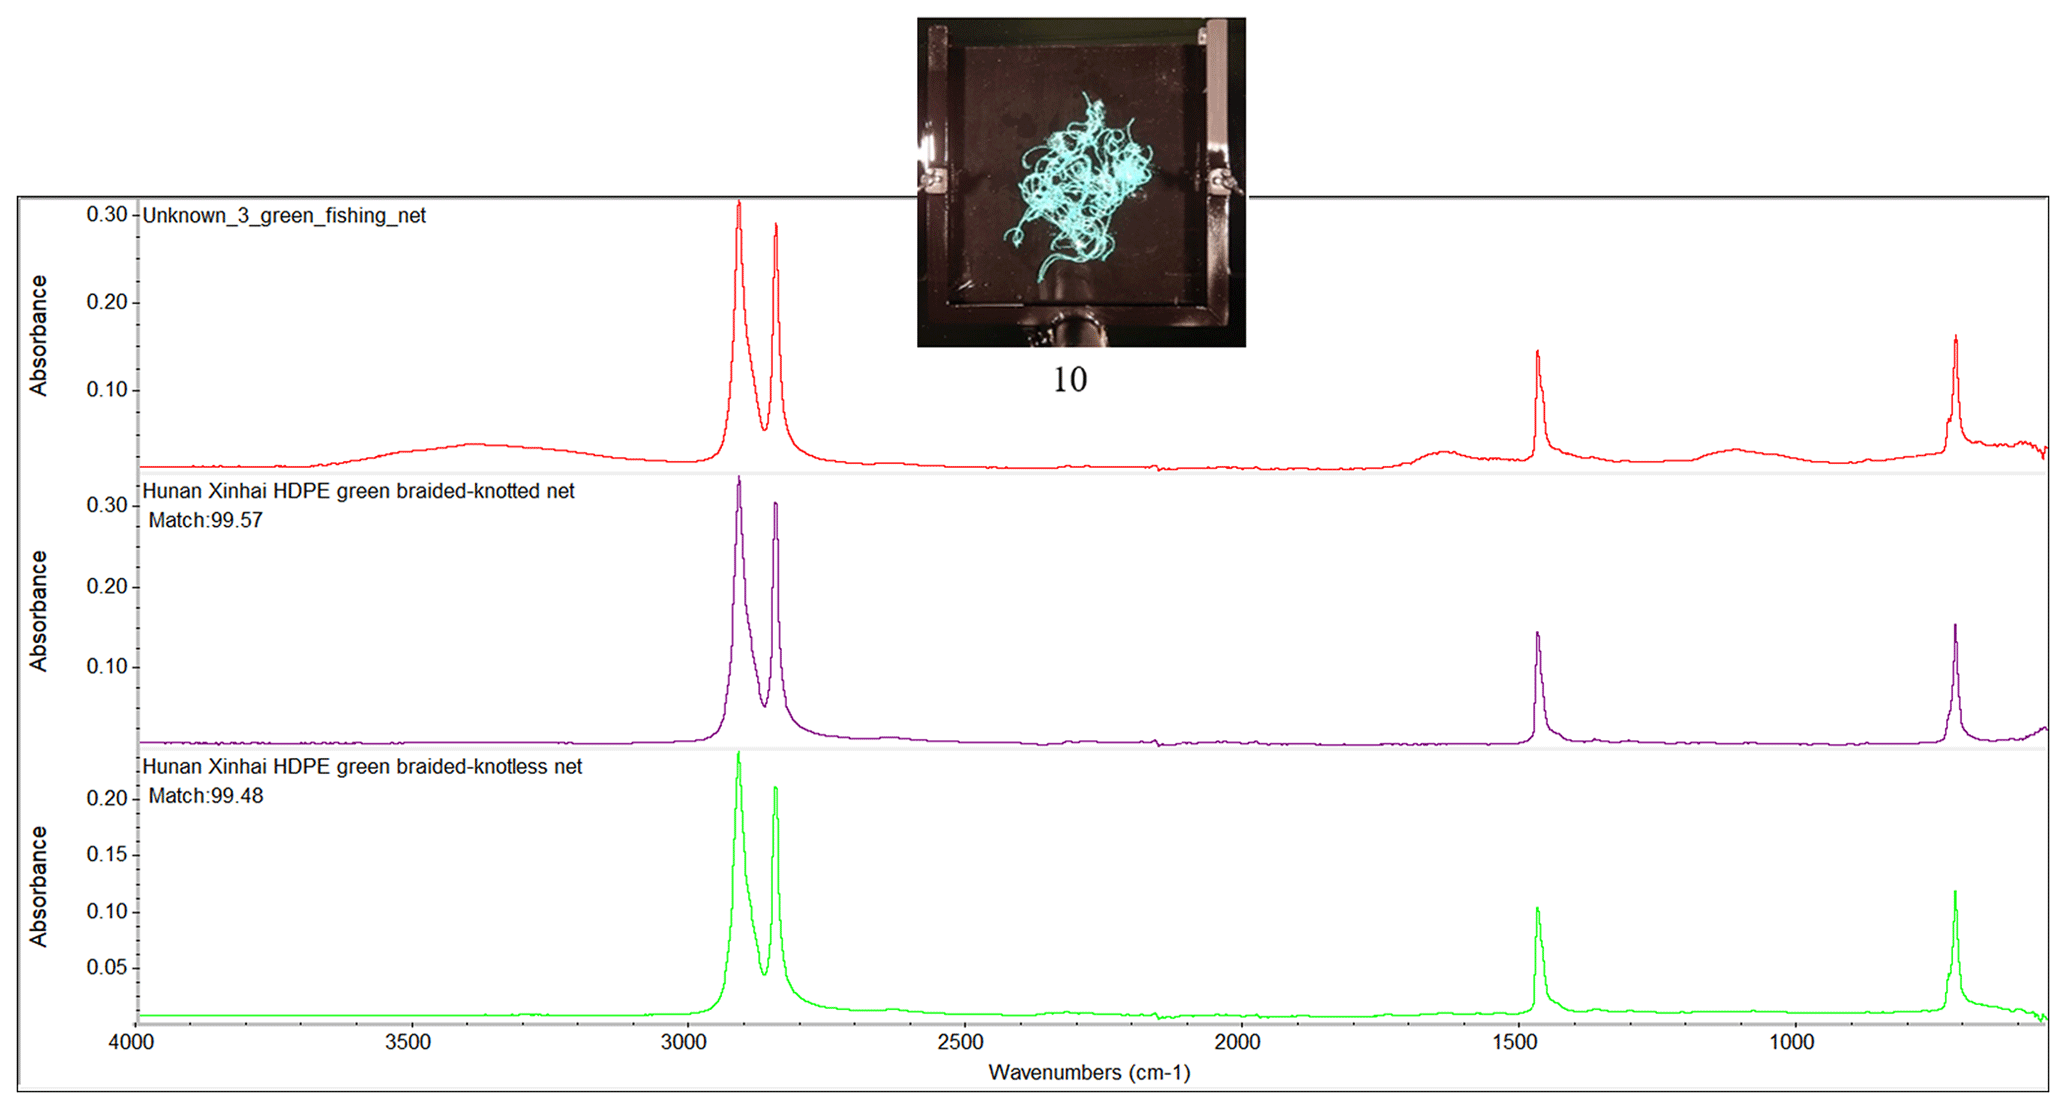
Figure D3FTIR spectrum of the ocean-harvested green fishing net sample, indicating a match with HDPE.
RVFdV, SPG, and SJR designed the experimental setup and conducted the data collection and preparation. RdV performed project management, data quality control, data visualization, and preparation of the dataset for open access. All authors discussed and approved the manuscript.
The contact author has declared that none of the authors has any competing interests.
Publisher’s note: Copernicus Publications remains neutral with regard to jurisdictional claims made in the text, published maps, institutional affiliations, or any other geographical representation in this paper. While Copernicus Publications makes every effort to include appropriate place names, the final responsibility lies with the authors.
We are grateful for the Wilhelmshaven tank construction by Gerrit Behrens, Helmo Nicolai, and Waldemar Siewert. We also thank Timo Sanders for the sample preparation, and Steon Engineering Plastics for supplying the pristine plastics. We thank the Hawai'i Pacific University and the Center for Marine Debris Research for hosting the biofouling microcosm in their facilities. We thank Paolo Corradi of the European Space Agency for discussions about the study, and we acknowledge the Discovery Element of the European Space Agency's Basic Activities for the funding of this work. Finally, we thank The Ocean Cleanup's donors, as the ocean-harvested samples and biofouling setup in Hawaii would not have been possible without them.
This research has been supported by the Deutsche Forschungsgemeinschaft (grant no. 417276871) and the European Space Agency (grant nos. 4000132036/20/NL/GLC and 4000132037/20/NL/GLC).
This paper was edited by Giuseppe M. R. Manzella and reviewed by Samantha Lavender and two anonymous referees.
Barboza, L. G. A., Dick Vethaak, A., Lavorante, B. R. B. O., Lundebye, A.-K., and Guilhermino, L.: Marine microplastic debris: An emerging issue for food security, food safety and human health, Mar. Pollut. Bull., 133, 336–348, https://doi.org/10.1016/j.marpolbul.2018.05.047, 2018.
Beaumont, N. J., Aanesen, M., Austen, M. C., Börger, T., Clark, J. R., Cole, M., Hooper, T., Lindeque, P. K., Pascoe, C., and Wyles, K. J.: Global ecological, social and economic impacts of marine plastic, Mar. Pollut. Bull., 142, 189–195, https://doi.org/10.1016/j.marpolbul.2019.03.022, 2019.
Benson, N. U., Bassey, D. E., and Palanisami, T.: COVID pollution: impact of COVID-19 pandemic on global plastic waste footprint., Heliyon, 7, e06343, https://doi.org/10.1016/j.heliyon.2021.e06343, 2021.
de Vries, R., Egger, M., Mani, T., and Lebreton, L.: Quantifying Floating Plastic Debris At Sea Using Vessel-Based Optical Data and Artificial Intelligence, Int. Geosci. Remote Sens. Symp., 1118–1121, https://doi.org/10.1109/IGARSS47720.2021.9554154, 2021.
de Vries, R. V. F. and Garaba, S. P.: Dataset of spectral reflectances and hypercubes of submerged plastic litter, including COVID-19 medical waste, pristine plastics, and ocean-harvested plastics, 4TU.Research Data [data set], https://doi.org/10.4121/769cc482-b104-4927-a94b-b16f6618c3b3.v1, 2023.
de Vries, R. V. F., Garaba, S. P., and Royer, S.-J.: Dataset of spectral reflectances and hypercubes of submerged biofouled, pristine, and ocean-harvested marine litter, 4TU.Research Data [data set], https://doi.org/10.4121/7c53b72a-be97-478b-9288-ff9c850de64b.v1, 2023.
Garaba, S. P. and Dierssen, H. M.: Hyperspectral ultraviolet to shortwave infrared characteristics of marine-harvested, washed-ashore and virgin plastics, Earth Syst. Sci. Data, 12, 77–86, https://doi.org/10.5194/essd-12-77-2020, 2020.
Garaba, S. P. and Harmel, T.: Top-of-atmosphere hyper and multispectral signatures of submerged plastic litter with changing water clarity and depth, Opt. Express, 30, 16553, https://doi.org/10.1364/oe.451415, 2022.
Garaba, S. P., Aitken, J., Slat, B., Dierssen, H. M., Lebreton, L., Zielinski, O., and Reisser, J.: Sensing Ocean Plastics with an Airborne Hyperspectral Shortwave Infrared Imager, Environ. Sci. Technol., 52, 11699–11707, https://doi.org/10.1021/acs.est.8b02855, 2018.
Garaba, S. P., Acuña-Ruz, T., and Mattar, C. B.: Hyperspectral longwave infrared reflectance spectra of naturally dried algae, anthropogenic plastics, sands and shells, Earth Syst. Sci. Data, 12, 2665–2678, https://doi.org/10.5194/essd-12-2665-2020, 2020.
Garaba, S. P., Arias, M., Corradi, P., Harmel, T., de Vries, R., and Lebreton, L.: Concentration, anisotropic and apparent colour effects on optical reflectance properties of virgin and ocean-harvested plastics, J. Hazard. Mater., 406, 124290, https://doi.org/10.1016/j.jhazmat.2020.124290, 2021.
GESAMP: Guidelines for the monitoring and assessment of plastic litter in the ocean, Rep. Stud. GESAMP, no 99, 130 pp., http://www.gesamp.org/site/assets/files/2002/rs99e.pdf (last access: 6 September 2023), 2019.
Goddijn-Murphy, L. and Dufaur, J.: Proof of concept for a model of light reflectance of plastics floating on natural waters, Mar. Pollut. Bull., 135, 1145–1157, https://doi.org/10.1016/j.marpolbul.2018.08.044, 2018.
Guffogg, J. A., Blades, S. M., Soto-Berelov, M., Bellman, C. J., Skidmore, A. K., and Jones, S. D.: Quantifying marine plastic debris in a beach environment using spectral analysis, Remote Sens., 13, 4548, https://doi.org/10.3390/rs13224548, 2021.
Knaeps, E., Sterckx, S., Strackx, G., Mijnendonckx, J., Moshtaghi, M., Garaba, S. P., and Meire, D.: Hyperspectral-reflectance dataset of dry, wet and submerged marine litter, Earth Syst. Sci. Data, 13, 713–730, https://doi.org/10.5194/essd-13-713-2021, 2021.
Kooi, M., Reisser, J., Slat, B., Ferrari, F. F., Schmid, M. S., Cunsolo, S., Brambini, R., Noble, K., Sirks, L. A., Linders, T. E. W., Schoeneich-Argent, R. I., and Koelmans, A. A.: The effect of particle properties on the depth profile of buoyant plastics in the ocean, Sci. Rep., 6, 33882, https://doi.org/10.1038/srep33882, 2016.
Law, K. L., Morét-Ferguson, S. E., Goodwin, D. S., Zettler, E. R., DeForce, E., Kukulka, T., and Proskurowski, G.: Distribution of Surface Plastic Debris in the Eastern Pacific Ocean from an 11-Year Data Set, Environ. Sci. Technol., 48, 4732–4738, https://doi.org/10.1021/es4053076, 2014.
Lebreton, L., Slat, B., Ferrari, F., Aitken, J., Marthouse, R., Hajbane, S., Sainte-Rose, B., Aitken, J., Marthouse, R., Hajbane, S., Cunsolo, S., Schwarz, A., Levivier, A., Noble, K., Debeljak, P., Maral, H., Schoeneich-Argent, R., Brambini, R., and Reisser, J.: Evidence that the Great Pacific Garbage Patch is rapidly accumulating plastic, Sci. Rep., 8, 4666, https://doi.org/10.1038/s41598-018-22939-w, 2018.
Leone, G., Catarino, A. I., De Keukelaere, L., Bossaer, M., Knaeps, E., and Everaert, G.: Hyperspectral reflectance dataset of pristine, weathered, and biofouled plastics, Earth Syst. Sci. Data, 15, 745–752, https://doi.org/10.5194/essd-15-745-2023, 2023.
Martínez-Vicente, V., Clark, J. R., Corradi, P., Aliani, S., Arias, M., Bochow, M., Bonnery, G., Cole, M., Cózar, A., Donnelly, R., Echevarría, F., Galgani, F., Garaba, S. P., Goddijn-Murphy, L., Lebreton, L., Leslie, H. A., Lindeque, P. K., Maximenko, N., Martin-Lauzer, F.-R., Moller, D., Murphy, P., Palombi, L., Raimondi, V., Reisser, J., Romero, L., Simis, S. G. H., Sterckx, S., Thompson, R. C., Topouzelis, K. N., van Sebille, E., Veiga, J. M., and Vethaak, A. D.: Measuring marine plastic debris from space: Initial assessment of observation requirements, Remote Sens., 11, 2443, https://doi.org/10.3390/rs11202443, 2019.
Maximenko, N., Corradi, P., Law, K. L., Sebille, E. Van, Garaba, S. P., Lampitt, R. S., Galgani, F., Martinez-Vicente, V., Goddijn-Murphy, L., Veiga, J. M., Thompson, R. C., Maes, C., Moller, D., Löscher, C. R., Addamo, A. M., Lamson, M. R., Centurioni, L. R., Posth, N. R., Lumpkin, R., Vinci, M., Martins, A. M., Pieper, C. D., Isobe, A., Hanke, G., Edwards, M., Chubarenko, I. P., Rodriguez, E., Aliani, S., Arias, M., Asner, G. P., Brosich, A., Carlton, J. T., Chao, Y., Cook, A.-M., Cundy, A. B., Galloway, T. S., Giorgetti, A., Goni, G. J., Guichoux, Y., Haram, L. E., Hardesty, B. D., Holdsworth, N., Lebreton, L., Leslie, H. A., Macadam-Somer, I., Mace, T., Manuel, M., Marsh, R., Martinez, E., Mayor, D. J., Moigne, M. Le, Jack, M. E. M., Mowlem, M. C., Obbard, R. W., Pabortsava, K., Robberson, B., Rotaru, A.-E., Ruiz, G. M., Spedicato, M. T., Thiel, M., Turra, A., and Wilcox, C.: Toward the Integrated Marine Debris Observing System, Front. Mar. Sci., 6, 447, https://doi.org/10.3389/fmars.2019.00447, 2019.
Park, Y.-J., Garaba, S. P., and Sainte-Rose, B.: Detecting the Great Pacific Garbage Patch floating plastic litter using WorldView-3 satellite imagery, Opt. Express, 29, 35288, https://doi.org/10.1364/oe.440380, 2021.
Tasseron, P., van Emmerik, T., Peller, J., Schreyers, L., and Biermann, L.: Advancing Floating Macroplastic Detection from Space Using Experimental Hyperspectral Imagery, Remote Sens., 13, 2335, https://doi.org/10.3390/rs13122335, 2021a.
Tasseron, P., van Emmerik, T., Schreyers, L., Biermann, L., and Peller, J.: Hyperspectral plastics dataset supplementary to the paper “Advancing floating plastic detection from space using hyperspectral imagery”, 4TU.Research Data [data set], https://doi.org/10.4121/14518278.v3, 2021b.
Topouzelis, K., Papakonstantinou, A., and Garaba, S. P.: Detection of floating plastics from satellite and unmanned aerial systems (Plastic Litter Project 2018), Int. J. Appl. Earth Obs. Geoinf., 79, 175–183, https://doi.org/10.1016/j.jag.2019.03.011, 2019.
United Nations Environment Programme: From pollution to solution: A global assessment of marine litter and plastic pollution, Nairobi, 148 pp., https://wedocs.unep.org/bitstream/handle/20.500.11822/36963/POLSOL.pdf (last access: 6 September 2023), 2021.
Van Sebille, E., Aliani, S., Law, K. L., Maximenko, N., Alsina, J. M., Bagaev, A., Bergmann, M., Chapron, B., Chubarenko, I., Cózar, A., Delandmeter, P., Egger, M., Fox-Kemper, B., Garaba, S. P., Goddijn-Murphy, L., Hardesty, B. D., Hoffman, M. J., Isobe, A., Jongedijk, C. E., Kaandorp, M. L. A., Khatmullina, L., Koelmans, A. A., Kukulka, T., Laufkötter, C., Lebreton, L., Lobelle, D., Maes, C., Martinez-Vicente, V., Morales Maqueda, M. A., Poulain-Zarcos, M., Rodríguez, E., Ryan, P. G., Shanks, A. L., Shim, W. J., Suaria, G., Thiel, M., Van Den Bremer, T. S., and Wichmann, D.: The physical oceanography of the transport of floating marine debris, Environ. Res. Lett., 15, 023003, https://doi.org/10.1088/1748-9326/ab6d7d, 2020.