the Creative Commons Attribution 4.0 License.
the Creative Commons Attribution 4.0 License.
 | 04 Dec 2023
Global high-resolution drought indices for 1981–2022
Solomon H. Gebrechorkos
Jian Peng
Ellen Dyer
Diego G. Miralles
Sergio M. Vicente-Serrano
Chris Funk
Hylke E. Beck
Dagmawi T. Asfaw
Michael B. Singer
Simon J. Dadson
Droughts are among the most complex and devastating natural hazards globally. High-resolution datasets of drought metrics are essential for monitoring and quantifying the severity, duration, frequency, and spatial extent of droughts at regional and particularly local scales. However, current global drought indices are available only at a coarser spatial resolution (>50 km). To fill this gap, we developed four high-resolution (5 km) gridded drought records based on the standardized precipitation evaporation index (SPEI) covering the period 1981–2022. These multi-scale (1–48 months) SPEI indices are computed based on monthly precipitation (P) from the Climate Hazards Group InfraRed Precipitation with Station Data (CHIRPS, version 2) and Multi-Source Weighted-Ensemble Precipitation (MSWEP, version 2.8), and potential evapotranspiration (PET) from the Global Land Evaporation Amsterdam Model (GLEAM, version 3.7a) and hourly Potential Evapotranspiration (hPET). We generated four SPEI records based on all possible combinations of P and PET datasets: CHIRPS_GLEAM, CHIRPS_hPET, MSWEP_GLEAM, and MSWEP_hPET. These drought records were evaluated globally and exhibited excellent agreement with observation-based estimates of SPEI, root zone soil moisture, and vegetation health indices. The newly developed high-resolution datasets provide more detailed local information and can be used to assess drought severity for particular periods and regions and to determine global, regional, and local trends, thereby supporting the development of site-specific adaptation measures. These datasets are publicly available at the Centre for Environmental Data Analysis (CEDA; https://doi.org/10.5285/ac43da11867243a1bb414e1637802dec) (Gebrechorkos et al., 2023).
- Article
(3965 KB) - Full-text XML
-
Supplement
(839 KB) - BibTeX
- EndNote


Drought is one of the most complex and major natural hazards, and it has devastating impacts on the environment, economy, water resources, agriculture, and society worldwide (Wilhite et al., 2007; Sternberg, 2011; CRED, 2018; Van Loon, 2015; Sheffield et al., 2012; UNCCD, 2022). The most negative impacts of drought include crop failure, food crisis, famine, malnutrition, and poverty, which lead to loss of life and mass migration (Vicente-Serrano et al., 2012; Haile et al., 2019; Ngcamu and Chari, 2020; Gebrechorkos et al., 2020; UNDRR, 2021). Globally, the occurrence of extreme events, such as droughts, has increased as a result of the increase in temperature and atmospheric evaporative demand (Sheffield and Wood, 2012; Mukherjee et al., 2018; Van Loon et al., 2022; Wehner et al., 2021). In addition, increased climate variability has increased the frequency and severity of drought events (Sivakumar et al., 2014; Naumann et al., 2018), which has resulted in significant environmental and socioeconomic damage globally (Mukherjee and Mishra, 2021; UNCCD, 2022). Moreover, the occurrence and impact of droughts are aggravated by anthropogenic activities such as land use change and water management and demand (Van Loon et al., 2022; UNCCD, 2019). During the past few decades a number of extreme drought events, with significant impacts, have occurred in different parts of the world such as in 2001–2009 in southeast Australia (van Dijk et al., 2013; Peng et al., 2019a), 2017 in Europe (García-Herrera et al., 2019), 2015 in East Africa (FEWS-NET, 2015), 2010 in Russia (Spinoni et al., 2015), 2014 in northern China (Wang and He, 2015), 2012–2019 in California (Warter et al., 2021), and 2015–2017 in South Africa (Baudoin et al., 2017), among others. These trends are expected to continue in the future under the projected change in climate (IPCC, 2014; Naumann et al., 2018; Wehner et al., 2021).
Several indices have been defined to quantify and monitor drought at different spatial and temporal scales. Drought indices, such as the Palmer drought severity index (Palmer, 1965), standardized precipitation index (SPI) (McKee et al., 1993), standardized precipitation–evapotranspiration index (SPEI) (Vicente-Serrano et al., 2010a), soil moisture deficit index (Narasimhan and Srinivasan, 2005), deciles index (Gibbs, 1967), and standardized runoff index (Shukla and Wood, 2008), among many others, have been developed and remain widely used. A key property of drought indices is their spatial comparability, and they must be statistically robust (Keyantash and Dracup, 2002). This is also the main property of the SPI, which was recommended by the World Meteorological Organization for identifying and monitoring meteorological droughts in different climates and time periods (Hayes et al., 2011). The SPI is computed based on precipitation, which makes it a simple and easy-to-apply indicator for monitoring and prediction of droughts in different parts of the world (e.g. Zhao et al., 2017; Gebrechorkos et al., 2020; Sun et al., 2022; Cammalleri et al., 2022; Vergni et al., 2017; Kumar et al., 2016; Gao et al., 2018; Hao et al., 2014; Lotfirad et al., 2022). However, the SPI does not consider other climate variables that might affect drought and are not stationary in the current climate change scenario, particularly those meteorological variables that control the atmospheric evaporative demand (Vicente-Serrano et al., 2020, 2022). In fact, several studies have suggested that global warming has increased drought severity, demonstrated by the increased stress on vegetation and water resources (Lespinas et al., 2010; Liang et al., 2010; Carnicer et al., 2011; Allen et al., 2015; Matiu et al., 2017; Mastrotheodoros et al., 2020). Hence, the SPEI (Vicente-Serrano et al., 2010a) accounts also for the role of the increased atmospheric evaporative demand on drought severity (Vicente-Serrano et al., 2020), being particularly dominant during periods of precipitation deficit.
Similar to the SPI, the SPEI can be calculated for a range of timescales (1–48 months). The SPEI calculation requires long-term and high-quality precipitation and atmospheric evaporative demand datasets, which can be obtained from ground stations or gridded data based on reanalysis as well as satellite and multi-source datasets. High-resolution drought information helps to better assess the spatial and temporal changes and variability in drought duration, severity, and magnitude at a much finer scale, which supports the development of site-specific adaptation measures. Globally, the SPEIbase (Vicente-Serrano et al., 2010b) and Global Precipitation Climatology Centre (GPCC) drought index (Ziese et al., 2014) datasets are available at a relatively coarse spatial resolution; the SPEIbase is available at 0.5∘ resolution calculated from the Climatic Research Unit (Harris et al., 2020) precipitation and potential evapotranspiration datasets, and the GPCC drought index provided SPEI datasets at a 1.0∘ spatial resolution for limited timescales (1, 3, 6, 9, 12, 24, and 48 months). These datasets, although useful for long-term assessment, may have limitations for the assessment of drought characteristics at detailed spatial scales.
In this study, four global high-resolution (0.05∘) SPEI datasets based on two high-resolution precipitation and two potential evapotranspiration datasets are developed covering the period from 1981 to 2022. The new SPEI datasets are evaluated against coarser spatial resolution SPEI datasets and other variables such as root zone soil moisture and vegetation indices. The precipitation and evapotranspiration datasets used in this study are widely used and generally reliable, although there may be some regions where their reliability is limited. Hence, developing multiple indices using different datasets will help to better manage and monitor droughts than using a single dataset (Turco et al., 2020), particularly in data-scarce regions of the world such as Africa and South America. Using a single dataset can be limiting, as it may not capture the full spectrum of drought characteristics and impacts. In this study, we utilize two distinct precipitation datasets, each with its unique processing methods and data sources. This approach allows for a detailed assessment of results, significantly increasing the reliability and confidence in the drought assessment. Furthermore, these high-resolution global drought indices serve a critical role in assessing drought impacts on a global, regional, and local scale. Such assessments are invaluable for informing the development of site-specific adaptation measures, as they offer a more nuanced understanding of drought events and their consequences on different scales. This paper offers a comprehensive overview of the datasets and methodologies employed, outlined in Sect. 2. Section 3 provides an in-depth analysis of the results, coupled with a detailed discussion. The availability of the newly developed high-resolution datasets, along with relevant links, is covered in Sect. 4, and Sect. 5 delivers a concise conclusion.
2.1 Datasets
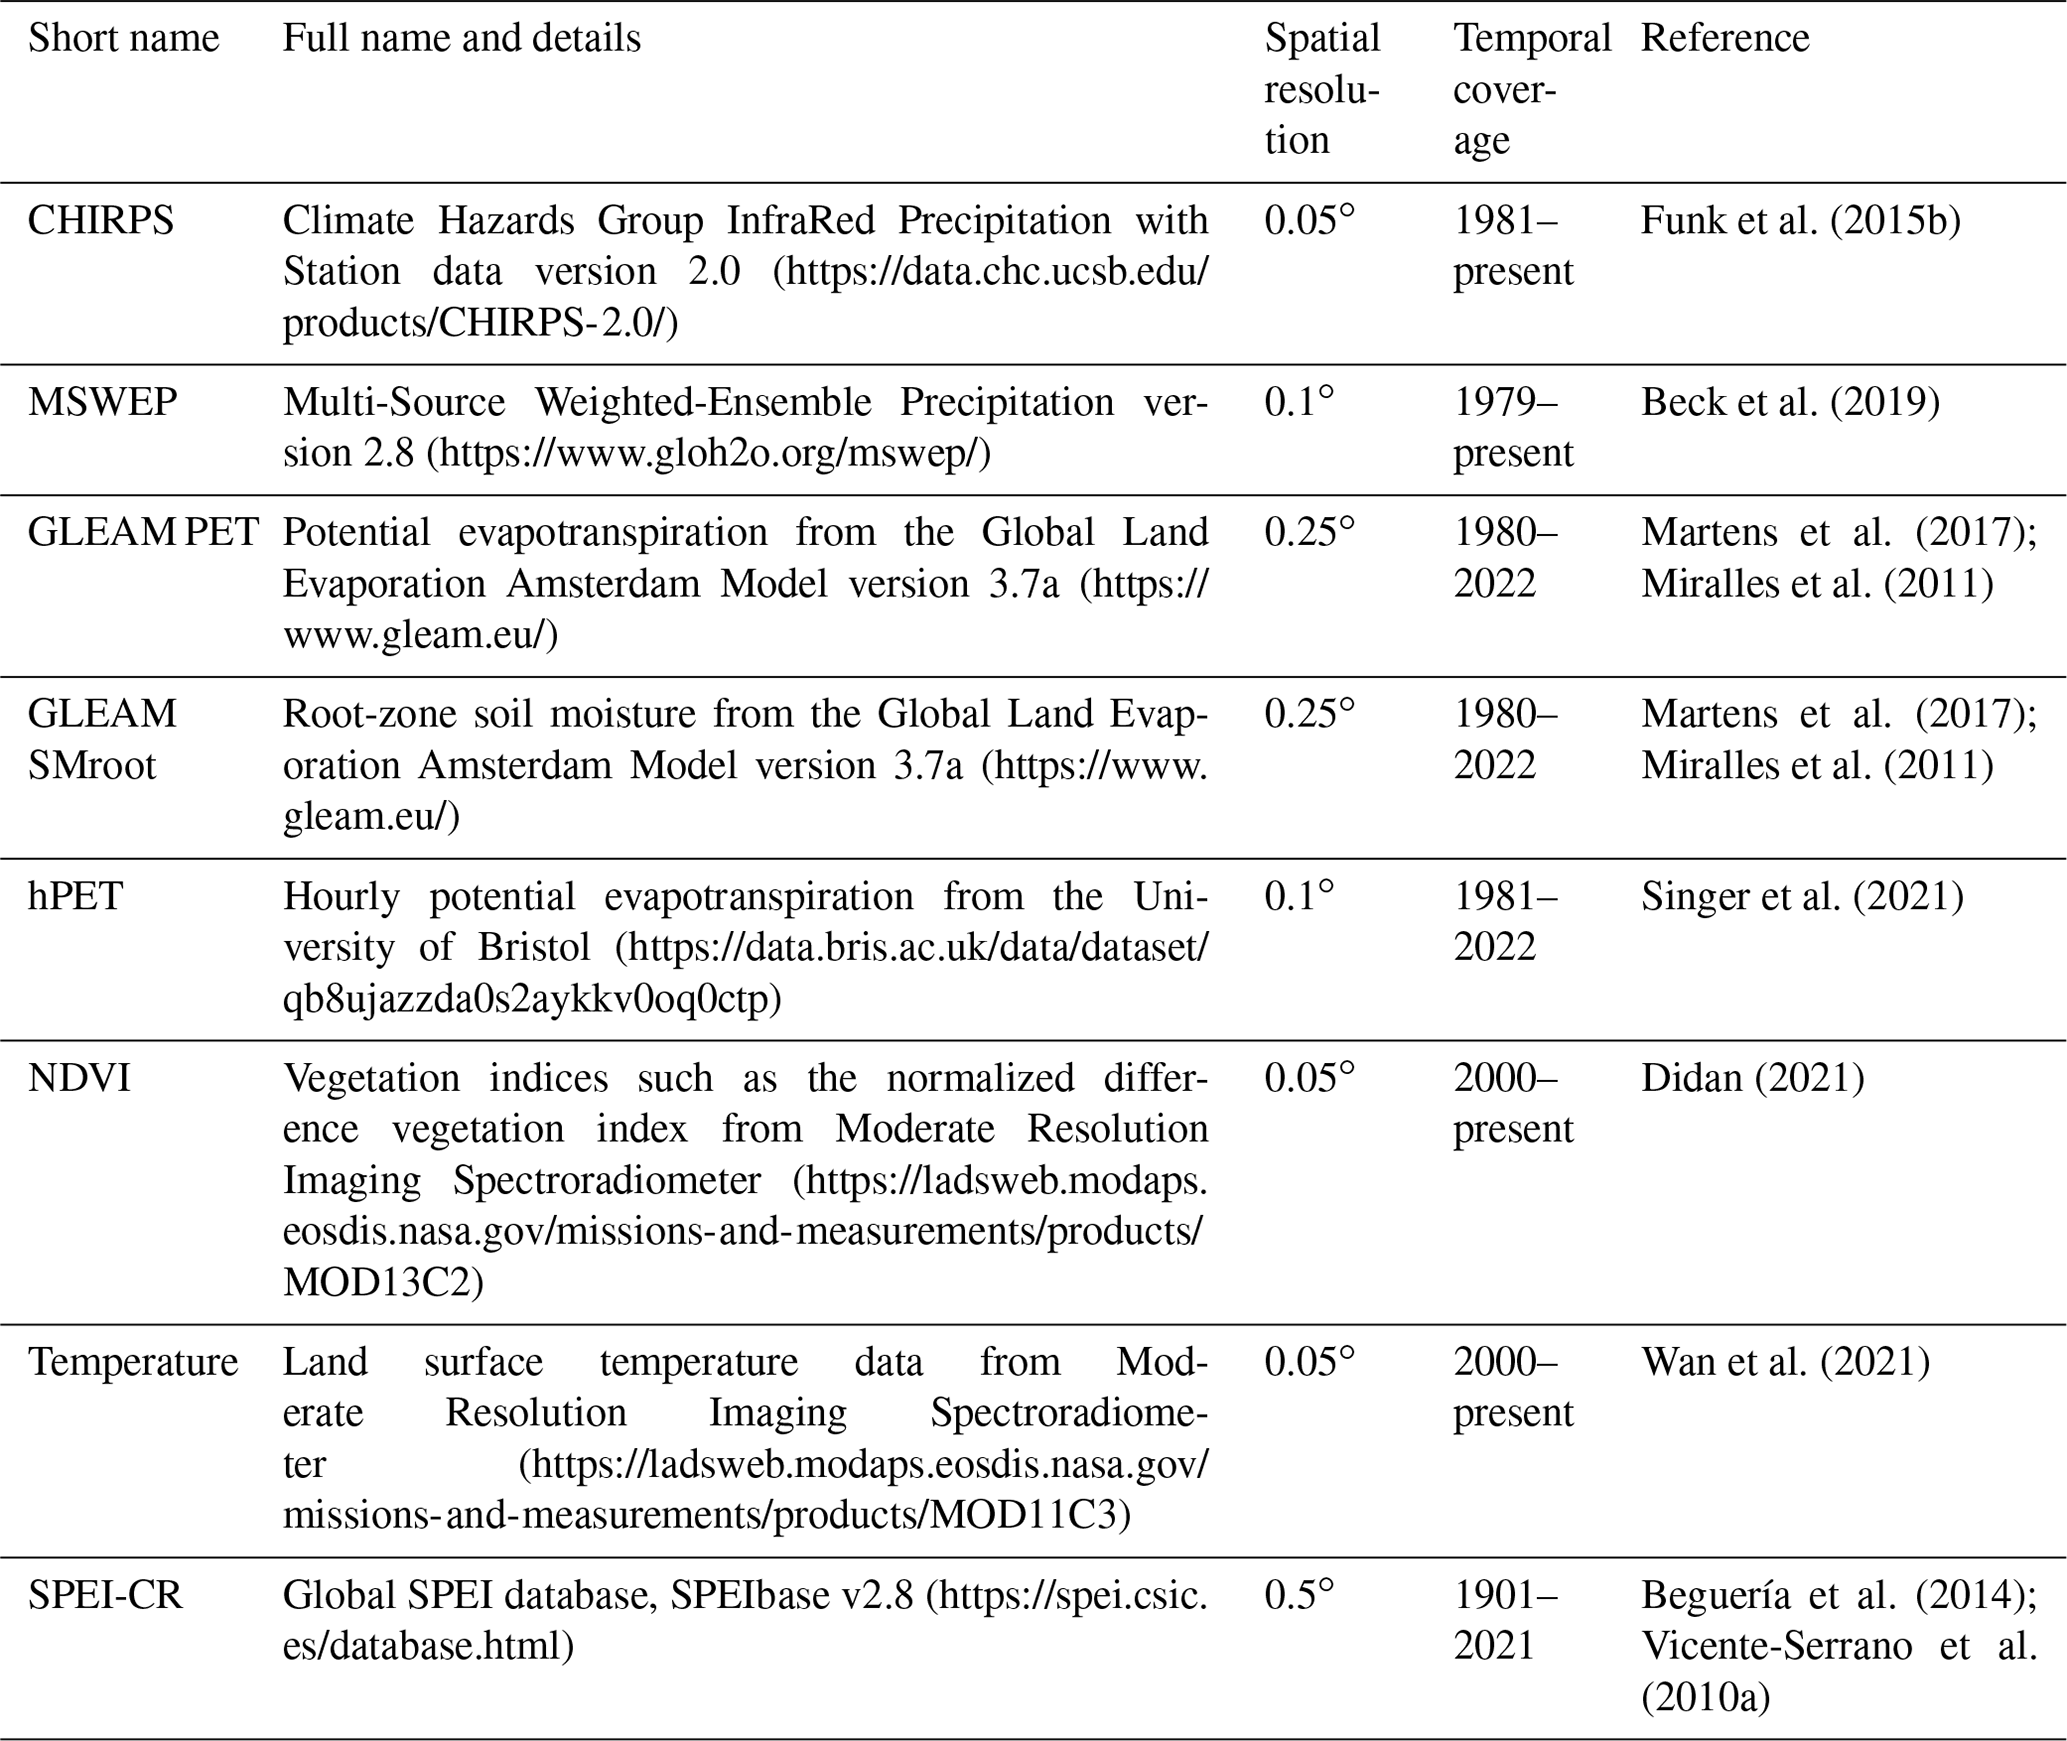
High-resolution precipitation and potential evapotranspiration datasets are selected for developing multi-scale high-resolution SPEI globally (Table 1). To assess the quality of the new high-resolution SPEI (SPEI-HR) we used multiple datasets such as a coarse resolution global SPEI (SPEI-CR), the root-zone soil moisture (SMroot), the vegetation condition index (VCI), and the vegetation health index (VHI). The VCI and VHI are computed based on vegetation indices such as the normalized difference vegetation index (NDVI) and temperature datasets (Table 1).
Table 1Overview of the different datasets used to develop and evaluate the new high-resolution SPEI (SPEI-HR) datasets. Last access: 29 July 2023 (applicable for all URLs in this table).
2.1.1 Precipitation
The Climate Hazards Group InfraRed Precipitation with Station data version 2.0 (CHIRPS) and Multi-Source Weighted-Ensemble Precipitation version 2.8 (MSWEP) precipitation estimates are used to compute SPEI quasi-globally (50∘ S–50∘ N) and globally, respectively.
CHIRPS is a high-resolution quasi-global rainfall product primarily developed for monitoring droughts and global environmental changes (Funk et al., 2015b). CHIRPS provides gauge-satellite precipitation estimates covering most of the globe with a high spatial resolution (0.05∘), low bias, and a long period of record. The product is developed by combining satellite-only Climate Hazards Group Infrared Precipitation (CHIRP), Climate Hazards Group Precipitation Climatology (CHPclim; Funk et al., (2015a)), and data from ground stations. CHIRP and CHPclim were developed based on calibrated infrared cold cloud duration (CCD) precipitation estimates and ground station data from the Global Historical Climate Network (GHCN), and other sources. The product is available at the Climate Hazards Center (https://www.chc.ucsb.edu/data/chirps/, last access: 29 July 2023) on daily, 10 d, and monthly timescales from 1981 to near present. CHIRPS has been evaluated against ground observations and has been widely used in climate, hydrological, and water resources studies, and for monitoring droughts (e.g. Peng et al., 2020; Pyarali et al., 2022; AL-Falahi et al., 2020; Gebrechorkos et al., 2018, 2019b, a; Mianabadi et al., 2022; Ghozat et al., 2022; Gao et al., 2018; Sandeep et al., 2021). The CHIRPS product benefits from homogeneity. The single source of background information (CHIRP) is based on a continuous stream of geostationary satellite thermal infrared observations. These low-bias background fields are then blended with a large set of quality-controlled station observations using a geostatistical blending procedure. The low bias of CHIRP reduces discontinuities associated with changes in station observation networks, which are common in the global south.
The MSWEP is a global (all land and oceans) high-resolution (0.1∘) precipitation product developed by merging multiple datasets including observed station data (∼77 000 stations), reanalyses, and satellite-based rainfall estimates (Beck et al., 2019). The observed station data include the Global Summary of the Day (GSOD), Global Historical Climatology Network-Daily (GHCN-D), WorldClim, Global Precipitation Climatology Centre (GPCC), and various national databases. The satellite datasets incorporated in MSWEP include Global Satellite Mapping of Precipitation (GSMaP), Climate Prediction Center morphing technique (CMORPH), Tropical Rainfall Measuring Mission (TRMM) Multi-satellite Precipitation Analysis (TMPA-3B42RT), and Gridded Satellite (GridSat). The reanalyses incorporated in MSWEP include the Japanese 55-year Reanalysis (JRA-55) and European Centre for Medium-Range Weather Forecasts (ECMWF) interim reanalysis (ERA-Interim). MSWEP have been evaluated and showed the best correlation compared with 22 other global precipitation datasets (Beck et al., 2017) and are widely used in climate, hydrology, and for monitoring droughts (e.g. Li et al., 2022, 2023; Xu et al., 2019; Guo et al., 2022; Gebrechorkos et al., 2022; Swain et al., 2017; Alijanian et al., 2022; Turco et al., 2020). The MSWEP is available via the GloH2O website (https://www.gloh2o.org/mswep/, last access: 29 July 2023) from 1979 to the near present on 3 h, daily, and monthly time frames.
2.1.2 Potential evapotranspiration
High-resolution potential evapotranspiration (PET) from the Global Land Evaporation Amsterdam Model (GLEAM) and hourly Potential Evapotranspiration (hPET) are used as input to develop the SPEI datasets. GLEAM is a set of algorithms designed to calculate actual evaporation, PET, evaporative stress, and root-zone soil moisture (Miralles et al., 2011). The PET from GLEAM v3.7a (GLEAM PET) is developed based on a Priestley–Taylor equation (Eq. 1) driven by satellite and reanalysis data. The data are available globally from 1980 to 2022 at 0.25∘ spatial resolution at daily and monthly timescales (https://www.gleam.eu/, last access: 29 July 2023). The GLEAM data have been extensively evaluated and widely used for global, continental, and regional scale hydro-meteorological applications and drought studies (e.g. Greve et al., 2014; Miralles et al., 2014; Trambauer et al., 2014; Forzieri et al., 2017; Lian et al., 2018; Wartenburger et al., 2018; Zhan et al., 2019; Peng et al., 2019b; Vicente-Serrano et al., 2018).
hPET is a recently developed global high-resolution (0.1∘) dataset available from 1981 to 2022 (Singer et al., 2021). hPET is developed based on ERA5-Land reanalysis and it is openly available from the University of Bristol (https://data.bris.ac.uk/data/dataset/qb8ujazzda0s2aykkv0oq0ctp, last access: 29 July 2023). Unlike the simple Priestley–Taylor equation used in GLEAM PET, the Food and Agriculture Organization (FAO) Penman–Monteith equation (Eq. 2) is used in hPET (Allan et al., 1998), which, in addition to radiation, temperature, and pressure, requires wind speed and dew-point temperature. The hPET data compare closely with the PET calculated based on the Climatic Research Unit (CRU) climate datasets, which are derived from field-based meteorological stations also based on the same FAO Penman–Monteith equation (Singer et al., 2021):
where α is the evaporative coefficient, Δ is the slope of the saturation vapour pressure–temperature relationship, Rn is the net radiation, G is the soil heat flux, λ is the latent heat of vaporization, γ is the psychrometric constant, ρa is the mean air density at constant pressure, cp is the specific heat of the air, (es−ea) is the vapour pressure deficit of the air, ra is aerodynamic resistance, and rs is the surface resistance.
2.1.3 Root zone soil moisture
The GLEAM root zone soil moisture (SMroot) is developed from a multilayer water balance driven by precipitation in which microwave surface soil moisture is assimilated (Martens et al., 2017). The GLEAM SMroot has been validated using observed soil moisture data from more than 2300 soil moisture sensors and 91 eddy-covariance sites (Martens et al., 2017), and inter-compared with other frequently used datasets (Beck et al., 2021).
2.1.4 Coarse-resolution global SPEI datasets
The global coarse resolution (0.5∘) SPEI is a widely used dataset for drought analysis (Vicente-Serrano et al., 2010b; Beguería et al., 2014). This coarse-resolution SPEI (SPEI-CR) was developed based on the 0.5∘ monthly precipitation and PET datasets from the Climate Research Unit (CRU-TS) (Harris et al., 2020). The FAO-56 Penman–Monteith equation is used to compute the CRU-TS PET, which is used to develop the SPEI-CR. In this study, the SPEI-CR from 1981 to 2022 is used to evaluate the SPEI-HR datasets.
2.1.5 Vegetation indices
Vegetation indices, such as the normalized difference vegetation index (NDVI), vegetation condition index (VCI), and vegetation health index (VHI), are used to investigate drought conditions (Peng et al., 2020; Pyarali et al., 2022). Compared with the NDVI and VCI, the VHI includes the effect of temperature on vegetation health. In this study, high-resolution (0.05∘) NDVI (MOD13C2) and land surface temperature (LST; MOD11C3) data from the Moderate Resolution Imaging Spectroradiometer (MODIS) for the period 2000–2022 are used. The VHI is computed based on NDVI and LST for the period 2000–2022 following similar work done for Europe (Bachmair et al., 2018). To compute the VHI (Eq. 5), first, the VCI (Eq. 3) and temperature condition index (TCI; Eq. 4) are computed using the methods developed by Kogan (1995):
where NDVI is the monthly NDVI and NDVImin and NDVImax are the minimum and maximum NDVI values in the time series, respectively. In addition, T is the monthly average temperature, and Tmin and Tmax are the minimum and maximum values of average temperature, respectively. Finally, α is used as a constant value (0.5) in the computation of the VHI.
2.2 Methods
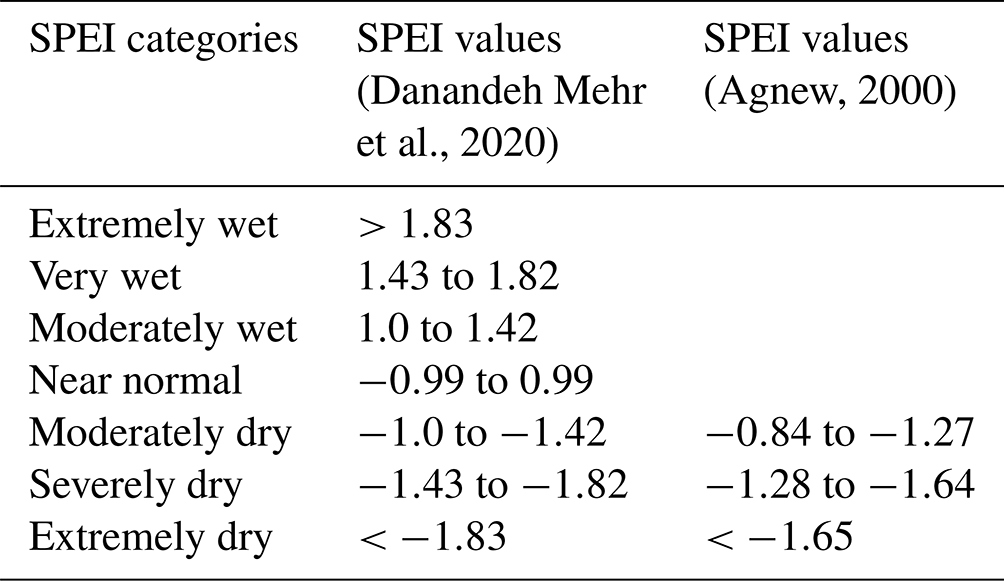
The standardized precipitation–evapotranspiration index (SPEI) (Vicente-Serrano et al., 2010a; Beguería et al., 2014) is a multiscalar drought index which combines the effect of atmospheric evaporative demand and precipitation to quantify the intensity and magnitude droughts over a given period and on different spatial scales (station to global scales). The SPEI has been used in a wide range of applications in hydrology, climate, and agriculture (e.g. Pyarali et al., 2022; Peng et al., 2020; Wang et al., 2021; Gebrechorkos et al., 2020; Naumann et al., 2018; Mohammed et al., 2022). The steps in computing the SPEI include the development of high-quality PET data and the calculation of the difference between supply and atmospheric water demand (precipitation minus PET) at different time scales (1–48 months). These differences are transformed into a normal standard distribution using a log-logistic probability distribution fit in order to have comparable values among periods and regions. The choice of the log-logistic distribution for SPEI is based on previous research (Vicente-Serrano et al., 2010a; Beguería et al., 2014), which demonstrated its superior ability to generate SPEI series with standardized properties (mean =0, SD =1) compared with other probability distributions. The log-logistic distribution involves three key parameters, i.e. α (scale), β (shape), and γ (origin), which are estimated using the robust and straightforward L-moment procedure. Further details on the parameter computation process can be found in Vicente-Serrano et al. (2010a). The wet and dry categories according to the SPEI are summarized in Table 2. In this study, we computed SPEI datasets for the period 1981–2022 using two sets of precipitation and potential evapotranspiration (PET) data. The precipitation datasets CHIRPS and MSWEP were paired with the PET datasets GLEAM PET and hPET. This resulted in the following SPEI indices: MSWEP and GLEAM PET (MSWEP_GLEAM), MSWEP and hPET (MSWEP_hPET), CHIRPS and GLEAM PET (CHIRPS_GLEAM), and CHIRPS and hPET (CHIRPS_hPET). A flow chart is provided in Fig. S1 in the Supplement. The MSWEP, GLEAM, and hPET are spatially interpolated to a 0.05∘ resolution using a bilinear interpolation to match with CHIRPS. Finally, four SPEI datasets are developed based on CHIRPS and GLEAM (CHIRPS_GLEAM), CHIRPS and hPET (CHIRPS_hPET), MSWEP and GLEAM (MSWEP_GLEAM), and MSWEP and hPET (MSWEP_hPET).
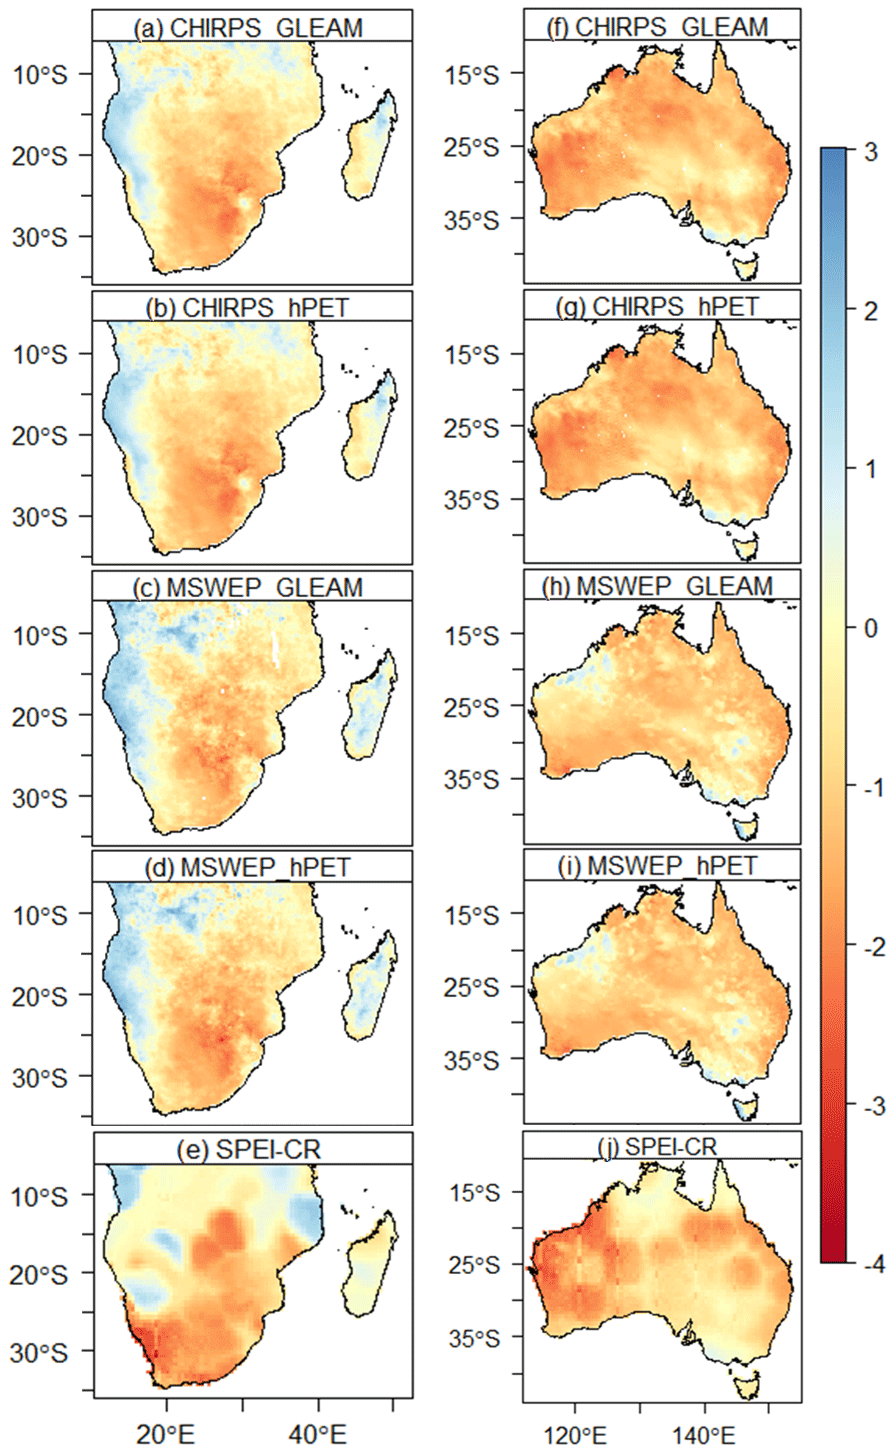
Figure 1An example of 1 month of the SPEI for December 2015 in South Africa and November 2019 in Australia based on CHIRPS_GLEAM (a, f) CHIRPS_hPET (b, g), MSWEP_GLEAM (c, h), MSWEP_hPET (d, i) and SPEI-CR (e, j). The spatial resolution of SPEI-CR is 0.5∘.
The developed high-resolution global SPEI datasets (SPEI-HR) based on CHIRPS_GLEAM, CHIRPS_hPET, MSWEP_GLEAM, and MSWEP_hPET are evaluated against the SPEI-CR, SMroot, VCI, and VHI at a global and a quasi-global scale. For comparison, the SPEI-HR is aggregated to the resolution of the SPEI-CR (0.5∘). In addition, the SMroot is bilinearly interpolated to match the resolution of SPEI-HR. For direct comparison with the SPEI, the SMroot, VCI, and VHI are normalized by subtracting the long-term mean and dividing by the standard deviation. Before normalizing the VCI and VHI values, the seasonal cycle is removed from the time series. Standardizing absolute values allows better comparison of different datasets and has been applied in various studies to compare different drought indices (Pyarali et al., 2022; Peng et al., 2020; Anderson et al., 2011; Mu et al., 2013; Zhao et al., 2017). The comparison between the SPEI-HR and VHI is performed for the period 2000–2022. The agreement between the SPEI-HR and SPEI-CR, SMroot, VCI, and VHI is assessed using Pearson's correlation coefficient.
3.1 Agreement between the SPEI-HR and SPEI-CR datasets
The SPEI-HR, compared with the SPEI-CR, provides more local information and spatial detail on drought conditions (Fig. 1). Figure 1 shows an example of severe droughts in South Africa in 2015 and Australia in 2019. In December to February 2015–2016, South Africa faced a severe drought driven by one of the strongest El Niño events in the past five decades, which caused severe consequences for food security in the region (Funk et al., 2018, 2016). In addition, November 2019 was the driest month in Australia with the lowest rainfall record (Funk, 2021). According to the Australian Government Bureau of Meteorology (Australian Government Bureau of Meteorology, 2023), November 2019 was the driest month across most of the country with lower rainfall and drier soil moisture records. The severe drought events in South Africa and Australia are very well reproduced by the SPEI-CR (Fig. 1). The SPEI-HR, compared to the SPEI-CR, clearly depicted the wetter and drier parts of Australia in November 2019. In Australia, for example, the wet events in the northern part of Western Australia and the central part of New South Wales states are well represented by the SPEI-CR. Similarly, the drought in South Africa in 2015 is well represented by the SPEI-HR as reported by Funk et al. (2018). However, wet events (SPEI up to 2.4) are shown by the SPEI-CR in the northern part of Mozambique. Overall, high-resolution information is more useful for managing and monitoring droughts at a local scale than the SPEI-CR, which exhibits much smoother patterns due to the interpolation of station observations (McRoberts and Nielsen-Gammon, 2012; Santini et al., 2023; Park et al., 2017; Jung et al., 2020).
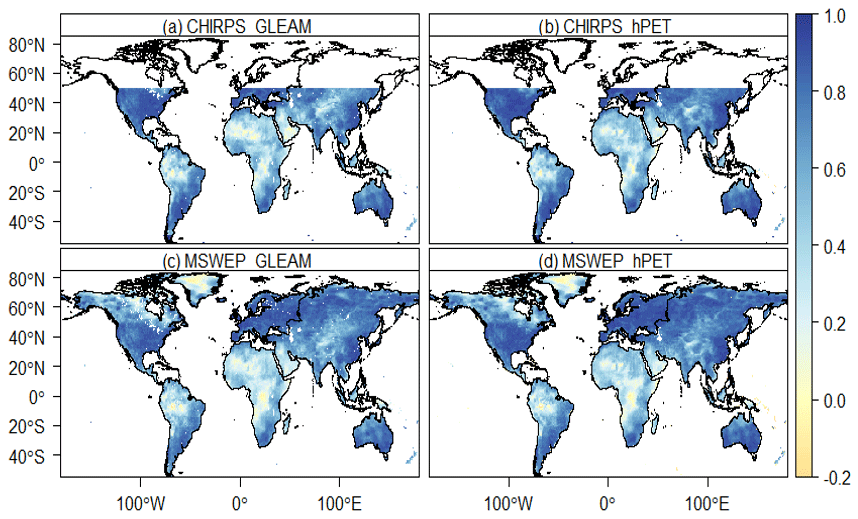
Figure 2Temporal correlation between the new high-resolution SPEI (SPEI-HR) based on (a) CHIRPS_GLEAM, (b) CHIRPS_hPET, (c) MSWEP_GLEAM, and (d) MSWEP_hPET, and the coarse resolution SPEI (SPEI-CR) for SPEI-01 month.
Furthermore, the SPEI-HR datasets are temporally evaluated using the SPEI-CR during the period 1981–2022. For the 1 month SPEI, for example, the correlation between CHIRPS_GLEAM, CHIRPS_hPET, MSWEP_GLEAM, and MSWEP_hPET with the SPEI-CR is significant (R>0.5, p<0.1) in large parts of the world (Fig. 2). The correlation between the SPEI-HR and SPEI-CR in the USA, Europe, Asia, and Australia is >0.8. However, it is lower in the tropical and arid regions of Africa and South America. The lower correlations reflect a lower data quality in these regions due to a lack of station observations (Menne et al., 2012) and the frequent occurrence of difficult-to-predict (using models) and measure (using gauges) intense, localized convective storms (Feng et al., 2021).
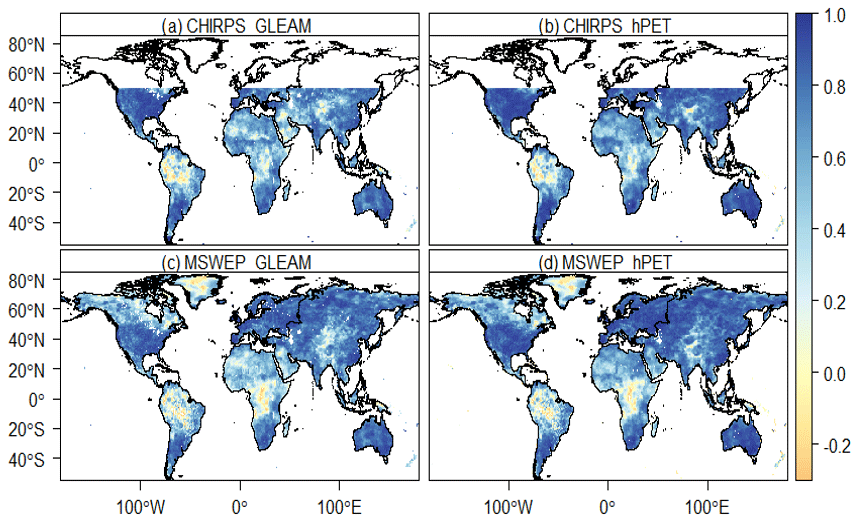
Figure 3Temporal correlation between the new high-resolution SPEI (SPEI-HR) based on (a) CHIRPS_GLEAM, (b) CHIRPS_hPET, (c) MSWEP_GLEAM, and (d) MSWEP_hPET, and the coarse resolution SPEI (SPEI-CR) for the 12 month SPEI.
The 12 month SPEI from the SPEI-HR and SPEI-CR also shows a higher correlation in large parts of the world (Fig. 3). The correlation between the SPEI-HR and SPEI-CR is very high in the USA, Asia, and Australia, but is lower in central Africa and northern South America. In Africa and South America, CHIRPS_GLEAM and CHIRPS_hPET show a higher correlation with the SPEI-CR compared with MSWEP_GLEAM and MSWEP_hPET. This higher correlation for CHIRPS may be due to the larger number of stations incorporated in CHIRPS than in MSWEP. The positive correlation increases with an increase in SPEI timescales. This indicates the cancellation of random errors, as the integration period increases. However, there is a low correlation between the SPEI-HR and SPEI-CR in parts of central Africa and northern South America. The lower correlation in the tropics (e.g. South America and Africa) is likely due to the very limited number of ground observations used in the development of the CRU-TS precipitation (Harris et al., 2020), which is used to develop the SPEI-CR. In line with this study, a lower correlation between the global drought probabilistic index developed from several global precipitation datasets and the MSWEP-based SPI index was reported in South America and Africa (Turco et al., 2020). These same areas have been shown to be areas of substantial disagreement for wet season precipitation totals (Funk et al., 2019b). In tropical regions with heavy convective precipitation, satellite inputs can produce very different results from station-only precipitation estimations.
The lower correlation in arid areas can also be due to the uncertainty of the forcing datasets, very few station observations, very few events, and intense, localized convective systems, which are difficult to measure and predict in these areas.
3.2 Agreement between the SPEI-HR and regional SPEI datasets
The new dataset, SPEI-HR, is compared with other high-resolution SPEI datasets in central Asia (Pyarali et al., 2022) and Africa (Peng et al., 2020). The central Asia SPEI (CA-SPEI) was developed based on CHIRPS and an older version of GLEAM PET for the period from 1981 to 2018. The CA-SPEI exhibits a stronger correlation with CHIRPS_GLEAM than with CHIRPS_hPET, MSWEP_hPET, and MSWEP_GLEAM (Fig. S2). The correlation between the CA-SPEI and CHIRPS_GLEAM exceeds 0.5. The agreement between the CA-SPEI and CHIRPS_hPET, MSWEP_hPET, and MSWEP_GLEAM is high in Kazakhstan but lower in Kyrgyzstan. This variation may be attributed to the differences in the performance of MSWEP and CHIRPS, in addition to variations in PET. According to Peña-Guerrero et al. (2022) MSWEP effectively represents the temporal dynamics of precipitation, while CHIRPS captures the distribution and volume of precipitation in central Asia. Similarly, SPEI-HR demonstrates a correlation with the Pan-African high-resolution SPEI (AF-SPEI) dataset (Peng et al., 2020). In Africa, both CHIRPS_GLEAM and CHIRPS_hPET exhibit a higher correlation (>0.75) with AF-SPEI compared with MSWEP_GLEAM and MSWEP_hPET for the period 1981–2016 (Fig. S3). The AF-SPEI, similar to the CA-SPEI, was developed based on CHIRPS and an older version of GLEAM PET (version 3a). On the whole, the correlation between the SPEI-HR and AF-SPEI exceeds 0.45 in Africa.
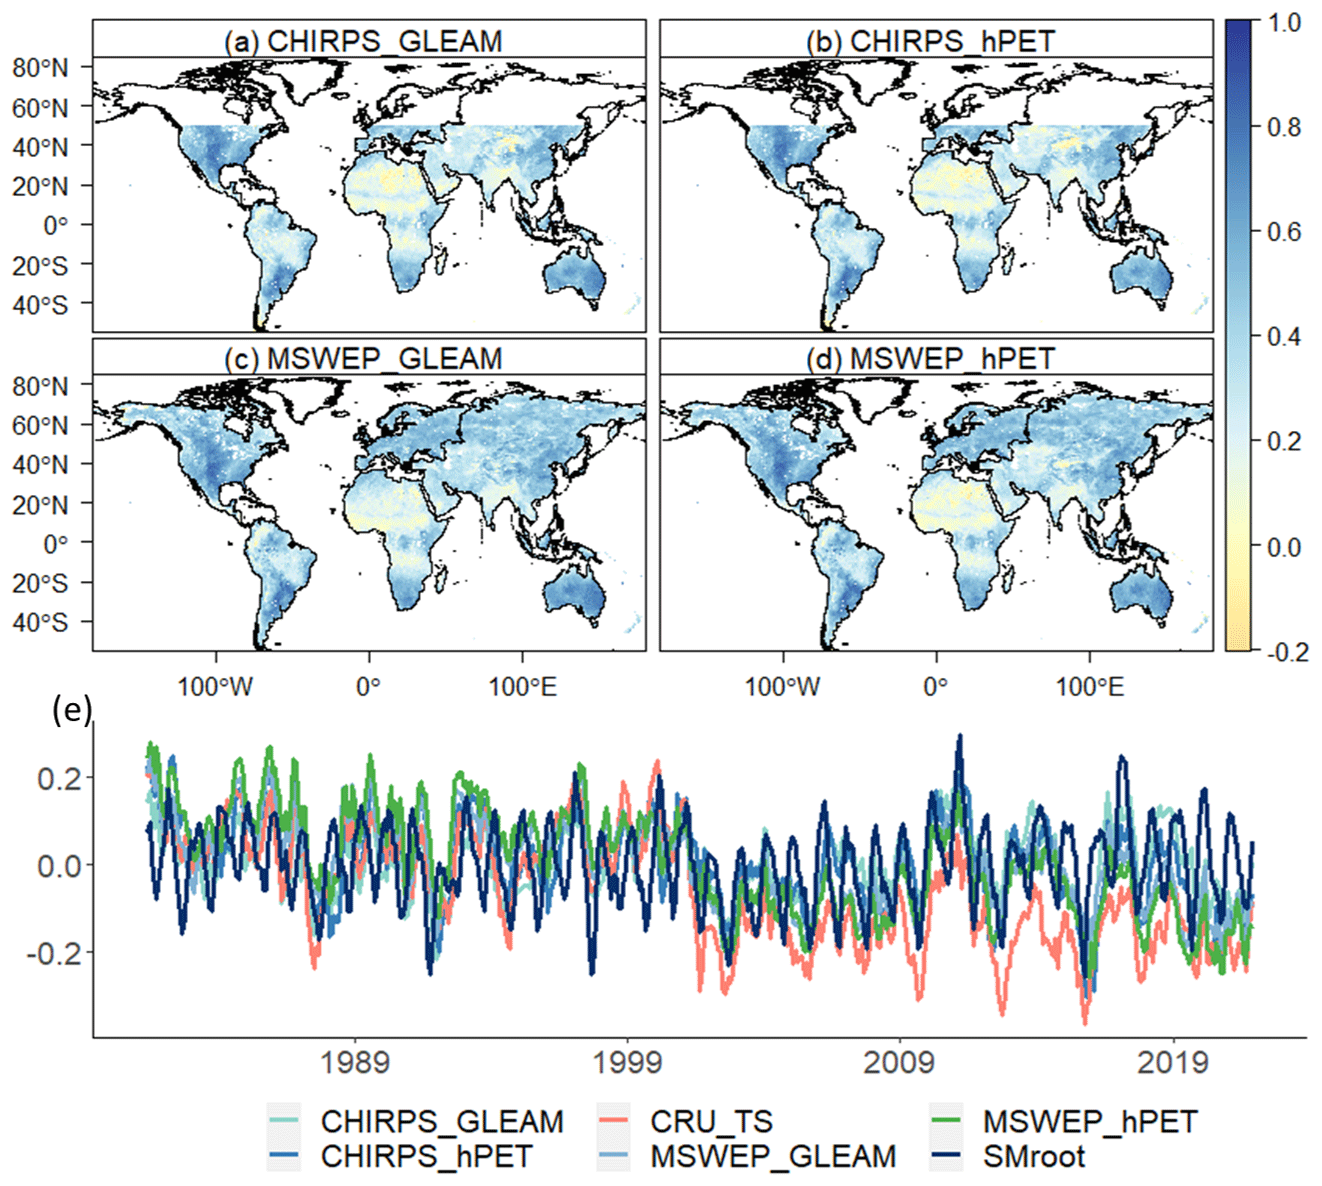
Figure 4Temporal correlation between the SMroot and 6 month SPEI based on (a) CHIRPS_GLEAM, (b) CHIRPS_hPET, (c) MSWEP_GLEAM, and (d) MSWEP_hPET. Panel (e) shows a global average (only up to 50∘ N) time series of the SMroot and 6 month SPEI based on CHIRPS_GLEAM, CHIRPS_hPET, MSWEP_GLEAM, MSWEP_hPET, and SPEI-CR.
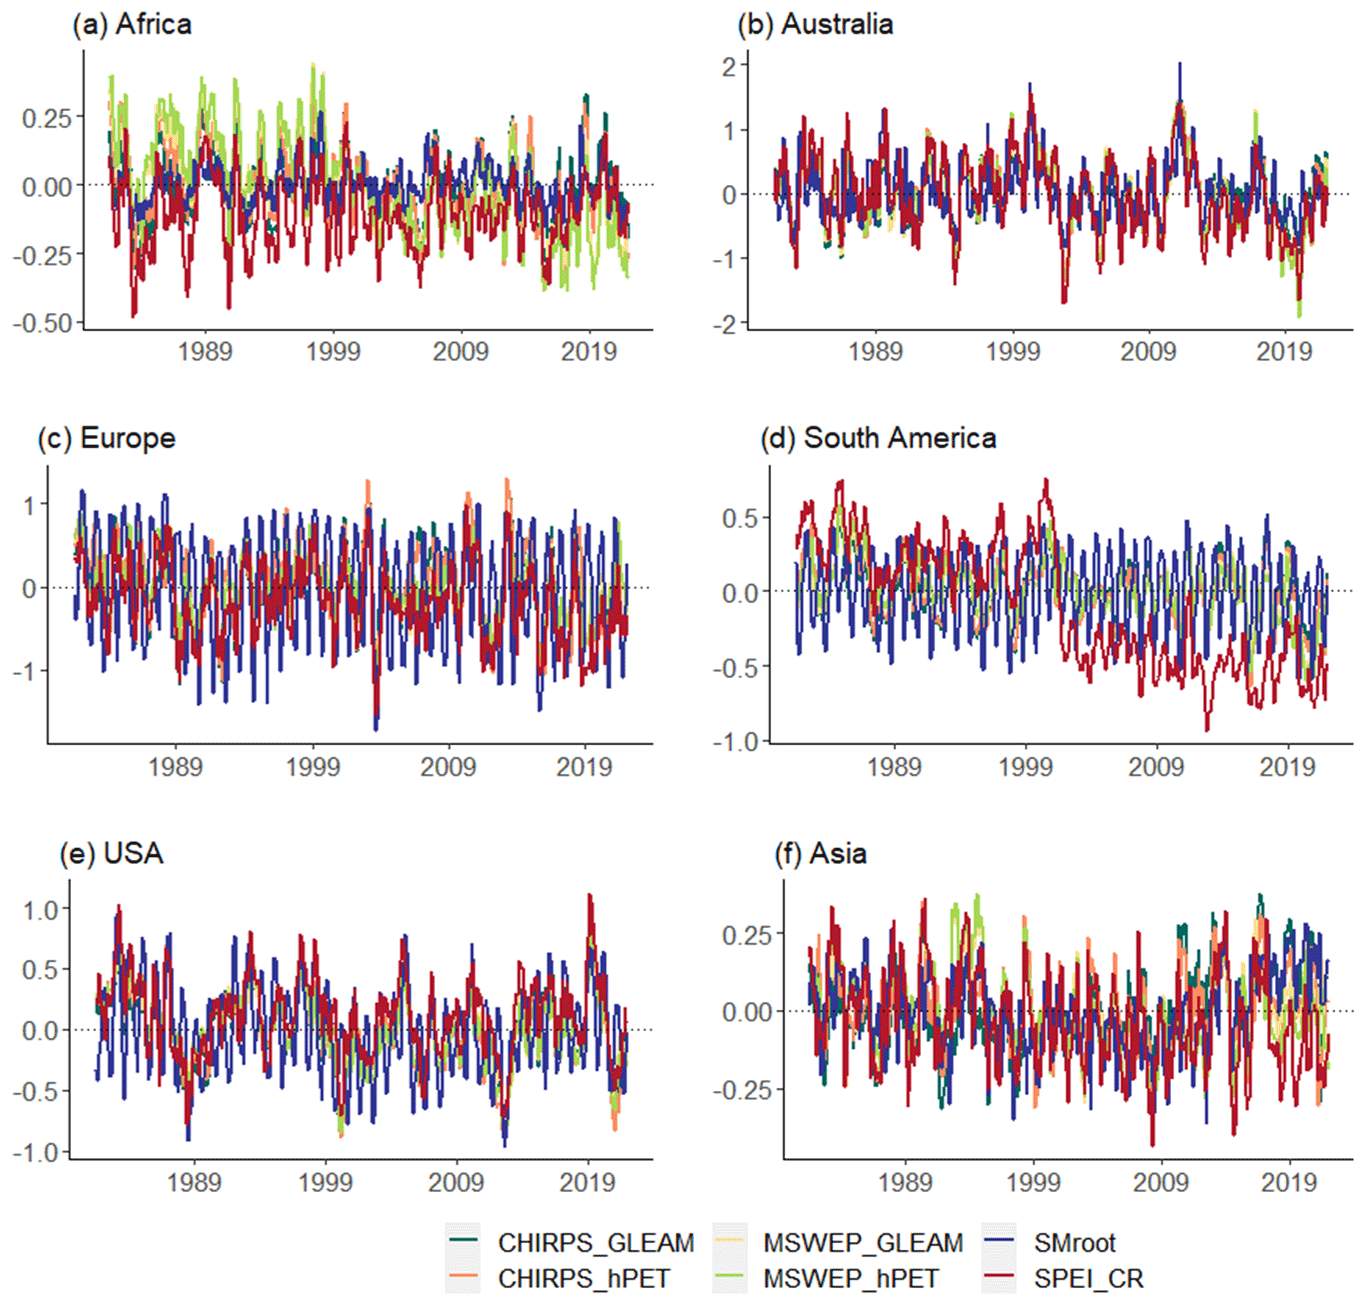
Figure 5Regional average time series of the SMroot and 6 month SPEI based on CHIRPS_GLEAM, CHIRPS_hPET, MSWEP_GLEAM, MSWEP_hPET, and SPEI-CR averaged over (a) Africa, (b) Australia, (c) Europe, (d) South America, (e) North America (USA only), and (f) Asia.
3.3 Agreement between the SPEI-HR and root zone soil moisture
The SPEI-HR is also evaluated using root zone soil moisture (SMroot) data obtained from GLEAM. Figure 4, for example, shows the temporal correlation between the 6 month SPEI computed based on the CHIRPS_GLEAM, CHIRPS_hPET, MSWEP_GLEAM, MSWEP_hPET, and SMroot. The SPEI-HR shows a reasonably good agreement with the SMroot with a correlation greater than 0.5 in large parts of the world except in some parts of the tropical and subtropical regions. Compared with other parts of the world, the correlation between the SPEI-HR and SMroot is lower in the tropical part of Africa. The global average SMroot time series also shows a good agreement with the SPEI-HR compared with the SPEI-CR. According to Peng et al. (2020), high-resolution SPEI datasets agree well with SMroot at 3 and 6 month timescales. The SPEI-CR, particularly after 2000, shows a more negative SPEI compared with the SMroot and SPEI-HR (Fig. 4e). The difference in the SPEI-CR (Fig. 4e) compared with the SMroot and SPEI-HR can be due to the reduction in the number of stations in the CRU-TS dataset (Funk et al., 2019a). The regional average time series of the SPEI-06 and SMroot also show the deviation of the SPEI-HR and SPEI-CR, particularly in Africa, South America, and Asia (Fig. 5). In Europe and the USA, the regional average 6 month SPEI and SMroot show a similar pattern of wet and dry events. However, in Africa (South America), the SPEI-CR before (after) 2000 shows much drier events than the SMroot and SPEI-HR. Similarly, MSWEP_hPET also shows more extreme wet events than the SMroot in Africa before 2000.
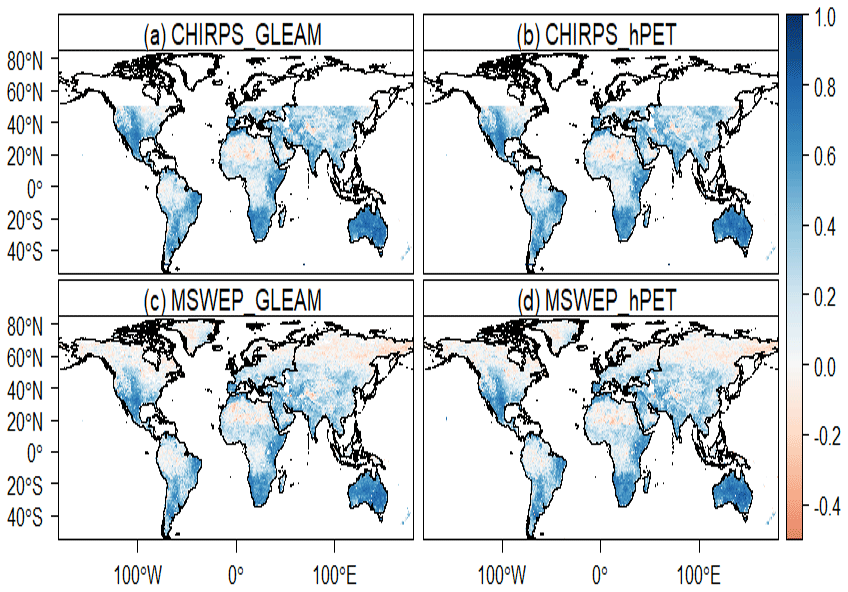
Figure 6Temporal correlation between the vegetation health index (VHI) and 6 month SPEI based on (a) CHIRPS_GLEAM, (b) CHIRPS_hPET, (c) MSWEP_GLEAM, and (d) MSWEP_hPET.
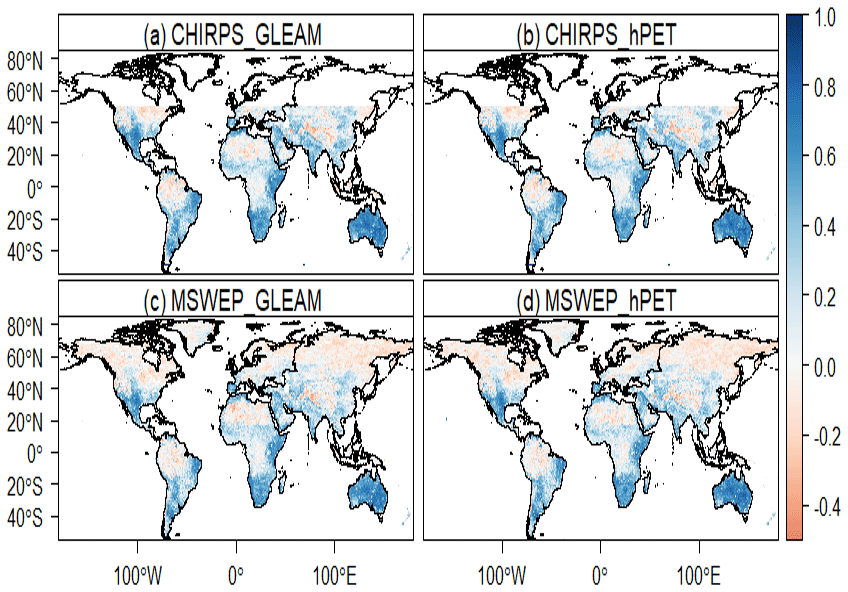
Figure 7Temporal correlation between the vegetation condition index (VCI) and 6 month SPEI based on (a) CHIRPS_GLEAM, (b) CHIRPS_hPET, (c) MSWEP_GLEAM, and (d) MSWEP_hPET.
3.4 Agreement between the SPEI-HR and vegetation indices
Vegetation indices are used to determine patterns of agricultural drought and they are popular for drought monitoring (Zuhro et al., 2020; Bento et al., 2018; Zeng et al., 2022). Remotely sensed vegetation indices provide additional information for monitoring and early warning of agricultural droughts (Bachmair et al., 2018). Figure 6 shows the correlation between the VHI and the 6 month SPEI based on CHIRPS_GLEAM, CHIRPS_hPET, MSWEP_GLEAM, and MSWEP_hPET. The agreement between the VHI and MSWEP_GLEAM and MSWEP_hPET is lower in the polar and subpolar regions of North America and Asia. However, there is a positive relationship in other parts of the world such as in South America, Africa, Australia, and the east and southern parts of Asia. In addition, the VHI showed a better correlation with the SPEI-HR compared with the VCI. As described in Sect. 2.1, the VCI is based on NDVI and does not consider explicitly the effect of temperature on vegetation health, yet the VCI shows a positive correlation in different parts of the world, particularly in tropical and subtropical zones (Fig. 7).
Results agree with previous studies which showed a good relationship between vegetation indices and the SPEI (Vicente-Serrano et al., 2018; Törnros and Menzel, 2014; Pyarali et al., 2022; Peng et al., 2020). Lower correlations between the SPEI-HR and VHI and VCI can be due to the complex nature of vegetation physiological processes and the effect of other climate and environmental drivers (Nemani et al., 2003). The time lag between precipitation and NDVI might also affect the lower correlation as compared with SMroot (Funk and Brown, 2006; Seddon et al., 2016; Papagiannopoulou et al., 2017; Wu et al., 2015). Previous studies have used NDVI to evaluate SPEI (Rojas et al., 2011; Vicente-Serrano et al., 2018; Törnros and Menzel, 2014; Pyarali et al., 2022; Peng et al., 2020). However, compared with VCI, VHI gives a better correlation with SPEI, which might be due to the consideration of the effect of warming on drought and vegetation health.
3.5 Uncertainties in the SPEI-HR
This high-resolution SPEI dataset will serve as a basis for drought analysis and the development of effective mitigation and adaptation strategies at a local scale. However, it is important to consider the uncertainties in the datasets due to the uncertainties in the precipitation and PET input datasets. The uncertainty in precipitation and PET, which has its inherent uncertainties, stemming from measurement errors, interpolation methods, and data gaps, can propagate and amplify these uncertainties in SPEI datasets. To reduce the uncertainties, the precipitation datasets employed in this study are widely recognized and have been extensively used in hydroclimatology research, including the development of drought indices (Pyarali et al., 2022; Peng et al., 2020; Hendrawan et al., 2022; Ma et al., 2023). Furthermore, a global-scale evaluation of 22 precipitation datasets has demonstrated the reliability of MSWEP and CHIRPS (Beck et al., 2017). Additionally, the GLEAM model output, particularly atmospheric evaporative demand, exhibits lower absolute and relative errors compared with other datasets such as the Global Land Data Assimilation System (GLDAS) and the MODIS Global Evapotranspiration Project (MOD16) (Khan et al., 2018). According to Laimighofer and Laaha (2022) the observation period used to estimate the SPEI and SPI distribution parameters introduces uncertainties. These uncertainties tend to significantly decrease when shifting from 20 to 60 years of records, as the parameters stabilize. For instance, increasing the record length from 20 to 60 years reduces the total variance by 58 %, although further improvements are not observed beyond 60 years. Additionally, the selection of the distribution also significantly reduces uncertainty by 23 % (Laimighofer and Laaha, 2022). For the SPEI, the log-logistic distribution demonstrated its superior ability to generate SPEI series compared with other probability distributions (Vicente-Serrano et al., 2010a; Beguería et al., 2014), which lowers the uncertainties. In addition to the length of observation and distribution method, the parameter estimation method can lead to uncertainties. The estimation of parameters depends on the choice of the distribution method but is often minimal when compared to the uncertainties in the precipitation and PET input datasets (Tallaksen and Lanen, 2004; Laimighofer and Laaha, 2022). Overall, it is well stated that the source of uncertainties in drought indices can be notably reduced by using longer periods of high-quality precipitation and PET datasets, and by selecting appropriate distribution methods.
The new high-resolution (0.05∘) global drought indices (SPEI-HR) based on CHIRPS_GLEAM, CHIRPS_hPET, MSWEP_GLEAM, and MSWEP_hPET are freely available at the Centre for Environmental Data Analysis (CEDA; https://doi.org/10.5285/ac43da11867243a1bb414e1637802dec) and on JASMIN (/badc/hydro-jules/data/Global_drought_indices) (Gebrechorkos et al., 2023). JASMIN is a unique data-intensive HPC system for environmental science (https://jasmin.ac.uk/, JASMIN, 2023a). For getting access to JASMIN please follow this link https://help.jasmin.ac.uk/article/189-get-started-with-jasmin (JASMIN, 2023b). The data are available under four directories (CHIRPS_GLEAM, CHIRPS_hPET, MSWEP_GLEAM, and MSWEP_hPET) containing spei01 to spei48 months for the period 1981–2022. The SPEI data cover (land only) all longitudes and from −50 to 50∘ latitude for CHIRPS_GLEAM and CHIRPS_hPET, and from −55 to 85∘ for MSWEP_GLEAM and MSWEP_hPET. The size of each SPEI file (i.e. NetCDF) is between 5 and 9 GB.
We produced four global high-resolution (0.05∘) and long-term (1981–2022) drought datasets using the SPEI, which is a multi-scale drought index used for drought monitoring and to assess the duration and severity of droughts at different scales (global to local scale). Here, the SPEI is computed based on high-resolution precipitation from CHIRPS and MSWEP and potential evapotranspiration (PET) from GLEAM and hPET. The GLEAM and hPET are developed based on Priestley–Taylor and FAO Penman–Monteith equations, respectively. These new high-resolution global SPEI datasets (SPEI-HR) are validated using observation-based coarse-resolution SPEI datasets (SPEI-CR), regional scale high-resolution SPEI datasets, root zone soil moisture (SMroot), the vegetation condition index (VCI), and the vegetation health index (VHI). The good agreement between the SPEI-HR and SPEI-CR, SMroot, VCI, and VHI confirms the suitability of the data for assessing and monitoring droughts. In addition, the SPEI-HR provides more local information as it is available at a much higher spatial resolution (0.05∘) compared with currently available global drought indices such as the SPEI-CR. Overall, these new multi-timescale (1–48 months) SPEI datasets can be used for drought monitoring and assessing drought severity and duration at a local and global scale allowing the development of site-specific adaptation measures.
The supplement related to this article is available online at: https://doi.org/10.5194/essd-15-5449-2023-supplement.
SJD led the project and conceived the study with input from all authors. SHG developed the drought datasets and drafted the manuscript. CF, HEB, and DTA and MBS developed the CHIRPS, MSWEP, and hPET datasets, respectively. SJD, JP, DGM, and SMVS supported the generation of the dataset and the analysis of the results. All authors contributed to the development of the paper.
The contact author has declared that none of the authors has any competing interests.
Publisher’s note: Copernicus Publications remains neutral with regard to jurisdictional claims made in the text, published maps, institutional affiliations, or any other geographical representation in this paper. While Copernicus Publications makes every effort to include appropriate place names, the final responsibility lies with the authors.
We thank the UK Foreign, Commonwealth and Development Office (FCDO) and the UK Natural Environment Research Council (NERC) for providing financial support. We also thank the Centre for Environmental Data Analysis (CEDA) for storing the SPEI-HR datasets.
This research has been supported by the Foreign, Commonwealth and Development Office (grant no. 201880) and the Natural Environment Research Council (grant no. NE/S017380/1).
This paper was edited by Yue Qin and reviewed by A. D. Mehr and two anonymous referees.
Agnew, C. T.: Using the SPI to Identify Drought, Drought Network News (1994–2001), https://digitalcommons.unl.edu/droughtnetnews/1 (last access: 28 November 2023), 2000.
AL-Falahi, A. H., Saddique, N., Spank, U., Gebrechorkos, S. H., and Bernhofer, C.: Evaluation the Performance of Several Gridded Precipitation Products over the Highland Region of Yemen for Water Resources Management, Remote Sens.-Basel, 12, 2984, https://doi.org/10.3390/rs12182984, 2020.
Alijanian, M., Rakhshandehroo, G. R., Dehghani, M., and Mishra, A.: Probabilistic drought forecasting using copula and satellite rainfall based PERSIANN-CDR and MSWEP datasets, Int. J. Climatol., 42, 6441–6458, https://doi.org/10.1002/joc.7600, 2022.
Allan, R., Pereira, L., and Smith, M.: Crop evapotranspiration-Guidelines for computing crop water requirements, FAO Irrigation and drainage paper 56, https://www.fao.org/3/X0490E/X0490E00.htm (last access: 28 November 2023), 1998.
Allen, C. D., Breshears, D. D., and McDowell, N. G.: On underestimation of global vulnerability to tree mortality and forest die-off from hotter drought in the Anthropocene, Ecosphere, 6, 129, https://doi.org/10.1890/ES15-00203.1, 2015.
Anderson, M., Hain, C., Wardlow, B., Pimstein, A., Mecikalski, J., and Kustas, W.: Evaluation of Drought Indices Based on Thermal Remote Sensing of Evapotranspiration over the Continental United States, J. Climate, 24, 2025–2044, https://doi.org/10.1175/2010JCLI3812.1, 2011.
Australian Government Bureau of Meteorology: Australia in November 2019, http://www.bom.gov.au/climate/current/month/aus/archive/201911.summary.shtml, last access: 27 November 2023.
Bachmair, S., Tanguy, M., Hannaford, J., and Stahl, K.: How well do meteorological indicators represent agricultural and forest drought across Europe?, Environ. Res. Lett., 13, 034042, https://doi.org/10.1088/1748-9326/aaafda, 2018.
Baudoin, M.-A., Vogel, C., Nortje, K., and Naik, M.: Living with drought in South Africa: lessons learnt from the recent El Niño drought period, Int. J. Disast. Risk Re., 23, 128–137, https://doi.org/10.1016/j.ijdrr.2017.05.005, 2017.
Beck, H. E., Vergopolan, N., Pan, M., Levizzani, V., van Dijk, A. I. J. M., Weedon, G. P., Brocca, L., Pappenberger, F., Huffman, G. J., and Wood, E. F.: Global-scale evaluation of 22 precipitation datasets using gauge observations and hydrological modeling, Hydrol. Earth Syst. Sci., 21, 6201–6217, https://doi.org/10.5194/hess-21-6201-2017, 2017.
Beck, H. E., Wood, E. F., Pan, M., Fisher, C. K., Miralles, D. G., Dijk, A. I. J. M. van, McVicar, T. R., and Adler, R. F.: MSWEP V2 Global 3-Hourly 0.1∘ Precipitation: Methodology and Quantitative Assessment, B. Am. Meteor. Soc., 100, 473–500, https://doi.org/10.1175/BAMS-D-17-0138.1, 2019.
Beck, H. E., Pan, M., Miralles, D. G., Reichle, R. H., Dorigo, W. A., Hahn, S., Sheffield, J., Karthikeyan, L., Balsamo, G., Parinussa, R. M., van Dijk, A. I. J. M., Du, J., Kimball, J. S., Vergopolan, N., and Wood, E. F.: Evaluation of 18 satellite- and model-based soil moisture products using in situ measurements from 826 sensors, Hydrol. Earth Syst. Sci., 25, 17–40, https://doi.org/10.5194/hess-25-17-2021, 2021.
Beguería, S., Vicente-Serrano, S. M., Reig, F., and Latorre, B.: Standardized precipitation evapotranspiration index (SPEI) revisited: parameter fitting, evapotranspiration models, tools, datasets and drought monitoring, Int. J. Climatol., 34, 3001–3023, https://doi.org/10.1002/joc.3887, 2014.
Bento, V. A., Gouveia, C. M., DaCamara, C. C., and Trigo, I. F.: A climatological assessment of drought impact on vegetation health index, Agr. Forest Meteorol., 259, 286–295, https://doi.org/10.1016/j.agrformet.2018.05.014, 2018.
Cammalleri, C., Spinoni, J., Barbosa, P., Toreti, A., and Vogt, J. V.: The effects of non-stationarity on SPI for operational drought monitoring in Europe, Int. J. Climatol., 42, 3418–3430, https://doi.org/10.1002/joc.7424, 2022.
Carnicer, J., Coll, M., Ninyerola, M., Pons, X., Sánchez, G., and Peñuelas, J.: Widespread crown condition decline, food web disruption, and amplified tree mortality with increased climate change-type drought, P. Natl. Acad. Sci. USA, 108, 1474–1478, https://doi.org/10.1073/pnas.1010070108, 2011.
CRED: Economic losses, poverty & disasters: 1998–2017, Centre for Research on the Epidemiology of Disasters (CRED), https://www.undrr.org/publication/economic-losses-poverty-disasters-1998-2017 (last access: 28 November 2023), 2018.
Danandeh Mehr, A., Sorman, A. U., Kahya, E., and Hesami Afshar, M.: Climate change impacts on meteorological drought using SPI and SPEI: case study of Ankara, Turkey, Hydrolog. Sci. J., 65, 254–268, https://doi.org/10.1080/02626667.2019.1691218, 2020.
Didan, K.: MODIS/Terra Vegetation Indices Monthly L3 Global 0.05Deg CMG V061, The Level-1 and Atmosphere Archive & Distribution System Distributed Active Archive Center (LAADS DAAC), https://doi.org/10.5067/MODIS/MOD13C2.061, 2021.
Feng, Z., Leung, L. R., Liu, N., Wang, J., Houze Jr, R. A., Li, J., Hardin, J. C., Chen, D., and Guo, J.: A Global High-Resolution Mesoscale Convective System Database Using Satellite-Derived Cloud Tops, Surface Precipitation, and Tracking, J. Geophys. Res.-Atmos., 126, e2020JD034202, https://doi.org/10.1029/2020JD034202, 2021.
FEWS-NET: Food security emergency in central/eastern Ethiopia follows worst drought in more than 50 years, FEWS NET, https://fews.net/east-africa/ethiopia/alert/december-2015 (last access: 28 November 2023), 2015.
Forzieri, G., Alkama, R., Miralles, D. G., and Cescatti, A.: Satellites reveal contrasting responses of regional climate to the widespread greening of Earth, Science, 356, 1180–1184, https://doi.org/10.1126/science.aal1727, 2017.
Funk, C., Verdin, A., Michaelsen, J., Peterson, P., Pedreros, D., and Husak, G.: A global satellite-assisted precipitation climatology, Earth Syst. Sci. Data, 7, 275–287, https://doi.org/10.5194/essd-7-275-2015, 2015a.
Funk, C., Peterson, P., Landsfeld, M., Pedreros, D., Verdin, J., Shukla, S., Husak, G., Rowland, J., Harrison, L., Hoell, A., and Michaelsen, J.: The climate hazards infrared precipitation with stations–a new environmental record for monitoring extremes, Sci. Data, 2, 150066, https://doi.org/10.1038/sdata.2015.66, 2015b.
Funk, C., Harrison, L., Shukla, S., Korecha, D., Magadzire, T., Husak, G., Galu, G., and Hoell, A.: Assessing the Contributions of Local and East Pacific Warming to the 2015 Droughts in Ethiopia and Southern Africa, B. Am. Meteor. Soc., 97, S75–S80, https://doi.org/10.1175/BAMS-D-16-0167.1, 2016.
Funk, C., Harrison, L., Shukla, S., Pomposi, C., Galu, G., Korecha, D., Husak, G., Magadzire, T., Davenport, F., Hillbruner, C., Eilerts, G., Zaitchik, B., and Verdin, J.: Examining the role of unusually warm Indo-Pacific sea-surface temperatures in recent African droughts, Q. J. Roy. Meteor. Soc., 144, 360–383, https://doi.org/10.1002/qj.3266, 2018.
Funk, C., Peterson, P., Peterson, S., Shukla, S., Davenport, F., Michaelsen, J., Knapp, K. R., Landsfeld, M., Husak, G., Harrison, L., Rowland, J., Budde, M., Meiburg, A., Dinku, T., Pedreros, D., and Mata, N.: A High-Resolution 1983–2016 Tmax Climate Data Record Based on Infrared Temperatures and Stations by the Climate Hazard Center, J. Climate, 32, 5639–5658, https://doi.org/10.1175/JCLI-D-18-0698.1, 2019a.
Funk, C., Harrison, L., Alexander, L., Peterson, P., Behrangi, A., and Husak, G.: Exploring trends in wet-season precipitation and drought indices in wet, humid and dry regions, Environ. Res. Lett., 14, 115002, https://doi.org/10.1088/1748-9326/ab4a6c, 2019b.
Funk, C. C.: Drought, Flood, Fire: How Climate Change Contributes to Catastrophes, Cambridge University Press, Cambridge, https://doi.org/10.1017/9781108885348, 2021.
Funk, C. C. and Brown, M. E.: Intra-seasonal NDVI change projections in semi-arid Africa, Remote Sens. Environ., 101, 249–256, https://doi.org/10.1016/j.rse.2005.12.014, 2006.
Gao, F., Zhang, Y., Ren, X., Yao, Y., Hao, Z., and Cai, W.: Evaluation of CHIRPS and its application for drought monitoring over the Haihe River Basin, China, Nat. Hazards, 92, 155–172, https://doi.org/10.1007/s11069-018-3196-0, 2018.
García-Herrera, R., Garrido-Perez, J. M., Barriopedro, D., Ordóñez, C., Vicente-Serrano, S. M., Nieto, R., Gimeno, L., Sorí, R., and Yiou, P.: The European 2016/17 Drought, J. Climate, 32, 3169–3187, https://doi.org/10.1175/JCLI-D-18-0331.1, 2019.
Gebrechorkos, S., Peng, J., Dyer, E., Miralles, D. G., Vicente-Serrano, S. M., Funk, C., Beck, H., Asfaw, D., Singer, M., and Dadson, S.: Global high-resolution drought datasets from 1981–2022, Centre for Environmental Data Analysis (CEDA) [data set], https://doi.org/10.5285/ac43da11867243a1bb414e1637802dec, 2023.
Gebrechorkos, S. H., Hülsmann, S., and Bernhofer, C.: Evaluation of multiple climate data sources for managing environmental resources in East Africa, Hydrol. Earth Syst. Sci., 22, 4547–4564, https://doi.org/10.5194/hess-22-4547-2018, 2018.
Gebrechorkos, S. H., Hülsmann, S., and Bernhofer, C.: Long-term trends in rainfall and temperature using high-resolution climate datasets in East Africa, Sci. Rep., 9, 1–9, https://doi.org/10.1038/s41598-019-47933-8, 2019a.
Gebrechorkos, S. H., Hülsmann, S., and Bernhofer, C.: Regional climate projections for impact assessment studies in East Africa, Environ. Res. Lett., 14, 044031, https://doi.org/10.1088/1748-9326/ab055a, 2019b.
Gebrechorkos, S. H., Hülsmann, S., and Bernhofer, C.: Analysis of climate variability and droughts in East Africa using high-resolution climate data products, Global Planet. Change, 186, 103130, https://doi.org/10.1016/j.gloplacha.2020.103130, 2020.
Gebrechorkos, S. H., Pan, M., Lin, P., Anghileri, D., Forsythe, N., Pritchard, D. M. W., Fowler, H. J., Obuobie, E., Darko, D., and Sheffield, J.: Variability and changes in hydrological drought in the Volta Basin, West Africa, J. Hydrol., 42, 101143, https://doi.org/10.1016/j.ejrh.2022.101143, 2022.
Ghozat, A., Sharafati, A., and Hosseini, S. A.: Satellite-based monitoring of meteorological drought over different regions of Iran: application of the CHIRPS precipitation product, Environ. Sci. Pollut. Res. Int., 29, 36115–36132, https://doi.org/10.1007/s11356-022-18773-3, 2022.
Gibbs, W. J.: Rainfall Deciles as Drought Indicators, Bureau of Meteorology Bulletin No. 48, Melbourne: Bureau of Meteorology, https://library2.deakin.edu.au/record=b1458806~S1 (last access: 28 November 2023), 1967.
Greve, P., Orlowsky, B., Mueller, B., Sheffield, J., Reichstein, M., and Seneviratne, S. I.: Global assessment of trends in wetting and drying over land, Nat. Geosci., 7, 716–721, https://doi.org/10.1038/ngeo2247, 2014.
Guo, H., Li, M., Nzabarinda, V., Bao, A., Meng, X., Zhu, L., and De Maeyer, P.: Assessment of Three Long-Term Satellite-Based Precipitation Estimates against Ground Observations for Drought Characterization in Northwestern China, Remote Sens.-Basel, 14, 828, https://doi.org/10.3390/rs14040828, 2022.
Haile, G. G., Tang, Q., Sun, S., Huang, Z., Zhang, X., and Liu, X.: Droughts in East Africa: Causes, impacts and resilience, Earth-Sci. Rev., 193, 146–161, https://doi.org/10.1016/j.earscirev.2019.04.015, 2019.
Hao, Z., AghaKouchak, A., Nakhjiri, N., and Farahmand, A.: Global integrated drought monitoring and prediction system, Sci. Data, 1, 140001, https://doi.org/10.1038/sdata.2014.1, 2014.
Harris, I., Osborn, T. J., Jones, P., and Lister, D.: Version 4 of the CRU TS monthly high-resolution gridded multivariate climate dataset, Sci. Data, 7, 109, https://doi.org/10.1038/s41597-020-0453-3, 2020.
Hayes, M., Svoboda, M., Wall, N., and Widhalm, M.: The Lincoln Declaration on Drought Indices: Universal Meteorological Drought Index Recommended, B. Am. Meteor. Soc., 92, 485–488, https://doi.org/10.1175/2010BAMS3103.1, 2011.
Hendrawan, V. S. A., Kim, W., Touge, Y., Ke, S., and Komori, D.: A global-scale relationship between crop yield anomaly and multiscalar drought index based on multiple precipitation data, Environ. Res. Lett., 17, 014037, https://doi.org/10.1088/1748-9326/ac45b4, 2022.
IPCC: Climate Change 2014 – Impacts, Adaptation and Vulnerability: Part B: Regional Aspects: Working Group II Contribution to the IPCC Fifth Assessment Report: Volume 2: Regional Aspects, Cambridge University Press, Cambridge, https://doi.org/10.1017/CBO9781107415386, 2014.
JASMIN: https://jasmin.ac.uk/, last access: 1 December 2023a.
JASMIN: Get Started with JASMIN, https://help.jasmin.ac.uk/article/189-get-started-with-jasmin, last access: 1 December 2023b.
Jung, H. C., Kang, D.-H., Kim, E., Getirana, A., Yoon, Y., Kumar, S., Peters-lidard, C. D., and Hwang, E.: Towards a soil moisture drought monitoring system for South Korea, J. Hydrol., 589, 125176, https://doi.org/10.1016/j.jhydrol.2020.125176, 2020.
Keyantash, J. and Dracup, J. A.: The Quantification of Drought: An Evaluation of Drought Indices, B. Am. Meteor. Soc., 83, 1167–1180, https://doi.org/10.1175/1520-0477-83.8.1167, 2002.
Khan, M. S., Liaqat, U. W., Baik, J., and Choi, M.: Stand-alone uncertainty characterization of GLEAM, GLDAS and MOD16 evapotranspiration products using an extended triple collocation approach, Agr. Forest Meteorol., 252, 256–268, https://doi.org/10.1016/j.agrformet.2018.01.022, 2018.
Kogan, F. N.: Application of vegetation index and brightness temperature for drought detection, Adv. space Res., 15, 91–100, 1995.
Kumar, R., Musuuza, J. L., Van Loon, A. F., Teuling, A. J., Barthel, R., Ten Broek, J., Mai, J., Samaniego, L., and Attinger, S.: Multiscale evaluation of the Standardized Precipitation Index as a groundwater drought indicator, Hydrol. Earth Syst. Sci., 20, 1117–1131, https://doi.org/10.5194/hess-20-1117-2016, 2016.
Laimighofer, J. and Laaha, G.: How standard are standardized drought indices? Uncertainty components for the SPI & SPEI case, J. Hydrol., 613, 128385, https://doi.org/10.1016/j.jhydrol.2022.128385, 2022.
Lespinas, F., Ludwig, W., and Heussner, S.: Impact of recent climate change on the hydrology of coastal Mediterranean rivers in Southern France, Climatic Change, 99, 425–456, https://doi.org/10.1007/s10584-009-9668-1, 2010.
Li, M., Lv, X., Zhu, L., Uchenna Ochege, F., and Guo, H.: Evaluation and Application of MSWEP in Drought Monitoring in Central Asia, Atmosphere, 13, 1053, https://doi.org/10.3390/atmos13071053, 2022.
Li, Y., Zhuang, J., Bai, P., Yu, W., Zhao, L., Huang, M., and Xing, Y.: Evaluation of Three Long-Term Remotely Sensed Precipitation Estimates for Meteorological Drought Monitoring over China, Remote Sensing, 15, 86, https://doi.org/10.3390/rs15010086, 2023.
Lian, X., Piao, S., Huntingford, C., Li, Y., Zeng, Z., Wang, X., Ciais, P., McVicar, T. R., Peng, S., Ottlé, C., Yang, H., Yang, Y., Zhang, Y., and Wang, T.: Partitioning global land evapotranspiration using CMIP5 models constrained by observations, Nat. Clim. Change, 8, 640–646, https://doi.org/10.1038/s41558-018-0207-9, 2018.
Liang, S., Ge, S., Wan, L., and Zhang, J.: Can climate change cause the Yellow River to dry up?, Water Resour. Res., 46, https://doi.org/10.1029/2009WR007971, 2010.
Lotfirad, M., Esmaeili-Gisavandani, H., and Adib, A.: Drought monitoring and prediction using SPI, SPEI, and random forest model in various climates of Iran, J. Water Clim. Change, 13, 383–406, https://doi.org/10.2166/wcc.2021.287, 2022.
Ma, Q., Li, Y., Liu, F., Feng, H., Biswas, A., and Zhang, Q.: SPEI and multi-threshold run theory based drought analysis using multi-source products in China, J. Hydrol., 616, 128737, https://doi.org/10.1016/j.jhydrol.2022.128737, 2023.
Martens, B., Miralles, D. G., Lievens, H., van der Schalie, R., de Jeu, R. A. M., Fernández-Prieto, D., Beck, H. E., Dorigo, W. A., and Verhoest, N. E. C.: GLEAM v3: satellite-based land evaporation and root-zone soil moisture, Geosci. Model Dev., 10, 1903–1925, https://doi.org/10.5194/gmd-10-1903-2017, 2017.
Mastrotheodoros, T., Pappas, C., Molnar, P., Burlando, P., Manoli, G., Parajka, J., Rigon, R., Szeles, B., Bottazzi, M., Hadjidoukas, P., and Fatichi, S.: More green and less blue water in the Alps during warmer summers, Nat. Clim. Change, 10, 155–161, https://doi.org/10.1038/s41558-019-0676-5, 2020.
Matiu, M., Ankerst, D. P., and Menzel, A.: Interactions between temperature and drought in global and regional crop yield variability during 1961–2014, PLOS ONE, 12, e0178339, https://doi.org/10.1371/journal.pone.0178339, 2017.
McKee, T. B., Doesken, N. J., and Kliest, J.: The relationship of drought frequency and duration to time scales, in: Proceedings of the 8th Conference of Applied Climatology, 17–22 January, Anaheim, CA, American Meterological Society, Boston, MA, 179–184, https://www.droughtmanagement.info/literature/AMS_Relationship_Drought_Frequency_Duration_Time_Scales_1993.pdf (last access: 28 November 2023), 1993.
McRoberts, D. and Nielsen-Gammon, J.: The Use of a High-Resolution Standardized Precipitation Index for Drought Monitoring and Assessment, J. Appl. Meteorol. Clim., 51, 68–83, https://doi.org/10.1175/JAMC-D-10-05015.1, 2012.
Menne, M. J., Durre, I., Vose, R. S., Gleason, B. E., and Houston, T. G.: An Overview of the Global Historical Climatology Network-Daily Database, J. Atmos. Ocean. Tech., 29, 897–910, https://doi.org/10.1175/JTECH-D-11-00103.1, 2012.
Mianabadi, A., Salari, K., and Pourmohamad, Y.: Drought monitoring using the long-term CHIRPS precipitation over Southeastern Iran, Appl. Water Sci., 12, 183, https://doi.org/10.1007/s13201-022-01705-4, 2022.
Miralles, D. G., Holmes, T. R. H., De Jeu, R. A. M., Gash, J. H., Meesters, A. G. C. A., and Dolman, A. J.: Global land-surface evaporation estimated from satellite-based observations, Hydrol. Earth Syst. Sci., 15, 453–469, https://doi.org/10.5194/hess-15-453-2011, 2011.
Miralles, D. G., van den Berg, M. J., Gash, J. H., Parinussa, R. M., de Jeu, R. A. M., Beck, H. E., Holmes, T. R. H., Jiménez, C., Verhoest, N. E. C., Dorigo, W. A., Teuling, A. J., and Johannes Dolman, A.: El Niño–La Niña cycle and recent trends in continental evaporation, Nat. Clim. Change, 4, 122–126, https://doi.org/10.1038/nclimate2068, 2014.
Mohammed, S., Alsafadi, K., Enaruvbe, G. O., Bashir, B., Elbeltagi, A., Széles, A., Alsalman, A., and Harsanyi, E.: Assessing the impacts of agricultural drought (SPI/SPEI) on maize and wheat yields across Hungary, Sci. Rep.-UK, 12, 8838, https://doi.org/10.1038/s41598-022-12799-w, 2022.
Mu, Q., Zhao, M., Kimball, J. S., McDowell, N. G., and Running, S. W.: A Remotely Sensed Global Terrestrial Drought Severity Index, B. Am. Meteor. Soc., 94, 83–98, https://doi.org/10.1175/BAMS-D-11-00213.1, 2013.
Mukherjee, S. and Mishra, A. K.: Increase in Compound Drought and Heatwaves in a Warming World, Geophys. Res. Lett., 48, e2020GL090617, https://doi.org/10.1029/2020GL090617, 2021.
Mukherjee, S., Mishra, A., and Trenberth, K. E.: Climate Change and Drought: a Perspective on Drought Indices, Curr. Clim. Change Rep., 4, 145–163, https://doi.org/10.1007/s40641-018-0098-x, 2018.
Narasimhan, B. and Srinivasan, R.: Development and evaluation of Soil Moisture Deficit Index (SMDI) and Evapotranspiration Deficit Index (ETDI) for agricultural drought monitoring, Agr. Forest Meteorol., 133, 69–88, https://doi.org/10.1016/j.agrformet.2005.07.012, 2005.
Naumann, G., Alfieri, L., Wyser, K., Mentaschi, L., Betts, R. A., Carrao, H., Spinoni, J., Vogt, J., and Feyen, L.: Global Changes in Drought Conditions Under Different Levels of Warming, Geophys. Res. Lett., 45, 3285–3296, https://doi.org/10.1002/2017GL076521, 2018.
Nemani, R. R., Keeling, C. D., Hashimoto, H., Jolly, W. M., Piper, S. C., Tucker, C. J., Myneni, R. B., and Running, S. W.: Climate-driven increases in global terrestrial net primary production from 1982 to 1999, Science, 300, 1560–1563, https://doi.org/10.1126/science.1082750, 2003.
Ngcamu, B. S. and Chari, F.: Drought Influences on Food Insecurity in Africa: A Systematic Literature Review, Int. J. Environ. Res. Pub. He., 17, 5897, https://doi.org/10.3390/ijerph17165897, 2020.
Palmer, W. C.: Meteorological Drought. Office of Climatology Research Paper No. 45, Washington DC: US Weather Bureau. https://www.droughtmanagement.info/literature/USWB_Meteorological_Drought_1965.pdf (last access: 28 November 2023), 1965
Papagiannopoulou, C., Miralles, D. G., Dorigo, W. A., Verhoest, N. E. C., Depoorter, M., and Waegeman, W.: Vegetation anomalies caused by antecedent precipitation in most of the world, Environ. Res. Lett., 12, 074016, https://doi.org/10.1088/1748-9326/aa7145, 2017.
Park, S., Im, J., Park, S., and Rhee, J.: Drought monitoring using high resolution soil moisture through multi-sensor satellite data fusion over the Korean peninsula, Agr. Forest Meteorol., 237–238, 257–269, https://doi.org/10.1016/j.agrformet.2017.02.022, 2017.
Peña-Guerrero, M. D., Umirbekov, A., Tarasova, L., and Müller, D.: Comparing the performance of high-resolution global precipitation products across topographic and climatic gradients of Central Asia, Int. J. Climatol., 42, 5554–5569, https://doi.org/10.1002/joc.7548, 2022.
Peng, J., Muller, J.-P., Blessing, S., Giering, R., Danne, O., Gobron, N., Kharbouche, S., Ludwig, R., Müller, B., Leng, G., You, Q., Duan, Z., and Dadson, S.: Can We Use Satellite-Based FAPAR to Detect Drought?, Sensors, 19, 3662, https://doi.org/10.3390/s19173662, 2019a.
Peng, J., Dadson, S., Leng, G., Duan, Z., Jagdhuber, T., Guo, W., and Ludwig, R.: The impact of the Madden-Julian Oscillation on hydrological extremes, J. Hydrol., 571, 142–149, https://doi.org/10.1016/j.jhydrol.2019.01.055, 2019b.
Peng, J., Dadson, S., Hirpa, F., Dyer, E., Lees, T., Miralles, D. G., Vicente-Serrano, S. M., and Funk, C.: A pan-African high-resolution drought index dataset, Earth Syst. Sci. Data, 12, 753–769, https://doi.org/10.5194/essd-12-753-2020, 2020.
Pyarali, K., Peng, J., Disse, M., and Tuo, Y.: Development and application of high resolution SPEI drought dataset for Central Asia, Sci. Data, 9, 172, https://doi.org/10.1038/s41597-022-01279-5, 2022.
Rojas, O., Vrieling, A., and Rembold, F.: Assessing drought probability for agricultural areas in Africa with coarse resolution remote sensing imagery, Remote Sens. Environ., 115, 343–352, https://doi.org/10.1016/j.rse.2010.09.006, 2011.
Sandeep, P., Obi Reddy, G. P., Jegankumar, R., and Arun Kumar, K. C.: Monitoring of agricultural drought in semi-arid ecosystem of Peninsular India through indices derived from time-series CHIRPS and MODIS datasets, Ecol. Indic., 121, 107033, https://doi.org/10.1016/j.ecolind.2020.107033, 2021.
Santini, M., Noce, S., Mancini, M., and Caporaso, L.: A Global Multiscale SPEI Dataset under an Ensemble Approach, Data, 8, 36, https://doi.org/10.3390/data8020036, 2023.
Seddon, A. W. R., Macias-Fauria, M., Long, P. R., Benz, D., and Willis, K. J.: Sensitivity of global terrestrial ecosystems to climate variability, Nature, 531, 229–232, https://doi.org/10.1038/nature16986, 2016.
Sheffield, J. and Wood, E. F.: Drought: Past problems and future scenarios, Taylor and Francis, https://doi.org/10.4324/9781849775250, 2012.
Sheffield, J., Wood, E. F., and Roderick, M. L.: Little change in global drought over the past 60 years, Nature, 491, 435–438, https://doi.org/10.1038/nature11575, 2012.
Shukla, S. and Wood, A. W.: Use of a standardized runoff index for characterizing hydrologic drought, Geophys. Res. Lett., 35, https://doi.org/10.1029/2007GL032487, 2008.
Singer, M. B., Asfaw, D. T., Rosolem, R., Cuthbert, M. O., Miralles, D. G., MacLeod, D., Quichimbo, E. A., and Michaelides, K.: Hourly potential evapotranspiration at 0.1∘ resolution for the global land surface from 1981-present, Sci, Data, 8, 224, https://doi.org/10.1038/s41597-021-01003-9, 2021.
Sivakumar, M. V. K., Stefanski, R., Bazza, M., Zelaya, S., Wilhite, D., and Magalhaes, A. R.: High Level Meeting on National Drought Policy: Summary and Major Outcomes, Weather and Climate Extremes, 3, 126–132, https://doi.org/10.1016/j.wace.2014.03.007, 2014.
Spinoni, J., Naumann, G., Vogt, J., and Barbosa, P.: The biggest drought events in Europe from 1950 to 2012, J. Hydrol., 3, 509–524, https://doi.org/10.1016/j.ejrh.2015.01.001, 2015.
Sternberg, T.: Regional drought has a global impact, Nature, 472, 169–169, https://doi.org/10.1038/472169d, 2011.
Sun, P., Ma, Z., Zhang, Q., Singh, V. P., and Xu, C.-Y.: Modified drought severity index: Model improvement and its application in drought monitoring in China, J. Hydrol., 612, 128097, https://doi.org/10.1016/j.jhydrol.2022.128097, 2022.
Swain, S., Patel, P., and Nandi, S.: Application of SPI, EDI and PNPI using MSWEP precipitation data over Marathwada, India, in: 2017 IEEE International Geoscience and Remote Sensing Symposium (IGARSS), 2017 IEEE International Geoscience and Remote Sensing Symposium (IGARSS), Fort Worth, TX, USA 23–28 July 2017, 5505–5507, https://doi.org/10.1109/IGARSS.2017.8128250, 2017.
Tallaksen, L. and Lanen, H. A. J. van: Hydrological drought, Processes and estimation methods for streamflow and groundwater, Elsevier, 2004.
Törnros, T. and Menzel, L.: Addressing drought conditions under current and future climates in the Jordan River region, Hydrol. Earth Syst. Sci., 18, 305–318, https://doi.org/10.5194/hess-18-305-2014, 2014.
Trambauer, P., Dutra, E., Maskey, S., Werner, M., Pappenberger, F., van Beek, L. P. H., and Uhlenbrook, S.: Comparison of different evaporation estimates over the African continent, Hydrol. Earth Syst. Sci., 18, 193–212, https://doi.org/10.5194/hess-18-193-2014, 2014.
Turco, M., Jerez, S., Donat, M. G., Toreti, A., Vicente-Serrano, S. M., and Doblas-Reyes, F. J.: A Global Probabilistic Dataset for Monitoring Meteorological Droughts, B. Am. Meteor. Soc., 101, E1628–E1644, https://doi.org/10.1175/BAMS-D-19-0192.1, 2020.
UNCCD: The Land-Drought Nexus Enhancing the role of land-based interventions in drought mitigation and risk management, United Nations Convention to Combat Desertification (UNCCD), https://www.unccd.int/resources/reports/land-drought-nexus-enhancing-role-land-based-interventions-drought-mitigation-and (last access: 28 November 2023), 2019.
UNCCD: Drought in numbers 2022 – Restoration for readiness and resilience, United Nations Convention to Combat Desertification (UNCCD), https://reliefweb.int/report/world/drought-numbers-2022-restoration-readiness-and-resilience (last access: 28 November 2023), 2022.
UNDRR: GAR Special Report on Drought 2021 | UNDRR, United Nations Office for Disaster Risk Reduction (UNDRR), https://www.undrr.org/publication/gar-special-report-drought-2021 (last access: 28 November 2023), 2021.
van Dijk, A. I. J. M., Beck, H. E., Crosbie, R. S., de Jeu, R. A. M., Liu, Y. Y., Podger, G. M., Timbal, B., and Viney, N. R.: The Millennium Drought in southeast Australia (2001–2009): Natural and human causes and implications for water resources, ecosystems, economy, and society, Water Resour. Res., 49, 1040–1057, https://doi.org/10.1002/wrcr.20123, 2013.
Van Loon, A. F.: Hydrological drought explained, WIREs Water, 2, 359–392, https://doi.org/10.1002/wat2.1085, 2015.
Van Loon, A. F., Rangecroft, S., Coxon, G., Werner, M., Wanders, N., Baldassarre, G. D., Tijdeman, E., Bosman, M., Gleeson, T., Nauditt, A., Aghakouchak, A., Breña-Naranjo, J. A., Cenobio-Cruz, O., Costa, A. C., Fendekova, M., Jewitt, G., Kingston, D. G., Loft, J., Mager, S. M., Mallakpour, I., Masih, I., Maureira-Cortés, H., Toth, E., Oel, P. V., Ogtrop, F. V., Verbist, K., Vidal, J.-P., Wen, L., Yu, M., Yuan, X., Zhang, M., and Lanen, H. A. J. V.: Streamflow droughts aggravated by human activities despite management, Environ. Res. Lett., 17, 044059, https://doi.org/10.1088/1748-9326/ac5def, 2022.
Vergni, L., Di Lena, B., Todisco, F., and Mannocchi, F.: Uncertainty in drought monitoring by the Standardized Precipitation Index: the case study of the Abruzzo region (central Italy), Theor. Appl. Climatol., 128, 13–26, https://doi.org/10.1007/s00704-015-1685-6, 2017.
Vicente-Serrano, S. M., Beguería, S., and López-Moreno, J. I.: A Multiscalar Drought Index Sensitive to Global Warming: The Standardized Precipitation Evapotranspiration Index, J. Climate, 23, 1696–1718, https://doi.org/10.1175/2009JCLI2909.1, 2010a.
Vicente-Serrano, S. M., Beguería, S., López-Moreno, J. I., Angulo, M., and Kenawy, A. E.: A New Global 0.5∘ Gridded Dataset (1901–2006) of a Multiscalar Drought Index: Comparison with Current Drought Index Datasets Based on the Palmer Drought Severity Index, J. Hydrometeorol., 11, 1033–1043, https://doi.org/10.1175/2010JHM1224.1, 2010b.
Vicente-Serrano, S. M., Beguería, S., Gimeno, L., Eklundh, L., Giuliani, G., Weston, D., El Kenawy, A., López-Moreno, J. I., Nieto, R., Ayenew, T., Konte, D., Ardö, J., and Pegram, G. G. S.: Challenges for drought mitigation in Africa: The potential use of geospatial data and drought information systems, Appl. Geogr., 34, 471–486, https://doi.org/10.1016/j.apgeog.2012.02.001, 2012.
Vicente-Serrano, S. M., Miralles, D. G., Domínguez-Castro, F., Azorin-Molina, C., Kenawy, A. E., McVicar, T. R., Tomás-Burguera, M., Beguería, S., Maneta, M., and Peña-Gallardo, M.: Global Assessment of the Standardized Evapotranspiration Deficit Index (SEDI) for Drought Analysis and Monitoring, J. Climate, 31, 5371–5393, https://doi.org/10.1175/JCLI-D-17-0775.1, 2018.
Vicente-Serrano, S. M., McVicar, T. R., Miralles, D. G., Yang, Y., and Tomas-Burguera, M.: Unraveling the influence of atmospheric evaporative demand on drought and its response to climate change, WIREs Climate Change, 11, e632, https://doi.org/10.1002/wcc.632, 2020.
Vicente-Serrano, S. M., Peña-Angulo, D., Beguería, S., Domínguez-Castro, F., Tomás-Burguera, M., Noguera, I., Gimeno-Sotelo, L., and El Kenawy, A.: Global drought trends and future projections, Philosophical Transactions of the Royal Society A: Mathematical, Phys. Eng. Sci., 380, 20210285, https://doi.org/10.1098/rsta.2021.0285, 2022.
Wan, Z., Hook, S., and Hulley, G.: MODIS/Terra Land Surface Temperature/Emissivity Monthly L3 Global 0.05Deg CMG V061, Land Processes Distributed Active Archive Center (LP DAAC), https://doi.org/10.5067/MODIS/MOD11C3.061, 2021.
Wang, H. and He, S.: The North China/Northeastern Asia Severe Summer Drought in 2014, J. Climate, 28, 6667–6681, https://doi.org/10.1175/JCLI-D-15-0202.1, 2015.
Wang, Q., Zeng, J., Qi, J., Zhang, X., Zeng, Y., Shui, W., Xu, Z., Zhang, R., Wu, X., and Cong, J.: A multi-scale daily SPEI dataset for drought characterization at observation stations over mainland China from 1961 to 2018, Earth Syst. Sci. Data, 13, 331–341, https://doi.org/10.5194/essd-13-331-2021, 2021.
Wartenburger, R., Seneviratne, S. I., Hirschi, M., Chang, J., Ciais, P., Deryng, D., Elliott, J., Folberth, C., Gosling, S. N., Gudmundsson, L., Henrot, A.-J., Hickler, T., Ito, A., Khabarov, N., Kim, H., Leng, G., Liu, J., Liu, X., Masaki, Y., Morfopoulos, C., Müller, C., Schmied, H. M., Nishina, K., Orth, R., Pokhrel, Y., Pugh, T. A. M., Satoh, Y., Schaphoff, S., Schmid, E., Sheffield, J., Stacke, T., Steinkamp, J., Tang, Q., Thiery, W., Wada, Y., Wang, X., Weedon, G. P., Yang, H., and Zhou, T.: Evapotranspiration simulations in ISIMIP2a–Evaluation of spatio-temporal characteristics with a comprehensive ensemble of independent datasets, Environ. Res. Lett., 13, 075001, https://doi.org/10.1088/1748-9326/aac4bb, 2018.
Warter, M. M., Singer, M. B., Cuthbert, M. O., Roberts, D., Caylor, K. K., Sabathier, R., and Stella, J.: Drought onset and propagation into soil moisture and grassland vegetation responses during the 2012–2019 major drought in Southern California, Hydrol. Earth Syst. Sci., 25, 3713–3729, https://doi.org/10.5194/hess-25-3713-2021, 2021.
Wehner, M., Seneviratne, S., Zhang, X., Adnan, M., Badi, W., Dereczynski, C., Di Luca, A., Ghosh, S., Iskandar, I., Kossin, J., Lewis, S., Otto, F., Pinto, I., Masaki, S., Vicente-Serrano, S., Zhou, B., Hauser, M., Kirchmeier-Young, M., and Wan, H.: Chapter 11: Weather and climate extreme events in a changing climate, 2021, U13B-11, Cambridge University Press, https://doi.org/10.1017/9781009157896.013, 2021.
Wilhite, D. A., Svoboda, M. D., and Hayes, M. J.: Understanding the complex impacts of drought: A key to enhancing drought mitigation and preparedness, Water Resour. Manage., 21, 763–774, https://doi.org/10.1007/s11269-006-9076-5, 2007.
Wu, D., Zhao, X., Liang, S., Zhou, T., Huang, K., Tang, B., and Zhao, W.: Time-lag effects of global vegetation responses to climate change, Glob. Change Biol., 21, 3520–3531, https://doi.org/10.1111/gcb.12945, 2015.
Xu, Z., Wu, Z., He, H., Wu, X., Zhou, J., Zhang, Y., and Guo, X.: Evaluating the accuracy of MSWEP V2.1 and its performance for drought monitoring over mainland China, Atmos. Res., 226, 17–31, https://doi.org/10.1016/j.atmosres.2019.04.008, 2019.
Zeng, J., Zhang, R., Qu, Y., Bento, V. A., Zhou, T., Lin, Y., Wu, X., Qi, J., Shui, W., and Wang, Q.: Improving the drought monitoring capability of VHI at the global scale via ensemble indices for various vegetation types from 2001 to 2018, Weather and Climate Extremes, 35, 100412, https://doi.org/10.1016/j.wace.2022.100412, 2022.
Zhan, S., Song, C., Wang, J., Sheng, Y., and Quan, J.: A Global Assessment of Terrestrial Evapotranspiration Increase Due to Surface Water Area Change, Earth's Future, 7, 266–282, https://doi.org/10.1029/2018EF001066, 2019.
Zhao, M., Aa, G., Velicogna, I., and Kimball, J.: A Global Gridded Dataset of GRACE Drought Severity Index for 2002–14: Comparison with PDSI and SPEI and a Case Study of the Australia Millennium Drought, J. Hydrometeorol., 18, 2117–2129, https://doi.org/10.1175/JHM-D-16-0182.1, 2017.
Ziese, M., Schneider, U., Meyer-Christoffer, A., Schamm, K., Vido, J., Finger, P., Bissolli, P., Pietzsch, S., and Becker, A.: The GPCC Drought Index – a new, combined and gridded global drought index, Earth Syst. Sci. Data, 6, 285–295, https://doi.org/10.5194/essd-6-285-2014, 2014.
Zuhro, A., Tambunan, M. P., and Marko, K.: Application of vegetation health index (VHI) to identify distribution of agricultural drought in Indramayu Regency, West Java Province, IOP Conf. Ser.: Earth Environ. Sci., 500, 012047, https://doi.org/10.1088/1755-1315/500/1/012047, 2020.