the Creative Commons Attribution 4.0 License.
the Creative Commons Attribution 4.0 License.
 | 27 Nov 2023
A global zircon U–Th–Pb geochronological database
Yujing Wu
Xianjun Fang
Jianqing Ji
Since the start of the 21st century, the widespread application of ion probes has promoted the mass output of high-precision and high-accuracy U–Th–Pb geochronological data. Zircon, as a commonly used mineral for U–Th–Pb dating, widely exists in the continental crust and records a variety of geological activities. Due to the universality and stability of zircon and the long half-lives of U and Th isotopes, zircon U–Th–Pb geochronology can provide nearly continuous records for almost the entirety of Earth's history and is thus essential to studying the growth and evolution of the continental crust and Earth system evolution. Here, we present a database of zircon U–Th–Pb geochronology that samples the global continental crust and spans nearly all of Earth's history. This database collects ∼2 000 000 geochronology records from ∼12 000 papers and dissertations. This paper describes the compiled raw data, presents the relationship between dating error and zircon age, compares the error levels of different dating instruments, and discusses the impact of sampling bias on data analysis as well as how to evaluate and minimize this impact. In addition, we provide an overview of the temporal and spatial distribution of global zircon ages and provide key insights into the potential research value of zircon ages for Earth system science, such as crustal evolution, plate tectonics, and paleoclimate changes, as well as commercial use in mining and energy exploration. Overall, this data collection provides us with a comprehensive platform with which to study zircon chronological data in deep time and space. The described zircon database is freely available via Zenodo at https://doi.org/10.5281/zenodo.7387566 (Wu et al., 2023).
- Article
(8233 KB) - Full-text XML
-
Supplement
(2530 KB) - BibTeX
- EndNote


Zircon U–Th–Pb geochronology has been made much more practical since Krogh (1973) invented isotope dilution thermal ionization mass spectrometry (ID-TIMS) (Song, 2015; Davis et al., 2003). With the widespread use of ion probe mass spectrometers, in situ microanalysis can be performed efficiently and precisely, promoting the rapid development of zircon U–Th–Pb dating (Gehrels, 2014; Carrapa, 2010). The main dating instruments at present include laser ablation inductively coupled plasma mass spectrometry (LA-ICP-MS), secondary ion mass spectrometry (SIMS), sensitive high-resolution ion microprobe (SHRIMP), and thermal ionization mass spectrometry (TIMS) instruments (Becker, 2007).
The U–Th–Pb decay system plays a key role in geochronology. The half-lives of 238U, 235U, and 232Th isotopes are long enough to date Earth's entire history but short enough to allow for the accurate measurement of both parent and daughter isotopes. Based on the decay of 238U→206Pb (half-life: 4.47 billion years, Gyr), 235U→207Pb (0.70 Gyr half-life), and 232Th→208Pb (14.01 Gyr half-life) (Jaffey et al., 1971), we can obtain three ages, i.e., 206Pb 238U, 207Pb 235U, and 208Pb 232Th. Using the abundance ratio of natural U isotopes, 238I 235U≈137.8, another 207Pb 206Pb age can be derived (Spencer et al., 2016; Hiess et al., 2012). If these ages are consistent with one another, the decay system is closed, verifying the reliability of the measured ages. This also represents an advantage of U–Th–Pb dating over other isotope-dating methods.
Zircon is a common accessory mineral that can stably exist in various kinds of rocks and that is distributed throughout the global continental crust of all ages (Hanchar and Hoskin, 2018; Hawkesworth et al., 2010). It is not unusual for zircon to survive through multiphase complex magmatism and metamorphism as a result of their physical and chemical stability (Hawkesworth et al., 2010). Due to its low original Pb content, rich Th and U contents, and high closure temperature for trace element diffusion, zircon is one of the most widely used minerals for U–Th–Pb isotopic dating (Williams, 2015). In addition, the zircon age distribution can span nearly all of geological history. The oldest zircon discovered thus far is 4.4 Gyr old (Wilde et al., 2001). Thus, zircon U–Th–Pb geochronology provides an excellent means of exploring the deep-time evolution of the continental crust (Voice et al., 2011).
With the widespread application of ion probe mass spectrometers, many zircon U–Th–Pb ages have been measured by various chronology laboratories worldwide in the past 2 decades (Puetz and Condie, 2019; Wu et al., 2022). These zircons are sampled in the global continental crust, with ages nearly continuously spanning from 4.4 billion years ago (Ga) to the present (Puetz et al., 2017). Here, we collected zircon U–Th–Pb dating records for the past decades and built a global zircon database, which could provide a means for enhanced academic and commercial geological analyses.
Many scholars have previously collected zircon data to explore the evolution of the solid Earth and Earth's geodynamic history. Voice et al. (2011) compiled ∼5100 individually dated detrital zircon samples with ∼200 000 dating records and suggested that the temporal distribution of zircon ages could indicate episodic crustal recycling. This evidence provided by zircons is consistent with plate tectonics. By analyzing the temporal distribution of zircon U–Pb ages combined with craton collisions and crustal cycles, Condie (2013) explored the evolution of the Proterozoic crust from the Nuna supercontinent to the Rodinia supercontinent. McKenzie et al. (2016) used ∼120 000 detrital zircon U–Pb age data from areas worldwide to explore the spatial distribution of continental magmatic arc systems in the Cryogenian period. Puetz and Condie (2019) collected U–Pb age data for ∼610 000 detrital zircons and ∼212 000 igneous zircons sampled worldwide and from five other isotope databases, showing the geochemical cycles of mantle evolution. Wu et al. (2022) analyzed the zircon production series of the global continental crust, compared it to astronomical driving factors, and proposed that the evolution of the continental crust and even the Earth system may be affected by the astronomical environment. Martin et al. (2022) collected >150 000 zircon analyses from >260 publications using an automated tool and got a consistent trend in zircon age frequency with previous studies (Martin, 2022). This automated approach will bring great convenience to data collection and promote big-data analysis. In addition, curated compilations, such as Earth Chemistry (EarthChem) and Geochemistry of Rocks of the Oceans and Continents (GEOROC), are developed and will be continuously updated, providing powerful and sustainable data sources for future research.
However, insufficient data with limited global coverage can affect results, which in turn can contribute to misleading interpretations (Wu et al., 2020; Puetz et al., 2017). Here, we present a database of ∼2 000 000 zircon U–Th–Pb dating records sampled from the global continental crust (Wu et al., 2023). The dating techniques used include LA-ICP-MS, SHRIMP, SIMS, and TIMS instruments; zircon host rocks include igneous, metamorphic, and sedimentary rocks. This database provides a comprehensive source of geochronological data, both temporally and spatially, for future Earth system science research. From this database, scholars can not only obtain an overview of global zircon production throughout Earth's entire history, but can also study the evolution of zircon production in each period and region. If these data are combined with other geological and astronomical events, it is also possible to deeply explore the energy source of Earth's dynamics and the mechanisms behind it. In the future, this database may even provide constraints for astronomical parameters and their evolution, expanding the deep-time dimension of astronomical parameters. In addition, from the perspective of data science, the large data volume and the global sampling range of this database give us a good experimental platform for analyzing and solving biased sampling issues.
Here, we collected ∼2 000 000 zircon U–Th–Pb age data points sampled from the global continental crust from ∼12 000 references, with zircon ages spanning all of Earth's history. This database is based on the original Chinese zircon U–Th–Pb dating database (Fang et al., 2018; Wu et al., 2019), with data sampled only in the Chinese continental crust and published in 2017 and earlier. Specifically, for the zircon records used in the study of Fang et al. (2018), the number of data points is 154 768, and the corresponding original references were published by the academic publisher of China National Knowledge Infrastructure (CNKI). The zircon data in the study of Wu et al. (2019) contained ∼410 000 dating records, which were collected from Elsevier. The new database in this paper, however, expanded the sampling sites to the global continental crust and updated data published from 2018 to 2020. The new original references were collected from the academic publishers of Elsevier (ScienceDirect full-text database), Cambridge, the Geological Society of London, Oxford, Springer, Taylor & Francis, Wiley, and CNKI. This new global database was used for time series analysis in the work of Wu et al. (2022), and we subsequently carried out more data-cleaning work.
The compilation of zircon data is divided into two categories: (1) the “Database” files, which include ∼2 000 000 records of zircon U–Th–Pb isotope ratios, ages, sample information, dating instruments, parent rock lithology, sampling locations, and reference numbers, and (2) the “References” file, which provides information on ∼12 000 original references corresponding to the zircon geochronological data, including author, year of publication, and detailed publication data. For each record in the Database files, a reference can be found in the References file from its reference number. This database is available at https://doi.org/10.5281/zenodo.7387566.
Notably, we improved the codes for extracting GPS information, so the GPS data used here are slightly different from the sampling map given in Wu et al. (2022) (see Fig. 1). The details of the improvement are as follows. (1) In the original references, the symbols of GPS “degrees, minutes, and seconds” are varied, it is difficult for a computer to completely distinguish them, and sometimes they are not even recognized or are recognized incorrectly. The new modification expands the recognition range of the codes for the “degrees, minutes, and seconds” symbols and manually normalizes some abnormally identified GPS data according to the original references. (2) The initial GPS extraction codes were aimed at the Chinese continental crust, and the GPS range was restricted in the screening step. Later, when the code was updated to extract the global GPS data, some details were omitted, resulting in the loss of some GPS data, especially for Europe.
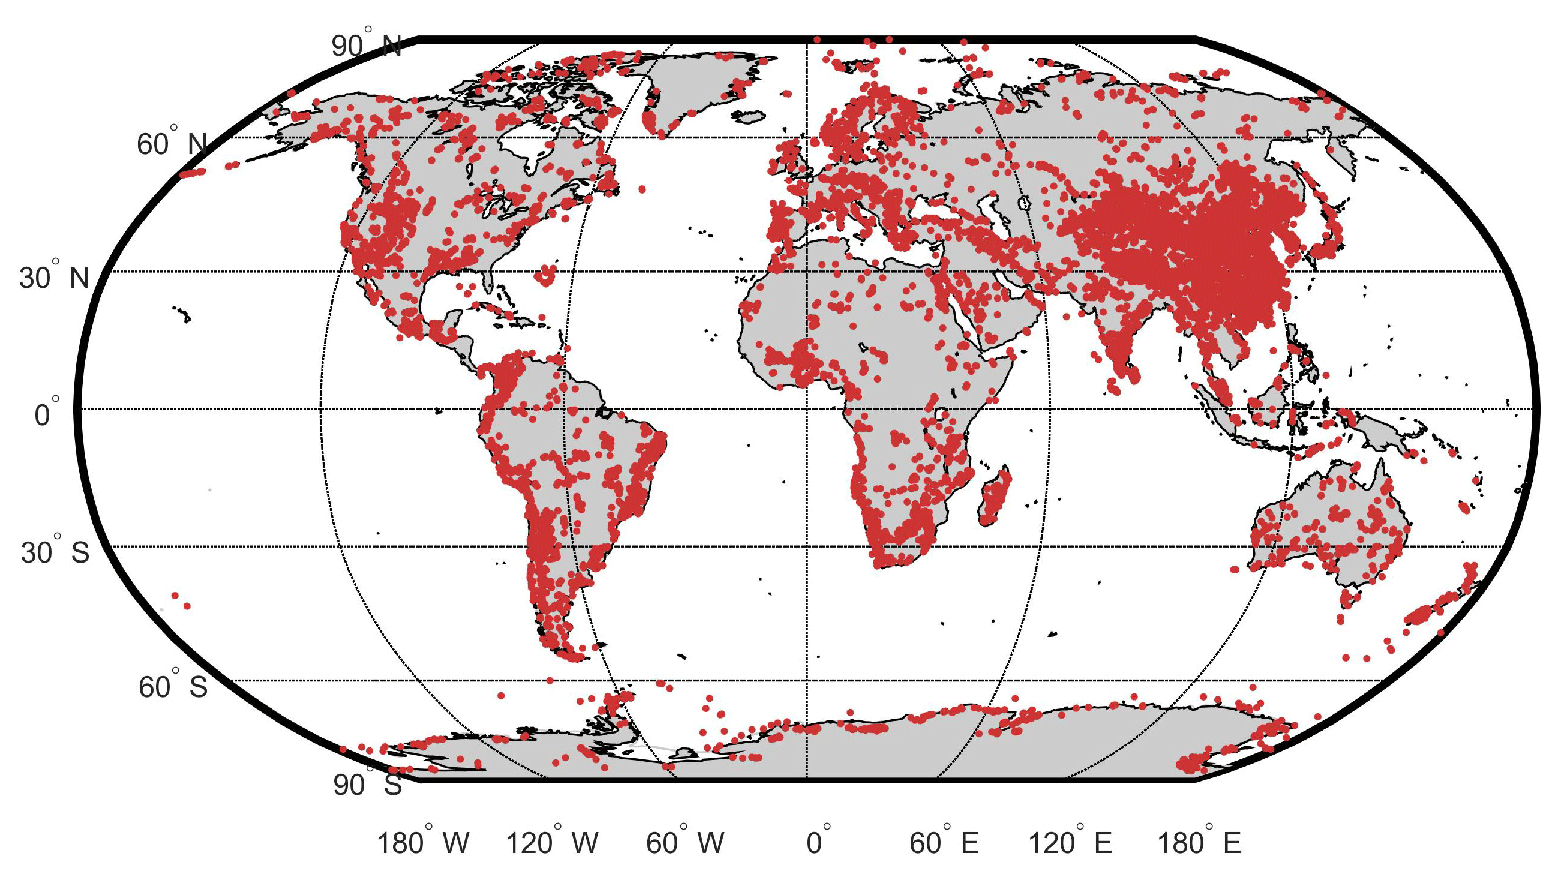
Figure 1Map of the distribution of zircon sampling locations. Each red dot indicates a sampling location (adapted from Wu et al., 2022).
2.1 Geochronological database
For the “Database” files, the fields of each record are detailed in Table 1. The database contains indices, isotope ratios, and uncertainties of 206Pb 238U, 207Pb 235U, 207Pb 206Pb, and 208Pb 232Th; ages and uncertainties derived from the above isotope ratios; dating instruments; reference materials for deriving ages; lithology of the host rock; and GPS coordinates of the sampling location. Data_number is the unique index for each chronological record. For each record in the “Database”, the source references can be found in the “References” file by Ref_number. The dating instruments include LA-ICP-MS, SIMS, SHRIMP, and TIMS. We also provide reference materials that were used to derive ages for further exploration. Notably, there are some null values in the database because the original papers did not publish them. Despite these deficiencies, the database still has considerable potential for geological research. The percentages of the records that are not null are listed in Table 1. Most fields have null values of less than 25 %, except for reference materials (68.88 %) and data on 232Th–208Pb decay (11 %–14 %), which is used less than other decay systems. In addition, there are significant regional disparities in zircon sampling (Fig. 1). For zircon records with GPS information (∼1.6 million records), data sampled from China and Europe account for ∼42 % and 8.9 %, respectively. This sampling bias should be considered based on research purposes before analysis.
Table 1Data specifications of the zircon U–Th–Pb database.
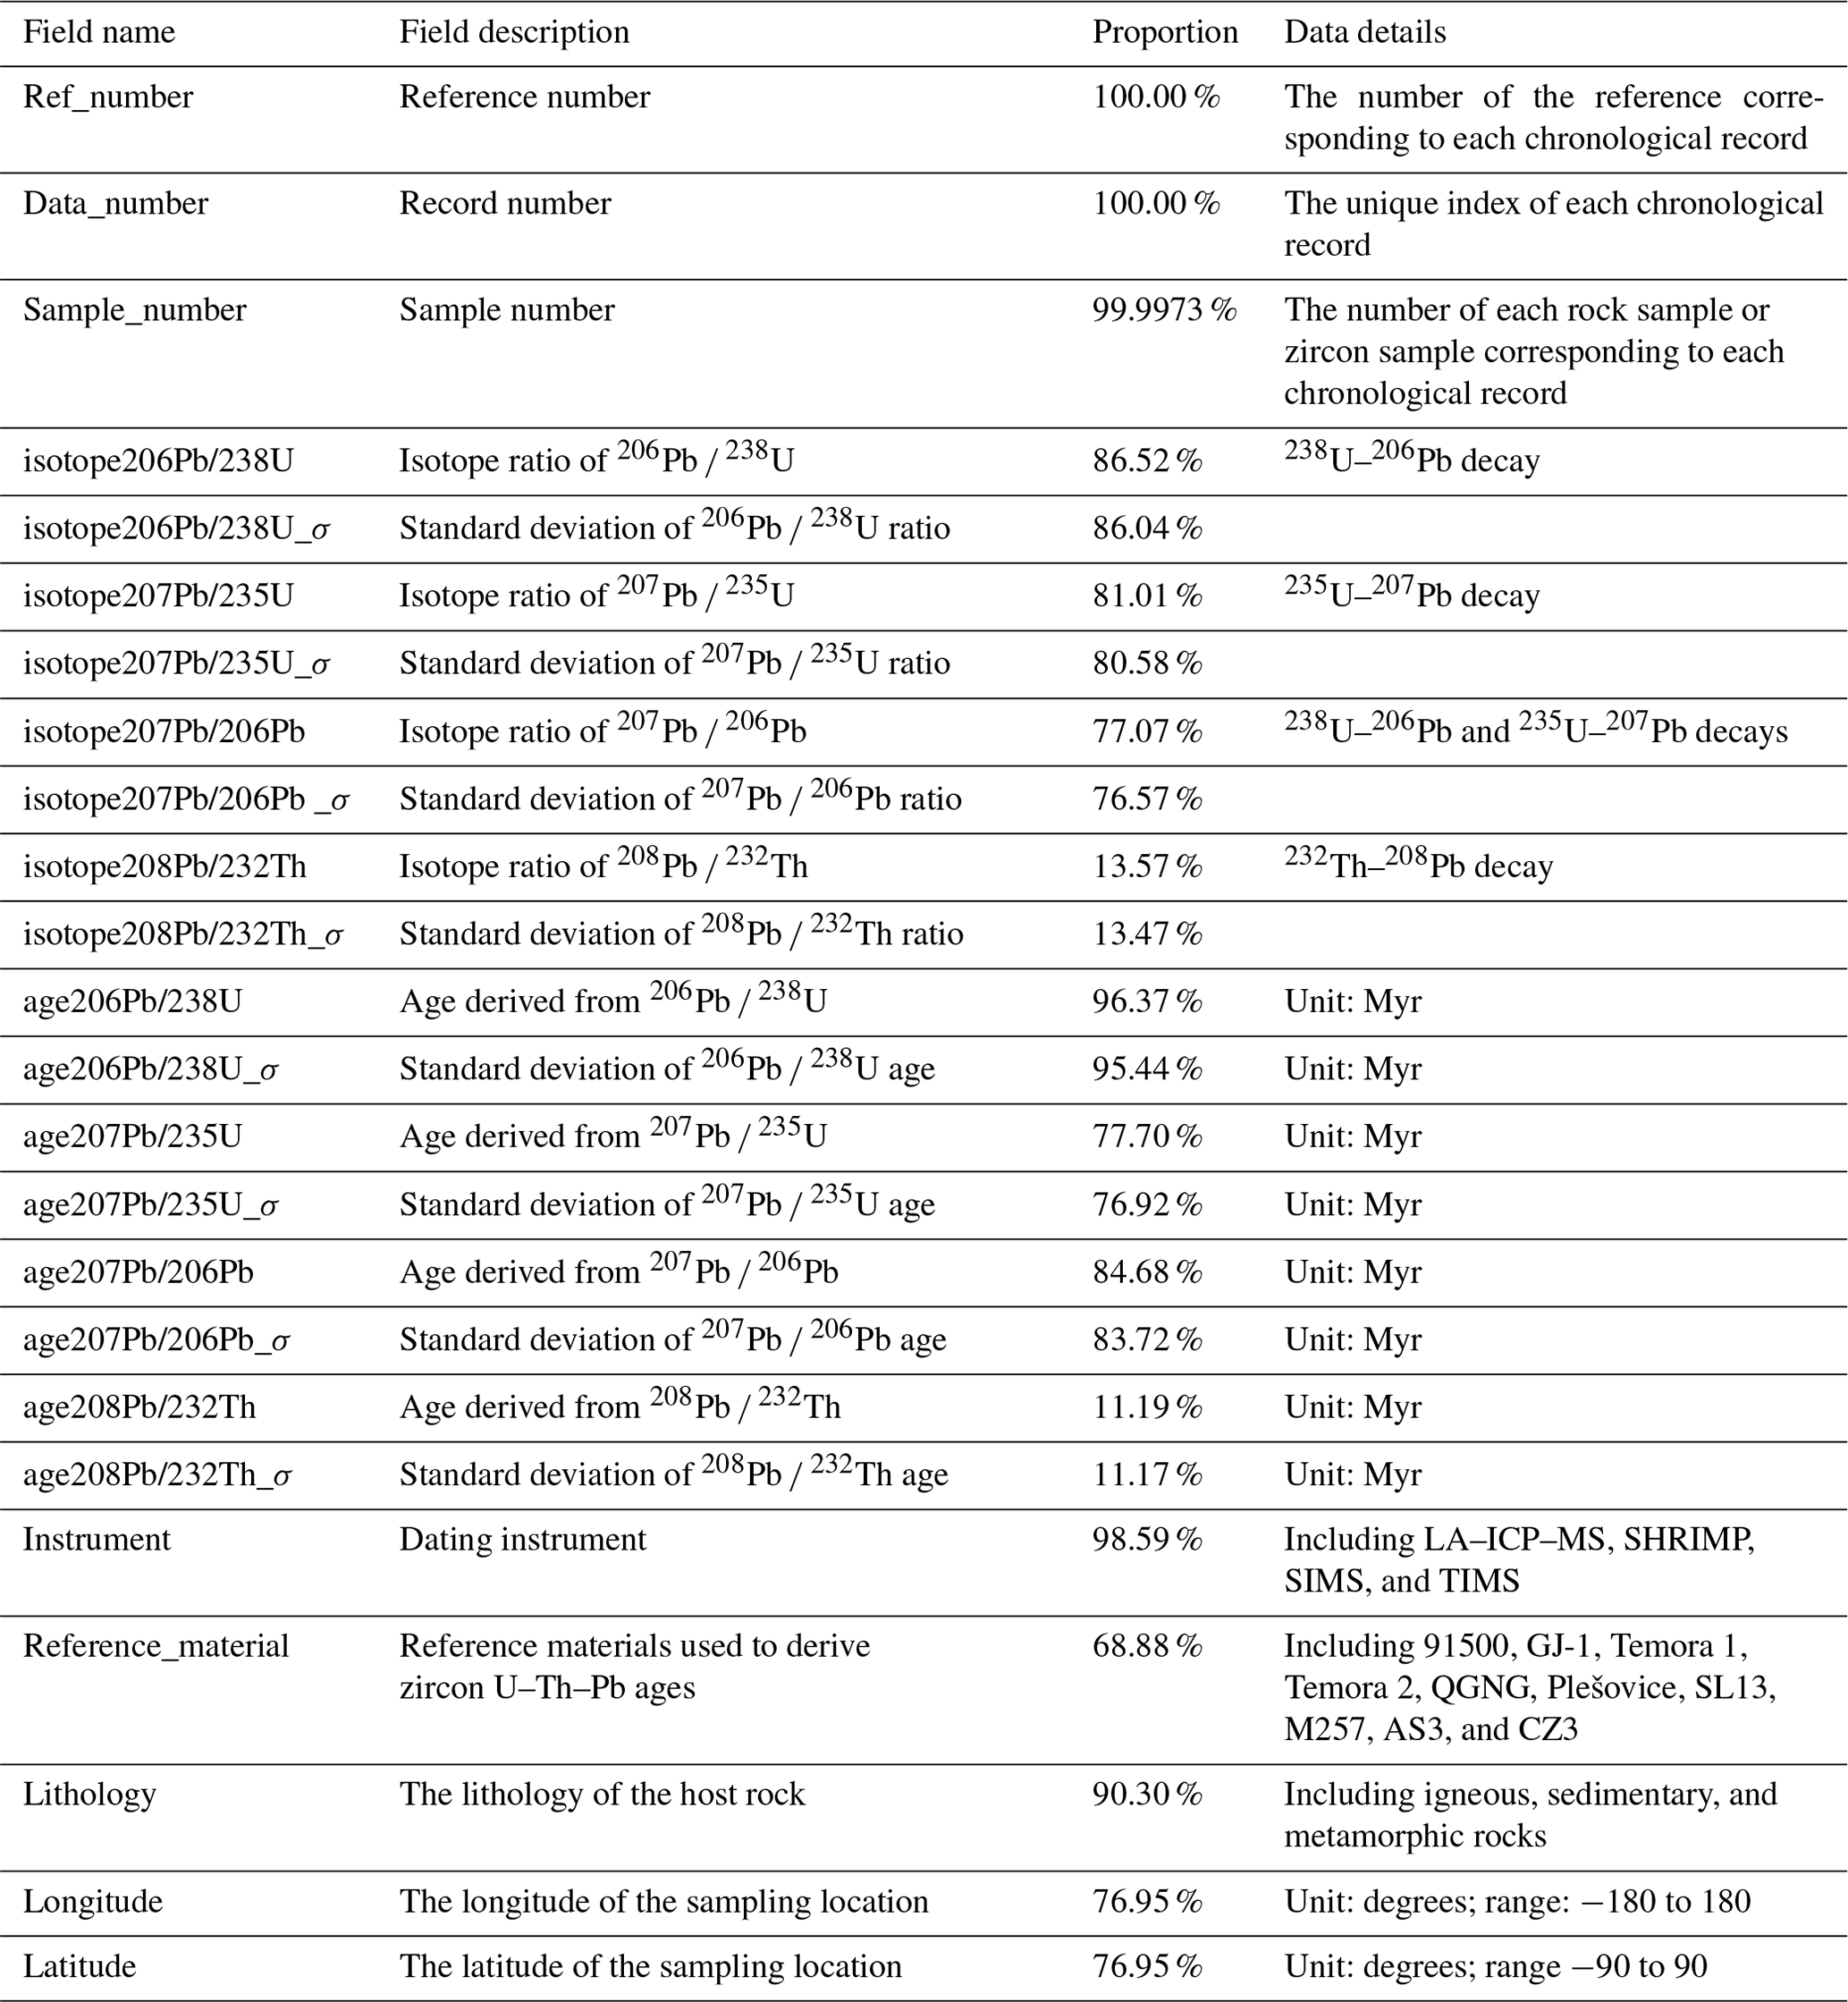
“Myr” indicates “million years”. The “Proportion” column lists the proportion of non-null values.
2.2 Data references
The chronological data used in this study were collected from ∼12 000 references of the following academic publishers: Elsevier (ScienceDirect full-text database), Cambridge, the Geological Society of London, Oxford, Springer, Taylor & Francis, Wiley, and CNKI. Original reference information for the chronological data is included in the “References” file (see the data repository on Zenodo). The fields of each reference record are detailed in Table 2. The “Ref_number” field, i.e., the reference number, cites the unique index in the “References” file corresponding to multiple chronological records in the “Database” files. The “DOI” field provides a unique digital object identifier to access the original reference. However, not all references have a DOI, especially Chinese dissertations and old papers. Instead, we supplement the “URL” field, which contains web addresses for the references without a DOI; 82.93 % of the literature has a DOI and 4.12 % of the literature has a URL. For the remaining 13.09 % of the literature, the unique identification of the data source can still be guaranteed by other information we provided: the first author, title, journal, volume, issue, first page, and last page.
Table 2Data specifications of the “References” file.
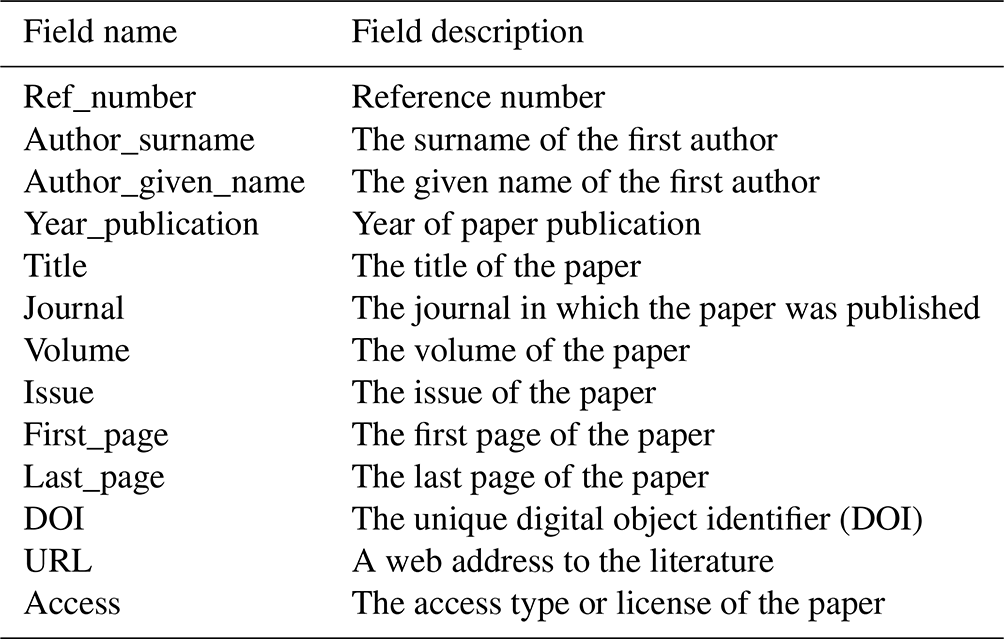
For references in Chinese, the “Author_surname” field is the full name of the first author owing to the Chinese citation format.
3.1 Uncertainty normalization
We unified the uncertainty form of isotope ratios and ages into standard deviation for the convenience of conducting research. There were various uncertainty forms published in the original literature. The specific processing procedures for each form were as follows.
-
The most ideal form of uncertainty was standard deviation (e.g., 1 SD and 1σ), which we collected directly from the literature.
-
If the uncertainty form was 2 standard deviations (e.g., .g., 2 SD and 2σ), we divided the original uncertainty by 2 and then compiled the new uncertainty into our database.
-
The uncertainty, which appeared as a percentage, represented a relative error. First, we multiplied this percentage by its corresponding isotope ratio or age to obtain an absolute error. Then, we repeated procedures (1) or (2) to normalize this absolute error into standard deviation.
3.2 Lithology classification
We categorized the lithology of the host rocks into three groups, i.e., sedimentary, igneous, and metamorphic rocks. During the initial collection, we directly input the lithologies that were published along with the geochronological data in the original literature. However, there were more than 4000 phrases used in the literature to describe lithology, which brought great difficulties to the statistical analysis of data grouped by the host rock lithology. In this case, we extracted the original detailed lithologies and classified them into three major types, referring to the national standards of the Classification and Nomenclature Schemes of Igneous Rocks (GB/T 17412.1-1998) (Qin et al., 1998), Sedimentary Rocks (GB-T17412.2-1998) (Yang et al., 1998), and Metamorphic Rocks (GB/T 17412.3-1998) (Chong et al., 1998). We left the “Lithology” field empty if the original literature did not provide any lithology information. The null-value percentage was 9.70 %.
3.3 Grouping instruments
We cleaned the “Instrument” field and grouped them into four major groups: LA-ICP-MS, SHRIMP, SIMS, and TIMS. There were more than 300 instruments provided in the original literature. For research convenience, we categorized similar instruments into four major categories. The LA-ICP-MS instrument category includes, for example, LA-ICP-MS, LA-Q-ICP-MS, LA-SF-ICP-MS, LA-MC-ICP-MS, and LAM-ICP-MS. The SHRIMP instrument category includes, for example, SHRIMP, SHRIMP II, and SHRIMP RG. The SIMS instrument category contains SIMS, Cameca IMS 1270, Cameca IMS 1280, and NORDSIM. The TIMS instrument category includes TIMS, the VG354 mass spectrometer, the MAT 262 mass spectrometer, and the TRITON spectrometer.
4.1 Dating uncertainty
The zircon U–Th–Pb dating error is related to the zircon age and dating instruments. In this study, the age error within a certain time interval is obtained using the moving-average method (Wu et al., 2022) (see Fig. 2 and the Supplement). When the sample is too old, the dating uncertainty of all age types increases significantly, which may be attributed to sample preservation. The error points for various ages were fitted to obtain error curves (see the equations in Table S1 in the Supplement). For dating instruments, although TIMS is more precise, instruments such as LA-ICP-MS are more cost-effective and thus are more widely used (Gehrels, 2014). This paper gives the relationship between the error and age of the four dating instruments of LA-ICP-MS, SHRIMP, SIMS, and TIMS. The numbers of chronological records for the instruments above are 1.6×10⁶, 2.6×10⁵, 8.1×10⁴, and 3.3×10⁴, respectively. The relationships between the various age errors of these four dating instruments are similar, but the specific intersection points of the curves are different (see Fig. 3, Figs. S1–S4, and Table S2).
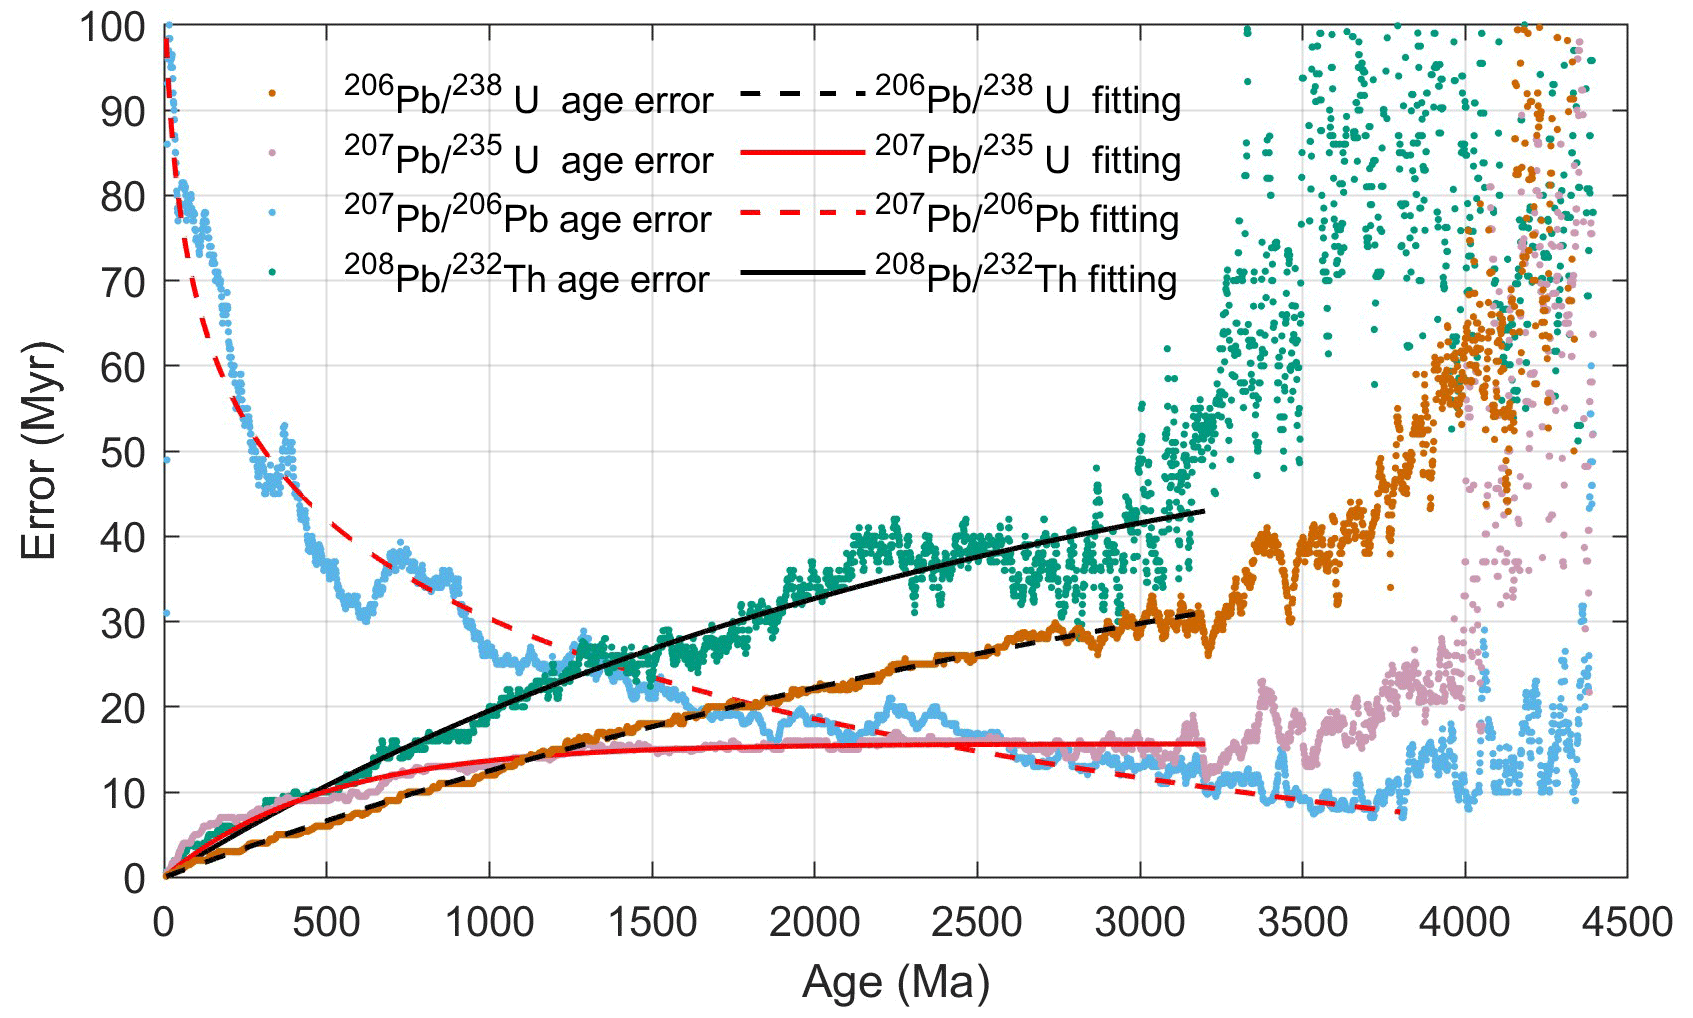
Figure 2Age errors of four age dating types and their fitting curves. See Table S1 for more fitting information.
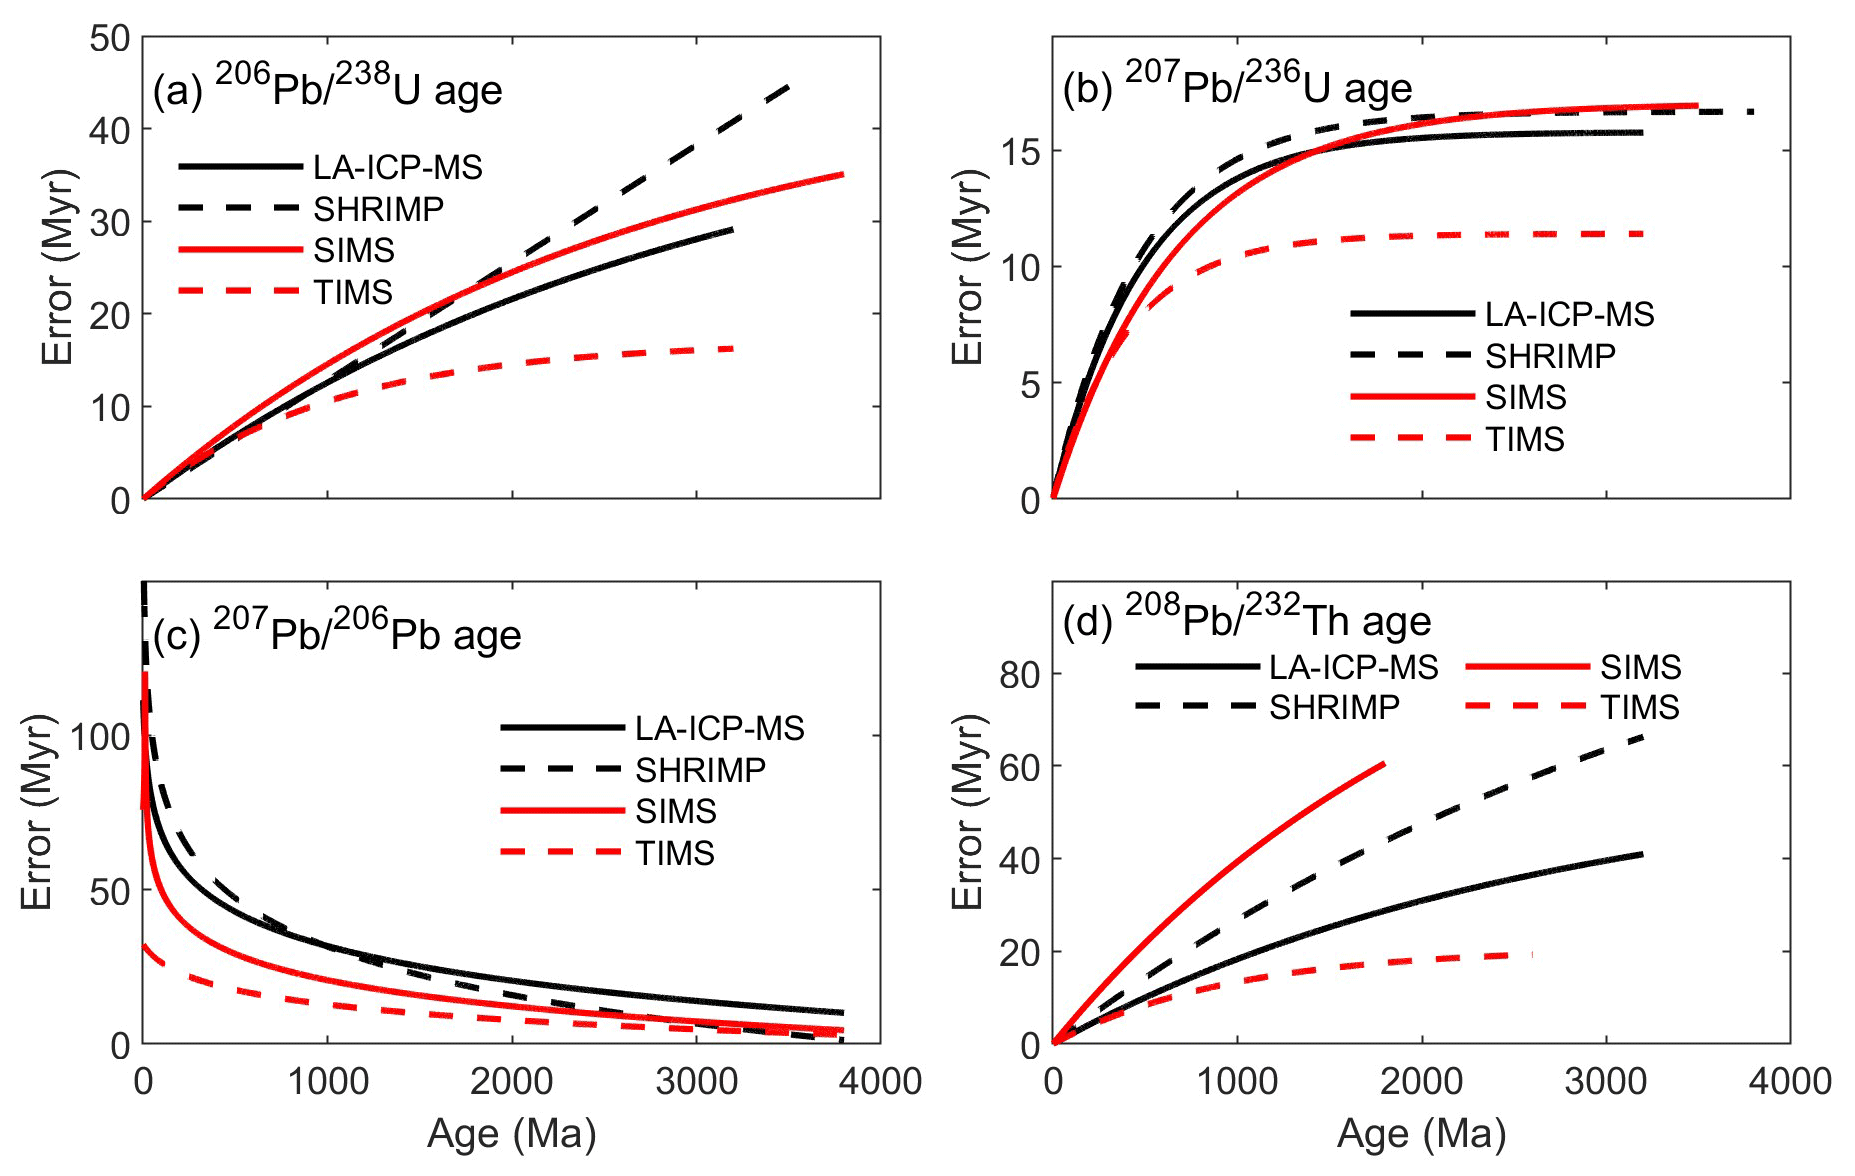
Figure 3Comparison of age errors of different dating instruments. (a) 206Pb 238U age; (b) 207Pb 235U age; (c) 207Pb 206Pb age; (d) 208Pb 232Th age.
4.2 Temporal and spatial characteristics
Zircon production increases with magmatic and metamorphic activities. Therefore, the amount of zircon production can be used to understand the past intensity of geological activity (Arndt and Davaille, 2013). A simple and direct proxy is the number of zircon age records for different geological times, which can indicate the intensity of magmatic and metamorphic activities (Wu et al., 2022). First, we used the noniterative probability model to derive a recommended age for each dating record (Puetz et al., 2021; Puetz and Spencer, 2023). Then, we conducted bootstrap resampling and Monte Carlo simulation with weights based on the spatiotemporal density to minimize the impact of biased sampling (Mehra et al., 2021; Keller and Schoene, 2012) (see the Supplement for detailed procedures). Figure 4 shows that the zircon age series of all the lithologies is more similar to that of sedimentary rocks, which may be explained by zircons in sedimentary rocks being composed of a natural mixture of igneous and metamorphic zircons. Nevertheless, the zircon production peak periods reflected in the age series of sedimentary, igneous, and metamorphic rocks are basically consistent, i.e., ca. 800, 1000, 1850, 2500, 2700, 3200, and 3400 Ma in the Precambrian. Figure 5 is presented to more clearly show zircon production in the Phanerozoic, during which prominent zircon age peaks occurred ca. 50, 130, 250, 300, and 440 Ma, reflected in the zircons of all three lithologies. However, sedimentary rocks at 100 and 160 Ma, igneous rocks at 220 Ma, and metamorphic rocks at 220, 240, and 500 Ma have different zircon peaks. Specific geological meanings can be analyzed in depth with the help of this database as well as other geological evidence. Furthermore, Figs. 4 and 5 clearly show that the time series of zircon production is multiscale and periodic. Wu et al. (2022) systematically analyzed the periodicity of the zircon age series and finally gave the following cycles: ca. 800, 360, 220, 160, 69, 57, 44, 30, 20, and 17 Myr.
The database here supports the globally heterogeneous distribution of magmatic U–Pb ages (Hawkesworth et al., 2010; Puetz et al., 2017). The spatial evolution of zircon production can be obtained by extracting the GPS coordinates of zircon-sampling sites in certain age intervals. Although the present geographical locations differ from those of the past, this spatial distribution still has indicative significance. According to the zircon production peak periods given above, the spatial distribution of zircons for these periods can be plotted. Because age error varies with age, we use a 50 Myr age interval for zircon peaks in the Phanerozoic and a 100 Myr interval for the Precambrian data. Because of the similarity in the spatial distribution of zircons with similar ages, this paper presents only the spatial pattern of the main peak periods, i.e., 50 ± 25, 130 ± 25, 250 ± 25, 440 ± 25, 1000 ± 50, 1850 ± 50, 2500 ± 50, and 3400 ± 50 Ma (Fig. 6). Inevitably, some areas were oversampled, such as China and Europe, and overly old ages are sparse due to preservation. In this case, we should pay more attention to relative rather than absolute zircon densities when comparing regions. “Zircon density” here refers to age counts per a grid which is bounded by longitudes of 4∘ length and latitudes of 2∘ width during the peak periods (50 or 100 Myr).
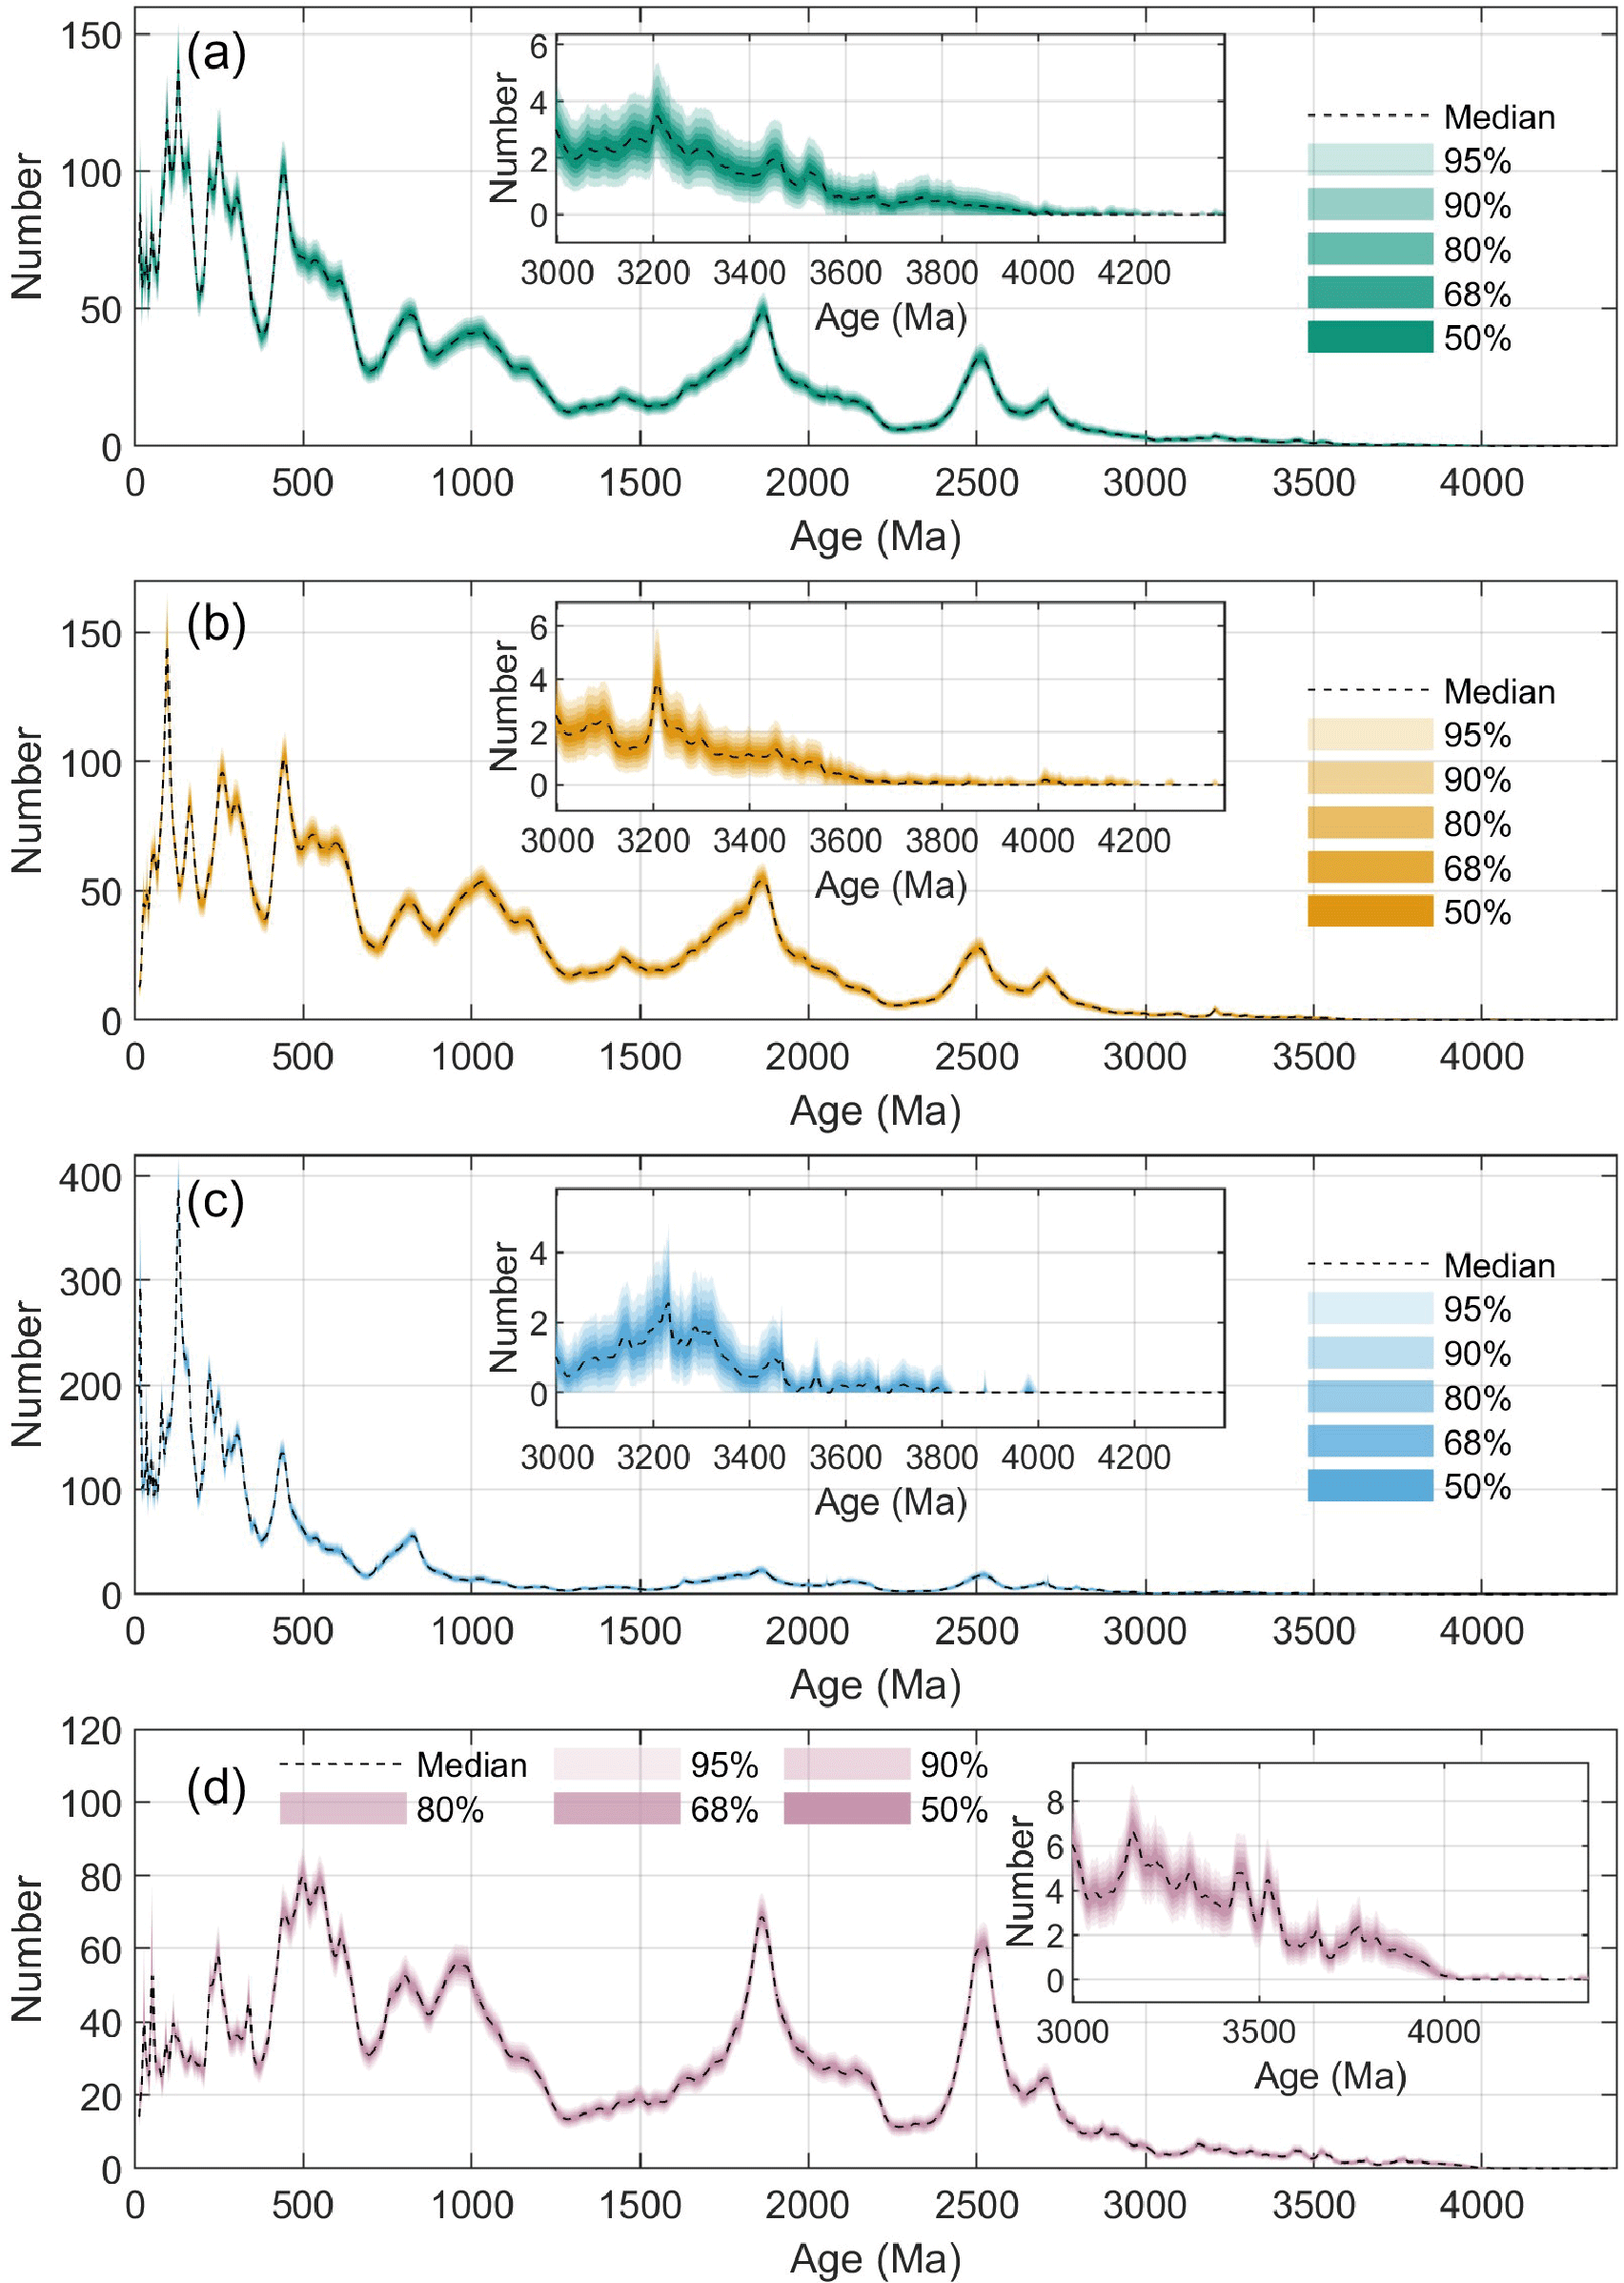
Figure 4Zircon production series since 4.4 Ga. The host rocks of each zircon series are (a) of all lithologies, (b) sedimentary rocks, (c) igneous rocks, and (d) metamorphic rocks. The insets of panels (a–d) focus on the data before 3 Ga. Inverse proximity weighting, bootstrap resampling, and Monte Carlo simulation were applied to solve the biased sampling issue. The filled zones represent 10 000 Monte Carlo simulations of the zircon series with different transparencies, indicating different distribution probabilities as shown in the legend. The dashed line indicates the median of the simulations. In each simulation, simulated zircon ages are selected based on a normal distribution. For more methodological details, see the Supplement.
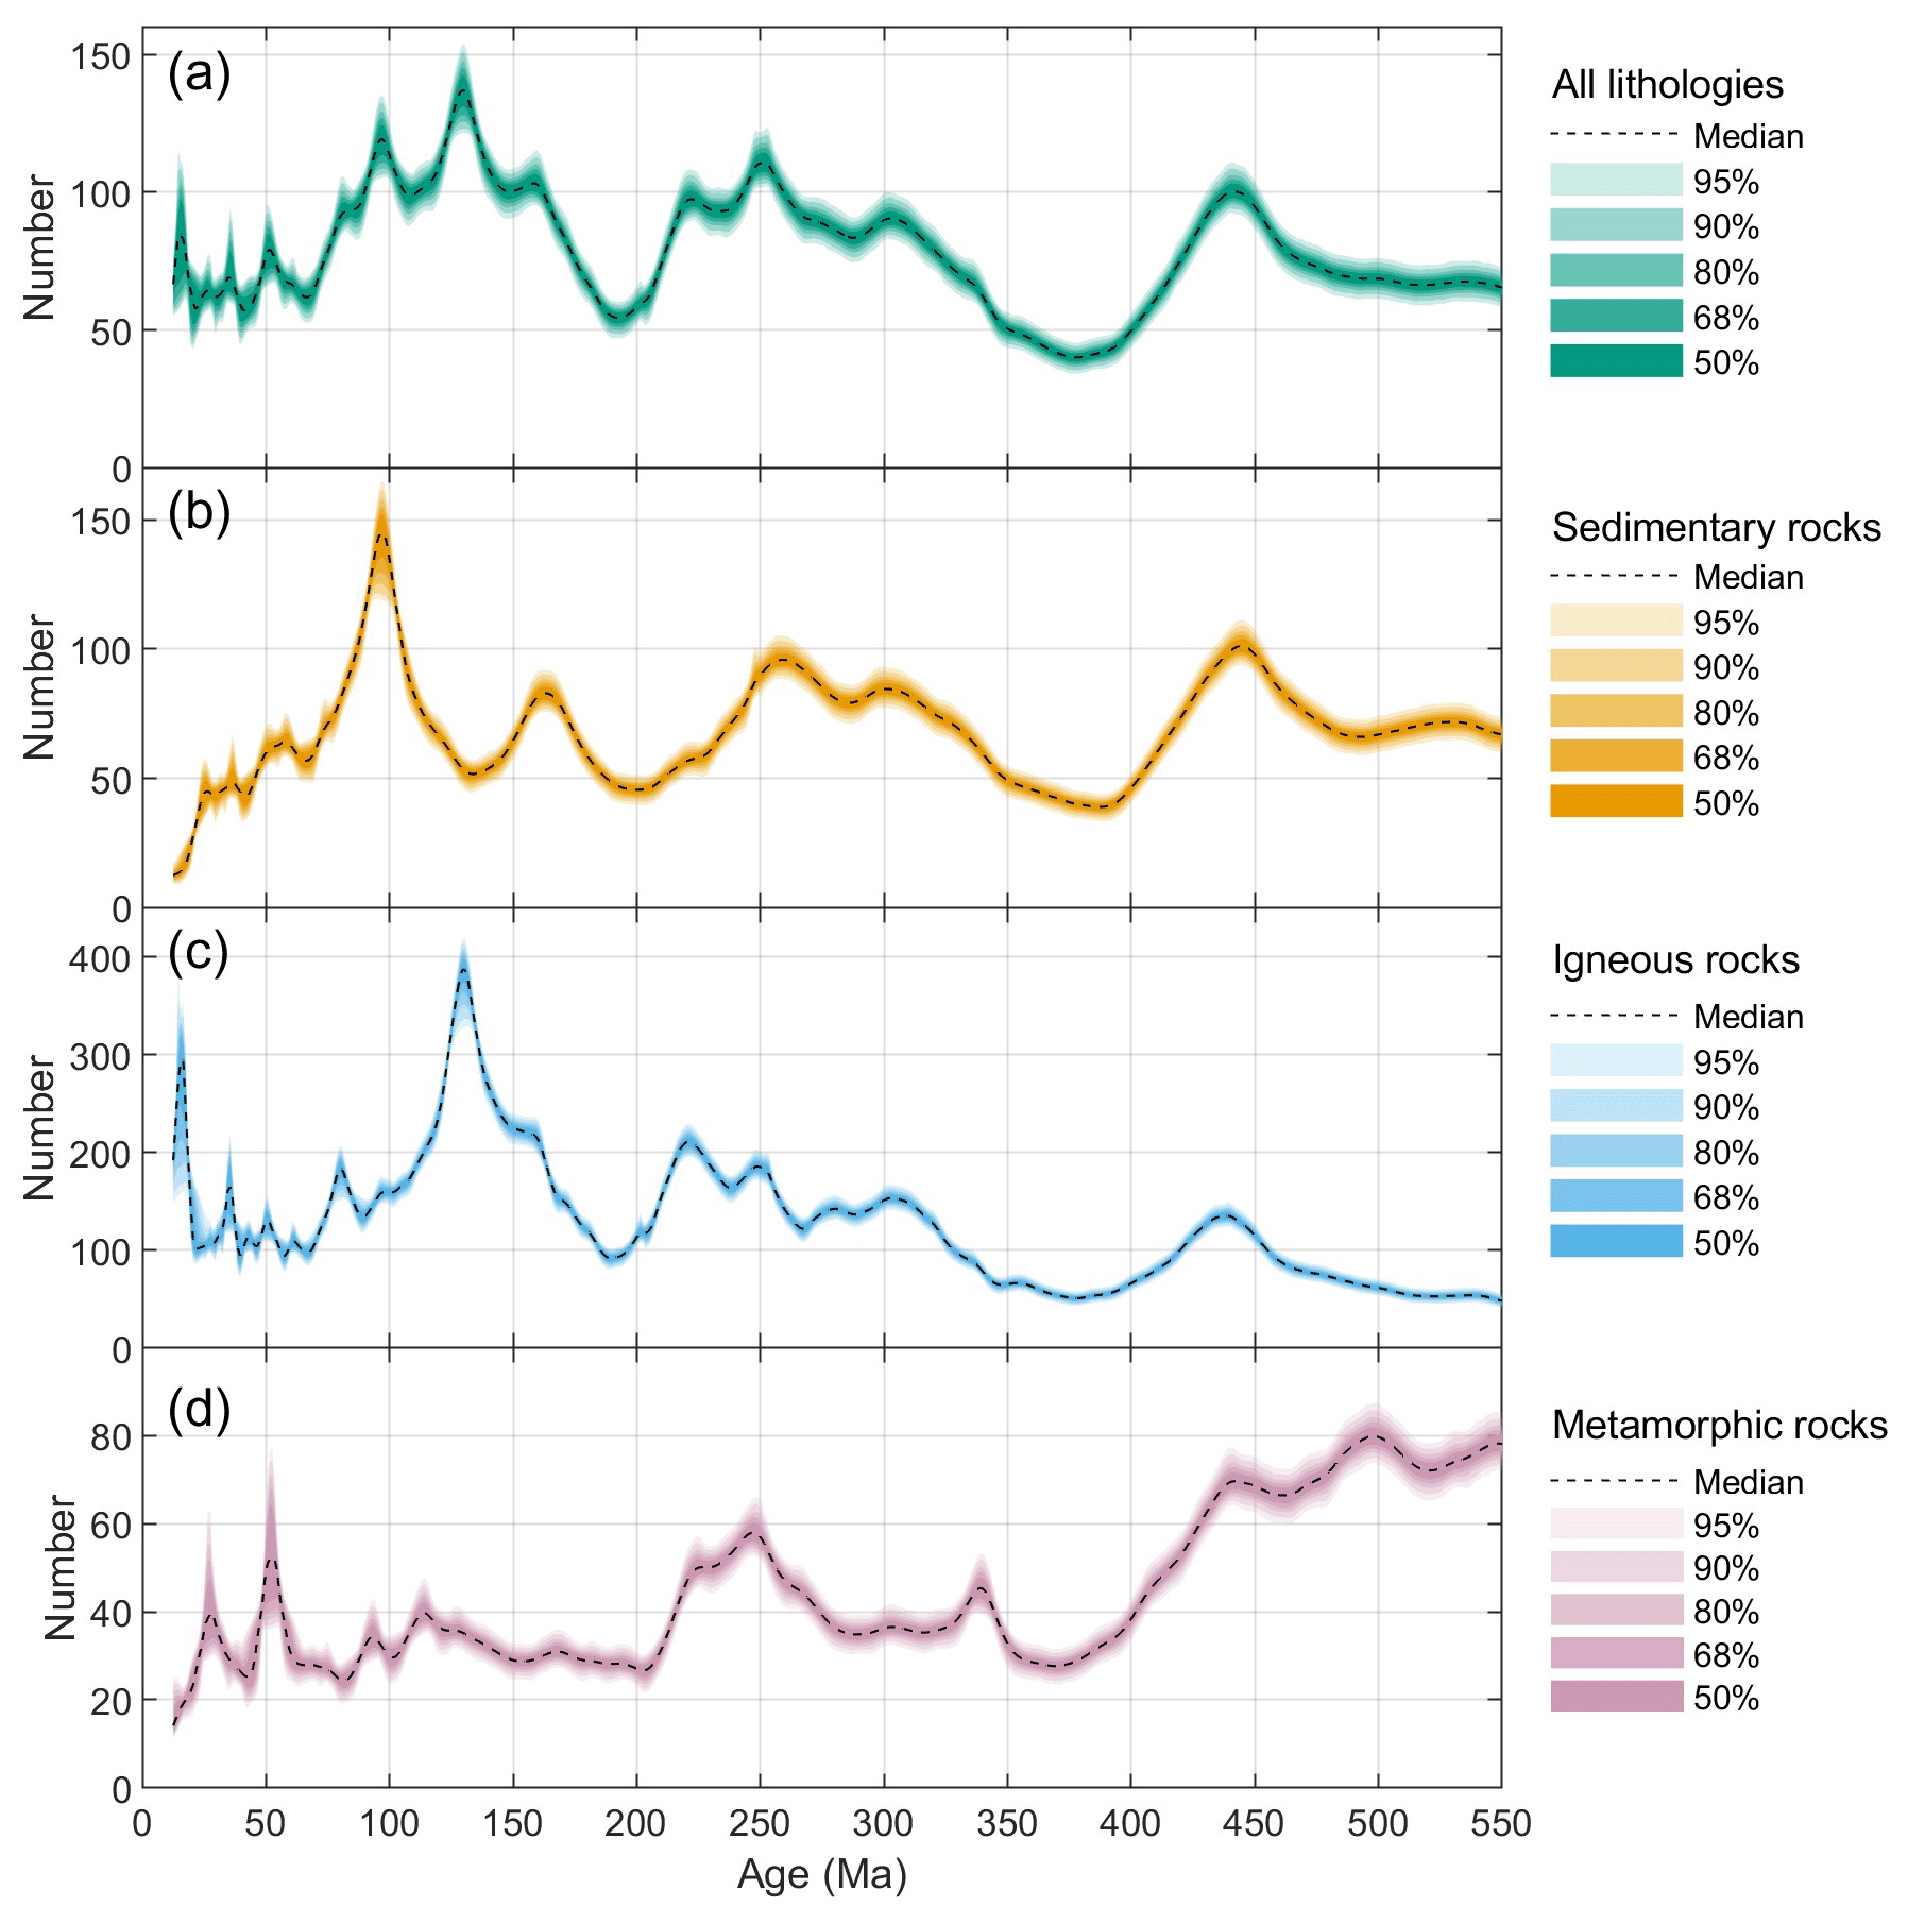
Figure 5Zircon production series in the Phanerozoic. The host rocks of each zircon series are (a) of all lithologies, (b) sedimentary rocks, (c) igneous rocks, and (d) metamorphic rocks. Inverse proximity weighting, bootstrap resampling, and Monte Carlo simulation were applied to solve the biased sampling issue. The filled zones represent 10 000 Monte Carlo simulations of the zircon series with different transparencies, indicating different distribution probabilities as shown in the legend. The dashed line indicates the median of the simulations. In each simulation, simulated zircon ages are selected based on a normal distribution. For more methodological details, see the Supplement.
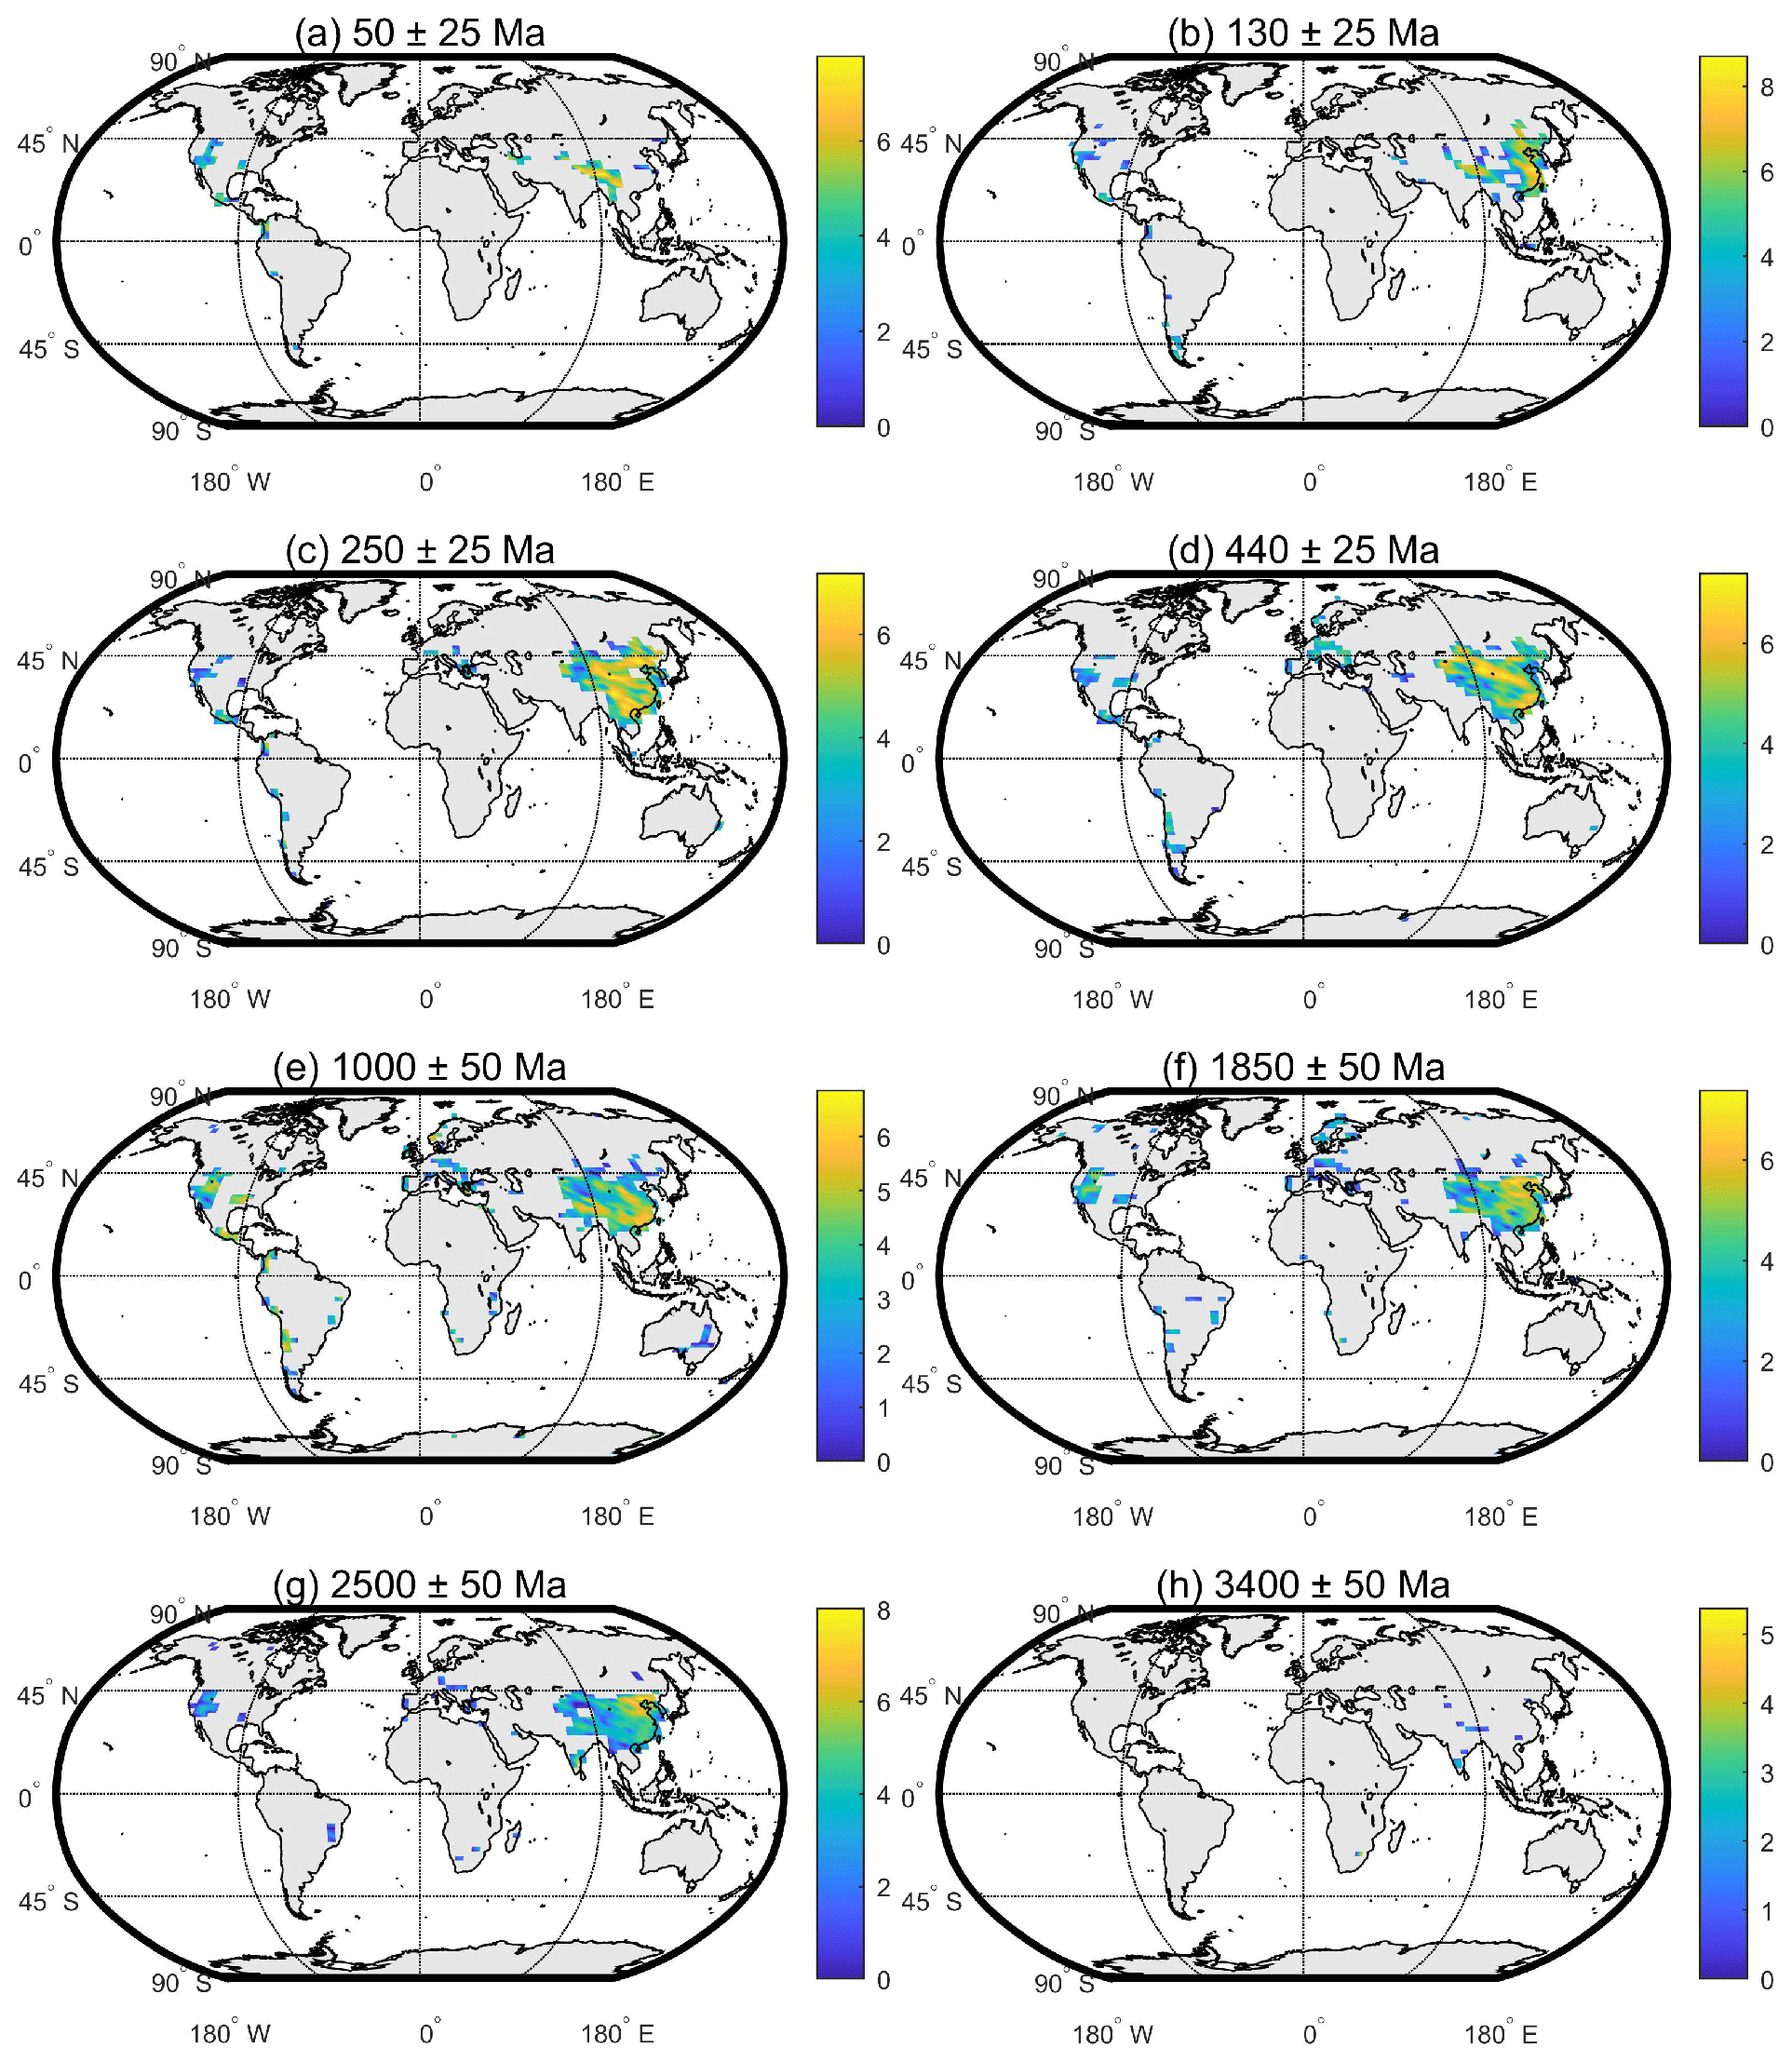
Figure 6Spatial distribution of zircon production peak periods of all the lithologies. Since some areas were oversampled and old ages are sparse, we should pay more attention to relative rather than absolute zircon densities when comparing regions. The “zircon density” here refers to age counts per a grid which is bounded by longitudes of 4∘ length and latitudes of 2∘ width during the peak periods (50 or 100 Myr). The color scale indicates the natural logarithm of age quantity.
5.1 Temporal and spatial evolution
The time series of zircon production indicates the evolution of not only the crust, but also of the Earth system. The amount of zircon production can indicate the intensity of geological activity (Hawkesworth et al., 2010). However, using zircon production as a proxy involves making certain assumptions, which can be minimized if the dataset used is large enough. Fang et al. (2018) and Wu et al. (2019) used independent zircon datasets from the publishers CNKI and Elsevier to study the Chinese continental crust. The conclusions they obtained are surprisingly similar, which not only supports the reliability of big-data statistics, but also confirms that these geological events (periods of intense geological activity) are related to amplified zircon production. Apart from internal dynamic events (such as orogeny and plate movement), zircon production time series can also indicate various associated surface processes, such as enhanced climate denudation during orogeny (Yu et al., 2011; Tu et al., 2015), the melting of ice sheets (Kim and Zhang, 2022; Mitrovica et al., 2001), and weathering processes and atmospheric composition (Kidder and Worsley, 2004; Campbell and Allen, 2008). Possible extraterrestrial drivers of geodynamics might also be explored by time series analysis of zircon production, providing information on plate tectonics, paleoclimate change, and biological extinctions (Wu et al., 2022; Isley and Abbott, 2002; Puetz and Condie, 2019; Prokoph et al., 2013).
The spatial distribution of zircon production peaks of all lithologies is presented in Fig. 6. Obviously, at different geological times, the regional intensity of geological activity varied as well as the amount of zircon production. For the spatial evolution of detrital, igneous, and metamorphic zircons, please see the Supplement (Figs. S8–S10). Fang et al. (2020) carried out a spatial classification of the Chinese continental crust by applying the grid-clustering algorithm to a zircon dataset. Intriguingly, these crustal units identified by zircons are basically consistent with those based on tectonics (Yang and Yu, 2015), verifying the scientific nature of zircon big-data research and providing a new means of studying the spatial evolution of the crust. In the future, this database can also be used to study the spatial distribution of zircons on a global scale or in various regions to obtain the spatial evolution of the continental crust. With the help of zircon spatial distribution, the spatial evolution of global tectonic zones can also be further studied to explore the formation and storage of oil, gas, and minerals, which will be of great help to commercial mining. Furthermore, the implications of zircon production for geodynamic processes may elucidate new energy sources.
5.2 Biased sampling
When using the number of zircon ages to indicate the intensity of geological activity, two conditions must be met: random exposure of the crust and random sampling of zircons. However, sampling bias, which occurs when zircons are oversampled or undersampled from a certain area or time interval, is inevitable (Wu et al., 2020; Puetz et al., 2017, 2018). In addition, considering the convenience and feasibility of fieldwork, sampling sites must be places that humans can reach. As shown in Fig. 1, the sampling sites are dense in Europe and China but sparse in the Sahara and Siberia. Specifically, for zircon records with GPS information (∼1.6 million records), data sampled from China, Europe, the Sahara, and Siberia account for ∼42 %, 8.9 %, 1.6 %, and 1.4 %, respectively. Since zircon production is inherently unevenly distributed in the crust in both the spatial and temporal domains, the identification of biased sampled data is more complicated. Nevertheless, it is difficult to determine whether a large amount of zircon data is caused by artificial oversampling or crustal conditions that are suitable for zircon growth.
Puetz et al. (2017) proposed the methods of grid-area and modern-sediment sampling using the surface area to weigh zircon data. Since the distributions of zircon ages were remarkably similar regardless of depth or height, this approach provides a simple and standard way of solving spatial sampling bias by weighing the records inversely proportional to sampling densities.
Alternatively, Wu et al. (2020) proposed the W and Y indices to measure the impact of biased sampling in the time domain. The W index should be used when artificial oversampling leads to a pseudo peak without geological meaning in the zircon production series. Conversely, a zircon peak that should be prominent might be smoothed out due to undersampling around peaks or oversampling around troughs. This “homogeneous” effect can be evaluated by the Y index. In addition, Wu et al. (2022) proposed eliminating the influence of biased sampled data from the result based on coherence. The frequency signals caused by the biased sampled data should exist only in the time series derived from the biased sampled region, suggesting little frequency similarity (low coherence) between the age series obtained from the normal sampled region and the biased sampled region. However, this method cannot quantitatively identify regions that tend to contain biased sampled data and needs to be improved further.
Keller and Schoene (2012) proposed an inverse spatiotemporal distance-weighting method and applied it in conjunction with bootstrap resampling and Monte Carlo simulation. This weighting approach calculated the spatiotemporal proximity for each sampling record, allowing us to balance the optimal sampling in space and through time at the same time (Mehra et al., 2021). Combined with bootstrap resampling and Monte Carlo simulation, the dating uncertainty could also be minimized. For comparison, we also obtained zircon production series data using only Monte Carlo simulation but without weighting, as in Wu et al. (2022) (see Figs. S6 and S7 in the Supplement). After weighting using spatiotemporal density (Figs. S5, S4, and S5), however, the trends of the zircon age series did not present much change, which affirmed the statistical reliability of big data to some degree. New approaches can be explored to address biased sampling issues, and this zircon database provides great experimental materials.
The database described in this paper can be accessed at the Zenodo repository at https://doi.org/10.5281/zenodo.7387566 (Wu et al., 2023).
Here, we introduce a zircon U–Th–Pb geochronological database of the global continental crust. This database provides comprehensive research materials for Earth system science due to its large amount of data (∼2 million records), wide sampling range (global continental crust), comprehensive samples (detrital, igneous, and metamorphic zircons), and various dating instruments (LA-ICP-MS, SHRIMP, SIMS, and TIMS).
Based on this database, we described the characteristics of zircon-dating errors, compared different dating instruments, and discussed biased sampling issues and possible solutions. Since the age errors vary over time and with dating instruments, the recommended ages should be selected with caution. Sampling bias would affect the objectivity of statistics to some degree. To solve this issue, we can weigh the data based on spatiotemporal sampling density in conjunction with bootstrapping resampling and Monte Carlo simulation. However, we can always seek better solutions. The rich spatiotemporal information of this database provides a good experimental platform for exploring more potential methods.
This zircon database provides excellent materials for multiple fields of research, including but not limited to crustal growth and evolution, plate tectonics, and paleoclimate changes. The amount of zircon production can indicate the intensity of geological activities and be used to study the evolution of the continental crust and Earth system, whether from the global or regional scale and whether for Earth's entire history or a specific period. In addition, this database has potential applications in the commercial mining of oil, gas, and minerals when associating structural geology with the temporal and spatial distribution of zircon production.
The supplement related to this article is available online at: https://doi.org/10.5194/essd-15-5171-2023-supplement.
YW, XF, and JJ compiled the data. YW and JJ merged the data, formatted the data, performed the analyses, standardized the reference materials, organized the database, managed the publication of the database in the Zenodo repository, and drafted and revised the manuscript. JJ initiated and supported the data compilation.
The contact author has declared that none of the authors has any competing interests.
Publisher’s note: Copernicus Publications remains neutral with regard to jurisdictional claims made in the text, published maps, institutional affiliations, or any other geographical representation in this paper. While Copernicus Publications makes every effort to include appropriate place names, the final responsibility lies with the authors.
We would like to thank the following people for their help in collecting the data: Muyuan Zhu, Sisi Liao, Lizhi Xue, Zhe Chen, Jiangnan Yang, Yamin Lu, Kun Ling, Shengyi Hu, Shuyuan Kong, Yiwei Xiong, Huacheng Li, Xiuqi Shang, Rui Ji, Xueyun Lu, Biao Song, and Lei Zhang.
This paper was edited by Kirsten Elger and reviewed by Marthe Klöcking and one anonymous referee.
Arndt, N. and Davaille, A.: Episodic Earth evolution, Tectonophysics, 609, 661–674, https://doi.org/10.1016/j.tecto.2013.07.002, 2013.
Becker, J. S.: Inorganic Mass Spectrometry: Principles and Applications, John Wiley & Sons Ltd, Chichester, West Sussex, England, ISBN 978-0-470-01200-0, 2007.
Campbell, I. H. and Allen, C. M.: Formation of supercontinents linked to increases in atmospheric oxygen, Nat. Geosci., 1, 554–558, https://doi.org/10.1038/ngeo259, 2008.
Carrapa, B.: Resolving tectonic problems by dating detrital minerals, Geology, 38, 191–192, https://doi.org/10.1130/focus022010.1, 2010.
Chong, R., Wang, M., Yang, L., and Qin, B.: Classification and namenclature schemes of metamorphic rocks: GB/T 17412.3-1998, in: Classification and namenclature schemes of the rocks, Standards Press of China, Beijing, 796–822, 1998.
Condie, K. C.: Preservation and recycling of crust during accretionary and collisional phases of proterozoic orogens: A bumpy road from nuna to rodinia, Geosciences, 3, 240–261, https://doi.org/10.3390/geosciences3020240, 2013.
Davis, D. W., Krogh, T. E., and Williams, I. S.: Historical development of zircon geochronology, Rev. Mineral. Geochem., 53, 145–181, https://doi.org/10.2113/0530145, 2003.
Fang, X., Wu, Y., Liao, S., Xue, L., Chen, Z., Song, B., Zhang, L., and Ji, J.: Preliminary analysis of the Chinese sub-database of the Chinese crust single-grain zircon U-Pb geochronology database, Acta Petrol. Sin., 34, 3253–3265, 2018.
Fang, X., Wu, Y., Liao, S., Xue, L., Chen, Z., Yang, J., Lu, Y., Ling, K., Hu, S., Kong, S., Xiong, Y., Li, H., Shang, X., Ji, R., Lu, X., Song, B., Zhang, L., and Ji, J.: Division of crustal units in China using grid-based clustering and a zircon U-Pb geochronology database, Comput. Ggeosci., 145, 104570, https://doi.org/10.1016/j.cageo.2020.104570, 2020.
Gehrels, G.: Detrital zircon U-Pb geochronology applied to tectonics, Annu. Rev. Earth Pl. Sc., 42, 127–149, https://doi.org/10.1146/annurev-earth-050212-124012, 2014.
Hanchar, J. M. and Hoskin, P. W. O.: Zircon, Mineralogical Society of America; Geochemical Society, Chantilly, VA, ISBN 0-93995060-X, 2018.
Hawkesworth, C. J., Dhuime, B., Pietranik, A. B., Cawood, P. A., Kemp, A. I. S., and Storey, C. D.: The generation and evolution of the continental crust, J. Geol. Soc. London, 167, 229–248, https://doi.org/10.1144/0016-76492009-072, 2010.
Hiess, J., Condon, D. J., McLean, N., and Noble, S. R.: 238U 235U Systematics in Terrestrial Uranium-Bearing Minerals, Science, 335, 1610–1614, https://doi.org/10.1126/science.1215507, 2012.
Isley, A. E. and Abbott, D. H.: Implications of the Temporal Distribution of High Mg Magmas for Mantle Plume Volcanism through Time, J. Geol., 110, 141–158, https://doi.org/10.1086/338553, 2002.
Jaffey, A., Flynn, K., Glendenin, L., Bentley, W. T., and Essling, A.: Precision measurement of half-lives and specific activities of 235U and 238U, Phys. Rev. C, 4, 1889, https://doi.org/10.1103/PhysRevC.4.1889, 1971.
Keller, C. B. and Schoene, B.: Statistical geochemistry reveals disruption in secular lithospheric evolution about 2.5 Gyr ago, Nature, 485, 490–493, https://doi.org/10.1038/nature11024, 2012.
Kidder, D. L. and Worsley, T. R.: Causes and consequences of extreme Permo-Triassic warming to globally equable climate and relation to the Permo-Triassic extinction and recovery, Palaeogeogr. Palaeocl., 203, 207–237, https://doi.org/10.1016/S0031-0182(03)00667-9, 2004.
Kim, B. and Zhang, Y. G.: Methane hydrate dissociation across the Oligocene-Miocene boundary, Nat. Geosci., 15, 203–209, https://doi.org/10.1038/s41561-022-00895-5, 2022.
Krogh, T. E.: A low-contamination method for hydrothermal decomposition of zircon and extraction of U and Pb for isotopic age determinations, Geochim. Cosmochim. Ac., 37, 485–494, https://doi.org/10.1016/0016-7037(73)90213-5, 1973.
Martin, E. L.: GEOSCRAPE zircon database (V1), GRO.data [data set], https://doi.org/10.25625/FWQ7DT, 2022.
Martin, E. L., Barrote, V. R., and Cawood, P. A.: A resource for automated search and collation of geochemical datasets from journal supplements, Sci. Data, 9, 724, https://doi.org/10.1038/s41597-022-01730-7, 2022.
McKenzie, N. R., Horton, B. K., Loomis, S. E., Stockli, D. F., Planavsky, N. J., and Lee, C.-T. A.: Continental arc volcanism as the principal driver of icehouse-greenhouse variability, Science, 352, 444–447, https://doi.org/10.1126/science.aad5787, 2016.
Mehra, A., Keller, C., Zhang, T., Tosca, N., Mclennan, S., Sperling, E., Farrell, U., Brocks, J., Canfield, D., and Cole, D.: Curation and analysis of global sedimentary geochemical data to inform earth history, GSA Today, https://doi.org/10.1130/GSATG484A.1, 2021.
Mitrovica, J. X., Tamisiea, M. E., Davis, J. L., and Milne, G. A.: Recent mass balance of polar ice sheets inferred from patterns of global sea-level change, Nature, 409, 1026–1029, https://doi.org/10.1038/35059054, 2001.
Prokoph, A., El Bilali, H., and Ernst, R.: Periodicities in the emplacement of large igneous provinces through the Phanerozoic Relations to ocean chemistry and marine biodiversity evolution, Dixue qian yuan, 4, 263–276, https://doi.org/10.1016/j.gsf.2012.08.001, 2013.
Puetz, S. J. and Condie, K. C.: Time series analysis of mantle cycles Part I: Periodicities and correlations among seven global isotopic databases, Geosci. Front., 10, 1305–1326, https://doi.org/10.1016/j.gsf.2019.04.002, 2019.
Puetz, S. J. and Spencer, C. J.: Evaluating U-Pb accuracy and precision by comparing zircon ages from 12 standards using TIMS and LA-ICP-MS methods, Geosyst. Geoenviron., 2, 100177, https://doi.org/10.1016/j.geogeo.2022.100177, 2023.
Puetz, S. J., Condie, K. C., Pisarevsky, S., Davaille, A., Schwarz, C. J., and Ganade, C. E.: Quantifying the evolution of the continental and oceanic crust, Earth-Sci. Rev., 164, 63–83, https://doi.org/10.1016/j.earscirev.2016.10.011, 2017.
Puetz, S. J., Ganade, C. E., Zimmermann, U., and Borchardt, G.: Statistical analyses of global U-Pb database 2017, Geosci. Front., 9, 121–145, https://doi.org/10.1016/j.gsf.2017.06.001, 2018.
Puetz, S. J., Spencer, C. J., and Ganade, C. E.: Analyses from a validated global U-Pb detrital zircon database: Enhanced methods for filtering discordant U-Pb zircon analyses and optimizing crystallization age estimates, Earth-Sci. Rev., 220, 103745, https://doi.org/10.1016/j.earscirev.2021.103745, 2021.
Qin, B., Wang, M., Chong, R., and Yang, L.: Classification and namenclature schemes of igneous rocks: GB/T 17412.1-1998, in: Classification and namenclature schemes of the rocks, Standards Press of China, Beijing, 741–775, 1998.
Song, B.: SHRIMP zircon U-Pb age measurement: Sample preparation, measurement, data processing and explanation, Geol. Bull. China, 34, 1777–1788, 2015.
Spencer, C. J., Kirkland, C. L., and Taylor, R. J. M.: Strategies towards statistically robust interpretations of in situ U-Pb zircon geochronology, Geosci. Front., 7, 581–589, https://doi.org/10.1016/j.gsf.2015.11.006, 2016.
Tu, J.-Y., Ji, J.-Q., Sun, D.-X., Gong, J.-F., Zhong, D.-L., and Han, B.-F.: Thermal structure, rock exhumation, and glacial erosion of the Namche Barwa Peak, constraints from thermochronological data, J. Asian Earth Sci., 105, 223–233, https://doi.org/10.1016/j.jseaes.2015.03.035, 2015.
Voice, P. J., Kowalewski, M., and Eriksson, K. A.: Quantifying the Timing and Rate of Crustal Evolution: Global Compilation of Radiometrically Dated Detrital Zircon Grains, J. Geol., 119, 109–126, https://doi.org/10.1086/658295, 2011.
Wilde, S. A., Valley, J. W., Peck, W. H., and Graham, C. M.: Evidence from detrital zircons for the existence of continental crust and oceans on the Earth 4.4 Gyr ago, Nature, 409, 175–178, https://doi.org/10.1038/35051550, 2001.
Williams, I. S.: Zircon, in: Encyclopedia of Astrobiology, edited by: Gargaud, M., Springer, 1790–1791, 2015.
Wu, Y., Fang, X., Liao, S., Xue, L., Chen, Z., Yang, J., Lu, Y., Ling, K., Hu, S., Kong, S., Xiong, Y., Li, H., Shang, X., Ji, R., Lu, X., Song, B., Zhang, L., and Ji, J.: Zircon U-Pb geochronology of the Chinese continental crust: a preliminary analysis of the Elsevier science database, Big Earth Data, 3, 26–44, https://doi.org/10.1080/20964471.2019.1576261, 2019.
Wu, Y., Fang, X., Liao, S., Xue, L., Chen, Z., Yang, J., Lu, Y., Ling, K., Hu, S., Kong, S., Xiong, Y., Li, H., Shang, X., Ji, R., Lu, X., Song, B., Zhang, L., and Ji, J.: Crustal evolution events in the Chinese continent: evidence from a zircon U-Pb database, Int. J. Dig. Earth, 13, 1532–1552, https://doi.org/10.1080/17538947.2020.1739152, 2020.
Wu, Y., Fang, X., Jiang, L., Song, B., Han, B., Li, M., and Ji, J.: Very long-term periodicity of episodic zircon production and Earth system evolution, Earth-Sci. Rev., 104164, https://doi.org/10.1016/j.earscirev.2022.104164, 2022.
Wu, Y., Fang, X., and Ji, J.: Global zircon U-Th-Pb geochronology database (2.1), Zenodo [data set], https://doi.org/10.5281/zenodo.7387566, 2023.
Yang, L., Han, G., Wang, M., Qin, B., and Chong, R.: Classification and namenclature schemes of sedimentary rocks: GB/T 17412.2-1998, in: Classification and namenclature schemes of the rocks, Standards Press of China, Beijing, 776–795, 1998.
Yang, W. C. and Yu, C. Q.: Tectonic divisions of the Chinese continental lithosphere based on forming tectonic processes, Geol. Rev., 61, 709–716, 2015.
Yu, X., Ji, J., Gong, J., Sun, D., Qing, J., Wang, L., Zhong, D., and Zhang, Z.: Evidences of rapid erosion driven by climate in the Yarlung Zangbo (Tsangpo) Great Canyon, the eastern Himalayan syntaxis, Chinese Sci. Bull., 56, 1123–1130, https://doi.org/10.1007/s11434-011-4419-x, 2011.