the Creative Commons Attribution 4.0 License.
the Creative Commons Attribution 4.0 License.
 | 24 Nov 2023
Snow accumulation and ablation measurements in a midlatitude mountain coniferous forest (Col de Porte, France, 1325 m altitude): the Snow Under Forest (SnoUF) field campaign data set
Jean Emmanuel Sicart
Victor Ramseyer
Ghislain Picard
Laurent Arnaud
Catherine Coulaud
Guilhem Freche
Damien Soubeyrand
Yves Lejeune
Marie Dumont
Isabelle Gouttevin
Erwan Le Gac
Frédéric Berger
Jean-Matthieu Monnet
Laurent Borgniet
Éric Mermin
Nick Rutter
Clare Webster
Richard Essery
Forests strongly modify the accumulation, metamorphism and melting of snow in midlatitude and high-latitude regions. Recently, snow routines in hydrological and land surface models were improved to incorporate more accurate representations of forest snow processes, but model intercomparison projects have identified deficiencies, partly due to incomplete knowledge of the processes controlling snow cover in forests. The Snow Under Forest (SnoUF) project was initiated to enhance knowledge of the complex interactions between snow and vegetation. Two field campaigns, during the winters 2016–2017 and 2017–2018, were conducted in a coniferous forest bordering the snow study at Col de Porte (1325 m a.s.l., French Alps) to document the snow accumulation and ablation processes. This paper presents the field site, the instrumentation and the collection and postprocessing methods. The observations include distributed forest characteristics (tree inventory, lidar measurements of forest structure, subcanopy hemispherical photographs), meteorology (automatic weather station and an array of radiometers), snow cover and depth (snow pole transect and laser scan) and snow interception by the canopy during precipitation events. The weather station installed under dense canopy during the first campaign has been maintained since then and has provided continuous measurements throughout the year since 2018. Data are publicly available from the repository of the Observatoire des Sciences de l'Univers de Grenoble (OSUG) data center at https://doi.org/10.17178/SNOUF.2022 (Sicart et al., 2022).
- Article
(5633 KB) - Full-text XML
- BibTeX
- EndNote


Around 20 % of Northern Hemisphere snow overlaps with forest (e.g., Rutter et al., 2009), and subcanopy snow cover is closely related to ecohydrological processes. Forests strongly modify the accumulation, metamorphism and melting of snow; they intercept part of the precipitation, modify radiation fluxes and surface roughness; and they reduce albedo and wind speed (e.g., Otterman et al., 1988; Pomeroy et al., 2008; Musselman et al., 2012; Essery, 2013). For example, Phase 2 of the Snow Model Intercomparison Project (SnowMIP2) (Essery et al., 2009; Rutter et al., 2009) evaluated 33 forest snow models differing in both process complexity and canopy implementation approaches. Major deficiencies of modeling snow in forests were identified, and the project concluded that model performance was limited by incomplete knowledge of the processes controlling snow cover in forests. Since then, numerous measurement campaigns have been conducted (e.g., Webster et al., 2016; Webster and Jonas, 2018; Malle et al., 2019; Mazzotti et al., 2019; Hojatimalekshah et al., 2021), and snow routines in hydrological and land surface models have been enhanced to incorporate more accurate representations of forest snow processes (e.g., Ellis et al., 2013; Gouttevin et al., 2015; Boone et al., 2017; Mazzotti et al., 2020). However, these improved routines still represent canopy as one homogeneous layer without accounting for the effects of vertical canopy heterogeneity on snow accumulation and ablation processes. Detailed snow and meteorological measurements are therefore still required and remain an important step to better understand the complex interactions between snow and vegetation. Col de Porte (CDP) is a mid-elevation site located at 1325 m altitude (45.295∘ N, 5.766∘ E) in the Chartreuse mountain range in France, with a meadow bordered by a coniferous forest. The CDP meadow site has been operated by CEN-Météo-France with daily measurements of snow depth, air temperature and precipitation recorded since 1960 (Lejeune et al., 2019; Morin et al., 2012). Hourly measurements of meteorological and snow variables required to run and evaluate detailed snowpack models such as Crocus (Vionnet et al., 2012) started in 1987 and have been almost continuous during the snow seasons since 1993. CDP is part of several observation networks at the national scale (e.g., Observation pour l'Experimentation et la Recherche en Environnement, CryObsClim, and Systèmes d'Observation et d'Expérimentation au long terme pour la Recherche en Environnement des glaciers, GlacioClim) and at the international scale (e.g., ILTER European Research Infrastructure, WMO Global Cryosphere Watch CryoNet network, GEWEX INARCH). For more details, the reader is referred to Lejeune et al. (2019). Only a few studies have investigated the snow cover distribution in the forest of CDP (e.g., Durot, 1999); however, the immediate proximity of the forest parcel to the historical, long-term open-area snow observatory of CDP offers a good opportunity to understand and relate the subcanopy meteorological and snow processes to their open-area counterparts.
Two field campaigns were conducted in the conifer forest bordering the reference meadow site to document the snow accumulation and ablation processes: from 16 January 2016 to 21 March 2017 and from 1 December 2017 to 15 March 2018. This paper presents the measurement methods that were applied in the forest plot during these two field campaigns. The observations include distributed forest characteristics (tree inventory, lidar measurements of forest structure, subcanopy hemispherical photographs), meteorological variables (automatic weather station and an array of radiometers), snow height and water equivalent (snow pole transect and laser scan) and transects of snow interception by the canopy during precipitation events. The data set also includes continuous measurements from the weather station in the forest from March 2018 to June 2022. Complementing the data sets, the repository of the Observatoire des Sciences de l'Univers de Grenoble data center also includes technical information, photographs and a detailed plan of the instrumentation.
2.1 Site
The study site is a triangular forest parcel of 2000 m2 (Fig. 1) next to the meadow where the historical open-area snow measurements are conducted. It is delimited by a fence along its southern and northeastern sides. Its western side corresponds to the edge between the forest and the open meadow area. The terrain slope is around 10∘ oriented toward east–northeast. The stand is dominated by Norway spruce (Picea abies) with young silver firs (Abies alba). Some broadleaved trees are located along the western edge. The parcel exhibits two gaps in the canopy. The smaller one is in the southwest, while the larger one is at the center and extends toward the southern fence (Fig. 2). During the first campaign, the annual maximum snow depth was around 100 cm at the open site (meadow reference site) and only around 50 cm under the canopy. During the second campaign, the annual maximum snow depth was around 160 cm at the open site and 130 cm under the canopy.
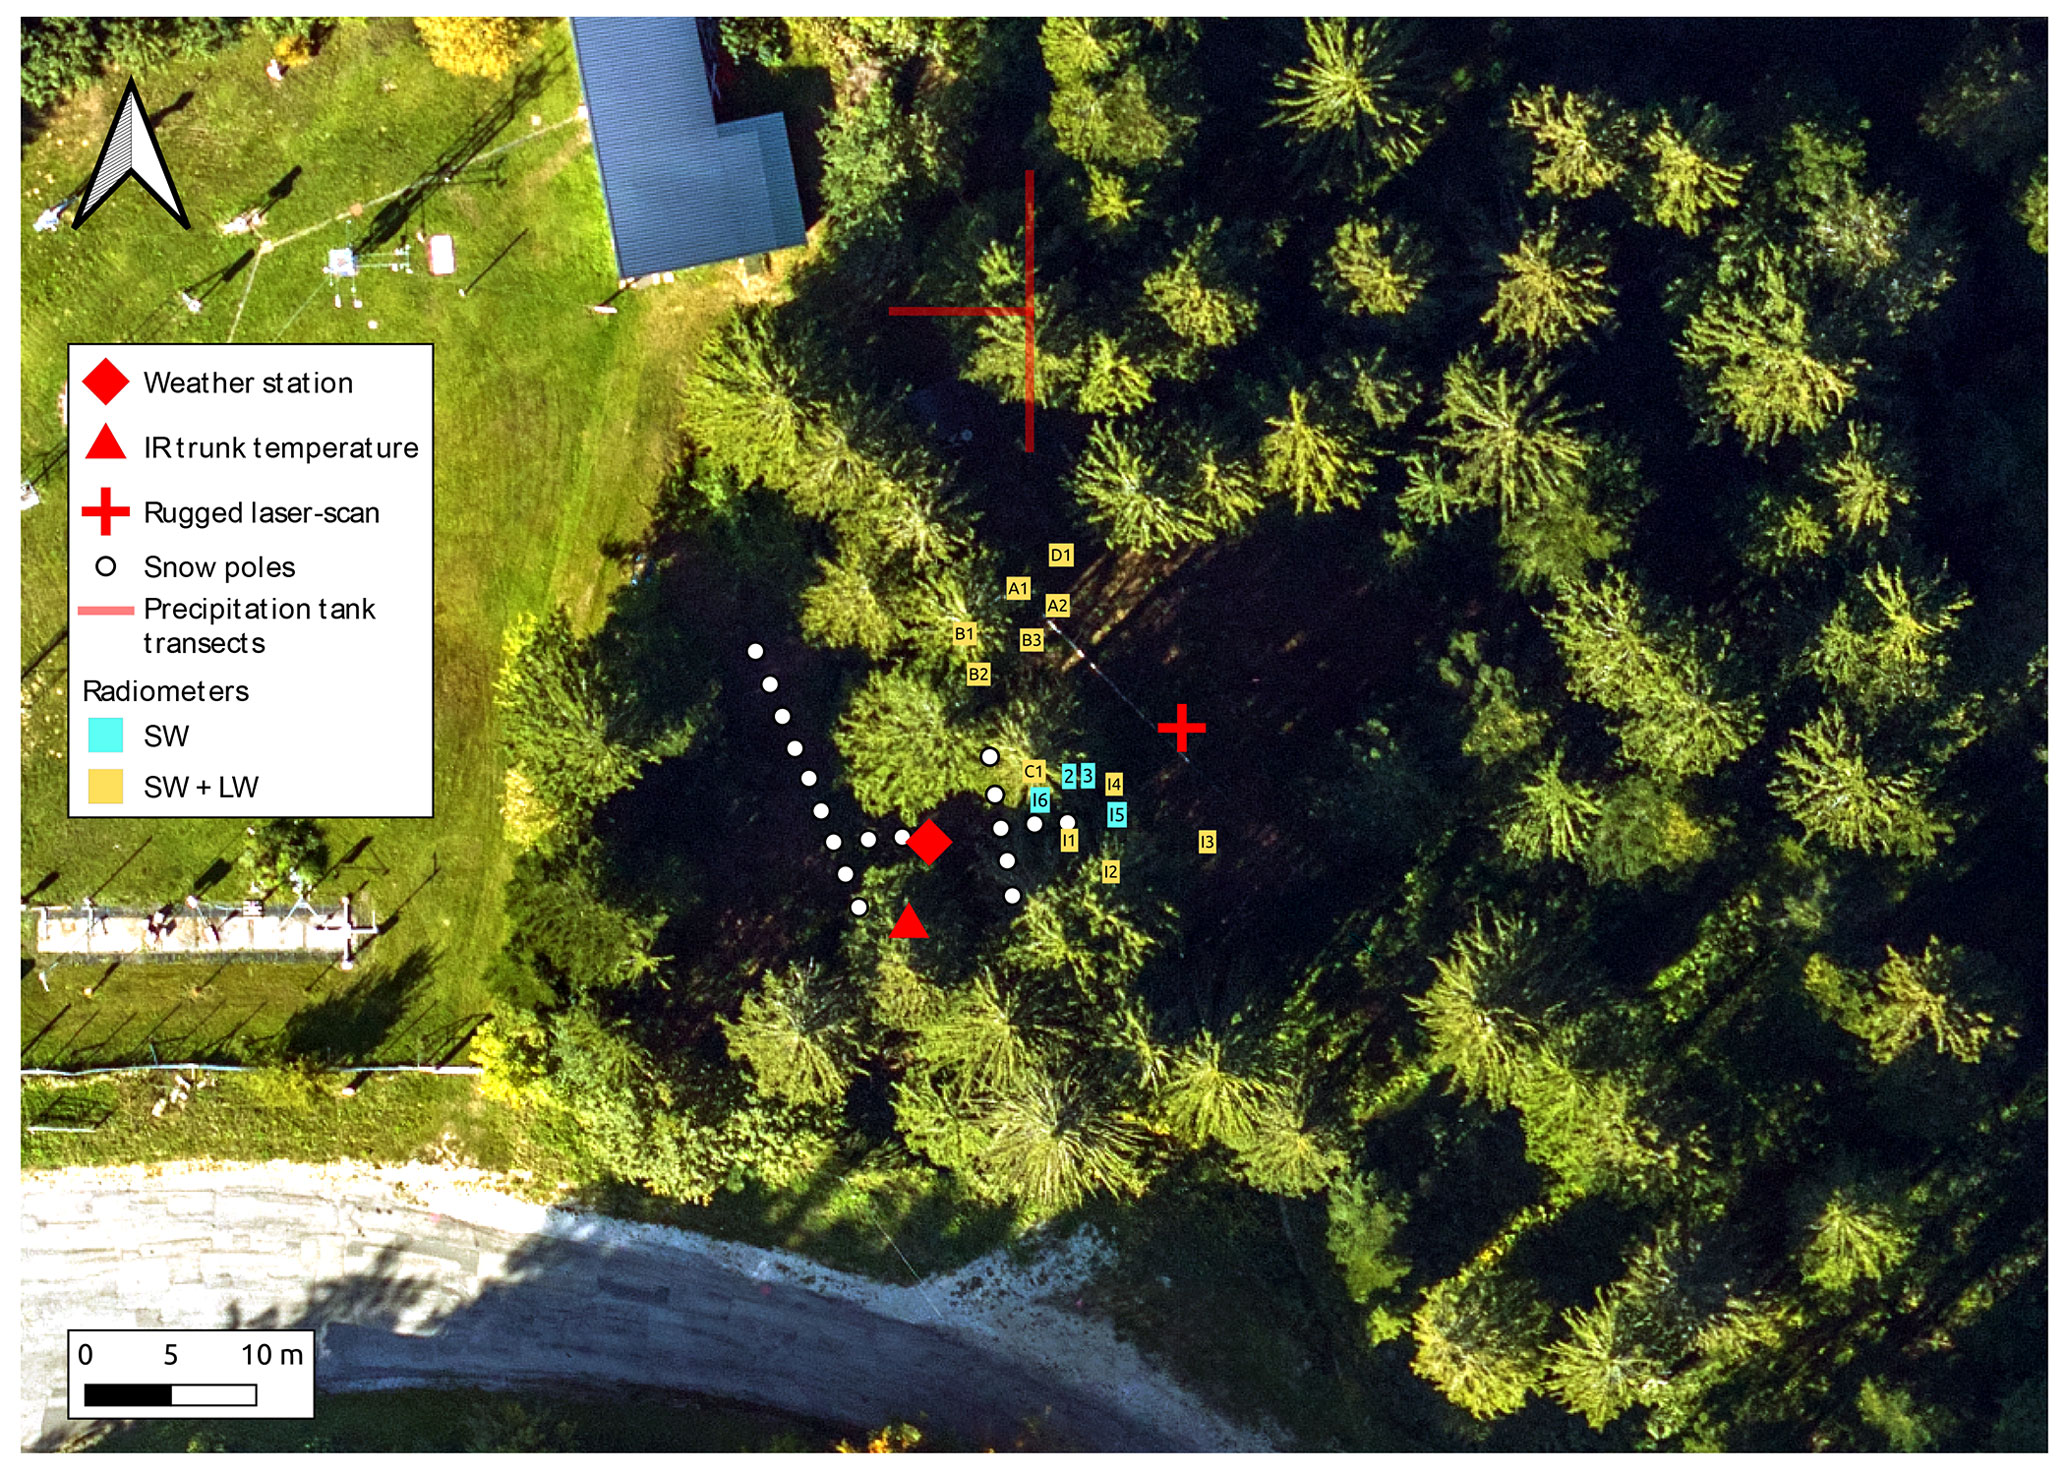
Figure 1Aerial photographs of the site taken on 30 August 2016, with the locations of the sensors during the 2017–2018 field campaign. On the left is the meadow with part of the long-term instrumentation for the Col de Porte site. Labels “2” and “3” refer to sensors SW2 and SW3.
2.2 Forest measurements
2.2.1 Manual forest inventory
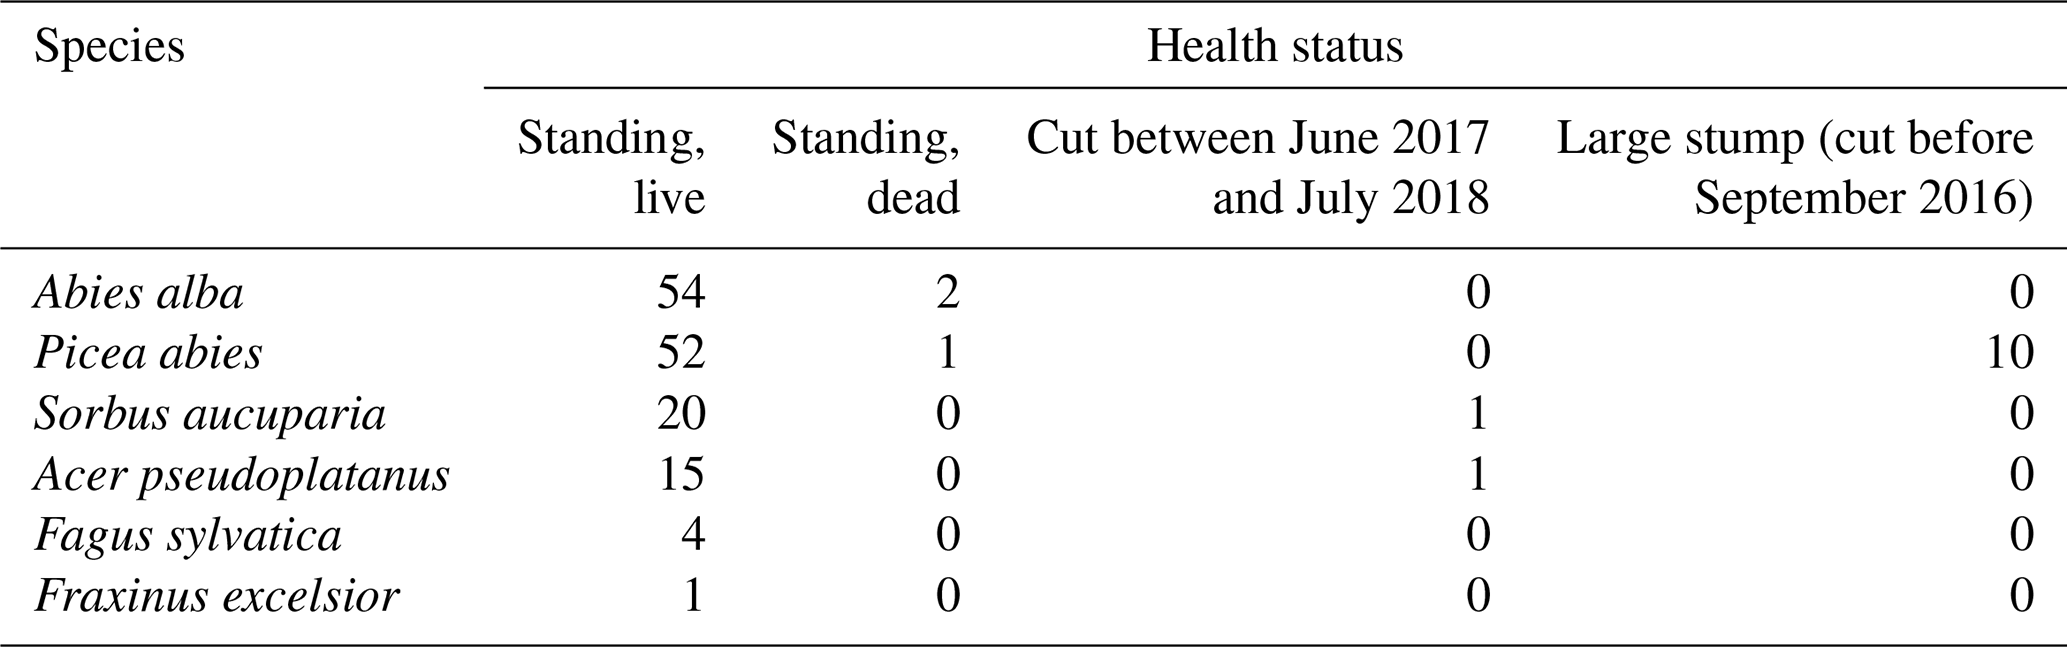
An inventory of trees higher than 1.3 m took place during field campaigns between September 2016 and July 2018. On 13–14 September 2016, live and dead trees were inventoried, and the following observations and measurements were performed:
-
diameter at breast height (DBH, measured with a tape measure at 1.3 m height above the ground, upslope of the tree);
-
species; and
-
tree height measured with a Haglöf Vertex 4 hypsometer, only for trees with a DBH larger than 7.5 cm.
Tree identification numbers were painted on the trunk at a height around 1.3 m above the ground. Three reference poles were positioned at the site and geolocated using a Trimble GeoExplorer 6000 XH Global Navigation Satellite System (GNSS) receiver. Trees were mapped relative to a nearby pole by measuring the ground distance (Vertex 4 hypsometer), slope (clinometer) and azimuth (compass). Tree position precision relative to the reference pole is expected to be better than 50 cm, whereas GNSS precision under the forest canopy is on the order of a few meters. In total, 141 trees were inventoried, including 128 live trees, 3 dead trees and 10 stumps.
On 5 May 2017, vertical crown projections of live trees with a DBH larger than 7.5 cm were measured following the method specified by Röhle (1986) but using a clinometer instead of a plummet to locate the crown extension. The horizontal distances between the trunk center and the vertical projection of the furthest live branch along the northern, southern, eastern and western directions were measured with a tape. If several tree stems were sprouting from a common base, the whole clump was considered to have one single crown, and its extension was measured from the stem with the largest diameter in the clump. On 20 June 2017, tree positions were measured with a Leica TS02 total station located in the open area in the west of the forest. The total station position was recorded with a Trimble R2 differential GNSS receiver, ensuring centimetric accuracy. On 25 July 2018, heights and crown extensions were measured on trees with a DBH smaller than 7.5 cm (Table 1). The tree inventory was extended outside the southern fence to include trees which might cast shadows inside the forest parcel (DBH, height, crown extension, species). Their positions were measured with slope (clinometer), azimuth (compass) and ground distance (Vertex 4 hypsometer) relative to a reference pole located with a GNSS receiver.
Tree easting and northing values in the RGF 93–Lambert 93 projected coordinate system were then derived from the total station coordinates if available or from their polar coordinates relative to a reference pole. Tree altitude values were computed from the airborne laser scanning data (see Sect. 2.2.2) by bilinear interpolation of the ground-classified points at the locations of trees. Figure 2 shows a map of inventoried live trees and canopy heights. In the forest stand inside the fence, most of the trees are between 30 and 40 m high (Fig. 3) and the total basal area is about 66.3 m2 ha−1. It includes 52 fir, 43 spruce and 33 broadleaved trees. Trees measured outside the southern fence included nine spruces, two firs and seven broadleaves. Tree position accuracy is estimated to be better than 10 cm for the trees measured with the total station inside the fenced area and around 50 cm for additional trees outside the fence. Luoma et al. (2017) reported a precision of 0.5 m (standard deviation) for height measurements with a Vertex 4 clinometer. Elzinga et al. (2005) reported a standard deviation of 0.5 cm for diameters measured with a tape measure. Measurement errors on crown extension are mostly due to the difficulty in assessing the vertical projection of the branches' extent on the ground. Accuracy is expected to be from 10 cm for small trees (height smaller than 4 m) to 50 cm for the tallest ones (around 30 m).
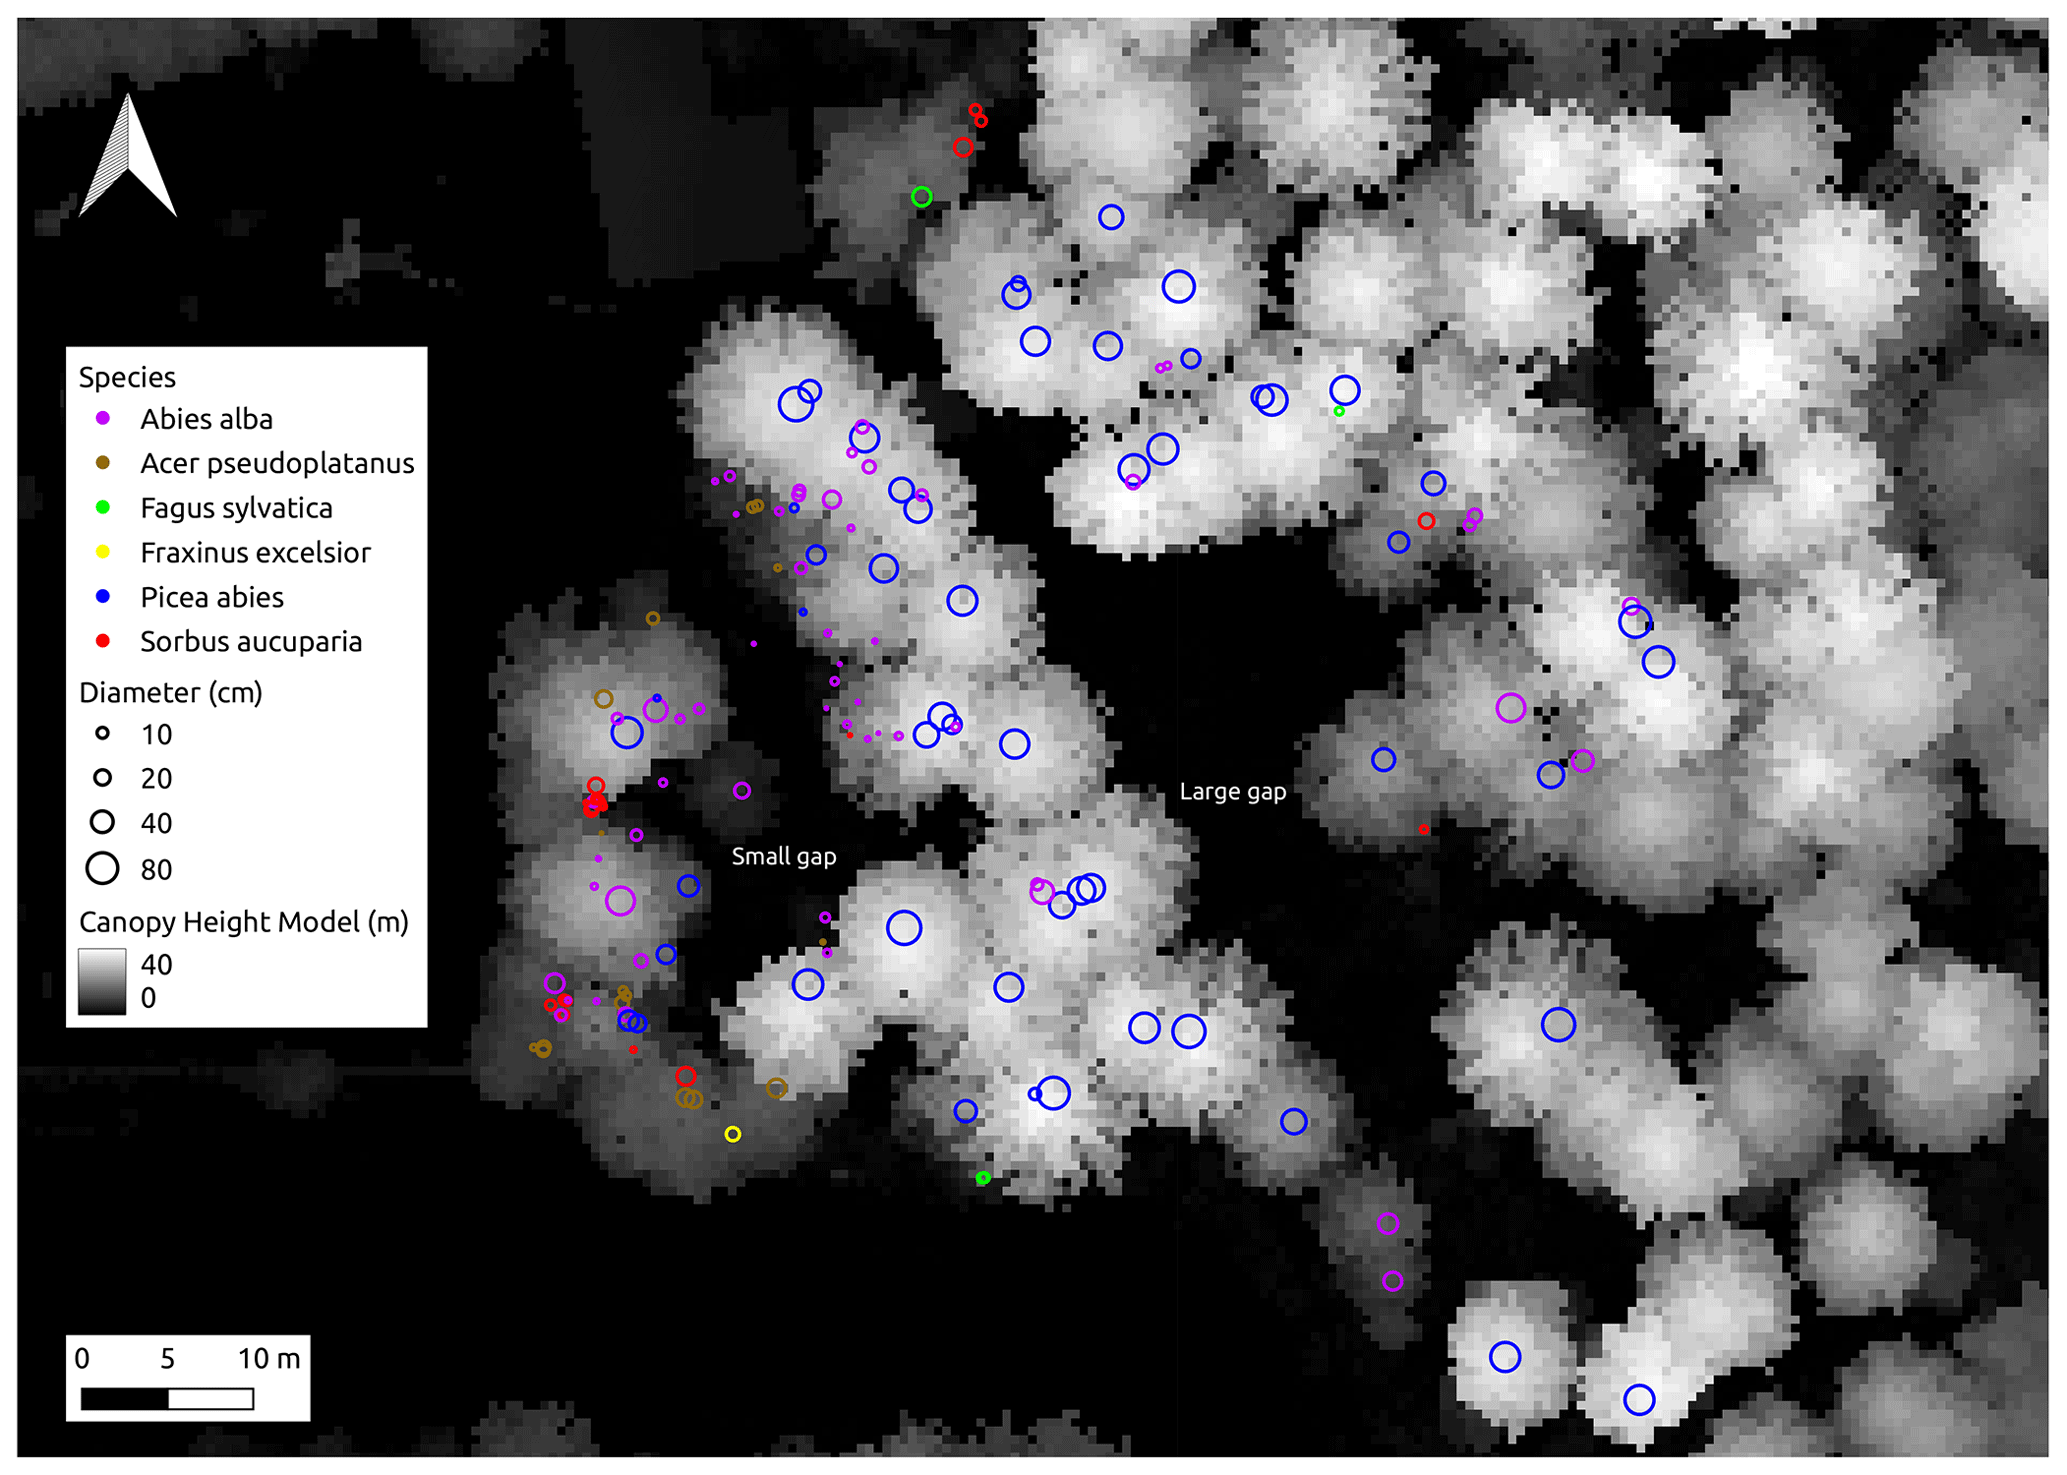
Figure 2Map of inventoried live trees (2016–2018 campaigns) and the canopy height model derived from airborne laser scanning acquired between 30 August and 2 September 2016.
2.2.2 Airborne remote-sensing measurements
Airborne laser scanning (ALS) is a remote-sensing technique based on lidar that can provide a 3D point cloud of forest structure. The point cloud can be processed to derive forest metrics used to parametrize snow interception, such as leaf area index or canopy closure (e.g., Helbig et al., 2020). ALS was acquired during a campaign covering 123.5 km2 (which integrates the Col de Porte site) between 30 August and 2 September 2016 using a Riegl LMS Q680i sensor mounted on a helicopter. The scheduled flight height and speed were 750 m above ground and 70 knots (36 m s−1), respectively. The scan frequency was 300 kHz with a scan angle of ±30∘. The aircraft trajectory was computed from the Inertial Measurement Unit and GNSS data. Point coordinates were extracted and computed using the RiAnalyse and RiWorld software (http://www.riegl.com/products/ software-packages/, last access: 22 August 2023). The point cloud was then classified as ground or non-ground using Terrasolid (https://terrasolid.com/, last access: 22 August 2023). To assess the accuracy of elevation measurements, 318 ground control points were measured with differential GNSS in 11 flat, vegetation-less plots. Differential GNSS horizontal accuracy is around 2–3 cm in such areas. Comparison of the control points with the point cloud yielded an altitudinal accuracy of 4.7 cm (root mean square error of differences), with a bias of −0.3 cm.
The point cloud was delivered as tiled files in LAS format, which is the most common format for lidar point cloud exchange and which is maintained by the ASPRS (https://www.asprs.org/divisions-committees/lidar-division/laser-las-file-format-exchange-activities, last access: 22 August 2023). The coordinate system was RGF 93–Lambert 93, with altitude in the system NGF-IGN69. The point cloud extracted on a 200 m radius disk centered on the study site was exported in a single compressed LAS file (v1.1 format 1). The pulse density in the study site is 17 points per square meter, resulting in densities of 3.3 points per square meter for ground points and 28 points per square meter with multiple returns for canopy points.
For the extent of the inventoried trees plus a 30 m buffer, digital surface models were computed at 0.5 m resolution from the ALS point cloud. The digital terrain model (DTM) was computed by estimating the altitude of each cell center by bilinear interpolation of ALS points classified as ground. The point cloud was normalized by subtracting the ground altitude at the position of each point estimated by bilinear interpolation of ground points. A canopy height model (CHM) was computed by retaining the highest value of normalized heights in each cell. Cells without values were filled by the median of their 3 × 3 neighborhood. The DTM and CHM were delivered as raster files in tif format. Aerial photographs were also taken during the ALS acquisition. Pictures were used to produce a 10 cm resolution RGB orthophoto provided as a tif file for the extent of the DTM. Figure 4 shows a perspective view of the 3D point cloud acquired by the airborne laser scanning.
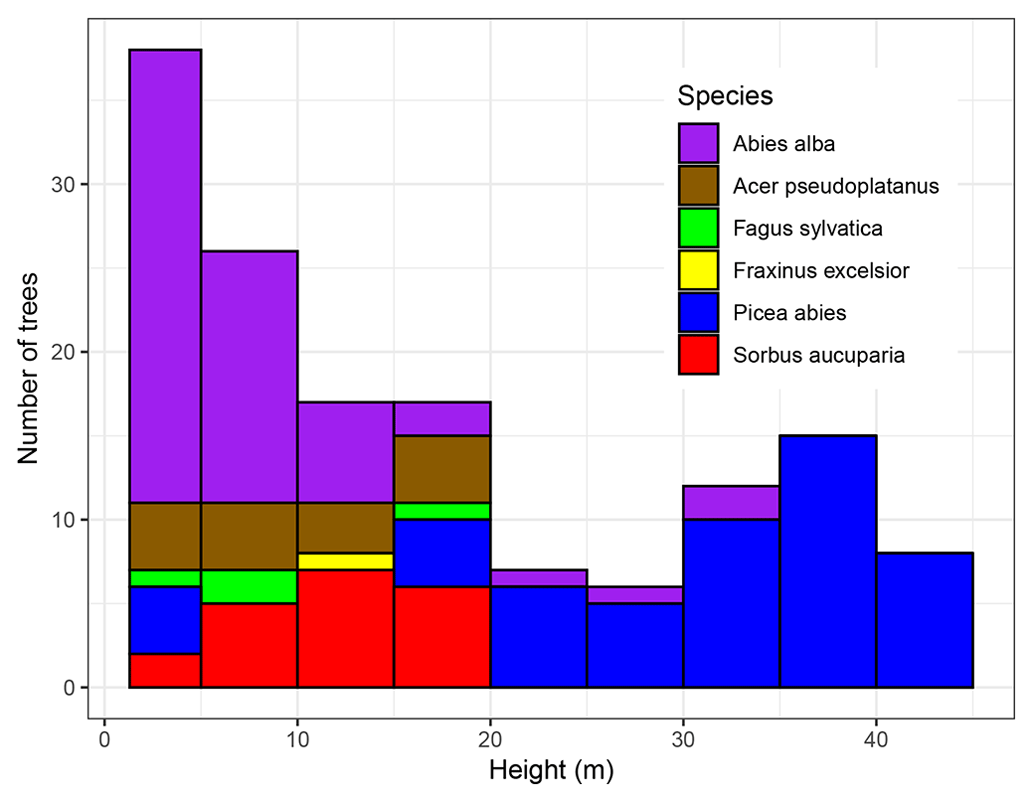
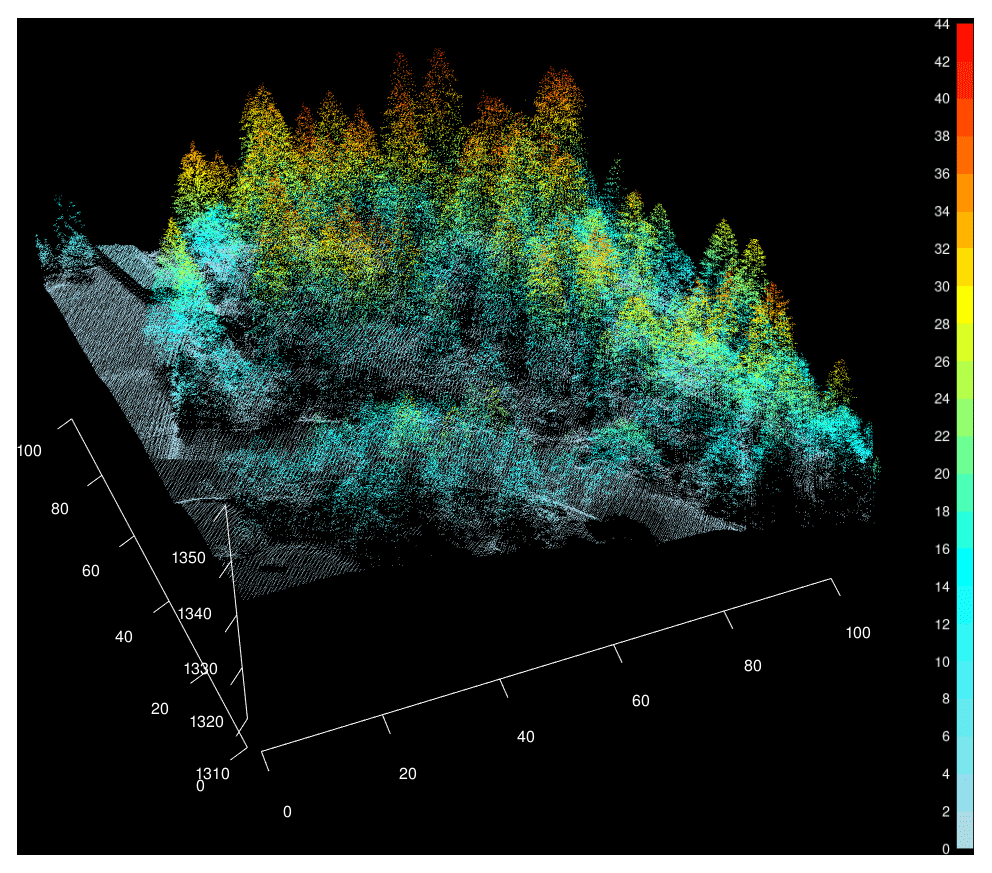
Figure 4Perspective view of the 3D point cloud of the area of interest acquired by airborne laser scanning between 30 August and 2 September 2016. Points are colored according to their height above the ground.
2.2.3 Hemispherical photographs
Hemispherical photographs were taken on 4 September 2017 at each radiometer location. Although the sky was not completely overcast, there was no direct sunlight. A Nikon Coolpix 4300 digital camera was used with a Nikon FC-E8 fisheye lens, mounted 60 cm above the ground surface on a tripod. The camera was aligned to north with a compass and carefully leveled using a bubble level. All sites were snow-free when the hemispherical photographs were taken. Sky view factors were then calculated following Essery et al. (2008) assuming an equiangular lens projection. To distinguish vegetation from sky pixels and to calculate the sky view factor at each location, a brightness threshold was selected manually for each hemispherical photograph (Fig. 5). This allows us to account for variations in illumination conditions during changes in cloud cover or thickness. Brightness thresholds can be selected automatically (Nobis and Hunziker, 2005), but the manual process gave a clear distinction between canopy and sky pixels in every case here. Calculated sky view factors ranged from 0.15 to 0.35 at the radiometer sites, which were mostly situated under a rather dense canopy. Reid et al. (2014) estimated the uncertainty in the sky view factor using this method to be ±0.02.
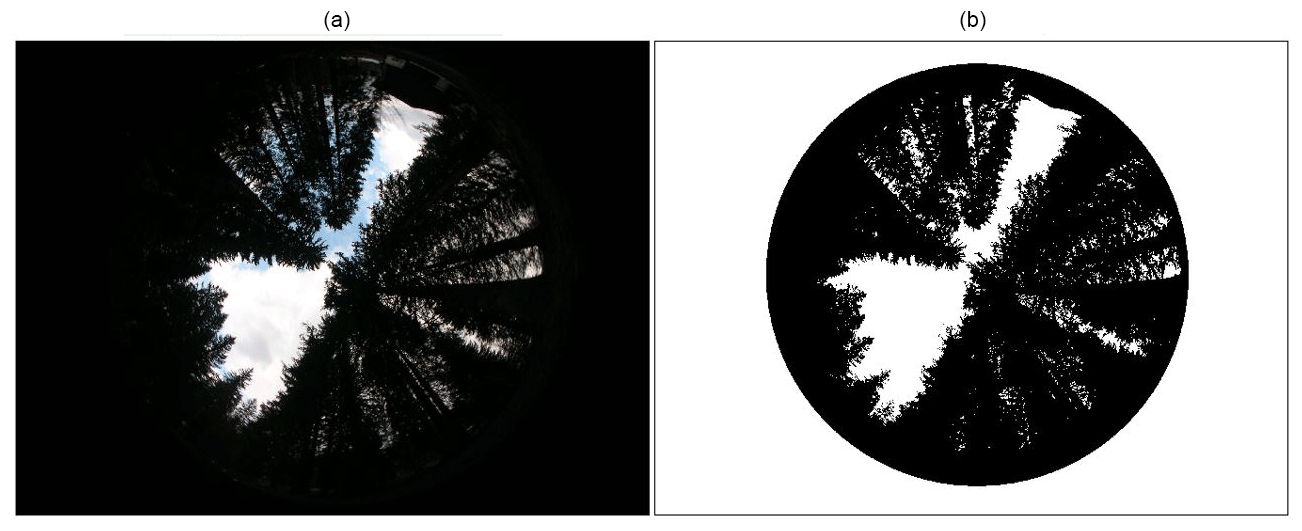
Figure 5Example of a hemispherical photograph (a) and a binary image ((b); white pixels are sky and black pixels are canopy, calculated with a sky view factor of 0.25). The photograph was taken on 4 September 2017 at radiometer A1 (Fig. 1).
Table 2Variables measured by the weather station below the canopy along with the sensor type, heights and precision according to the manufacturers.
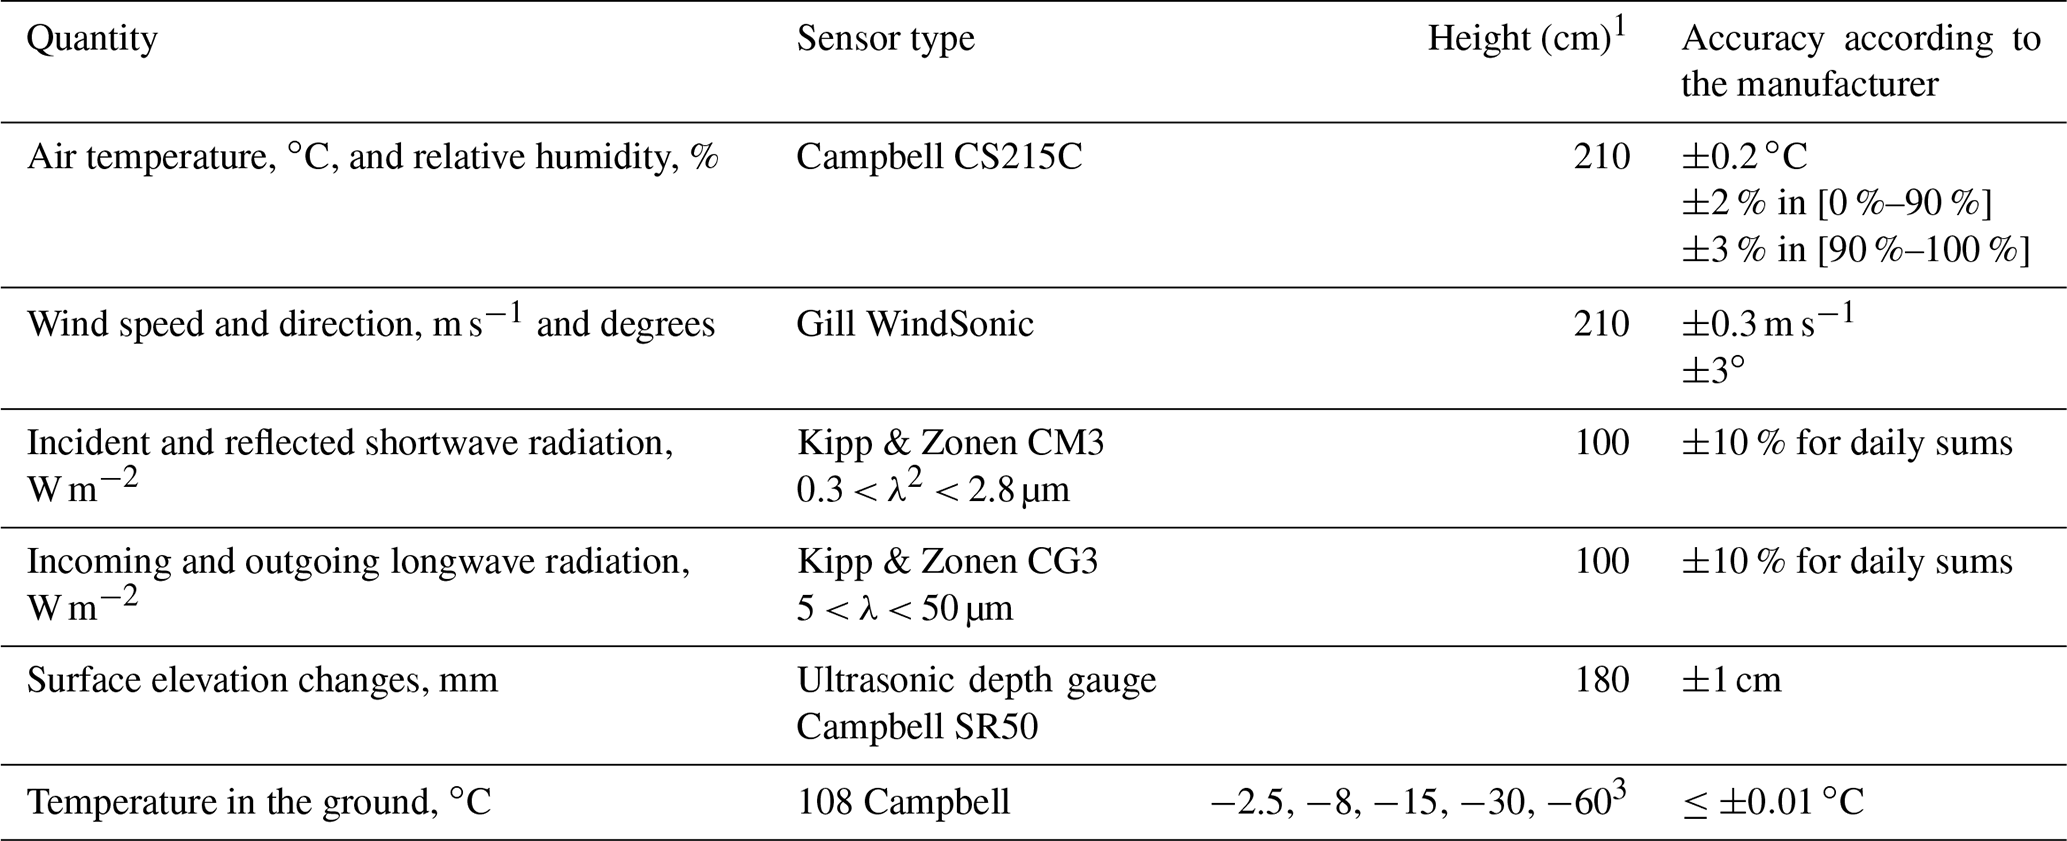
1 Height above snow-free ground. 2 Spectral range in wavelength. 3 Two sensors for each depth.
3.1 Radiometer array
An array of 15 CMP3 Kipp & Zonen pyranometers and 11 CGR3 Kipp & Zonen pyrgeometers was deployed on the snow surface from dense canopy to an opening (Fig. 1). During the first campaign, each radiometer was positioned horizontally with a bubble level on a wooden board placed on the snow surface. During the second campaign, the horizontal support of the radiometers was attached to a vertical bar fixed in the ground. The height of the support (10–20 cm) was adjusted to the snow surface every 2 or 3 d. This system allowed better stability and leveling of the radiometers. One-minute averages of the incoming radiation fluxes measured at 5 s time intervals were recorded by two Campbell Scientific CR3000 data loggers. Intercalibration of the sensors before the campaigns led to estimates of sensor accuracies close to those announced by the manufacturer: ±12 W m−2 for solar radiation and ±8 W m−2 for longwave radiation, in accordance with uncertainty estimations from similar sensors (Halldin and Lindroth, 1992; Philipona et al., 2001; Michel et al., 2008; Van den Broeke et al., 2004). The radiation data were carefully postprocessed to remove periods when the sensors were snow-covered or tilted.
3.2 Weather station
The weather station was installed under rather dense canopy (sky view factor of ∼ 0.2) during the first campaign and has been maintained since then. Table 2 lists the sensors installed on the station, their specifications and their accuracy according to the manufacturers. The ultrasonic depth gauge measures the snow height. Ten temperature probes buried in the ground are used to estimate the heat conduction flux; 15 min averages of the data measured at 10 s time intervals are recorded by a Campbell Scientific CR3000 data logger. An AXIS M1125-E camera took pictures of the surface around the weather station every 3 h during daytime. These images were used to monitor surface and sensor conditions. A Campbell Scientific IR120 infrared sensor was used to measure the surface temperature of a trunk close to the meteorological station (Fig. 1). One-minute averages of longwave irradiance measured at 5 s time intervals were recorded by a Campbell Scientific CR1000 data logger.
As an example of the use of these measurements, Fig. 6 shows hourly changes in air and soil temperatures and snow depth from December 2018 until June 2019, a winter characterized by deep and sustained snow cover. Snow cover began to build up in late December, reaching a maximum of 90 cm in early February. Melt rates became significant as air temperatures remained consistently above 0 ∘C through late February. Snow cover disappeared by the end of March, although there were a few snowfalls through May. Snow cover strongly affected soil temperatures to a depth of 60 cm. The disappearance of the main snow cover at the end of March suddenly reversed the temperature gradient in the soil (the deeper soil became colder than the surface). Soil temperatures were also affected by a few snowfalls in April associated with short periods of cold weather.
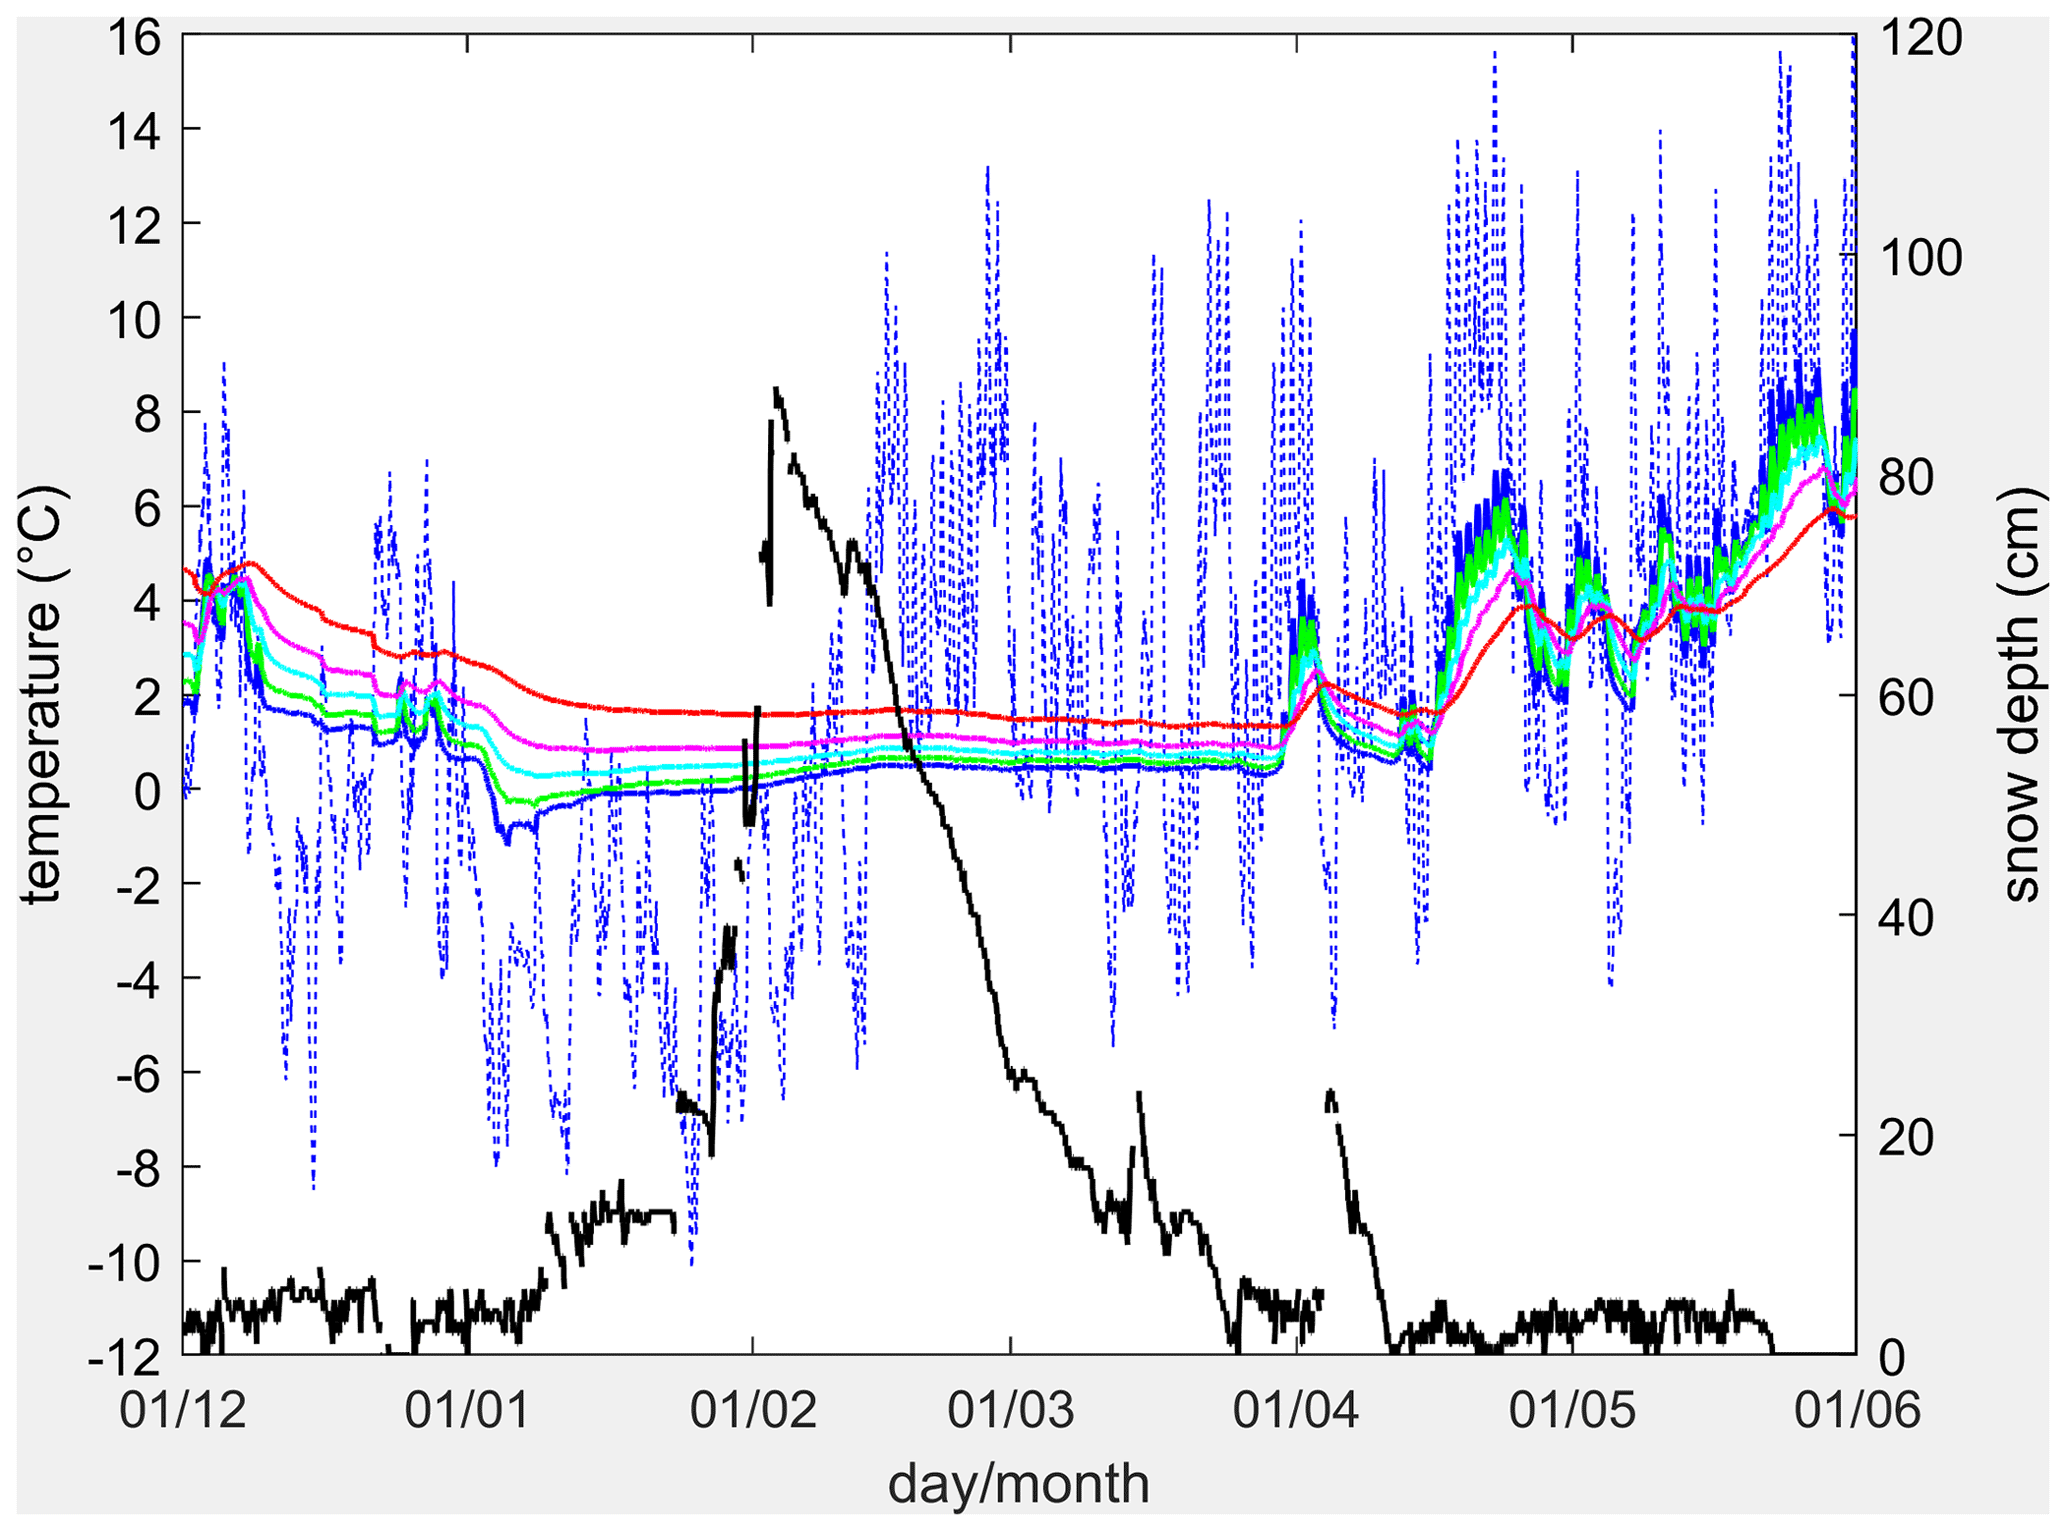
Figure 6Left axis: air temperature (blue dotted line) and soil temperature at 2.5, 8, 15, 30 and 60 cm depths (blue, green, cyan, magenta and red solid lines, respectively). Right axis: snow depth (black line). Hourly data from the weather station in the forest (Table 2) from 1 September 2018 to 1 June 2019. The data gaps in the snow depth time series are mainly due to snowfall events that disrupted the measurements.
3.3 Snow measurements
In order to document the spatial variability of snow cover in the forest, a transect of 18 snow poles was deployed in early winter 2016–2017 (Fig. 1). The locations of these snow poles (spaced 2 m apart) were georeferenced in Lambert 93 coordinates. For each pole, the snow depth was measured approximately every 2 weeks during the two field campaigns. Snow water equivalent measurements were carried out every week for only 4 poles at a time, alternating among the 18 poles to minimize destruction of the local snowpack structure. Detailed studies by Morin et al. (2012) and Lejeune et al. (2019) estimated the uncertainties in snow depth and snow water equivalent measurements to be ±1 cm and ±5 %, respectively, in agreement with the estimation of López-Moreno et al. (2020) derived from a comparison of measurements with different snow core samplers. Simultaneously, measurements of snow depth and water equivalent were made at the reference meadow site as described in Lejeune et al. (2019).
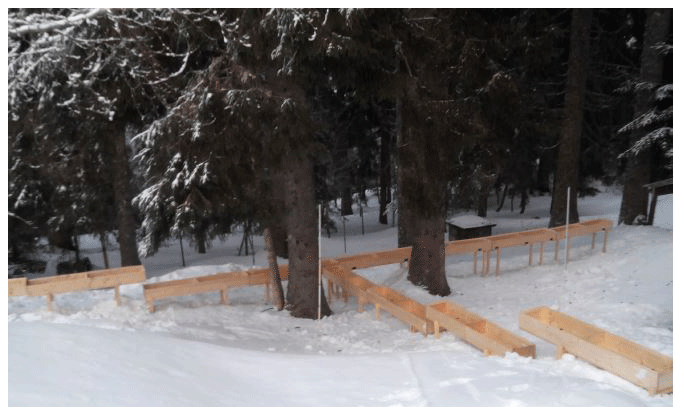
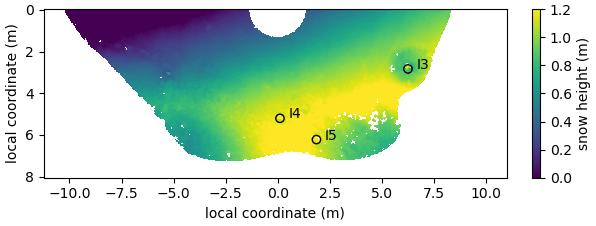
Figure 8Snow height (m) derived from the digital terrain models (DTMs) measured by the rugged Laserscan, obtained by subtracting the snow-free DTM from the 15 April 2018 DTM. The measurement area encompassed three radiometers (I3, I4 and I5).
3.4 Precipitation tanks
The amount of snow held in the canopy can be large and remains difficult to measure. Due to the sublimation of intercepted snow, a large portion of the snow retained in the canopy never reaches the ground, and the interplay of interception, sublimation and delayed deposition on the ground creates significant below-forest heterogeneity in snow accumulation (e.g., Helbig et al., 2020). To try to measure snow interception by the canopy, 24 “precipitation tanks” (1 m × 0.39 m) were built and then deployed under the canopy in three 8 m transects at the start of winter 2017–2018 (Figs. 1 and 7). Snow was taken from the precipitation tanks and weighed after each of the seven significant snowfall events between 20 February and 3 April 2018. The uncertainties in this new measurement method developed by CEN-Météo-France are difficult to estimate. Vincent (2018) estimated the measurement uncertainty at about 5 %, but additional studies are needed.
3.5 Rugged Laser Scan
The Rugged Laser Scan (RLS) is a scanning laser meter that was installed at about 4 m above the ground close to the center of the main clearing to monitor spatiotemporal variations of snow depth under various canopy covers on a daily or 2-daily basis (Fig. 1). The device is described in detail in Picard et al. (2016) and is specially designed to monitor snow heights. It comprises a laser meter mounted on a two-axis stage and can scan ≈ 200 000 points in 4 h. The laser meter was used in scan mode. With a setup at 4 m height, azimuth angles varying from −90 to +90∘ (azimuth angle 0∘ points towards 225∘ southwest) and zenith angles varying from 19 and 62∘, the scanned area is a half-disk of radius ∼ 7 m with a surface area of about 80 m2. The area encompasses three pairs of radiometers installed on the snow surface. Data acquired by the laser meter for a given day are processed to build a cloud of x, y and z points which is then interpolated and averaged on a regular 3 cm grid. The grid is common to all the measurement days, so it is easy to compare the evolution of the snow surface. The vertical precision was evaluated to be about 3 mm and the accuracy to be 1 cm (Picard et al., 2016).
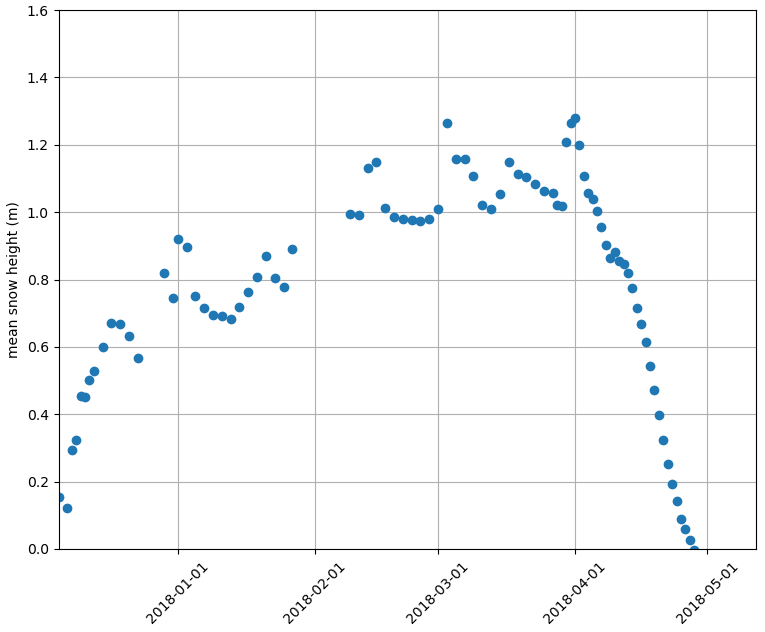
Figure 9Daily spatial averages of the snow depth measured by the rugged Laserscan during the 2017–2018 field campaign.
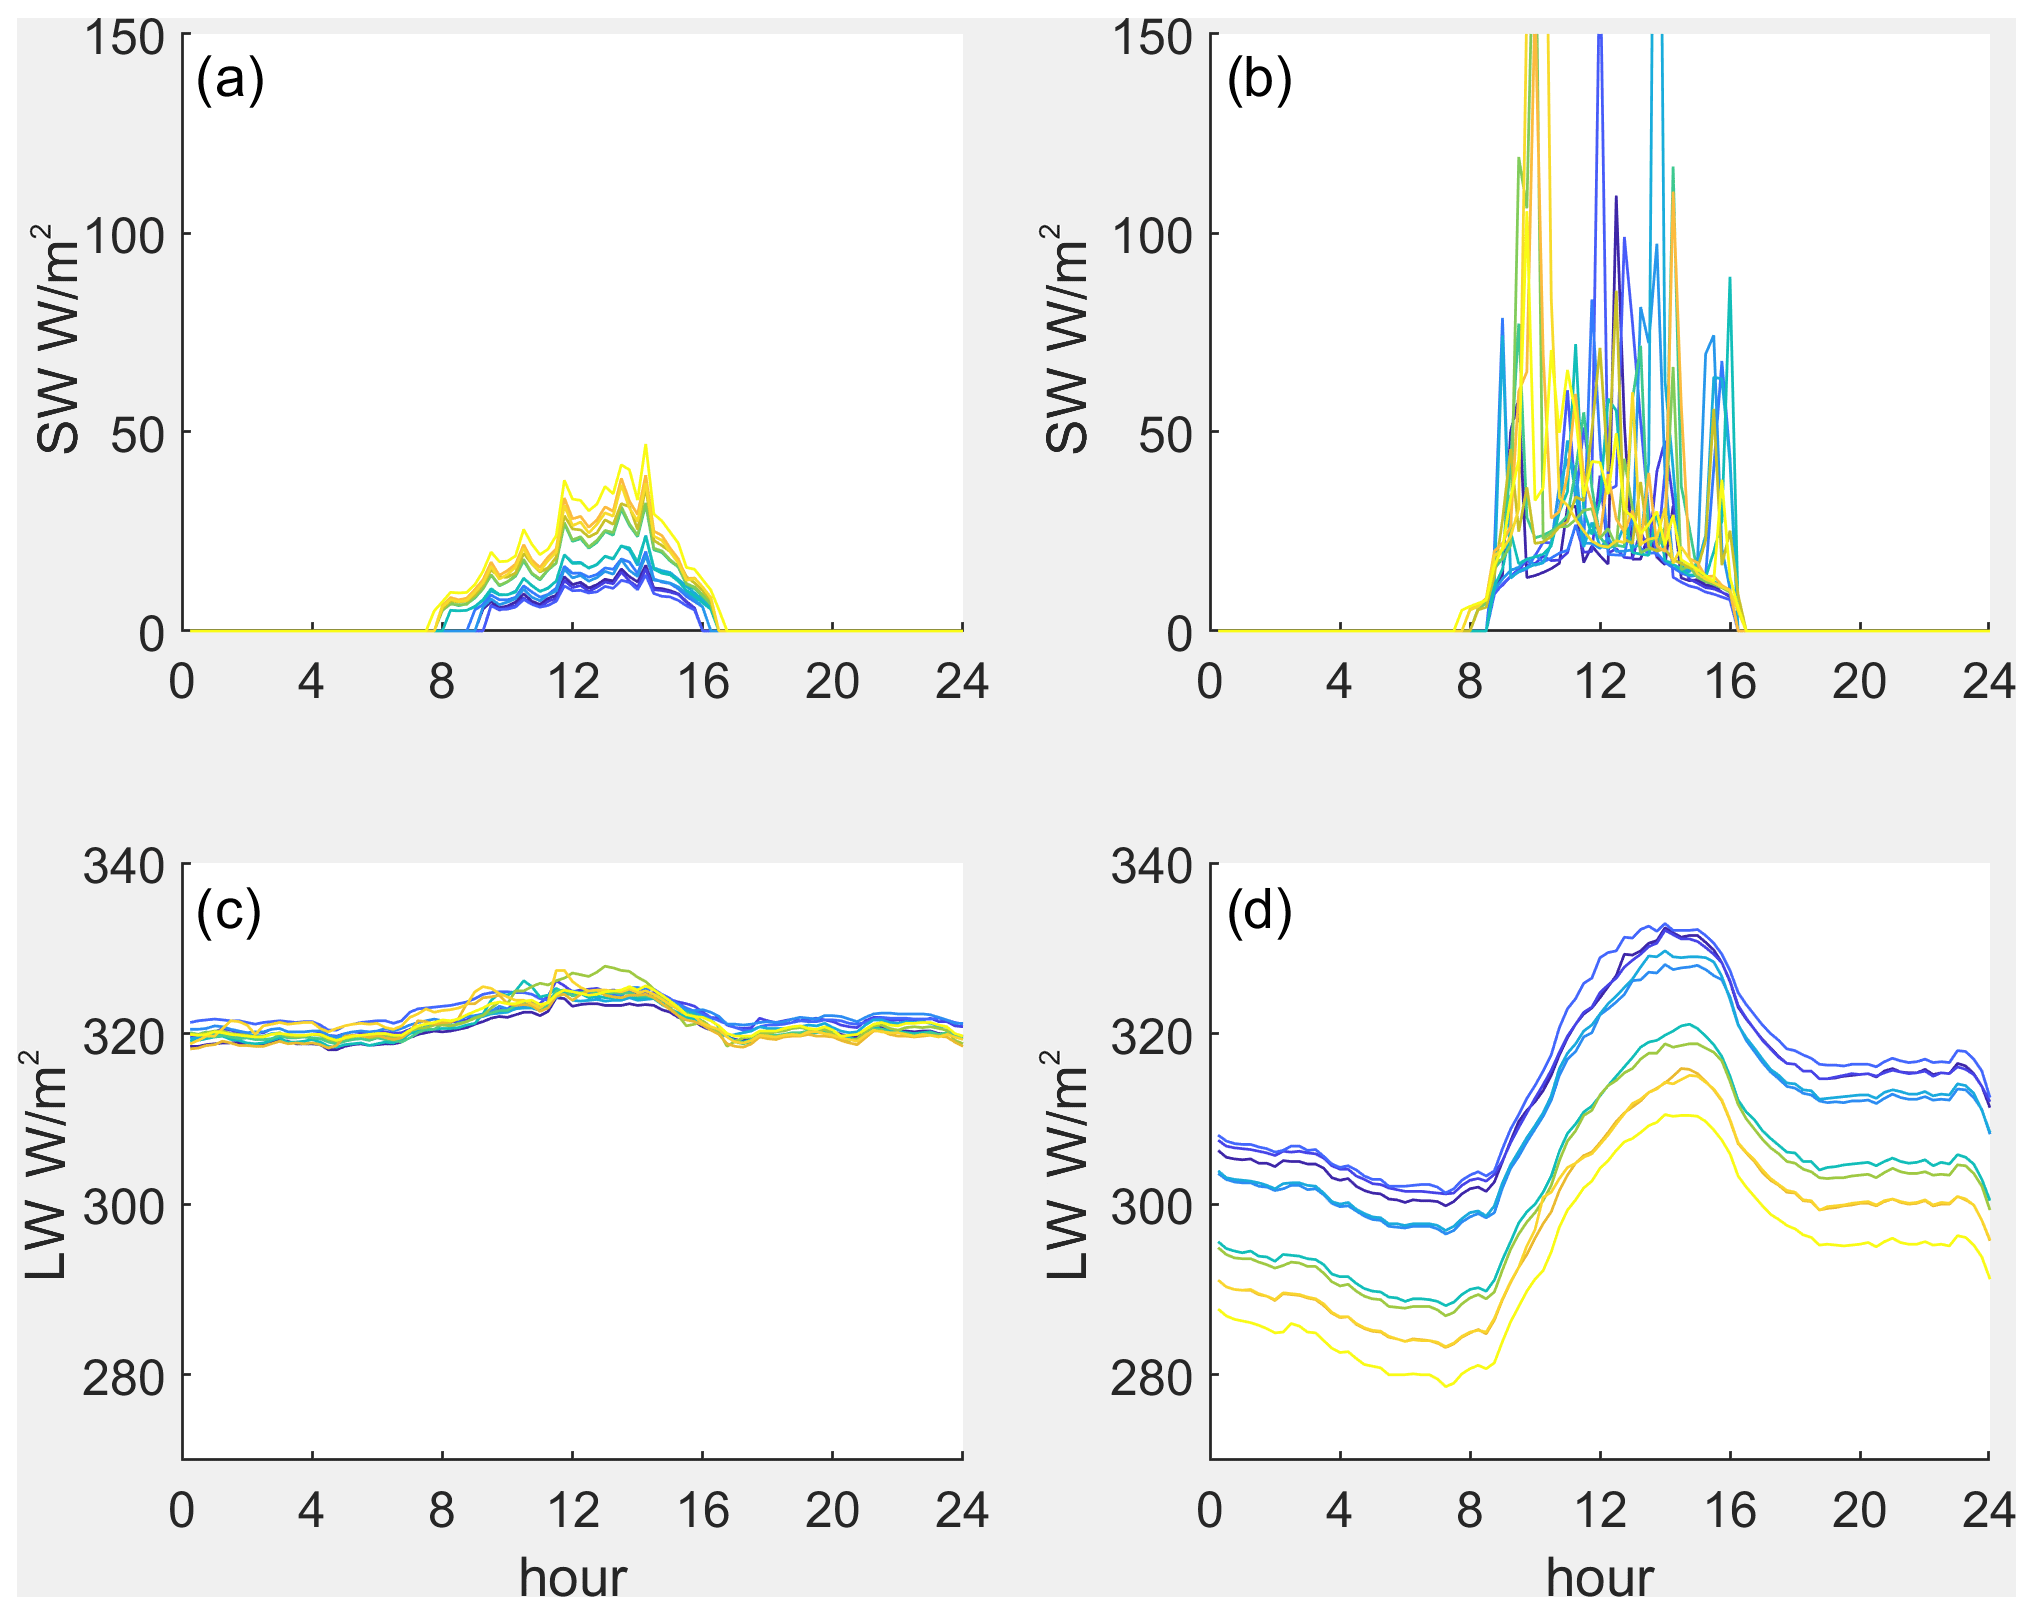
Figure 10Shortwave (a, b) and longwave (c, d) incoming radiation fluxes measured by each radiometer during an overcast day (31 January (a, c)) and during a clear-sky day (18 February (b, d)); 15 min averages of the subcanopy fluxes during the 2017 campaign. Line color is related to the sky view factor Vf from dark blue (lowest Vf=0.17) to yellow (highest Vf=0.32).
The RLS was operated during the two field experiments. The first season was from 22 February 2017 to 4 April 2017 (42 d) and had 42 valid acquisitions (once a day). The second season was from 5 December 2017 to 11 March 2018 (160 d) and had 81 valid acquisitions because scans were scheduled every other day during the winter (accumulation period) and every day during the melt season. Figure 8 shows an example of snow depths on 15 April 2018, and Fig. 9 shows the changes in the daily spatial averages of the snow depth during the 2017–2018 field campaign.
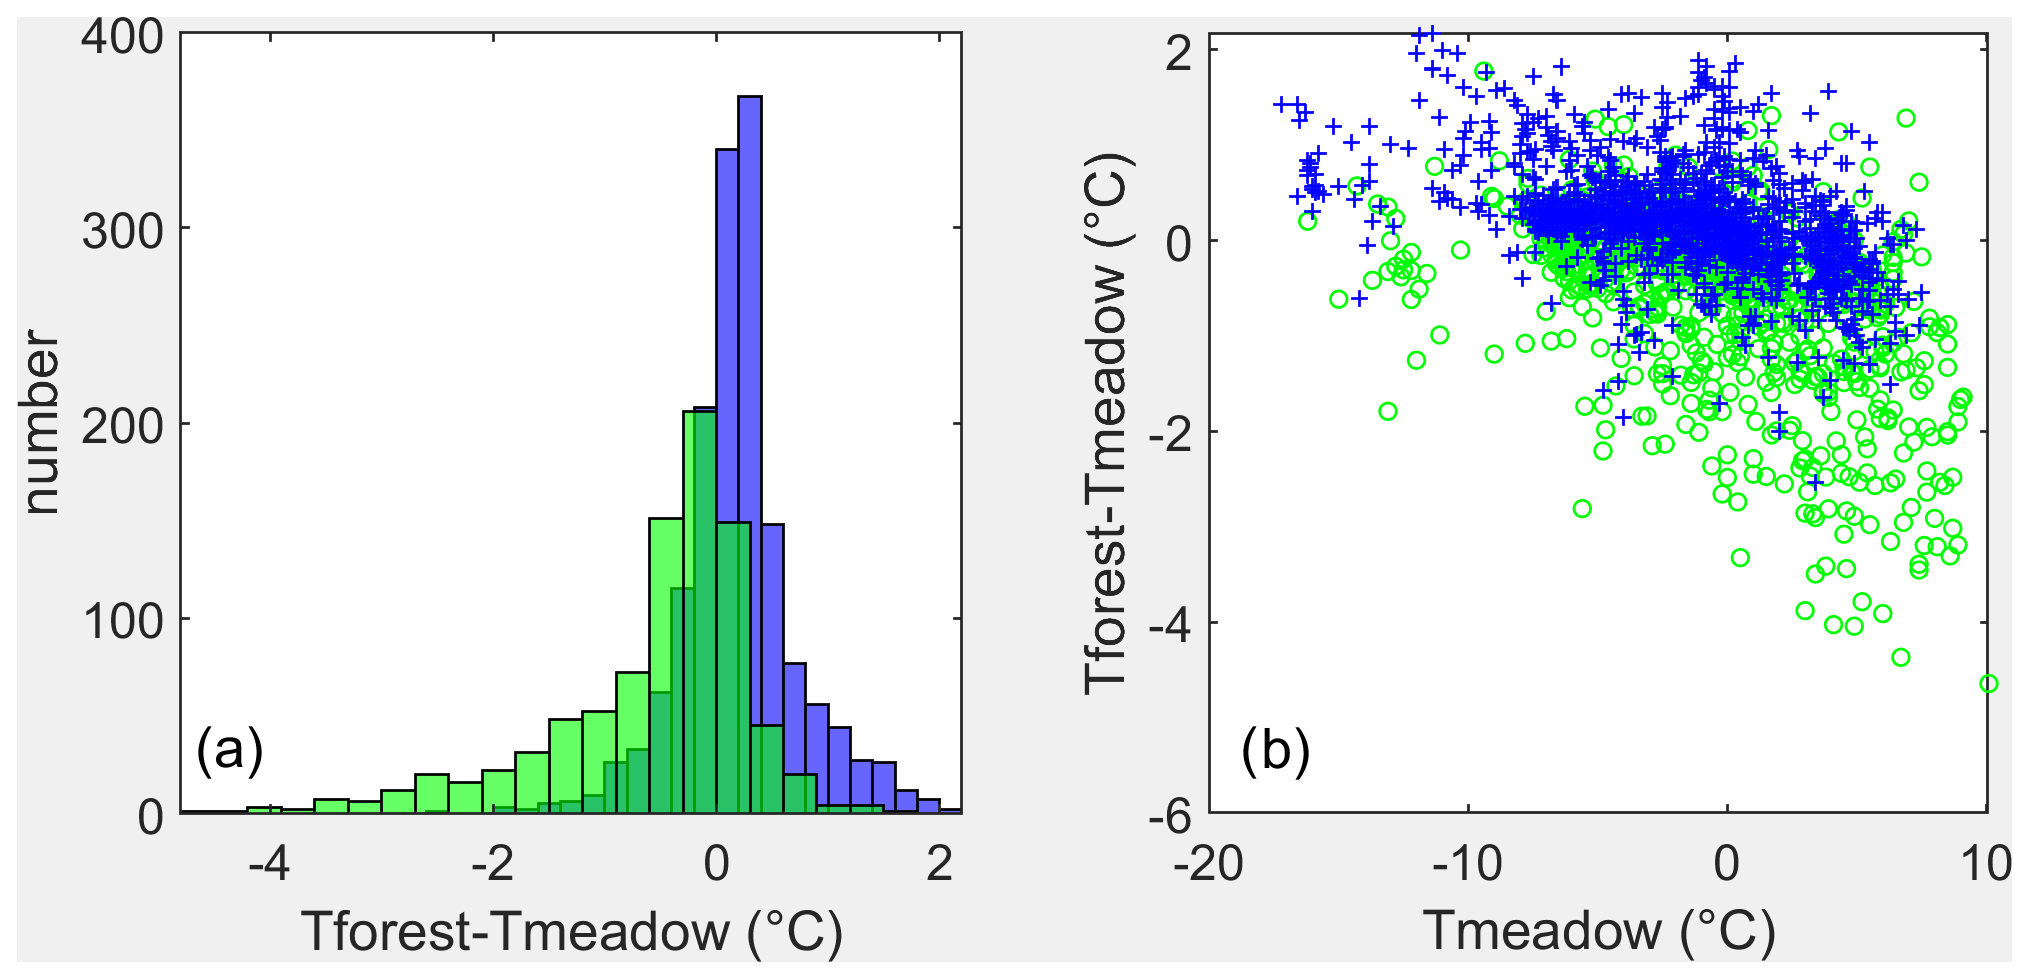
Figure 11Difference in hourly air temperature between forest and meadow (Tforest–Tmeadow) during the 2018 campaign. Panel (a) shows histograms, and panel (b) shows (Tforest–Tmeadow) according to Tmeadow. The distinction between daytime (green bars and circles) and nighttime (blue bars and crosses) values is based on a threshold on the shortwave incoming radiation fluxes at the meadow site (SW < 10 W m−2 during nighttime).
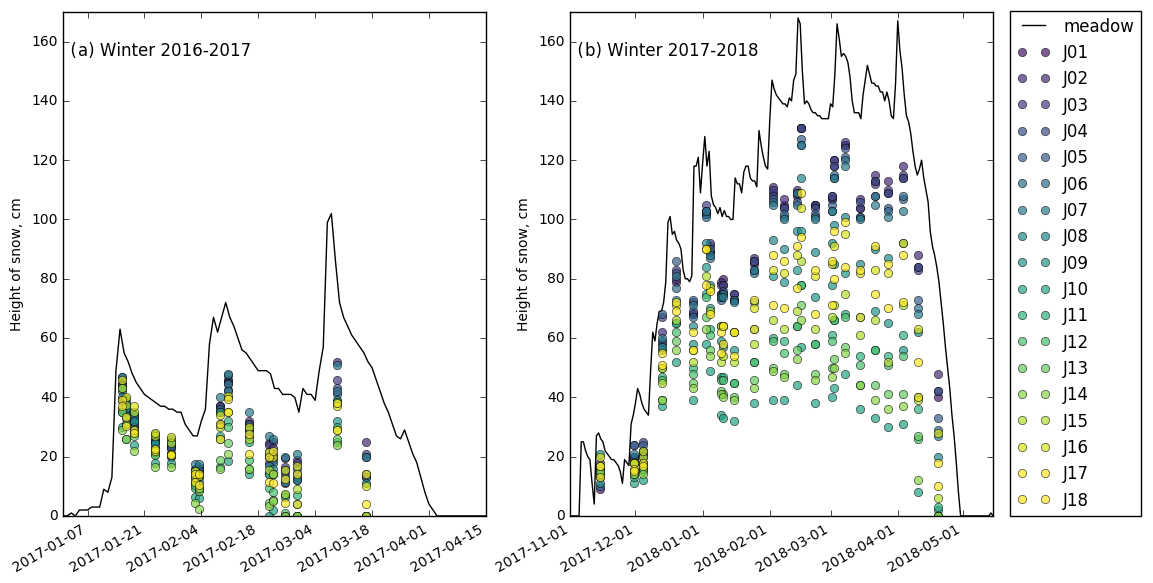
Figure 12Reference snow depth measured in the meadow from Lejeune et al. (2019) (black line) and manually measured at the snow pole transect in the forest (circles; each color corresponds to a snow pole, Fig. 1) during the 2017 (a) and 2018 (b) field campaigns.
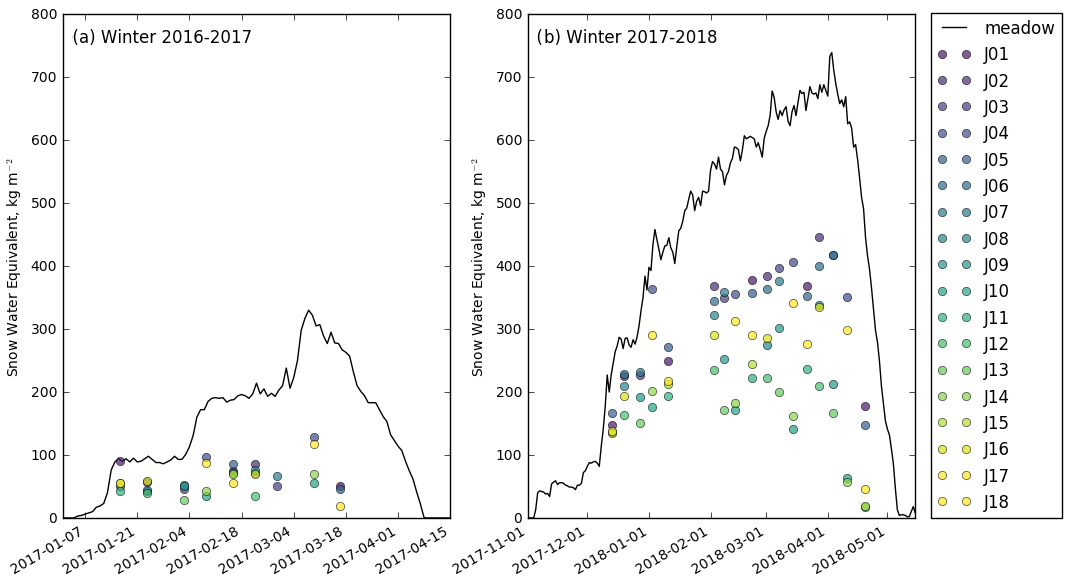
Figure 13Reference snow water equivalent measured at the meadow site with a cosmic-ray neutron sensor (black line; see the details in Lejeune et al., 2019) and manually measured at the snow pole transect in the forest (circles; each color corresponds to a snow pole, Fig. 1) during the 2017 (a) and 2018 (b) field campaigns.
This section provides estimations of the data set uncertainties related to measurement uncertainties and the spatial variability of the variables within the measurement plot. The uncertainties of the sensors and the measurement methods have been described in the previous sections. For meteorological measurements, sensor manufacturers generally provide reliable information on sensor accuracy (Table 2). In this section, comparisons of radiation, air temperature and snow measurements at different locations provide better insight into the measurement uncertainties and a first validation of the data set.
Figure 10 illustrates the spatial variability of the incoming shortwave and longwave radiation fluxes below various forest covers. It shows the effects of clouds and canopy cover on the subcanopy 15 min radiation fluxes during an overcast day and a clear-sky day of the 2017 campaign. Under thick cloud cover (31 January), shortwave radiation, mostly diffuse, reaching the ground remains small but steadily increases with decreasing canopy cover (increasing sky view factor). Sky and vegetation were characterized by similar temperatures and longwave emittance (close to 1), and all the pyrgeometers recorded similar longwave radiations fluxes (within a few watt per square meter, confirming the good accuracy of the sensors) without relation to the canopy cover. Under clear-sky conditions (18 February), shortwave irradiance is mostly direct. Sunflecks on the ground below the canopy caused peaks of shortwave irradiance of various amplitudes and at different times at the different pyranometers, superimposed on the diffuse shortwave radiation that has penetrated through the canopy. The diurnal changes in subcanopy longwave irradiance are remarkably parallel between the different measurement sites. The constant offset between the signals is related to the canopy cover due to the large contrast between the large emittance of vegetation and the small emittance of clear, cold sky: the larger the sky view factor, the smaller the longwave irradiance (Fig. 10d).
Figure 11 illustrates the hourly air temperature differences between forest and meadow. During daytime, the forest is generally a few degrees colder than the open meadow site, with the difference increasing on clear-sky days when the air is warmest (high Topen). During the night, the forest is generally slightly warmer than the meadow, with the difference reaching a few degrees on cold clear-sky nights (low Topen). Thus, average daily air temperatures are quite similar at the forest and meadow site (dT ∼ 0.2 ∘C on average during the 2018 campaign) because warmer nights counterbalance cooler days in the forest relative to the meadow. In addition, warmer cloudy periods tend to counterbalance cooler clear-sky periods in the forest relative to the meadow.
Figures 12 and 13 illustrate the spatial variability of snow depth and snow water equivalent measurements in the open meadow and along the snow pole transect in the forest (see the locations in Fig. 1) during the 2017 and 2018 field campaigns. As previously mentioned, snow cover lasted several weeks longer and was deeper in the second campaign than in the first, reaching maxima in the meadow of 160 and 100 cm, respectively. The seasonal maximum snow depth under the canopy was smaller than that of the meadow by factors ranging from 0.20 to 0.75, depending on the local canopy cover. For the snow water equivalent, these ratios ranged from 0.16 to 0.60. Relative decreases in snow depth and water equivalent in the forest transect compared to the meadow were greater during the first campaign characterized by shallow snow cover. Figures 12 and 13 suggest that the effects of the forest on snow cover are more marked during the winter accumulation season (likely due to interception of snow by the canopy), whereas melt rates during the short ablation season appear to be quite similar in the forest and the meadow. Snow generally disappears earlier in the forest than in the open meadow, but differences in the duration of snow cover are generally small, except in years of low snowfall, and are highly location-dependent due to the high spatial variability of snow depth in the forest (Figs. 12 and 13). This is in line with the meta-analysis of Lundquist et al. (2013) for a dense forest site in a mild climate, but further analysis of snow and meteorological data is needed to investigate this issue at Col de Porte.
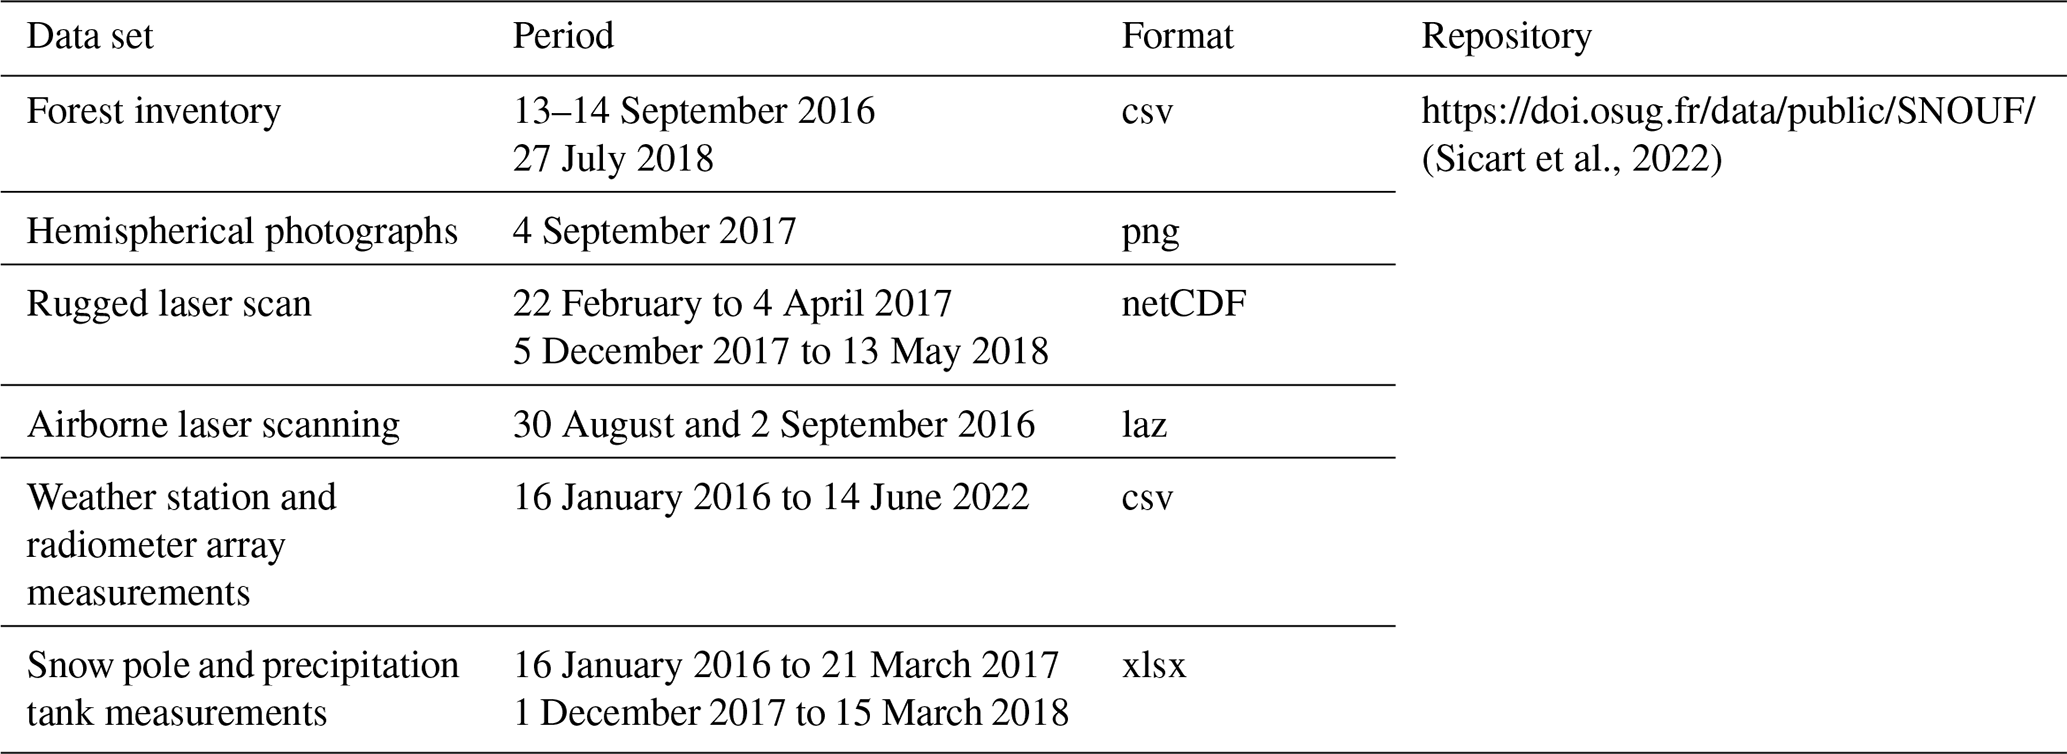
All the data sets described and presented in this paper can be openly accessed from the repository of the Observatoire des Sciences de l'Univers de Grenoble (OSUG) data center at https://doi.org/10.17178/SNOUF.2022 (Sicart et al., 2022). Table 3 provides the link to the different data sets.
The data sets collected in the Col de Porte coniferous forest will allow research on the effects of the canopy on snow accumulation and ablation processes under different canopy covers. Two intensive field campaigns were conducted during the winters of 2016–2017 and 2017–2018, and an automatic weather station has been maintained under the canopy since then. Meteorological and snow measurements (automatic weather station, radiometer array, snow pole transect, laser scan, precipitation tanks to estimate snow interception by the canopy) were complemented by canopy observations (tree inventory, lidar measurements of forest structure, subcanopy hemispherical photographs). Continuous measurements throughout the year at a high temporal frequency (15 min) from the meteorological station allow hydrological and ecological studies related to seasonal changes in micrometeorological and soil conditions.
JES organized the data and wrote the first draft of the manuscript. JMM and YL cleaned and corrected the forest and snow measurements, respectively. LA and GP cleaned and corrected the laser scan measurements. VR and DS analyzed the meteorological data. All the authors participated in the field campaigns, collected and assembled data records, and contributed to writing the paper.
The contact author has declared that none of the authors has any competing interests.
Any reference to specific equipment types or manufacturers is for informational purposes and does not represent a product endorsement.
Publisher's note: Copernicus Publications remains neutral with regard to jurisdictional claims made in the text, published maps, institutional affiliations, or any other geographical representation in this paper. While Copernicus Publications makes every effort to include appropriate place names, the final responsibility lies with the authors.
This article is part of the special issue “Hydrometeorological data from mountain and alpine research catchments”. It is not associated with a conference.
We thank Laurent Bourges (CNRS, OSUG) for his support in managing the data set.
This project was conducted within grant no. Labex OSUG@2020 ANR10 LABX56 UGA and with financial support from the IGE and the CEN through a collaboration between the French institutes IGE, CEN and INRAE and the universities of Edinburgh and Northumbria in the UK. Marie Dumont received funding from the European Research Council (ERC) under the European Union's Horizon 2020 research and innovation program (IVORI; grant no. 949516).
This paper was edited by James Thornton and reviewed by two anonymous referees.
Boone, A., Samuelsson, P., Gollvik, S., Napoly, A., Jarlan, L., Brun, E., and Decharme, B.: The interactions between soil–biosphere–atmosphere land surface model with a multi-energy balance (ISBA-MEB) option in SURFEXv8 – Part 1: Model description, Geosci. Model Dev., 10, 843–872, https://doi.org/10.5194/gmd-10-843-2017, 2017.
Durot, K.: Modélisation hydrologique distribuée du bassin versant nivo-pluvial de Sarennes. Validation des données d'entrées et développement d'un module de fonte nivale sous forêt, PhD thesis, Laboratoire d'Etude des Transferts en Hydrologie et Environnement, UJF, 332 pp., 1999.
Ellis, C. R., Pomeroy, J. W., and Link, T. E.: Modeling increases in snowmelt yield and desynchronization resulting from forest gap-thinning treatments in a northern mountain headwater basin, Water Resour. Res., 49, 936–949, https://doi.org/10.1002/wrcr.20089, 2013.
Elzinga, C., Shearer, R. C., and Elzinga, G.: Observer Variation in Tree Diameter Measurements, West. J. Appl. For., 20, 134–137, https://doi.org/10.1093/wjaf/20.2.134, 2005.
Essery, R.: Large-scale simulations of snow albedo masking by forests, Geophys. Res. Lett., 40, 5521–5525, 2013.
Essery, R., Bunting, P., Rowlands, A., Rutter, N., Hardy, J., Melloh, R., Link, T., Marks, D., and Pomeroy, J.: Radiative transfer modeling of a coniferous canopy characterized by airborne remote sensing, J. Hydrometeorol., 9, 228–241, 2008.
Essery, R., Rutter, N., Pomeroy, J., Baxter, R., Stahli, M., Gustafsson, D., Barr, A., Bartlett, P., and Elder, K.: An Evaluation of Forest Snow Process Simulations, B. Am. Meteorol. Soc., 90, 1120–1136, https://doi.org/10.1175/2009bams2629.1, 2009.
Gouttevin, I., Lehning, M., Jonas, T., Gustafsson, D., and Mölder, M.: A two-layer canopy model with thermal inertia for an improved snowpack energy balance below needleleaf forest (model SNOWPACK, version 3.2.1, revision 741), Geosci. Model Dev., 8, 2379–2398, https://doi.org/10.5194/gmd-8-2379-2015, 2015.
Halldin, S. and Lindroth, A.: Errors in Net Radiometry: Comparison and Evaluation of Six Radiometer Designs, J. Atmos. Ocean. Tech., 9, 762–783, 1992.
Helbig, N., Moeser, D., Teich, M., Vincent, L., Lejeune, Y., Sicart, J.-E., and Monnet, J.-M.: Snow processes in mountain forests: interception modeling for coarse-scale applications, Hydrol. Earth Syst. Sci., 24, 2545–2560, https://doi.org/10.5194/hess-24-2545-2020, 2020.
Hojatimalekshah, A., Uhlmann, Z., Glenn, N. F., Hiemstra, C. A., Tennant, C. J., Graham, J. D., Spaete, L., Gelvin, A., Marshall, H.-P., McNamara, J. P., and Enterkine, J.: Tree canopy and snow depth relationships at fine scales with terrestrial laser scanning, The Cryosphere, 15, 2187–2209, https://doi.org/10.5194/tc-15-2187-2021, 2021.
Lejeune, Y., Dumont, M., Panel, J.-M., Lafaysse, M., Lapalus, P., Le Gac, E., Lesaffre, B., and Morin, S.: 57 years (1960–2017) of snow and meteorological observations from a mid-altitude mountain site (Col de Porte, France, 1325 m of altitude), Earth Syst. Sci. Data, 11, 71–88, https://doi.org/10.5194/essd-11-71-2019, 2019.
López-Moreno, J. I., Leppänen, L., Luks, B., Holko, L., Picard, G., Sanmiguel-Vallelado, A., Alonso-González, E., Finger, D. C., Arslan, A. N., and Gillemot, K.: Intercomparison of measurements of bulk snow density and water equivalent of snow cover with snow core samplers: Instrumental bias and variability induced by observers, Hydrol. Process., 34, 3120–3133, 2020.
Lundquist, J. D., Dickerson-Lange, S. E., Lutz, J. A., and Cristea, N. C.: Lower forest density enhances snow retention in regions with warmer winters: A global framework developed from plot-scale observations and modeling, Water Resour. Res., 49, 6356–6370, 2013.
Luoma, V., Saarinen, N., Wulder, M. A., White, J. C., Vastaranta, M., Holopainen, M., and Hyyppä, J.: Assessing Precision in Conventional Field Measurements of Individual Tree Attributes, Forests, 8, 38, https://doi.org/10.3390/f8020038, 2017.
Malle, J., Rutter, N., Mazzotti, G., and Jonas, T.: Shading by Trees and Fractional Snow Cover Control the Subcanopy Radiation Budget, J. Geophys. Res.-Atmos., 124, 3195–3207, https://doi.org/10.1029/2018jd029908, 2019.
Mazzotti, G., Currier, W. R., Deems, J. S., Pflug, J. M., Lundquist, J. D., and Jonas, T.: Revisiting Snow Cover Variability and Canopy Structure Within Forest Stands: Insights From Airborne Lidar Data, Water Resour. Res., 55, 6198–6216, https://doi.org/10.1029/2019wr024898, 2019.
Mazzotti, G., Essery, R., Moeser, C. D., and Jonas, T.: Resolving Small-Scale Forest Snow Patterns Using an Energy Balance Snow Model With a One-Layer Canopy, Water Resour. Res., 56, e2019WR026129, https://doi.org/10.1029/2019WR026129, 2020.
Michel, D., Philipona, R., Ruckstuhl, C., Vogt, R., and Vuilleumier, L.: Performance and uncertainty of CNR1 net radiometers during a one-year field comparison, J. Atmos. Ocean. Tech., 25, 442–451, https://doi.org/10.1175/2007jtecha973.1, 2008.
Morin, S., Lejeune, Y., Lesaffre, B., Panel, J.-M., Poncet, D., David, P., and Sudul, M.: An 18-yr long (1993–2011) snow and meteorological dataset from a mid-altitude mountain site (Col de Porte, France, 1325 m alt.) for driving and evaluating snowpack models, Earth Syst. Sci. Data, 4, 13–21, https://doi.org/10.5194/essd-4-13-2012, 2012.
Musselman, K. N., Molotch, N. P., Margulis, S. A., Lehning, M., and Gustafsson, D.: Improved snowmelt simulations with a canopy model forced with photo-derived direct beam canopy transmissivity, Water Resour. Res., 48, https://doi.org/10.1029/2012WR012285, 2012.
Nobis, M. and Hunziker, U.: Automatic thresholding for hemispherical canopy-photographs based on edge detection, Agr. Forest Meteorol., 128, 243–250, https://doi.org/10.1016/j.agrformet.2004.10.002, 2005.
Otterman, J., Staenz, K., Itten, K. I., and Kukla, G.: Dependence of Snow Melting and Surface-Atmosphere Interactions on the Forest Structure, Bound.-Lay. Meteorol., 45, 1–8, https://doi.org/10.1007/bf00120812, 1988.
Philipona, R., Dutton, E. G., Stoffel, T., Michalsky, J., Reda, I., Stifter, A., Wendling, P., Wood, N., Clough, S. A., Mlawer, E. J., Anderson, G., Revercomb, H. E., and Shippert, T. R.: Atmospheric longwave irradiance uncertainty: Pyrgeometers compared to an absolute sky-scanning radiometer, atmospheric emitted radiance interferometer, and radiative transfer model calculations, J. Geophys. Res.-Atmos., 106, 28129–28141, 2001.
Picard, G., Arnaud, L., Panel, J.-M., and Morin, S.: Design of a scanning laser meter for monitoring the spatio-temporal evolution of snow depth and its application in the Alps and in Antarctica, The Cryosphere, 10, 1495–1511, https://doi.org/10.5194/tc-10-1495-2016, 2016.
Pomeroy, J., Rowlands, A., Hardy, J., Link, T., Marks, D., Essery, R., Sicart, J. E., and Ellis, C.: Spatial Variability of Shortwave Irradiance for Snowmelt in Forests, J. Hydrometeorol., 9, 1482–1490, https://doi.org/10.1175/2008jhm867.1, 2008.
Reid, T., Essery, R., Rutter, N., and King, M.: Data-driven modelling of shortwave radiation transfer to snow through boreal birch and conifer canopies, Hydrol. Process., 28, 2987–3007, 2014.
Röhle, H.: Vergleichende Untersuchungen zur Ermittlung der Genauigkeit bei der Ablotung von Kronenradien mit dem Dachlot und durch senkrechtes Anvisieren des Kronenrandes (Hochblick-Methode), Forstarchiv, 57, 67–71, 1986.
Rutter, N., Essery, R., Pomeroy, J., Altimir, N., Andreadis, K., Baker, I., Barr, A., Bartlett, P., Boone, A., Deng, H. P., Douville, H., Dutra, E., Elder, K., Ellis, C., Feng, X., Gelfan, A., Goodbody, A., Gusev, Y., Gustafsson, D., Hellstrom, R., Hirabayashi, Y., Hirota, T., Jonas, T., Koren, V., Kuragina, A., Lettenmaier, D., Li, W. P., Luce, C., Martin, E., Nasonova, O., Pumpanen, J., Pyles, R. D., Samuelsson, P., Sandells, M., Schadler, G., Shmakin, A., Smirnova, T. G., Stahli, M., Stockli, R., Strasser, U., Su, H., Suzuki, K., Takata, K., Tanaka, K., Thompson, E., Vesala, T., Viterbo, P., Wiltshire, A., Xia, K., Xue, Y. K., and Yamazaki, T.: Evaluation of forest snow processes models (SnowMIP2), J. Geophys. Res.-Atmos., 114, D06111, https://doi.org/10.1029/2008jd011063, 2009.
Sicart, J. E., Ramseyer, V., Picard, G., Arnaud, L., Coulaud, C., Freche, G., Soubeyrand, D., Lejeune, Y., Dumont, M., Gouttevin, I., Le Gac, E., Berger, F., Monnet, J. M., Borgniet, L., Mermin, E., Rutter, N., Webster, C., and Essery, R.: Snow Under Forest, Snow, forest and meteorological measurements at Col de Porte, SNOUF-OSUG [data set], https://doi.org/10.17178/SNOUF.2022, 2022.
Van den Broeke, M., Reijmer, C. H., and Van De Wal, R. S. W.: Surface radiation balance in Antarctica as measured with automatic weather stations, J. Geophys. Res., 109, D09103, https://doi.org/10.1029/2003JD004394, 2004.
Vincent, L.: Observation et modélisation du manteau neigeux sous une forêt d'épicéas au Col de Porte, Thèse de Master 2, Université Paul Sabatier, Toulouse, 40 pp., 2018.
Vionnet, V., Brun, E., Morin, S., Boone, A., Faroux, S., Le Moigne, P., Martin, E., and Willemet, J.-M.: The detailed snowpack scheme Crocus and its implementation in SURFEX v7.2, Geosci. Model Dev., 5, 773–791, https://doi.org/10.5194/gmd-5-773-2012, 2012.
Webster, C. and Jonas, T.: Influence of canopy shading and snow coverage on effective albedo in a snow-dominated evergreen needleleaf forest, Remote Sens. Environ., 214, 48–58, 2018.
Webster, C., Rutter, N., Zahner, F., and Jonas, T.: Modeling subcanopy incoming longwave radiation to seasonal snow using air and tree trunk temperatures, J. Geophys. Res.-Atmos., 121, 1220–1235, 2016.
- Abstract
- Introduction
- Site and forest description
- Meteorological and snow observations in the forest
- Spatial variability, measurement uncertainties and data validation
- Data availability
- Conclusions
- Author contributions
- Competing interests
- Disclaimer
- Special issue statement
- Acknowledgements
- Financial support
- Review statement
- References