the Creative Commons Attribution 4.0 License.
the Creative Commons Attribution 4.0 License.
 | 15 Nov 2023
A new cropland area database by country circa 2020
Francesco N. Tubiello
Giulia Conchedda
Leon Casse
Pengyu Hao
Giorgia De Santis
Zhongxin Chen
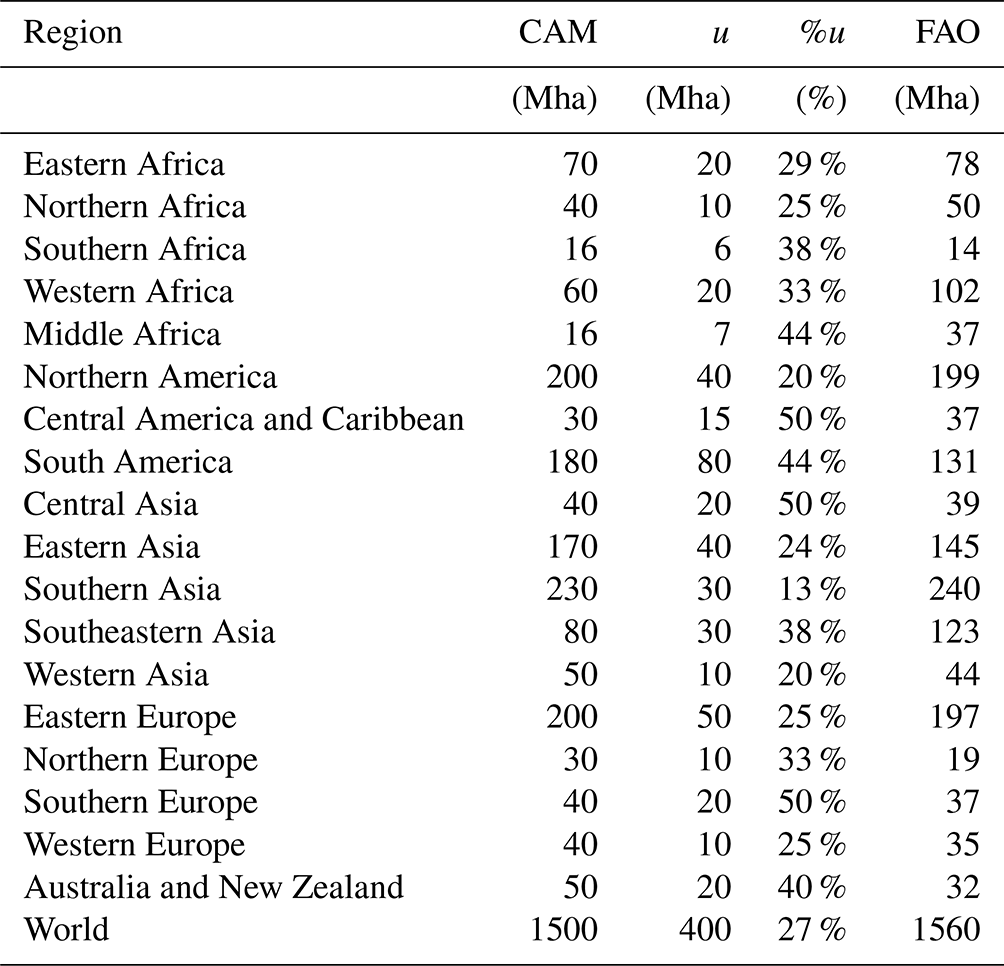
We describe a new dataset of cropland area circa the year 2020, with global coverage and with data for 221 countries and territories and 34 regional aggregates. Data are generated from geospatial information on the agreement–disagreement characteristics of six open-access high-resolution cropland maps derived from remote sensing. The cropland area mapping (CAM) aggregation dataset provides information on (i) mean cropland area and its uncertainty, (ii) cropland area by six distinct cropland agreement classes, and (iii) cropland area by specific combinations of underlying land cover product. The results indicated that world cropland area is 1500 ± 400 Mha (mean and 95 % confidence interval), with a relative uncertainty of 25 % that increased across regions. It was 50 % in Central Asia (40 ± 20 Mha), South America (180 ± 80 Mha), and Southern Europe (40 ± 20 Mha) and up to 40 % in Australia and New Zealand (50 ± 20 Mha), Southeastern Asia (80 ± 30 Mha), and Southern Africa (16 ± 6 Mha). Conversely, cropland area was estimated with better precision, i.e., smaller uncertainties in the range 10 %–25 % in Southern Asia (230 ± 30 Mha), Northern America (200 ± 40 Mha), Northern Africa (40 ± 10 Mha), and Eastern Europe and Western Europe (40 ± 10 Mha). The new data can be used to investigate the coherence of information across the six underlying products, as well as to explore important disagreement features. Overall, 70 % or more of the estimated mean cropland area globally and by region corresponded to good agreement of underlying land cover maps – four or more. Conversely, in Africa cropland area estimates found significant disagreement, highlighting mapping difficulties in complex landscapes. Finally, the new cropland area data were consistent with FAOSTAT (FAO, 2023) in 15 out of 18 world regions, as well as for 114 out of 182 countries with a cropland area above 10 kha. By helping to highlight features of cropland characteristics and underlying causes for agreement–disagreement across land cover products, the CAM aggregation dataset may be used as a reference for the quality of country statistics and may help guide future mapping efforts towards improved agricultural monitoring. Data are publicly available at https://doi.org/10.5281/zenodo.7987515 (Tubiello et al., 2023a).
- Article
(3181 KB) - Full-text XML
- BibTeX
- EndNote


Information on cropland area is needed to assess and monitor the sustainability of agriculture at local, regional and planetary scales. Information on world cropland area with national or sub-national detail is currently available as (i) statistics of agricultural land use, collected from countries by the Food and Agriculture Organization of the United Nations (FAO) and disseminated in FAOSTAT (FAO, 2023), and (ii) land cover maps produced from remote sensing (Potapov et al., 2022a). These historically rather distinct sources are becoming interconnected, with remotely sensed data increasingly complementing more traditional data sources such as agricultural censuses and surveys (Miller et al., 2009; Bailey and Boryan, 2010; FAO, 2018; Karthikeyan et al., 2020; Weiss et al., 2020; Bey et al., 2016). Comparison analyses at multiple scales of these different sources have been published to facilitate in-depth understanding of cropland characteristics and to derive methods for data selection and applications (Bratic et al., 2019; Liu et al., 2021; Venter et al., 2022; Chaaban et al., 2022; Ding et al., 2022). We recently conducted a meta-analysis of the six currently available independent high-resolution (10–30 m) land cover maps circa 2020 and derived a map on cropland agreement–disagreement at the pixel level – the CAM map – showing that by combining such information world cropland area can be estimated to within 25 % of the mean cropland area (Tubiello et al., 2023b). That study identified “definitional bias”, i.e., systematic errors due to imperfectly aligned land cover/land use definitions, as an important source of uncertainty in addition to well-described factors such as differences in data sources, pre-processing methods and validation approaches (Fritz et al., 2013; Gao et al., 2020, Wang et al., 2019). The cropland agreement map is already being used in support of relevant geospatial work (e.g., Tang et al., 2023).
This study presents a new database of cropland area at country level, based on the geospatial work of Tubiello et al. (2023b). We aggregated pixel level information and quantified means and uncertainties of cropland area at country and regional level. The new database, referred to hereafter as the Cropland Agreement Mapping (CAM) aggregation dataset, provides information on cropland area by country, with data on (i) mean estimate and uncertainty, (ii) contributions to total area by agreement class, and (iii) contributions to total area by specific combinations of the underlying land cover products. This novel information helps us to better understand the linkage between agricultural land cover and land use information and related uncertainty, offering useful insights into future mapping efforts and their evaluation. The CAM dataset is available as open-access data at https://doi.org/10.5281/zenodo.7987515 (Tubiello et al., 2023a).
2.1 Cropland agreement map
We used the CAM map by Tubiello et al. (2023b) as input to generate country statistics. The CAM map consolidates information from six high-resolution land cover maps based on a meta-analysis done within the code editor of the Google Earth Engine (GEE) (Gorelick et al., 2017). These six maps are ESRI (Karra et al. 2021), FROM_GLC Plus (Yu et al., 2022), GLAD (Potapov et al, 2022a), GLC-FCS30-2020 (Zhang et al., 2021), Globeland30 (Chen et al., 2015) and WorldCover (Zanaga et al., 2021). Appendix A further provides details on the characteristics of the six land cover maps, along with their spatial consistency and similarity analysis.
The CAM actually consists of two geospatial layers prepared at 30 m resolution as 8-bit unsigned integers using the WGS84 (EPSG:4326) coordinate system: (i) a simple cropland agreement map and (ii) a detailed cropland agreement map.
The simple cropland agreement map layer combines six cropland binary masks (with values of 1 for cropland, 0 for no cropland) from the six input land cover products (Appendix A), into a map with pixel values ranging 1–6, representing, when normalized by the number of layers, the probability of cropland area in each pixel.
The detailed cropland agreement map layer contains information on the individual land cover products and their combinations, with values ranging between 0 (bit 00000000, corresponding to no cropland) and 63 (bit 00111111, representing complete agreement) (Appendix B, Table B1). Each input dataset contains omission and commission errors, which affect their accuracy (Table 1). While the uncertainty information in CAM and in our dataset is computed after these accuracies, it should be noted that synergic combinations of multiple land cover products typically yield improved accuracies (Lu et al., 2020) as overall omission and commission errors may be reduced.
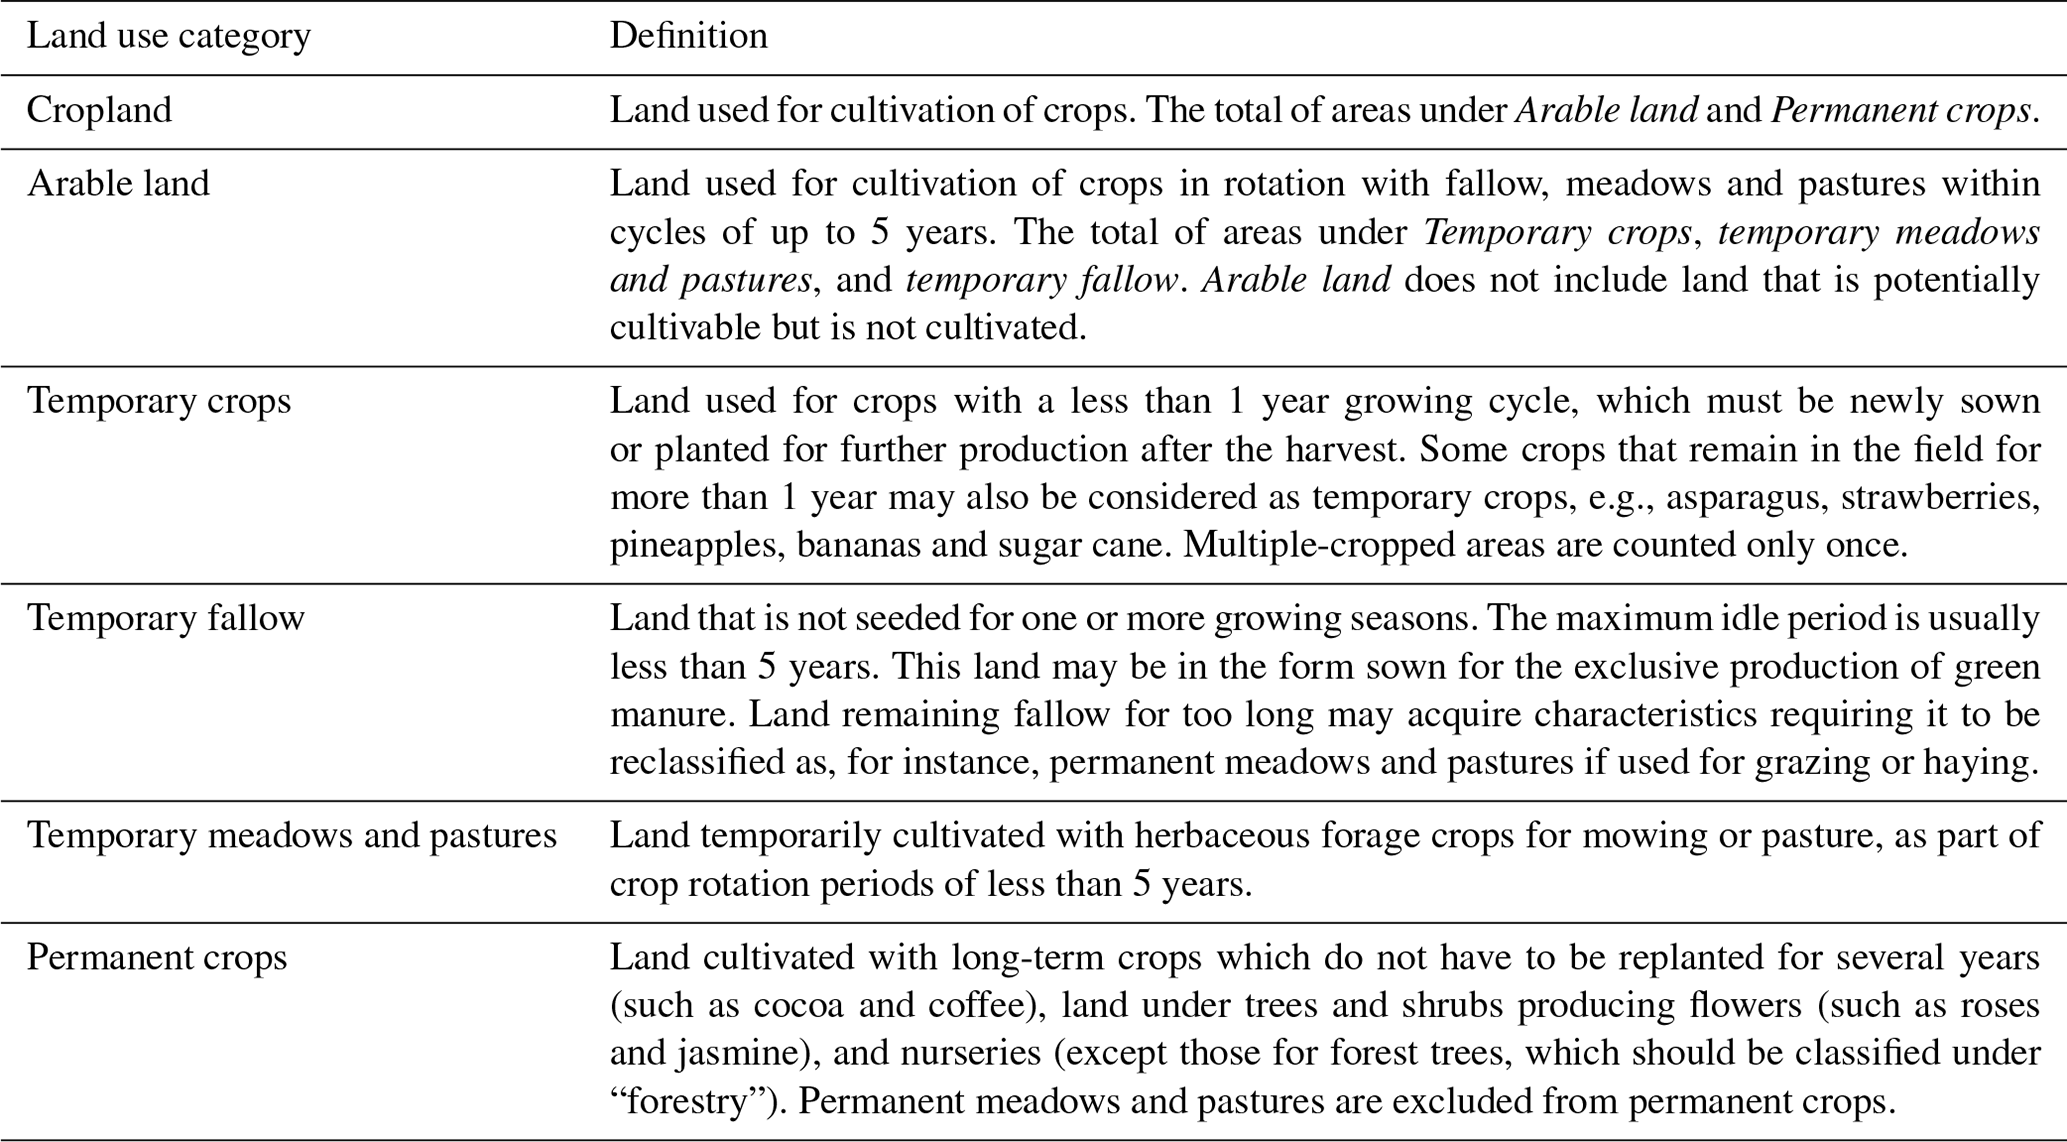
As discussed elsewhere (Tubiello et al., 2023b), the definitions of “cropland” as a land cover class varied across the six products (Table 1), although they largely corresponded to FAO land use class cropland or arable land (Table 2). Specifically, of the six products used as input, GLAD, WorldCover and ESRI cropland classes could conceptually be mapped to FAO land use class arable land or temporary crops, while the other three maps, including information on shrubs and woody components, could be better aligned with the FAO parent class cropland (Tubiello et al., 2023b). Within the latter, Globeland30 included within “cropland” tree and shrub crops directly under a single class (cultivated land); FROM-GLC included permanent shrubs crops while excluding tree crops; and FCS30 provided data on cropland globally, with some partial regional distinctions between herbaceous and woody crops within irrigated/rainfed sub-classes (Table 1). The latter category was excluded to reduce definitional bias in the consolidated product.
Table 1Cropland definitions and accuracy of the six input layers used for the cropland agreement map.
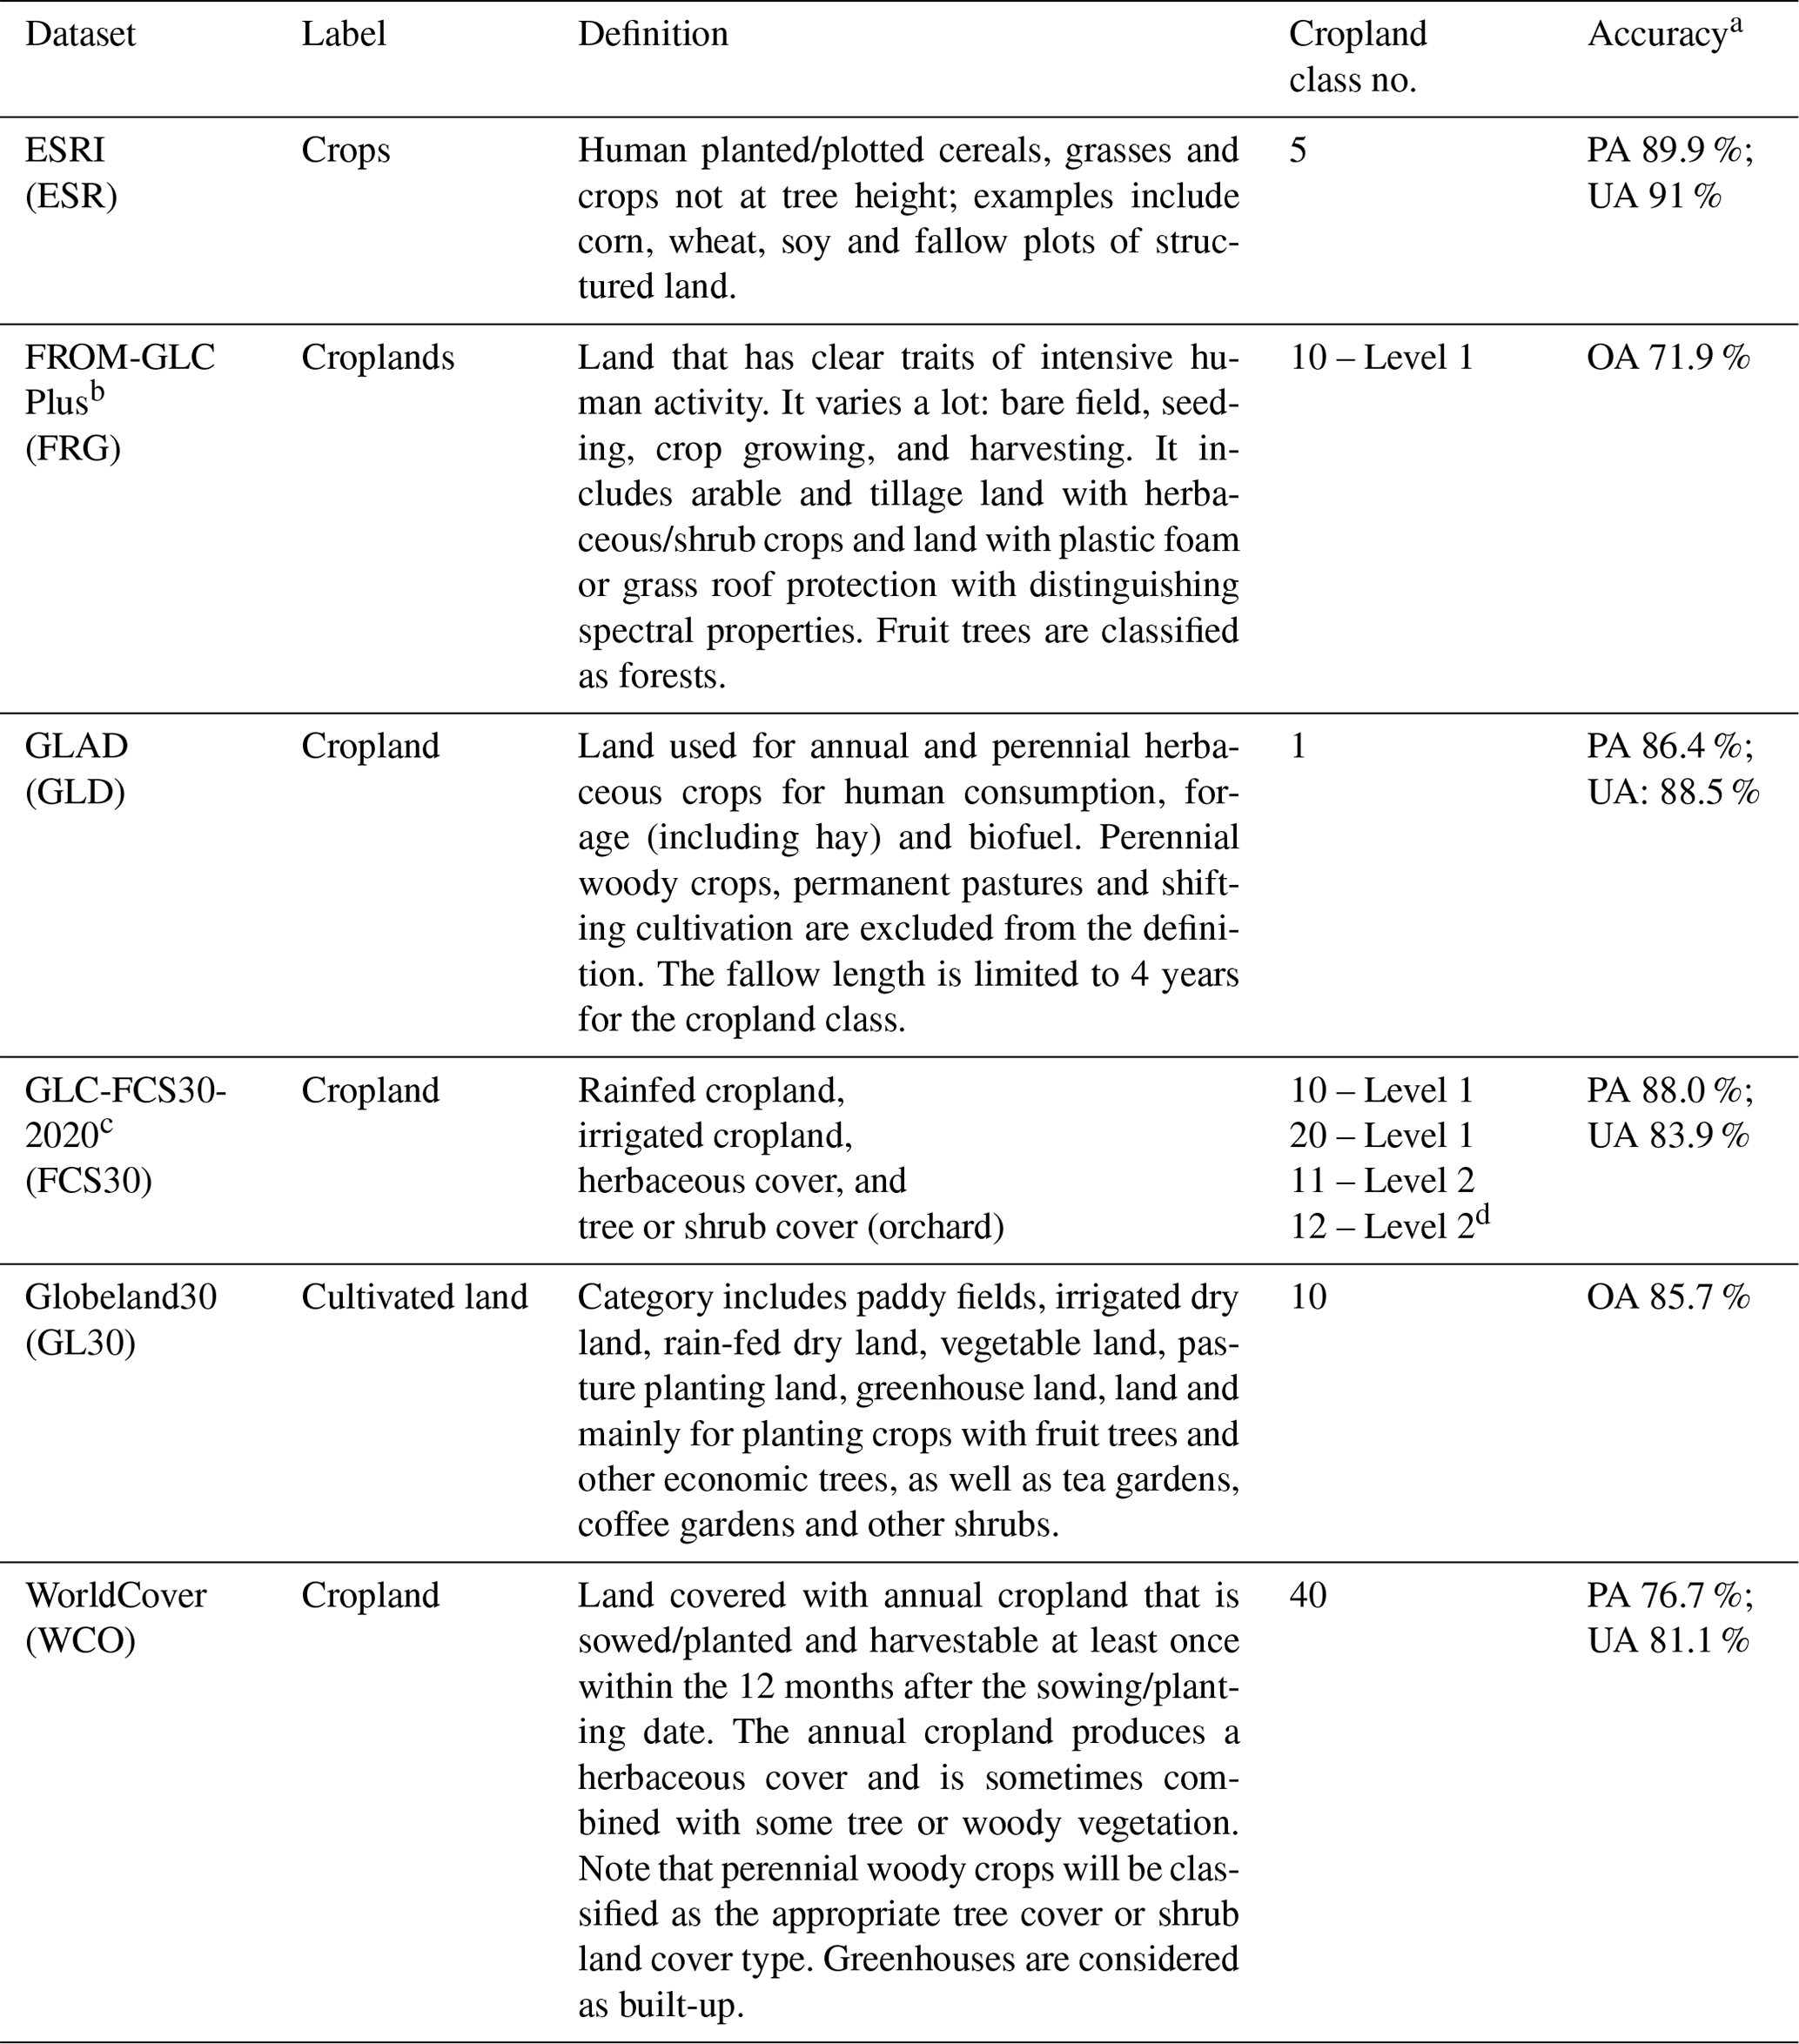
a When available, user and producer accuracy (UA and PA) of the cropland class are given; otherwise, overall map accuracy (OA) is reported. b Accuracy results reported for the 2020 map from the data producers (Pengyu Hao, personal communication, September 2022). c Accuracy results based on the 2015 version of the map. d Excluded from the cropland agreement map.
2.2 Preparation of the CAM aggregation dataset
The country statistics populating the CAM aggregation dataset (Tubiello et al., 2023a) were extracted from the simple and detailed agreement maps discussed above (Tubiello et al., 2023b), using the FAO Global Administrative Unit layer (GAUL) for country boundaries (FAO, 2015) – also accessible from the GEE code editor. The cloud processing method in GEE generates country area statistics by inherently taking into account the different pixel areas by latitude. The aggregation to country level was done by summing these pixels (i.e., pixel counting) for the simple or detailed classes of agreement as well as for the six cropland layers in the CAM aggregation dataset.
Generally, for n land cover maps, pixel values in the simple agreement map belong to a set of n+1 elements, i.e., {0, , ,..., 1}, representing the level of agreement among input maps, which was interpreted as the probability of finding cropland in each pixel by Tubiello et al. (2023b). By aggregating the pixel-level information at national scale, it was therefore possible to generate country estimates of (i) mean cropland area A and associated uncertainty; (ii) cropland area by agreement class, SA1 to SA6, with SAk representing the area where k maps agreed, and A=Σk SAk (Fig. 1); and (iii) cropland area by specific map combinations.
Following the steps above, we generated values for over 221 countries and 34 territories, with country codes aligned to the standard M49 area codes classification.
In terms of simple agreement classes, SA1 represents the contribution to cropland area by single land cover products, while SA6 provides information on the contribution to cropland area when all six products agree. Similarly, for each agreement class SAk, data represent the contributions to total cropland area by all relevant combinations of k products. With respect to the two extreme cases, definitional bias would be small for SA6, with the CAM map likely estimating the sub-component temporary crops rather than cropland, since the former category would be the only one that could be detected by all land cover products. By the same token, definitional bias would be higher for SAk classes with lower k values and highest for SA1, with CAM including in such cases more sub-components of cropland that would not be equally detected by the underlying land cover products, e.g. temporary meadows and pastures or permanent crops. To this end, the CAM data on detailed cropland agreement provide additional information on which specific combinations of k land cover products contributed to class SAk in a given country. For example, the area of SA3 in country i could be the sum of agreement areas identified by GLAD-WorldCover-ESRI and GLAD-WorldCover-FROM_GLC.
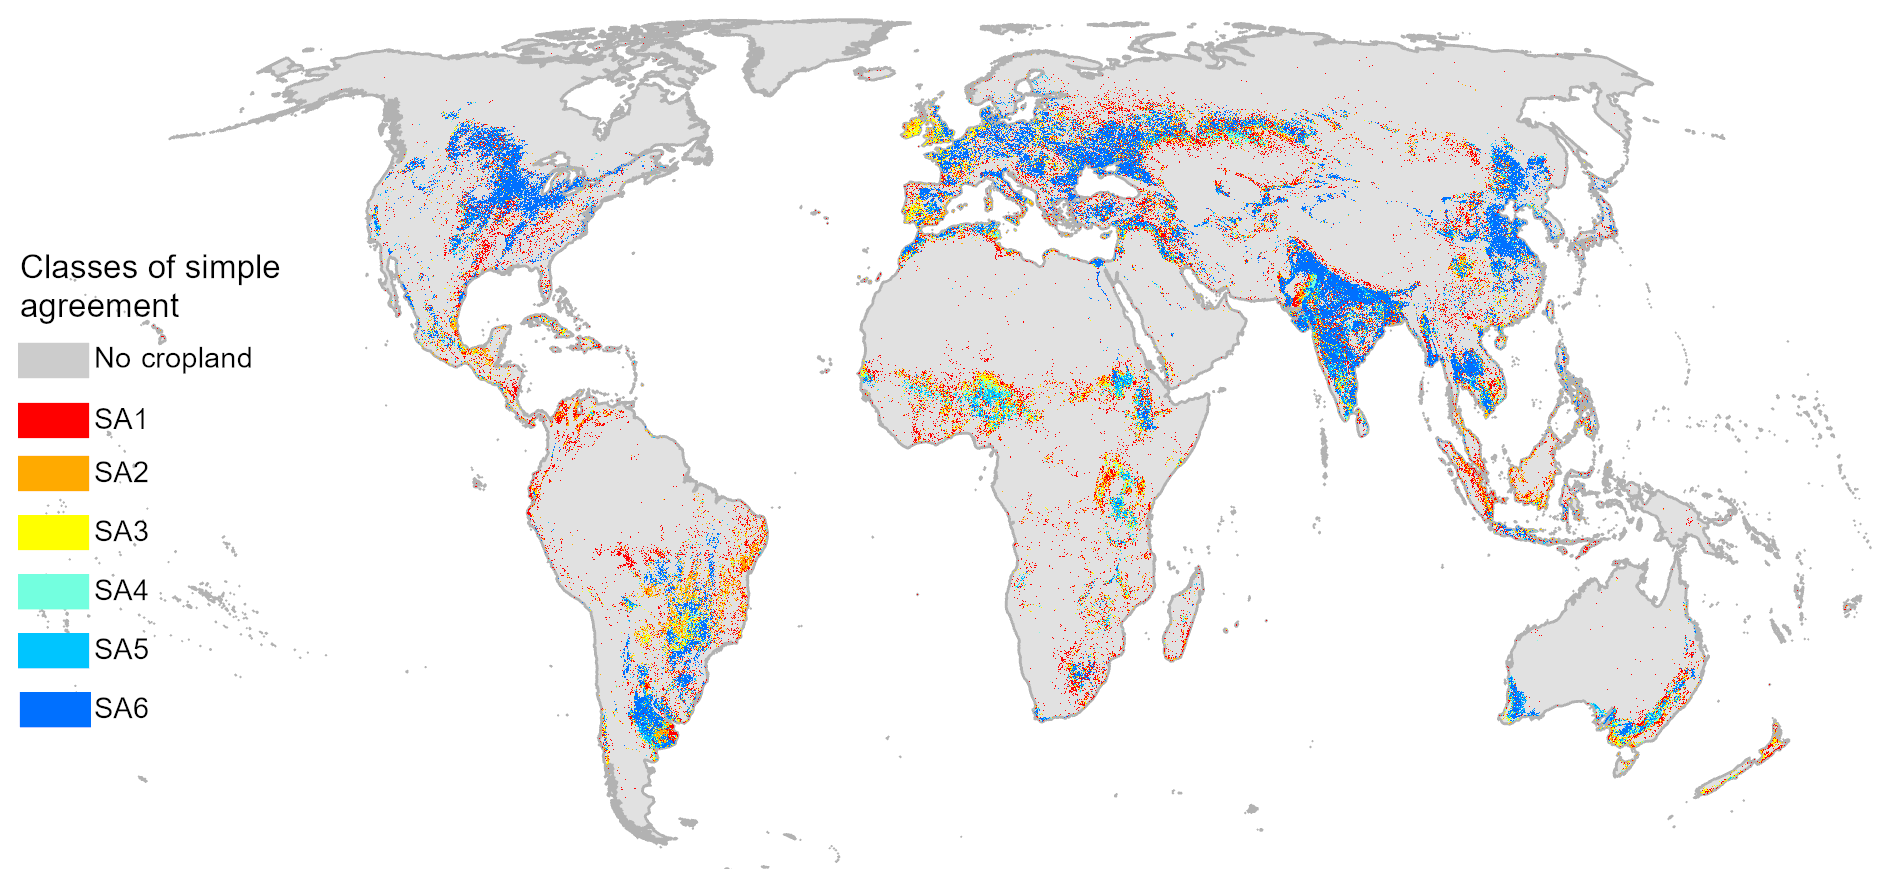
Figure 1Simple cropland agreement map. Adapted from Tubiello et al. (2023b).
2.3 Comparison with FAO land use statistics
FAO land use statistics of cropland and arable land are routinely used as a benchmark to assess the robustness of land cover information at various scales (Vancutsem et al., 2012; Yu et al., 2014; Pérez-Hoyos et al., 2017; Xu et al., 2019; Li and Xu, 2020; Potapov et al., 2022a). We compared the cropland area estimates of the CAM aggregation dataset against FAOSTAT (FAO, 2023) area statistics of cropland (Table 2), quantifying goodness of fit in terms of the coefficient of determination (R2) and a normalized root-mean-square error (NRMSE, expressed in percent and computed by dividing RMSE by the range of values). Possibly due to variations in land and water masks, many small island states were absent in one or more of the six land cover inputs used in CAM. To ensure consistency, a minimum cut-off value of 10 kha (kilohectare) of cropland was applied, resulting in 182 complete country records in CAM out of the total 221 countries covered.
Table 2FAO land use categories for cropland as defined in the FAO land use, irrigation and agricultural practices questionnaire (FAO, 2023).
2.4 Uncertainty and use of significant figures
The data made available through the CAM aggregation dataset are area estimates based on samples of size n=6 (one value per land cover map). Cropland area was thus estimated as , with x being the sample mean and u its uncertainty, defined herein as a 95 % confidence interval and computed as the estimated standard error of the mean multiplied by 2.57 – the corresponding value of the two-tailed t-test Student distribution for degrees of freedom. We reported results using only one significant figure for the uncertainty, following recommendations of the International Bureau of Weights and Measures (BIPM) for small sample sizes (BIPM, IEC, IFCC, ILAC, ISO, IUPAC, IUPAP, and OIML, 2009).
3.1 Cropland area
3.1.1 Global and regional results
CAM-aggregated data indicated a total world cropland area in year 2020 of 1500 ± 400 Mha, with a relative uncertainty of 27 %. Uncertainty was higher across regions – up to 50 % for Africa, Americas, Asia and Europe and up to 40 % for Oceania (Table 3). The world's cropland area was very close to and statistically consistent with the corresponding FAOSTAT value (1560 Mha). Comparisons of regional cropland area were also largely consistent with FAOSTAT, with R2=0.92 and a NRMSE of 8 % (Fig. 2). With reference to Table 3, only 3 cropland area estimates of the 18 world sub-regions considered were statistically inconsistent with FAOSTAT, namely, Middle Africa, where we computed 16±7 Mha vs. 37 Mha in FAOSTAT; Western Africa, 60 ± 20 Mha vs. 102 Mha in FAOSTAT; and Southeastern Asia, 80 ± 30 vs. 123 M ha in FAOSTAT. All 15 other sub-regional estimates had uncertainty bounds that contained the corresponding FAOSTAT values.
The uncertainty of CAM values was higher at regional compared to world level, i.e., up to 50 % in Central Asia, South America, and Southern Europe and up to 40 % in Australia and New Zealand, Southeastern Asia, and Southern Africa (Table 3). In absolute terms, South America had in addition the largest absolute uncertainty (80 Mha). Conversely, cropland area estimates with the smallest uncertainties (hence larger precision) were those for Southern Asia (13 %), Northern America (20 %), Northern Africa (24 %), and Eastern Europe and Western Europe (25 %).
Table 3Regional cropland area estimates in CAM (means and uncertainties) and FAOSTAT. Melanesia, Micronesia and Polynesia were excluded due to the cut-off country size used in this study.
3.1.2 Country results
CAM estimates also compared well with FAOSTAT statistics at country level. Overall, considering the 182 countries and territories with cropland area greater than 10 kha, CAM values were in good agreement with FAOSTAT data (R2=0.95; NRMSE of 3 %, or less than 5 Mha on average). In addition, CAM estimates were statistically consistent with FAOSTAT values for 114 of the 182 countries considered (Fig. 3). Conversely, among CAM estimates that were inconsistent with FAOSTAT data, relevant cases (cropland area > 1 Mha) were Colombia (4 ± 3 vs. 9 Mha), Côte d'Ivoire (3 ± 2 vs. 8 Mha), the Democratic Republic of the Congo (DRC) (5±5 vs. 15 Mha), Indonesia (20 ± 10 vs. 59 Mha), Malaysia (3±3 vs. 8 M ha), Niger (5 ± 4 vs. 18 Mha), Pakistan (21 ± 3 vs. 32 Mha) and the Philippines (6 ± 3 vs. 11 Mha). These highlight the need for further investigation of land cover maps and FAO statistics to better identify possible data quality issues.
Overall, the large range of uncertainties found in the CAM aggregate country data, 20 %–100 %, underscored a large variability across geographies in relation to (i) complexity of cropland landscapes and/or (ii) the ability of single land cover products to capture them consistently across regions. We note, nonetheless, that among the top five countries in terms of cropland area extent (i.e., Brazil, USA, China, India and the Russian Federation), only Brazil showed high uncertainty (50 %) (Fig. 3). Countries with estimated cropland area greater than 1 Mha and relative uncertainties of 100 % included Malaysia (3 Mha in absolute value), Nicaragua (2 Mha), Ireland (2 Mha), New Zealand (3 Mha), and the DRC (5 Mha) (see also Appendix C).
3.2 Simple cropland agreement
3.2.1 Regional results
The CAM map and aggregation dataset complement the information on cropland area with knowledge of the contribution by agreement class. This information provided useful insights into some of the findings highlighted above. First, the data show that the top agreement class, SA6, was in general the larger contributor to the estimated cropland area at regional level, with the exception of Africa (Fig. 4). This indicated that the underlying land cover maps were capable of mapping cropland rather consistently in most regions. More specifically, the sub-regions with the highest contribution of agreement class SA6 (> 0 %) were Northern America (SA6>62 %), Eastern Europe (SA6>58 %), Western Europe (SA6>56 %) and Southern Asia (SA6>56 %) (Appendix C, Table C1).
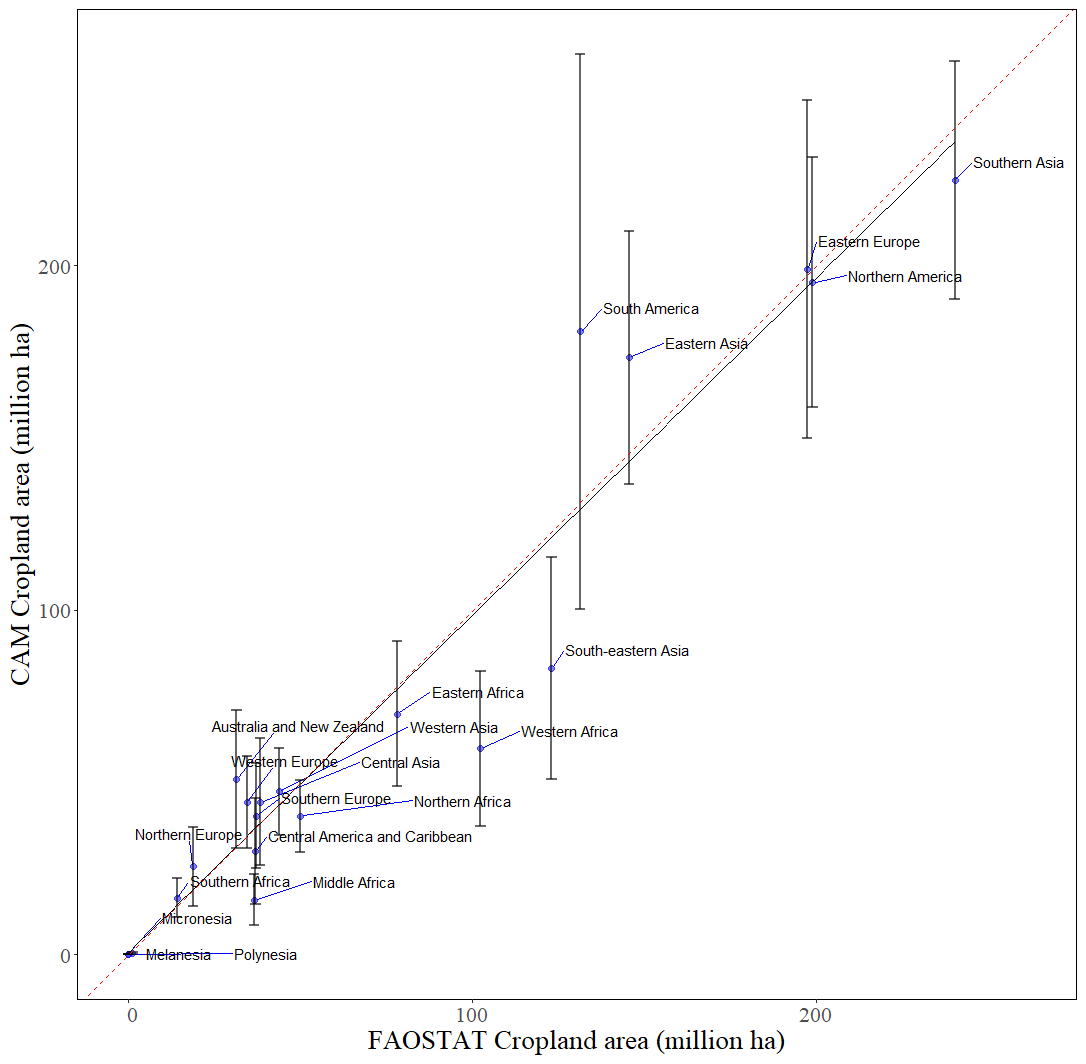
Figure 2Regional comparisons between CAM and FAOSTAT data (R2=0.92; NRMSE = 8 %, p value < 0.001). The dotted red line shows the perfect 1:1 relationship, while the black line shows the linear regression line of the points.
The large contribution of SA6 was consistent with the prevalence of simpler cropland landscapes in those regions; for instance, landscapes characterized by large fields with high-input and often irrigated annual crops. Conversely, the lowest contributions of SA6 to cropland area were estimated in Middle Africa (2 %), Western Africa (5 %) and Eastern Africa (10 %), followed by regions with shares of a quarter to a third, i.e., Central America (25 %), Southern Africa (28 %), Northern Africa (29 %), Central Asia (32 %), and Australia and New Zealand (33 %). By the same reasoning as above, low shares of SA6 were indicative of regions with a prevalence of more complex agricultural mosaics – including in particular more traditional low-input systems. The latter characterize agriculture in Eastern Africa, Middle Africa and Western Africa regions. CAM-aggregated data show that, unlike all other regions, in these three regions the SA6 contribution to cropland area was in the single digits and far smaller than contributions from other agreement classes (Appendix C, Table C1).
In terms of high SA6 contributions to the regions identified above, it is likely that the underlying land cover products were mapping temporary crops or arable land at country level rather than cropland area, as also suggested by Tubiello et al. (2023b). These are in fact the specific sub-components of cropland included in all their definitions. Conversely, low SA6 shares point to complex and fragmented agricultural landscapes in specific regions, where land cover products are likely to disagree. Indeed, we tested a possible relation between relative uncertainty in regional cropland area estimates and the level of contribution of top agreement classes (combined area of SA4, SA5 and SA6) and found good correlation between the area uncertainty and the percent contribution to cropland area of the top three agreement classes (Fig. 5).
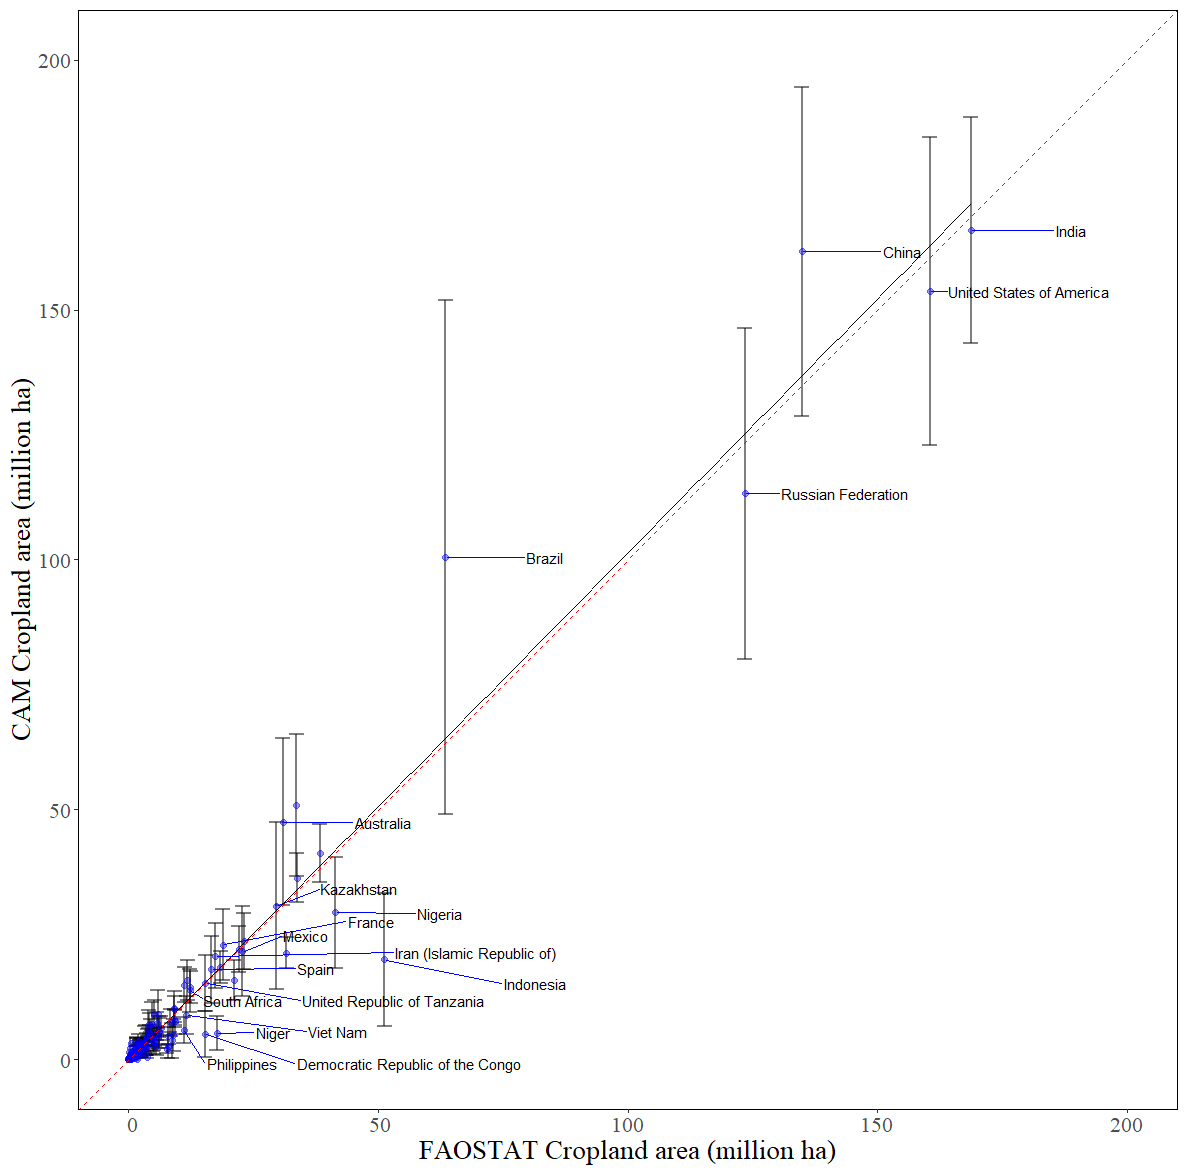
Figure 3Country comparisons between CAM and FAOSTAT (R2=0.95; NRMSE = 3 %, p value < 0.001). The dotted red line shows the perfect 1:1 relationship, while the black line shows the linear regression line of the points.
3.2.2 Country results
We extended the above analysis based on simple agreement classes to countries. The CAM country data confirmed the regional analysis of a strong link between simple cropland landscapes and prevalence of the SA6 contribution to total cropland area. Only five countries globally had SA6>65 %, of which four were in Eastern Europe: Ukraine (75 %), Bulgaria (70 %), Hungary (70 %), the Republic of Moldova (67 %) and Canada (67 %). Cropland in these countries is indeed dominated by large agricultural fields of annual crops that are easy to recognize from space (FAO, 2023). In Ukraine, the top three agreement classes contributed to 90 % of the cropland area. Virtually the same features applied to other countries in Eastern Europe and Central Europe, specifically Czechia (64 %), Slovakia (64 %), Romania (63 %), Serbia (62 %), Germany (62 %) and Poland (61 %), as well as in France and Austria, where it exceeded 50 %.
Outside of Europe, Canada and the USA also had substantial proportions of SA6 in their cropland areas, accounting for 67 % and 61 %, respectively. In Central Asia, Turkmenistan and Uzbekistan show values comparable to Western Europe countries, with 52 % and 57 %, respectively. In Southeastern Asia, large agreement in cropland classification is found in India (58 %), Pakistan (63 %), Bangladesh (56 %), and Thailand (57 %). Among African countries, Egypt stood out as the only one with a significant share from SA6 (62 %), likely due to the presence of the irrigated fields along the Nile and of pivot irrigation schemes against an otherwise arid landscape, which were well captured by the six classification algorithms.
Similarly and consistently with the regional findings, the CAM country data likewise suggested a relation between complexity of cropland landscapes and low SA6 contribution. Indeed, of the 17 countries with SA6 contribution below 10 % and cropland size above 5 Mha (threshold chosen arbitrarily), 14 were located in Eastern Africa, Middle Africa or Western Africa, including Burkina Faso, Niger, and the DRC (0 % SA6 contribution, implying no agreement across the six maps in any pixel) and Mozambique, Mali, and Uganda (1 %).
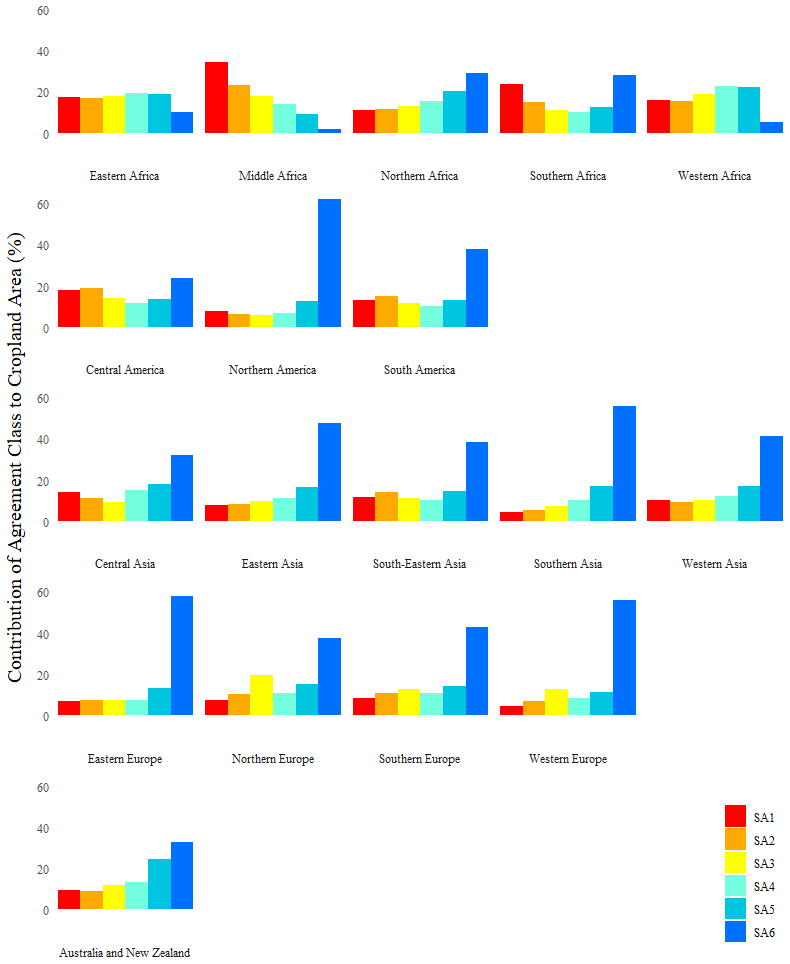
Figure 4Percentage contribution to cropland area by simple cropland agreement, by sub-region.
Finally, the highest uncertainties in estimated cropland area corresponded to high disagreement of the underlying land cover maps, expressed herein as the fraction covered by SA1>80 %. These country cases included Papua New Guinea and Sierra Leone (SA1=90 %) (Appendix C, Table C2). The difficulties to map the fragmented and heterogeneous agricultural landscapes that prevail in these countries likely contributed to this feature (Potapov et al., 2022b). In addition, in Papua New Guinea, cropland is dominated by permanent crops (FAO, 2023), which most CAM input layers do not include in their definitions. This means that in such countries CAM is mapping arable land rather than cropland.
Similar yet more complex dynamics were associated with country cases with 100 % uncertainty in the CAM cropland estimates (Fig. 6). Two typologies could be identified among countries with cropland area > 1 Mha (Appendix C, Table C2). The first country case was characterized by high SA1 percent contribution to total cropland area and included Nicaragua (50 %), DRC (49 %) and Malaysia (36 %). As in the previous cases, dominance of the SA1 class was linked to complex landscapes within cropland, which could not be mapped precisely, leading to high uncertainty. In particular, Malaysia was characterized by a large presence of permanent crops, which was not mapped by all products. The second typology was characterized by high SA3 percent contributions to total cropland area and included Ireland (54 %) and New Zealand (36 %). In both cases, despite little presence of permanent crops, disagreement across land cover products persisted. We speculated that SA3 prevalence was linked to the presence of crop/pasture mixtures within cropland; in fact, large shares of temporary meadows and pastures within arable land – a well-known landscape in both countries – which are mapped only by a subset of the underlying land cover products, generate high uncertainty as in the previous case but for different reasons.
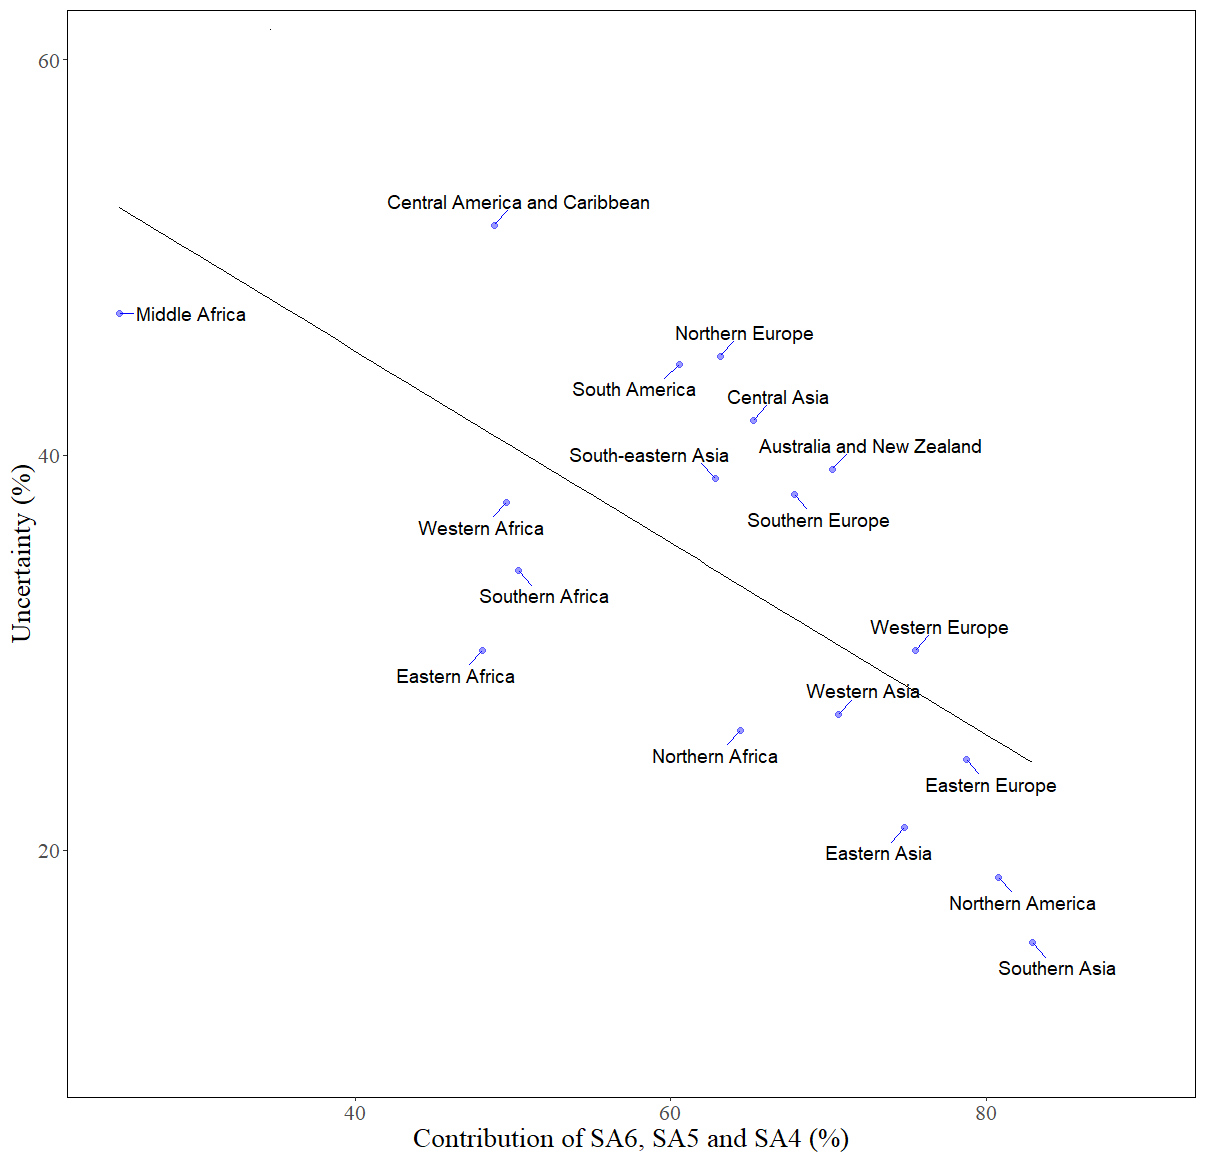
Figure 5Linear regression of relative uncertainty in regional cropland area estimates against percent contribution to same cropland area by top-three agreement classes (R2=0.46, NRMSE = 64 %, p value < 0.005).
3.3 Detailed cropland agreement
3.3.1 Regional results
To gain further insight into the relationship between mapping uncertainty and landscape complexity, we looked at the detailed contribution of single CAM land cover maps to SA1 contributions, by region, where SA1 represents the areas with minimum agreement across land cover products. All detailed combinations at both regional and country levels are available in the CAM aggregation dataset (Tubiello et al., 2023a) but are too large to be discussed here in its entirety. We limited the discussion here to the larger FAO regional groups and to notable country examples among those presented earlier.
Regionally and with reference to Fig. 7, GLAD contributed to SA1 from less than 1 % in Europe to about 5 % in Africa; WorldCover contributed from 1 % in the Americas, Europe and Oceania to 9 % in Africa; and ESRI contributed from 4 % in Europe to 11 % in Oceania. Most contributions to SA1 were instead from FCS30 (from 23 % in Africa to 60 % in Oceania); Globeland30 (from 23 % in Oceania to 53 % in Europe); and FROM_GLC (from 30 % in Africa to 8 % in Oceania).
The regional analysis of the detailed agreement singles out FCS30 and Globeland30 as the land cover products in the CAM map and dataset with the largest contributions to disagreement across regions, which is consistent with the fact that these are the only maps that include permanent crops and hence larger portions of cropland in their definitions. Conversely ESRI, GLAD and WorldCover were the least contributors to disagreement, in line with their definitions, which focus on herbaceous crops within cropland landscapes. The FROM_GLC was an intermediate case, which is consistent with its inclusion of shrub crops within its definitions.
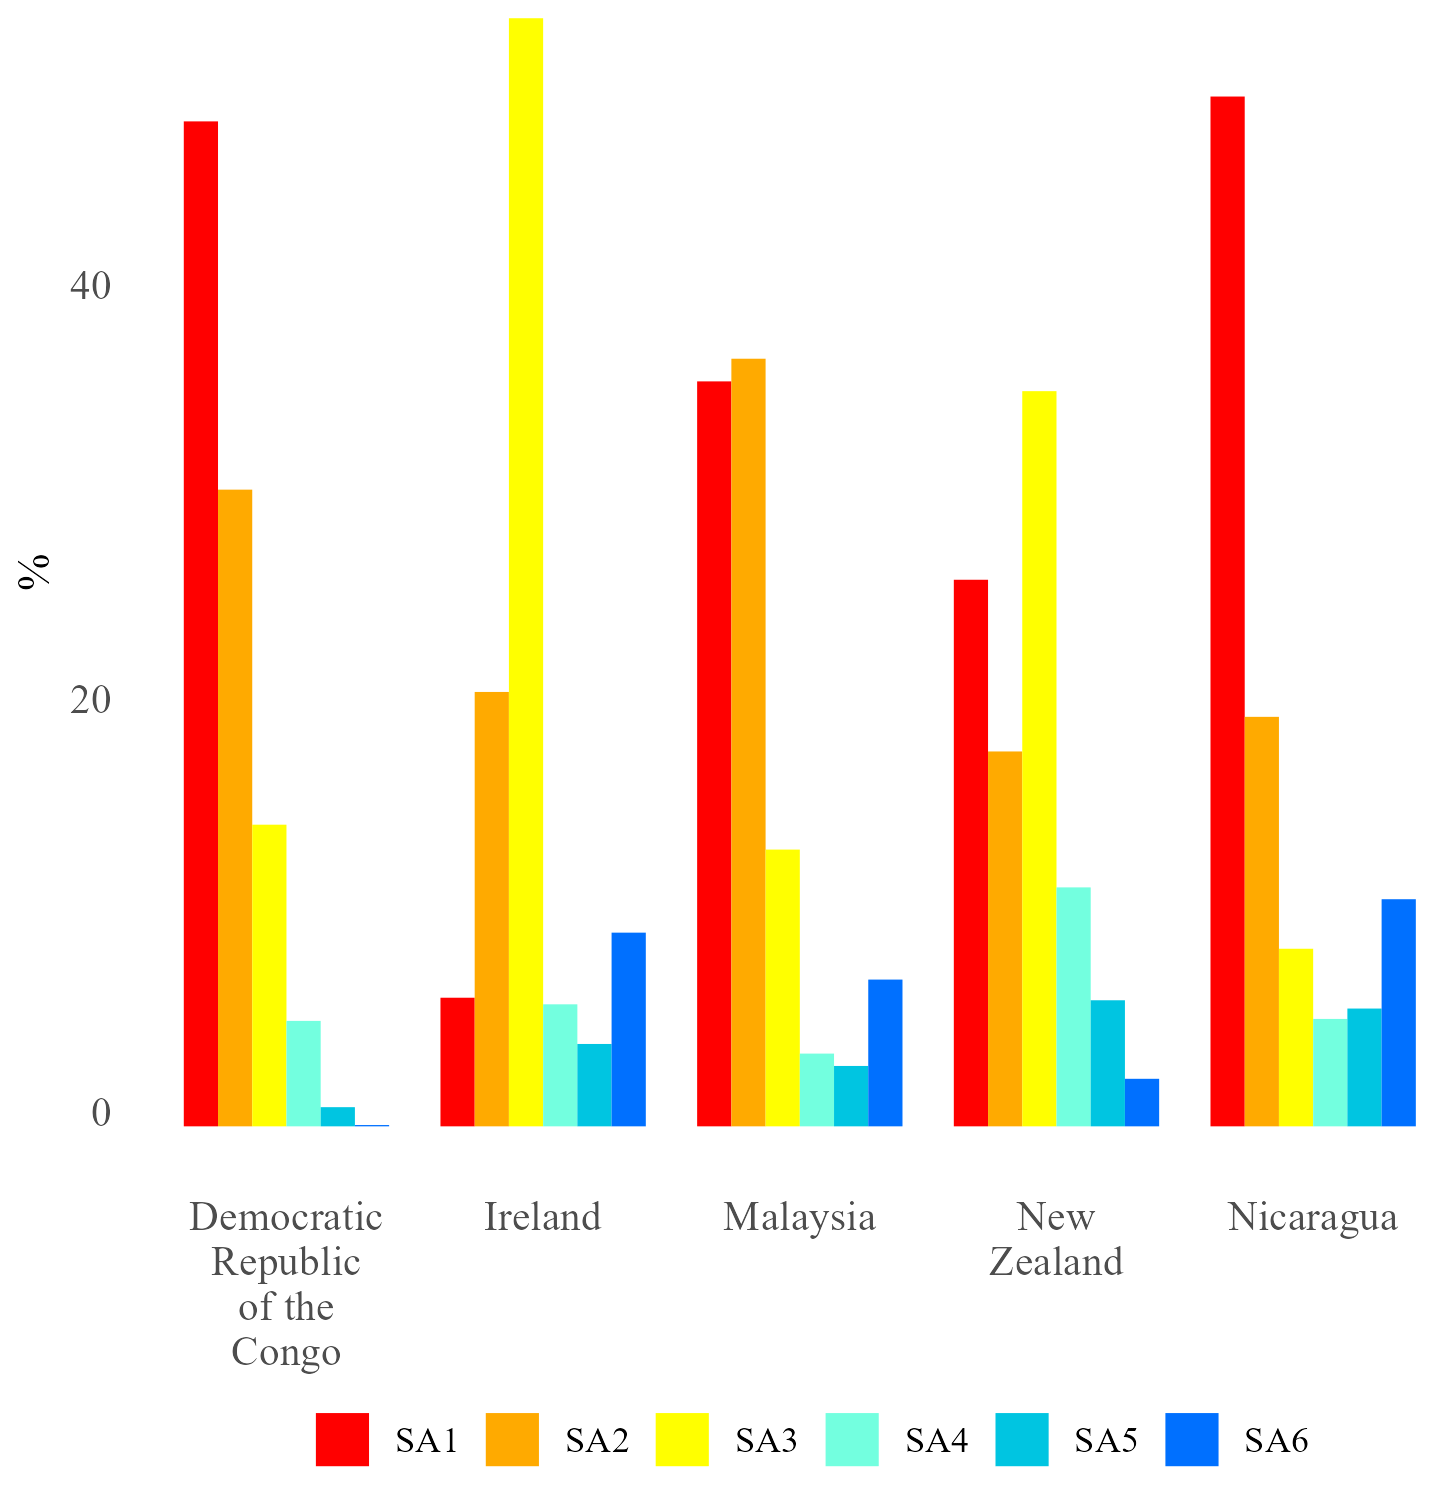
Figure 6Contribution to cropland area by cropland agreement class in five countries with 100 % uncertainty and cropland area > 1 Mha.
3.3.2 Country results
In our earlier observations, we highlighted that Ireland and New Zealand had the largest contribution of SA3, accounting for 54 % and 36 %, respectively. This indicated that, on average, half of the land cover products in CAM agreed on mapping cropland. The detailed cropland agreement data in CAM showed that in both countries this outcome was due to a fixed combination of just three products: ESRI-FCS30-Globeland30 (Fig. 8). These were in fact the only land cover products in CAM that include pastures or generic herbaceous cover within their cropland definition, supporting our hypothesis that the prevalence of SA3 was linked to extensive areas of pastures within cropland, indeed typical of both countries' agricultural landscapes. Additionally, for New Zealand, the detailed agreement data indicated that FSC30 and FSC30-GL30 were behind the SA1 and SA2 contributions to cropland area in the country. This was consistent with a significant presence of permanent crops in the national agricultural landscape, as both products were the only ones in CAM that could capture permanent crops within cropland area.
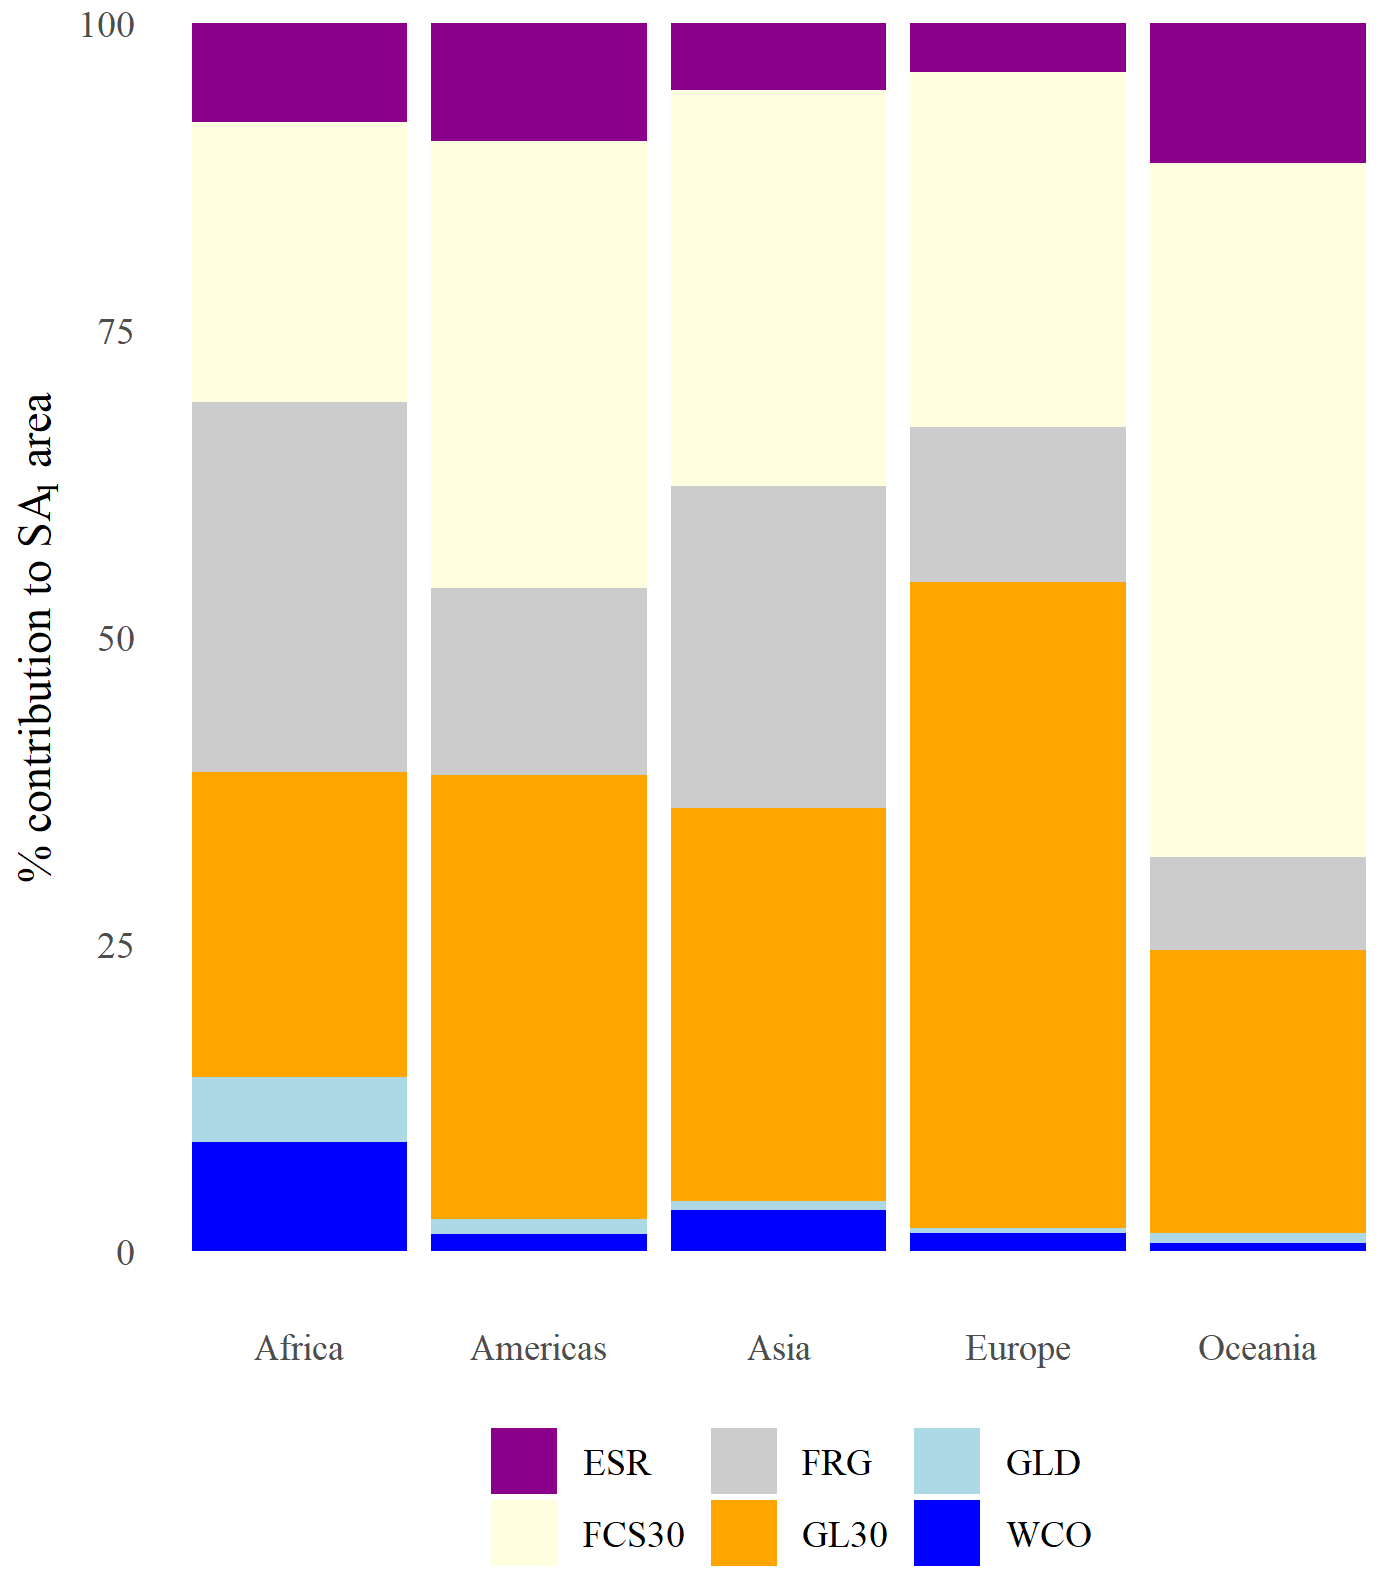
Figure 7Percent contribution to minimum cropland agreement area (SA1) by input land cover product and region (ESR = ESRI; FCS30 = GLC_FCS30-2020; FRG = FROM_GLC Plus; GLD = GLAD; GL30 = Globeland30; WCO = WorldCover).
For DRC, Malaysia and Nicaragua (Fig. 9), countries characterized by cropland area estimates with very high uncertainty and a dominance of the SA1 class, the information provided by the detailed agreement data in CAM indicated that FCS30, GL30 and FRG were the land cover products mainly contributing to SA1. As discussed above, FCS30 and GL30 were the only two products in CAM that included permanent crops in their definitions. They were compared in eight out of nine SA1 combinations in DRC, in seven out of eight in Malaysia, and in five out of six combinations in Nicaragua (shown in Fig. 9), which is consistent with the large presence of permanent crops in these countries.
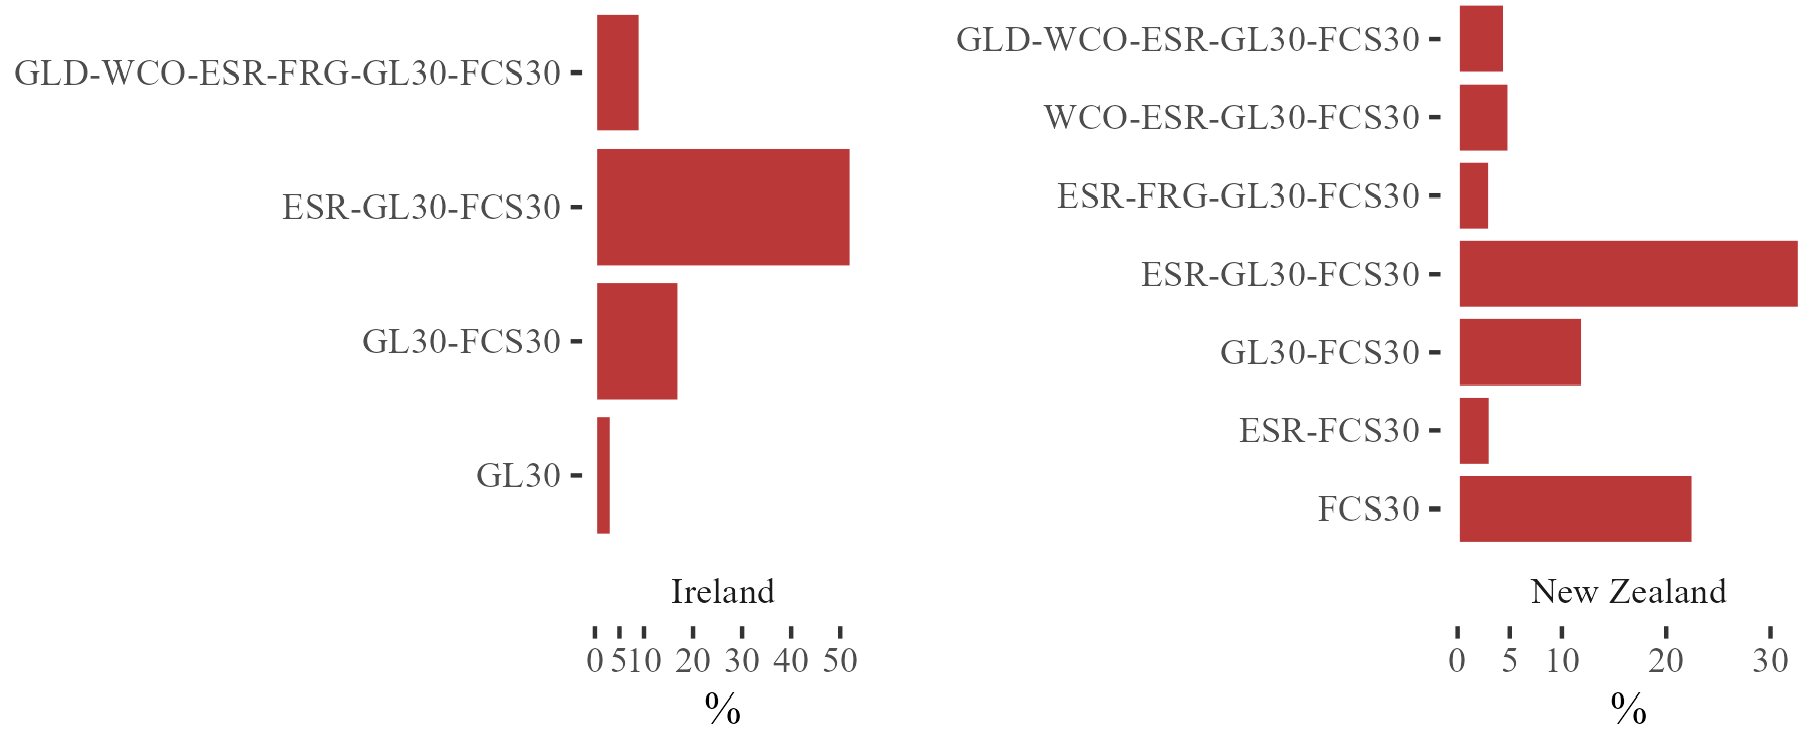
Figure 8Percent contribution of product combinations to the detailed agreement in Ireland and New Zealand. (Detailed agreement is limited to land cover combinations with at least 3 % contribution. ESR = ESRI; FCS30 = GLC_FCS30-2020; FRG = FROM_GLC Plus; GLD = GLAD; GL30 = Globeland30; WCO = WorldCover).
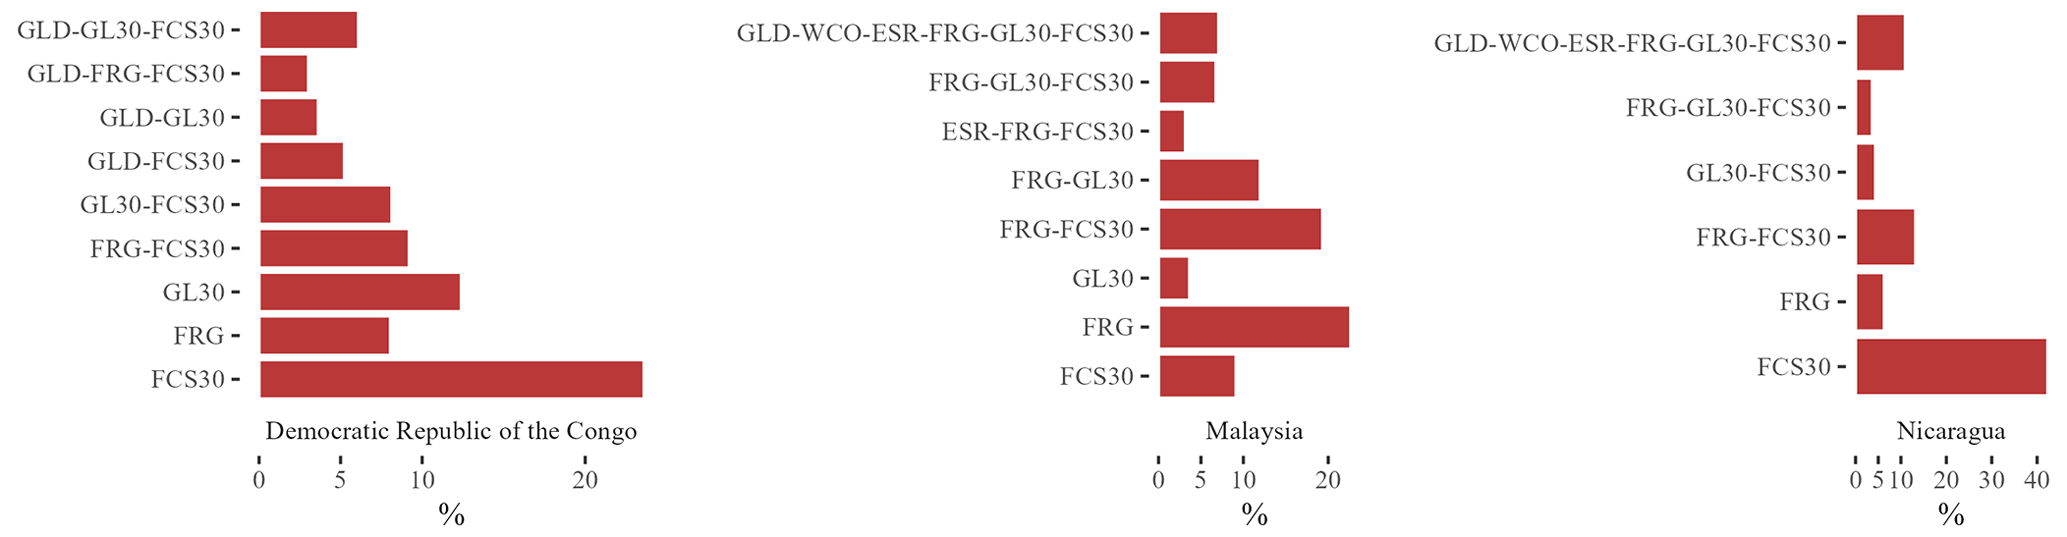
Figure 9Percent contribution of product combinations to the detailed agreement in the Democratic Republic of the Congo, Malaysia and Nicaragua. (Detailed agreement is limited to land cover combinations with at least 3 % contribution. ESR = ESRI; FCS30 = GLC_FCS30-2020; FRG = FROM_GLC Plus; GLD = GLAD; GL30 = Globeland30; WCO = WorldCover).
The CAM aggregation dataset represents a novel global reference and knowledge product of the cropland area as well as a useful complement and guide for spatial applications of the CAM map (Tubiello et al., 2023b). For instance, and unlike the underlying land cover maps applied in its synthesis, the CAM dataset includes the uncertainty of cropland area estimates by country worldwide. By highlighting areas with lower consensus among the six cropland maps, it can thus guide and support the targeting of areas in need of more in-depth spatial analysis. By the same token, thanks to the high spatial resolution and global coverage, pixels with higher agreement may support the development of global training datasets in machine learning approaches for future efforts of cropland mapping.
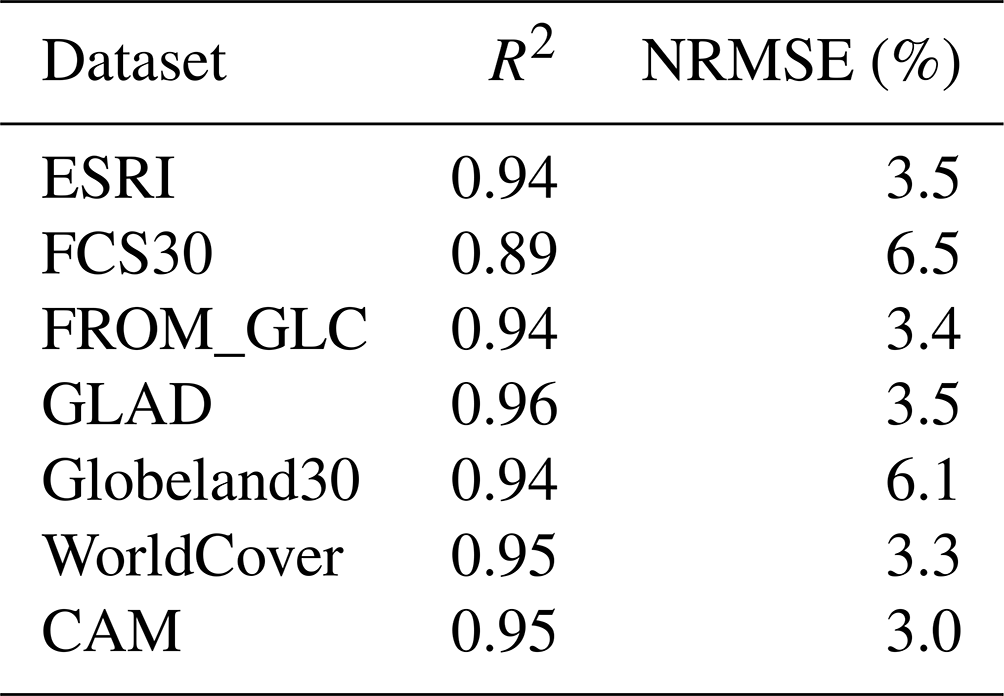
In constructing the CAM map and the CAM aggregate dataset, we assumed that pixels and areas with higher agreement – corresponding in our approach to simple agreement classes SA4 to SA6 – have a higher likelihood to represent, indeed, cropland. The six cropland maps used in the construction of the CAM map differed by their operational definitions. Hence, we also assume that areas with a larger consensus represent cropland types and agricultural landscape that are common to the six cropland maps. The temporary crops (annual herbaceous crops) coincide with this core, common definitional component. Our tests (Appendix D, Fig. D1) provided statistical confirmation of this hypothesis, although actual ground verification would be required for a conclusive assessment. The interpretation of pixels and areas with agreement classes SA3 and below is instead less straightforward. A lower consensus may result from the errors of omissions and commissions that characterize each layer, their uneven accuracy across regions and in large countries, and also to the differences in definitions (or often a combination of all these elements). We acknowledge the fact that the six land cover layers suffer from inaccuracies across regions, but we maintain that our synthetic approach may help with reducing the errors of input datasets. For instance, when comparing country statistics from each input layer and from CAM with FAOSTAT cropland areas, we observed the lowest NRMSE for the CAM-aggregated dataset (Appendix D, Table D1). The detailed agreement data, whereby we provided granular information on the agreement between each land cover product and their specific combinations, can help to disentangle these more complex situations at multiple scales.
The CAM map and dataset currently provide information circa 2020. However, some of the maps used in our synthetic product (e.g., ESRI, GLAD, WorldCover, and Globeland30) already include multi-year information and are expected to provide yearly land cover data on a regular basis. These future developments together with the addition of new cropland layers such as the WorldCereal of the European Space Agency (Van Tricht et al., 2023), when made operational on an annual basis, may also provide opportunities for the analysis and understanding of cropland trends.
The CAM aggregation dataset is publicly available on Zenodo at https://doi.org/10.5281/zenodo.7987515 (Tubiello et al., 2023a).
The CAM aggregation dataset presented herein consolidates information from six high-resolution global cropland maps circa 2020 currently available in the literature, using a meta-analysis approach to estimate cropland area and its uncertainty at country level, with data for 221 countries and territories and 34 regional aggregates. The CAM data are complemented by ancillary data on simple and detailed agreements of the underlying land cover products, with the same country and regional coverage. To our knowledge, this is the first time that such country information is presented in the literature.
The global regional and country examples provided in this work demonstrate the usefulness of the CAM aggregation dataset to assess current knowledge on cropland area in countries as available from land cover maps, highlighting how they agree or disagree on specific agricultural landscapes, depending on individual accuracy but also and, importantly, on definitional differences. In particular, the data highlighted critical connections between the level of complexity in the observed agricultural landscape and the preponderance of specific cropland agreement classes. We showed that high agreement among land cover products corresponded to large-scale fields with high input annual crops, hence cropland areas dominated by temporary crops, while minimum agreement tended to correspond to the presence of more complex cropland landscapes, be it tree plantations in Africa, Southeastern Asia and South America or mixed crop–pasture systems, such as in Ireland and New Zealand.
The CAM aggregation dataset represents a new global knowledge product, and it can serve as a useful guide to support future land cover and land use product development and data evaluation.
The six cropland layers that contribute to CAM include one thematic cropland product and five global land cover products, all containing one or multiple cropland classes (Table A1). GLAD, the thematic cropland map, uses images of multiple years (2016–2019) to create a single cropland map; a similar approach is used by FROM_GLC, Globeland30 (4 years) and FCS30 (3 years), while ESRI and WorldCover use 2020 images. ESRI and Globeland30 make use of a combination of pixel- and object-based classification methods, whereas the other products use pixel-based supervised classification approaches. Of the CAM components, WorldCover was openly available from the Earth Engine Data Catalog, while the other datasets were available through assets created by individual users in the GEE environment.
Table A1Technical specifications of six land cover maps used as input in CAM maps (Tubiello et al., 2022, 2023b) and underlying information in the CAM aggregation dataset (Tubiello et al., 2023a).
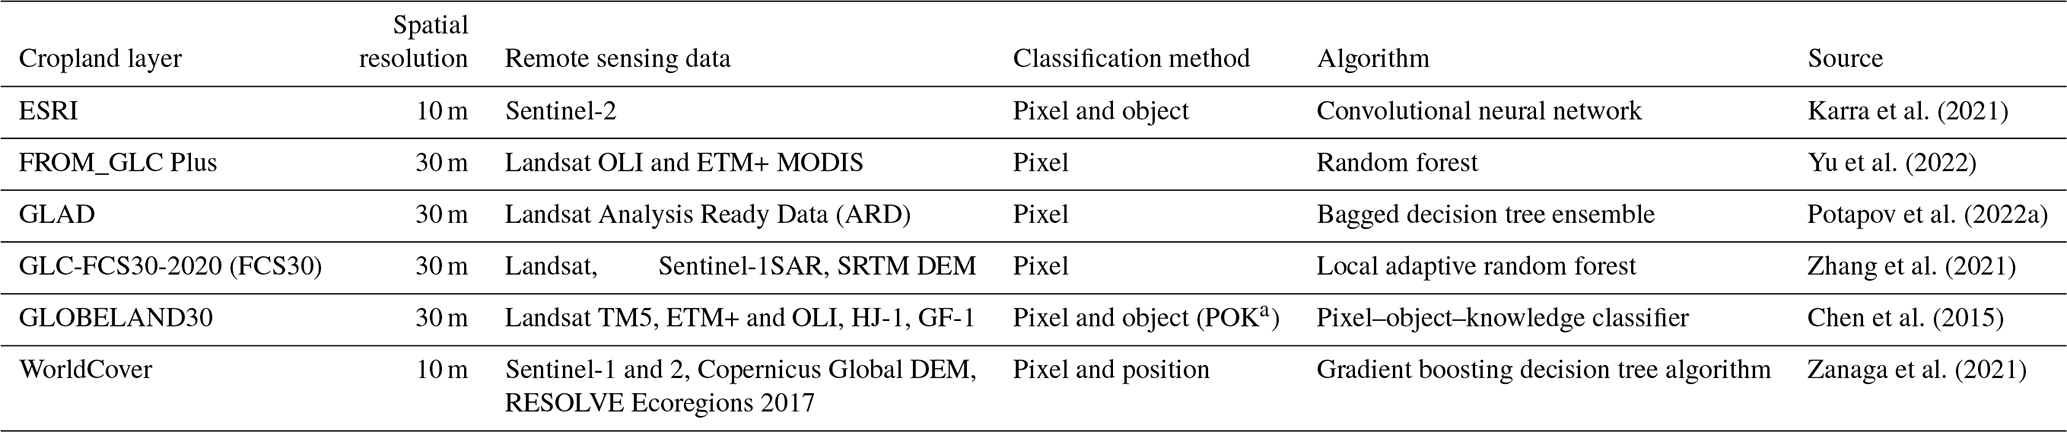
a Pixel- and object-based methods with prior knowledge. OLI is Operational Land Imager. ETM+ is Enhanced Thematic Mapper Plus. SRTM is Shuttle Radar Topography Mission
Spatial consistency and similarity of the six input layers in CAM were investigated by following the methods in Liu et al. (2021). A total of 30 000 random points among non-zero cropland values were selected, and cropland area fractions for each agreement layer were used separately for all pixels within an area of 5×5 km around each random point. Areas of overlap were excluded from the analysis. This produced approximately 28 000 data points for each layer containing the location and cropland area fraction. Scatterplots were created where the cropland area fraction was plotted for each dataset pair. This allowed for a comprehensive analysis of the spatial similarity among datasets. The pixel-level comparison yielded the best agreement between GLAD and WorldCover (R2=0.79; RMSE = 0.15), followed by WorldCover and ESRI (R2=0.61, RMSE = 0.23), and ESRI and GLAD (R2=0.58, RMSE = 0.24). On the contrary, lowest R2 is found between FROM_GLC and Globeland30 (R2=0.26, RMSE = 0.36) and FROM_GLC and FCS30 (R2=0.33, RMSE = 0.32), even though in absolute terms these products all mapped the largest global extents (Table A2). Overall, there is a clear separation between the three products that correlate well with one another (WorldCover, GLAD and ESRI) and the other high-resolution products. On the other hand, both Globeland30 and FCS30 have values that are almost consistently higher than in GLAD. This suggests that there are many regions which are classified as cropland for Globeland30 and FCS30 where GLAD but also WorldCover and ESRI show no presence for cropland (Fig. A1 for pixel-comparison of GLAD with the other six land cover maps).
Table A2Pixel-level correlation (R2) between the six cropland datasets; RMSE is given in brackets (values computed from fraction of the cropland area).
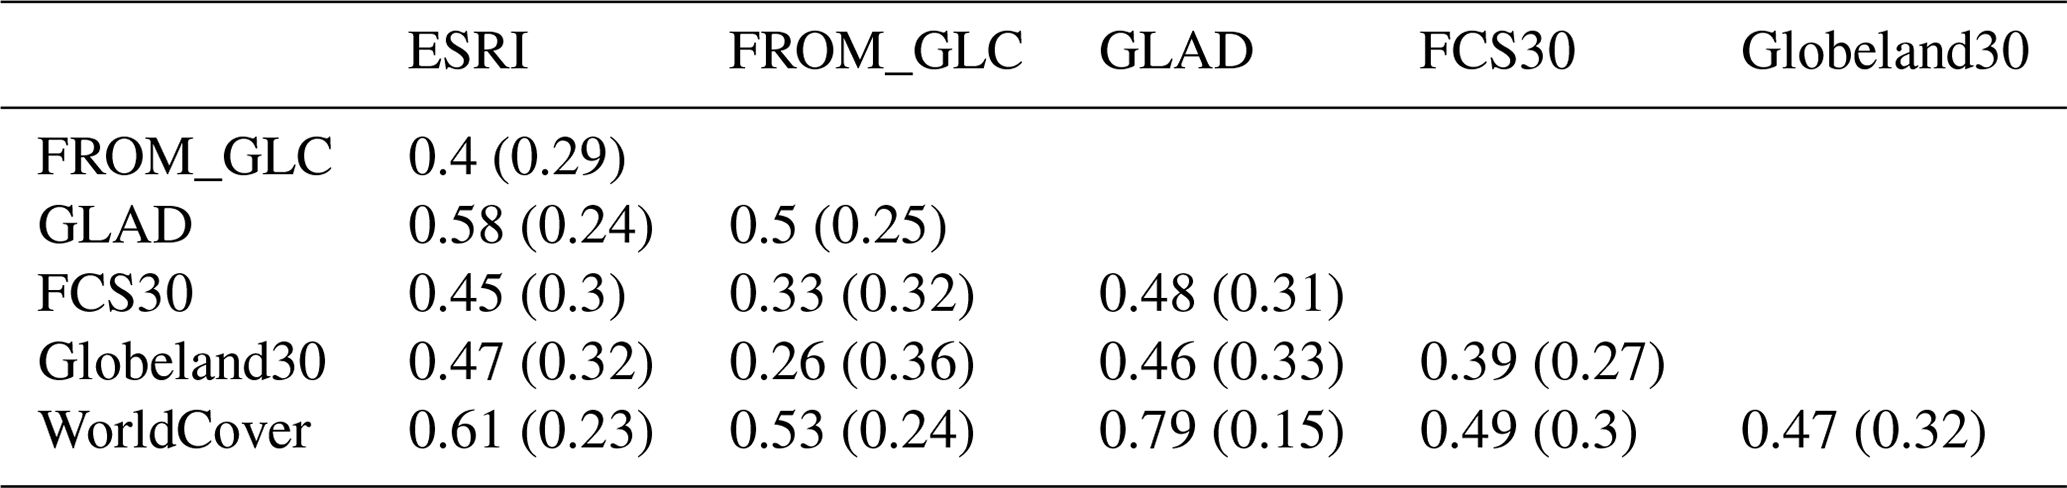
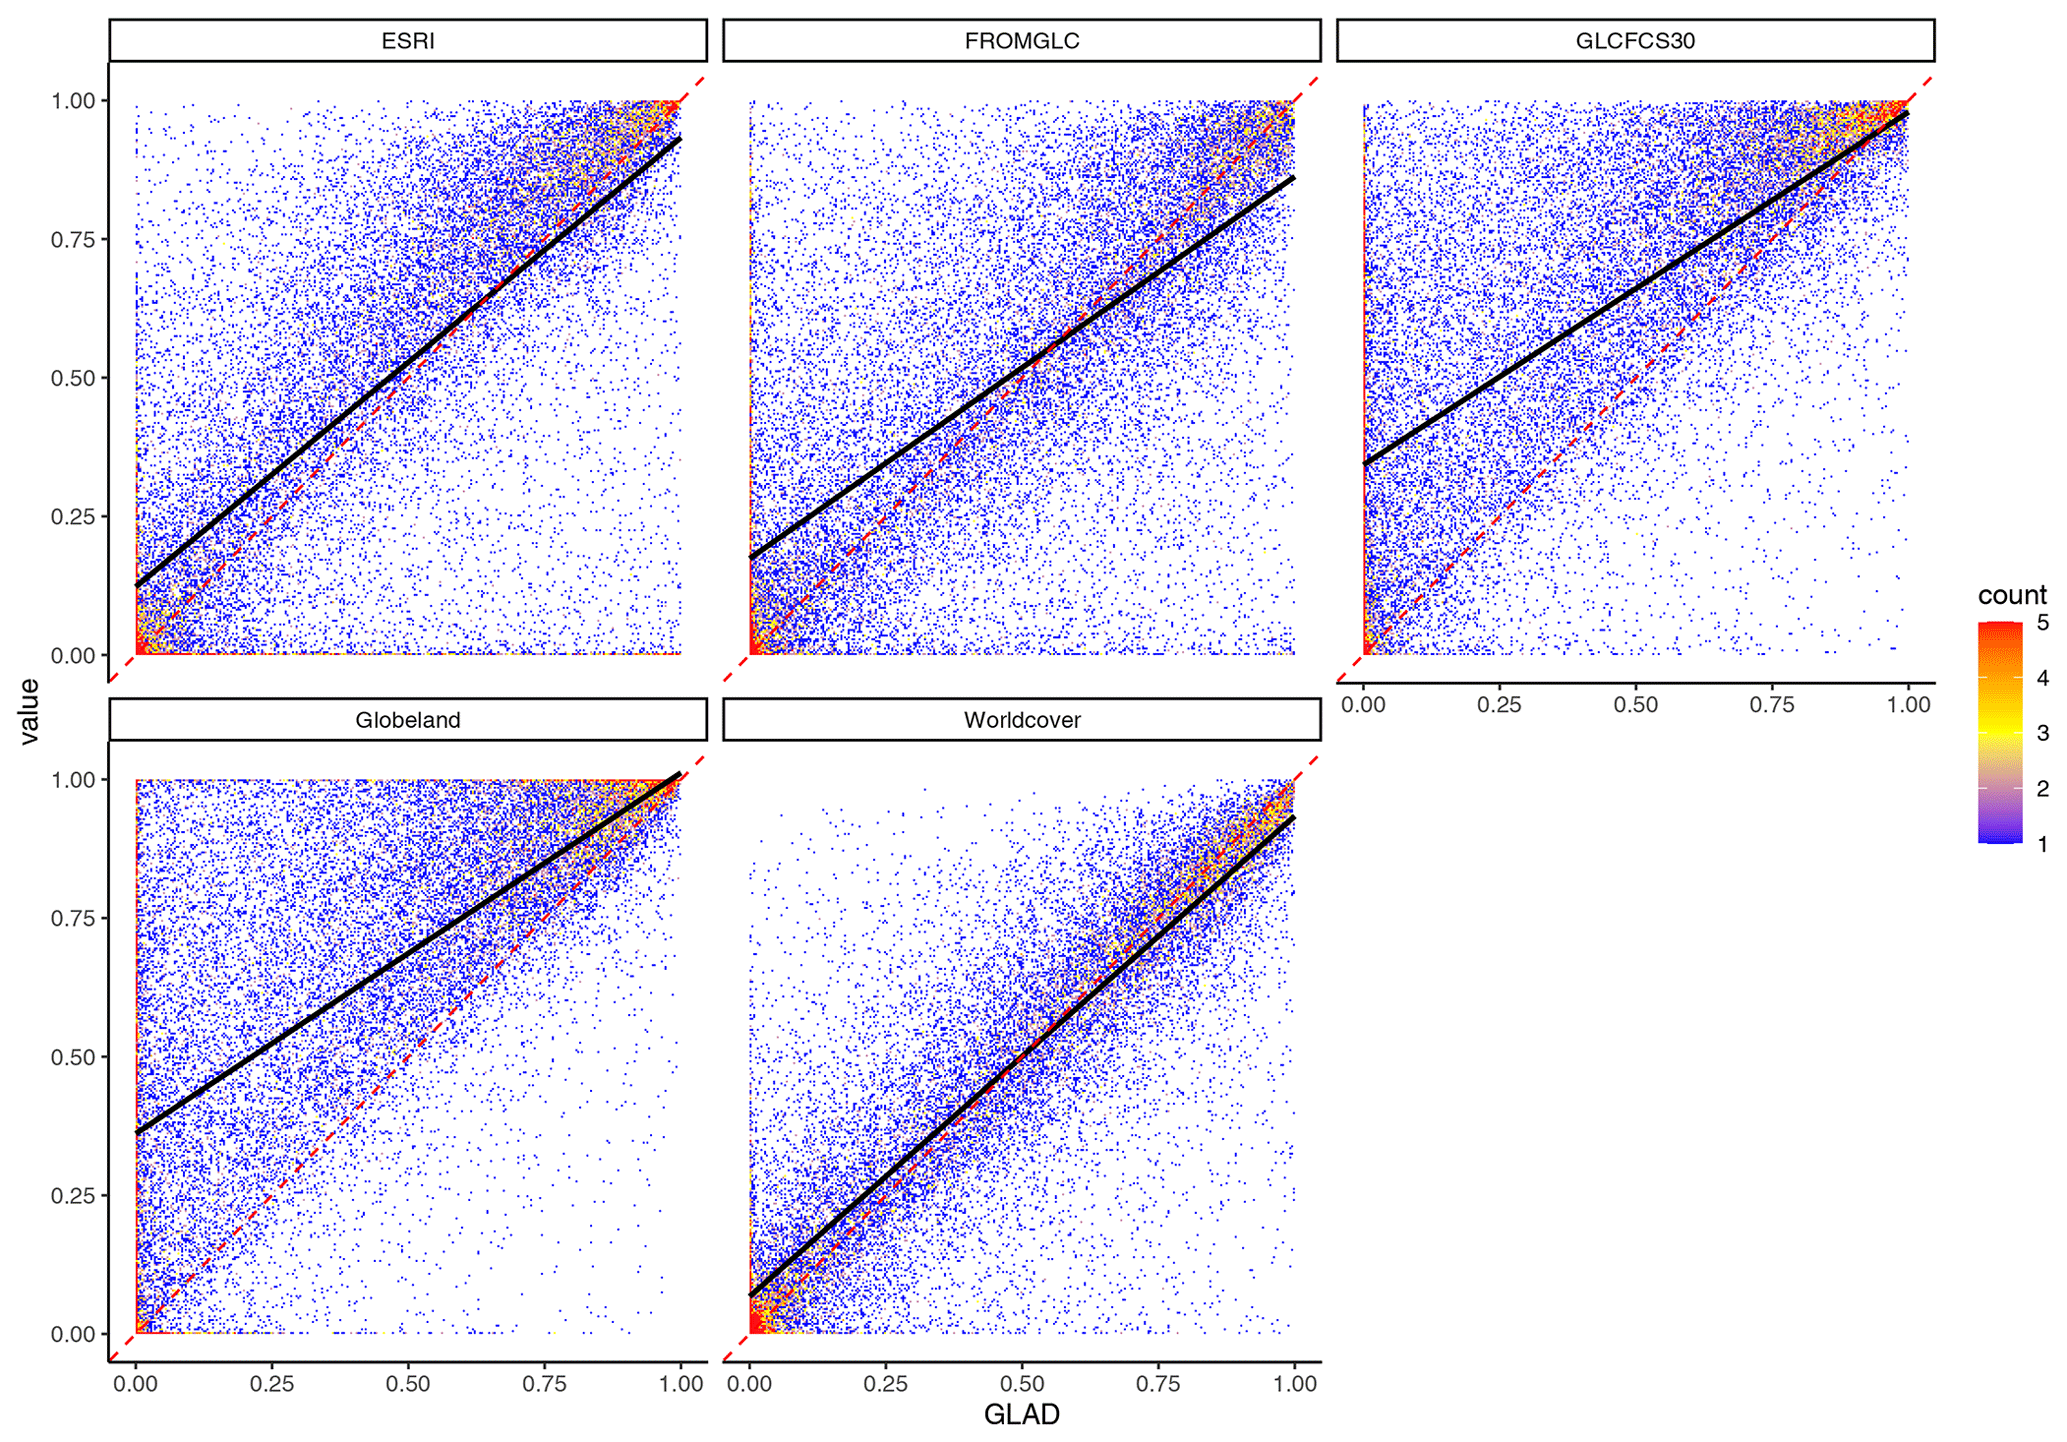
Figure A1Density scatterplot of correlation between GLAD and the 5 other cropland datasets. The color of the points indicates the number of scatter points in that location. The black line depicts the regression line, while the red line shows the optimal 1:1 relationship.
Binary similarity and distance measures are helpful tools in analysis of patterns and clustering (Choi et al., 2010). The detailed agreement allows us to extract information on the binary instances between two cropland layers and to define for each country their intersections and their mismatches. We computed the Baroni similarity index (Baroni-Urbani and Buser, 1976) from country statistics of the detailed agreement. The Baroni similarity index ranges between 0 (no attributes in common between pairs of land cover products) and 1 (perfect overlap), and it thus accounts for both positive – that is, where two layers agree on the presence of cropland – and negative matches, corresponding herein to areas where two layers agree on the absence of cropland. The normalized index was computed as follows:
where i and j are cropland layers, A is the area that both layers mapped as cropland, B is the area of cropland mapped by the first layer only; C is the area of cropland mapped by the second layer only, and D is the country area that both layers agree is not cropland. In the analysis, the total A + B + C + D corresponds to the total land area (see Table A3 for regional and global results).
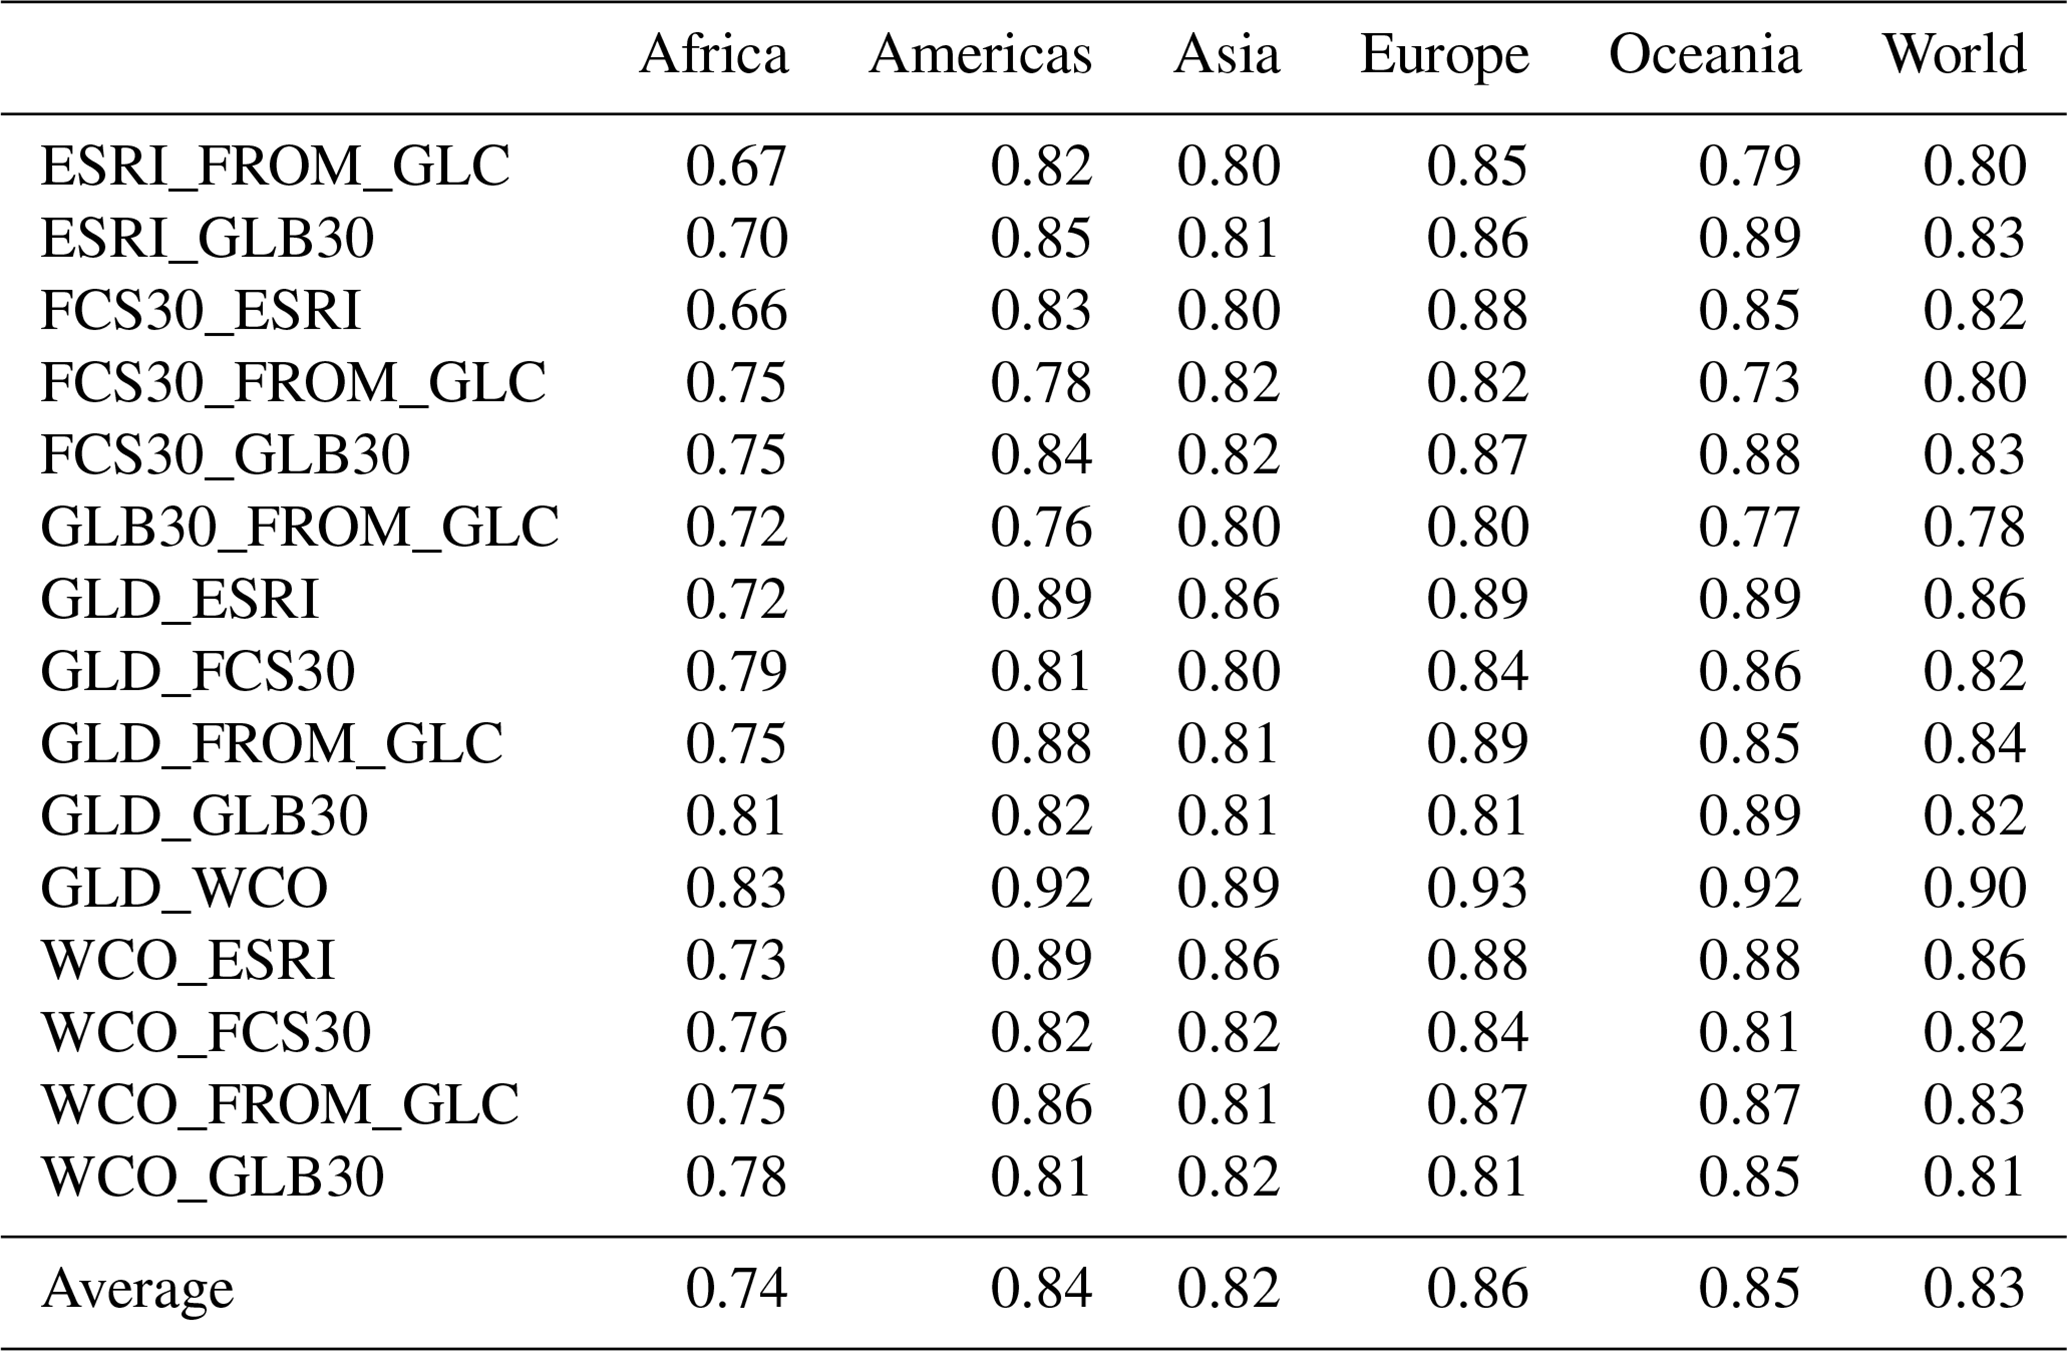
Table B1Look-up table of the binary and decimal values for each detailed class of agreement. For each dataset, a value of 1 means the presence of cropland and 0 is the absence.
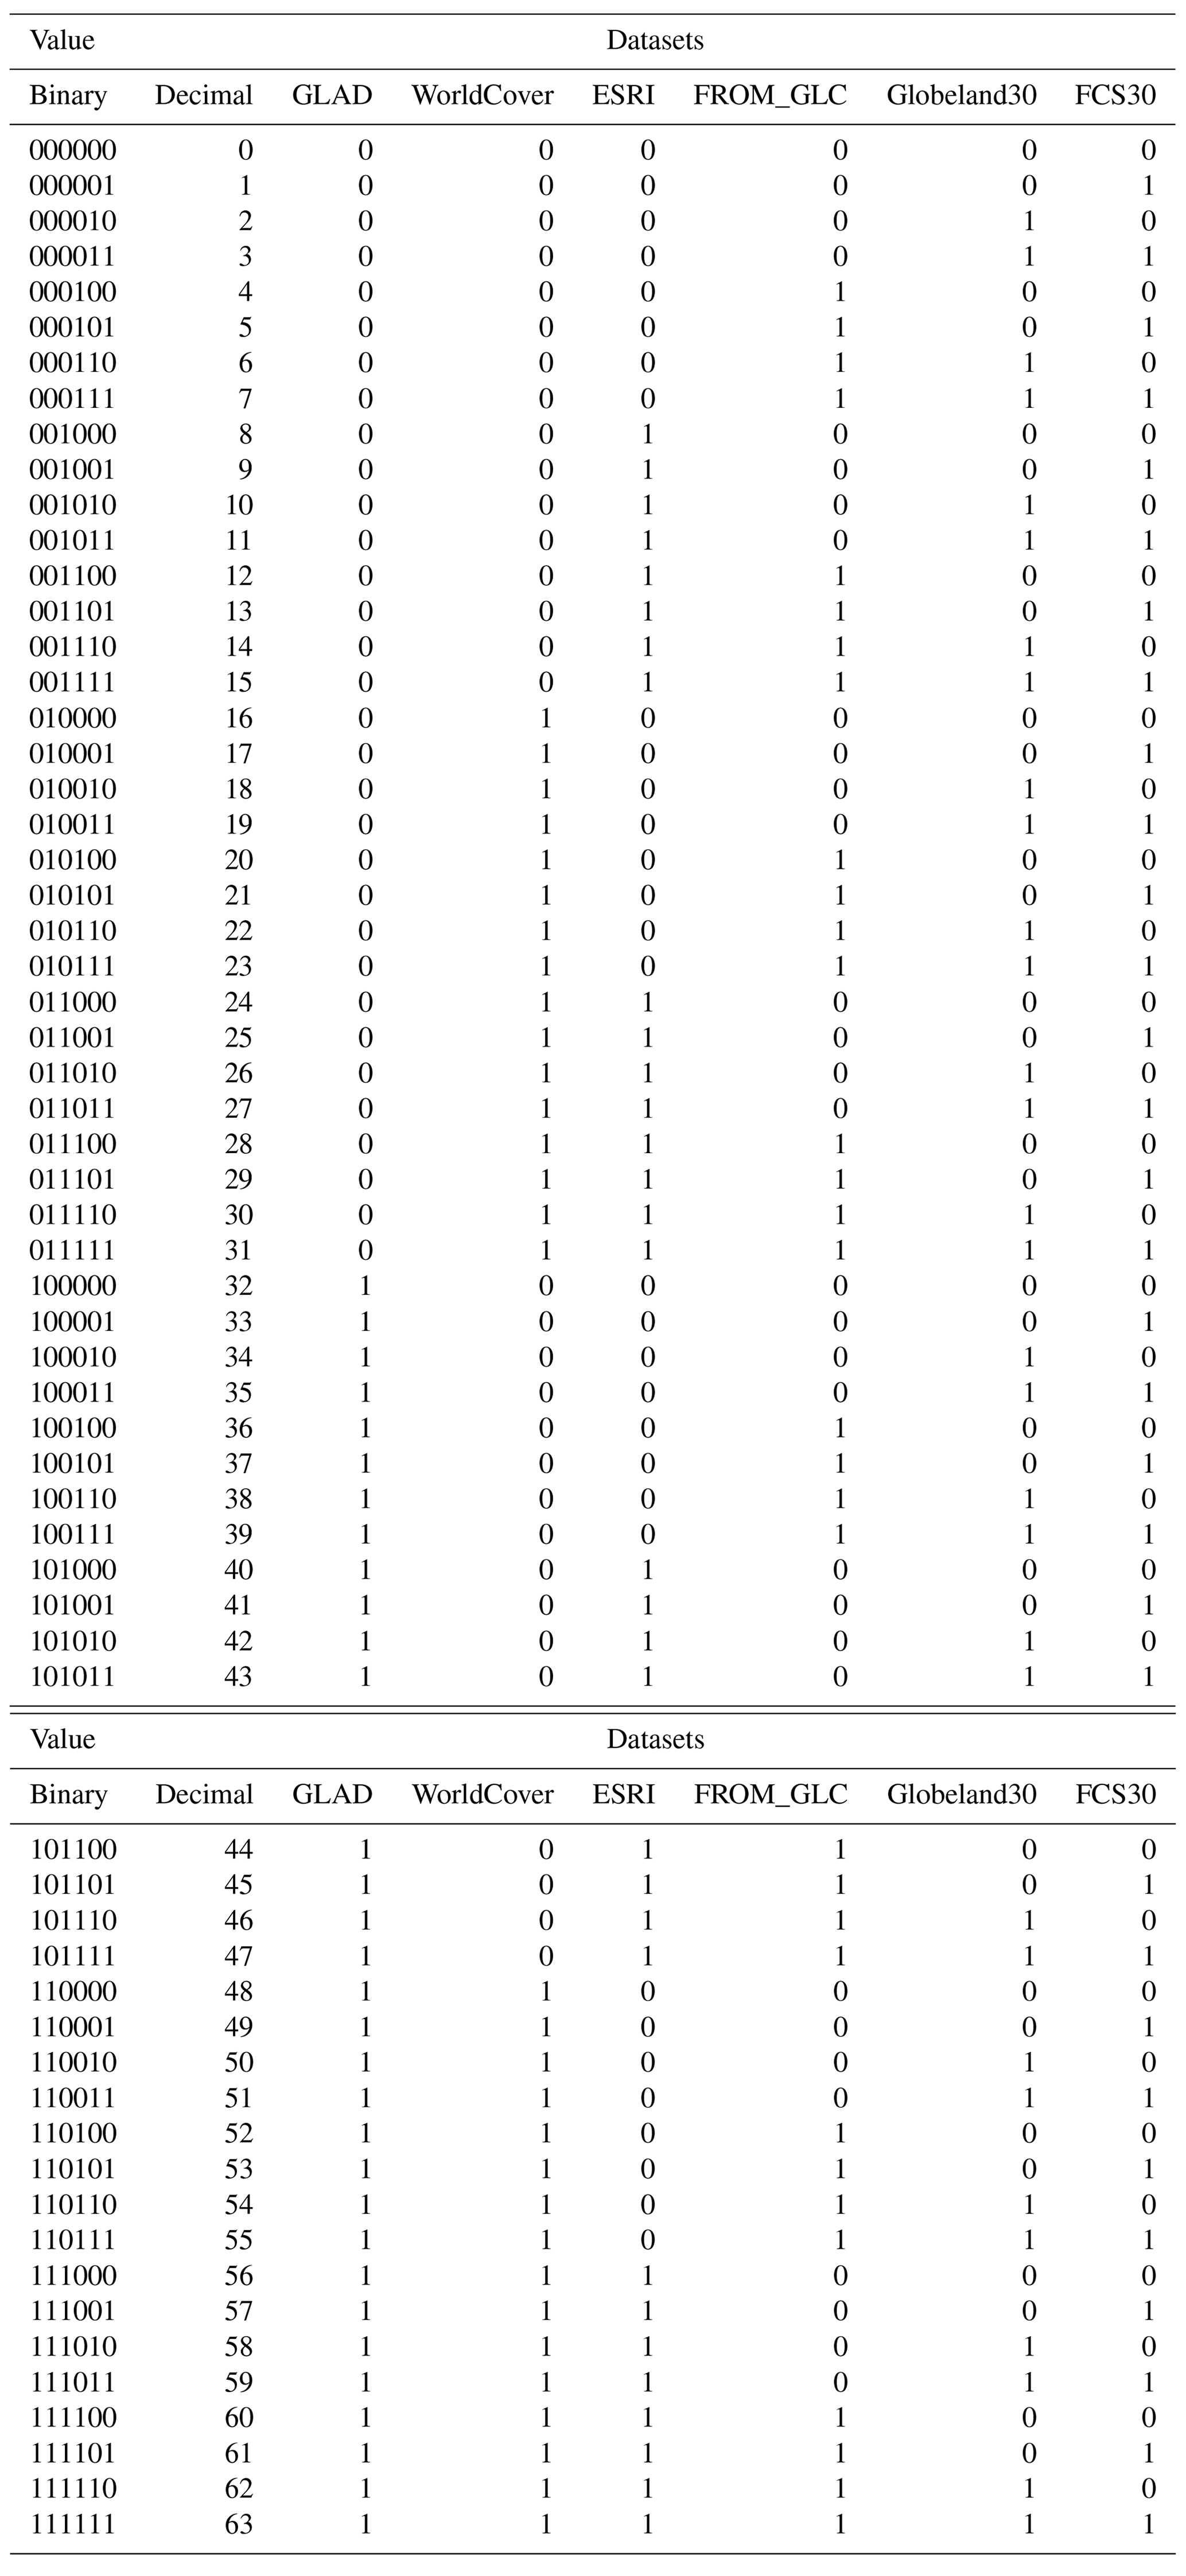
Note: since we only have six datasets, only six bits are shown for the binary value as the last two bits are always 0 (8-bit integer). For example, a pixel value of 38 equals bit 100110, meaning the 2nd, 3rd and 6th bits (or datasets) depict the presence of cropland (i.e., Globeland30, FROM_GLC and GLAD), whereas the other three layers show no cropland.
Table C1Percent area contribution by agreement class to regional cropland area estimates in CAM.
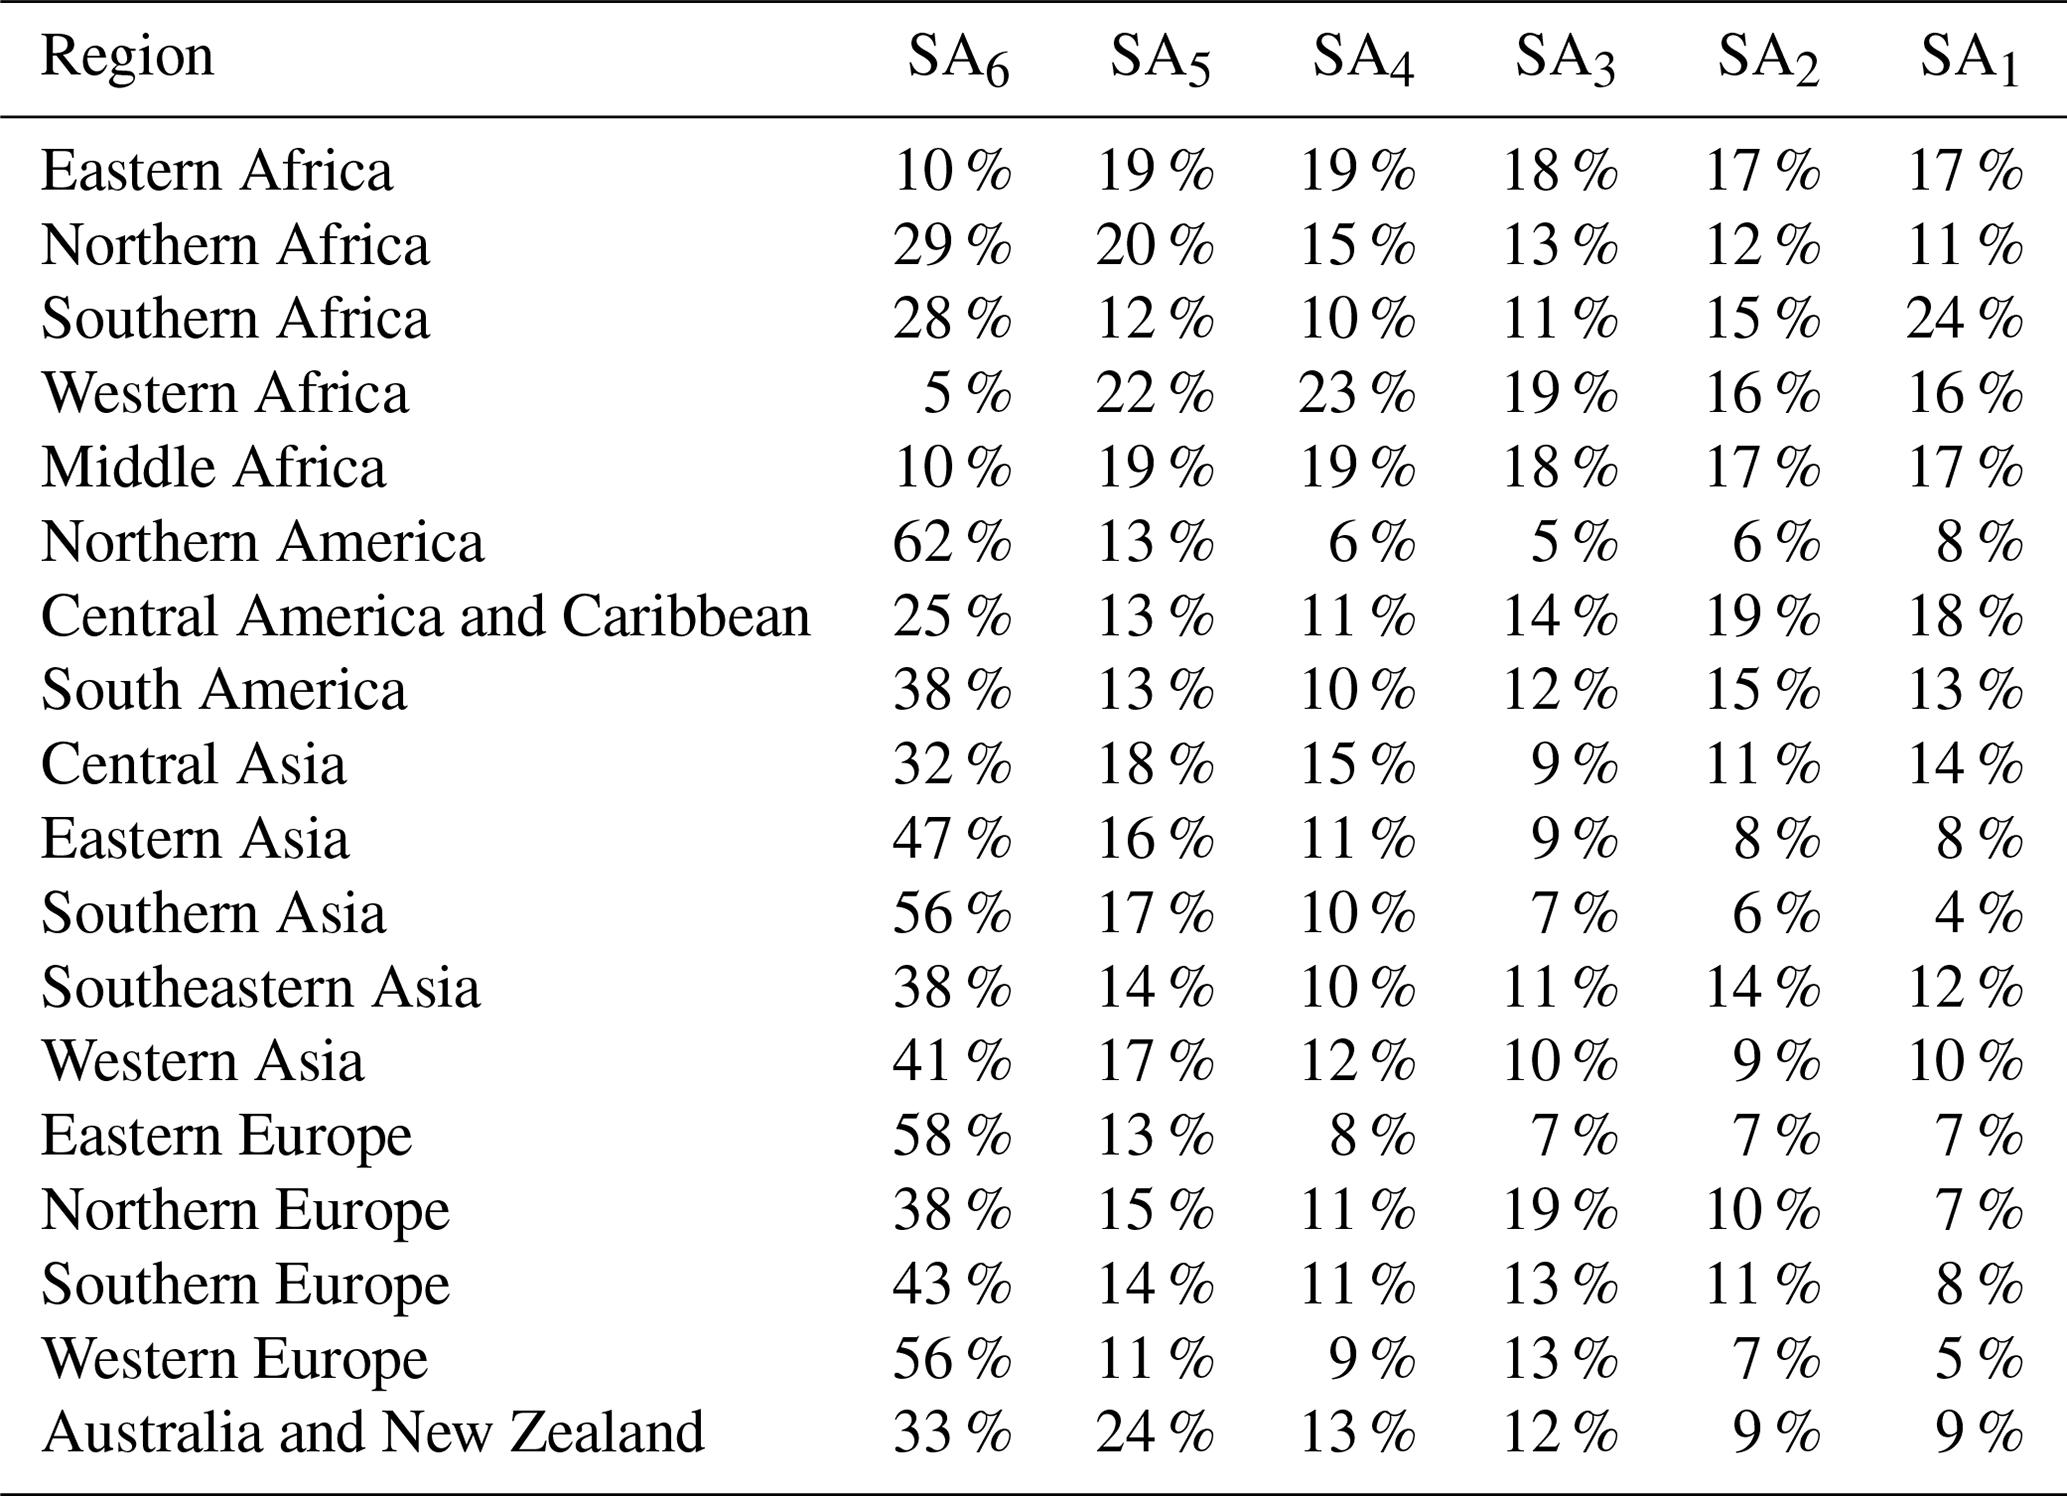
Table C2Countries with 100 % relative uncertainty in CAM estimates (mean area; SE; area by simple agreement class) and FAO cropland area.
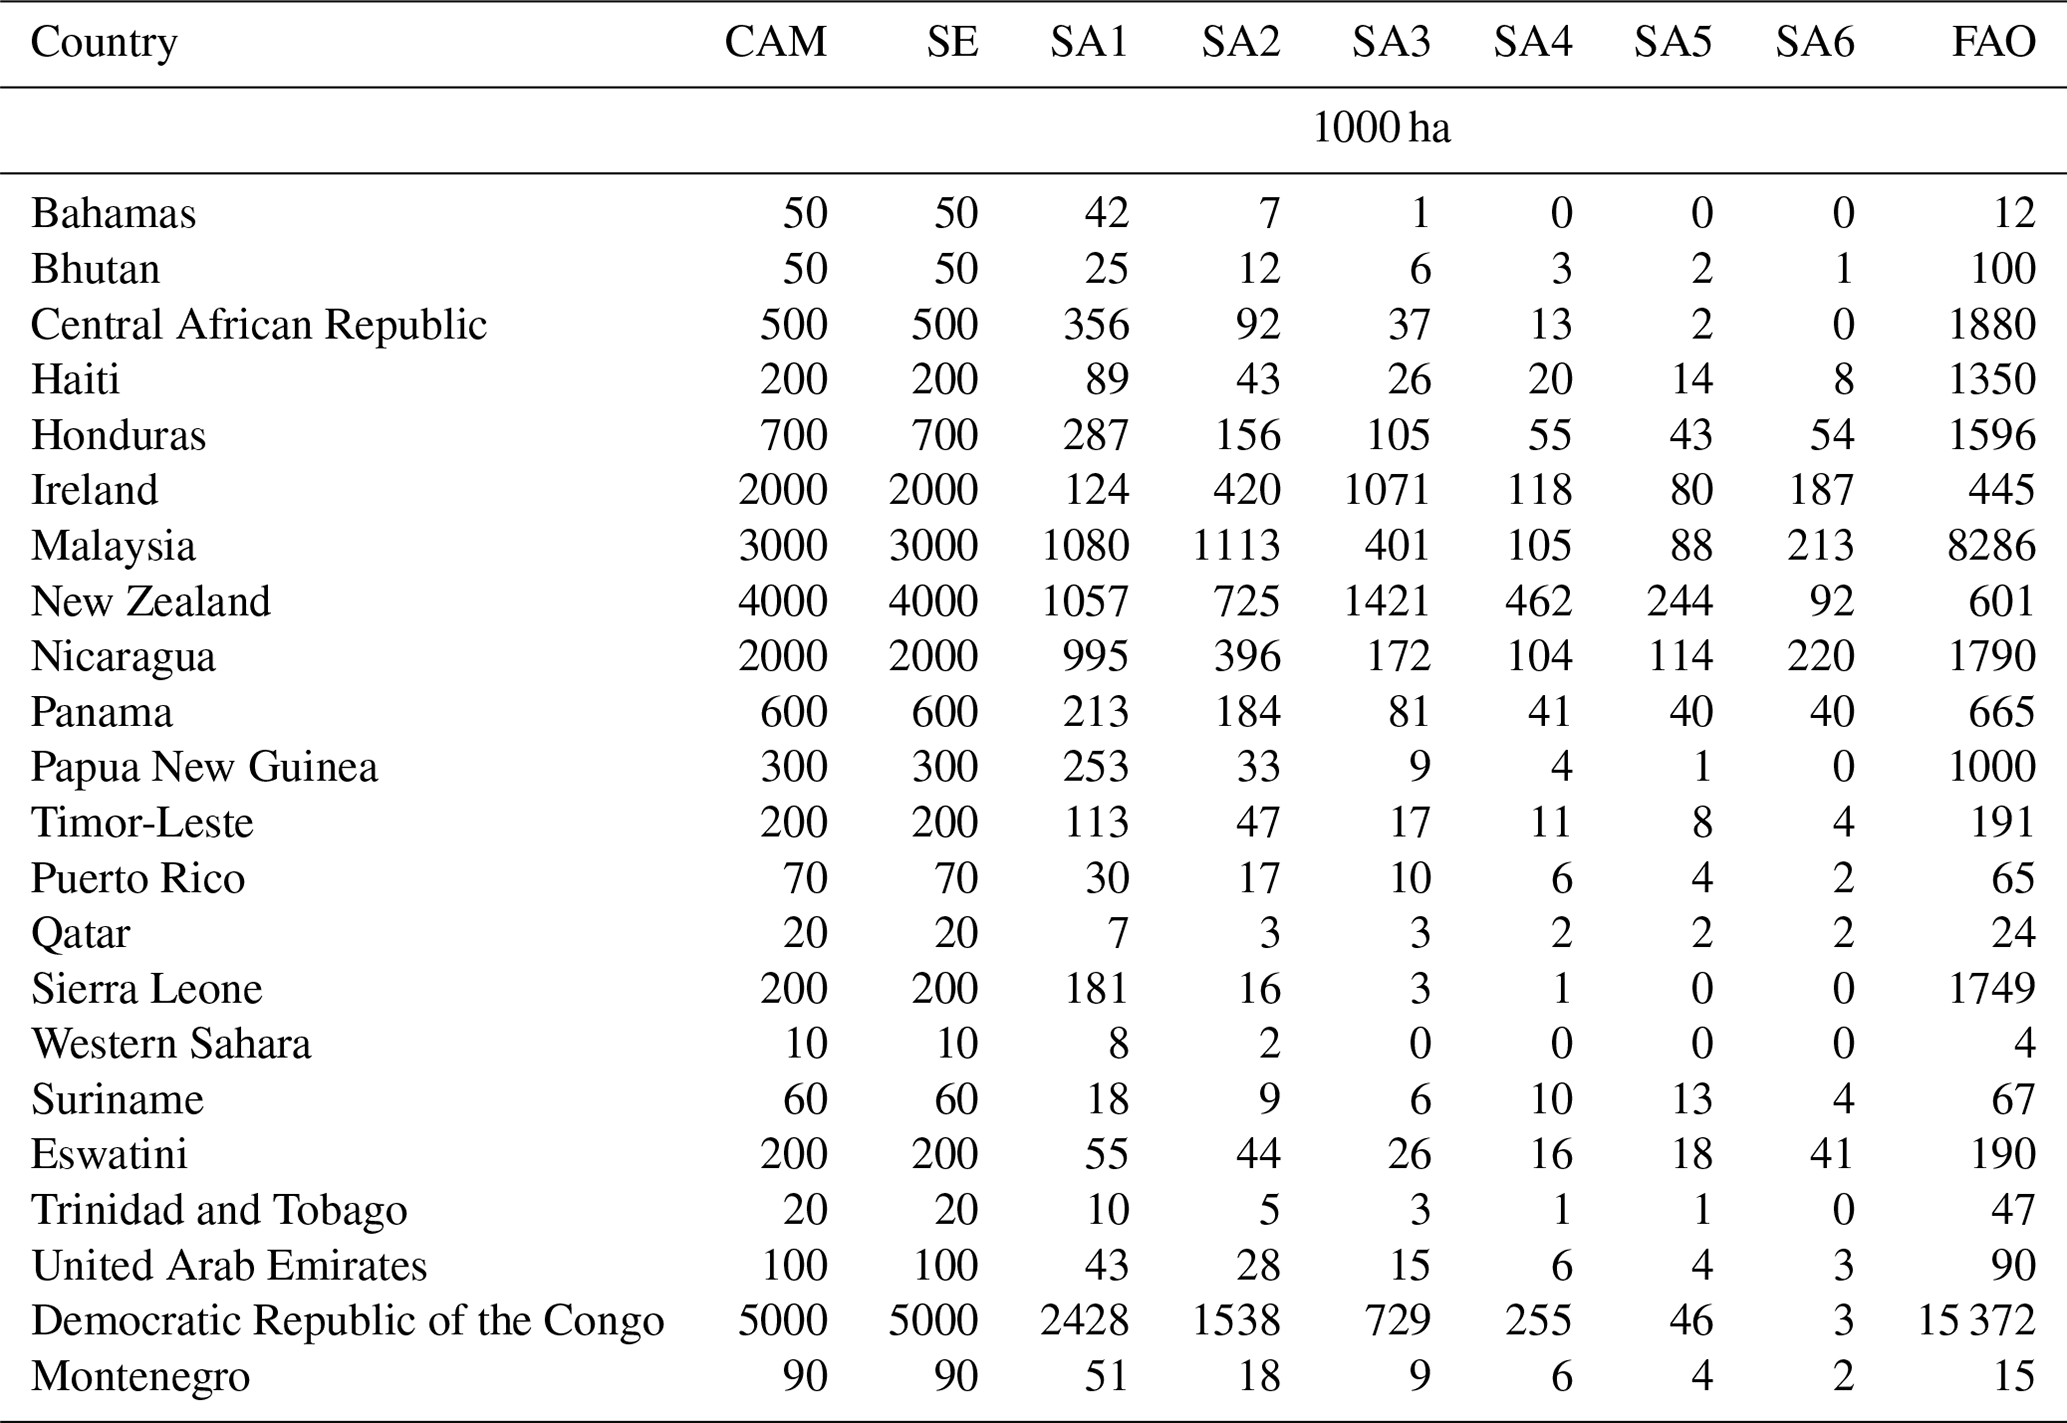
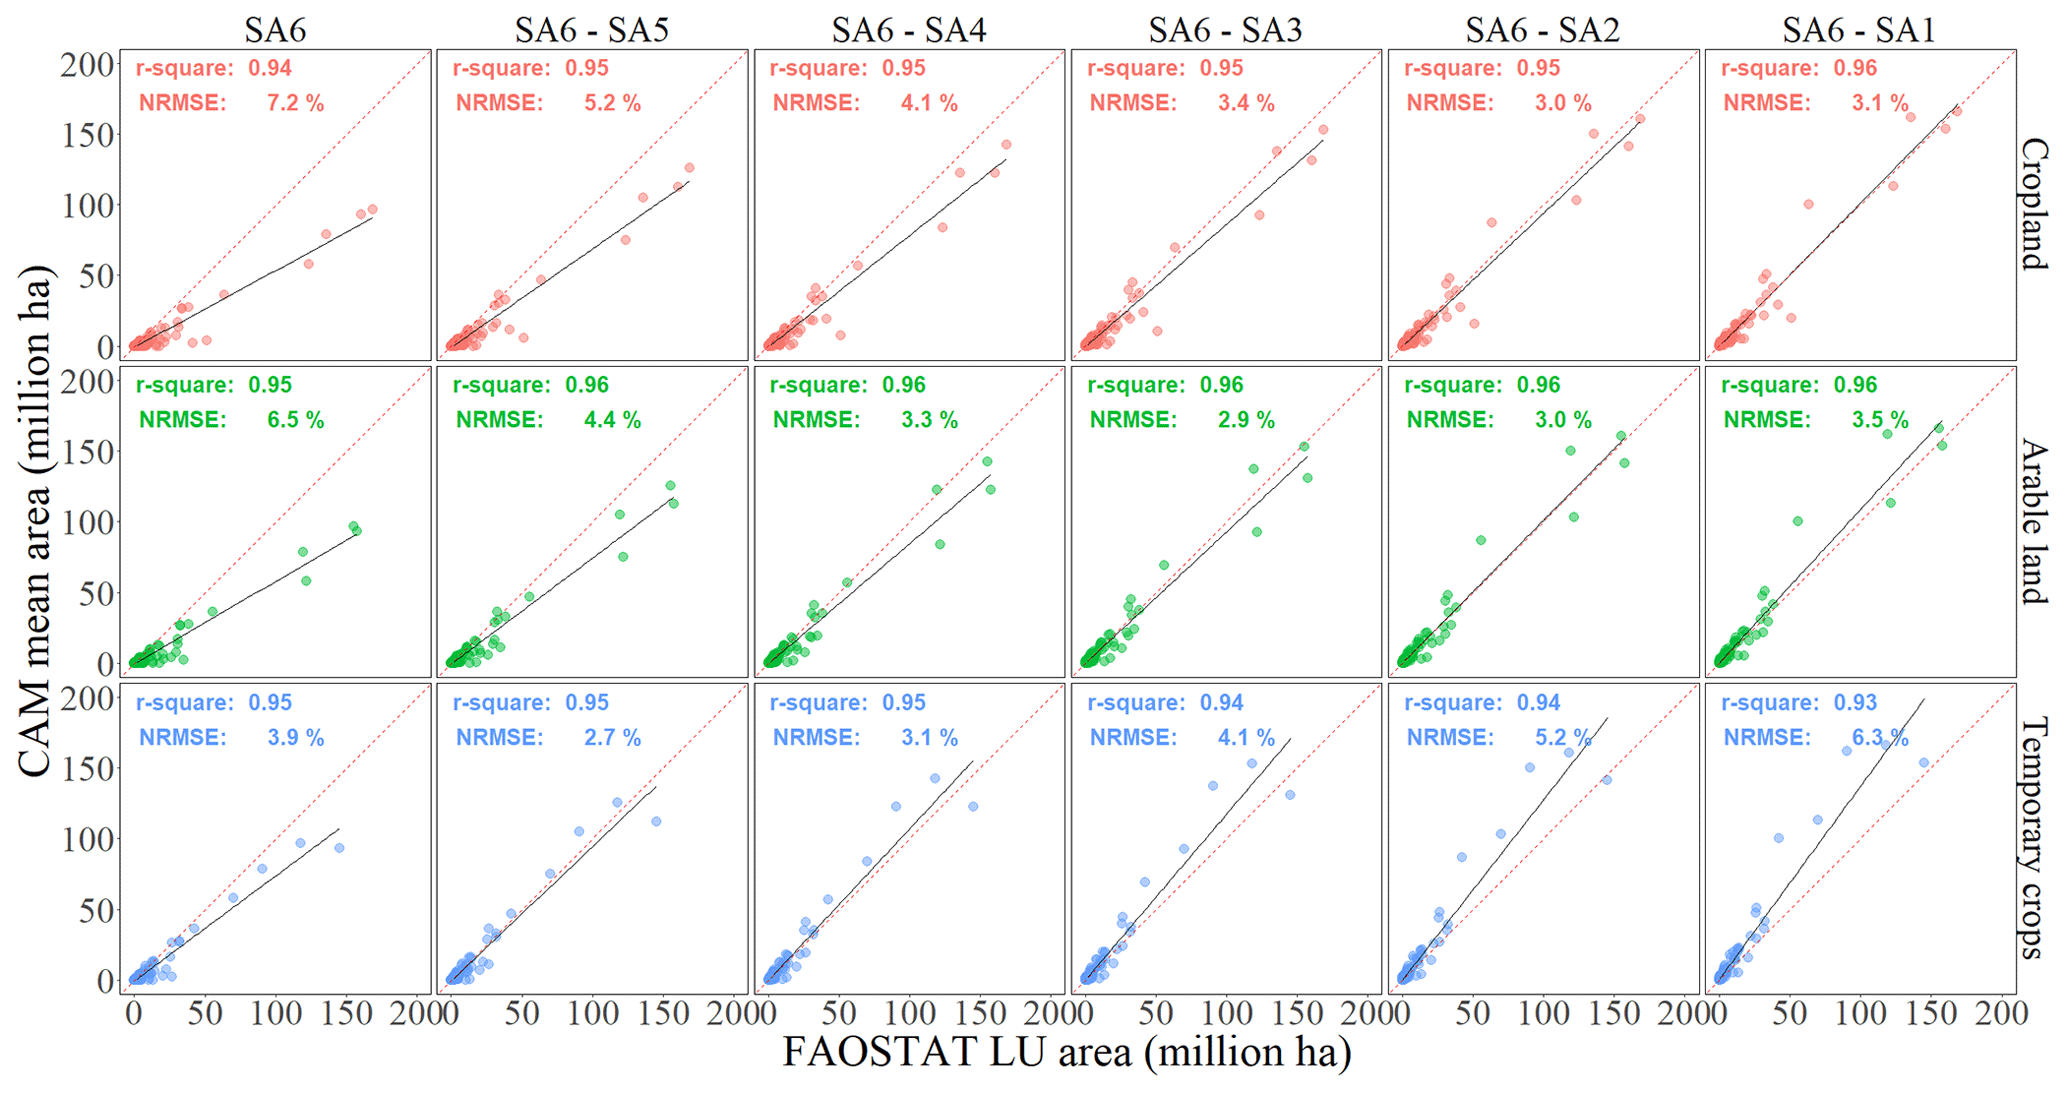
Figure D1Scatterplots of the correlation between FAOSTAT land use (LU) statistics of cropland and sub-components (arable land and temporary crops) and the CAM area by aggregated classes of agreement. The black line depicts the regression line, while the red line shows the optimal 1:1 relationship. All correlations were statistically significant (p<0.001).
Table D1Results of the comparison between country statistics from the six cropland input layers and from CAM with FAOSTAT cropland areas (R2 and NRMSE).
FNT, GC and LC conceived the dataset and conducted the analysis. GC, LC, PH and ZC supported the underlying geospatial analysis. GD supported the land use analysis and country examples. All authors contributed to writing the paper.
At least one of the (co-)authors is a member of the editorial board of Earth System Science Data.. The peer-review process was guided by an independent editor, and the authors also have no other competing interests to declare.
Publisher’s note: Copernicus Publications remains neutral with regard to jurisdictional claims made in the text, published maps, institutional affiliations, or any other geographical representation in this paper. While Copernicus Publications makes every effort to include appropriate place names, the final responsibility lies with the authors.
The authors wish to acknowledge the Swiss Office of Agriculture for funding the FAO Statistics Division under the FAO Regular Programme, which made this work possible. The views expressed in this work are the authors' only and cannot be taken to represent FAO's views or policy on the subject matter.
This paper was edited by Hao Shi and reviewed by two anonymous referees.
Bailey, J. T. and Boryan, C. G.: Remote sensing applications in agriculture at the USDA National Agricultural Statistics Service. ICAS-V Conference Proceedings, https://www.fao.org/fileadmin/templates/ess/documents/meetings_and_workshops/ICAS5/PDF/ICASV_2.1_048_Paper_Bailey.pdf (last access: 31 October 2023), 2010.
Baroni-Urbani, C. and Buser, M. W.: Similarity of binary data, Syst. Zool., 25, 251–259, https://doi.org/10.2307/2412493, 1976.
Bey, A., Sánchez-Paus Díaz, A., Maniatis, D., Marchi, G., Mollicone, D., Ricci, S., Bastin, J.-F., Moore, R., Federici, S., Rezende, M., Patriarca, C., Turia, R., Gamoga, G., Abe, H., Kaidong, E., and Miceli, G.: Collect earth: Land use and land cover assessment through augmented visual interpretation, Remote Sens., 8, 807, https://doi.org/10.3390/rs8100807, 2016.
Bratic, G., Oxoli, D., and Brovelli, M. A.: INTER-COMPARISON OF THE GLOBAL LAND COVER MAPS IN AFRICA SUPPLEMENTED BY SPATIAL ASSOCIATION OF ERRORS, Int. Arch. Photogramm. Remote Sens. Spatial Inf. Sci., XLII-4/W14, 11–16, https://doi.org/10.5194/isprs-archives-XLII-4-W14-11-2019, 2019.
Chaaban, F., El Khattabi, J., and Darwishe, H.: Accuracy assessment of ESA WorldCover 2020 and ESRI 2020 land cover maps for a Region in Syria, J. Geovisualiz. Spatial Anal., 6, 31, https://doi.org/10.1007/s41651-022-00126-w, 2022.
Chen, J., Chen, J., Liao, A., Cao, X., Chen, L., Chen, X., He, C., Han, G., Peng, S., Lu, M., Zhang, W., Tong, X., and Mills, J.: Global land cover mapping at 30 m resolution: A POK-based operational approach, ISPRS J. Photogramm., 103, 7–27, https://doi.org/10.1016/j.isprsjprs.2014.09.002, 2015.
Choi, S.-S., Cha, S.-H., and Tappert, C. C.: A survey of binary similarity and distance measures, J. Syst. Cybernet. Inform., 8, 43–48, 2010.
Ding, Y., Yang, X., Wang, Z., Fu, D., Li, H., Meng, D., Zeng, X., and Zhang, J.: A field-data-aided comparison of three 10 m land cover products in Southeast Asia, Remote Sens., 14, 5053, https://doi.org/10.3390/rs14195053, 2022.
FAO: FAO GAUL: Global Administrative Unit Layers 2015, Country boundaries, in: Earth Engine Data Catalog, https://developers.google.com/earth-engine/datasets/catalog (last access: 6 June 2023), 2015.
FAO: World programme for the census of agriculture 2020. Volume 2 Operational guidelines. FAO statistical development series 16. Rome, 348 pp. Licence: CC BY-NC-SA 3.0 IGO, FAO, Rome, ISBN 978-92-5-131032-8, 2018.
FAO: Land statistics. Global, regional and country trends, 1990-2018. FAOSTAT Analytical Brief Series No. 15. Rome, ISSN 2709-0078, 19 pp., 2020.
FAO: FAOSTAT Land, Inputs and Sustainability: Land Use, https://www.fao.org/faostat/en/#data/RL (last access: 6 June 2023), 2023.
Fritz, S., See, L., You, L., Justice, C., Becker-Reshef, I., Bydekerke, L., Cumani, R., Defourny, P., Erb, K., Foley, J., Gilliams, S., Gong, P., Hansen, M., Hertel, T., Herold, M., Herrero, M., Kayitakire, F., Latham, J., Leo, O., McCallum, I., Obersteiner, M., Ramankutty, N., Rocha, J., Tang, H., Thornton, P., Vancutsem, C., van der Velde, M., Wood, S., and Woodcock, C.: The need for improved maps of global cropland, Eos, Trans. Am. Geophys. Union, 94, 31–32, https://doi.org/10.1002/2013EO030006, 2013.
Gao, Y., Liu, L., Zhang, X., Chen, X., Mi, J., and Xie, S.: Consistency analysis and accuracy assessment of three global 30-m land-cover products over the European Union using the LUCAS dataset, Remote Sens., 12, 3479, https://doi.org/10.3390/rs12213479, 2020.
Gorelick, N., Hancher, M., Dixon, M., Ilyushchenko, S., Thau, D., and Moore, R.: Google Earth Engine: Planetary-scale geospatial analysis for everyone, Remote Sens. Environ., 202, 18–27, https://doi.org/10.1016/j.rse.2017.06.031, 2017.
BIPM, IEC, IFCC, ILAC, ISO, IUPAC, IUPAP, and OIML: Evaluation of measurement data – An introduction to the “Guide to the expression of uncertainty in measurement” and related documents. Joint Committee for Guides in Metrology, JCGM 104:2009, https://www.bipm.org/documents/20126/2071204/JCGM_104_2009.pdf/19e0a96c-6cf3-a056-4634-4465c576e513 (last access: 1 September 2023), 2009.
Karra, K., Kontgis, C., Statman-Weil, Z., Mazzariello, J. C., Mathis, M., and Brumby, S. P.: Global land use/land cover with Sentinel 2 and deep learning, in: 2021 IEEE international geoscience and remote sensing symposium IGARSS, 4704–4707, https://doi.org/10.1109/IGARSS47720.2021.9553499, 2021.
Karthikeyan, L., Chawla, I., and Mishra, A. K.: A review of remote sensing applications in agriculture for food security: Crop growth and yield, irrigation, and crop losses, J. Hydrol., 586, 124905, https://doi.org/10.1016/j.jhydrol.2020.124905, 2020.
Li, K. and Xu, E.: Cropland data fusion and correction using spatial analysis techniques and the Google Earth Engine, GISci. Remote Sens., 57, 1026–1045, https://doi.org/10.1080/15481603.2020.1841489, 2020.
Liu, L., Zhang, X., Gao, Y., Chen, X., Shuai, X., and Mi, J.: Finer-resolution mapping of global land cover: Recent developments, consistency analysis, and prospects, J. Remote Sens., 2021, 1–38, https://doi.org/10.34133/2021/5289697, 2021.
Lu, M., Wu, W., You, L., See, L., Fritz, S., Yu, Q., Wei, Y., Chen, D., Yang, P., and Xue, B.: A cultivated planet in 2010 – Part 1: The global synergy cropland map, Earth Syst. Sci. Data, 12, 1913–1928, https://doi.org/10.5194/essd-12-1913-2020, 2020.
Miller, D., McCarthy, J., and Zakzeski, A.: A fresh approach to agricultural statistics: data mining and remote sensing, in: Proceedings of the Joint Statistical Meetings, 1–6 August, 3144–3155, 2009.
Pérez-Hoyos, A., Rembold, F., Kerdiles, H., and Gallego, J.: Comparison of global land cover datasets for cropland monitoring, Remote Sens., 9, 1118, https://doi.org/10.3390/rs9111118, 2017.
Potapov, P., Turubanova, S., Hansen, M. C., Tyukavina, A., Zalles, V., Khan, A., Song, X.-P., Pickens, A., Shen, Q., and Cortez, J.: Global maps of cropland extent and change show accelerated cropland expansion in the twenty-first century, Nat. Food, 3, 19–28, https://doi.org/10.1038/s43016-021-00429-z, 2022a.
Potapov, P., Hansen, M. C., Pickens, A., Hernandez-Serna, A., Tyukavina, A., Turubanova, S., Zalles, V., Li, X., Khan, A., Stolle, F., Harris, N., Song X.-P., Baggett, A., Kommareddy, I., and Kommareddy, A.: The global 2000-2020 land cover and land use change dataset derived from the Landsat archive: first results, Front. Remote Sens., 3, 18, https://doi.org/10.3389/frsen.2022.856903, 2022b.
Tang, F. H. M., Nguyen, T. H., Conchedda, G., Casse, L., Tubiello, F. N., and Maggi, F.: CROPGRIDS: A global geo-referenced dataset of 173 crops circa 2020, Earth Syst. Sci. Data Discuss. [preprint], https://doi.org/10.5194/essd-2023-130, in review, 2023.
Tubiello, F. N., Conchedda, G., Casse, L., Pengyu, H., Chen, Z., De Santis, G., Fritz, S., and Muchoney, D.: High resolution cropland agreement map (30 m) circa 2020, Zenodo [dataset], https://zenodo.org/record/7244124, 2022.
Tubiello, F. N., Conchedda, G., Casse, L., Pengyu, H., De Santis, G., and Zhongxin, C.: Cropland area database by country circa 2020, Zenodo [dataset], https://doi.org/10.5281/zenodo.7987515, 2023a.
Tubiello, F. N., Conchedda, G., Casse, L., Pengyu, H., Zhongxin, C., De Santis, G., Fritz, S., and Muchoney, D.: Measuring the world's cropland area, Nat. Food, 1–3, https://doi.org/10.1038/s43016-022-00667-9, 2023b.
Van Tricht, K., Degerickx, J., Gilliams, S., Zanaga, D., Battude, M., Grosu, A., Brombacher, J., Lesiv, M., Bayas, J. C. L., Karanam, S., Fritz, S., Becker-Reshef, I., Franch, B., Mollà-Bononad, B., Boogaard, H., Pratihast, A. K., and Szantoi, Z.: WorldCereal: a dynamic open-source system for global-scale, seasonal, and reproducible crop and irrigation mapping, Earth Syst. Sci. Data Discuss. [preprint], https://doi.org/10.5194/essd-2023-184, in review, 2023.
Vancutsem, C., Marinho, E., Kayitakire, F., See, L., and Fritz, S.: Harmonizing and combining existing land cover/land use datasets for cropland area monitoring at the African continental scale, Remote Sens., 5, 19–41, https://doi.org/10.3390/rs5010019, 2012.
Venter, Z. S., Barton, D. N., Chakraborty, T., Simensen, T., and Singh, G.: Global 10 m Land Use Land Cover Datasets: A Comparison of Dynamic World, World Cover and Esri Land Cover, Remote Sens., 14, 4101, https://doi.org/10.3390/rs14164101, 2022.
Wang, X., Gao, X., Zhang, Y., Fei, X., Chen, Z., Wang, J., Zhang, Y., Lu, X., and Zhao, H.: Land-cover classification of coastal wetlands using the RF algorithm for Worldview-2 and Landsat 8 images, Remote Sens., 11, 1927, https://doi.org/10.3390/rs11161927, 2019.
Weiss, M., Jacob, F., and Duveiller, G.: Remote sensing for agricultural applications: A meta-review, Remote Sens. Environ., 236, 111402, https://doi.org/10.1016/j.rse.2019.111402, 2020.
Xu, Y., Yu, L., Feng, D., Peng, D., Li, C., Huang, X., Lu, H., and Gong, P.: Comparisons of three recent moderate resolution African land cover datasets: CGLS-LC100, ESA-S2-LC20, and FROM-GLC-Africa30, Int. J. Remote Sens., 40, 6185–6202, https://doi.org/10.1080/01431161.2019.1587207, 2019.
Yu, L., Wang, J., Li, X., Li, C., Zhao, Y., and Gong, P.: A multi-resolution global land cover dataset through multisource data aggregation, Sci. China Earth Sci., 57, 2317–2329, https://doi.org/10.1007/s11430-014-4919-z, 2014.
Yu, L., Du, Z., Dong, R., Zheng, J., Tu, Y., Chen, X., Hao, P., Zhong, B., Peng, D., Zhao, J., Li, X., Yang, J., Fu, H., Yang, G., and Gong, P.: FROM-GLC Plus: toward near real-time and multi-resolution land cover mapping, GIScience Remote Sens., 59, 1026–1047, https://doi.org/10.1080/15481603.2022.2096184, 2022.
Zanaga, Daniele, Van De Kerchove, Ruben, De Keersmaecker, Wanda, Souverijns, Niels, Brockmann, Carsten, Quast, Ralf, Wevers, Jan, Grosu, Alex, Paccini, Audrey, Vergnaud, Sylvain, Cartus, Oliver, Santoro, Maurizio, Fritz, Steffen, Georgieva, Ivelina, Lesiv, Myroslava, Carter, Sarah, Herold, Martin, Li, Linlin, Tsendbazar, Nandin-Erdene, Arino, Olivier, ESA WorldCover 10 m 2020 v100 (Version v100), Zenodo, https://doi.org/10.5281/zenodo.5571936, 2021.
Zhang, X., Liu, L., Chen, X., Gao, Y., Xie, S., and Mi, J.: GLC_FCS30: global land-cover product with fine classification system at 30 m using time-series Landsat imagery, Earth Syst. Sci. Data, 13, 2753–2776, https://doi.org/10.5194/essd-13-2753-2021, 2021.
- Abstract
- Introduction
- Materials and methods
- Results and discussion
- Potential uses and limitations
- Data availability
- Conclusions
- Appendix A: The six land cover products of the CAM maps and measures of spatial consistency and similarity
- Appendix B: Binary and decimal code attributes of the CAM detailed map of agreement
- Appendix C: CAM estimates for sub-regions and countries with largest relative uncertainty
- Appendix D: Comparison with FAOSTAT land use statistics
- Author contributions
- Competing interests
- Disclaimer
- Acknowledgements
- Review statement
- References