the Creative Commons Attribution 4.0 License.
the Creative Commons Attribution 4.0 License.
 | 10 Nov 2023
A dataset of energy, water vapor, and carbon exchange observations in oasis–desert areas from 2012 to 2021 in a typical endorheic basin
Shaomin Liu
Ziwei Xu
Xin Li
Tongren Xu
Zhiguo Ren
Yang Zhang
Junlei Tan
Lisheng Song
Ji Zhou
Zhongli Zhu
Xiaofan Yang
Rui Liu
Yanfei Ma
Oases and deserts generally act as a landscape matrix and mosaic in arid and semiarid regions. The significant difference in thermal and dynamic characteristics between an oasis and desert surface will result in oasis–desert interaction. Specifically, this refers to the interaction between an oasis and desert system via the exchange of momentum, energy, water, and carbon, which can lead to a series of microclimate effects that affect the structure of the atmospheric boundary layer, changes in carbon sources and sinks in an oasis, and the local ecological environment. Therefore, studying water, heat, and carbon exchange is significant to achieve the goals of carbon peaking and carbon neutrality in oasis–desert areas and support the ecological security and sustainable development of oases. To monitor energy, water vapor, and carbon exchange between the land surface and atmosphere, a land surface process integrated observatory network was established in the oasis–desert area in the middle and lower reaches of the Heihe River basin, the second largest endorheic basin in China. In this study, we present a suite of observational datasets from artificial and natural oasis–desert systems that consist of long-term energy, water vapor, carbon and methane fluxes as well as auxiliary data involving hydrometeorology, vegetation, and soil parameters from 2012 to 2021. Half-hourly turbulent flux data were acquired by an eddy covariance system and scintillometer. The hydrometeorological data (including radiation, soil heat flux, and soil temperature profiles; gradients of air temperature and humidity and of wind speed and direction; and air pressure, precipitation, and soil moisture profiles) were observed from automatic weather stations with a 10 min average period as well as the groundwater table data. Moreover, vegetation and soil parameters were also supplemented in the datasets. Careful data processing and quality control were implemented during data production, including data collection, processing, archiving, and sharing. The current datasets can be used to explore the water–heat–carbon process and its mechanism of influence; to calibrate and validate related remote-sensing products; to simulate energy, water vapor, and carbon exchange in oasis and desert areas; and to provide references and representatives for other similar artificial and natural oases along the “Silk Road”. The data are available from the National Tibetan Plateau Third Pole Environment: https://doi.org/10.11888/Terre.tpdc.300441 (Liu et al., 2023).
- Article
(13536 KB) - Full-text XML
- BibTeX
- EndNote


Arid and semiarid regions represent approximately 30 % of the global terrestrial surface area (Dregne, 1991; Scanlon et al., 2006), and dryland expansion occurs under climate change, especially in developing countries (Huang et al., 2016). This proportion is much higher in China, as (semi)arid regions account for approximately 47 % of the country's terrestrial surface (X. Y. Zhang et al., 2016; Mao et al., 2018). An oasis is a unique ecological landscape in arid and semiarid areas that is not only the core of regions' ecological environment but also the foundation of their economic development, especially in western China, which has been an important part of the “Silk Road” since ancient times. Oases comprising less than 10 % of the total area of arid regions support more than 90 % of the population in these regions of China (Chu et al., 2005; Li et al., 2016; Zhou et al., 2022). The main geomorphologic feature is a wide sandy desert or “gobi” (gravel desert), interspersed with many oases of different sizes and shapes in the middle and lower reaches of a typical endorheic basin in northwestern China (Cheng et al., 1999). The water from upstream is the link connecting these ecosystems, and the oasis is the place where human beings live. The oasis areas are now 3.3 times larger than those in the early 1950s in the region of northwestern China (Zhang et al., 2018). The oasis–desert system plays a crucial role in maintaining a stable ecological environment and agricultural productivity (Zhang and Zhao, 2015). However, inland river basins in arid and semiarid areas are facing the crisis of ecological environment degradation, such as the drying up of rivers and lakes, the degradation of natural vegetation, the intensification of land desertification, and the frequent occurrence of dust storms, especially in many inland river basins westward along the Silk Road, such as the Tarim River basin (Zhao et al., 2013), the Aral Sea basin (Stanev et al., 2004; Crétaux et al., 2009), and the Lake Urmia basin (Stone, 2015). Therefore, it is critical to maintain the balance between oasis and desert systems in order to achieve the goal of sustainable oasis development.
The particularity of the underlying surface in an oasis–desert area, e.g., the irrigation cropland, riparian forest, sandy vegetation, seasonal snow, and frozen soil, makes the study of land–atmosphere interactions complex and requires comprehensive consideration for such heterogeneous underlying surfaces. The dynamic and thermal characteristics of the underlying surface of the oasis and the desert are significantly different, and the oasis and desert systems interact and influence each other through momentum, energy, water vapor, and carbon exchange. Thus, the oasis–desert interaction will affect the structure of the atmospheric boundary layer and the local ecological environment. Additionally, under the influence of weather conditions, oasis–desert interaction results in local circulation between the oasis and desert, and airflows form a dynamic and thermal inner boundary layer within the oasis (Cheng et al., 2014). The oasis–desert local circulation inside the oasis can lead to the local microclimate characteristics of the oasis–desert area (Liu et al., 2020), such as the wind shield effect and cold and wet island effect of the oasis, the humidity inversion effect within the surrounding desert, and oasis carbon sources or sinks. These microclimate effects play an important role in the self-sustainment and development of oasis systems. Understanding the basic characteristics of energy, water vapor, and carbon exchange in oasis–desert ecosystems is important to achieve the goals of carbon peaking and carbon neutrality in the oasis–desert area and support the ecological security and sustainable development of the oasis.
Extensive studies have investigated energy, water vapor, and carbon exchange in oasis–desert areas based on field and remote-sensing observations (Taha et al., 1991; Potchter et al., 2008; Xue et al., 2019; Wang et al., 2019; Zhou et al., 2022) and numerical simulations (Chu et al., 2005; Meng et al., 2009; Georgescu et al., 2011; Liu et al., 2020). Li et al. (2016) provided a complete sketch map of oasis–desert interactions based on previous studies, including the oasis cold and wet island effect, the oasis wind shield effect (oasis effect), and the air humidity inversion effect within the surrounding desert (desert effect), which are important for the stability and sustainability of the oasis–desert ecosystem (Liu et al., 2020). In addition, oasis–desert areas located in semiarid regions have been found to be carbon sinks by previous researchers (Tagesson et al., 2016; Wang et al., 2019); thus, they can significantly affect the carbon balance of arid regions and play an increasingly important role within the global carbon cycle.
The Heihe River basin (HRB), the second largest endorheic basin in China, is characterized by artificial oases and natural oases in its middle and lower reaches, respectively. Several experiments have been conducted in these oasis–desert areas, e.g., the Heihe River Basin Field Experiment (HEIFE) from 1990 to 1992 that comprised comprehensive studies of atmosphere–land surface interactions over the Zhangye oasis and desert area in the middle reaches of the HRB (Wang and Mitsuta, 1992), the Jinta experiment from 2005 to 2008 that focused on energy and water exchange and the atmospheric boundary over the Jinta oasis and desert area in the middle reaches of the HRB (Wen et al., 2012), the oasis–desert area in the middle reaches and mountainous area in the upper reaches of the Watershed Allied Telemetry Experimental Research (WATER) and subsequent Heihe Watershed Allied Telemetry Experimental Research (HiWATER) campaign (oasis–desert area in the middle and lower reaches and mountainous area in the upper reaches) as part of a comprehensive simultaneous satellite–airborne–ground observations ecohydrological experiment (Li et al., 2009, 2013). All the experiments (HEIFE, Jinta, WATER and HiWATER) were conducted in the HRB. The HEIFE and Jinta experiments were conducted in the middle reaches of the HRB, WATER in the upper and middle reaches of the HRB, and HiWATER in the whole region of the HRB. Thereafter, a multielement, multiscale, elaborate integrated observatory network was established (setup began in 2007 and was completed in 2013) in the oasis–desert area in the middle and lower reaches and in the mountainous area in the upper reaches of the HRB (Liu et al., 2018). A quantitative understanding of the energy, water vapor, and carbon exchange in oasis–desert areas is crucial to recognize the oasis–desert interactions and is significant to protect the ecological stability and socioeconomic development of oases; moreover, long-term observations are indispensable. The observations and research findings from the oasis–desert area in the HRB will serve as references and representatives for other similar artificial and natural oases along the Silk Road. To achieve the aforementioned objective, observations should be continuously conducted and a high-quality dataset should be obtained.
In this paper, the integrated observatory network of the artificial and natural oasis–desert areas in the middle and lower reaches of the HRB is first introduced. The observations characterizing the energy, water vapor, and carbon exchange that provide a 10-year dataset are then explicated. Specifically, the spatial distribution and design of the observation sites are summarized in Sect. 2. Section 3 describes the data processing and quality control procedures. In Sect. 4, the energy, water vapor, and carbon fluxes as well as the related auxiliary parameters are introduced in detail. The data availability is documented in Sect. 5, and the conclusions are summarized in Sect. 6. This dataset can be used to obtain a comprehensive understanding of energy, water vapor, and carbon exchange in oasis–desert areas and to validate simulation results and remote-sensing products of energy, water vapor, and carbon fluxes in oasis–desert areas.
2.1 Study area description
The study area comprises the middle and lower reaches of the HRB, located in the arid regions of western China, that receive water from the typical cryosphere of the upper reaches. In the upper reaches, glaciers, snow cover, and frozen ground are widely distributed, and snowfall could occur in any season (elevation >3800 m). The typical snow depth is 15–30 cm with a duration of 90–120 d in the snow-covered regions (Che et al., 2012, 2019). The middle reaches, typical of the artificial oasis–desert system in the city of Zhangye, the largest oasis in the Hexi Corridor, cover an area of 29 717 km2 with an oasis area of 5560 km2, whereas the lower reaches in Ejin Banner comprise a natural oasis–desert system covering an area of 85 678 km2 with an oasis area of 1130 km2 (Fig. 1). Among the oases, agricultural oases have a traceable history of more than 2000 years. The annual average air temperature is 7.29 and 9.75 ∘C, and the annual accumulated precipitation is 184.83 and 37.31 mm (1979–2018) in the middle and lower reaches, respectively.
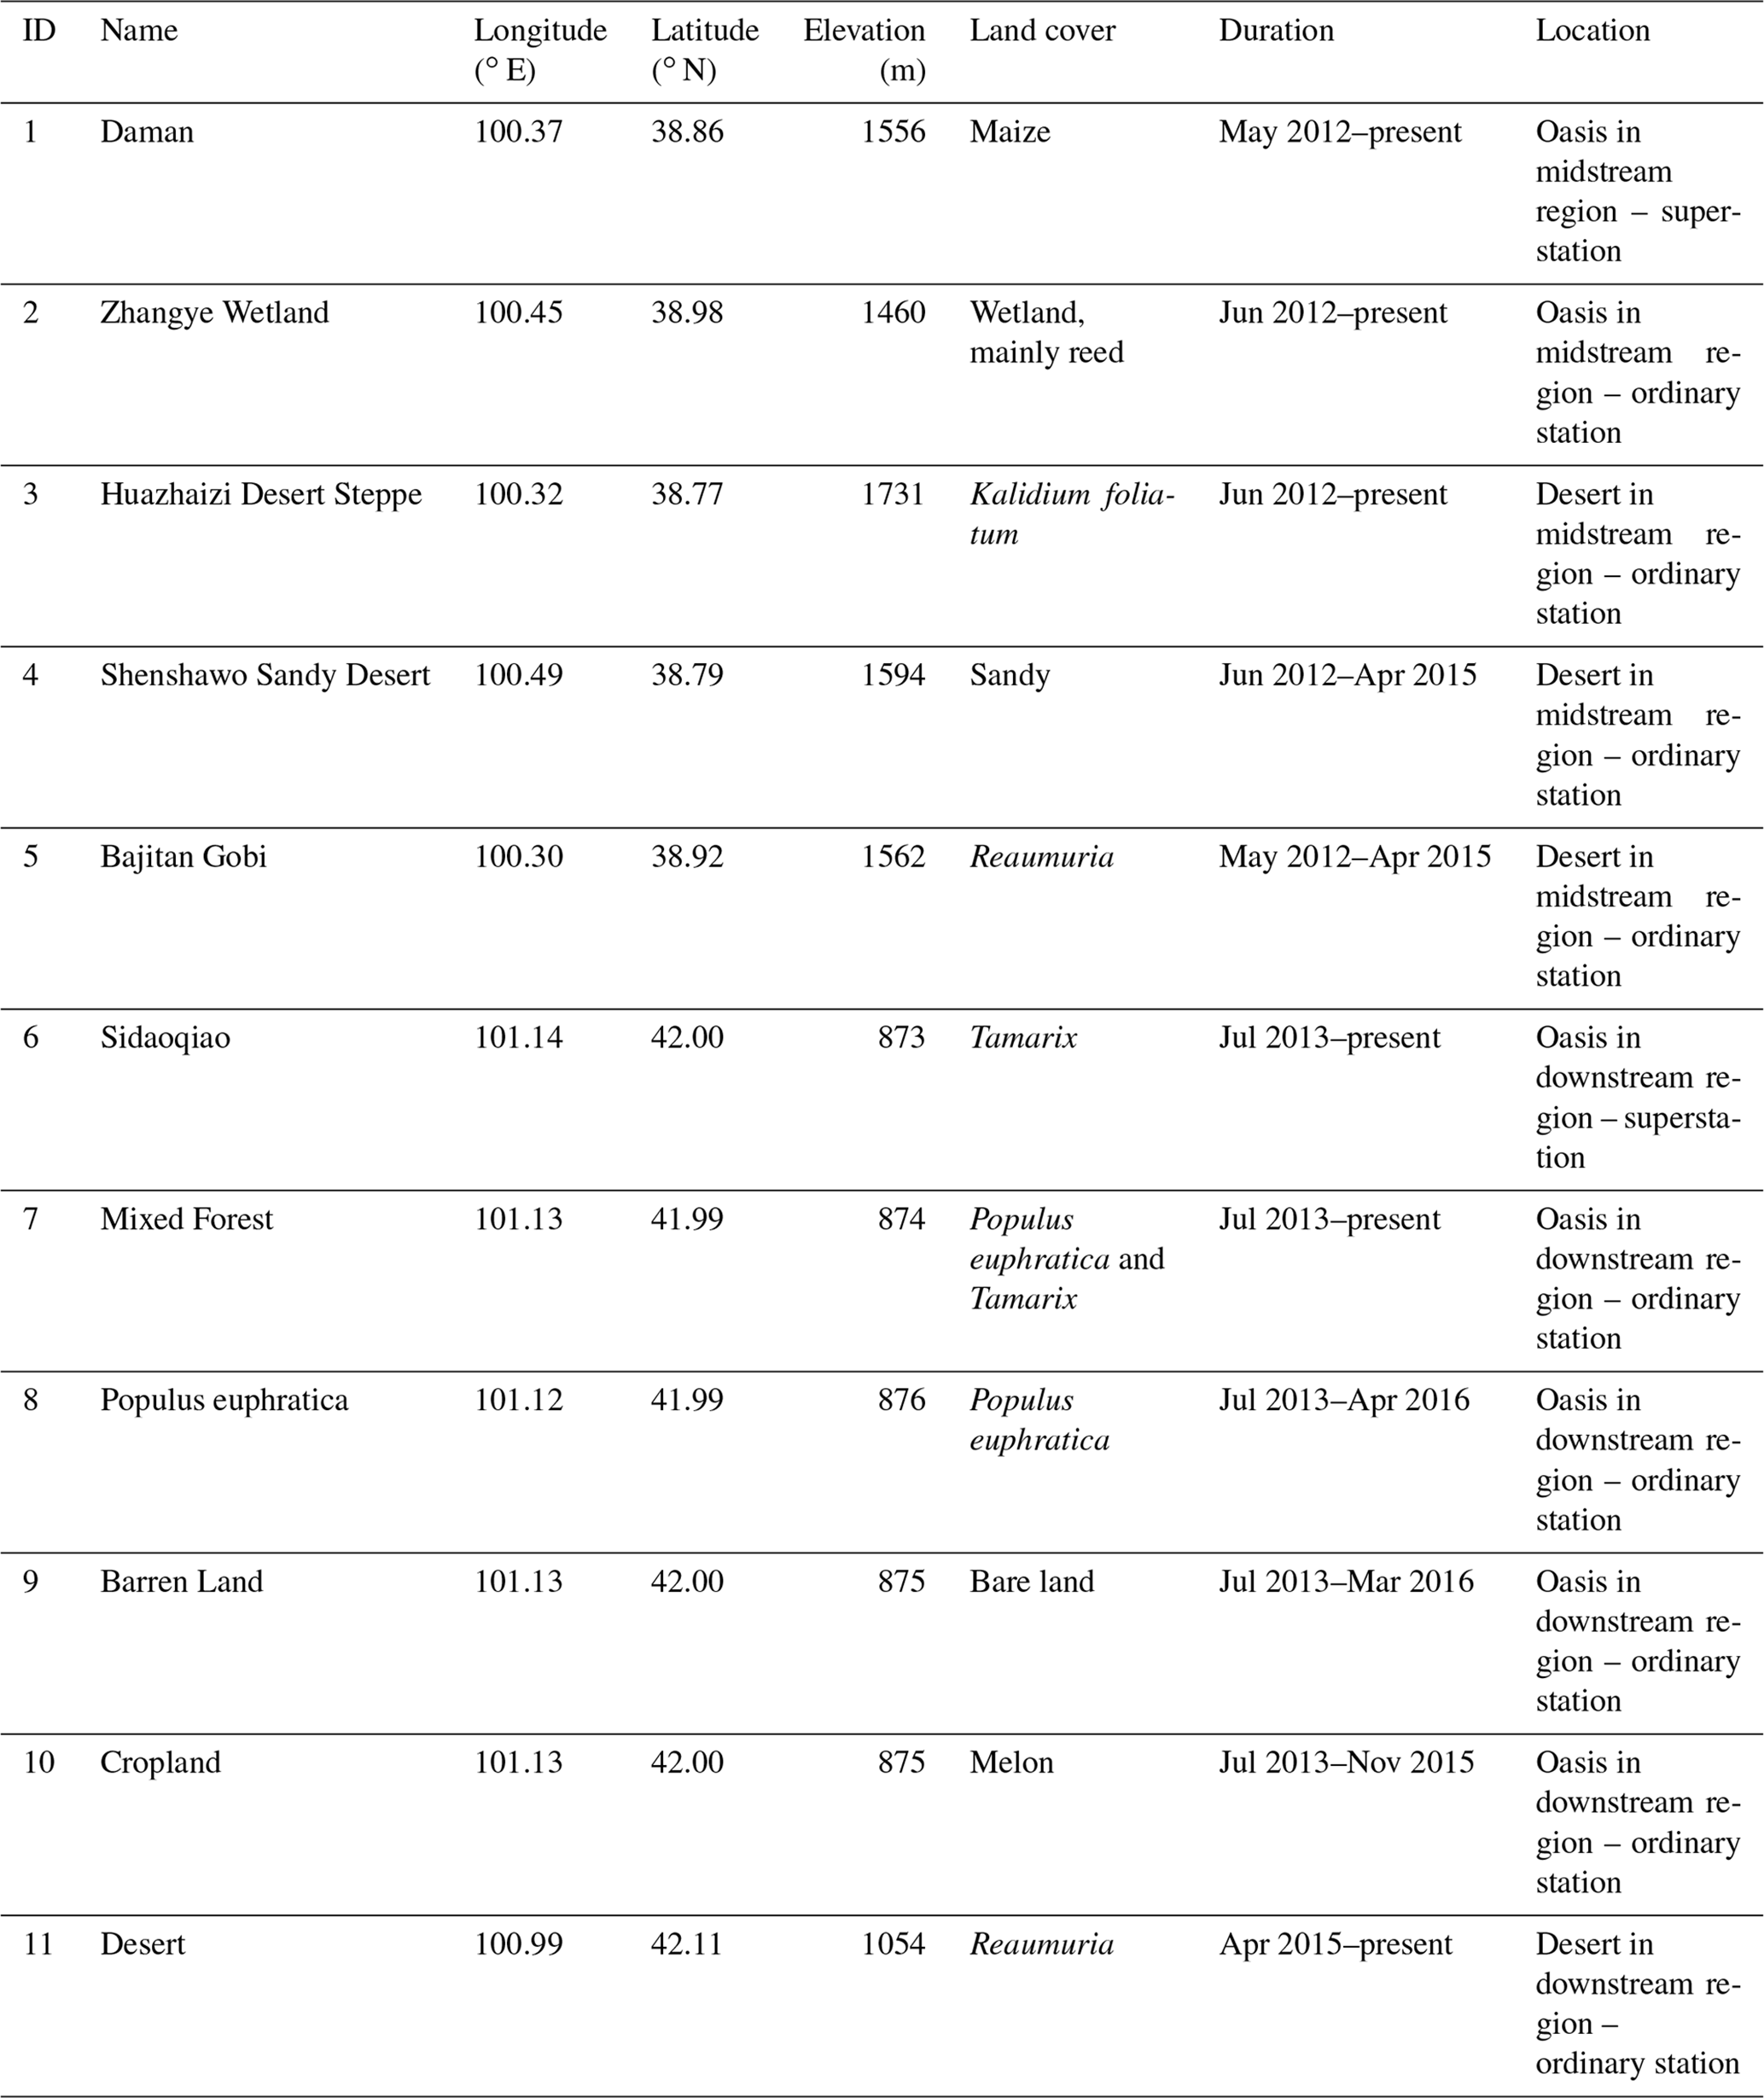
A total of 11 land surface flux and meteorological stations have been established in these regions since 2012 – 2 superstations and 9 ordinary stations (Table 1; Sect. 2.2) – specifically 2 oasis stations and 3 desert stations in the middle reaches and 5 oasis stations and 1 desert station in the lower reaches.
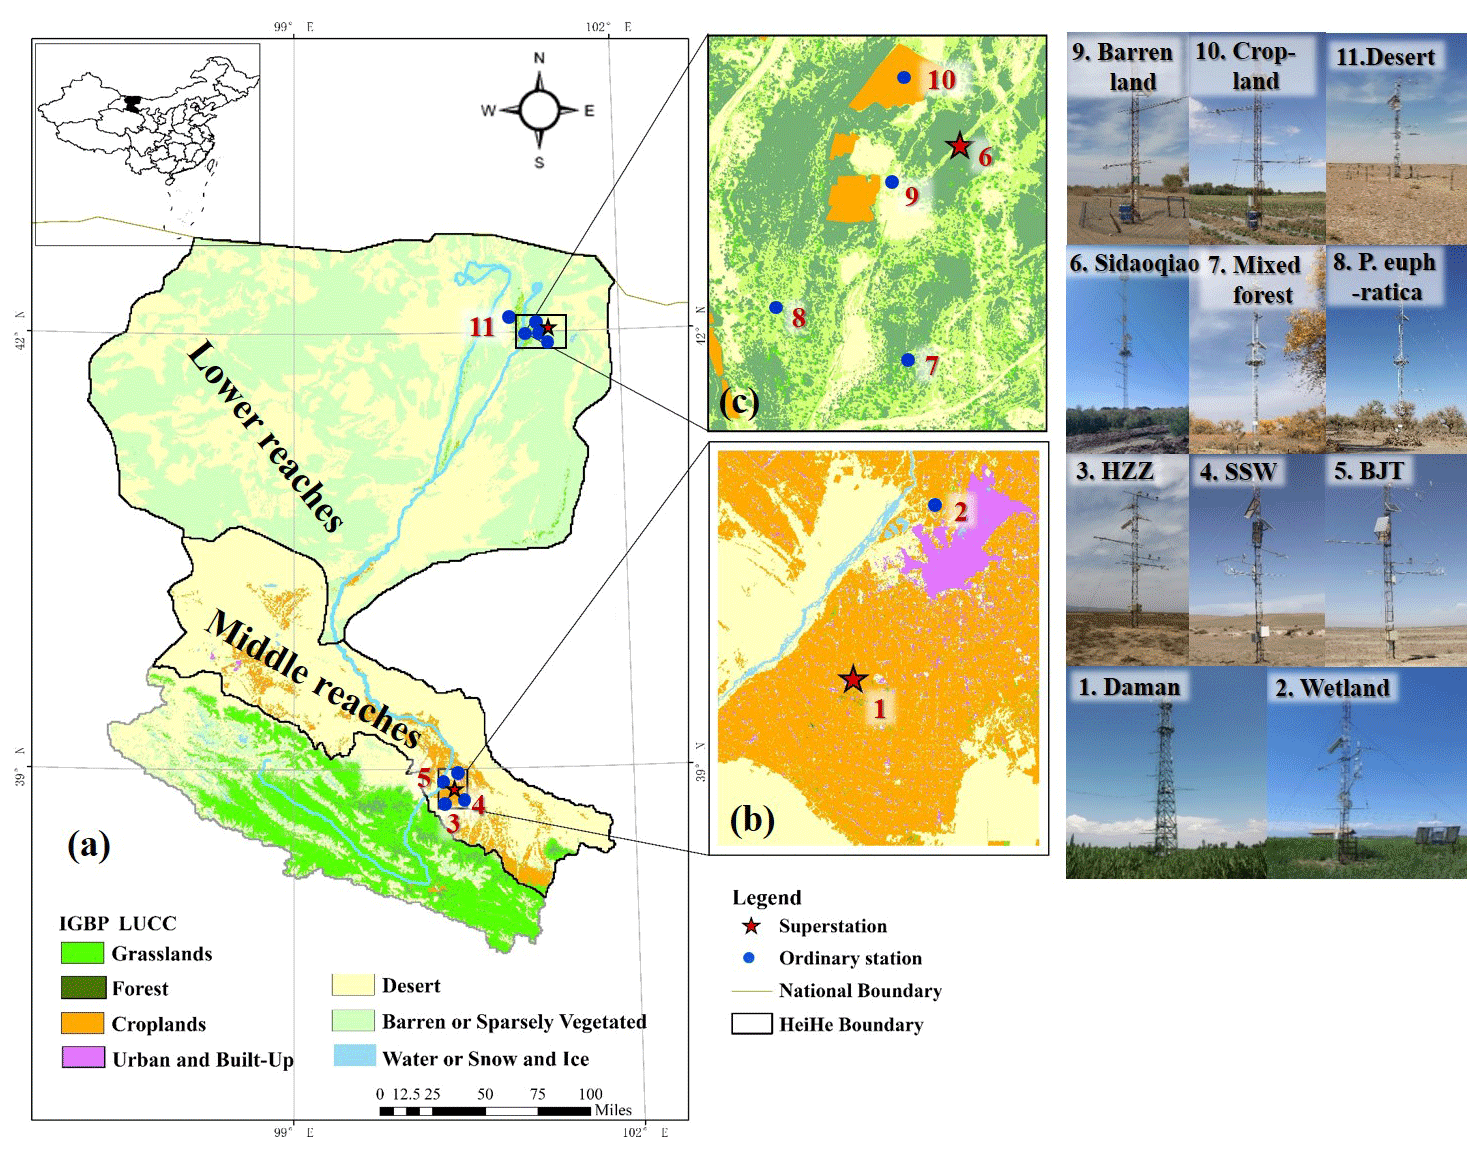
Figure 1The observation systems in the middle and lower reaches of the HRB. Panel (a) shows the Heihe River basin, panel (b) presents the stations in the Zhangye artificial oasis–desert area in the middle reaches, and panel (c) displays the stations in the Ejin Banner natural oasis area in the lower reaches. On the right side are photographs of each station.
Table 1Station information for the middle and lower reaches of the HRB.
2.2 Observation systems
2.2.1 Artificial oasis and desert areas in the middle reaches
The middle reaches are located in the Zhangye oasis in the city of Zhangye in Gansu Province. The primary underlying surfaces in the area include cropland (maize), shelterbelt, orchard, residential area, and wetland (reeds) in the oasis as well as sandy desert, desert steppe (Kalidium foliatum), and the Gobi Desert (Reaumuria) in the surrounding desert. Five stations (one superstation and four ordinary stations) were established on these surface types, which are representative of the main underlying surfaces within the oasis–desert area in the middle reaches of the HRB.
There is one superstation (maize and shelterbelt) and one ordinary station (wetland and reed) in the Zhangye oasis surrounded by three ordinary stations in the desert located in the middle reaches of the HRB (Fig. 2a). The superstation includes a multiscale observation system for energy, water vapor, and carbon fluxes (a lysimeter, eddy covariance system, and scintillometer for meter-scale to hundred-kilometer-scale observations) and soil moisture measurements (in situ soil moisture profile, cosmic-ray probe, and soil moisture wireless sensor network for meter-scale to hundred-kilometer-scale observations). It also includes a hydrometeorological gradient observation system to monitor parameters such as the profile (seven layers) of wind speed and direction, air temperature and humidity, carbon dioxide and water vapor concentration, one layer's four-component radiation, air pressure, precipitation, infrared temperature (two repetitions), nine and eight layers' soil temperature and moisture profile, and soil heat flux (three plates, with two buried under the bare soil between two corn plants and one buried under the corn plants). The eddy covariance and hydrometeorological gradient observation systems were installed on a 40 m tower. Optical and microwave scintillometer instruments were installed on both sides of the 40 m tower at a distance of 1854 m. There were also observations of vegetation parameters taken from the 40 m tower, including a visible and near-infrared phenological camera to monitor the vegetation index and crop growth curve, two photosynthetically active radiation (PAR) sensors to monitor PAR, a vegetation chlorophyll fluorescence observation system to monitor sun-induced chlorophyll fluorescence (SIF), and a leaf area index (LAI) wireless sensor network (28 nodes) to monitor multipoint LAI in the source area of the scintillometer (Figs. 2b, 4a).
The ordinary stations are comprised of an eddy covariance system, an automatic weather station (AWS), and a visible and near-infrared phenological camera. The observation elements of the AWS include parameters such as two layers' air temperature and humidity and wind speed and direction; one layer's four-component radiation, air pressure, and infrared temperature (two repetitions); two layers' precipitation; eight or seven layers' soil temperature and moisture; and soil heat flux (three plates) (Fig. 2c).
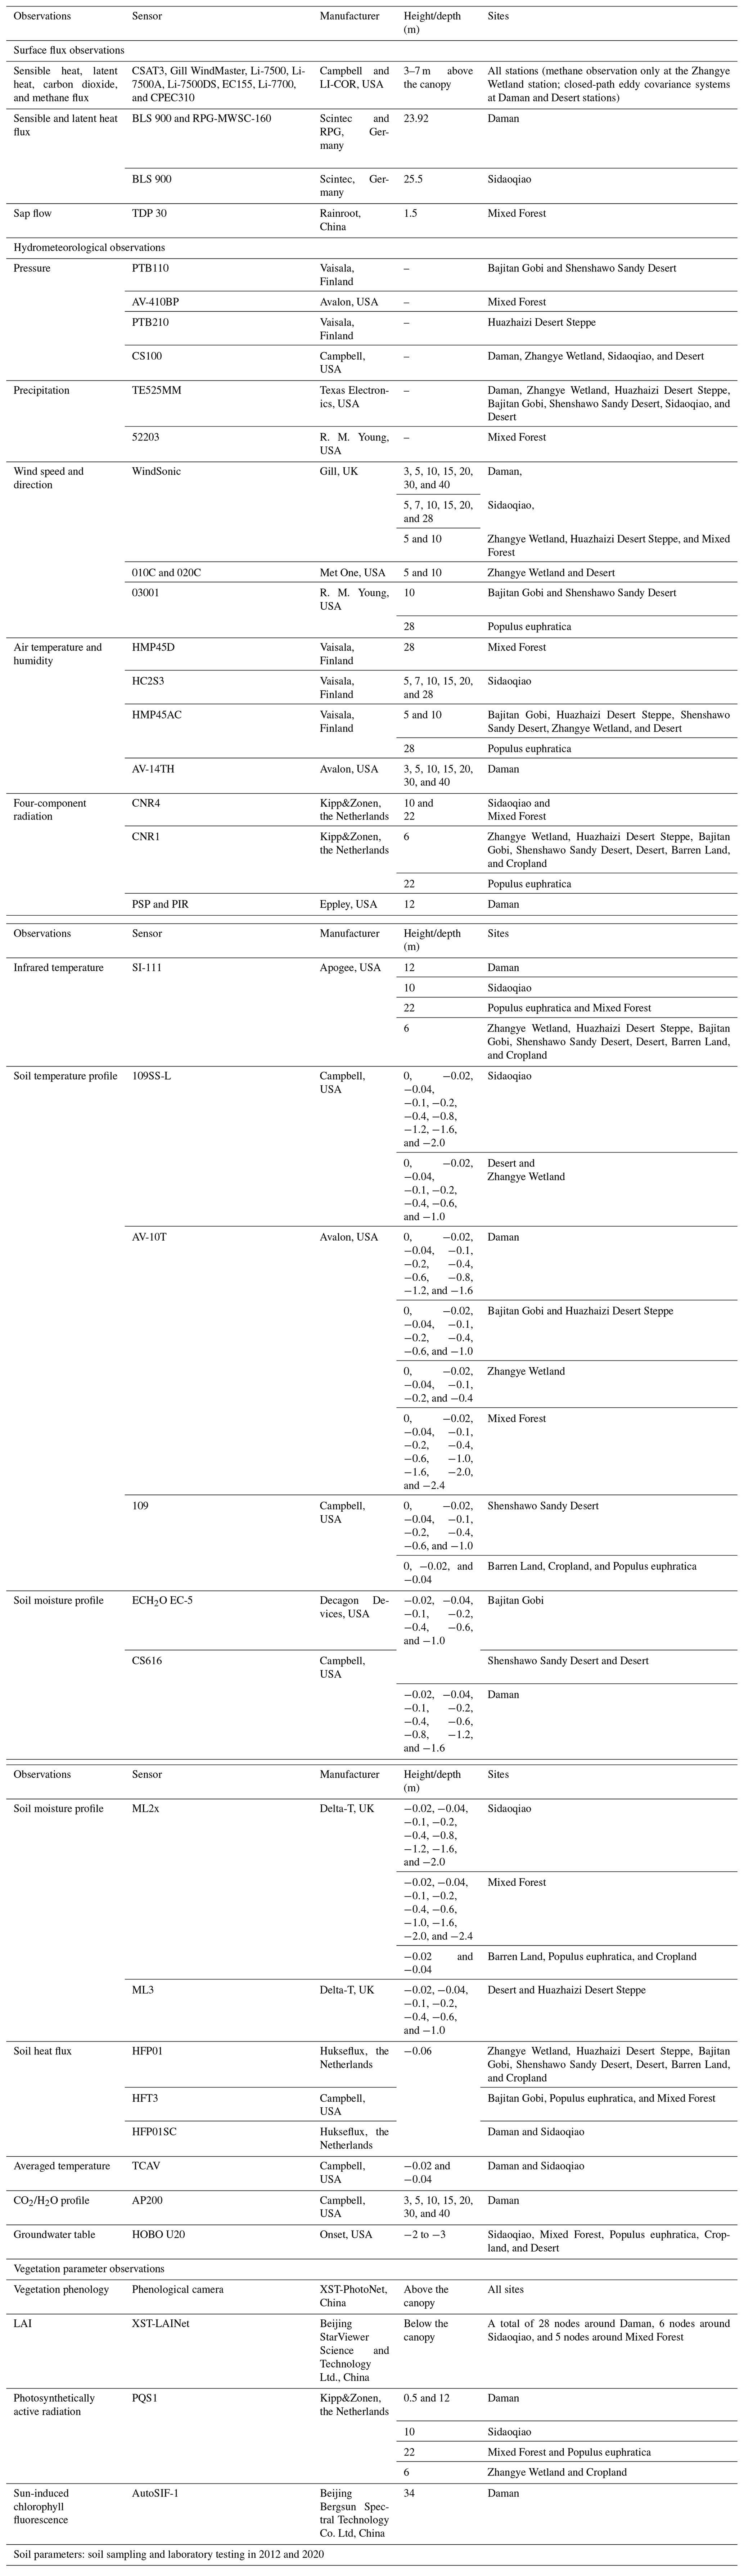
The sonic anemometers of the eddy covariance systems were installed at a height of approximately 3–7 m above the canopy to capture the sensible heat, latent heat, carbon dioxide and methane (in wetland) fluxes, etc. The sonic anemometers of all of the eddy covariance systems were aimed toward the north. Soil parameters, such as soil texture, porosity, bulk density, saturated hydraulic conductivity, and soil organic matter content, were investigated at each station in 2012 and 2020. Detailed information can be found in Table 2.
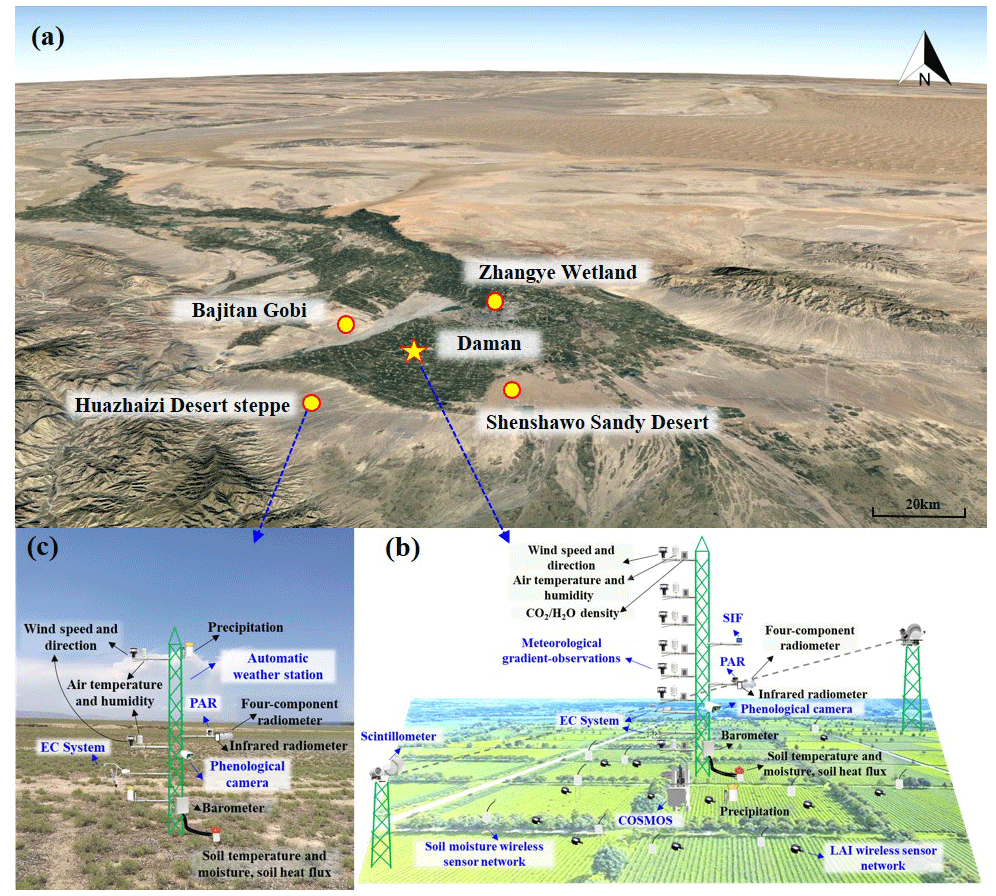
Figure 2Sketch map of the artificial oasis and desert area in the middle reaches. Panel (a) shows the artificial oasis and desert area (© Google Earth), panel (b) presents the Daman superstation, and panel (c) displays the Huazhaizi Desert Steppe ordinary station.
2.2.2 Natural oasis and desert areas in the lower reaches
The Ejin Banner oasis is located in the lower reaches of the HRB and belongs to Inner Mongolia and part of the city of Jiuquan in Gansu Province, which is surrounded by widespread desert. In the lower reaches, the main underlying surface types are Reaumuria and terminal lake in desert and riparian forest, cropland, barren land, and residential area in the oasis region. There are six stations (one superstation and five ordinary stations) in the lower reaches that are located in areas with the following land cover types: Populus euphratica, Tamarix chinensis, cropland, barren land, and desert.
In the oasis–desert area of the lower reaches, there is one superstation and four ordinary stations in the oasis and one ordinary station in the desert (Fig. 3a). Superstations include a multiscale observation system for energy, water vapor, and carbon fluxes (sap flow gauge, eddy covariance system, and large-aperture scintillometer for meter- to hundred-kilometer-scale observations) and soil moisture measurements (in situ soil moisture profile and cosmic-ray probe for meter- to hundred-meter-scale observations) and a hydrometeorological gradient observation system to monitor the profile (six layers) of parameters such as wind speed and direction and air temperature and humidity; one layer's four-component radiation, air pressure, and infrared temperature (two repetitions); two layers' precipitation; 10 or 9 layers' soil temperature and moisture profile; and soil heat flux (three plates, with two buried under bare soil and one buried under Tamarix plants). The eddy covariance and hydrometeorological gradient observation systems were installed on a 28 m tower. Two groups of large-aperture scintillometer instruments were installed on both sides of the 28 m tower at a distance of 2350 m. The vegetation parameter observations included PAR and the phenological camera, installed on the 28 m tower, to monitor the vegetation index and crop growth curve and an LAI wireless sensor network (11 nodes in the source area of the scintillometer) (Figs. 3b, 4b). The ordinary stations are comprised of an eddy covariance system, an AWS, and a visible and near-infrared phenological camera. (Fig. 3c).
Additionally, thermal infrared radiometers and imagers were installed at the Mixed Forest and Sidaoqiao stations to measure different component temperatures, i.e., the brightness temperature of different land cover types under different illumination conditions (Li et al., 2019). The soil parameters and groundwater table were also observed around the stations. Detailed information can be found in Table 2.
Table 2Observation variables and sensor configurations for surface flux, hydrometeorology, vegetation, and soil parameters.
The data processing and quality control procedure can be divided into data collection, data processing, and data archiving and sharing (Fig. 4).
In the data collection step, the comparison and calibration of instruments are prerequisites to ensure the quality of the observation data. To ensure the consistency and comparability of the instruments, instrument comparison experiments were specifically arranged in the Gobi Desert in the middle reaches in 2012 (Xu et al., 2013) and in a shrub-covered area in the lower reaches in 2013 (Li et al., 2018). In addition, the instruments with multiple layers were compared at the same height before installation, the soil moisture probes were compared under dry and wet conditions, and the multi-type rain gauges were compared in the same field. The infrared gas analyzers of all of the eddy covariance systems were calibrated at the beginning and end of the vegetation growing season every year. To ensure the data quality, a routine maintenance procedure was formulated and strictly followed, including daily (checking the real-time data via a remote monitoring and data management system for the field observation network v1.0), 10 d (checking the time series plot provided by the system), monthly (routinely inspecting every station), and annual (data processing and release) procedures (Liu et al., 2018). The Heihe watershed Internet of Things observation system was developed to complete the above maintenance procedure, which included processes such as remotely receiving and storing the field data, browsing and processing real-time data, monitoring the instrument status, and early warning of abnormal conditions.
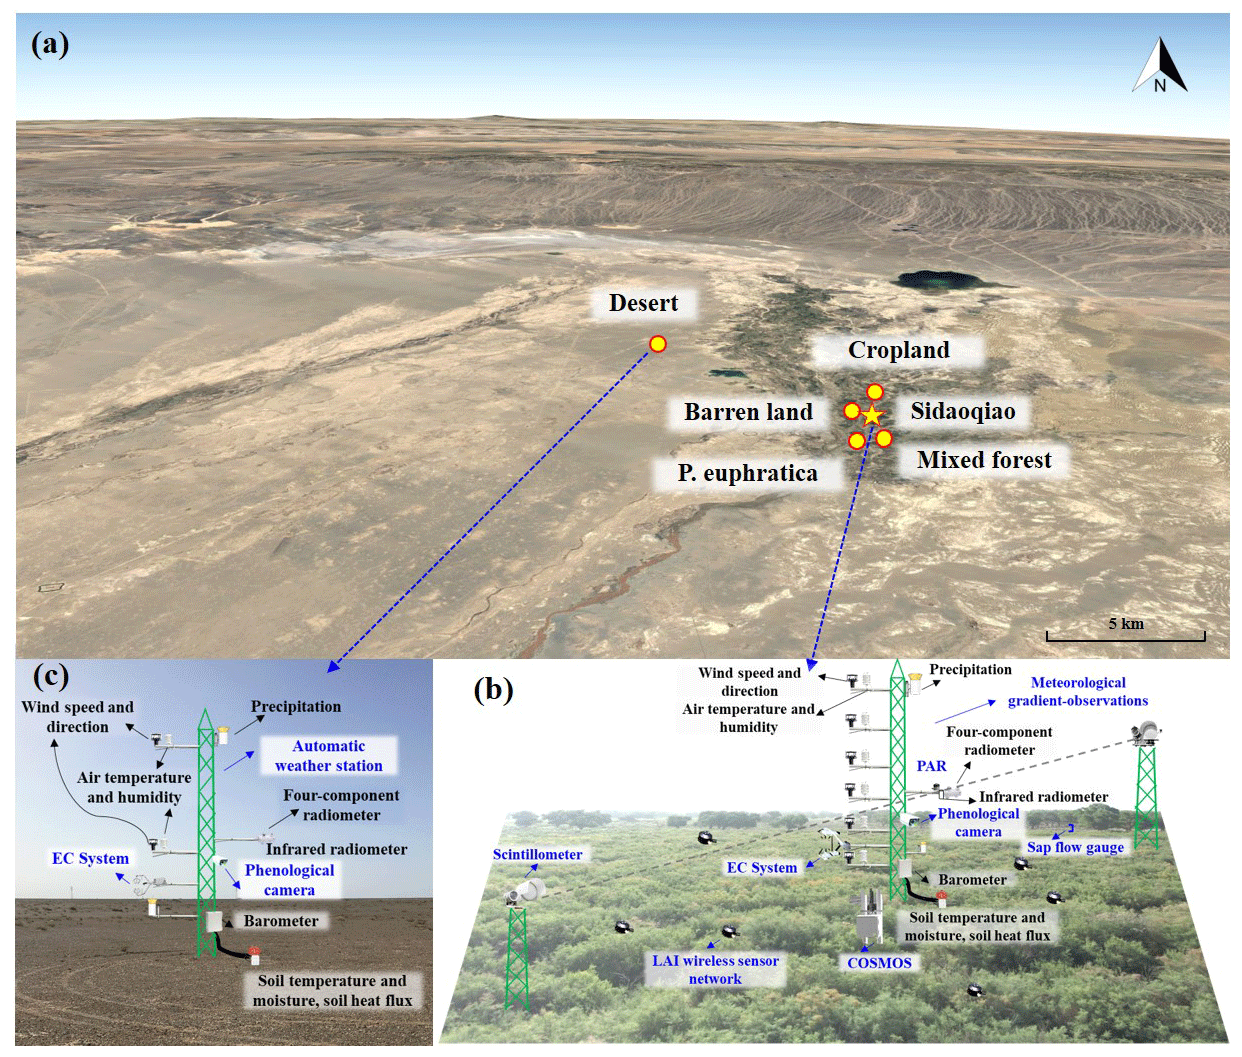
Figure 3Sketch map of the natural oasis and desert areas in the lower reaches. Panel (a) shows the natural oasis and desert area (© Google Earth), panel (b) presents the Sidaoqiao superstation, and panel (c) displays the Desert ordinary station.
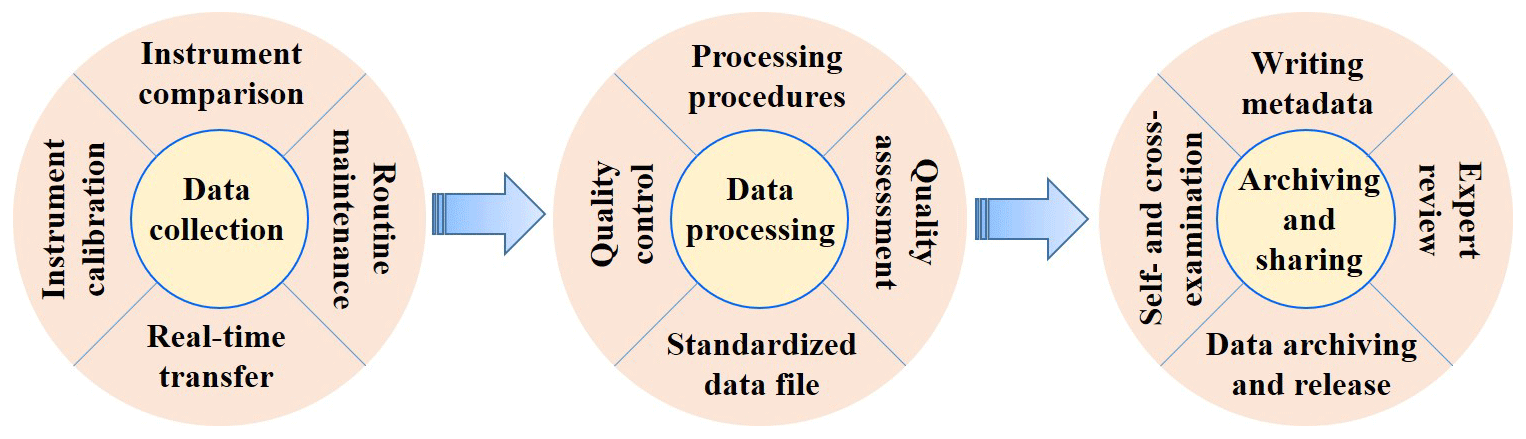
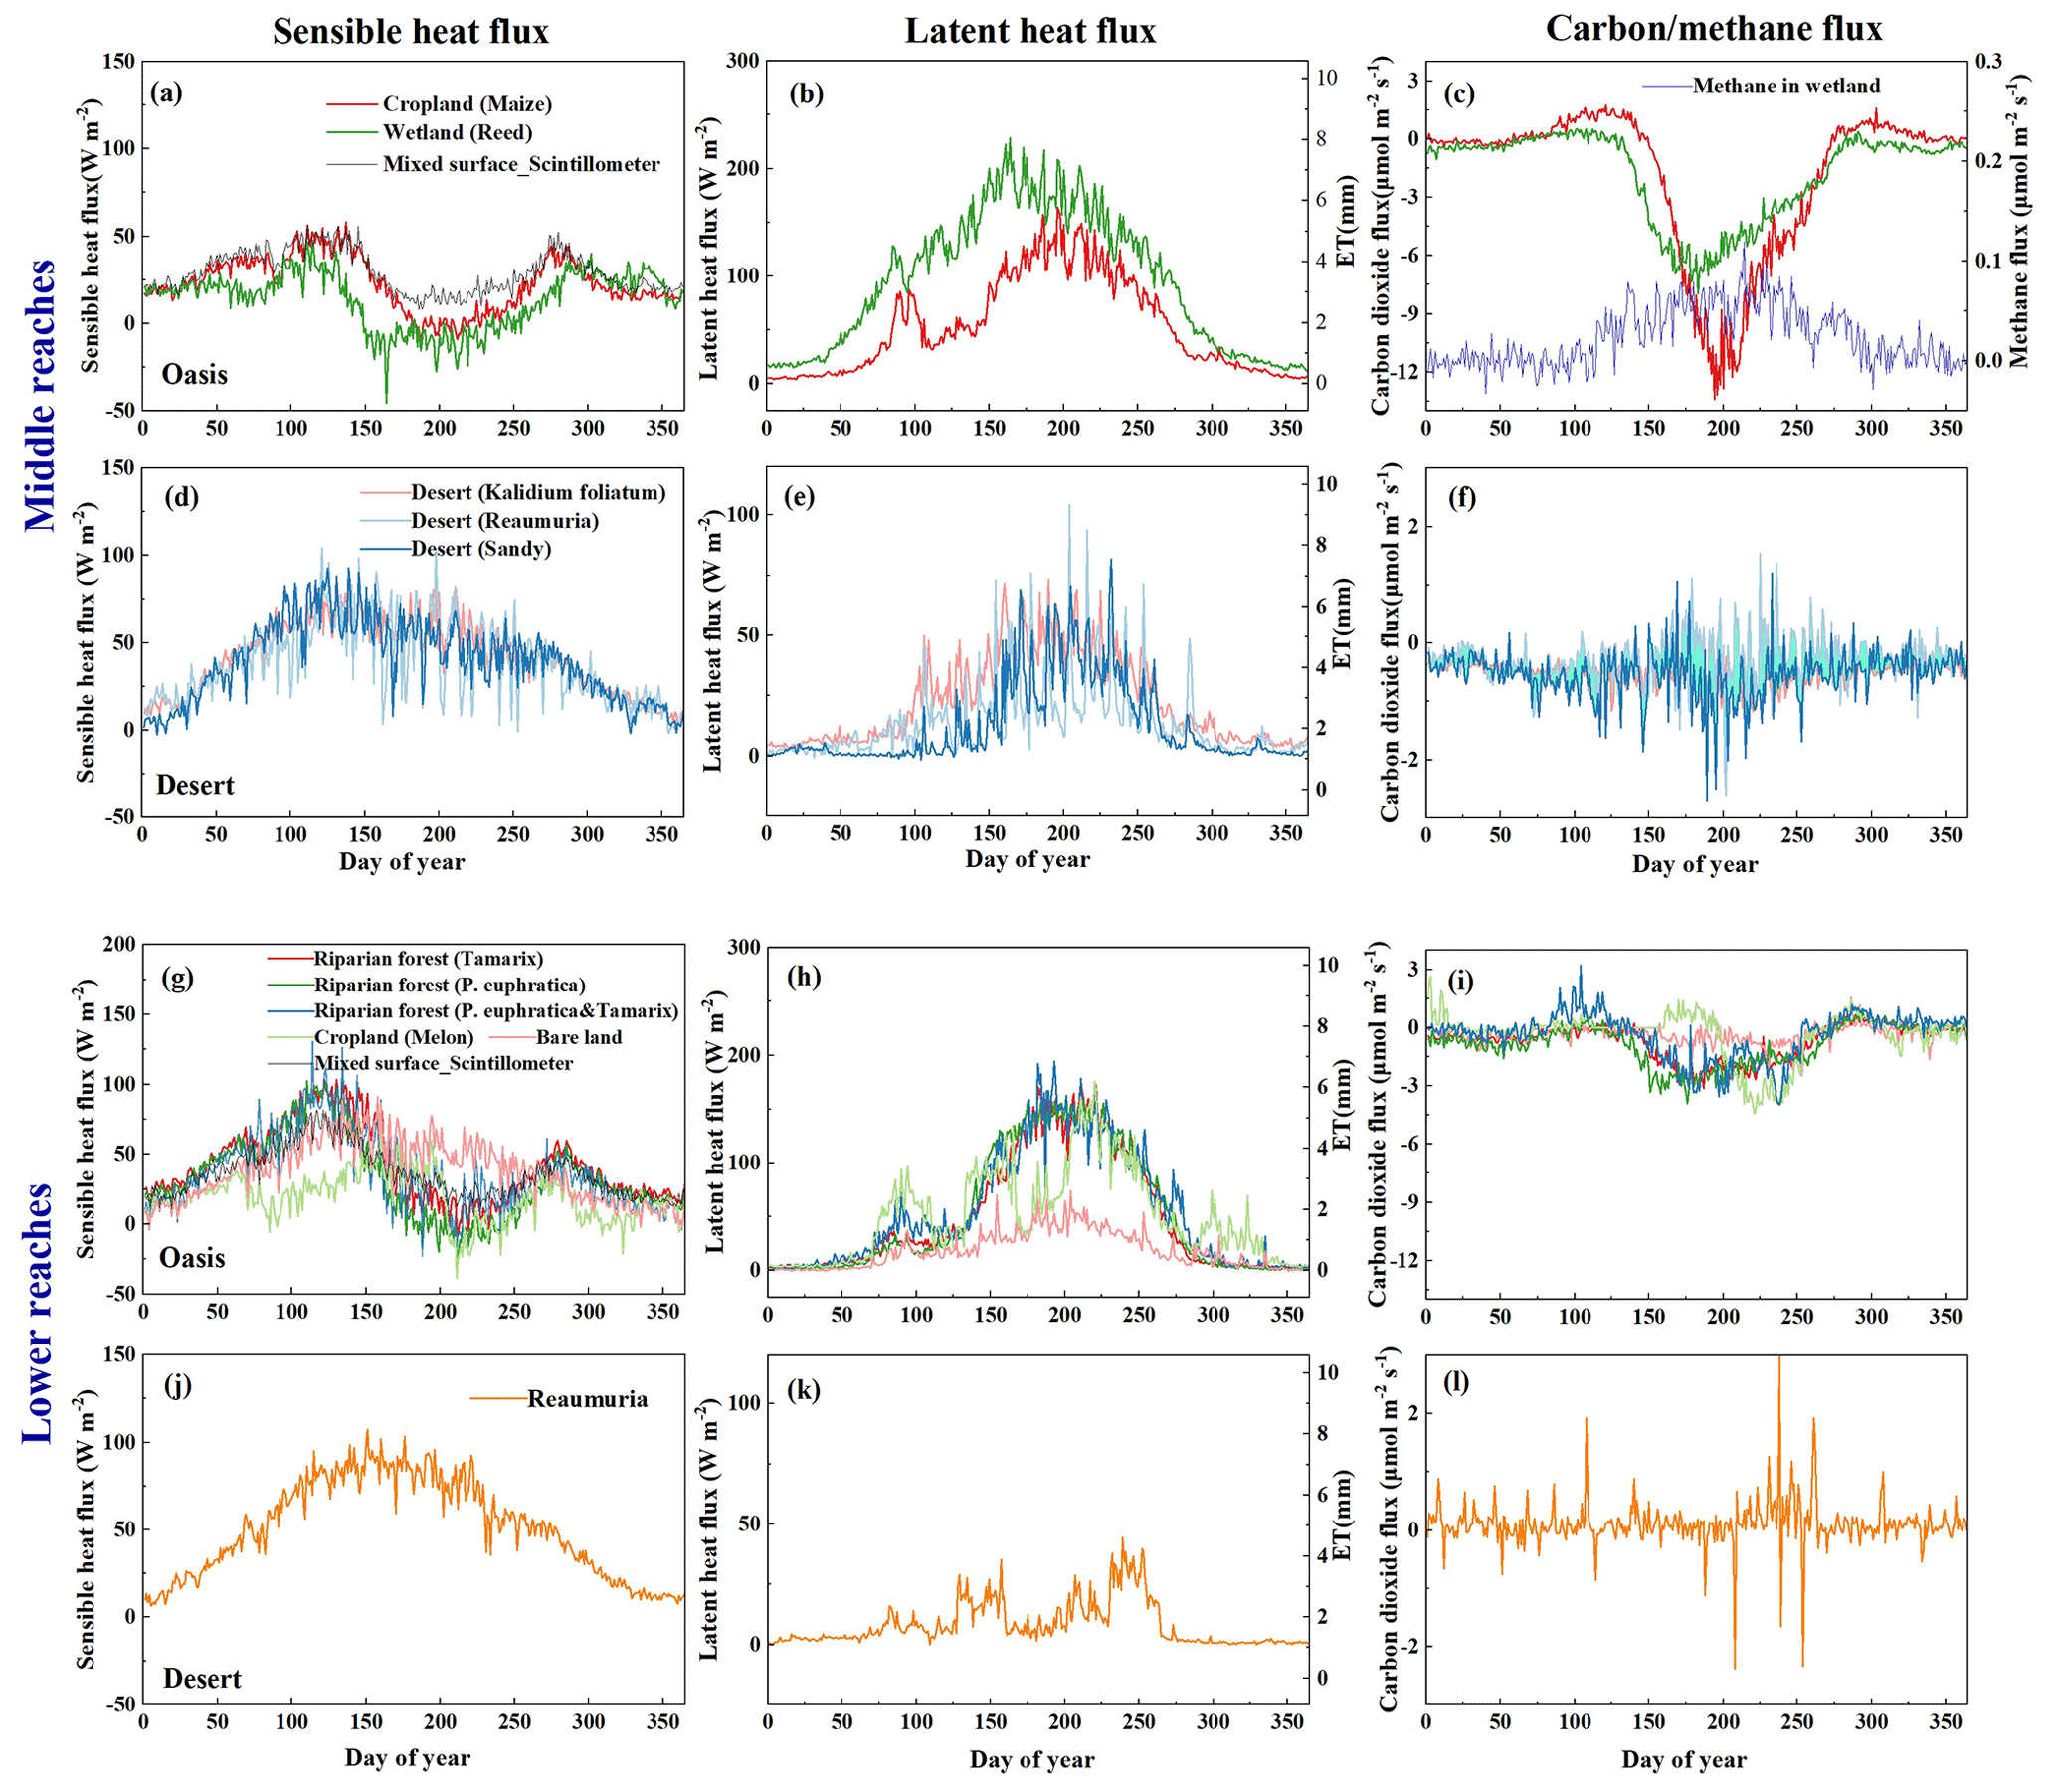
Figure 5The multiyear seasonal variations in sensible heat (a, d, g, j), latent heat (b, e, h, k), and carbon dioxide and methane (c, f, i, l) fluxes in the oasis–desert area for 2012–2021.
During the data processing step, a processing scheme was formulated for each type of instrument. For the eddy covariance system, the data were processed from the raw 10 Hz turbulent data, including spike detection, sonic temperature correction, coordinate rotation, frequency response correction, and Webb–Pearman–Leuning (WPL) correction. (Liu et al., 2016; Wu et al., 2023). Additionally, the 30 min flux data series were identified using quality flags according to the stationarity test and integral turbulence characteristics test. A final quality flag (1–9) was assigned to each specific turbulent flux value, indicating good quality (1–3), suitability for general use (4–6), poor but better than gap-filling data (7–8), and discarded data (9). The unclosed energy balance of the eddy covariance system is a universal problem. There was an approximate average energy imbalance of 17 % in our study area (Xu et al., 2017; Zhou and Li, 2018), which was reasonable compared with previous results (Stoy et al., 2013). The Bowen ratio correction method is recommended to close the energy balance (Twine et al., 2000; Xu et al., 2020). The data processing steps from scintillometer measurements to surface fluxes are as follows: raw data to light intensity variance; light intensity variance to the structure parameter of the refractive index of air (); to meteorological data; and, finally, obtaining surface fluxes combining the meteorological data. Four steps are taken to ensure the quality of scintillometer data (Liu et al., 2011; Zheng et al., 2023): (1) excluding data for beyond the saturation criterion, (2) excluding data obtained during periods of precipitation, (3) excluding data when the demodulated signal is small, and (4) excluding data when the sensor is malfunctioning. The steps of the meteorological gradient observation system and AWS data processing and quality control were twofold: (1) all of the AWS data were averaged over an interval of 10 min for a total of 144 records per day (missing data were denoted by −6999) and (2) the unphysical data were rejected (gaps were denoted by −6999). The surface soil heat flux was calculated using the “PlateCal” approach (Liebethal et al., 2005), and the final surface soil heat flux was the weighted vegetation fraction combined with the soil temperature and moisture measured above the heat plates. Approximately 10 %–20 % of values were missing or rejected for eddy covariance or scintillometer data. The look-up table (LUT) method is recommended to fill the gaps when data are missing (Xu et al., 2020). No more than 10 % of AWS data values were missing, and the linear interpolation method is recommended to fill the missing values. The vegetation growth curve and vegetation index can be obtained from the visible and near-infrared bands measured by phenological cameras. The key phenological parameters are determined according to growth curve fitting, such as the growth season start date, peak, and growth season end. The leaf area index (LAI) data were obtained from a LAINet sensor, which can continuously measure the multipoint total solar radiation above the canopy and the transmitted radiation below the canopy, and the LAI was calculated based on multiangle transmittance data (Qu et al., 2014). The 7 d moving averaged method is recommend to eliminate noise from the daily LAI observations (Qu et al., 2014). Then, all of the data were processed into a standardized file for sharing.
During the archiving and sharing step, the metadata were written for each data point, including the site description, processing step, header description, and other notes (Li et al., 2017a). Before data were released, self-examination, cross-checks, and an expert review are required to ensure data quality. Finally, the data were archived and shared online.
4.1 Energy, water vapor, and carbon flux data
The eddy covariance systems were used to measure the surface flux at all sites, namely, five stations (two in the oasis and three in the desert) in the middle reaches and six stations (five in the oasis and one in the desert) in the lower reaches. The turbulent flux data were recorded by the open-path or closed-path eddy covariance systems and processed carefully. In addition to the surface flux of sensible heat, latent heat, and carbon dioxide, the methane flux was also observed at the wetland site in the middle reaches (Table 2). The multiyear seasonal variations in sensible heat, latent heat, carbon dioxide, and methane fluxes are shown in Fig. 5. Generally, the latent heat fluxes in oases are obviously higher than those in deserts, especially in the lower reaches. The latent heat fluxes exhibited a single peak during 1 year, with a peak value of approximately 200 W m−2 in the oasis area; however, they significantly fluctuated due to irrigation (normally four times in cropland land cover of the midstream region and two times in riparian forest and melon land cover of the downstream region) or precipitation. In the middle reaches, the latent heat flux in the wetland area showed the largest values, which were more than 200 W m−2 in the crop growing season; the latent heat flux also presented relatively large values in the midstream piedmont desert region with dense Kalidium foliatum cover, with a peak value greater than 50 W m−2. In the lower reaches, the latent heat flux showed consistent variations in the riparian forest, with a peak value of approximately 150 W m−2 during the crop growing season; however, it showed large fluctuations in the melon surface cover area during growth due to frequent irrigation (approximately seven to eight times), and the bare land in the oasis and desert had a small latent heat flux.
The seasonal variations in sensible heat flux were totally different in the oasis and desert systems. The sensible heat flux showed two peaks in the oasis in both the middle and lower reaches, except for the bare land station, reaching maximum values at the end of April and September, and it showed minimum values in mid-August (−25 W m−2), corresponding to large values of latent heat flux in the oasis that were even greater than net radiation. This phenomenon has also been found by previous researchers (Liu et al., 2011) and is called the “oasis effect”. In the desert area, the sensible heat flux appeared as a single peak in spring and decreased gradually from then. The variation in sensible heat flux in the bare land of the natural oasis in the lower reaches is similar to that in the desert area.
In the oasis, the carbon dioxide (CO2) flux showed obvious “U” variations, especially in the middle reaches. Crops absorbed carbon dioxide (carbon sink) in the crop growing season, and a negative value of approximately −14 was observed in areas with maize land cover. The magnitude of the methane (CH4) flux was lower than the CO2 flux and was in the range of approximately 0–0.1 in the wetland region. The CH4 flux in the non-growing season was the lowest, and it increased rapidly in April. Although the magnitude of the CH4 flux was lower than the CO2 flux, the contribution of methane emissions to global warming was as important as CO2 contributions on a long timescale (Hommeltenberg et al., 2014; Q. Zhang et al., 2016), especially focusing on CH4 flux measurements in wetlands (Z. Zhang et al., 2022). The variations in CO2 flux in the riparian forest were relatively small, with values of approximately −0.4 in the plant growing season. There was little carbon sequestration in the desert area due to little or sparse vegetation, and the CO2 flux in the desert area was very small, fluctuating around zero.
4.2 Hydrometeorological data
The hydrometeorological data were obtained from 13 AWSs, with 6 in the middle reaches (Fig. 2) and 7 in the lower reaches (Fig. 3) of the HRB. All of the AWSs recorded four-component radiation (shortwave and longwave upward and downward radiation), soil heat flux, surface and soil temperature profiles, air temperature and humidity, wind speed and direction, air pressure, precipitation, soil moisture profiles, infrared temperature, and the groundwater table in the lower reaches. (Table 2). All sensors were calibrated and intercompared before being mounted. The sampling frequencies, reference heights, and directions of these sensors at all stations were identical to maintain consistency.
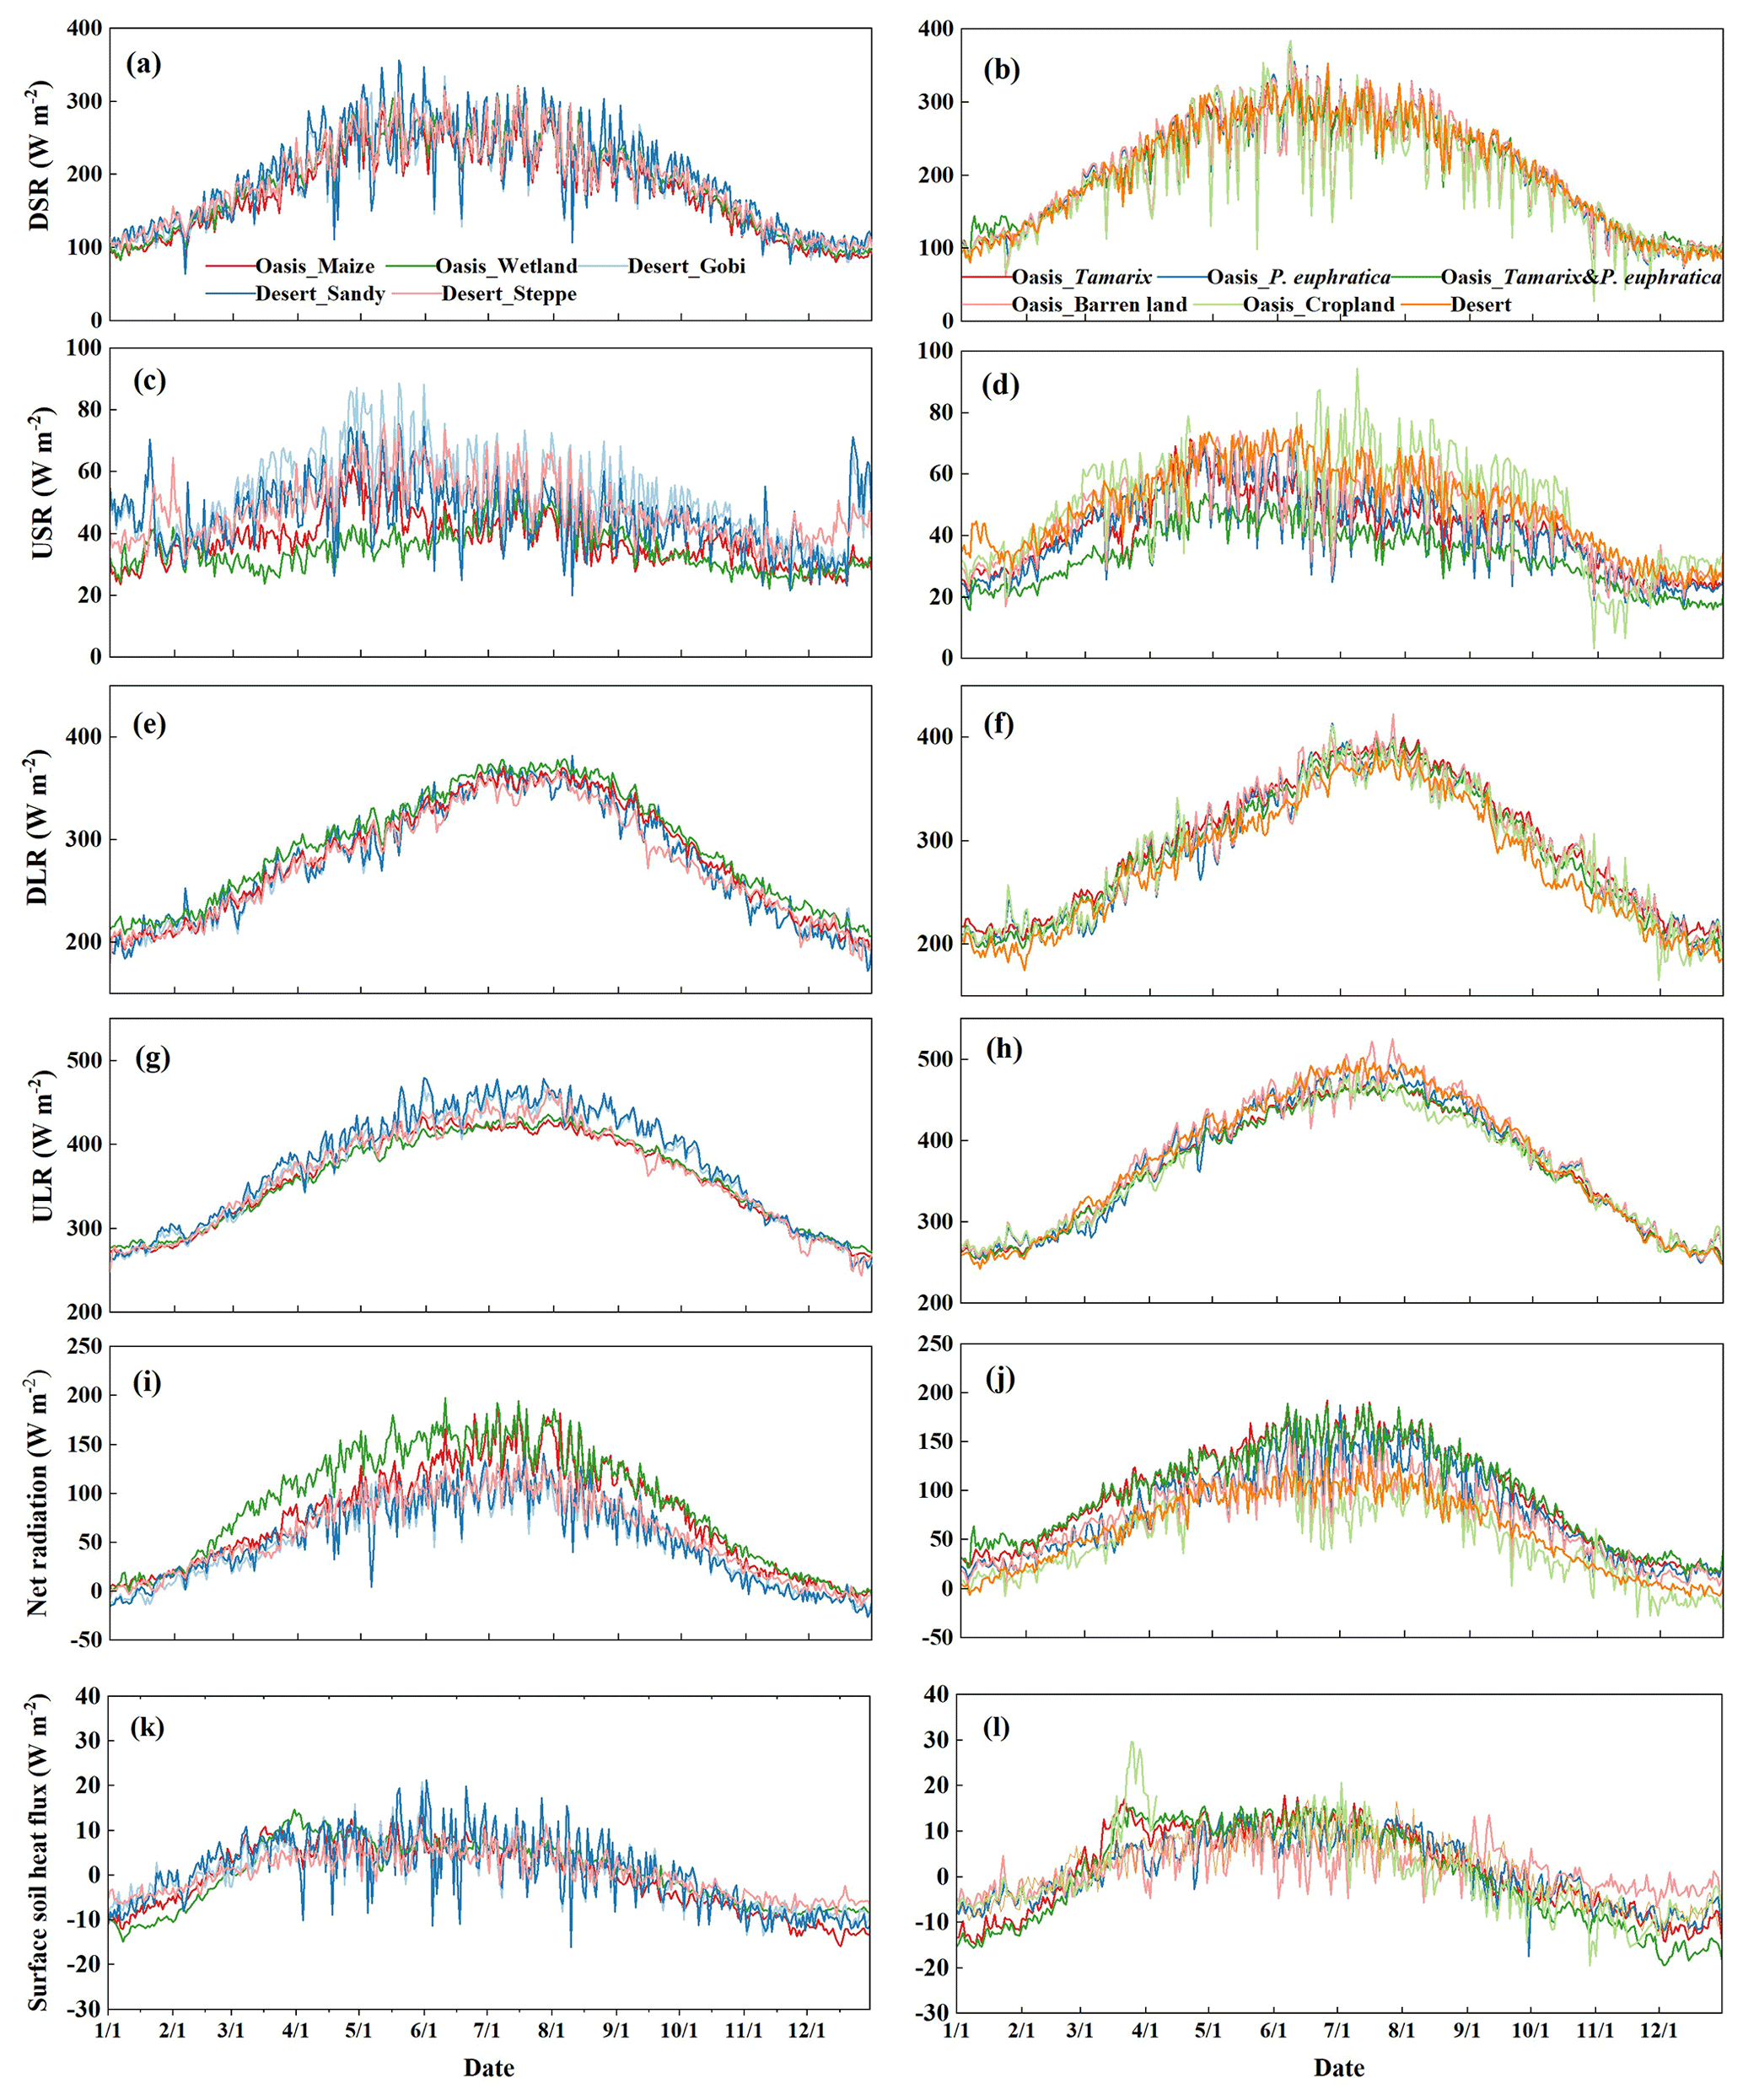
Figure 6Seasonal variations in the multiyear average radiation components, including the daily averaged downward shortwave radiation (DSR), upward shortwave radiation (USR), downward longwave radiation (DLR), and upward longwave radiation (ULR), in the oasis–desert system for the middle reaches (a, c, e, g, i, k) and lower reaches (b, d, f, h, j, l) for 2012–2021.
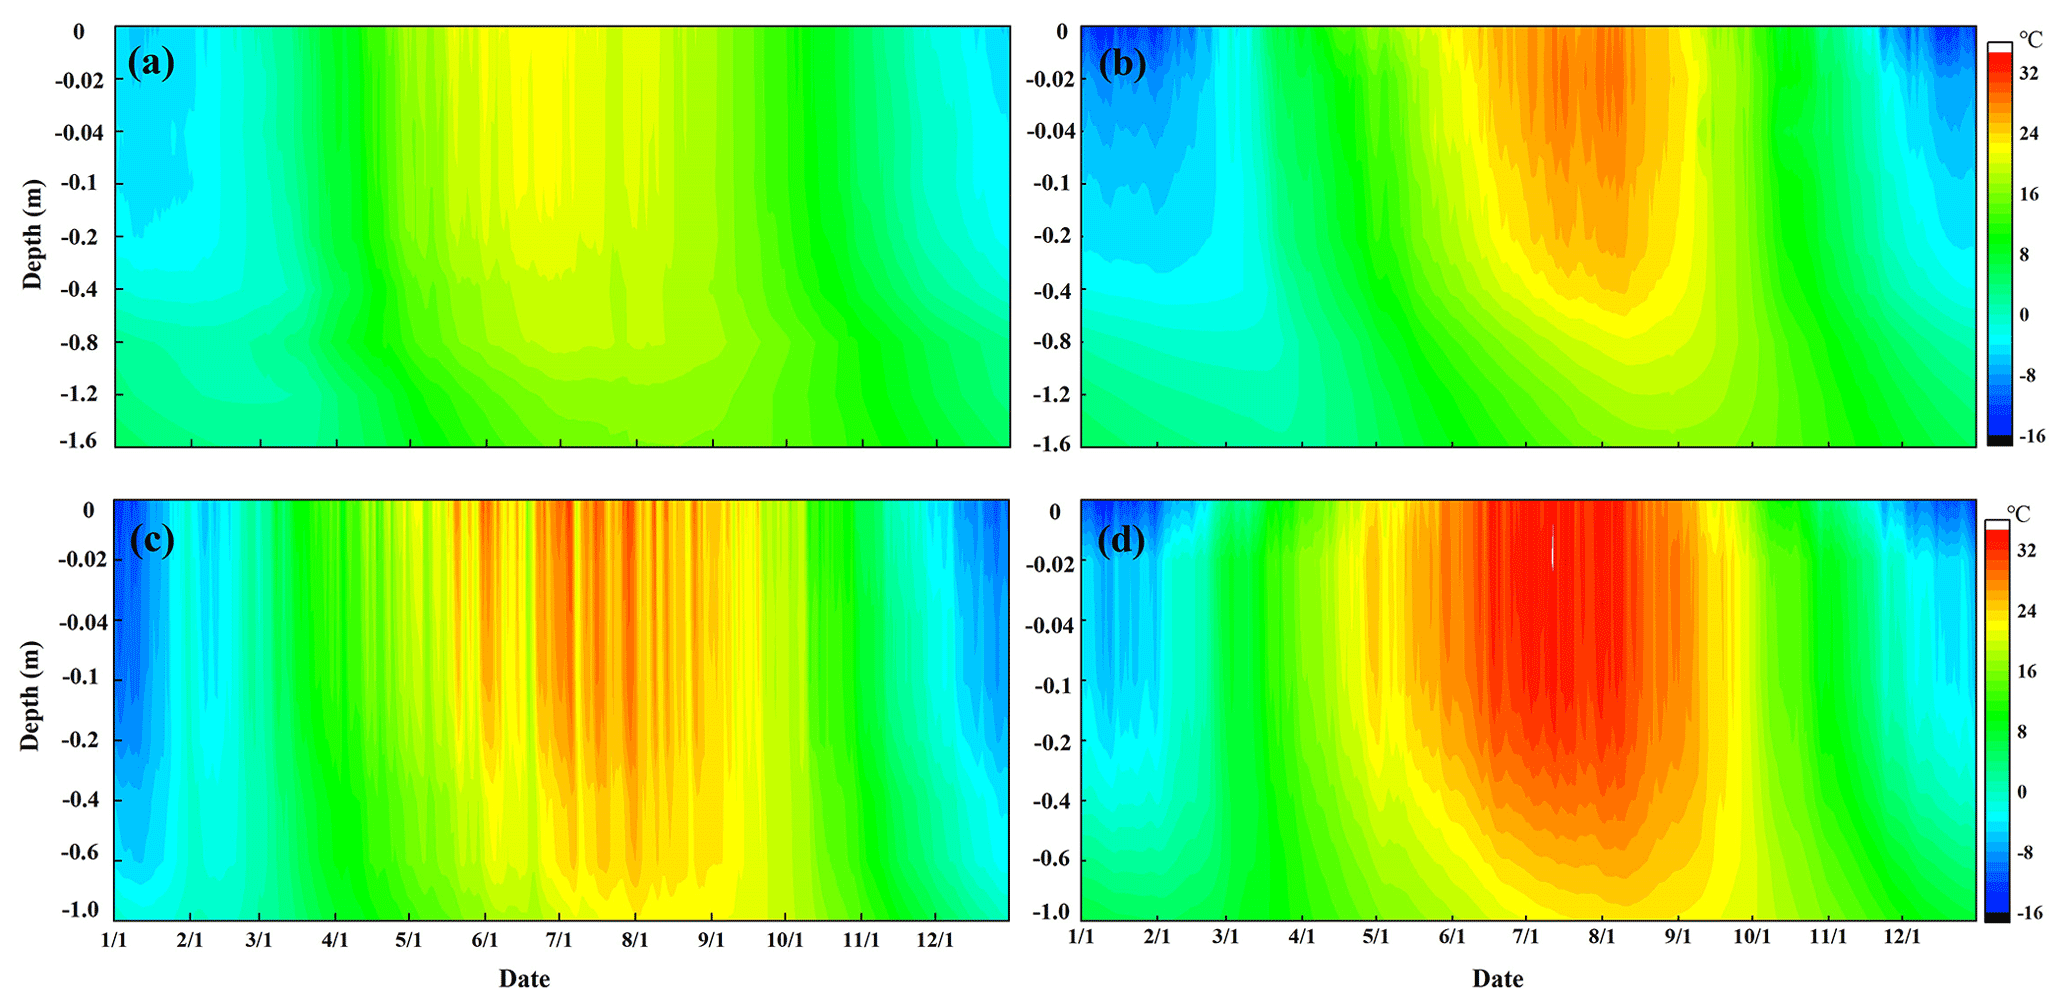
Figure 7Seasonal variations in the surface and soil temperature profiles in oasis and desert areas for 2012–2021. Panel (a) shows the oasis in the middle reaches – maize; panel (b) presents the oasis in the lower reaches – Tamarix; panel (c) displays the desert in the middle reaches – Reaumuria; and panel (d) shows the desert in the lower reaches – Reaumuria.
4.2.1 Radiation, soil heat flux, and surface and soil temperature profiles
It is important to understand the variations in radiation and surface soil heat flux in oasis and desert areas, as they comprise the surface-available energy. Figure 6 shows the four radiation components and soil heat flux in oasis and desert areas in the middle and lower reaches of the HRB, and all of the variables exhibited obvious seasonal variations with an inverted “U” shape. The incoming shortwave radiation values were consistent with each other in the oasis and desert because of the short distance among the sites. Due to the higher albedo in the desert, the upward shortwave radiation in the desert was higher than that in the oasis (approximately larger than 30 %). The incoming longwave radiation originates from the atmosphere (in particular CO2 and water vapor) and from thermal radiation from clouds in the lower atmosphere. The oasis presents relatively high water vapor and cloudiness levels; thus, the incoming longwave radiation in the oasis was greater than that in the desert (approximately 2 %). It is to be expected that, under dry conditions during the daytime, the surface temperature of the desert will be significantly greater than that of the well-watered oasis site. Consequently, the upward longwave radiation in the desert was larger than that in the oasis (approximately 8 %). The net radiation, driving the turbulent fluxes of sensible heat and latent heat at the Earth surface and heating the soil, was greater in the artificial oasis and natural oasis than that in the desert at approximately 50 W m−2. The daily mean surface soil heat fluxes varied similarly in oasis and desert areas with relatively low values in the range of −20 to 20 W m−2.
The soil temperature exhibited a signal peak throughout the year in the range of −15 to 34 ∘C, and it decreased with increasing soil depth during the plant growing season; however, it exhibited an increasing trend in winter. The shallow soil began to thaw at the beginning of spring (March) and to freeze in autumn (November). The soil temperature changed little with depth when it exceeded 0.8 and 1 m in the oasis and desert, respectively. The soil temperature in the desert was significantly higher (by approximately 10 ∘C) during the plant growing season than that in the oasis in both the middle and lower reaches. Additionally, the soil temperature in the artificial oasis–desert area (middle reaches) was approximately 5 ∘C lower during the plant growing season than that in the natural oasis–desert area (lower reaches) (Fig. 7).
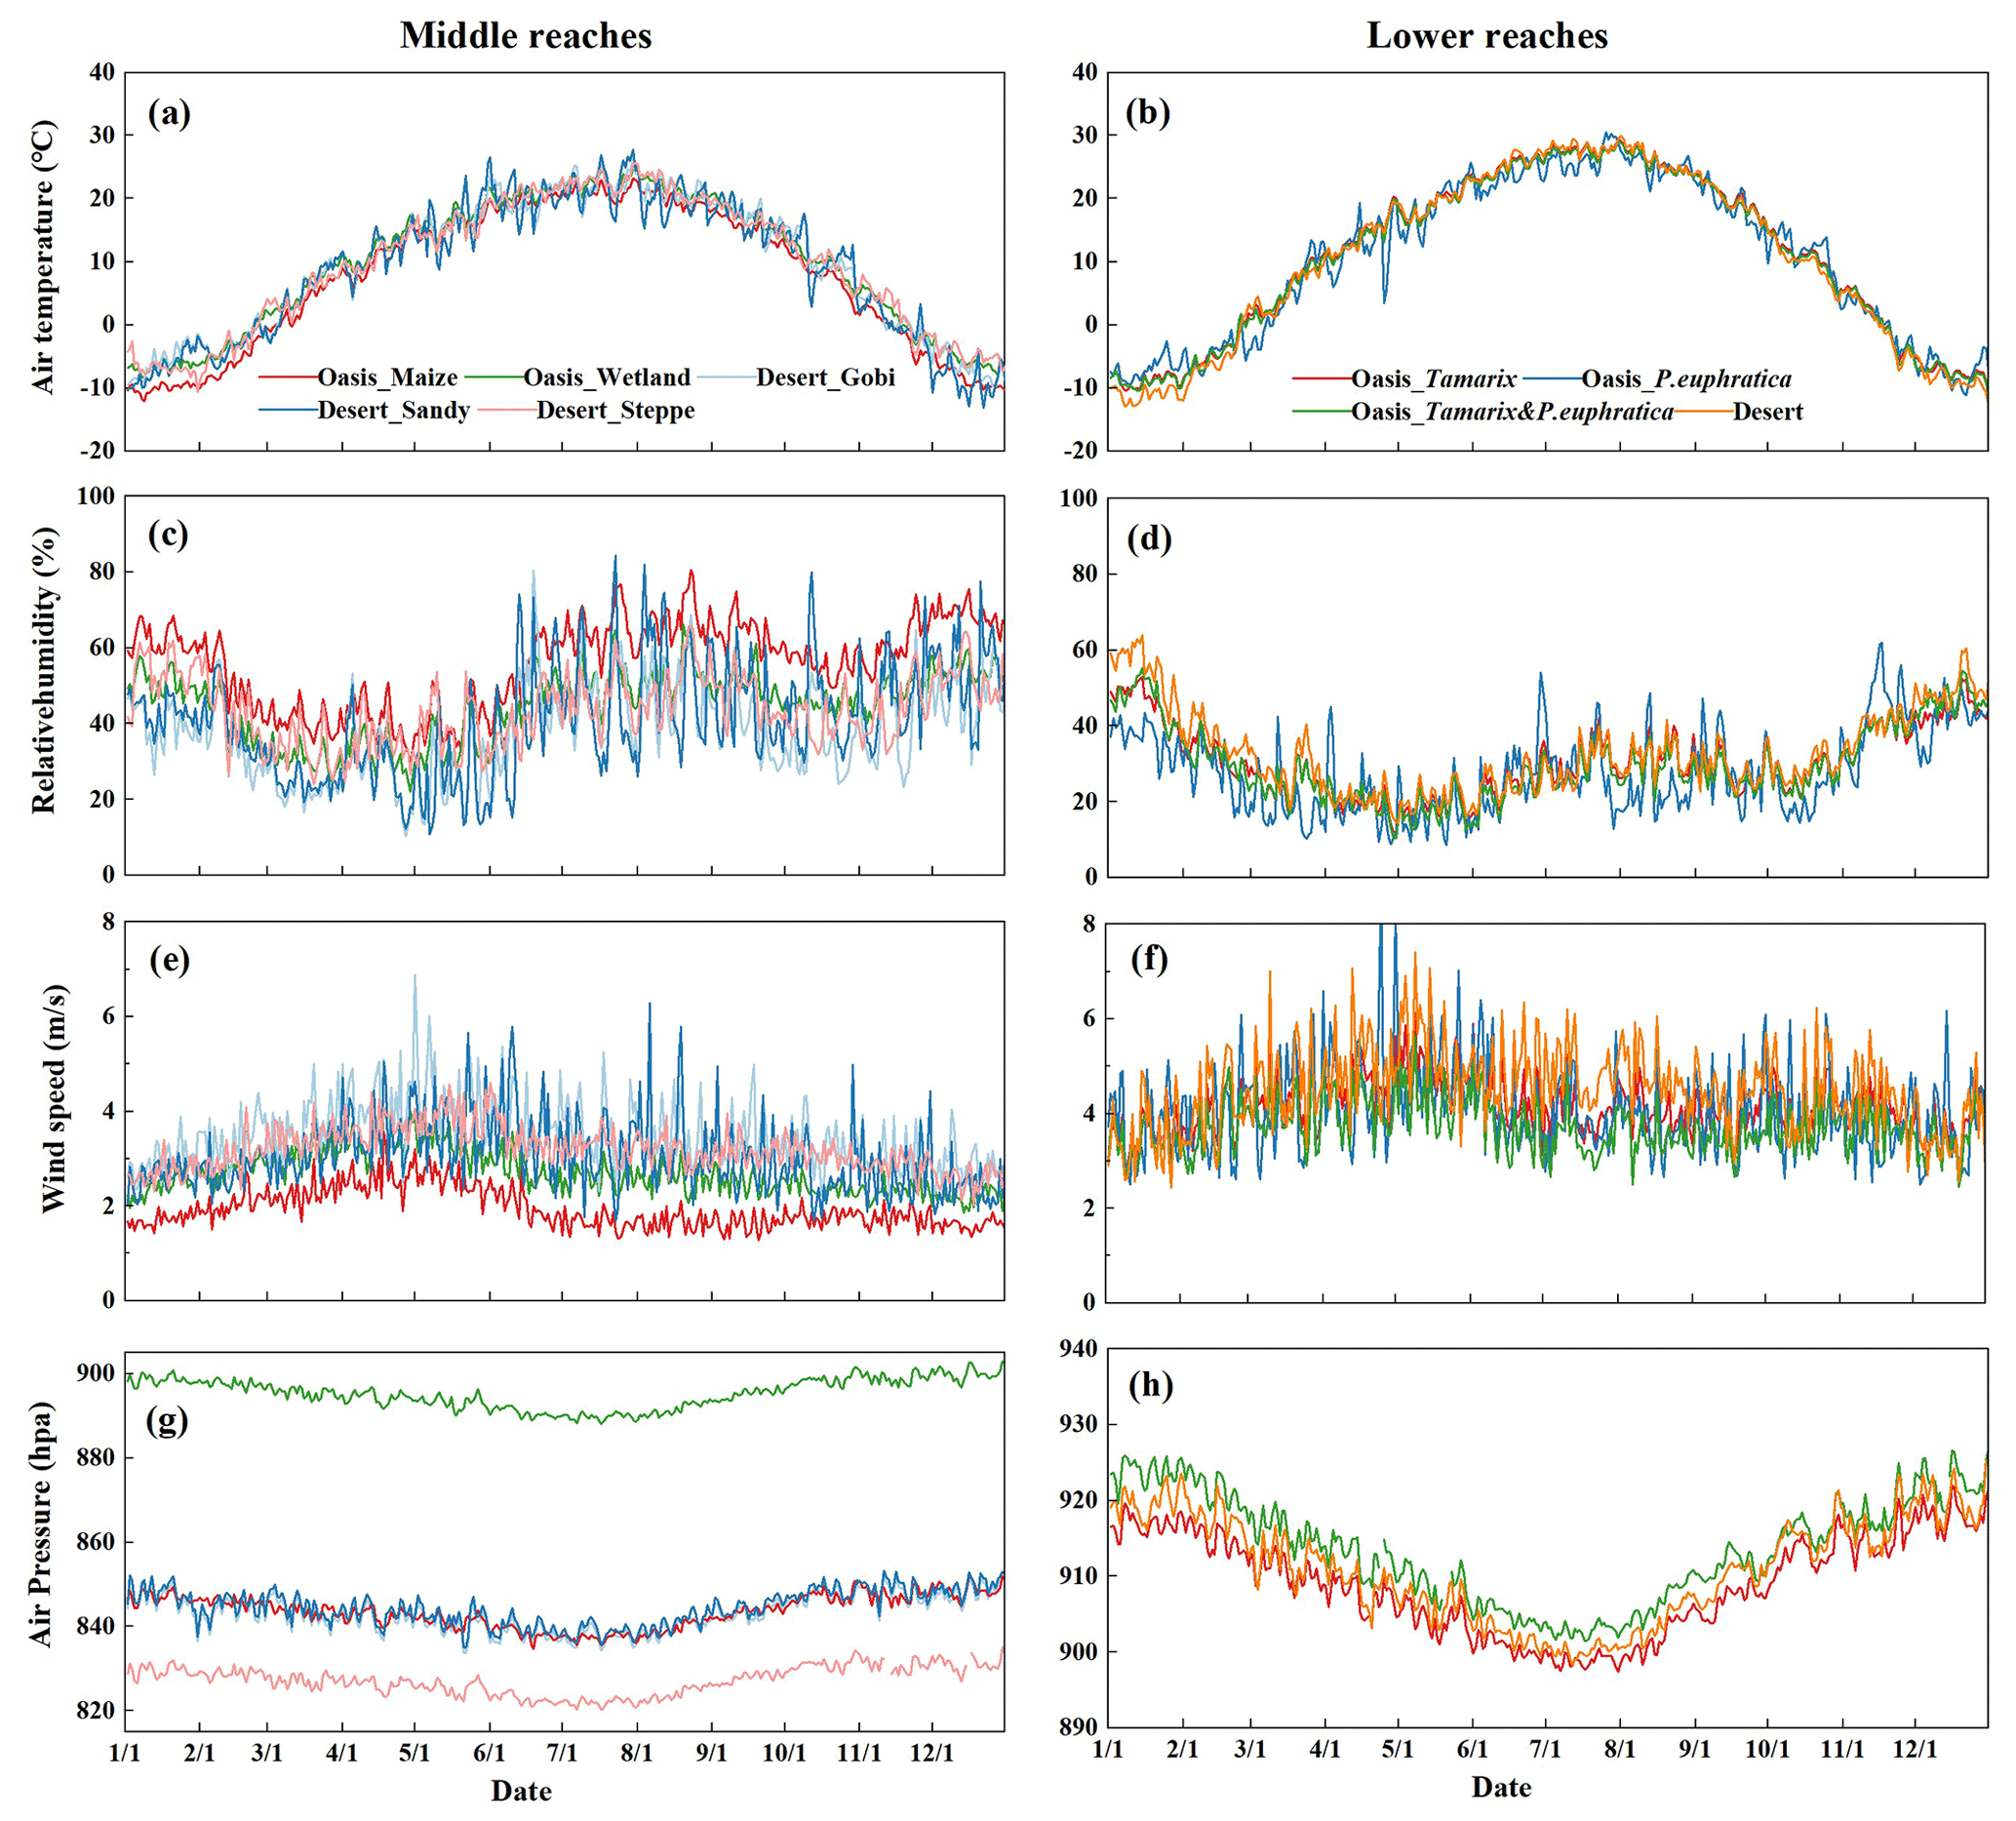
Figure 8Micrometeorological comparison between the oasis and desert with respect to (a, b) air temperature, (c, d) relative humidity, (e, f) wind speed, and (g, h) air pressure for 2012–2021.
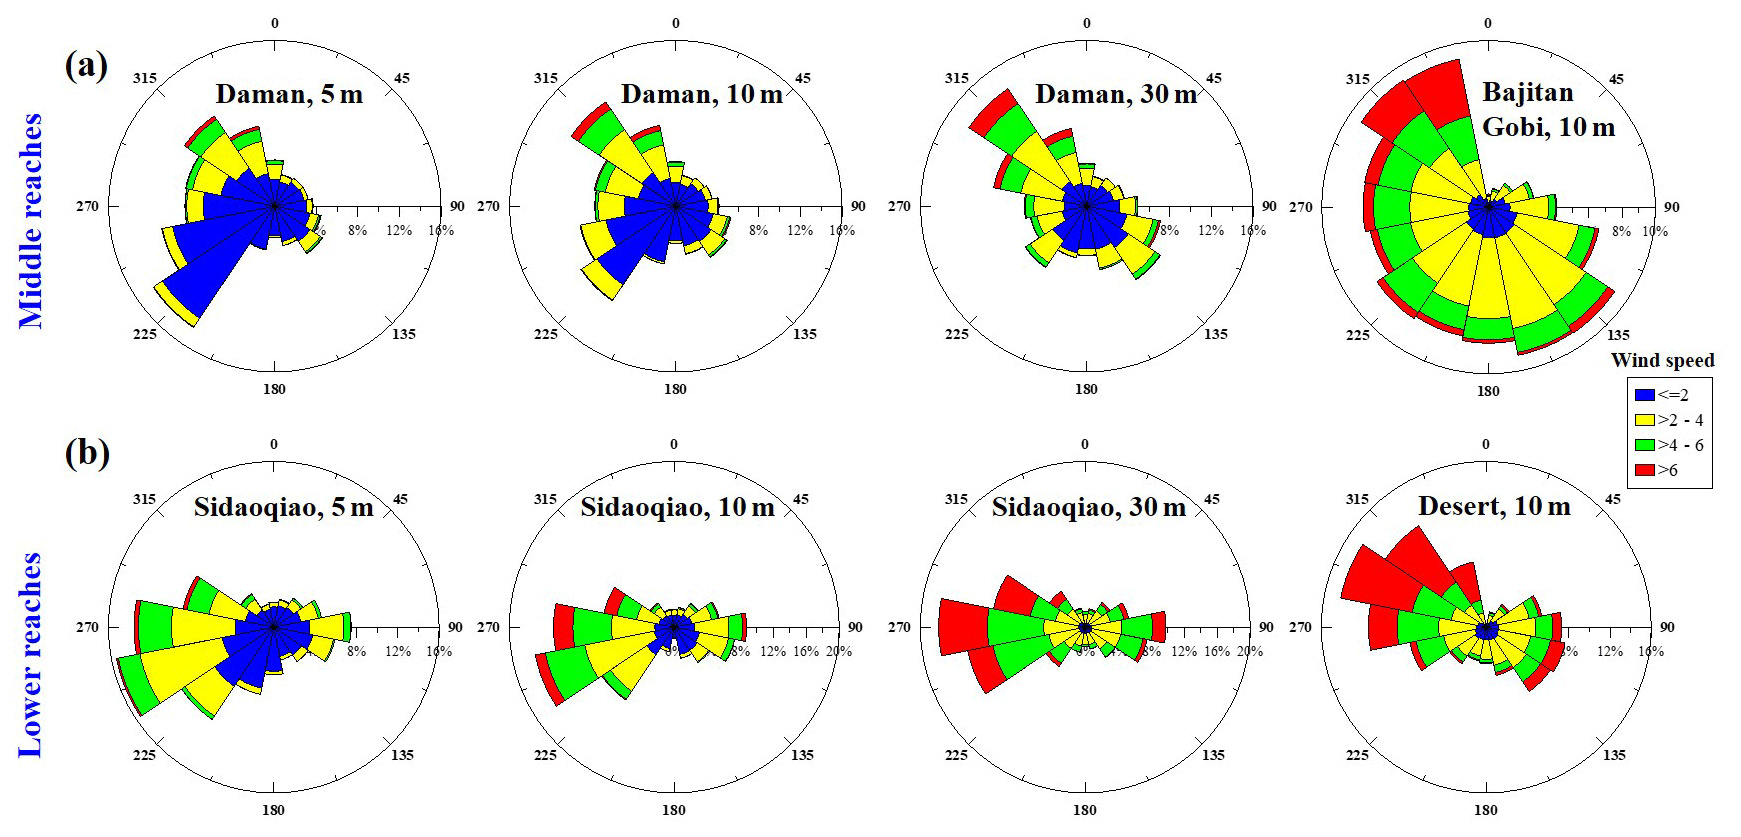
Figure 9Wind speed and direction in the oasis and desert area in 2012–2021 for (a) the artificial oasis–desert area in the middle reaches and (b) the natural oasis–desert area in the lower reaches. The legend shows the wind speed.
4.2.2 Air temperature and humidity, wind speed and direction, and air pressure
To show micrometeorological characteristics clearly, comparisons of daily average air temperature and relative humidity (5 m except the P. euphratica surface type with a height of 28 m), wind speed (10 m), and air pressure in the desert and oasis are plotted in Fig. 8. The seasonal variation in air temperature in the oasis and desert was similar; however, the air temperature in the desert was generally higher than that in the oasis by approximately 0.6 ∘C on annual average (approximately 0.4 ∘C in the plant growing season). In contrast, the relative humidity in the desert was lower than that in the artificial oasis in the midstream region (approximately 9 % and 10 % in the annual and plant growing seasons, respectively). The relative humidity values in the natural oasis and desert areas are similar due to the fact that both are extremely arid regions with rare precipitation and little irrigation and the natural oasis area is small. Generally, the desert surface has the characteristics of high temperature and low humidity, and the oasis is a cold and wet island. In the middle and lower reaches of the oasis and desert areas, the wind speed in the desert was obviously higher than that in the oasis because of the wind shield effect in the oasis (middle reaches: 1–3 m s−1 in the oasis and 2–6 m s−1 in the desert; lower reaches: 3–6 m s−1 in the oasis and 3–7 m s−1 in the desert), and the wind speed decreased significantly when passing by windbreaks, buildings, and crops, especially in the artificial oasis in the middle reaches. The lower wind speed in oases aids plant growth, the creation of an environment conducive to human survival, and the maintenance of oasis and desert ecosystems (Wang and Cheng, 1999). While the seasonal variation in wind speed between the desert and oasis was similar, this indicated that they were controlled by the same synoptic system. The wind speed in the natural oasis in the lower reaches was higher than that in the artificial oasis in the middle reaches. The maximum wind speeds were observed in April in both the artificial and natural oases, while the minimum values were observed in July. The air pressure decreased with decreasing elevation (e.g., the air pressure in the middle reaches, which had relatively high elevation, was lower than that in the lower reaches). The different air pressures at the stations in the middle reaches were also caused by the different elevations (Fig. 10g, h; Table 1).
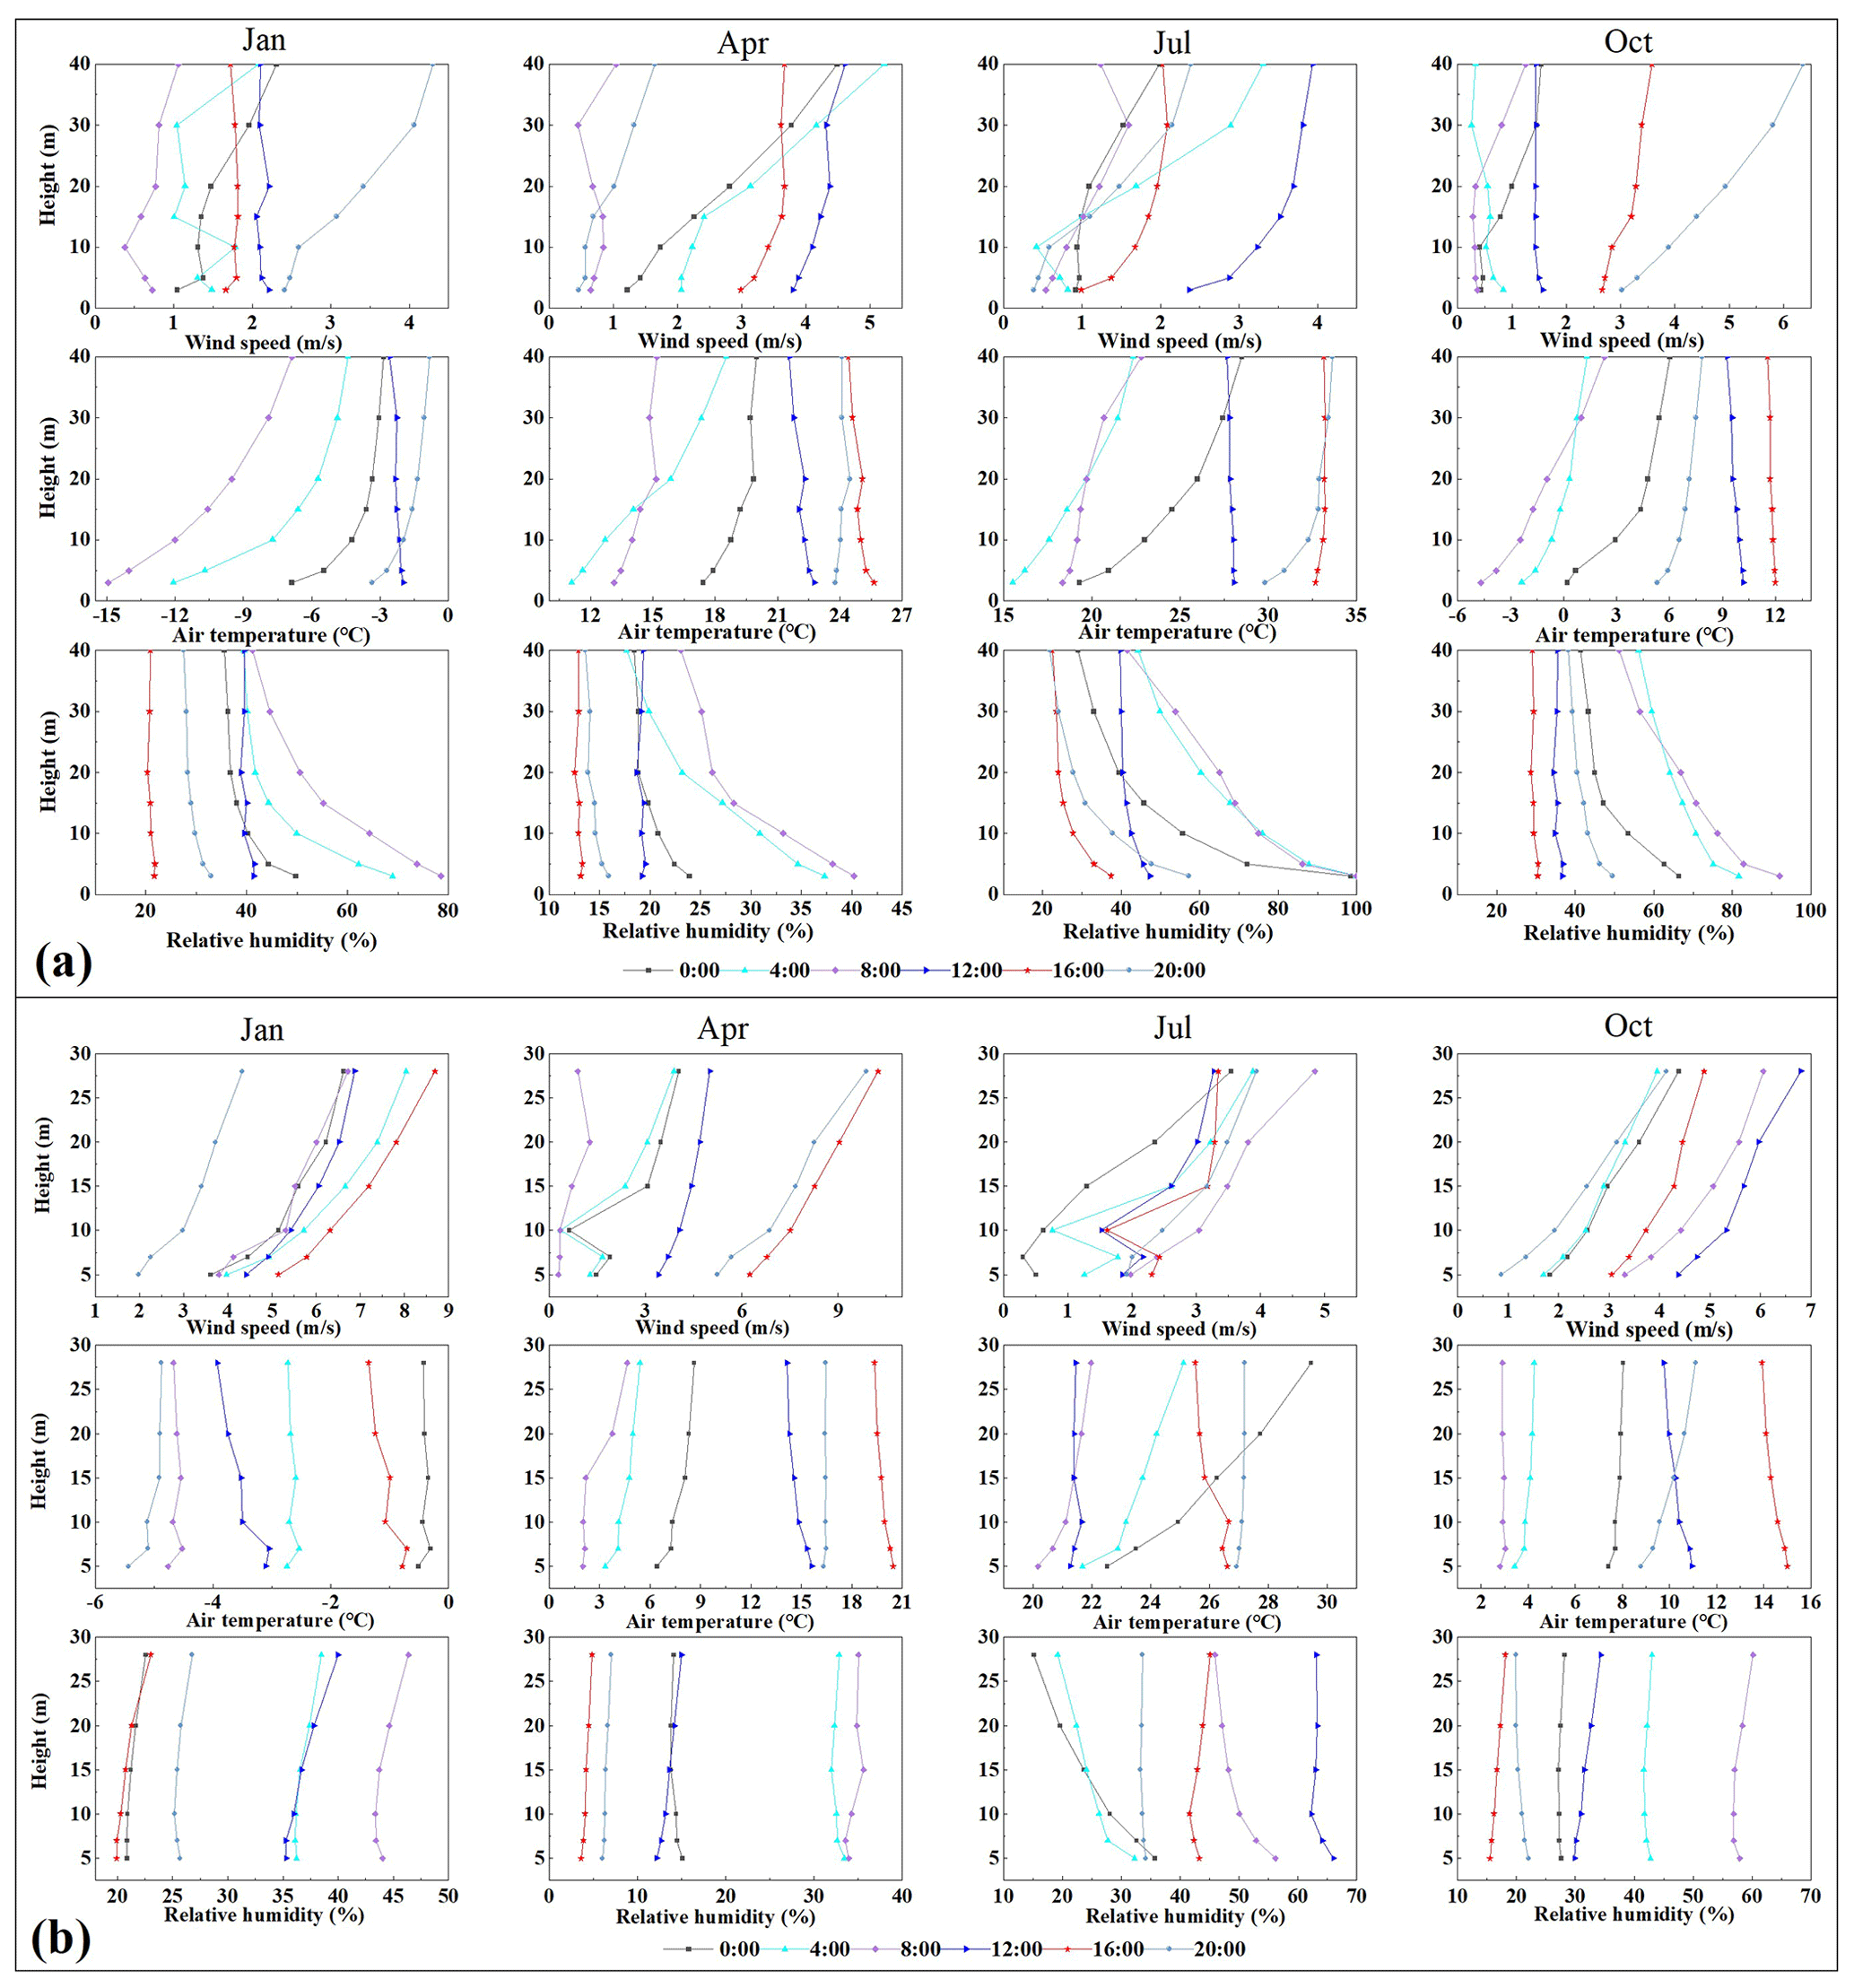
Figure 10The profiles of wind speed, air temperature, and relative humidity for the typical days of 14 January, 14 April, 14 July, and 14 October in 2021 for (a) the artificial oasis in the middle reaches and (b) the natural oasis in the lower reaches.
Windbreaks, buildings, crops, or riparian forests create drag on the wind flow inside the oasis, and the wind direction is different between the oasis and desert. In the middle reaches, the dominant wind directions in the desert are northwest and southeast, while they are northwest and southwest (10 m) in the oasis cropland; however, with an increase in observation height, the influence of surface roughness on wind speed and direction decreased, and southwest wind gradually decreased, while northwest wind and southeast wind gradually increased, which is similar to the wind in the desert area around the oasis (∼30 m height). In the lower reaches, the wind direction was similar in the oasis and desert areas, with prevailing west and east wind directions (Fig. 9).
There are six-layer and seven-layer gradient observations of wind, air temperature, and humidity at superstations in artificial and natural oases. Data on typical days during January, April, July, and October in 2021 were selected, and the profiles of wind speed, air temperature, and humidity are plotted in Fig. 10. The wind speed generally increased with observation height, especially in the natural oasis. The air temperature showed inversion at night during stable atmospheric stratification and changed little, even below 10 m, in the afternoon in July in both artificial and natural oases, which may be caused by oasis–desert interactions. The relative humidity was low during the daytime and maintained high values at night, decreasing with observation height, especially below 10 m.
4.2.3 Precipitation, soil moisture, and the groundwater table
Figure 11 shows the variations in precipitation, soil moisture profiles, and the groundwater table (lower reaches) in typical oasis and desert ecosystems. Precipitation in the middle reaches was higher than that in the lower reaches, and it was higher in the oasis than in the desert. The soil moisture in the oasis was significantly higher than that in the desert, and it was especially low in the desert of the lower reaches. The soil moisture exhibited an increasing trend with increasing soil depth, especially in the oasis. The soil moisture was higher at depths of 0.8–1 m in the artificial oasis in the middle reaches and at depths of 0.4–0.8 m in the natural oasis in the lower reaches. Soil crust appeared in the lower reaches due to soil salinization, and it may have prevented the loss of soil moisture. When a precipitation event occurred, the soil moisture in the desert increased accordingly; however, there were no clear variations in the oasis. There were usually four irrigation events in the artificial oasis in the middle reaches, and the soil moisture clearly increased accordingly in these cases, while some occasional peaks in soil moisture were due to relative heavy precipitation (Fig. 11a). In the lower reaches, two irrigation events (usually in March and September) generally occurred in riparian forests in natural oases. The shallow soil moisture showed large values in March when irrigation occurred and decreased in the plant growing season with a slight increase in September. Another phenomenon is that the amount of precipitation in the artificial oasis was larger than that in the desert, although the sites were not far away from each other (e.g., 103.1 mm at the Daman superstation and 75.4 mm at the Bajitan Gobi station). From the analysis, the soil moisture in the desert was strongly dependent on precipitation (Fig. 11c, d), while it maintained high values in the plant growing season in the oasis due to irrigation.
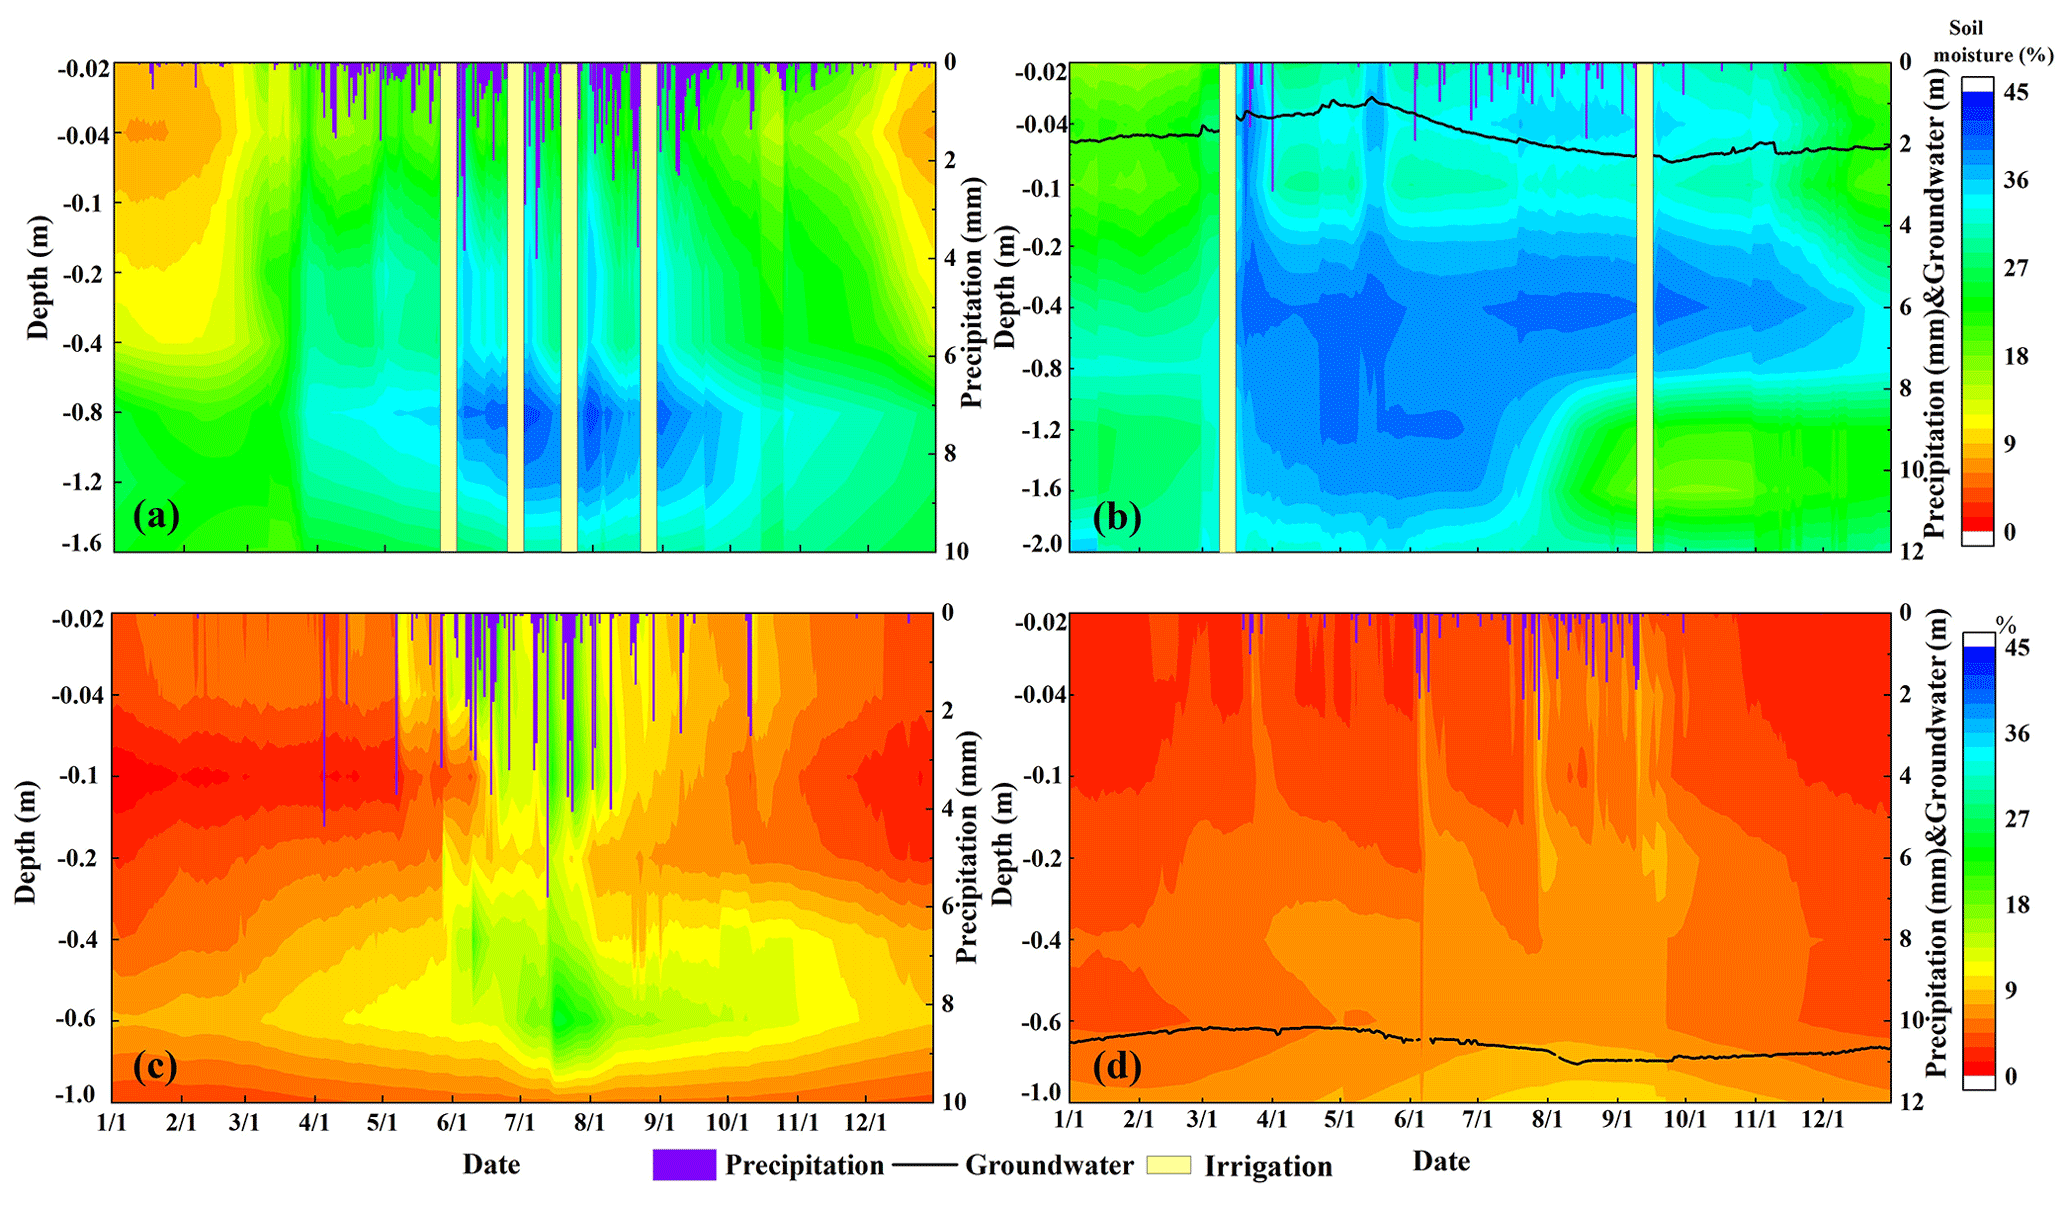
Figure 11Comparison of precipitation and soil moisture profiles between the desert and oasis for 2012–2021 for (a) the oasis in the middle reaches (maize, Daman), (b) the oasis in the lower reaches (Tamarix, Sidaoqiao), (c) the desert in the middle reaches (Bajitan Gobi), and (d) the desert in the lower reaches (Desert).
In the lower reaches, five systems for groundwater table measurement have operated since June 2014 in the oasis, near the Sidaoqiao, Mixed Forest, Populus euphratica, Cropland, and Barren Land stations. The groundwater table was approximately 1–3 m below the ground, and the groundwater table level declined from a depth of approximately 1 to 3 m in the growing season to supply the riparian forest growth (Fig. 11b). Additionally, one groundwater table measurement system was installed near the Desert station in 2018. The depth of the groundwater table level was approximately 10–11 m in the desert and showed no significant variation over the years (Fig. 11d).
4.3 Vegetation and soil parameters
The vegetation parameters include variables such as photosynthetically active radiation (PAR), leaf area index (LAI), phenology, and sun-induced chlorophyll fluorescence (SIF). The PAR, the amount of light available for photosynthesis, is observed at stations with vegetation cover, and it can be used as the source of energy for photosynthesis by green plants. The PAR observations showed similar seasonal variations in typical oasis ecosystems in the middle and lower reaches, with a maximum daily PAR of approximately 750 (Fig. 12a). Vegetation parameters, such as LAI and phenology, were also observed in the middle and lower reaches. The LAI in the middle reaches (maize) increased gradually with crop growth, and it was larger than that in the lower reaches (Tamarix), which showed little change in this shrub surface (Fig. 12c). A phenological camera was installed at each station except the Desert station to acquire the phenology. The greenness index of the green chromatic coordinate (GCC) was derived to capture the key phenological phase of the plant, such as the SOS (start of season), POP (position of peak value), and EOS (end of season) (Fig. 12b).
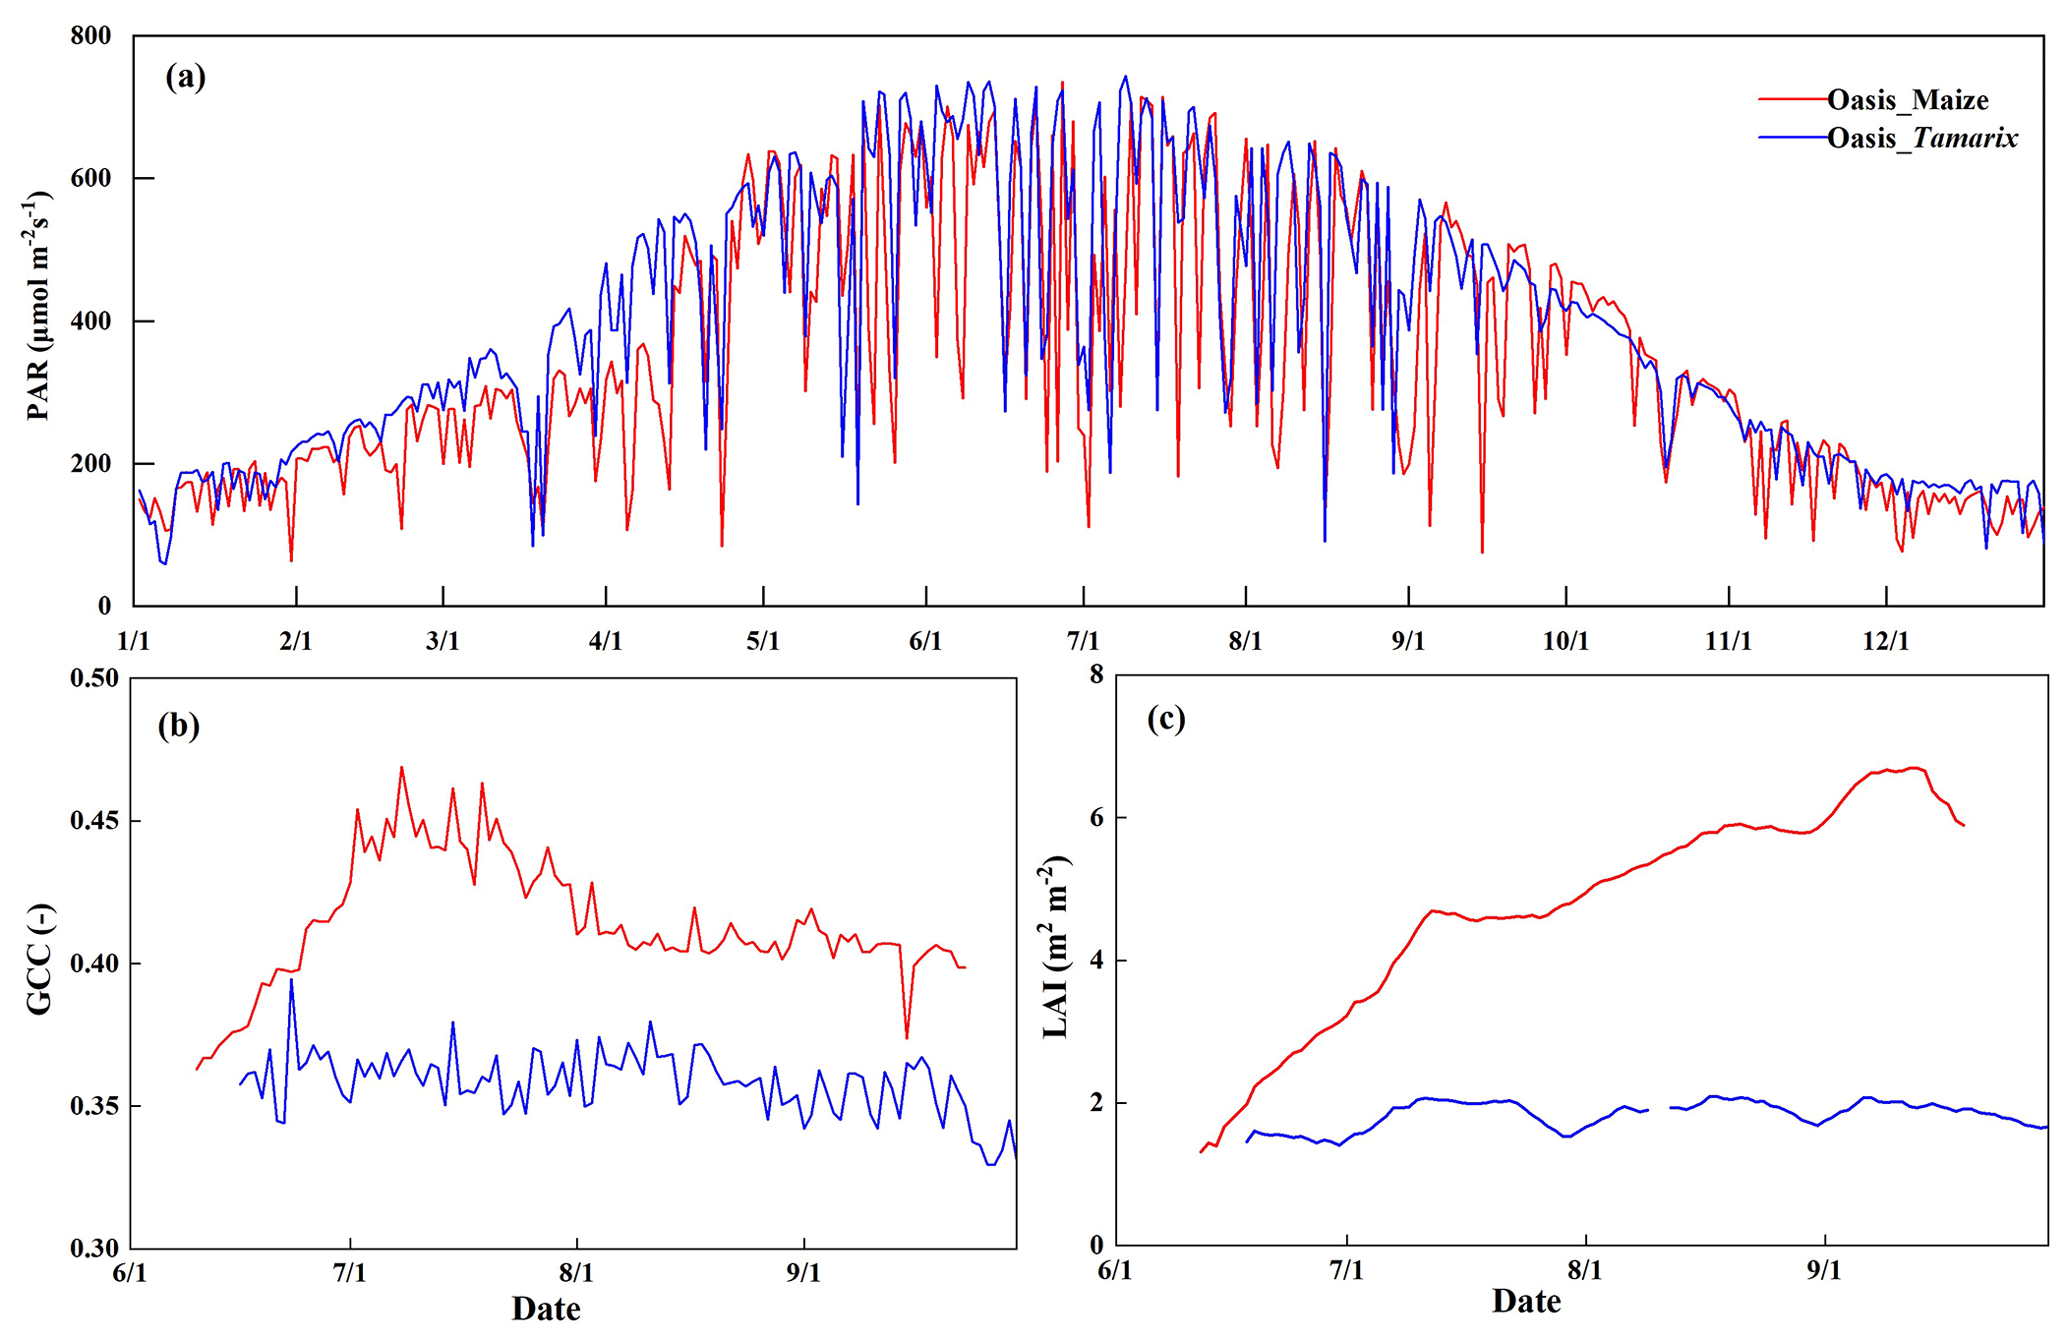
Figure 12Variations in vegetation parameters in the middle and lower reaches of the oasis. Panels (a), (b), and (c) show the respective PAR, GCC, and LAI values in the artificial and natural oases in 2018.
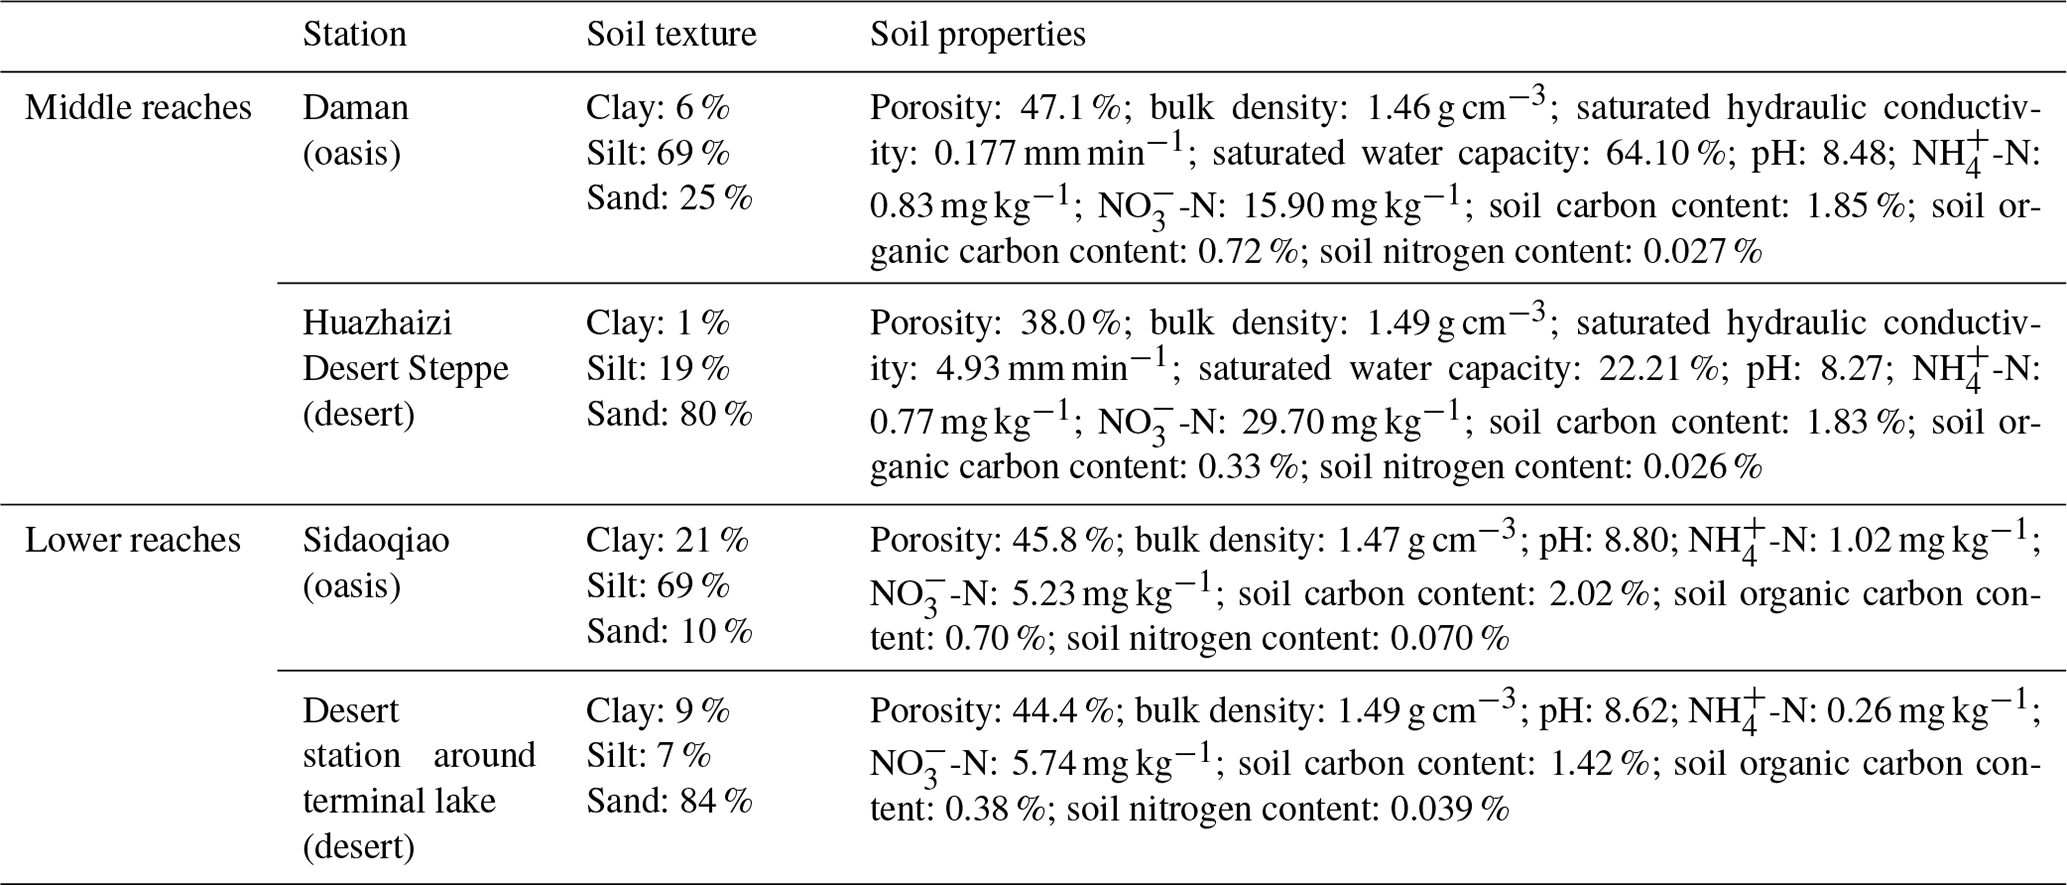
Soil samples were collected at each station in the middle and lower reaches in 2012 and 2020. These soil samples were analyzed in the laboratory, and parameters such as soil texture, porosity, bulk density, saturated hydraulic conductivity, and soil organic matter content were obtained. Some soil parameters at typical stations are shown in Table 3. Silty soil is dominant in the oasis, whereas sand is dominant in the desert. The porosity and bulk density showed no significant difference. The saturated hydraulic conductivity and soil organic matter at the typical stations are also given in Table 3.
Table 3Soil parameter measurements at typical stations in 2020.
The dataset of energy, water vapor, and carbon exchange observations in oasis–desert areas reported in this study (including energy, water vapor, and carbon fluxes; hydrometeorological data; and vegetation and soil parameters) is freely available from the National Tibetan Plateau Data Center (https://doi.org/10.11888/Terre.tpdc.300441, Liu et al., 2023). A specific directory for each observation station has been designated, with data classified into the three following categories: energy, water vapor, and carbon fluxes; hydrometeorological data; and vegetation and soil parameter data. Short descriptions are also provided for each dataset. China Standard Time (CST) has been used for all of the data files (UTC+8).
The typical land cover types in the middle and lower reaches of the HRB are oases and deserts characterized by fragile environments. Oasisization and desertification are two opposing processes in arid and semiarid regions with scarce water resources. To combat desertification around oases and maintain the sustainable development of oases, a land surface process integrated observatory network was established in the oasis–desert area in the middle and lower reaches of the HRB. A total of 11 stations (7 in the oasis and 4 in the desert) have been established in these regions since 2012 to monitor the energy, water vapor, and carbon exchange between the land and atmosphere over oasis and desert areas, and a long-term, high-quality oasis and desert dataset of energy, water vapor, and carbon fluxes as well as auxiliary parameters has been produced. This study shows the achievements of 11 stations over 10 continuous years of observations, including energy, water vapor, and carbon fluxes; hydrometeorology; and vegetation and soil parameter data. These data can be used in the analysis of the water–heat–carbon process and its mechanism of influence (Wang et al., 2019; Xu et al., 2020; Bai et al., 2021; Wu et al., 2023); calibration and validation of remote-sensing products (Ma et al., 2018; Song et al., 2018; Li et al., 2021; Y. Zhang et al., 2022); and simulations of energy, water vapor, and carbon exchange (Li et al., 2017b; Liu et al., 2020; He et al., 2022; Zhou et al., 2022). We confirm that the 10-year, long-term dataset presented in this study is of high quality with few missing data, and we believe that the data will support ecological security and sustainable development in oasis–desert areas. Most of the stations are producing ongoing observations, which can play a great role in such ecologically fragile areas and provide a reference for other similar oasis–desert areas along the Silk Road.
SL, ZX, TC, and XL designed the framework of this research. SL and ZX performed the computations and data analysis and wrote the paper. ZR, YZ, and JT maintained the intensive experiment and downloaded the original measurements. TX, LS, JZ, ZZ, XY, RL, and YM supervised the progress of this work, provided critical suggestions, and revised the paper.
The contact author has declared that none of the authors has any competing interests.
Publisher's note: Copernicus Publications remains neutral with regard to jurisdictional claims made in the text, published maps, institutional affiliations, or any other geographical representation in this paper. While Copernicus Publications makes every effort to include appropriate place names, the final responsibility lies with the authors.
This work has been supported by the Strategic Priority Research Program of the Chinese Academy of Sciences (grant no. XDA20100101) and the National Natural Science Foundation of China (grant no. 42171461).
This work has been supported by the Strategic Priority Research Program of the Chinese Academy of Sciences (grant no. XDA20100101) and the National Natural Science Foundation of China (grant no. 42171461).
This paper was edited by Zhen Yu and reviewed by two anonymous referees.
Bai, Y., Liu, Y. L., Kueppers, L. M., Feng, X., Yu, K. L., Yang, X. F., Li, X. Y., and Huang, J. P.: The coupled effect of soil and atmospheric constraints on stress-responses of desert riparian species, Agr. Forest Meteorol., 311, 108701, https://doi.org/10.1016/j.agrformet.2021.108701, 2021.
Che, T., Dai, L. Y., Wang, J., Zhao, K., and Liu, Q: Estimation of snow depth and snow water equivalent distribution using airborne microwave radiometry in the Binggou Watershed, the upper reaches of the Heihe River basin, Int. J. Appl. Earth Obs., 17, 23–32, https://doi.org/10.1016/j.jag.2011.10.014, 2012.
Che, T., Li, X., Liu, S., Li, H., Xu, Z., Tan, J., Zhang, Y., Ren, Z., Xiao, L., Deng, J., Jin, R., Ma, M., Wang, J., and Yang, X.: Integrated hydrometeorological, snow and frozen-ground observations in the alpine region of the Heihe River Basin, China, Earth Syst. Sci. Data, 11, 1483–1499, https://doi.org/10.5194/essd-11-1483-2019, 2019.
Cheng, G. D., Xiao, D. N., and Wang, G. X.: On the characteristics and building of landscape ecology in arid area, Adv. Geosci., 14, 11–15, 1999 (in Chinese with English abstract).
Cheng, G. D., Li, X., Zhao, W., Xu, Z., Feng, Q., Xiao, S., and Xiao, H.: Integrated study of the water-ecosystem-economy in the Heihe River Basin, Natl. Sci. Rev., 1, 413–428, https://doi.org/10.1093/nsr/nwu017, 2014.
Chu, P. C., Lu, S., and Chen, Y.: A numerical modeling study on desert oasis self-supporting mechanisms, J. Hydrol., 312, 256–276, https://doi.org/10.1016/j.jhydrol.2005.02.043, 2005.
Crétaux, J. F., Calmant, S., Romanovski, V., Shabunin, A., Lyard, F., Bergé-Nguyen, M., Cazenave, A., Hernandez, F., and Perosanz, F.: An absolute calibration site for radar altimeters in the continental domain: Lake issykkul in the central asia, J. Geodesy, 83, 723–735, https://doi.org/10.1007/s00190-008-0289-7, 2009.
Dregne, H. E.: Global status of desertification, Ann. Arid Zone, 30, 179–185, 1991.
Georgescu, M., Moustaoui, M., Mahalov, A., and Dudhia, J.: An alternative explanation of the semiarid urban area “oasis effect”, J. Geophys. Res.-Atmos., 116, D24113, https://doi.org/10.1029/2011JD016720, 2011.
He, X. L., Liu, S. M., Xu, T. R., Yu, K. L., Gentine, P., Zhang, Z., Xu, Z. W., Jiao, D. D., and Wu, D. X.: Improving predictions of evapotranspiration by integrating multi-source observations and land surface model, Agr. Water Manage., 272, 107827, https://doi.org/10.1016/j.agwat.2022.107827, 2022.
Hommeltenberg, J., Mauder, M., Drosler, M., Heidbach, K., Werle, P., and Schmid, H. P.: Ecosystem scale methane fluxes in a natural temperature bog-pine forest in southern Germany, Agr. Forest Meteorol., 198–199, 273–284, https://doi.org/10.1016/j.agrformet.2014.08.017, 2014.
Huang, J. P., Yu, H. P., Guan, X. D., Wang, G. Y., and Guo, R. X.: Accelerated dryland expansion under climate change, Nature Clim. Change, 6, 166–171, https://doi.org/10.1038/nclimate2837, 2016.
Li, M. S., Zhou, J., Peng, Z. X., Liu, S. M., Göttsche, F. M., Zhang, X. D., and Song, L. S.: Component radiative temperatures over sparsely vegetated surfaces and their potential for upscaling land surface temperature, Agr. Forest Meteorol., 276–277, 107600, https://doi.org/10.1016/j.agrformet.2019.05.031, 2019.
Li, X., Li, X. W., Li, Z. Y., Ma, M. G., Wang, J., Xiao, Q., Liu, Q., Che, T., Chen, E. X., Yan, G. J., Hu, Z. Y., Zhang, L. X., Chu, R. Z., Su, P. X., Liu, Q. H., Liu, S. M., Wang, J. D., Niu, Z., Chen, Y., Jin, R., Wang, W. Z., Ran, Y. H., and Xin, X.: Watershed Allied Telemetry Experimental Research, J. Geophys. Res.-Atmos., 114, D22103, https://doi.org/10.1029/2008JD011590, 2009.
Li, X., Cheng, G. D., Liu, S. M., Xiao, Q., Ma, M. G., Jin, R., Che, T., Liu, Q. H., Wang, W. Z., Qi, Y., Wen, J. G., Li, H. Y., Zhu, G. F., Guo, J. W., Ran, Y. H., Wang, S. G., Zhu, Z. L., Zhou, J., Hu, X. L., and Xu, Z. W.: Heihe Watershed Allied Telemetry Experimental Research (HiWATER): Scientific Objectives and Experimental Design, B. Am. Meteorol. Soc., 94, 1145–1160, https://doi.org/10.1175/BAMS-D-12-00154.1, 2013.
Li, X., Yang, K., and Zhou, Y.: Progress in the study of oasis-desert interactions, Agr. Forest Meteorol., 230, 1–7, https://doi.org/10.1016/j.agrformet.2016.08.022, 2016.
Li, X., Liu, S. M., Xiao, Q., Ma, M. G., Jin, R., Che, T., Wang, W. Z., Hu, X. L., Xu, Z. W., Wen, J. G., and Wang, L. X.: A multiscale dataset for understanding complex eco-hydrological processes in a heterogeneous oasis system, Sci. Data, 4, 170083, https://doi.org/10.1038/sdata.2017.83, 2017a.
Li, X., Zheng, Y., Sun, Z., Tian, Y., Zheng, C. M., Liu, J., Liu, S. M., and Xu, Z. W.: An integrated ecohydrological modeling approach to exploring the dynamic interaction between groundwater and phreatophytes, Ecol. Model., 356, 127–140, https://doi.org/10.1016/j.ecolmodel.2017.04.017, 2017b.
Li, X., Liu, S. M., Li, H. X., Ma, Y. F., Wang, J. H., Zhang, Y., Xu, Z. W., Xu, T. R., Song, L. S., Yang, X. F., Lu, Z., Wang, Z. Y., and Guo, Z. X.: Intercomparison of six upscaling evapotranspiration methods: from site to the satellite pixel, J. Geophys. Res.-Atmos., 123, 6777–6803, https://doi.org/10.1029/2018JD028422, 2018.
Li, X., Liu, S. M., Yang, X. F., Ma, Y. F., He, X. L., Xu, Z. W., Xu, T. R., Song, L. S., Zhang, Y., Hu, X., Qu, Q., and Zhang, X. D.: Upscaling evapotranspiration from a single-site to satellite pixel scale, Remote Sens., 13, 4072, https://doi.org/10.3390/rs13204072, 2021.
Liebethal, C., Huwe, B., and Foken, T.: Sensitivity analysis for two ground heat flux calculation approaches, Agr. Forest Meteorol., 132, 253–262, https://doi.org/10.1016/j.agrformet.2005.08.001, 2005.
Liu, R., Sogachev, A., Yang, X. F., Liu, S. M., Xu, T. R., and Zhang, J. J.: Investigating microclimate effects in an oasis-desert interaction zone, Agr. Forest Meteorol., 290, 107992, https://doi.org/10.1016/j.agrformet.2020.107992, 2020.
Liu, S., Xu, Z., Che, T., Li, X., Xu, T., Ren, Z., Zhang, Y., Tan, J., Song, L., Zhou, J., Zhu, Z., Yang, X., Liu, R., and Ma, Y.: Energy, water vapor and carbon exchange observations in oasis-desert areas of Heihe river basin (2012–2021), National Tibetan Plateau/Third Pole Environment Data Center, https://doi.org/10.11888/Terre.tpdc.300441, 2023.
Liu, S. M., Xu, Z. W., Wang, W. Z., Jia, Z. Z., Zhu, M. J., Bai, J., and Wang, J. M.: A comparison of eddy-covariance and large aperture scintillometer measurements with respect to the energy balance closure problem, Hydrol. Earth Syst. Sci., 15, 1291–1306, https://doi.org/10.5194/hess-15-1291-2011, 2011.
Liu, S. M., Xu, Z. W., Song, L. S., Zhao, Q. Y., Ge, Y., Xu, T. R., Ma, Y. F., Zhu, Z. L., Jia, Z. Z., and Zhang, F.: Upscaling evapotranspiration measurements from multi-site to the satellite pixel scale over heterogeneous land surfaces, Agr. Forest Meteorol., 230–231, 97–113, https://doi.org/10.1016/j.agrformet.2016.04.008, 2016.
Liu, S. M., Li, X., Xu, Z. W., Che, T., Xiao, Q., Ma, M. G., Liu, Q. H., Jin, R., Guo, J. W., Wang, L. X., Wang, W. Z., Qi, Y., Li, H. Y., Xu, T. R., Ran, Y. H., Hu, X. L., Shi, S. J., Zhu, Z. L., Tan, J. L., Zhang, Y., and Ren, Z. G.: The Heihe Integrated Observatory Network: A basin-scale land surface processes observatory in China, Vadose Zone J., 17, 180072, https://doi.org/10.2136/vzj2018.04.0072, 2018.
Ma, Y. F., Liu, S. M., Song, L. S., Xu, Z. W., Liu, Y. L., Xu, T. R., and Zhu, Z. L.: Estimation of daily evapotranspiration and irrigation water efficiency at a Landsat-like scale for an arid irrigation area using multi-source remote sensing data, Remote Sens. Environ., 216, 715–734, https://doi.org/10.1016/j.rse.2018.07.019, 2018.
Mao, D., Wang, Z., Wu, B., Zeng, Y., Luo, L., and Zhang, B.: Land degradation and restoration in the arid and semiarid zones of China: Quantified evidence and implications from satellites, Land Degrad. Dev., 29, 3841–3851, https://doi.org/10.1002/ldr.3135, 2018.
Meng, X., Lv, S., Zhang, T., Guo, J., Gao, Y., Bao, Y., Wen, L., Luo, S., and Liu, Y.: Numerical simulations of the atmospheric and land conditions over the jinta oasis in northwestern China with satellite-derived land surface parameters, J. Geophys. Res.-Atmos., 114, 605–617, https://doi.org/10.1029/2008JD010360, 2009.
Potchter, O., Goldman, D., Kadish, D., and Iluz, D.: The oasis effect in an extremely hot and arid climate: The case of southern Israel, J. Arid Environ., 72, 1721–1733, https://doi.org/10.1016/j.jaridenv.2008.03.004, 2008.
Qu, Y. H., Zhu, Y. Q., Han, W. C., Wang, J. D., and Ma, M. G: Crop leaf area index observations with a wireless sensor network and its potential for validating remote sensing products, IEEE J-STARS., 7, 431–444, https://doi.org/10.1109/JSTARS.2013.2289931, 2014.
Scanlon, B. R., Keese, K. E., Flint, A. L., Flint, L. E., Gaye, C. B., Edmunds, W. M., and Simmers, I.: Global synthesis of groundwater recharge in semiarid and arid regions, Hydrol. Process., 20, 3335–3370, https://doi.org/10.1002/hyp.6335, 2006.
Song, L. S., Liu, S. M., Kustas, W. P., Nieto, H., Sun, L., Xu, Z. W., Skaggs, T. H., Yang, Y., Ma, M. G., Xu, T. R., Tang, X. G., and Li, Q. P.: Monitoring and validating spatially and temporally continuous daily evaporation and transpiration at river basin scale, Remote Sens. Environ., 219, 72–88, https://doi.org/10.1016/j.rse.2018.10.002, 2018.
Stanev, E., Staneva, J., Bullister, J., and Murray, J.: Ventilation of the black sea pycnocline. Parameterization of convection, numerical simulations and validations against observed chlorofluorocarbon data, Deep-Sea Res. Pt. I, 51, 2137–2169, https://doi.org/10.1016/j.dsr.2004.07.018, 2004.
Stone, K. B.: Burke-Litwin organizational assessment survey: reliability and validity, Organization Development Journal, 33, 33–50, 2015.
Stoy, P. C., Mauder, M., Foken, T., Marcolla, B., Boegh, E., Ibrom, A., Arain, M., Arneth, A., Aurela, M., Bernhofer, C., Cescatti, A., Dellwik, E., Duce, P., Gianelle, D., Gorsel, E., Kiely, G., Knohl, A., Margolis, H., McCaughey, H., Merbold, L., Montagnanti, L., Papale, D., Reichstein, M., Saunders, M., Serrano-Ortiz, P., Sottocornola, M., Spano, D., Vaccari, F., and Varlagin, A.: A data-driven analysis of energy balance closure across FLUXNET research sites: The role of landscape scale heterogeneity, Agr. Forest Meteorol., 171–172, 137–152, https://doi.org/10.1016/j.agrformet.2012.11.004, 2013.
Tagesson, T., Fensholt, R., Cappelaere, B., Mougin, E., Horion, S., Kergoat, L., Nieto, H., Mbow, C., Ehammer, A., Demarty, J., and Ardö, J.: Spatiotemporal variability in carbon exchange fluxes across the Sahel, Agr. Forest Meteorol., 226–227, 108–118, https://doi.org/10.1016/j.agrformet.2016.05.013, 2016.
Taha, H., Akbari, H., and Rosenfeld, A.: Heat island and oasis effects of vegetative canopies, Theor. Appl. Climatol., 44, 123–138, https://doi.org/10.1007/BF00867999, 1991.
Twine, T. E., Kustas, W. P., Norman, J. M., Cook, D. R., Houser, P. R., Meyers, T. P., Prueger, J. H., Starks, P. J., and Wesely, M. L.: Correcting eddy-covariance flux underestimates over a grassland, Agr. Forest Meteorol., 103, 279–300, https://doi.org/10.1016/S0168-1923(00)00123-4, 2000.
Wang, G. X. and Cheng, G. D.: Water resource development and its influence on the environment in arid areas of China-the case of the Hei River basin, J. Arid Environ., 43, 121–131, https://doi.org/10.1006/jare.1999.0563, 1999.
Wang, H. B., Li, X., Xiao, J. F., Ma, M. G., Tan, J. L., Wang, X. F., and Geng, L. Y.: Carbon fluxes across alpine, oasis, and desert ecosystems in northwestern China: The importance of water availability, Sci. Total Environ., 697, 133978, https://doi.org/10.1016/j.scitotenv.2019.133978, 2019.
Wang, J. M. and Mitsuta, Y.: Evaporation from the desert: some preliminary results of HEIFE, Bound.-Lay. Meteorol., 59, 413–418, https://doi.org/10.1007/BF02215461, 1992.
Wen, X., Lv, S., and Jin, J.: Integrating remote sensing data with WRF for improved simulations of oasis effects on local weather processes over an arid region in northwestern China, J. Hydrometeorol., 13, 573–587, https://doi.org/10.1175/JHM-D-10-05001.1, 2012.
Wu, D. X., Liu, S. M., Wu, X. C., Xu, T. R., Xu, Z. W., He, X. L., and Shi, H. Y.: Evaluation of the intrinsic temperature sensitivity of ecosystem respiration in typical ecosystems of an endorheic river basin, Agr. Forest Meteorol., 333, 109393, https://doi.org/10.1016/j.agrformet.2023.109393, 2023.
Xu, Z. W., Liu, S. M., Li, X., Shi, S. J., Wang, J. M., Zhu, Z. L., Xu, T. R., Wang, W. Z., and Ma, M. G.: Intercomparison of surface energy flux measurement systems used during the HiWATER-MUSOEXE, J. Geophys. Res.-Atmos., 118, 13140–13157, https://doi.org/10.1002/2013JD020260, 2013.
Xu, Z. W., Ma, Y. F., Liu, S. M., Shi, W. J., and Wang, J. M.: Assessment of the energy balance closure under advective conditions and its impact using remote sensing data, J. Appl. Meteorol. Clim., 56, 127–140, https://doi.org/10.1175/JAMC-D-16-0096.1, 2017.
Xu, Z. W., Liu, S. M., Zhu, Z. L., Zhou, J., Shi, W. J., Xu, T. R., Yang, X. F., Zhang, Y., and He, X. L.: Exploring evapotranspiration changes in a typical endorheic basin through the integrated observatory network, Agr. Forest Meteorol., 290, 108010, https://doi.org/10.1016/j.agrformet.2020.108010, 2020.
Xue, J., Gui, D., Lei, J., Sun, H., Zeng, F., Mao, D., Zhang, Z., Jin, Q., and Liu, Y.: Oasis microclimate effects under different weather events in arid or hyper arid regions: A case analysis in southern Taklimakan desert and implication for maintaining oasis sustainability, Theor. Appl. Climatol., 137, 89–101, https://doi.org/10.1007/s00704-018-2567-5, 2019.
Zhang, Q., Sun, R., Jiang, G. Q., Xu, Z. W., and Liu, S. M.: Carbon and energy flux from a Phragmites australis wetland in Zhangye oasis-desert area, China, Agr. Forest Meteorol., 230–231, 45–57, https://doi.org/10.1016/j.agrformet.2016.02.019, 2016.
Zhang, Y. Y. and Zhao, W. Z.: Vegetation and soil property response of short-timefencing in temperate desert of the Hexi Corridor northwestern China, Catena, 133, 43–51, https://doi.org/10.1016/j.catena.2015.04.019, 2015.
Zhang, X. Y., Arimoto, R., Zhu, G. H., Chen, T., and Zhang, G. Y.: Concentration, size-distribution and deposition of mineral aerosol over Chinese desert regions, Tellus B, 50, 317–330, https://doi.org/10.3402/tellusb.v50i4.16131, 2016.
Zhang, Y., Zhao, W., He, J., and Fu, L.: Soil susceptibility to macropore flow across a desert-oasis ecotone of the Hexi Corridor, Northwest China, Water Resour. Res., 54, 1281–1294, https://doi.org/10.1002/2017WR021462, 2018.
Zhang, Y., Liu, S. M., Song, L. S., Li, X., Jia, Z. Z., Xu, T. R., Xu, Z. W., Ma, Y. F., Zhou, J., Yang, X. F., He, X. L., Yao, Y. J., and Hu, G. C.: Integrated Validation of Coarse Remotely Sensed Evapotranspiration Products over Heterogeneous Land Surfaces, Remote Sens., 14, 3467, https://doi.org/10.3390/rs14143467, 2022.
Zhang, Z., Poulter, B., Knox, S., Stavert, A., McNicol, G., Fluet-Chouinard, E., Feinberg, A., Zhao, Y., Bousquet, P., Canadell, J., Ganesan, A., Hugelius, G., Jackson, R., Patra, P., Saunois, M., Höglund-Isaksson, L., Huang, C., Chatterjee, A., and Li, X.: Anthropogenic emission is the main contributor to the rise of atmospheric methane during 1993–2017, Natl. Sci. Rev., 9, nwab200, https://doi.org/10.1093/nsr/nwab200, 2022.
Zhao, R., Chen, Y., Shi, P., Zhang, L., Pan, J., and Zhao, H.: Land use and land cover change and driving mechanism in the arid inland river basin: a case study of Tarim River, Xinjiang, China, Environ. Earth Sci., 68, 591–604, https://doi.org/10.1007/s12665-012-1763-3, 2013.
Zheng, C., Liu, S. M., Song, L. S., Xu, Z. W., Guo, J. X., Ma, Y. F., Ju, Q., and Wang, J. M.: Comparison of sensible and latent heat fluxes from optical-microwave scintillometers and eddy covariance systems with respect to surface energy balance closure, Agr. Forest Meteorol., 331, 109345, https://doi.org/10.1016/j.agrformet.2023.109345, 2023.
Zhou, Y. and Li, X.: Energy balance closures in diverse ecosystems of an endorheic river basin, Agr. Forest Meteorol., 274, 118–131, https://doi.org/10.1016/j.agrformet.2019.04.019, 2018.
Zhou, Y., Liao, W., and Li, X.: The contributions of individual factors to the oasis cold island effect intensity in the Heihe River Basin, Agr. Forest Meteorol., 312, 108706, https://doi.org/10.1016/j.agrformet.2021.108706, 2022.
- Abstract
- Introduction
- A land surface process integrated observatory network in the oasis–desert area of the HRB
- Data processing and quality control
- Data description
- Data availability
- Conclusions
- Author contributions
- Competing interests
- Disclaimer
- Acknowledgements
- Financial support
- Review statement
- References