the Creative Commons Attribution 4.0 License.
the Creative Commons Attribution 4.0 License.
 | 07 Nov 2023
Global carbon uptake of cement carbonation accounts 1930–2021
Zi Huang
Jiaoyue Wang
Longfei Bing
Yijiao Qiu
Rui Guo
Ying Yu
Mingjing Ma
Le Niu
Dan Tong
Robbie M. Andrew
Pierre Friedlingstein
Josep G. Canadell
Fengming Xi
The main contributor to the greenhouse gas (GHG) footprint of the cement industry is the decomposition of alkaline carbonates during clinker production. However, systematic accounts for the reverse of this process – namely carbonation of calcium oxide and other alkaline oxides and/or hydroxides within cement materials during cements' life cycles – have only recently been undertaken. Here, adopting a comprehensive analytical model, we provide the most updated estimates of CO2 uptake by cement carbonation. The accumulated amount of global CO2 uptake by cements produced from 1930 to 2021 is estimated to be 22.9 Gt CO2 (95 % confidence interval, CI: 19.6–26.6 Gt CO2). This amount includes the CO2 uptake by concrete, mortar, construction waste and kiln dust, accounting for 30.1 %, 58.5 %, 4.0 % and 7.1 % respectively. The cumulative carbon uptake by cement materials from 1930 to 2021 offsets 55.1 % of the emissions from cement production (41.6 Gt CO2, 95 % CI: 38.7–47.2 Gt CO2) over the same period, with the greater part coming from mortar (58.5 % of the total uptake). China has the highest cement carbon uptake, with cumulative carbonation of 7.06 Gt CO2 (95 % CI: 5.22–9.44 Gt CO2) since 1930. In addition, the carbon uptake amounts of the USA, EU, India and the rest of the world took 5.0 %, 23.2 %, 5.6 % and 34.8 % separately. As a result of rapidly increased production in recent years, over three-quarters of the cement carbon uptake has occurred since 1990. Additionally, our results show little impact by the COVID-19 pandemic on cement production and use, with carbon uptake reaching about 0.92 Gt CO2 (95 % CI: 0.78–1.10 Gt CO2) in 2020 and 0.96 Gt CO2 (95 % CI: 0.81–1.15 Gt CO2) in 2021. Our uniformly formatted and most updated cement uptake inventories provide coherent data-based support for including cement carbon uptake into future carbon budgets from the local to global scale. The latest version contains the uptake data till 2021, showing the global uptake's increasing pattern and offering more usable and relevant data for evaluating cement's carbon uptake capacity. All the data described in this study are accessible at https://doi.org/10.5281/zenodo.7516373 (Bing et al., 2023).
- Article
(3325 KB) - Full-text XML
-
Supplement
(555 KB) - BibTeX
- EndNote


With continued urbanization in the developing world and infrastructure projects worldwide, cement consumption has increased rapidly (Low, 2005). The cement production process is an energy-intensive and CO2-emitting process, the total CO2 emission of which amounts to 5 %–8 % of global CO2 emissions (IEA, 2019; Xuan and Poon, 2019; Friedlingstein et al., 2022). The worldwide average CO2 emission coefficient of ordinary Portland cement (OPC) is 0.86 kgCO2 kg−1 (Damtoft et al., 2008), which comprises the release of 0.53 kgCO2 kg−1 of clinker owing to the decomposition of limestone during calcination. While in use, though, cement materials that are exposed to air naturally undergo carbonation (Pade and Guimaraes, 2007; Renforth et al., 2011; Huntzinger et al., 2009), a physicochemical process where atmospheric CO2 gradually absorbs into concrete's structure and reacts with alkaline components such as CaO in a moist environment. The main carbonation mechanisms that are responsible for the carbon uptake can be attributed to the oxide, hydroxide and silicate constituents, as described by Reactions (R1) and (R2).
Unfortunately, from the perspective of offsetting emissions in the production of cement, carbonation is a slow process that occurs over the entire life cycle of cementitious materials, in contrast to the instantaneous CO2 emissions that occur during their production (Andersson et al., 2013). It has been shown that up to a quarter of the CO2 emitted in cement production can be reabsorbed throughout a building's life and recovery phase (Xi et al., 2016). Quite a few procedures for evaluating the CO2 footprint over cement's life cycle have been suggested (Damineli et al., 2010; Renforth et al., 2011; Yang et al., 2013; Cao et al., 2020). Most procedures, however, consider only a case-limited system boundary and material type such as concrete service stage or the recycling phase of concrete after demolition (Andersson et al., 2013; Yang et al., 2014; Xi et al., 2016; Cao et al., 2020; Kaliyavaradhan et al., 2020) and do not take other types and stages of the life cycle into systematic account. In our previous study (Guo et al., 2021), which incorporated the merits from other work (Andersson et al., 2013; Yang et al., 2014; Xi et al., 2016; Cao et al., 2020; Kaliyavaradhan et al., 2020) and the updated clinker ratio and/or cement production data, we constructed a comprehensive analytical model to estimate the time series of cement CO2 uptake inventories and estimated that 21.02 Gt CO2 had been sequestered in cements produced between 1930 and 2019, which abated 55 % of the corresponding process emissions over the same period.
The cement CO2 uptake and emission dataset can be accounted annually. In this study, based on the previous data frameworks (Guo et al., 2021), we updated cement production and emission factors and most up-to-date clinker ratio data for the years 2020 and 2021. Adopting a previous comprehensive analytical model (Guo et al., 2021), we updated the cement CO2 uptake and emission dataset from 1930 to 2021. The inventories are constructed in a uniform format, which includes cement process-related emissions and cement uptake from four material types with three life stages that are burned in five countries or regions. The uniformly formatted time series cement uptake inventories can be utilized widely. Using these consistent frameworks and models, we provide an updated annual cement carbon uptake to be used in the annual assessments of the global carbon budget (GCB) (Friedlingstein et al., 2022). These timely updated inventories can provide robust data support for further analysis of global or regional emission reduction policy making, especially for carbon-intensive industries like the cement-manufacturing industry. By accelerating carbon capture from existing cement materials and using waste concrete as a carbon storage material, cement could reduce its net carbon emission impact. The primary focus of this research is to update the cement carbon uptake data up to 2021 using a methodology consistent with our previous publication. By doing so, we aim to provide the most current and up-to-date data to accurately portray the impact of cement carbon uptake. The data can be downloaded freely from https://doi.org/10.5281/zenodo.7516373 (Bing et al., 2023).
The cement CO2 uptake and process emissions in this dataset were estimated in terms of the comprehensive analytical model and based on the IPCC (Intergovernmental Panel on Climate Change) administrative territorial-based accounting scope. In addition, we also assessed the uncertainties in cement uptake and process emission estimates using the Monte Carlo method that the IPCC recommended. The detailed input data are in SI table 1 (available from https://doi.org/10.5281/zenodo.7516373, Bing et al., 2023). Our inventories were constructed in two parts: process-related (cement) CO2 emissions and cement material uptake. Figure 1 presents a diagram of the entire construction of our cement material carbonation uptake and cement emission inventories.
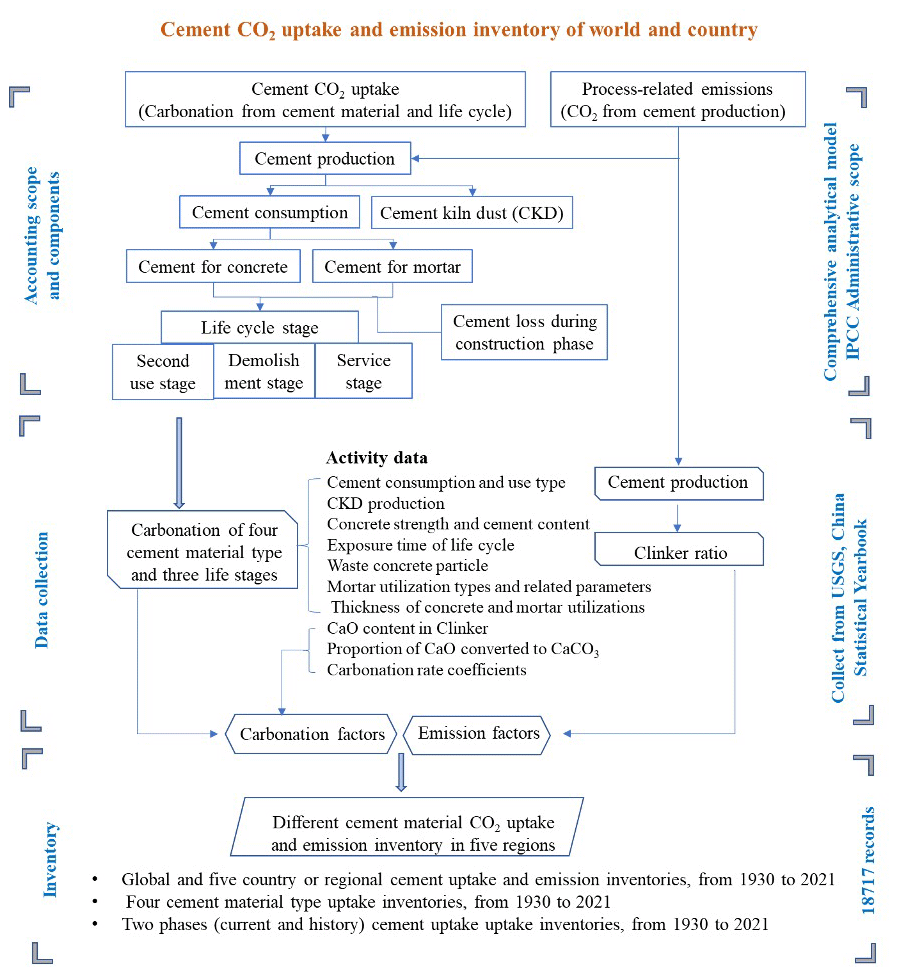
2.1 Cement production data sources
To keep the consistency with the previous study (Xi et al., 2016; Guo et al., 2021), we still obtained the global cement production data from 1930 to 2021 from the United States Geological Survey (USGS) and geographically divided into five primary countries and aggregated regions, including China, the United States (US), Europe and central Eurasia (including Russia), India, and the rest of the world (ROW). In this study, we updated cement production for the years 2020 and 2021, and the global cement production was collected from the USGS cement statistics and information annual report (USGS, 2023); regional cement productions were gained from the China Statistical Yearbook (NBS, 2022), the USGS cement annual publication (USGS, 2023) and Trading Economics (Trading Economics, 2023) for China, the US, Europe and central Eurasia (including Russia), and India. The clinker ratio data were kept the same as the previous data sources (CCA, 2001–2015; Xu et al., 2012, 2014; Cao et al., 2017; MIIT, 2019), except for the US, the data of which were collected from USGS annual cement report (USGS, 2023).
2.2 Cement process emission calculation
In producing cement clinker, the major constituent of cement (OPC), limestone and other carbonates are decomposed into their corresponding oxides and gaseous CO2 via calcination, resulting in the process emission of the cement industry. It is a so-called hard-to-abate CO2 emission source (Antunes et al., 2021) because no clear avenue has yet been found to replace this chemical process. Therefore, the process emission intensity (factor) is related to the composition of the clinker and its content in the cements in question. The IPCC-recommended default value of the process emission factor is 0.507 kg CO2 kg−1 clinker (EFDB, 2002) without the emissions associated with MgCO3. In our work, the value of the clinker ratio for China was taken to be 0.51966 kg CO2 kg−1 clinker for dry kilns with pre-heating and without pre-calciner, dry kilns with pre-heating and pre-calciner, and dry kilns without pre-heating (long dry), and 0.49983 kg CO2 kg−1 clinker for semi-wet or semi-dry and wet or shaft kilns since 2005, as adapted from Shen's study (Shen et al., 2016). For other countries, Andrew's recent work (Andrew, 2019) established a sound foundation for those who are in need of survey data (data can be accessed from SI table 1-3 from https://doi.org/10.5281/zenodo.7516373, Bing et al., 2023). Besides, the survey data were obtained from the World Business Council for Sustainable Development (WBCSD) and the Global Cement Directory 2019 (publicly named as the GCD-2019 dataset). Finally, the use of integrated global plant-level capacity and technology information was maintained and continued in this study for higher accuracy in contrast to regionally averaged cement emission factors (Guo et al., 2021).
In general, the process emission can be calculated using Eq. (1). Given the current types of cement additives, if statistical data on cement clinker production are available, it is recommended that cement clinker production data be used directly to accurately estimate process emissions (Andrew, 2019).
In the above equation, Eprocess,i is the cement process emission of the different regions. Pcement,i is the regional cement production. fclinker,i and are the actual clinker-to-cement ratios and the cement (clinker) carbon emission factors of these five regions respectively.
2.3 Cement life cycle uptake assessments
The cement utilization was categorized by four types: concrete, mortar, cement kiln dust and cementitious construction wastes, which included three life stages (Xi et al., 2016; Guo et al., 2021): (1) service, (2) demolishment and (3) second use. Thus, the whole carbon uptake process can be designed as
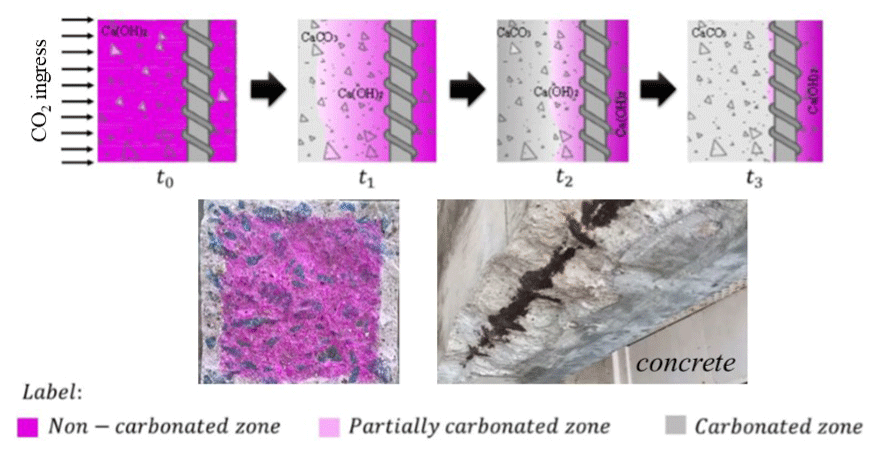
where Cuptake, Cconcrete, Cmortar, Cwastes and CCKD are the uptake amounts of every type. Cl,tl, Cd,td and Cs,ts are the uptake amounts during the service, demolition and secondary-use stages respectively. Following our previous study, 100 years were considered to be the total life cycle time. During the service stage, cement materials are mainly used for the construction of civil infrastructures. Based on Fick's second law, a simplified model was applied in this work, which introduced a two-dimensional diffusion slab process, as shown in Fig. 2. Fick's second law determines the relationship of carbonization depths and reaction time (tl) linked by diffusion coefficient (k), which can be described as follows:
Then, based on the reaction of cement carbonation and the IPCC's report, the carbonation calculation can be expressed as
where is the clinker ratio, is the CaO content in the clinker, and γ is the fraction of CaO that could be converted to CaCO3. is molar mass of CO2. MCaO is the molar mass of CaO.
In order to simplify the calculation model, some assumptions were applied in this study. Firstly, the diffusion front was assumed to be the same as the carbonation front, with the area behind the front being fully carbonated; then, in the slab model, shown as Fig. 2, the carbonation amounts were determined as a function of exposed surface area, carbonation depth and the cement content of concrete. Due to the influence on the carbonation process of the exposure condition and material properties, in this study, for concrete, a compressive-strength-class breakdown was carried out based on the regional standards. For mortar, the different kinds of utilization – rendering, masonry and maintenance – were considered to be most important. Two main exposure conditions (buried and in open air) were considered, with different carbonation coefficients. Specifically, carbon sequestration of these four types of cementitious materials can be found in the Supplement.
2.4 Uncertainty assessment
Based on the kinetic models described in previous sections, in this study, the uncertainty estimations through Monte Carlo simulation are applied in cement process emission and cement carbon uptake separately. The term “uncertainty” in this study refers to the lower and upper bounds of a 95 % confidence interval (CI) around our central estimate, i.e. the median. All of the input parameters of activity levels, emission and uptake factors, with corresponding statistical distributions, were fed into a Monte Carlo framework, and 10 000 simulations were performed to analyse the uncertainties in estimated carbon emissions and uptake. The uncertainty ranges of cement process emissions and carbon uptake are in Table S4 (Bing et al., 2023). The previous works (Xi et al., 2016) have illustrated the sources of uncertainties. Coherently with previous studies (Xi et al., 2016; Guo et al., 2021), the annual global cement carbon uptake and emission were obtained from regional or material use aggregation, which include 26 variables and factors, as shown in Table S2 (Bing et al., 2023). Notably, the annual median at a higher level is not equal to the sum of its sub-level components when evaluating the carbon uptake at each level due to the different statistics based on the Monte Carlo simulation results (see https://doi.org/10.5281/zenodo.7516373; Bing et al., 2023; Guo et al., 2021). In this work, for our model used for 2020 and 2021, most of the distributions and their features of variables remain and refer to the previous estimation (Guo et al., 2021). However, the clinker-to-cement ratio of the US is updated based on the USGS cement annual report of 2021, leading to a change where the random errors are within the range of ±5 % (a uniform distribution). Specifically, the clinker ratio was set to range from 75 % to 97 % in a Weibull distribution, with shape and scale parameters of 91.0 % and 25 for regional aggregation of the years 1930–2021. For China and India, the clinker ratio distribution was unchanged for 1930–1989. For China, the range of coefficient values of the clinker ratio was set to 10 %–20 % for 1990–2004 with a normal distribution; for 2004–2021, the random errors were calculated within the range of ±5 % of the mean values with a uniform distribution. For India, the random errors were calculated within the range of ±10 % and ±5 % of the mean values for 1990–2001 and 2002–2001, respectively, with a uniform distribution.
Meanwhile, to discern the relative contributions of distinct parameters to the uncertainty inherent in model predictions, a one-at-a-time (OAT) sensitivity analysis was executed. The OAT methodology involves altering one parameter while maintaining others as constant, thereby isolating and gauging the impact of that particular parameter on the projected outcomes. By comparing the relative influence of various parameters, those that wield a more pronounced effect on model predictions become evident. Within the purview of the OAT analysis conducted here, each parameter was perturbed by +10 % to discern the variables imparting considerable uncertainty to forecasted cement carbon uptake.
3.1 Global and reginal CO2 emissions from cement processes
Although carbon reduction policies have become more stringent and technologies more effective since 2019, accompanied by uncertainty factors such as the fact that the COVID-19 pandemic occurred, global CO2 emissions from cement processes have been increasing rapidly over the recent past decades due to the continuous growth in the production of cement and related clinker, though this showed a slightly lower average annual growth rate in 2019 (8.57 %) compared to recent past decades (8.68 %). According to our calculations and estimates, the global cement process CO2 emissions have increased from 0.03 Gt yr−1 in 1930 to 1.81 Gt yr−1 in 2021. Over the period 1930–2021, global cumulative cement process CO2 emissions amounted to 41.55 Gt (95 % CI: 38.74–47.19 Gt CO2). Specifically, around 67 % was accumulated from 1930 to 1990, only slightly less than that from 1930 to 2019 (71 %). This illustrates that the rapid increase in cement process emissions is mainly driven by industrialization and urbanization accompanied by the development of the global economy. From 1930 to 2021, global cement production increased by over 6000 %, while the growth rate of CO2 emissions (5547.31 %) was slightly lower than that of cement production, partly due to the relative decreases in average clinker ratios from ∼89 % in 1930 to ∼70 % in 2019 (Wang et al., 2021).
The regional contribution of CO2 emissions from the cement process has been altered over the period 1930–2021. As shown in Fig. 3, the CO2 emissions from the cement processes in each region show an overall growth trend, while the growth rate varies by country and region. Among all regions, China experienced the most dramatic increasing emission trend, with an annual growth rate of 7.7 % and reaching 0.76Gt CO2 (95 % CI: 0.73–0.80 Gt CO2) in 2021. China contributed 33.5 % of cumulative process emissions (13.91 Gt CO2, 95 % CI: 12.44–17.00 Gt CO2) during the period 1930–2021. Meanwhile, ROW (mainly developing countries or regions), Europe and the US were responsible for about 35.6 % (14.78 Gt CO2, 95 % CI: 13.17–17.87 Gt CO2), 23.98 % (9.96 Gt CO2, 95 % CI: 8.71–12.46 Gt CO2) and 6.3 % (2.62 Gt CO2, 95 % CI: 2.29–3.27 Gt CO2) of the total cumulative emissions respectively. India has experienced an incremental growth trend in recent years, totally emitting 2.56 Gt CO2 (95 % CI: 2.33–3.02 Gt CO2), accounting for around 6.2 % of process emissions. China and ROW kept their absolute leader role in cement CO2 emissions till 2021, but the share of India decreased significantly from ∼ 10 % to 6.2 % in the most recent 2 years, partly because of the shrinkage of the cement market during the COVID pandemic (Schlorke et al., 2020).
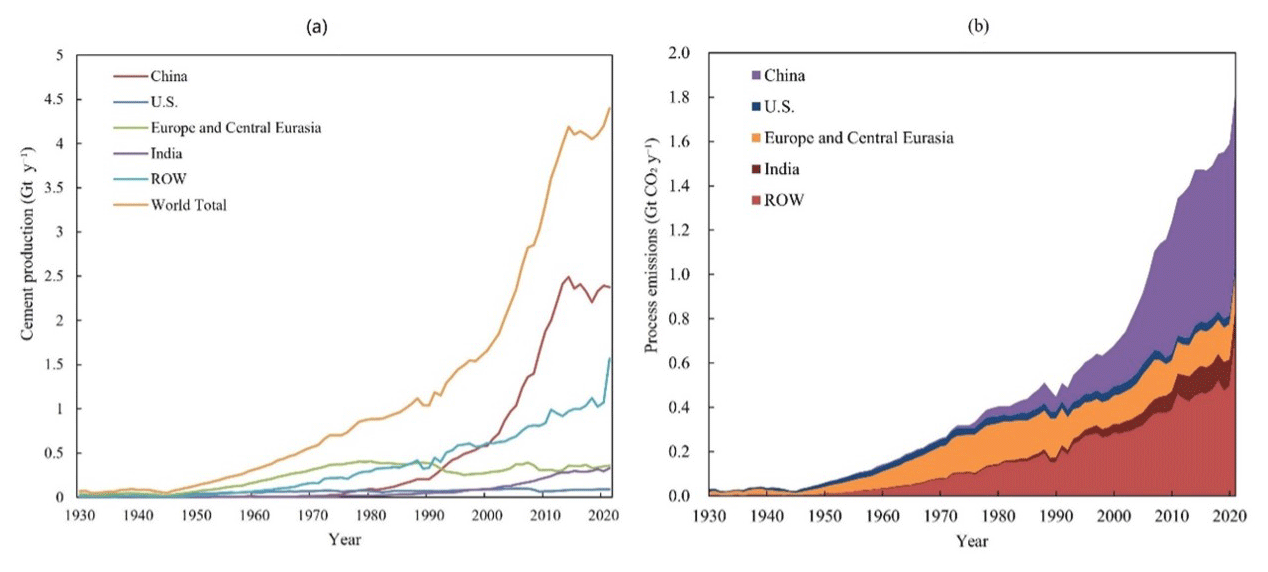
Figure 3Regional and global cement production (a) and process emissions (b) from 1930 to 2021.
Meanwhile, according to our calculations, there has been a persistent upward trend in global cement production since 2019, which has led to a corresponding increase in CO2 emissions during the pandemic period (2020–2021). In 2020, global cement production reached 1590.38 Mt, and this figure rose to 1819.48 Mt in 2021. Notably, the ROW accounted for the highest contribution, with production increasing from 495.75 in 2020 to 725.83 Mt in 2021. The surge in demand for cement in 2021 can be attributed to the recovery from the pandemic, which resulted in the resumption of delayed construction projects (Schlorke et al., 2020).
However, it is important to note that China bucked this trend, experiencing a slight decline in cement production from 752.40 in 2019 to 748.64 Mt in 2021, with an intermediate figure of 774.45 Mt in 2020. This deviation can be attributed to China's stringent policy measures and the property crisis that unfolded in 2020 and 2021 (Hale et al., 2022).
3.2 Cement carbon uptake by region and material type
According to our estimates, the total global CO2 uptake by cement reached 0.96 Gt CO2 (95 % CI: 0.81–1.15 Gt CO2) in 2021, with an average annual growth rate of 7.9 %. This means that 30.8 % of CO2 emission from the cement process in 2021 was offset by cement carbon uptake in that year. It shows that the cement uptake increased fast during around 2000–2013, then the increase rate slowed down due to the changes in cement production. Global cumulative CO2 uptake by cement was estimated to be 22.90 Gt CO2 (95 % CI: 19.64–26.64 Gt CO2), equivalent to ∼ 55 % of the cumulative emissions over the same period. As we can see in Fig. 4, in China, cement carbon uptake increased from 0.05 Mt in 1930 to 426.77 Mt in 2021; its cumulative uptake reached 7.06 Gt CO2 (95 % CI: 5.22–9.44 Gt CO2), accounting for 30.8 % of global cumulative uptake. The cement carbon uptake in China grew exponentially, while the growth curves in the US and European countries were relatively smooth. This is mainly because the cement demand in China has seen rapid growth in recent decades, while developed countries have been close to saturation after the 1980s. Moreover, concrete structures in developed countries have a longer service life (estimated 70 years). As for the rest of world, the total carbon uptake by cement has also increased significantly (from 0.74 Mt in 1930 to 328.23 Mt in 2021), and the growth trend in these countries was smoother than in China but more dramatic than in the US and Europe.
In addition, the amount of cement carbon uptake varies depending on the type of cement material. Mortar contributes the largest portion of cement carbon uptake, although its application scale is much less than concrete (∼ 73 % for concrete use and ∼ 24 % for mortar use). This is because mortar, as a building decoration material, has the characteristics of small thickness, large exposed surface area and therefore fast carbonation kinetics. According to Fig. 6, in 2021, the carbon uptakes by mortar and concrete were 536.85 and 325.95 Mt, accounting for 55.6 % and 33.8 % of the total cement carbon uptake respectively. Meanwhile, cement kiln dust (CKD) and loss waste absorbed 62.60 Mt (6.5 %) and 34.97 Mt (3.6 %) CO2 respectively.
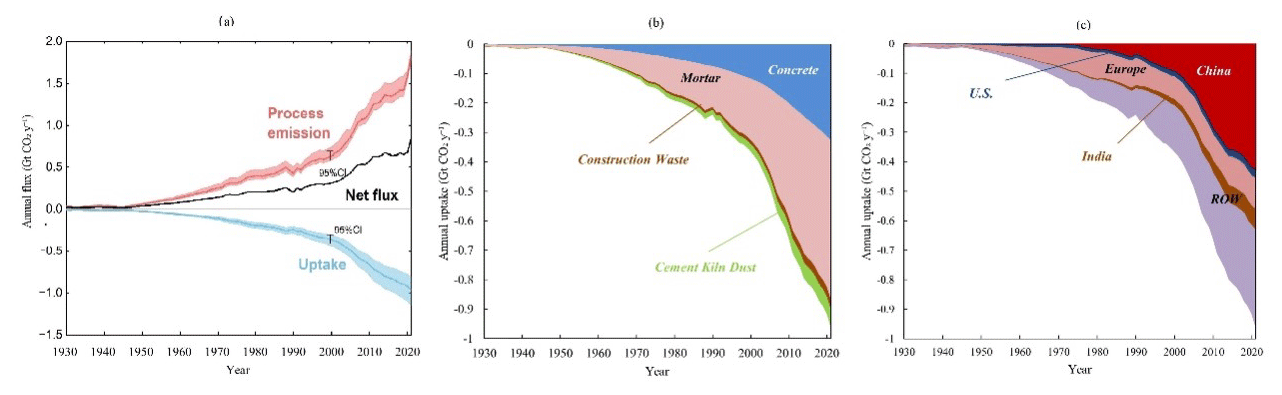
Figure 4Annual cement-carbon-uptake-induced net emission (a) and cement CO2 uptake by different cement materials (b) and by different country or region (c) from 1930 to 2021.
3.3 Features of cement carbon uptake
The cement uptake in certain years actually consists of two parts, namely the current uptake and the historical uptake. The current uptake refers to the uptake from the year cement is produced and has a close relationship with the current cement production. Historical uptake refers to the uptake accumulated from the year before. The natural carbonation of cement materials is a slow, dynamic process, and, thus, the carbon uptake by cement has obvious time lag effects. As shown in Fig. 7, part of the carbon uptake in a given period was contributed by cement materials in previous periods. This is because the cementitious materials' carbon uptake is a very slow process, leading to a long period being required to accumulate and to manifest; during the demolishment period of cement materials, crushing increases its newly exposed surface area and carbonation rate, allowing the carbon uptake capacity of cement materials to persist for a long time. With this feature, the cement carbon uptake capacity can be affected by the service life of cement buildings, and the average lifetime in China (40 years) is less than in the US and Europe (65–75 years). Therefore, countries such as China, with a higher-speed cement carbonation cycle, can make relatively greater contributions to cement carbon uptake. However, the majority of cement carbon uptake was still attributed to the consumption use stage, providing a ∼ 64 % share in 2021.
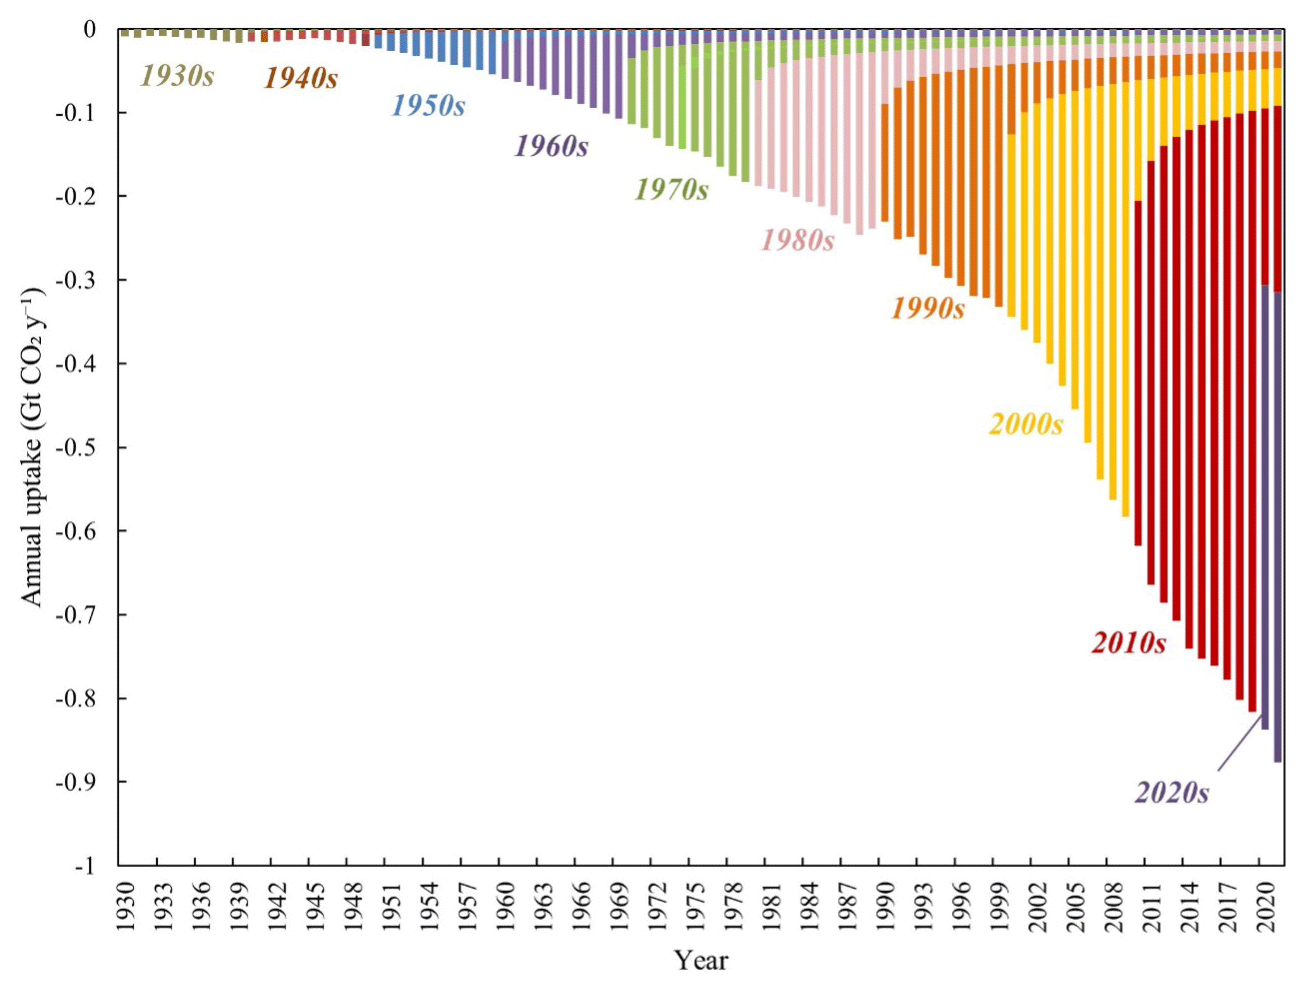
Figure 5The cumulative characteristic of cement carbon uptake. The colour-coded bar areas represent the amount of uptake by the cement produced and/or consumed in each decade from 1930 to 2021. The fractions of uptake that occurred in each decade post-1990 are annotated. The tails indicate that cement produced in a certain time will keep absorbing CO2 beyond its consumption use stage, and the annual uptakes are composed of current and historical contributions.
We can also learn from Fig. 6 that the growth rate of historical carbon uptake spiked after the 1990s. It is noteworthy that 75.4 % of the cement carbon uptake has occurred since the 1990s, larger than that of 2019 (71 %). This surge can be explained by the surplus absorption in the demolition phase due to the historically produced cement in European countries during the 1930s and 1940s on the one hand and by the considerably increased demand for cement materials in China after the implementation of the reform and opening-up policy on the other hand.
Besides, the offset level (55.1 %) is slightly higher than our previous estimate for 1930–2019 (∼ 52 %) (Guo et al., 2021), mainly due to the rapid increase in demand from ROW during the COVID pandemic (Schlorke et al., 2020).
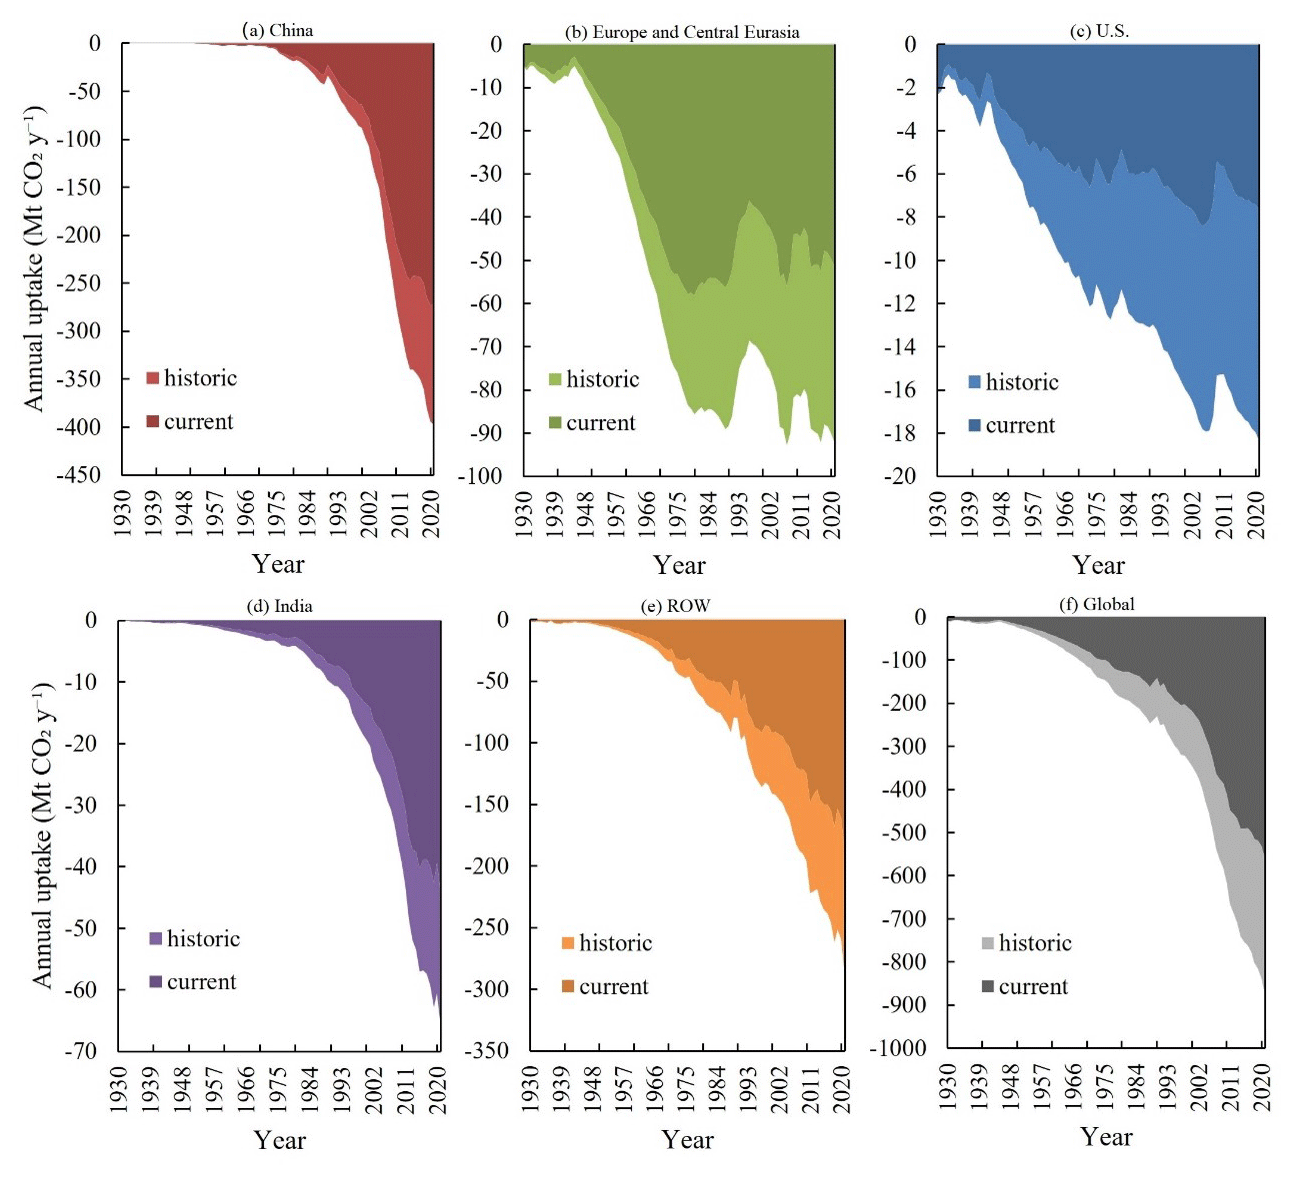
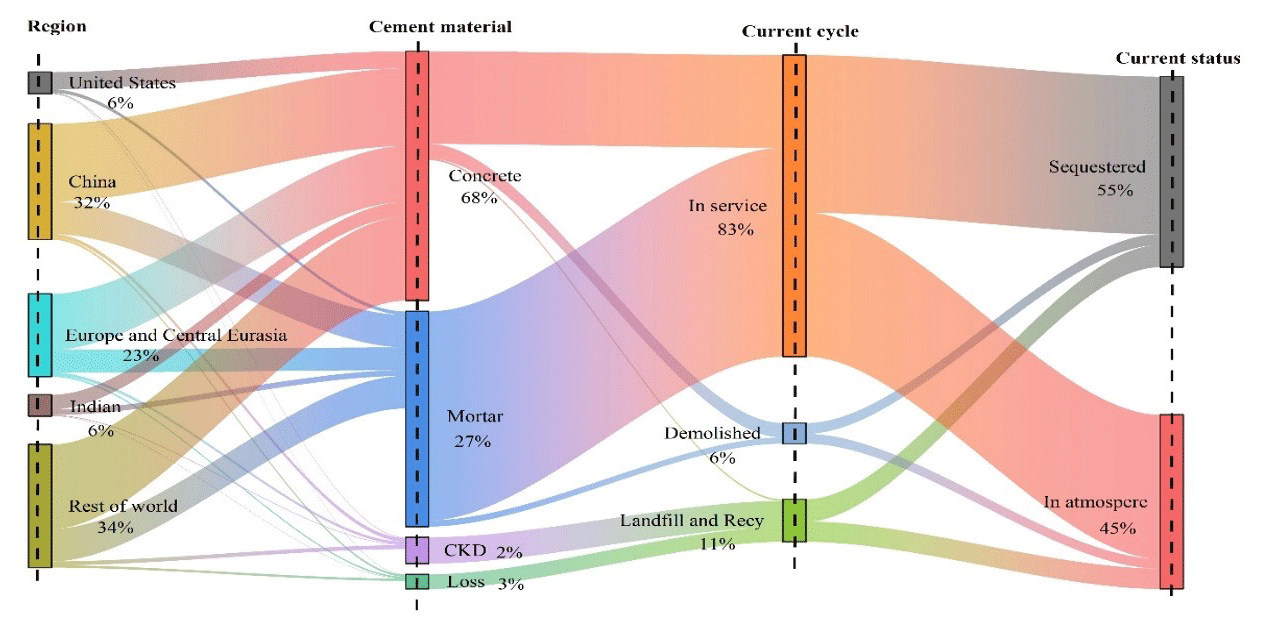
Figure 7 traces the cumulative cement process CO2 emissions between 1930 and 2021 according to the regional production and use of cement in different materials and according to the life cycle of each type of material. From a regional perspective, between 1930 and 2021, 6 %, 32 %, 23 %, 6 % and 34 % of CO2 emissions from cement production were from the United States, China, Europe, India and the rest of the world respectively. For cement material, the CO2 emissions were 68 % from concrete, 27 % from mortar, 2 % from cement loss during the construction stage and 3 % from CKD generation. The CO2 emissions can be allocated as follows: 83 % to service life cement, 6 % to demolished cement, and 11 % to demolition cement landfills and recycling. Overall, the emissions during 1930–2021 are sequestered by cement materials, and 43 % remain in atmosphere.
Our series of research into building cement carbon uptake accounting methods and quantitative calculation of its carbon absorption has made up for the lack of methods in the IPCC national greenhouse gas inventory guidelines (IPCC, 2006; Xi et al., 2016) and has provided data and technical support for the precise calculation of the global carbon balance and carbon neutrality. In the global carbon budget report, the impact of cement carbon sequestration on global carbon balance has started to be considered (Friedlingstein et al., 2022). According to the analysis conducted in the present study, the cement materials' annual carbon uptake in 2021 was equivalent to 7.67 % of the global industrial process emissions of CO2 (Friedlingstein et al., 2022), approximately 8.23 % of the average global land carbon sink from 2010 to 2020 (Friedlingstein et al., 2022) and approximately 23.80 % of the average net global forest sink from 1990 to 2007 (Pan et al., 2011). The cement carbon sink of China alone in 2021 was about 0.43 Gt CO2 yr−1, which accounts for 48 % to 60 % of the terrestrial carbon sink in China during the past decades (Yang et al., 2022), with the substantial cement carbon sequestration making it one of the important carbon sinks that cannot be ignored in the national and global carbon cycle and carbon neutrality evaluation. Meanwhile, the carbonization of cement materials is considered to be one of the most promising technologies for carbon dioxide capture and storage. Scientists and engineers have been inspired by the carbonization effect of cement to develop carbon capture, utilization and storage technologies (CCUS) by using construction waste (Skocek et al., 2020; Hargis et al., 2021). Certainly, the CCUS technology of mineralization is technically feasible, but further research is still needed to reduce economic costs and to identify suitable application department scenarios. In the future, use of alkaline mineral carbon sequestration to achieve emission reductions will play an important role in achieving carbon neutrality goals (Chiang and Pan, 2017; Hargis et al., 2021).
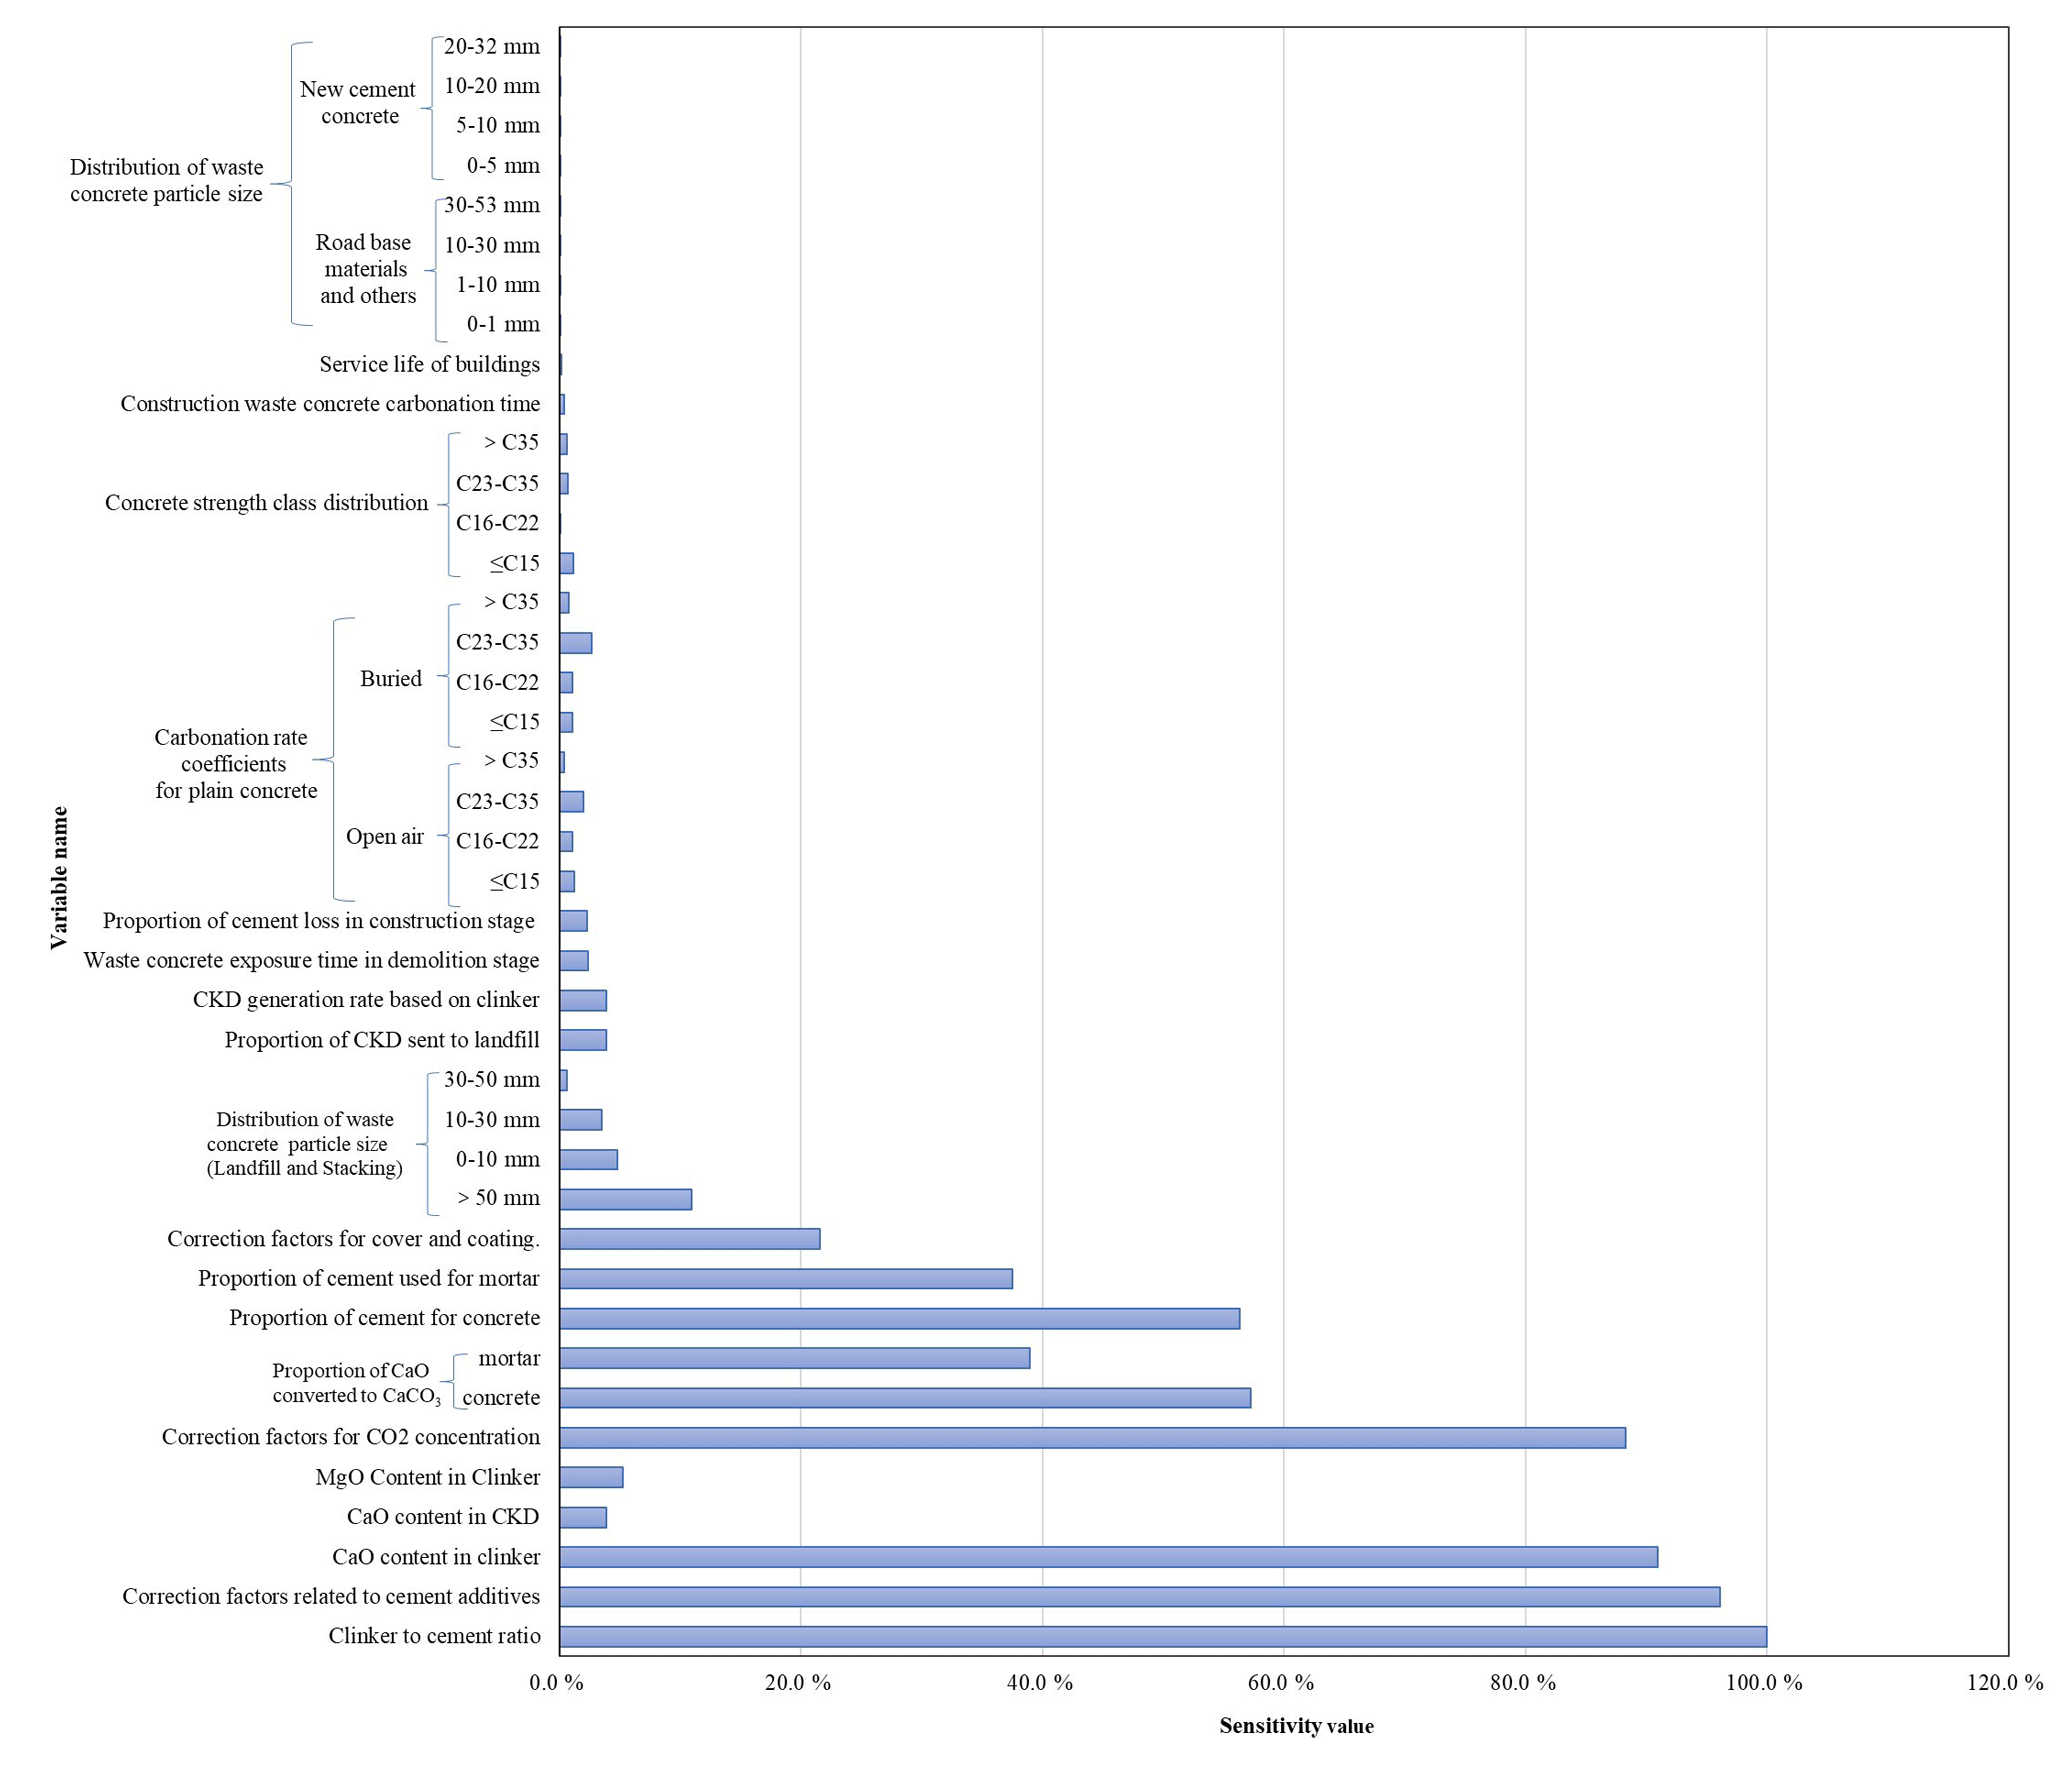
Figure 8Sensitivity analysis of cement carbon uptake, taking China's carbon uptake simulation as an illustrative case.
3.4 Uncertainty analysis
The estimates of cement carbon uptake and emissions underwent thorough uncertainty analysis utilizing Monte Carlo simulations. The findings reveal that the 95 % confidence interval for cumulative carbon uptake spanning from 1930 to 2021 ranges from 19.6 to 26.6 Gt CO2, while the cumulative emissions exhibit a range of 38.7 to 47.2 Gt CO2, as presented in Table S4.
Through executing an OAT sensitivity analysis that uses China's carbon uptake simulation as an illustrative case (Fig. 8), overall, the main influential parameters can be categorized as cement material properties, carbonation efficiency parameters and environmental factors. Notably, cement material properties encompassing factors such as clinker-to-cement ratio (100 %), correction factors related to cement additives (96.1 %) and CaO content in clinker (90.9 %) exerted the most substantial influence, given their direct impact on the scale of carbon uptake. Carbonation efficiency parameters encompassing the proportions of CaO converted to CaCO3 for concrete and mortar introduced significant uncertainty at levels of 57.2 % and 38.9 % respectively. This underscores the pivotal role that carbonation efficiency uncertainty plays in determining outcomes. Environmental factors primarily encapsulated by the CO2 concentration correction factor were responsible for 88.2 % of the uncertainty in predictions. Consequently, ambient CO2 levels exercise a notable sway over the degree of result uncertainty. The uncertainty analysis provides a quantitative basis for assessing the influence of different factors on carbon uptake. Further collection of measured data and improving the certainty of key parameters in the future will help reduce result uncertainty and improve estimation accuracy.
Furthermore, in order to establish the validity of this study, we attempted cross-validation. Generally, the coverage of the global cement carbonation uptake within the existing research is limited, with only a handful of studies (Xi et al., 2016; Guo et al., 2021; Cao et al., 2020) delving into this area. The majority of research focuses solely on specific regions, like Spain (Sanjuán et al., 2020) or the Nordic countries (Pade and Guimaraes, 2007) or particular structures, such as the Itaipu Dam (Possan et al., 2017). Moreover, there is a notable discrepancy in the methodologies employed among studies that share similar scopes. Notably, the iterative updating approach is utilized in various studies but with distinct variations. For instance, Guo's research method builds upon the foundation established by Xi's work, a progression that Guo elaborates upon in their paper (Guo et al., 2021).
All the original datasets used for estimating the emissions and uptake in this study and the resulting datasets themselves from the simulation, as well as the associated uncertainties, are made available on Zenodo at https://doi.org/10.5281/zenodo.7516373 (Bing et al., 2023).
Due to the unique characteristics of carbon uptake by cement, it is imperative to conduct a scientific and comprehensive estimation of cement carbon uptake. This is crucial for accurately assessing the environmental impact of the cement industry and for supporting global carbon neutrality goals. From a kinetic standpoint, cement carbon uptake is a dynamic process that occurs during various stages, including production and/or consumption, demolition, and reuse. Therefore, it is highly significant to incorporate historical cement legacy sequestration and to utilize dynamic clinker ratios to enhance the comprehensiveness and accuracy of estimations. Our objective in this study is to update our data in the temporal dimension while maintaining consistency with our previous work in terms of methodology. Updating the data within the same framework will enhance the completeness of our database, thereby providing a reliable data foundation for our future forecasting endeavours.
Based on our estimations, the cumulative carbon uptake by cement materials from 1930 to 2021 amounts to 22.90 Gt CO2 (with a 95 % confidence interval, CI: 19.64–26.64 Gt CO2). Mortar contributes approximately 58.5 % to the total uptake, effectively offsetting 55.1 % of the cumulative process emissions.
This dataset and estimation methodology can be employed as a valuable set of tools for evaluating cement carbon emissions and uptake throughout the dynamic processes encompassing the entire cement life cycle. While per capita cement stocks in Europe and the United States are reaching saturation levels, China has emerged as the dominant region in cement production and consumption following the implementation of China's reform and opening-up policy. Considering that cement demand in China and other developing countries is expected to continue increasing, it becomes evident that this trend will impact the assessment of global carbon neutrality. Therefore, it is crucial to make further efforts to improve the accuracy of cement carbon uptake estimation by incorporating direct clinker production data and experimentally derived, spatially resolved conversion factors.
The supplement related to this article is available online at: https://doi.org/10.5194/essd-15-4947-2023-supplement.
ZH prepared, reviewed and edited the manuscript with assistance from JW, YQ, LB, YY, RG, MM, LN, ZL and FX. ZH performed the analyses with support from JW, MM, LN and YY in the analytical approaches and figure making. ZH, JW, LB and YQ curated the datasets. LB, FX and ZH developed the code and performed the simulations with support from YQ. DT, RMA, PF and JGC reviewed and edited the paper. ZL and FX conceptualized and supervised the study.
The contact author has declared that none of the authors has any competing interests.
Publisher's note: Copernicus Publications remains neutral with regard to jurisdictional claims made in the text, published maps, institutional affiliations, or any other geographical representation in this paper. While Copernicus Publications makes every effort to include appropriate place names, the final responsibility lies with the authors.
Jiaoyue Wang and Fengming Xi acknowledge funding from the Youth Innovation Promotion Association, Chinese Academy of Sciences (grant nos. 2020201 and Y202050); the Natural Science Foundation of China (grant no. 41977290); the Liaoning Xingliao Talents Project (grant no. XLYC1907148); and the Major Program of the Institute of Applied Ecology, Chinese Academy of Sciences (grant no. IAEMP202201). Josep G. Canadell thanks the support of the National Environmental Science Program – Climate Systems hub.
This work was supported by the Youth Innovation Promotion Association, Chinese Academy of Sciences (grant nos. 2020201 and Y202050); the Natural Science Foundation of China (grant no. 41977290); the Liaoning Xingliao Talents Project (grant no. XLYC1907148); and the Major Program of the Institute of Applied Ecology, Chinese Academy of Sciences (IAEMP202201).
This paper was edited by Guanyu Huang and reviewed by two anonymous referees.
Andersson, R., Fridh, K., Stripple, H., and Häglund, M.: Calculating CO2 Uptake for Existing Concrete Structures during and after Service Life, Environ. Sci. Tech. Let., 47, 11625–11633, https://doi.org/10.1021/es401775w, 2013.
Andrew, R. M.: Global CO2 emissions from cement production, 1928–2018, Earth Syst. Sci. Data, 11, 1675–1710, https://doi.org/10.5194/essd-11-1675-2019, 2019.
Antunes, M., Santos, R. L., Pereira, J., Rocha, P., Horta, R. B., and Colaço, R.: Alternative Clinker Technologies for Reducing Carbon Emissions in Cement Industry: A Critical Review, Materials, 15, 209, https://doi.org/10.3390/ma15010209, 2021.
Bing, L. F., Huang, H., Wang, J. Y., and Xi, F. M.: Global carbon uptake of cement carbonization accounts 1930–2021, Zenodo [data set], https://doi.org/10.5281/zenodo.7516373, 2023.
Cao, Z., Shen, L., Løvik, A. N., Müller, D. B., and Liu, G.: Elaborating the History of Our Cementing Societies: An in-Use Stock Perspective, Environ. Sci. Tech. Let., 51, 11468–11475, https://doi.org/10.1021/acs.est.7b03077, 2017.
Cao, Z., Myers, R. J., Lupton, R. C., Duan, H., Sacchi, R., Zhou, N., Miller, T. R., Cullen, J. M., Ge, Q., and Liu, G.: The sponge effect and carbon emission mitigation potentials of the global cement cycle, Nat. Commun., 11, 3777, https://doi.org/10.1038/s41467-020-17583-w, 2020.
China Cement Association (CCA): China Cement Almanac, China Building Industry Press, Beijing, China, ISBN 9787516007594, 2001–2015.
Chiang, P. C. and Pan, S. Y.: CO2 Mineralization and Utilization via Accelerated Carbonation, in: Carbon Dioxide Mineralization and Utilization, Springer, Singapore, https://doi.org/10.1007/978-981-10-3268-4_3, 2017.
Damineli, B. L., Kemeid, F. M., Aguiar, P. S., and John, V. M.: Measuring the eco-efficiency of cement use, Cement Concrete Comp., 32, 555–562, https://doi.org/10.1016/j.cemconcomp.2010.07.009, 2010.
Damtoft, J. S., Lukasik, J., Herfort, D., Sorrentino, D., and Gartner, E. M.: Sustainable development and climate change initiatives, Cement Concrete Res., 38, 115–127, https://doi.org/10.1016/j.cemconres.2007.09.008, 2008.
EFDB: Emission Factor for CO2 Emissions from Cement Production, https://www.ipcc-nggip.iges.or.jp/EFDB/ef_detail.php (last access: 9 March 2023), 2002.
Friedlingstein, P., Jones, M. W., O'Sullivan, M., Andrew, R. M., Bakker, D. C. E., Hauck, J., Le Quéré, C., Peters, G. P., Peters, W., Pongratz, J., Sitch, S., Canadell, J. G., Ciais, P., Jackson, R. B., Alin, S. R., Anthoni, P., Bates, N. R., Becker, M., Bellouin, N., Bopp, L., Chau, T. T. T., Chevallier, F., Chini, L. P., Cronin, M., Currie, K. I., Decharme, B., Djeutchouang, L. M., Dou, X., Evans, W., Feely, R. A., Feng, L., Gasser, T., Gilfillan, D., Gkritzalis, T., Grassi, G., Gregor, L., Gruber, N., Gürses, Ö., Harris, I., Houghton, R. A., Hurtt, G. C., Iida, Y., Ilyina, T., Luijkx, I. T., Jain, A., Jones, S. D., Kato, E., Kennedy, D., Klein Goldewijk, K., Knauer, J., Korsbakken, J. I., Körtzinger, A., Landschützer, P., Lauvset, S. K., Lefèvre, N., Lienert, S., Liu, J., Marland, G., McGuire, P. C., Melton, J. R., Munro, D. R., Nabel, J. E. M. S., Nakaoka, S.-I., Niwa, Y., Ono, T., Pierrot, D., Poulter, B., Rehder, G., Resplandy, L., Robertson, E., Rödenbeck, C., Rosan, T. M., Schwinger, J., Schwingshackl, C., Séférian, R., Sutton, A. J., Sweeney, C., Tanhua, T., Tans, P. P., Tian, H., Tilbrook, B., Tubiello, F., van der Werf, G. R., Vuichard, N., Wada, C., Wanninkhof, R., Watson, A. J., Willis, D., Wiltshire, A. J., Yuan, W., Yue, C., Yue, X., Zaehle, S., and Zeng, J.: Global Carbon Budget 2021, Earth Syst. Sci. Data, 14, 1917–2005, https://doi.org/10.5194/essd-14-1917-2022, 2022.
Global Cement Directory: Global Cement Directory – listing of all global cement plants from Global Cement, https://www.globalcement.com/directory (last access: 25 December 20200), 2019.
Guo, R., Wang, J., Bing, L., Tong, D., Ciais, P., Davis, S. J., Andrew, R. M., Xi, F., and Liu, Z.: Global CO2 uptake by cement from 1930 to 2019, Earth Syst. Sci. Data, 13, 1791–1805, https://doi.org/10.5194/essd-13-1791-2021, 2021.
Hale, T., Telling, O., and Lin, A.: China property woes trigger decline in global cement output, Financial Times, https://www.ft.com/content/9e645c53-d3c2-4c73-951f-d2373de0e5ec (last access: 14 May 2023), 2022.
Hargis, C. W., Chen, I. A., Devenney, M., Fernandez, M. J., Gilliam, R. J., and Thatcher, R. P.: Calcium Carbonate Cement: A Carbon Capture, Utilization, and Storage (CCUS) Technique, Materials, 14, 2709, https://doi.org/10.3390/ma14112709, 2021.
Huntzinger, D. N., Gierke, J. S., Kawatra, S. K., Eisele, T. C., and Sutter, L. L.: Carbon Dioxide Sequestration in Cement Kiln Dust through Mineral Carbonation, Environ. Sci. Tech. Let., 43, 1986–1992, https://doi.org/10.1021/es802910z, 2009.
IEA: CO2 Emissions from Fuel Combustion 2019, International Energy Agency, https://doi.org/10.1787/9789264096134-en, 2019.
IPCC: IPCC Guidelines for National Greenhouse Gas Inventories 2006, https://www.ipcc-nggip.iges.or.jp/public/2006gl/vol3.html (last access: 20 May 2023), 2006.
Kaliyavaradhan, S. K., Ling, T.-C., and Mo, K. H.: CO2 sequestration of fresh concrete slurry waste: Optimization of CO2 uptake and feasible use as a potential cement binder, J. CO2 Util., 42, 101330, https://doi.org/10.1016/j.jcou.2020.101330, 2020.
Low, M.-S.: Material flow analysis of concrete in the United States, S.M., Department of Architecture, Thesis, Massachusetts Institute of Technology, USA, http://hdl.handle.net/1721.1/33030, 2005.
MIIT: Building materials, http://www.miit.gov.cn/n1146312/n1146904/n1648356/n1648361/index.html (last access: 22 August 2020), 2019.
NBS: National data, https://data.stats.gov.cn/ (last access: 22 August 2020), 2019.
Pade, C. and Guimaraes, M.: The CO2 uptake of concrete in a 100 year perspective, Cement. Concrete. Res., 37, 1348–1356, https://doi.org/10.1016/j.cemconres.2007.06.009, 2007.
Pan, Y., Birdsey, R. A., Fang, J., Houghton, R., Kauppi, P. E., Kurz, W. A., Phillips, O. L., Shvidenko, A., Lewis, S. L., Canadell, J. G., Ciais, P., Jackson, R. B., Pacala, S. W., McGuire, A. D., Piao, S., Rautiainen, A., Sitch, S., and Hayes, D.: A large and persistent carbon sink in the world's forests, Science, 333, 988–993, 2011.
Possan, E., Thomaz, W. A., Aleandri, G. A., Felix, E. F., and dos Santos, A. C. P.: CO2 uptake potential due to concrete carbonation: a case study, Case Studies in Construction Materials, 6, 147–161, https://doi.org/10.1016/j.cscm.2017.01.007, 2017.
Renforth, P., Washbourne, C.-L., Taylder, J., and Manning, D. A. C.: Silicate Production and Availability for Mineral Carbonation, Environ. Sci. Tech. Let., 45, 2035–2041, https://doi.org/10.1021/es103241w, 2011.
Sanjuán, M.Á., Andrade, C., Mora, P., and Zaragoza, A.: Carbon dioxide uptake by cement-based materials: a Spanish case study, Appl. Sci., 10, 339, https://doi.org/10.3390/app10010339, 2020.
Schlorke, S., Tu, L., Stec, M., Mallagray, J. V., and Kaleem, H.: The Impact of COVID-19 on the Cement Industry, International Finance Corporation, Washington, DC, http://hdl.handle.net/10986/35233, 2020.
Shen, L., Zhao, J., Wang, L., Liu, L., Wang, Y., Yao, Y., Geng, Y., Gao, T., and Cao, Z.: Calculation and evaluation on carbon emission factor of cement production in China, Chinese Sci. Bull., 61, 2926–2938, https://doi.org/10.1360/N972016-00037, 2016.
Skocek, J., Zajac, M., and Haha, M. B.: Carbon capture and utilization by mineralization of cement pastes derived from recycled concrete, Sci. Rep., 10, 5614, https://doi.org/10.1038/s41598-020-62503-z, 2020.
Trading Economics: Russia cement production, https://tradingeconomics.com/russia/cement-production (last access: 10 March 2023), 2021.
USGS: https://www.usgs.gov/centers/national-minerals-information-center/cement-statistics-and-information, last access: 15 March 2023.
Wang, J. Y., Bing, L. F, Tong, D., Guo, R., and Xi, F. M.: Global CO2 uptake of cement in 1930–2019 (Version 3), Zenodo [data set], https://doi.org/10.5281/zenodo.4459729, 2021.
Xi, F., Davis, S. J., Ciais, P., Crawford-Brown, D., Guan, D., Pade, C., Shi, T., Syddall, M., Lv, J., Ji, L., Bing, L., Wang, J., Wei, W., Yang, K.-H., Lagerblad, B., Galan, I., Andrade, C., Zhang, Y., and Liu, Z.: Substantial global carbon uptake by cement carbonation, Nat. Geosci., 9, 880–883, https://doi.org/10.1038/ngeo2840, 2016.
Xu, J.-H., Fleiter, T., Eichhammer, W., and Fan, Y.: Energy consumption and CO2 emissions in China's cement industry: A perspective from LMDI decomposition analysis, Energ. Policy, 50, 821–832, https://doi.org/10.1016/j.enpol.2012.08.038, 2012.
Xu, J.-H., Fleiter, T., Fan, Y., and Eichhammer, W.: CO2 emissions reduction potential in China's cement industry compared to IEA's Cement Technology Roadmap up to 2050, Appl. Energy, 130, 592–602, https://doi.org/10.1016/j.apenergy.2014.03.004, 2014.
Xuan, D. and Poon, C. S.: 16 – Sequestration of carbon dioxide by RCAs and enhancement of properties of RAC by accelerated carbonation, in: New Trends in Eco-efficient and Recycled Concrete, edited by: de Brito, J. and Agrela, F., Woodhead Publishing, 477–497, https://doi.org/10.1016/B978-0-08-102480-5.00016-6, 2019.
Yang, K.-H., Song, J.-K., and Song, K.-I.: Assessment of CO2 reduction of alkali-activated concrete, J. Clean Prod., 39, 265–272, https://doi.org/10.1016/j.jclepro.2012.08.001, 2013.
Yang, K.-H., Seo, E.-A., and Tae, S.-H.: Carbonation and CO2 uptake of concrete, Environ. Impact Assess. Rev., 46, 43–52, https://doi.org/10.1016/j.eiar.2014.01.004, 2014.
Yang, Y., Shi, Y., Sun, W., Chang, J., Zhu, J., Chen, L., Wang, X., Guo, Y., Zhang, H., Yu, L., Zhao, S., Xu, K., Zhu, J., Shen, H., Wang, Y., Peng, Y., Zhao, X., Wang, X., Hu, H., Chen, S., Huang, M., Wen, X., Wang, S., Zhu, B., Niu, S., Tang, Z., Liu, L., and Fang, J.: Terrestrial carbon sinks in China and around the world and their contribution to carbon neutrality, Sci. China Life Sci., 6, 861–895, 2022.