the Creative Commons Attribution 4.0 License.
the Creative Commons Attribution 4.0 License.
 | 20 Oct 2023
Modern air, englacial and permafrost temperatures at high altitude on Mt Ortles (3905 m a.s.l.), in the eastern European Alps
Luca Carturan
Fabrizio De Blasi
Roberto Dinale
Gianfranco Dragà
Paolo Gabrielli
Volkmar Mair
Roberto Seppi
David Tonidandel
Thomas Zanoner
Tiziana Lazzarina Zendrini
Giancarlo Dalla Fontana
The climatic response of mountain permafrost and glaciers located in high-elevation mountain areas has major implications for the stability of mountain slopes and related geomorphological hazards, water storage and supply, and preservation of palaeoclimatic archives. Despite a good knowledge of physical processes that govern the climatic response of mountain permafrost and glaciers, there is a lack of observational datasets from summit areas. This represents a crucial gap in knowledge and a serious limit for model-based projections of future behaviour of permafrost and glaciers.
A new observational dataset is available for the summit area of Mt Ortles, which is the highest summit of South Tyrol, Italy. This paper presents a series of air, englacial, soil surface and rock wall temperatures collected between 2010 and 2016. Details are provided regarding instrument types and characteristics, field methods, and data quality control and assessment. The obtained data series are available through an open data repository (https://doi.org/10.5281/zenodo.8330289, Carturan et al., 2023).
In the observed period, the mean annual air temperature at 3830 m a.s.l. was between −7.8 and −8.6 ∘C. The most shallow layers of snow and firn (down to a depth of about 10 m) froze during winter. However, melt water percolation restored isothermal conditions during the ablation season, and the entire firn layer was found at the melting pressure point. Glacier ice is cold, but only from about 30 m depth. Englacial temperature decreases with depth, reaching a minimum of almost −3 ∘C close to the bedrock, at 75 m depth. A small glacier located at 3470 m a.s.l., close to the summit of Mt Ortles, was also found in cold conditions down to a depth of 9.5 m. The mean annual ground surface temperature was negative for all but one monitored sites, indicating cold ground conditions and the existence of permafrost in nearly all debris-mantled slopes of the summit. Similarly, the mean annual rock wall temperature was negative at most monitored sites, except the lowest one at 3030 m a.s.l. This suggests that the rock faces of the summit are affected by permafrost at all exposures.
- Article
(34335 KB) - Full-text XML
- BibTeX
- EndNote


High-elevation mountain areas are complex systems influenced by physical processes occurring in the atmosphere, cryosphere and lithosphere. These processes closely interact with and govern the energy and mass balances as well as climatic response of mountain permafrost and glaciers located at high elevation. Their response to climatic changes has important consequences for (i) the stability of mountain slopes and related geomorphological hazards (Huggel et al., 2015; Knight and Harrison, 2023); (ii) the thermal regime, water storage, and stability of mountain glaciers (Deline et al., 2015); (iii) the hydrological balance and water supply from glacierized catchments (Irvine-Fynn and Hubbard, 2017); and (iv) the formation and preservation of palaeoclimatic archives, such as glacier geochemical records (Gabrielli et al., 2010).
The ongoing atmospheric warming is leading to a deep transformation of these high-elevation systems, which react sensitively to climatic changes. Indeed, the thermal state of the cryosphere is strongly influenced by variations in air temperature, which regulates its energy and mass balances and dynamic behaviour (Harris et al., 2009; Cicoira et al., 2019; Deline et al., 2015). Projections of future global climate indicate further warming in the absence of mitigation policies such as the reduction of greenhouse gas emission (Langsdorf et al., 2022). For this reason, the current impacts on high-elevation mountain areas are expected to continue and possibly accelerate.
Direct observations of the thermal state and response of high-elevation mountain areas are of great importance. Even though the physical processes that govern the energy and mass balances and climatic response of mountain permafrost and glaciers are known, model-based projections of their future behaviour are subject to large uncertainty. This is because the observational datasets required for model calibration and validation are particularly scarce for these summit areas, where model inputs and results are often poorly constrained and extrapolated, in the absence of direct observations (Charbonneau et al., 1981; Machguth et al., 2008; Carturan et al., 2012a; Zolles et al., 2019; Kinnard et al., 2022).
Thermal observations in high-elevation mountain areas are also of great value for (i) improving knowledge on the air temperature variability (e.g. the so-called elevation-dependent warming; Pepin et al., 2015, 2022) or the glacier cooling effect (Braithwaite et al., 2002; Carturan et al., 2015; Troxler et al., 2020; Shaw et al., 2023), (ii) better understanding the relationship between climatic proxies and meteorological variables (e.g. ice cores; Bohleber et al., 2013), (iii) evaluating/improving models (e.g. permafrost distribution models; Boeckli et al., 2012), (iv) biological and biogeochemical studies (e.g. Rathore et al., 2018), and (v) setting baseline conditions for future studies and trend analyses.
In this paper we present a novel 6-year dataset of air, rock, soil surface and englacial temperatures collected between 2010 and 2016 on the summit of Mt Ortles (46.508∘ N, 10.541∘ E; 3905 m a.s.l.), in the eastern Italian Alps. These observations were carried out in the framework of the Ortles Project (http://ortles.org, last access: 10 October 2023; Gabrielli et al., 2016), which is an international research project, coordinated by the Byrd Polar and Climate Research Center, The Ohio State University (USA) and the Hydrographic Office of the Autonomous Province of Bolzano, with the aim of extracting ice cores from the Alto dell'Ortles Glacier (Oberer Ortlerferner) to be used for palaeoclimatic and palaeoenvironmental investigations.
Here we provide a full description of the experimental site, data-collection methods and equipment, raw data processing and final datasets.
Mount Ortles (46.508∘ N, 10.541∘ E) is located in the Ortles–Cevedale mountain group, which is the largest glacierized area in the Italian Alps (Carturan et al., 2013), and it is the highest peak (3905 m a.s.l.) of South Tyrol (Fig. 1). From a lithological point of view, the summit of Mt Ortles is mainly composed by dolomites, alternated with dark-stratified limestones and paraconglomeratic limestone levels and breccias. Local outcrops of phyllites rich in quartz and orthogneiss can be found at the base of the mountain (Montrasio et al., 2012).
The northern part of the Ortles–Cevedale mountain range is characterized by a continental climate, with scarce annual precipitation (500 mm in the lower valley), which falls mostly in summer. Towards the south, there is an increasing Mediterranean influence, and the annual precipitation maxima are in spring and autumn, with cumulative amounts of 900 mm in the lower valleys. In the glaciated areas in the middle of the mountain range, at 3000–3200 m a.s.l., the mean annual precipitation has been estimated between 1400 and 1500 mm (Carturan, 2010; Carturan et al., 2012b). Using mass balance observations in the period from 2009 to 2016, it is possible to estimate 1300–1400 mm of annual precipitation on top of Mt Ortles. However, the snow accumulation and glacier mass balance are highly affected by wind, and estimating the actual precipitation is almost impossible at this site. In comparison, the closest weather station (Sulden (Solda) 1905 m a.s.l.) averaged an annual precipitation of 1090 mm between 1989 and 2019.
The mean annual isotherm of 0 ∘C is located at about 2500 m a.s.l. At the elevation of the glaciers (above 3000 m), the snow cover shows a typical annual cycle, so the accumulation season lasts between October and May and the ablation season between June and September. On the glaciers, however, snowfalls are frequent during summer, especially above 3300–3500 m. Liquid precipitation is rare on top of Mt Ortles, but some rain events have been observed in the last 15 years.
Glaciers, glacierets and snowfields cover the Mt Ortles flanks. Here we describe the Alto dell'Ortles and Hintergrat glaciers, which are the two ice bodies investigated in the Ortles Project. The summit area is almost entirely covered by the Alto dell'Ortles Glacier (Oberer Ortlerferner), which is the highest glacier of South Tyrol, ranging in altitude between 3018 and 3905 m a.s.l. and covering an area of 1.04 km2 (year 2008). The observed glacier thickness is about 75 m (Gabrielli et al., 2012), and the vertical ice profile encompasses the last ∼7 kyr (Gabrielli et al., 2016). This glacier is polythermal, with temperate firn and cold ice underneath (Gabrielli et al., 2012). From geomorphological evidence (trimlines and moraines), it is possible to estimate a maximum Little Ice Age (14th–19th centuries) area of 2.09 km2 for this glacier and a 50 % area loss since then. Between 1984 and 2005 the (geodetic) mass balance of the glacier was closer to equilibrium (−0.18 m w.e. yr−1) when compared to the majority of glaciers in the Ortles–Cevedale group in the same period (mean balance rate of −0.69 m w.e. yr−1; Carturan et al., 2013). A small glacier, named Hintergrat, covers part of the eastern rocky ridge of Mt Ortles. The area of this glacier is 0.09 km2, and its elevation ranges between 3340 and 3580 m a.s.l. This glacier is mostly in cold thermal conditions, and its front hangs over the Fine del Mondo Glacier (Ende der Welt Ferner) underneath.
Mountain permafrost is widespread on Mt Ortles, according to the permafrost distribution modelled by Boeckli et al. (2012), that indicates “permafrost in nearly all conditions” above 2600 m for areas with northern exposure and above 2900 m for areas with southern exposure.
Before the Ortles Project, no specific investigation existed on the air, englacial and permafrost temperatures of this mountain.
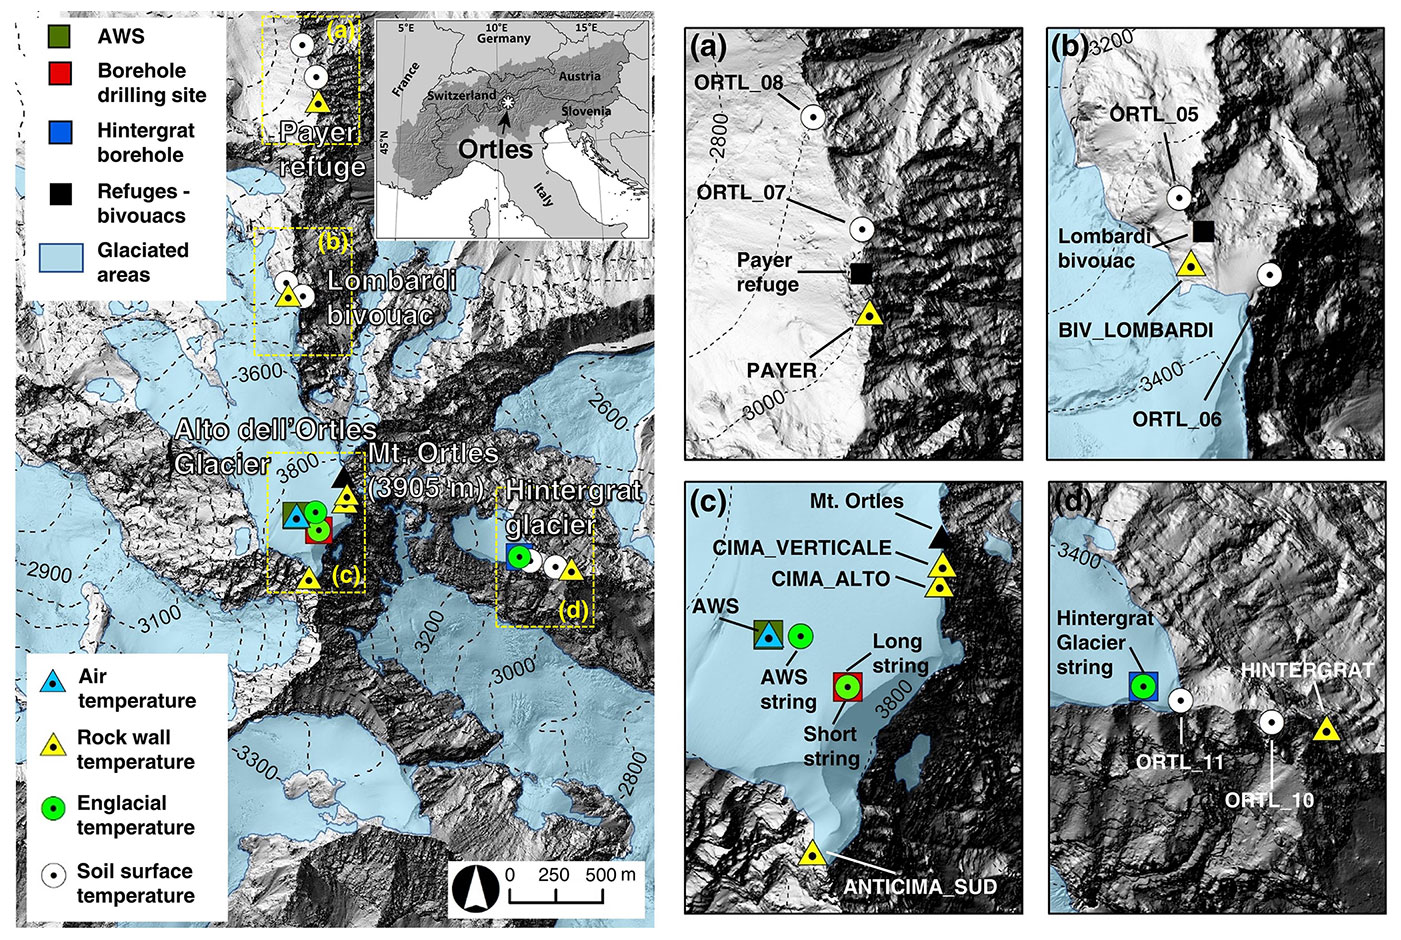
Figure 1Geographic locations of Mt Ortles and of sites instrumented for air, rock, englacial and soil surface temperature measurements. Close ups of the (a) Payer refuge, (b) Lombardi bivouac, (c) Mt Ortles summit area and (d) Hintergrat ridge are reported in the panels on the right. The background hill-shaded DEM (2017 lidar survey) is from http://geocatalogo.retecivica.bz.it/ (last access: 10 October 2023) (Agenzia per la Protezione civile, Autonomous Province of Bolzano).
The temperature datasets presented in this work were obtained by installing standalone data loggers connected to one or several temperature sensors. Due to the remoteness of the study site, data loggers were powered by lithium or lead–acid batteries, which in the case of the automatic weather station (AWS, Sect. 3.1) were recharged daily by solar panels. Periodic field visits, mostly performed from June to September, were used for instrument maintenance and data download using a laptop. No real-time transmission of data was set up.
The dataset is characterized by a good time coverage and a few gaps (Fig. 2), indicating the suitability of the selection of equipment and field procedures for installation and maintenance. The most significant temporal gaps affect soil surface temperature datasets due to the impossibility of accessing data loggers in late summer of 2011. Other minor gaps were caused by temporary malfunctions or by damaged equipment, e.g. the rupture of the fan-aspirated radiation shield at the AWS between February and August 2013, which forced us to treat this period as a data gap. We did not undertake gap-filling in order to keep the data recorded in the field as unchanged as possible.
Details of measuring equipment and installations are provided in the following sections. Further details about the instruments are provided in Table 1, and a topographic description of instrumented sites is reported in Table E1, in Appendix E. Figures showing examples of data series for each variable are provided in the following subsections.
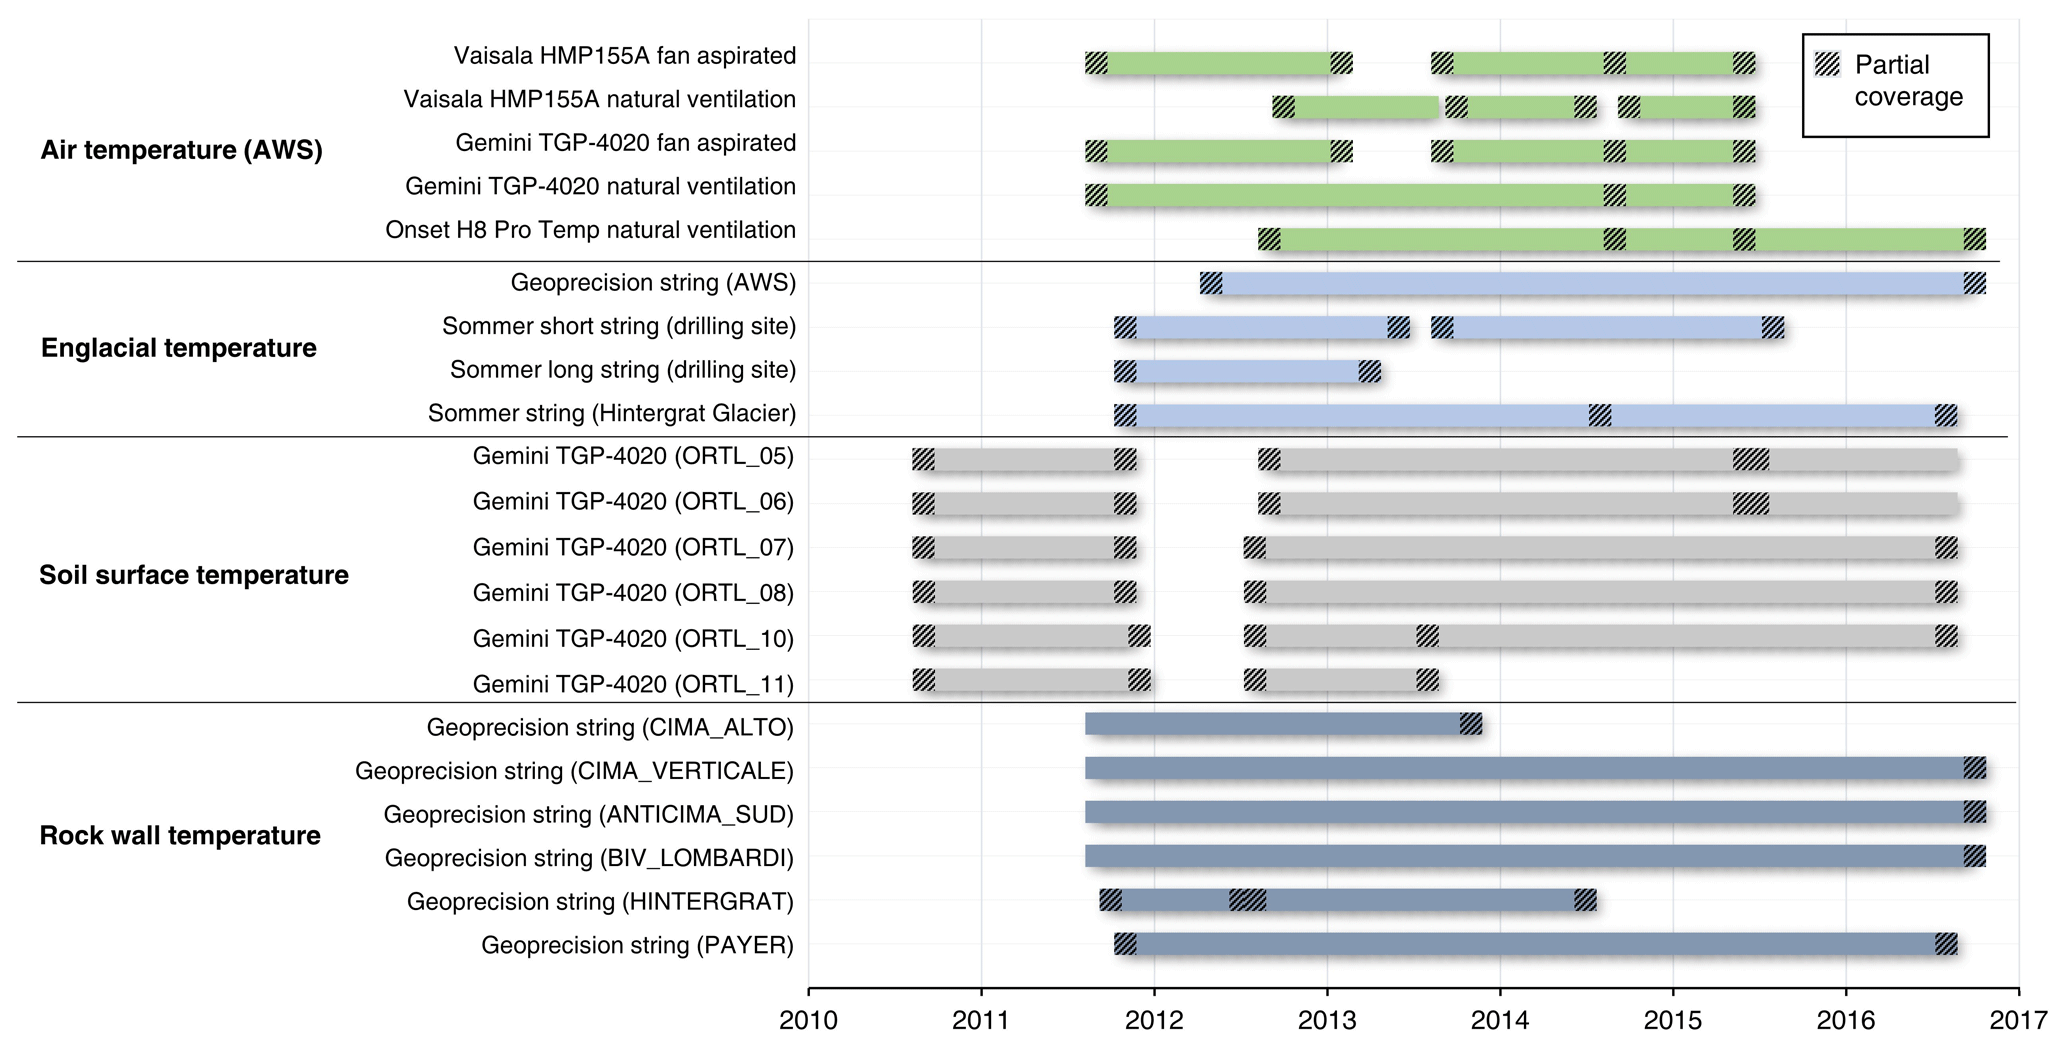
Figure 2Monthly coverage of temperature measurements available from 2010 to 2016 on Mt Ortles. Partial coverage indicates the occurrence of data gaps for specific months.
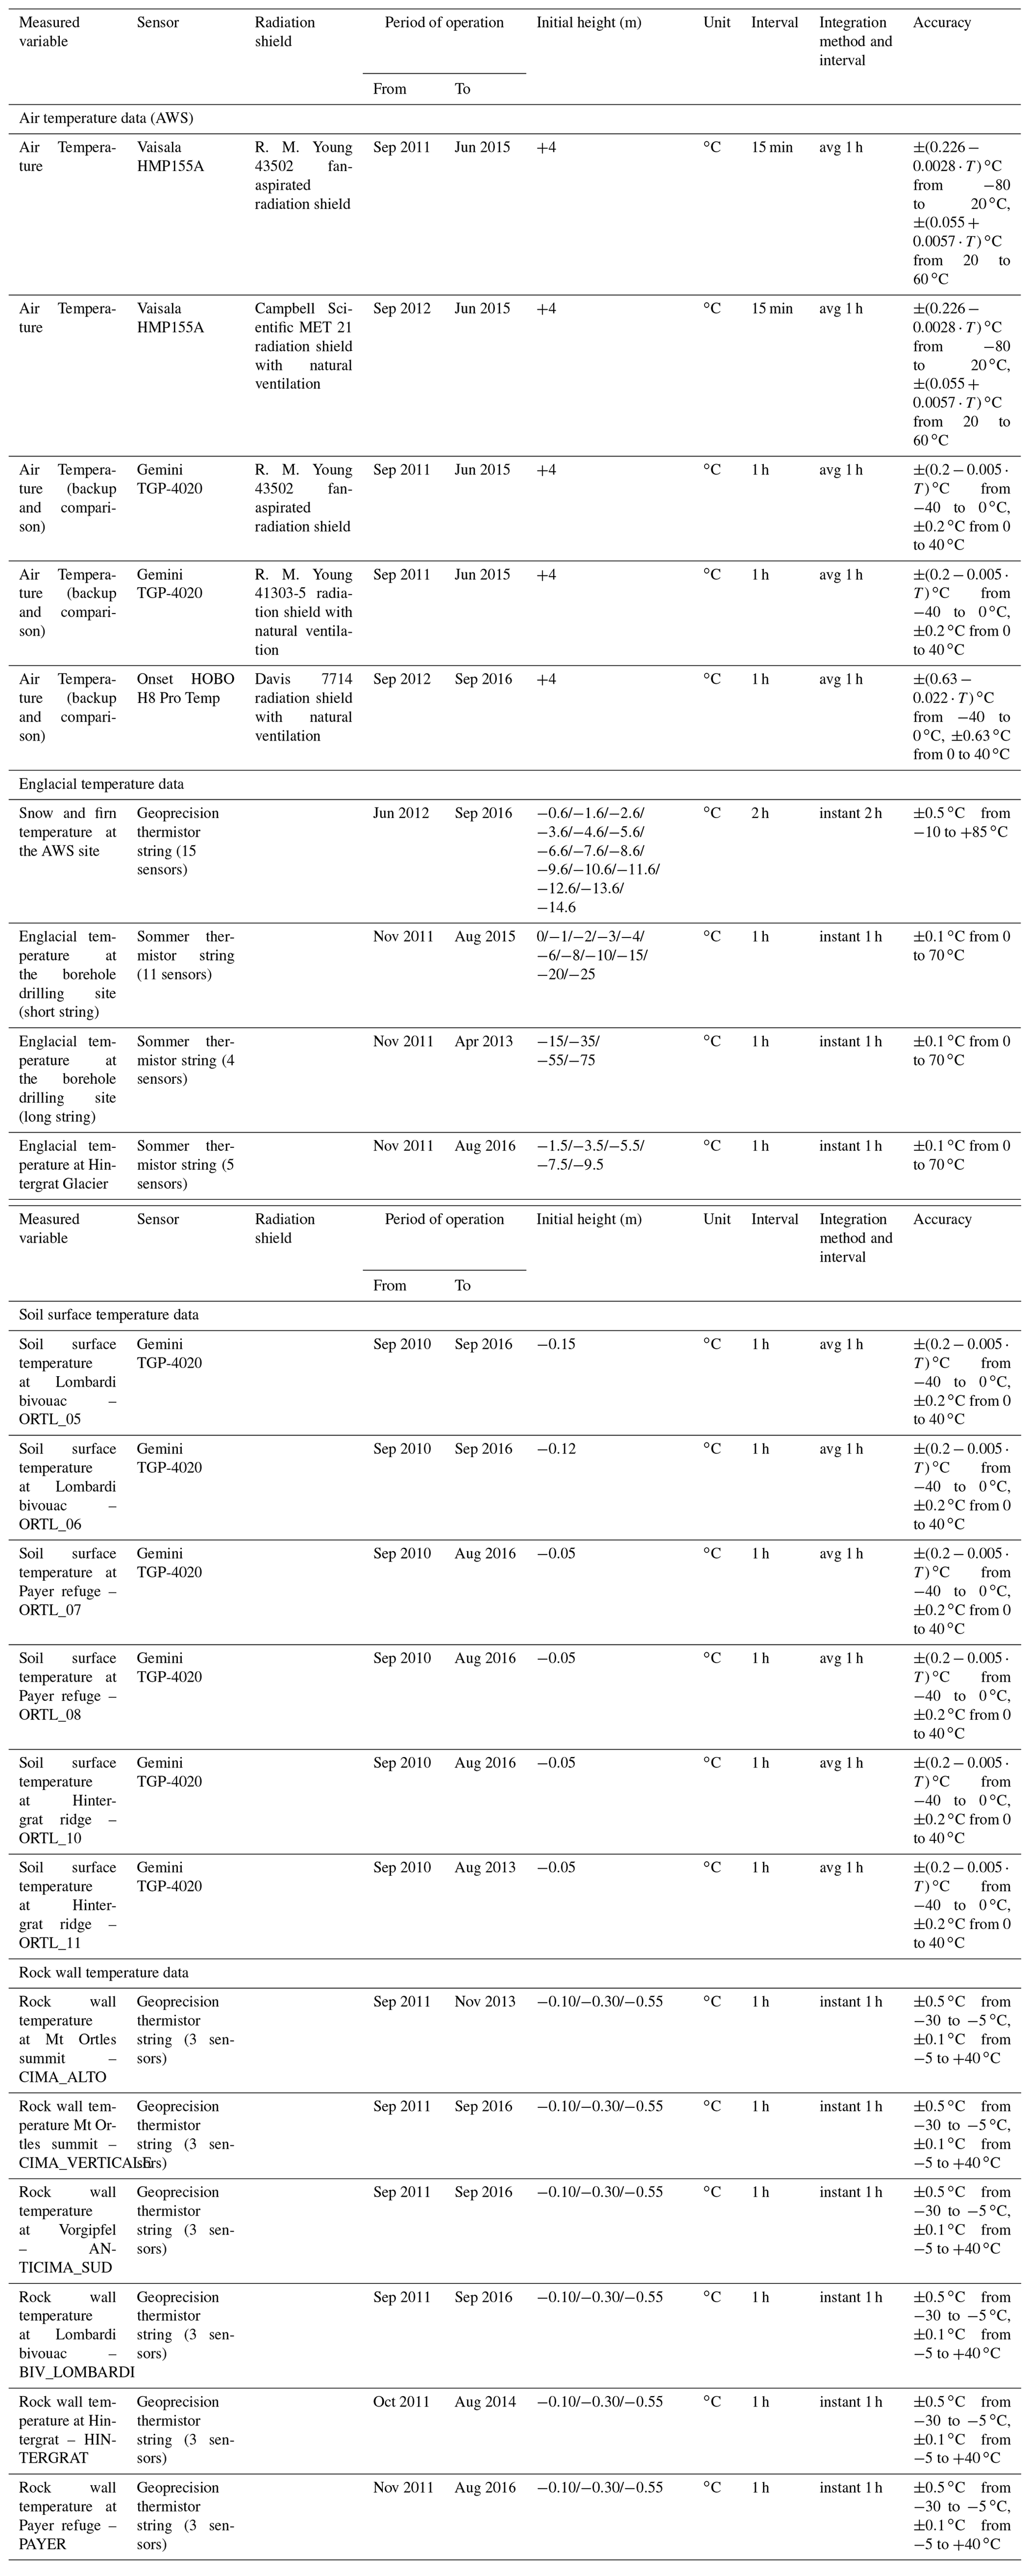
Table 1Sensor characteristics, set-up, and period of operation for air, englacial, soil surface, and rock wall temperature measurements on Mt Ortles.
3.1 Air temperature data
On 30 September 2011 an automatic weather station (AWS, Fig. 3) was installed on the upper accumulation area of Alto dell'Ortles Glacier, at an elevation of 3830 m a.s.l. The AWS was equipped with a Campbell Scientific CR-1000 data logger, solar panels, and sensors for air temperature and relative humidity (Vaisala HMP155A), wind speed and direction (R. M. Young 05103), incoming and outgoing short-wave and long-wave radiation (Delta Ohm LP Pyra 05 and LP PIRG 01), and snow depth (Campbell Scientific SR50A). The equipment was supported by an aluminium tower (composed of 2 m modules), anchored in the firn at 2 m depth and supported by wooden boards. After the installation, the tower extended 4 m from the surface. The sensors and solar panels were fixed on top of the tower, whereas the data-logger and battery housing box were fixed at the bottom (Figs. F1 and F2).
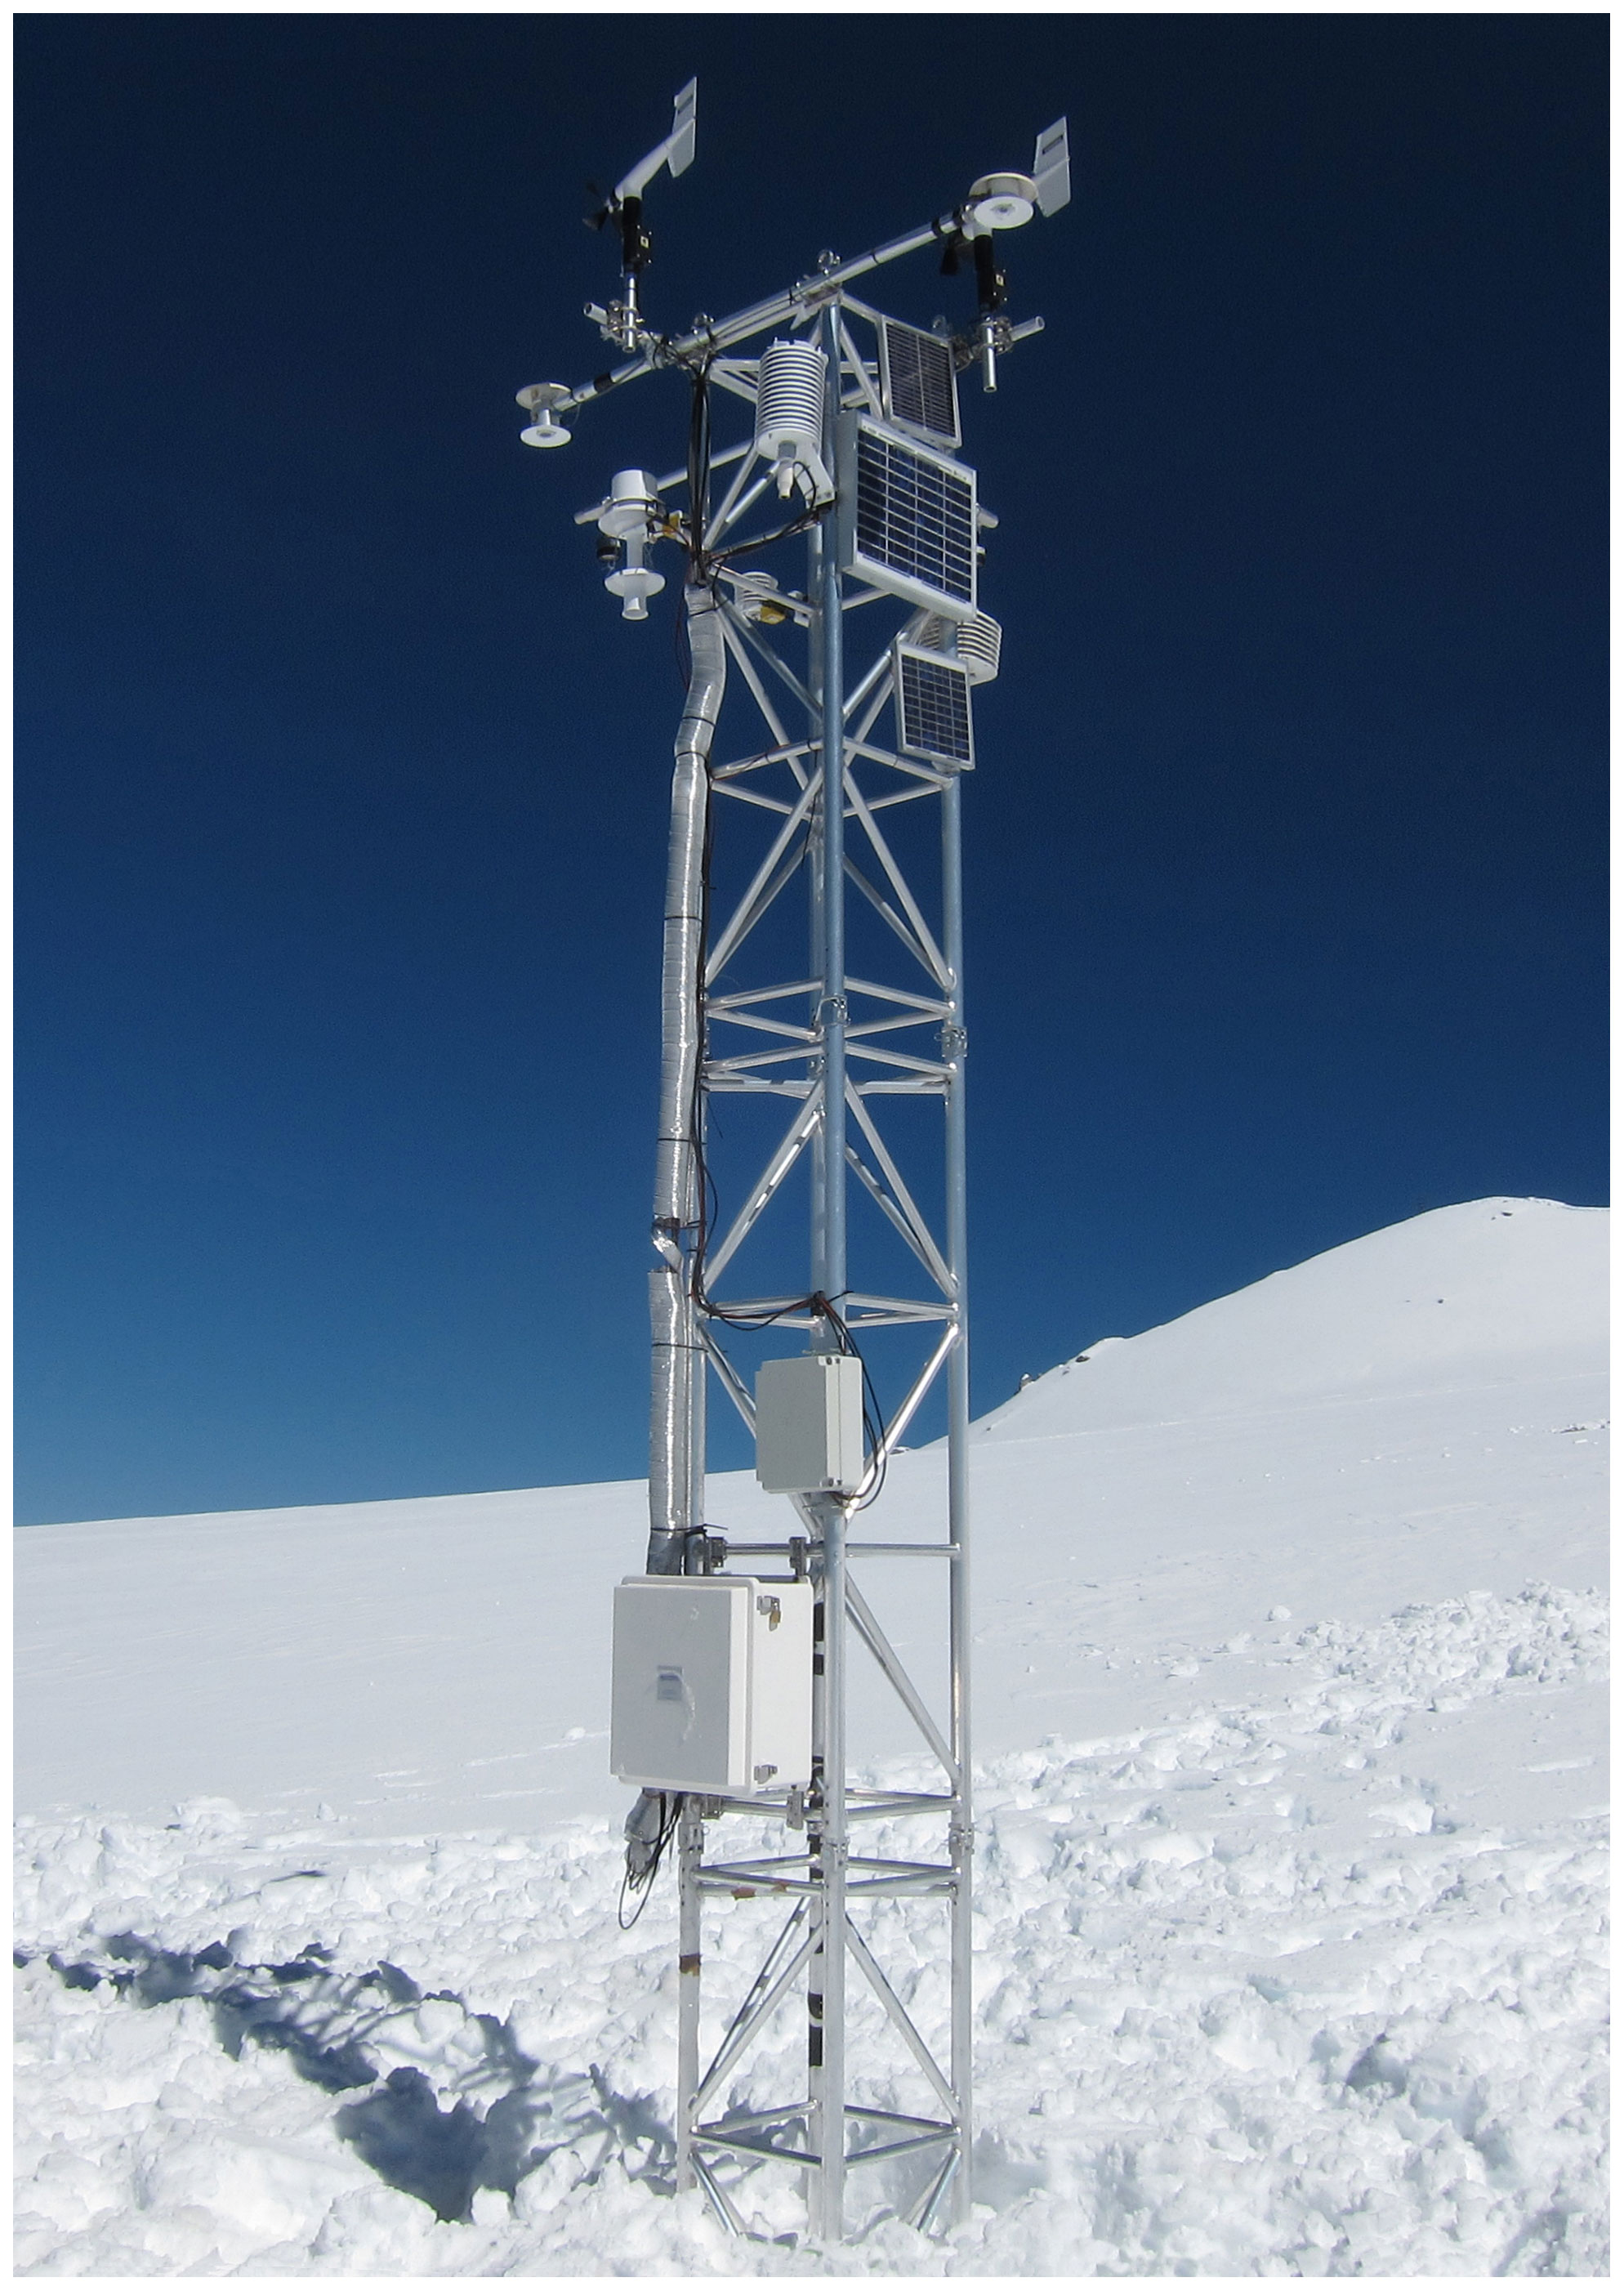
Figure 3The automatic weather station installed in the upper accumulation area of Alto dell'Ortles Glacier. The Mt Ortles summit (3905 m a.s.l.) is visible in the background.
The Vaisala HMP155A sensor was installed inside a R. M. Young 43502 fan-aspirated radiation shield. Two standalone Gemini TGP-4020 data loggers equipped with PB-5003-1 thermistor probes were also installed for comparison and backup purposes: one in the same fan-aspirated radiation shield of the Vaisala HMP155A sensor and one inside a six-plate R. M. Young 41303-5 radiation shield with natural ventilation. In September 2012, we installed an additional HMP155A temperature sensor inside a 15-plate Campbell Scientific MET 21 radiation shield with natural ventilation and an Onset HOBO H8 Pro Temp data logger housed in an eight-plate Davis 7714 radiation shield with natural ventilation (Figs. F3 and F4). Sensor specifications are reported in Table 1. The Vaisala HMP155A data were recorded as 15 min mean values, whereas the Gemini TGP-4020 data loggers recorded hourly minimum and maximum temperatures and the HOBO H8 Pro Temp data logger recorded hourly instantaneous temperature. All the temperature records have been converted to hourly averages, averaging 15 min means for the Vaisala HMP155A sensors, minimum and maximum hourly temperature for the Gemini TGP-4020 data loggers, and instantaneous temperature at the beginning and end of each hour for the HOBO H8 Pro Temp data logger, assuming a linear variation of temperature during each hour.
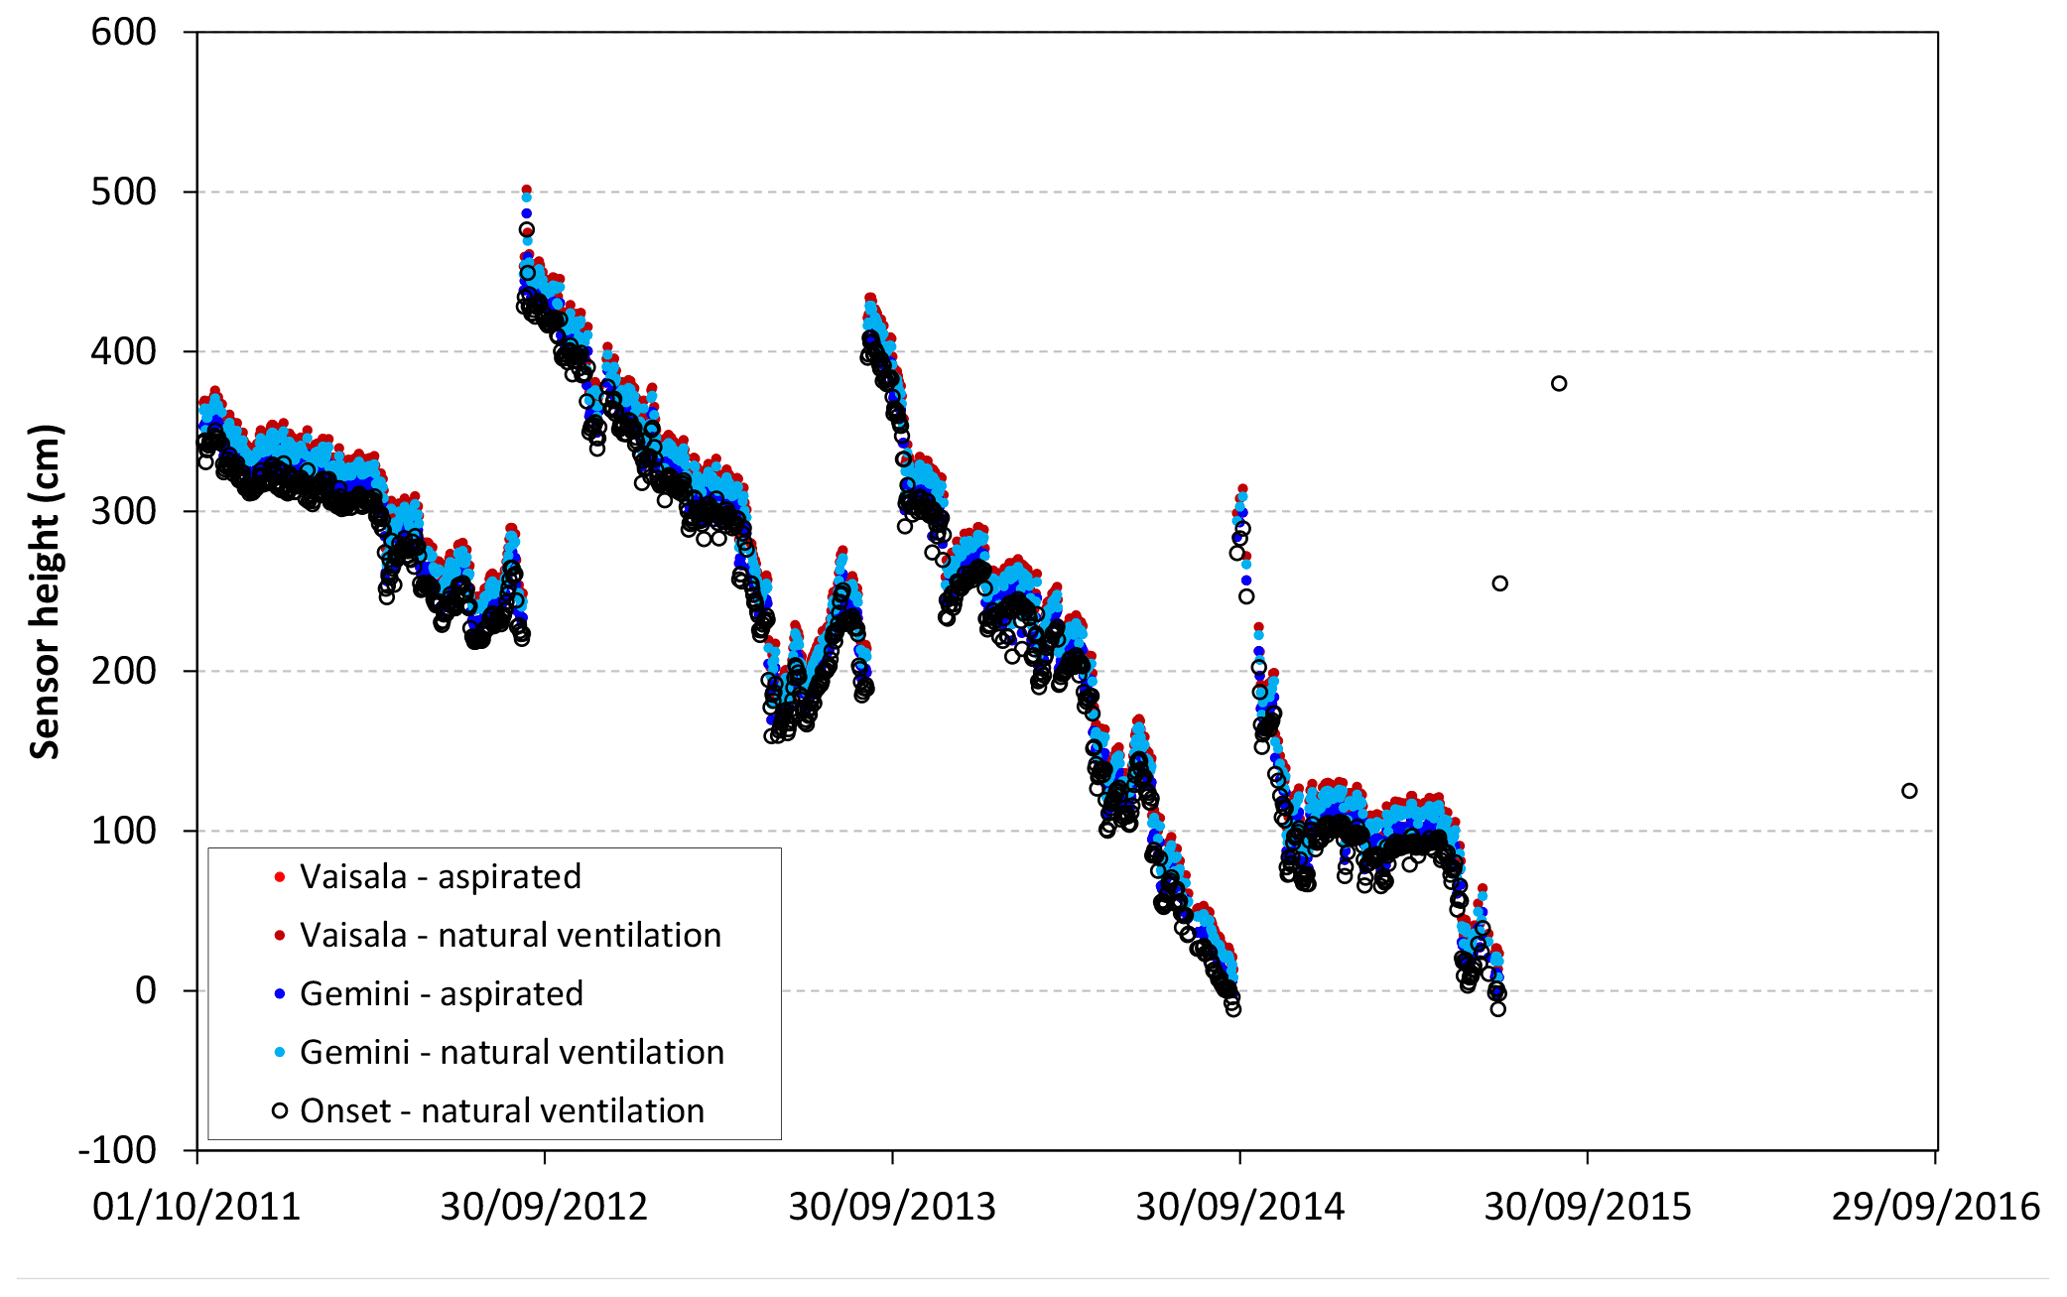
All the air temperature sensors were installed at the same level (±20 cm). The height of the air temperature sensors above the glacier surface changed with the snow accumulation over time (mean height = 241 cm, 5th percentile = 61 cm, 95th percentile = 407 cm). To prevent burial by snow accumulation, the tower was elongated annually by adding a 2 m module. Figure 4 shows the height of the sensors above the glacier surface, as reconstructed from the snow depth data and maintenance logs (Table D1).
Despite the remote and harsh environment, the AWS worked properly without major interruptions. In June 2015 it was removed, but the HOBO H8 Pro Temp logger was left on site and recorded an additional 15 months of data. The main issue linked to the specific environment of installation was ice and snow accretion combined with strong winds, which damaged the fan-aspirated radiation shield in February 2013. The obtained data are shown in Fig. 5.
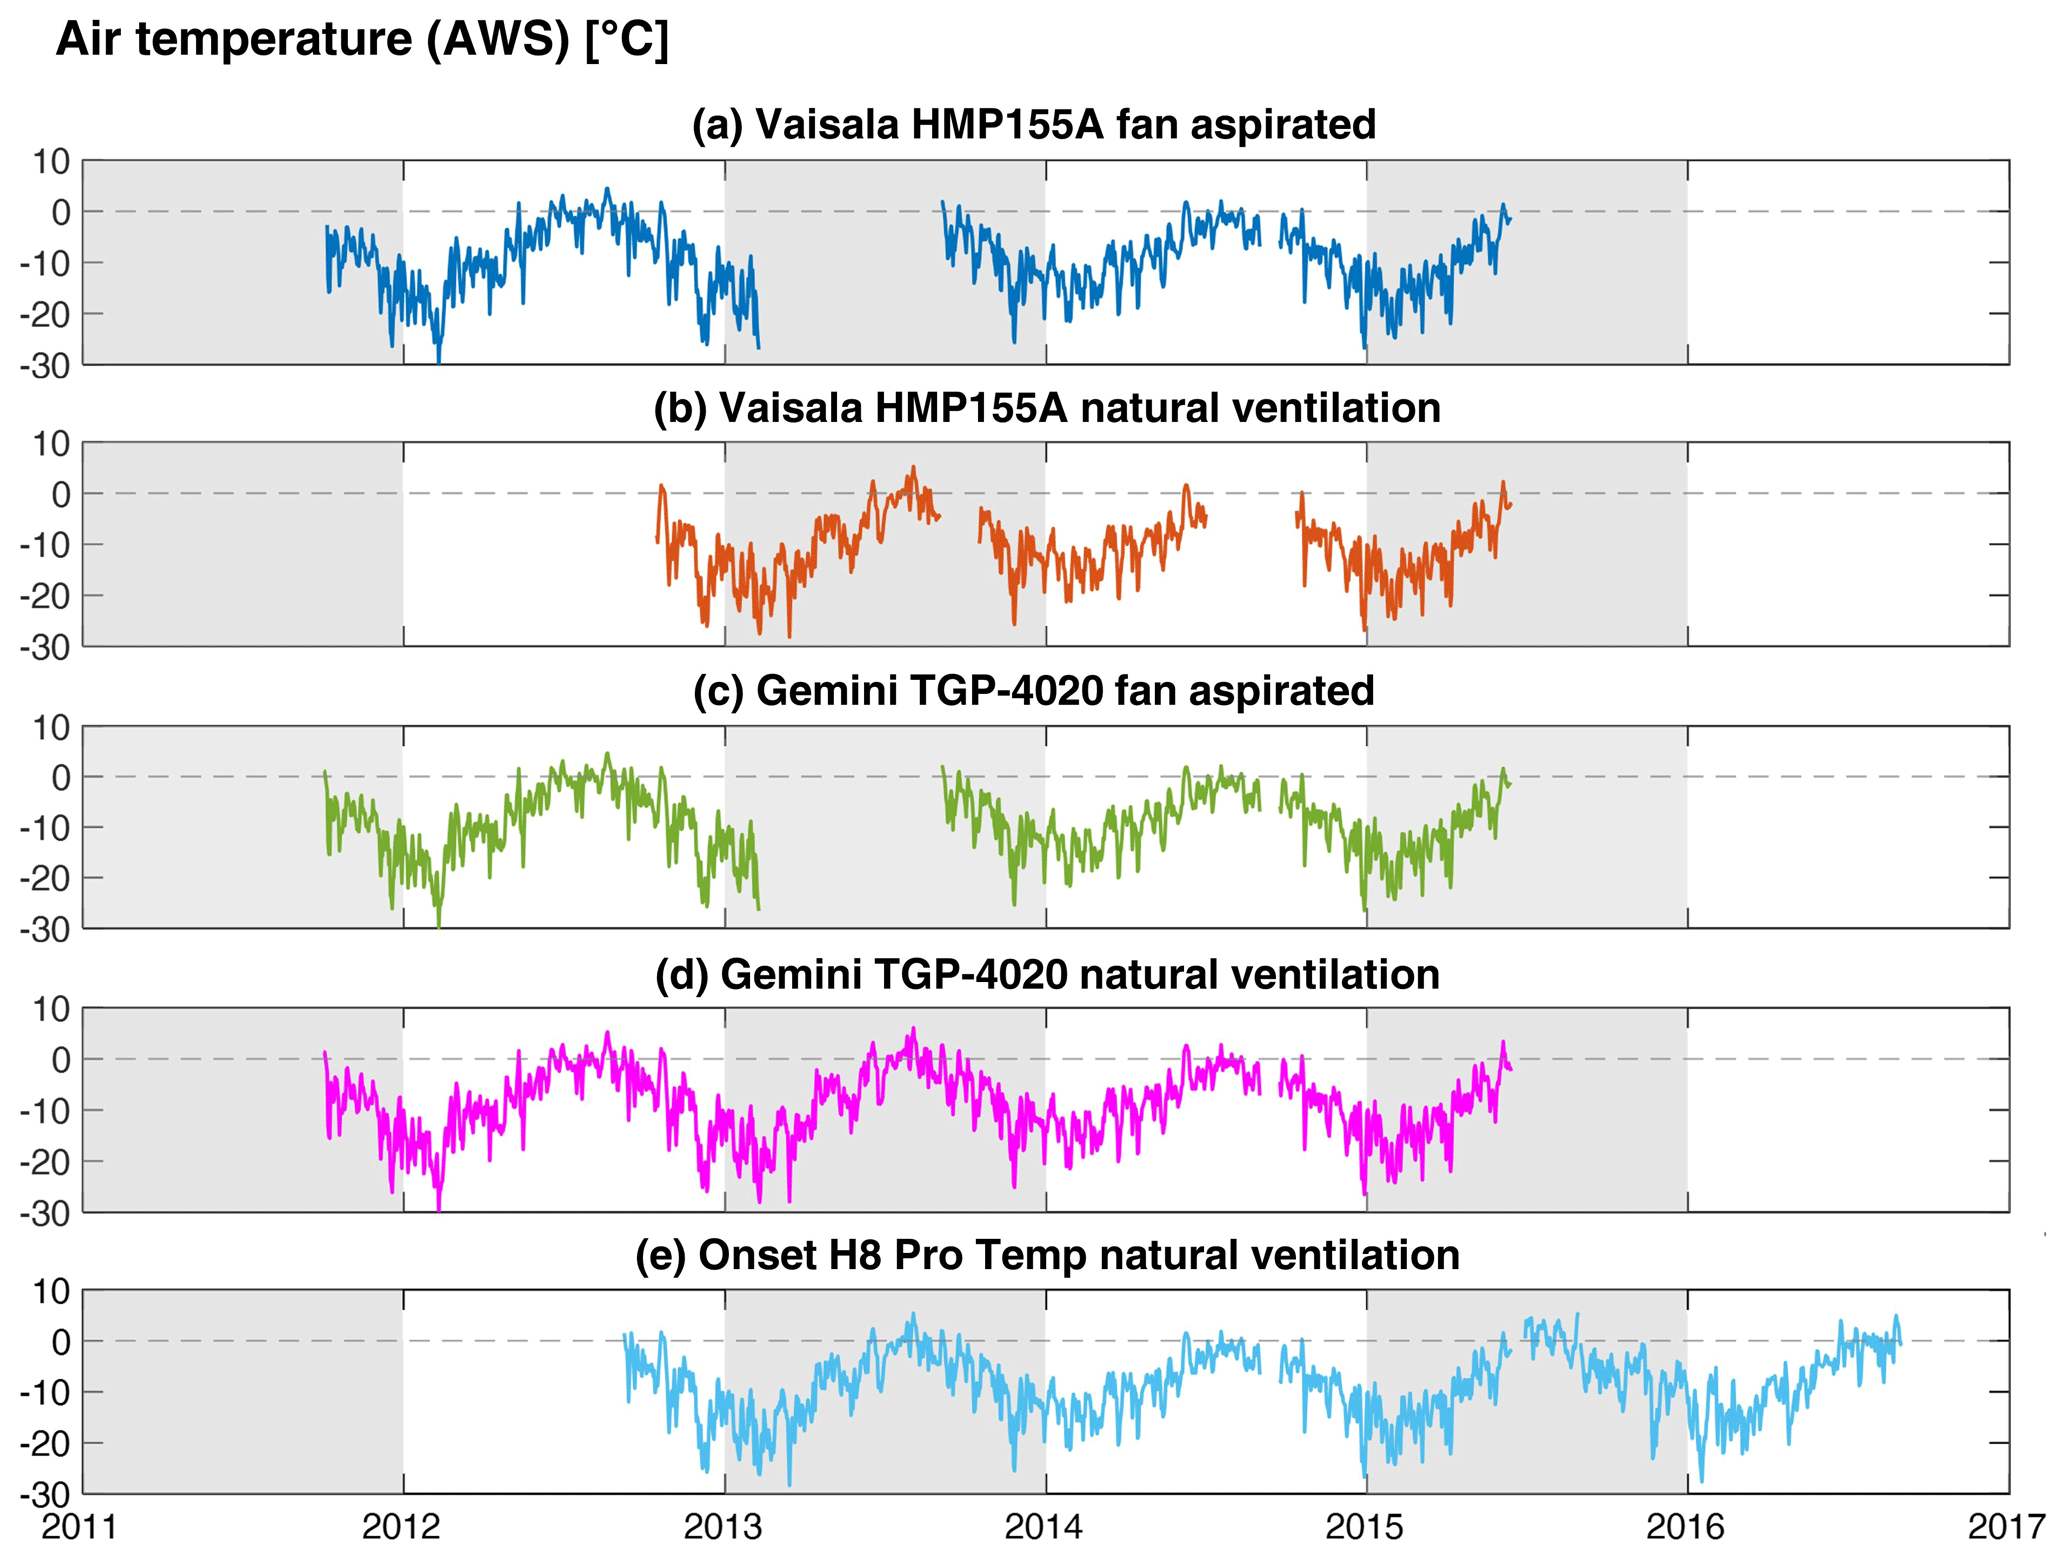
Figure 5Daily mean air temperature time series measured by different sensors installed at the automatic weather station on Mt Ortles.
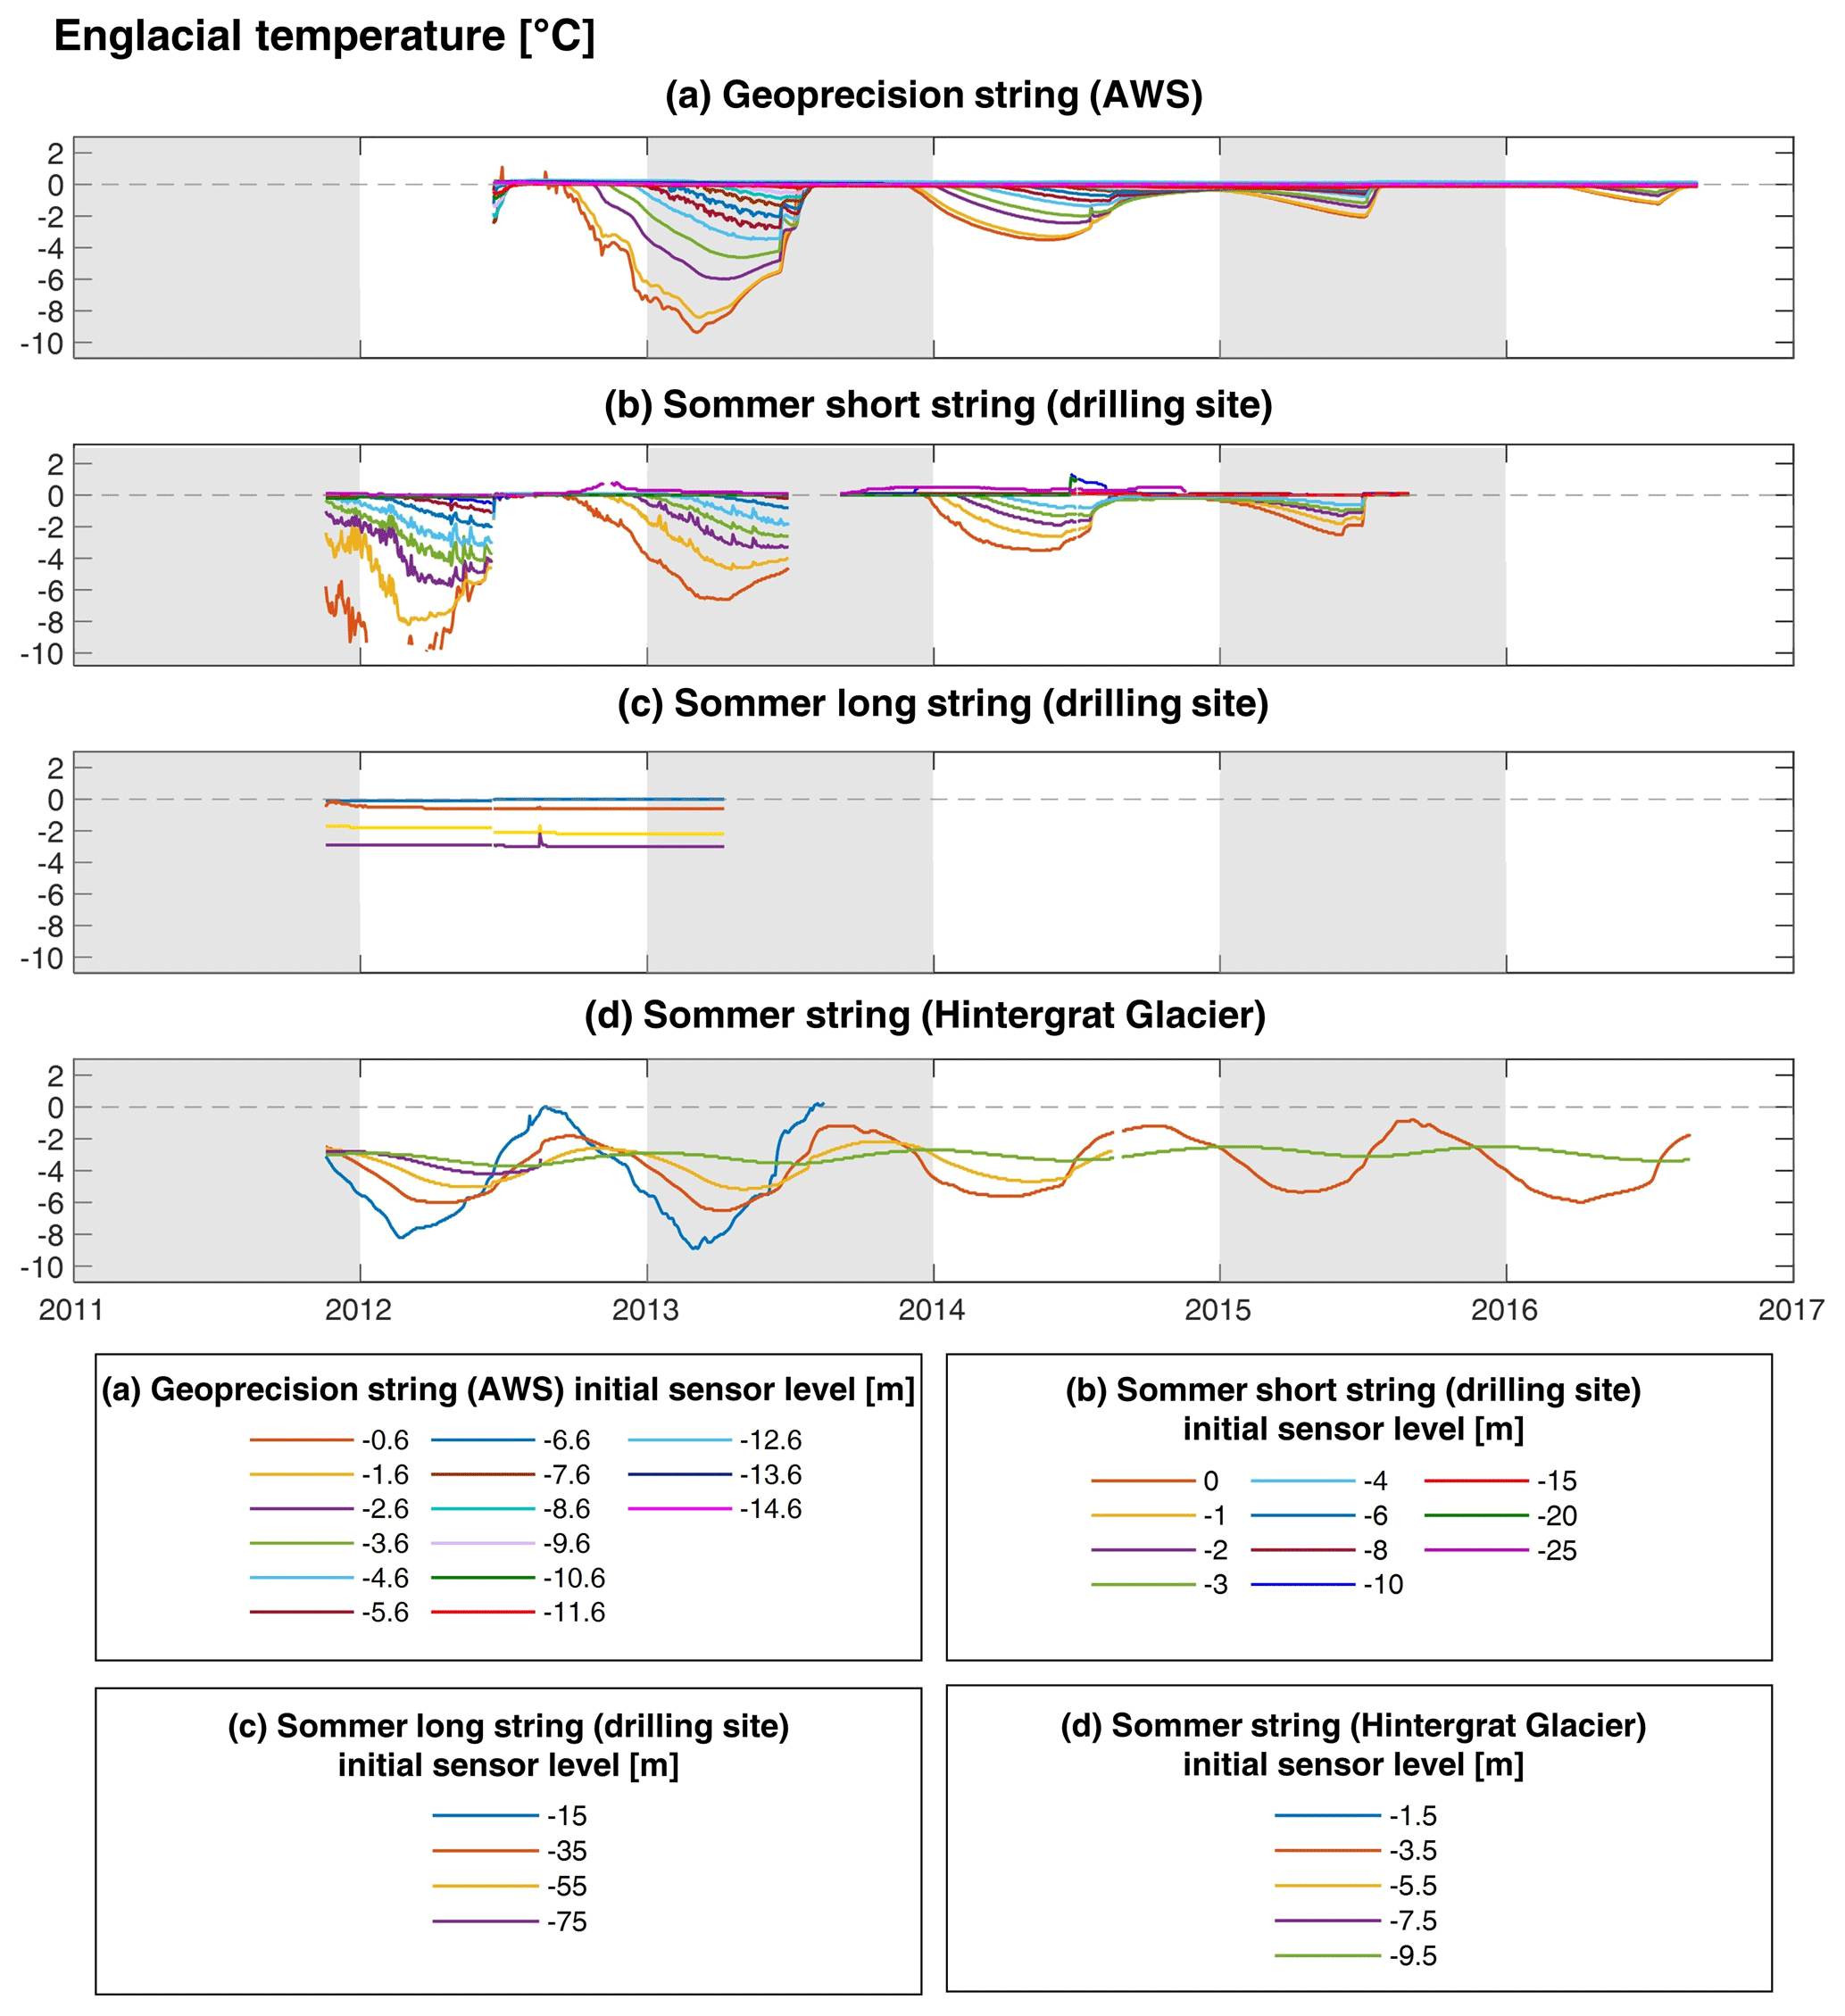
Figure 6Englacial temperature measured at various sites and various depths on the Alto dell'Ortles Glacier.
3.2 Englacial temperature data
Englacial temperature measurements were collected at three different sites on Mt Ortles: (i) at the AWS site (3830 m), (ii) at the borehole drilling site (3859 m) and (iii) at Hintergrat Glacier (3476 m). The obtained englacial temperature data are shown in Fig. 6.
3.2.1 Snow and firn temperature data at the AWS site
On the 18 June 2012 a 20 m thermistor string manufactured by Geoprecision GmbH (Germany) was installed 10 m east of the AWS (Fig. F1). The thermistor string was composed of a Dallas M-Log5W data logger, powered by a 3.6 V lithium battery, and connected to 15 digital Dallas temperature sensors spaced 1 m from each other. The string was lowered into a 14.6 m hole drilled using a steam ice drill. The initial depth of temperature sensors ranged between 0.6 and 14.6 m and increased afterwards up to about 6 m due to the accumulation of snow. The logger was housed inside a plastic box on the glacier surface, subsequently buried in the snow. Instantaneous temperature data were recorded with a 2 h frequency.
The data were retrieved by means of a laptop using a USB dongle connected wirelessly (radio transmission) to the logger, below the glacier surface. We were able to retrieve temperature data with the logger buried below a maximum of ∼6 m of snow and firn. The thermistor string worked properly without interruptions and without requiring maintenance or battery replacement. Sensor specifications are reported in Table 1.
3.2.2 Englacial temperature at the borehole drilling site
The site where the Ortles Project deep ice cores were extracted is a small col (3859 m; 46∘30′25′′ N, 10∘32′34′′ E) between the summit of Mt Ortles and the Anticima Sud/Vorgipfel (3845 m, Figs. 1 and G1). The ice is 75 m thick at this site as indicated by geophysical sensing prospecting and confirmed by ice core drilling operations (Gabrielli et al., 2016). Two thermistor strings were installed in borehole number 3 on the 5 October 2011, immediately after the completion of the drilling operations (Fig. G3a). The strings were composed of an MDL 8/3 data logger, manufactured by Sommer GmbH & Co KG (Austria). The logger was connected to 44031 thermistors, manufactured by ThermX Southwest (USA).
A first (short) thermistor string was 35 m long and was equipped with temperature sensors at 0, 1, 2, 3, 4, 6, 8, 10, 15, 20 and 25 m (initial depth). The other (long) string was 100 m, with temperature sensors at 15, 35, 55 and 75 m (initial depth). Burial depth of sensor increased over time due to net snow and firn accumulation.
Data loggers and exposed portions of strings were housed inside a metal box and arranged on a winding system (Fig. G3), making it possible to extend the thermistor strings and to raise the box at the glacier surface periodically. Field maintenance was also required to replace batteries and download the stored data. Instantaneous temperature data were recorded with a 1 h frequency.
The short string worked properly until removal in summer 2015, with the exception of a 2-month gap in summer 2013. The long string stopped working in April 2013, possibly due to ice dynamics and deformation of the borehole at a depth below 25–30 m. Sensor specifications are reported in Table 1.
3.2.3 Englacial temperature at Hintergrat Glacier
On the 14 October 2011 a thermistor string was installed at 3476 m a.s.l. on top of Hintergrat Glacier (Fig. G2). The string was manufactured by Sommer GmbH & Co KG (Austria), with the same components as those installed at the ice core drilling site (Sect. 3.2.2, Fig. G4). It was lowered into a hole drilled using a steam ice drill down to a depth of 9.6 m. We did not reach the glacier bottom at this site. The temperature sensors were placed at 1.5, 3.5, 5.5, 7.5 and 9.5 m below the glacier surface. This lower site is subject to net ablation; therefore, in this case the initial depth decreased through time, and the sensor at 1.5 m depth came to the surface in summer 2013. After 2013, this sensor's data were consequently discarded.
3.3 Soil surface temperature data
The thermal regime of the soil surface at six deglaciated sites on Mt Ortles was monitored using standalone temperature data loggers over the period between September 2010 and September 2016. We used Gemini TGP-4020 data loggers, powered by 3.6 V lithium batteries and equipped with PB-5001 probes, which were placed 5–15 cm below the soil surface (Figs. H1 and H2). Mean temperature data were recorded at hourly intervals. Periodic maintenance was required to download the data and replace exhausted batteries.
The monitored sites range in elevation between 2899 and 3466 m a.s.l. The data loggers were placed in pairs at three main locations (Figs. 1 and H3): refuge Payer (ORTL_07 and ORTL_08), bivouac Lombardi (ORTL_05 and ORTL_06) and Hintergrat ridge (ORTL_10 and ORTL_11).
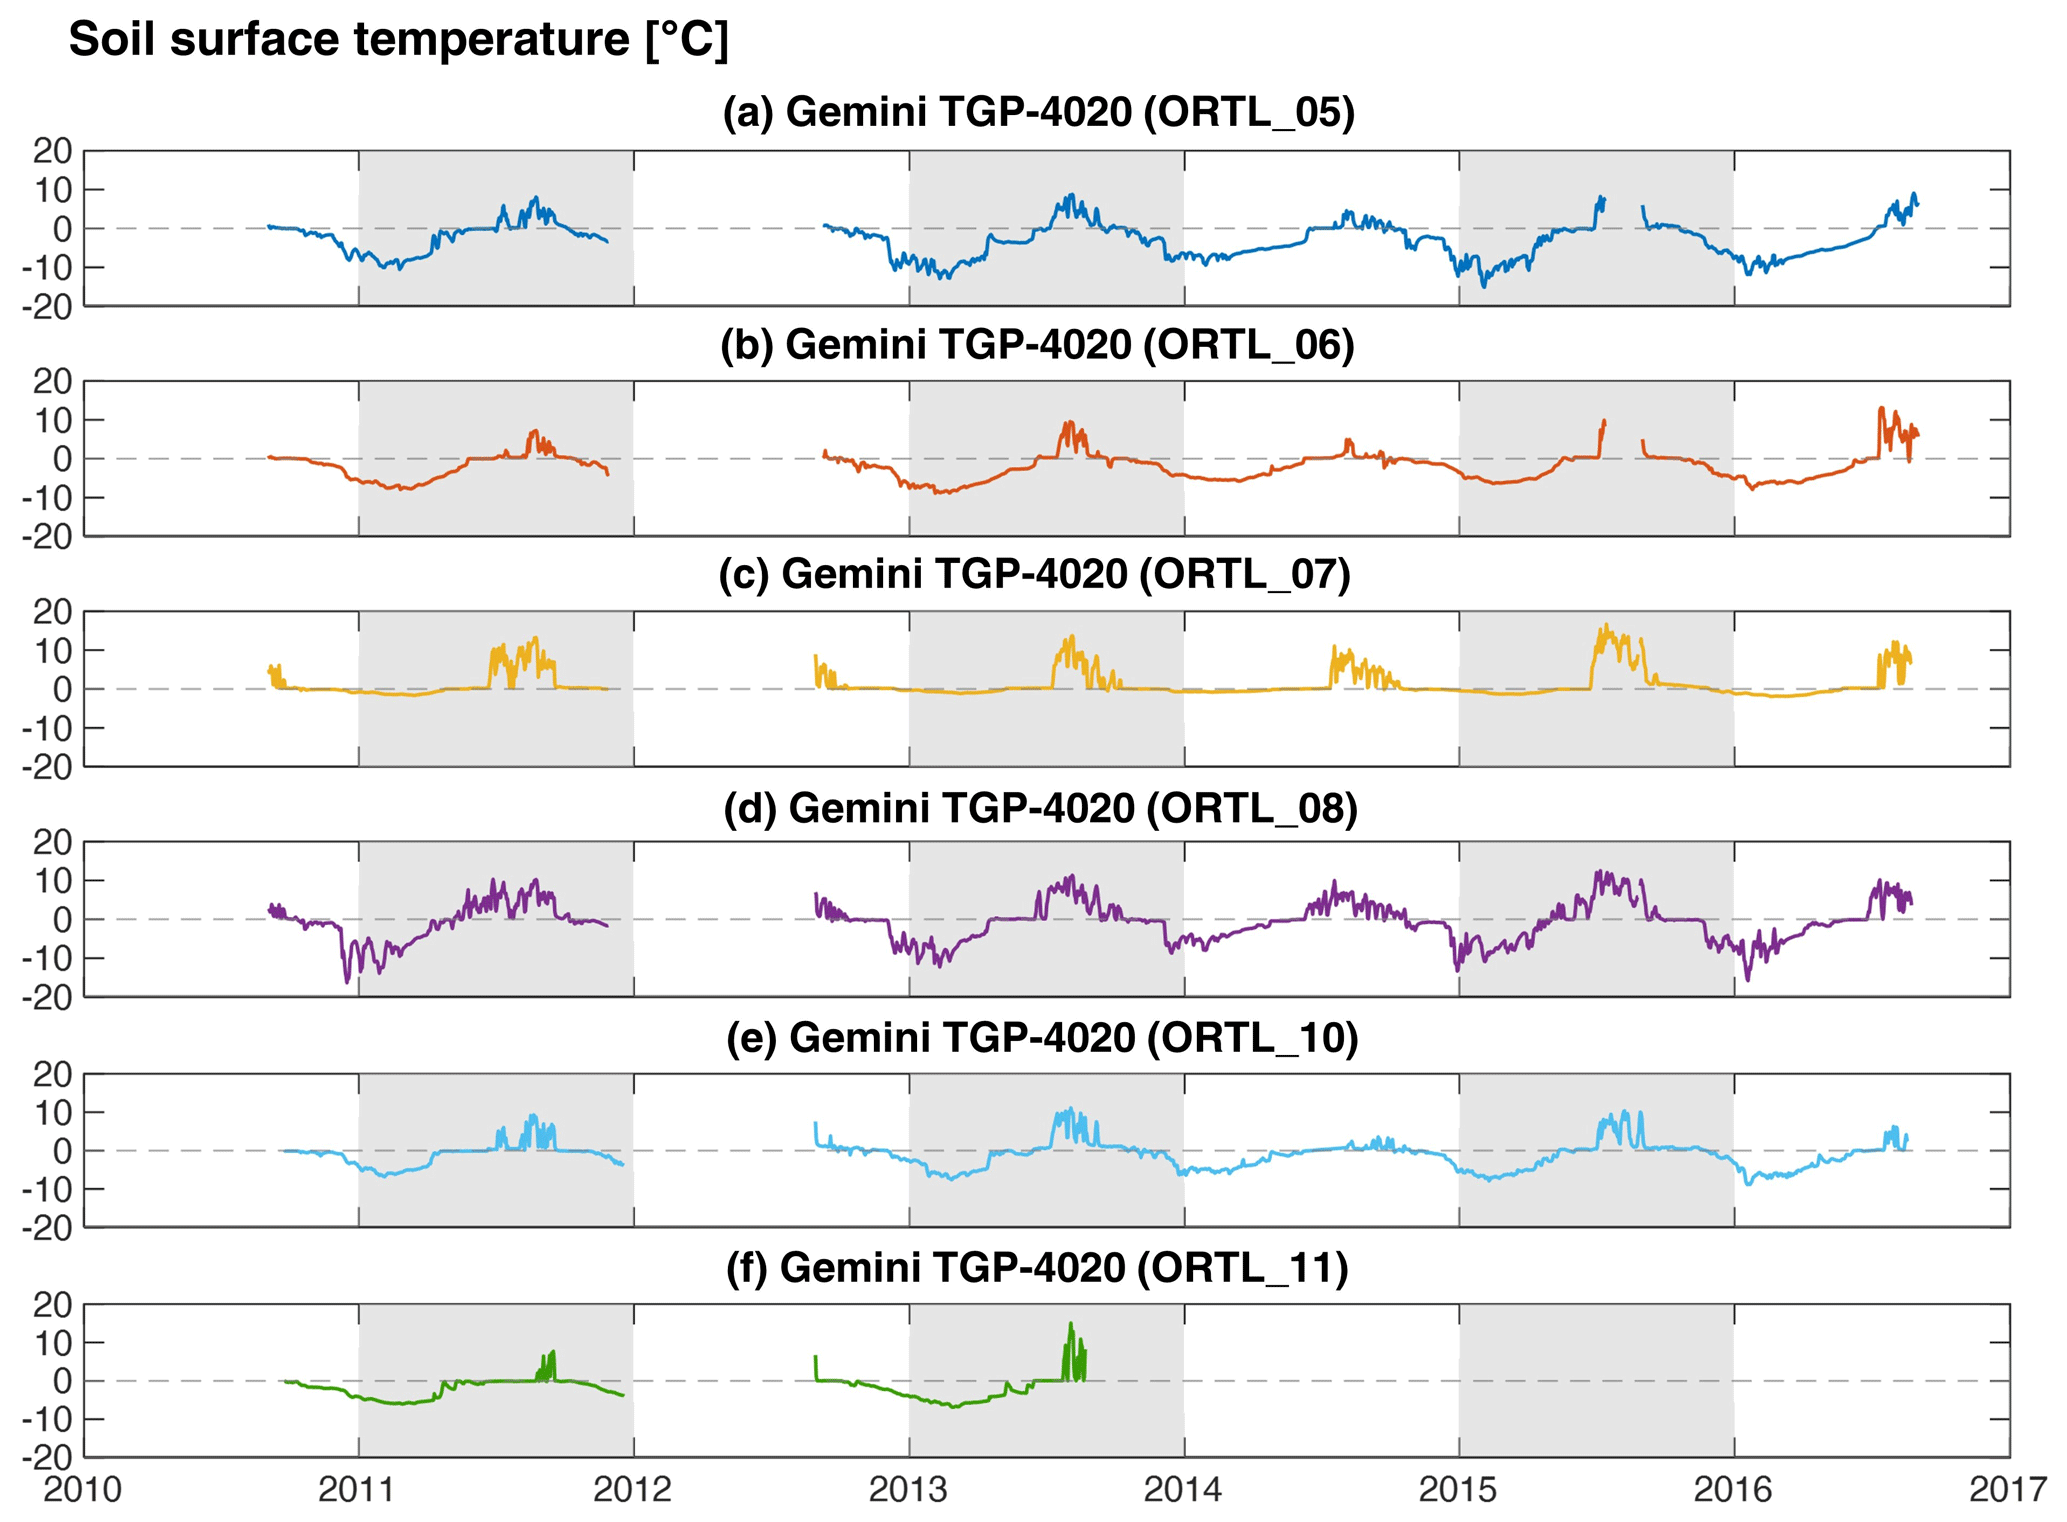
The data series extend from late summer 2010 to late summer 2016, with a gap between autumn 2011 and late summer 2012 and also for ORTL_05 and ORTL_06 between July and August 2015, due to the impossibility of accessing the data loggers for maintenance. ORTL_11 was buried under snow and firn after 2013 and has never been recovered. The obtained soil surface temperature data are displayed in Fig. 7.
3.4 Rock wall temperature data
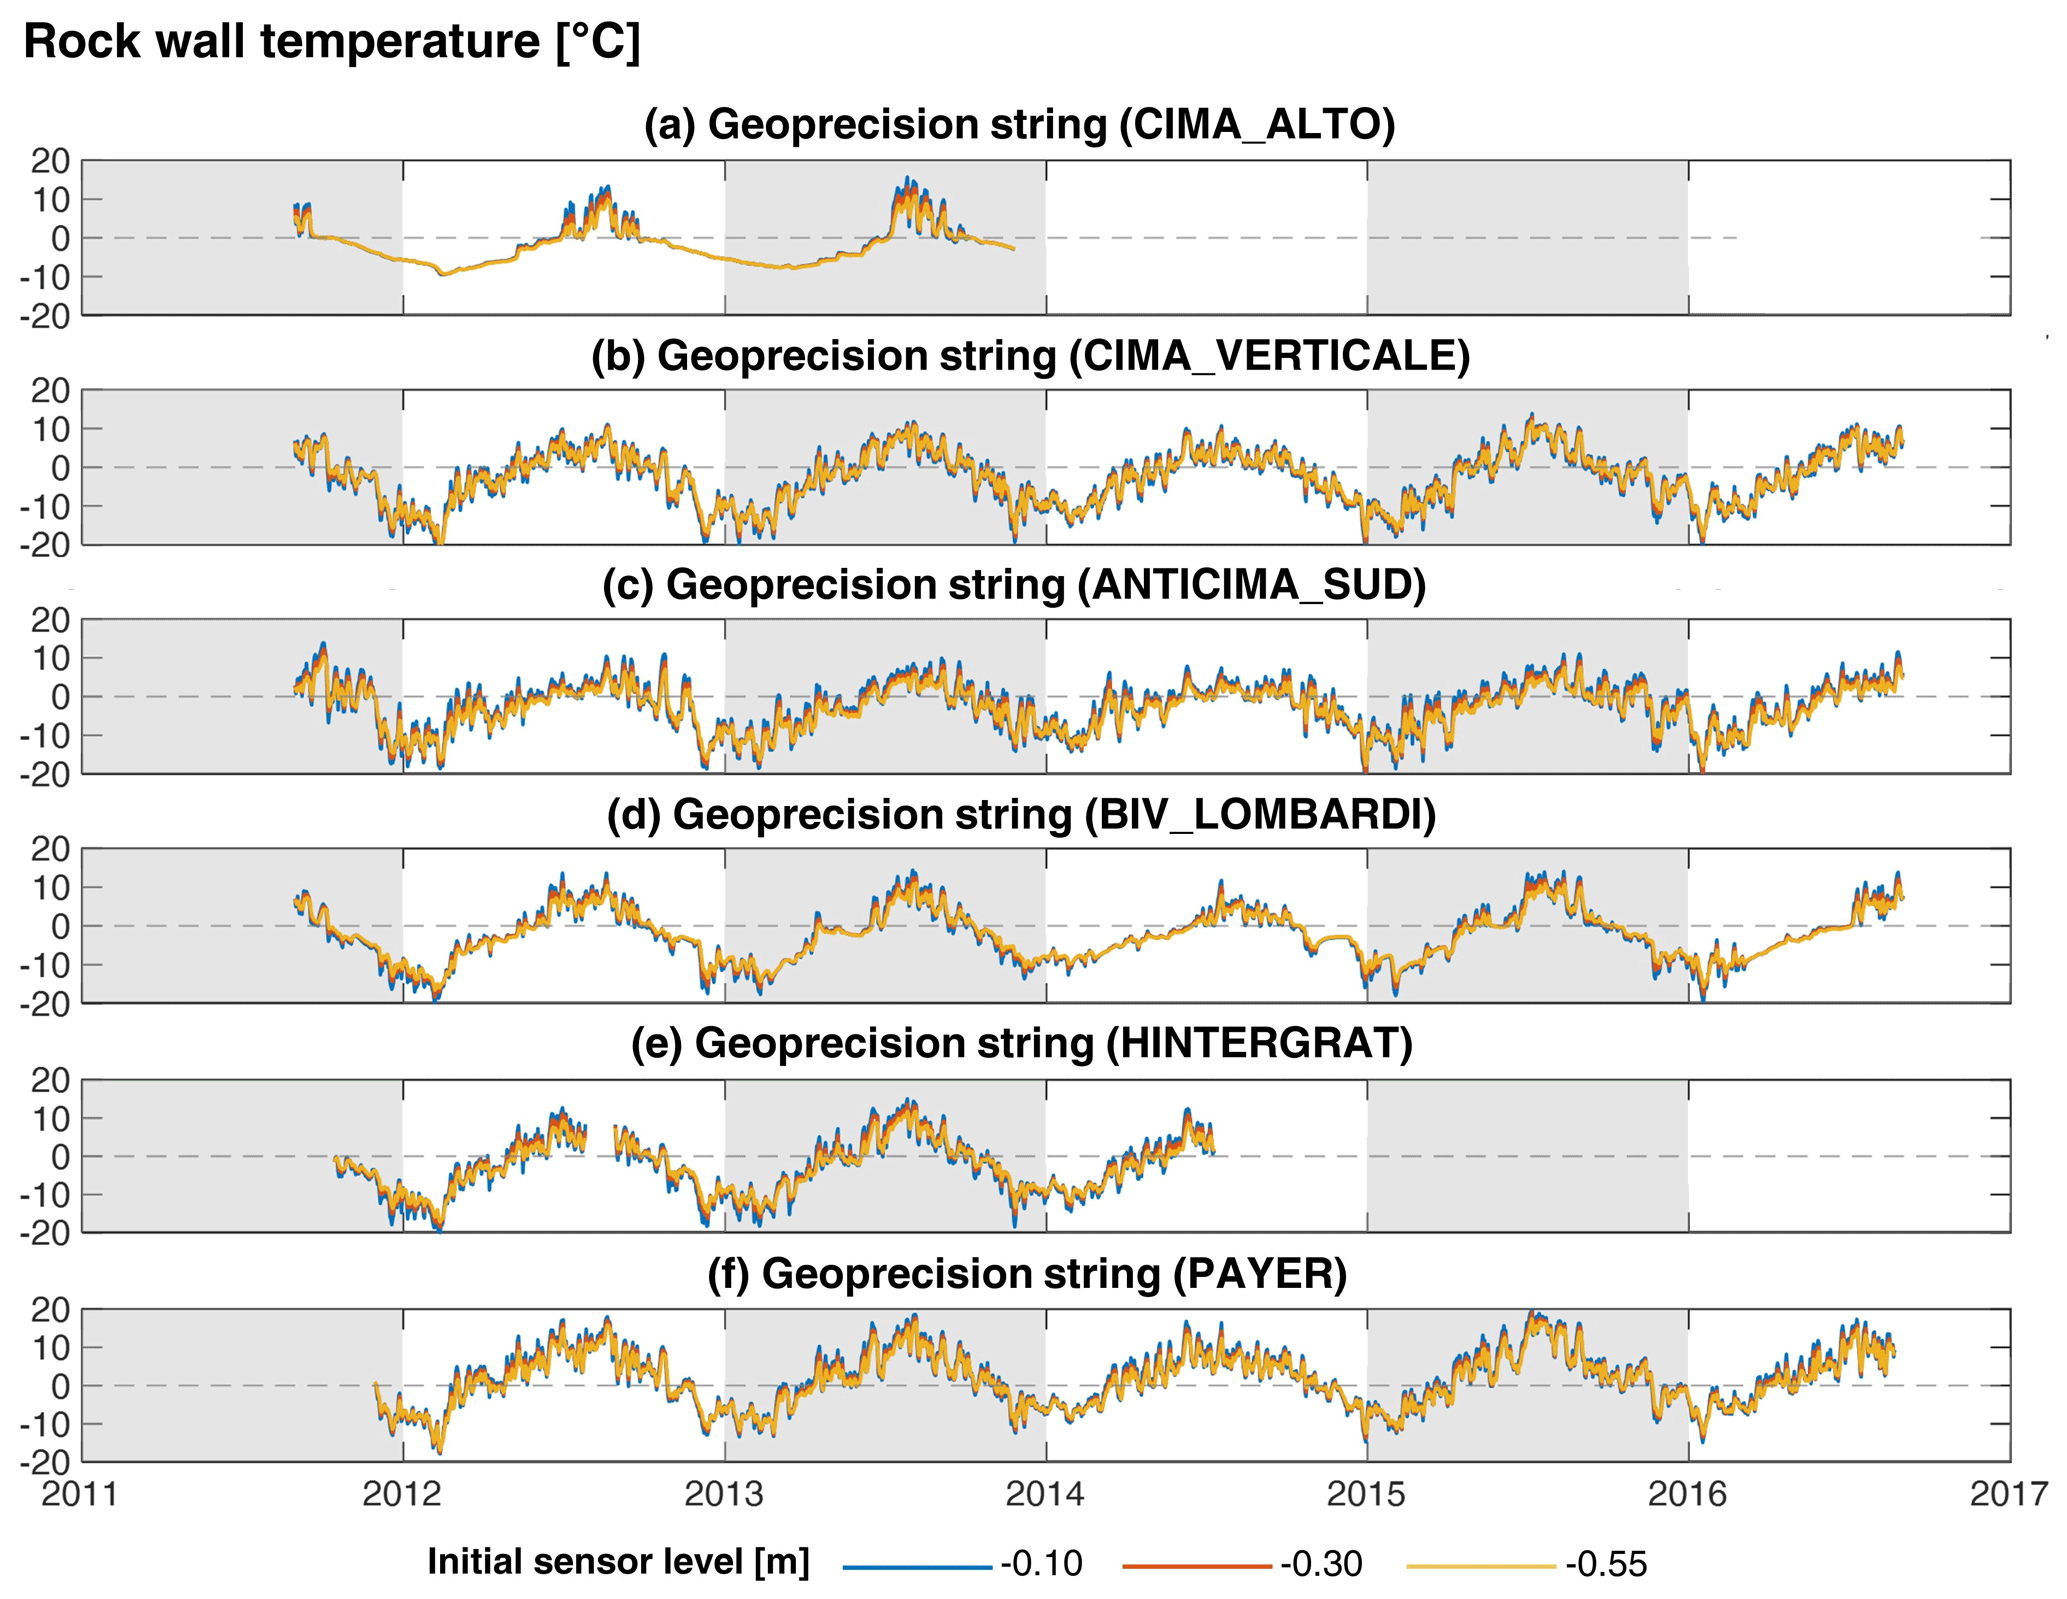
The subsurface temperature of rock walls located at six sites on Mt Ortles was monitored starting in late summer and autumn 2011 (Fig. 2). Very steep or almost vertical rock walls with different exposures and elevations were selected for monitoring (Figs. 1 and I3, Table E1). Two sites were established next to the Mt Ortles summit (3900 and 3880 m, facing east), one was at the Vorgipfel (3844 m, facing south), one was at the Hintergrat (3370 m, facing north-east), one was at the bivouac Lombardi (3351, facing west) and one was at the refuge Payer (3030 m, facing east).
Rock temperature data were acquired using Geoprecision Dallas M-Log5W data loggers, powered by a 3.6 V lithium battery, and connected to three digital Dallas temperature sensors installed at 0.1, 0.3 and 0.55 m depth, into holes drilled with a hammer drill (Fig. I1). Instantaneous temperature data were stored at hourly intervals and downloaded with a remote connection using a wireless USB dongle and a laptop (Fig. I2).
The data logger placed at the Hintergrat was damaged by hikers in late July 2012 but was repaired in late August 2012. It remained operational until August 2014 when it was removed due to more damage.
One of the loggers installed at the Mt Ortles summit (“CIMA_ALTO”) stopped working in November 2013 due to battery failure, while the other data loggers worked properly until the end of the monitoring period, in late summer 2016. Sensor specifications are reported in Table 1. The obtained rock wall temperature data are displayed in Fig. 8.
The temperature datasets presented in this study were carefully inspected to detect possible problems affecting raw measurements and to ensure the highest possible accuracy (Table 1). Data quality controls allowed for assigning a quality flag to each temperature record, as described in Table B1.
Air temperature sensors were exposed to harsh conditions, without protection from snow, rock or firn/ice as in the case of sensors used to measure the englacial, soil and rock wall temperature. For this reason, the air temperature sensors were subjected to possible damage by strong winds and lightning, ice and snow accretion, and burial by snow in case of abundant snowfall. In addition, they were subjected to the typical issues affecting air temperature measurements, arising from low wind speed and high solar radiation, worsened by high surface albedo, which generally lead to errors due to heating during daytime (WMO, 2021). Sensor drifting should also be taken into account as a potential problem.
In order to spot problematic periods, we carried out a sensor-by-sensor intercomparison, calculating hourly and daily temperature differences among pairs of sensors, including data from two neighbouring weather stations (Madriccio, 2825 m a.s.l., and Cima Beltovo, 3328 m a.s.l., Weather Service – Autonomous Province of Bolzano) for additional confirmation. We compared temperature difference series with maintenance logs to understand the sources of malfunctions and anomalies and to assign data quality flags to air temperature time series. Data recorded during malfunctions were handled as data gaps and removed from the published series. Anomalies in periods of heavy snowfalls, which caused snow/ice accretion and a rapid decrease of sensor height, are flagged with a specific code (Table B1).
Englacial and rock wall temperature were checked in the same way by calculating hourly and daily differences among sensors located at the same site and checking irregularities (i.e. sudden jumps in temperature differences) in combination with field observations during maintenance operations. We have detected no malfunctions, but it is possible that after maintenance operations (detailed in Tables D1 to D4) a short period of a few hours or a few days was required to reach a new equilibrium at englacial temperature monitoring sites. We have highlighted these maintenance operations with potential impacts on measured temperature using a data quality code, reported in Table B1.
Soil surface temperature data displayed no obvious anomalies and were checked in the “zero-curtain” phase, i.e. the 0 ∘C plateau during the snowmelt phase. Only ORTL_07 required a correction of measured temperature in 2014 (offset applied = −0.35 ∘C) and 2015 (offset applied = −1.1 ∘C) to correct discrepancies larger than sensor accuracies reported in Table 1. We have highlighted these adjustments with a quality flag in the corresponding data files (Table B1).
The datasets from this study are publicly available at https://doi.org/10.5281/zenodo.8330289 (Carturan et al., 2023). The data files are stored in .csv format. Detailed information on the file content and structure are reported in the appendix of this paper (Tables A1, B1 and C1).
Table 2Average difference in mean daily air temperature among pairs of installed sensors (f.a. = fan-aspirated; n.v. = natural ventilation). Column headings represent the first term of the difference calculation.
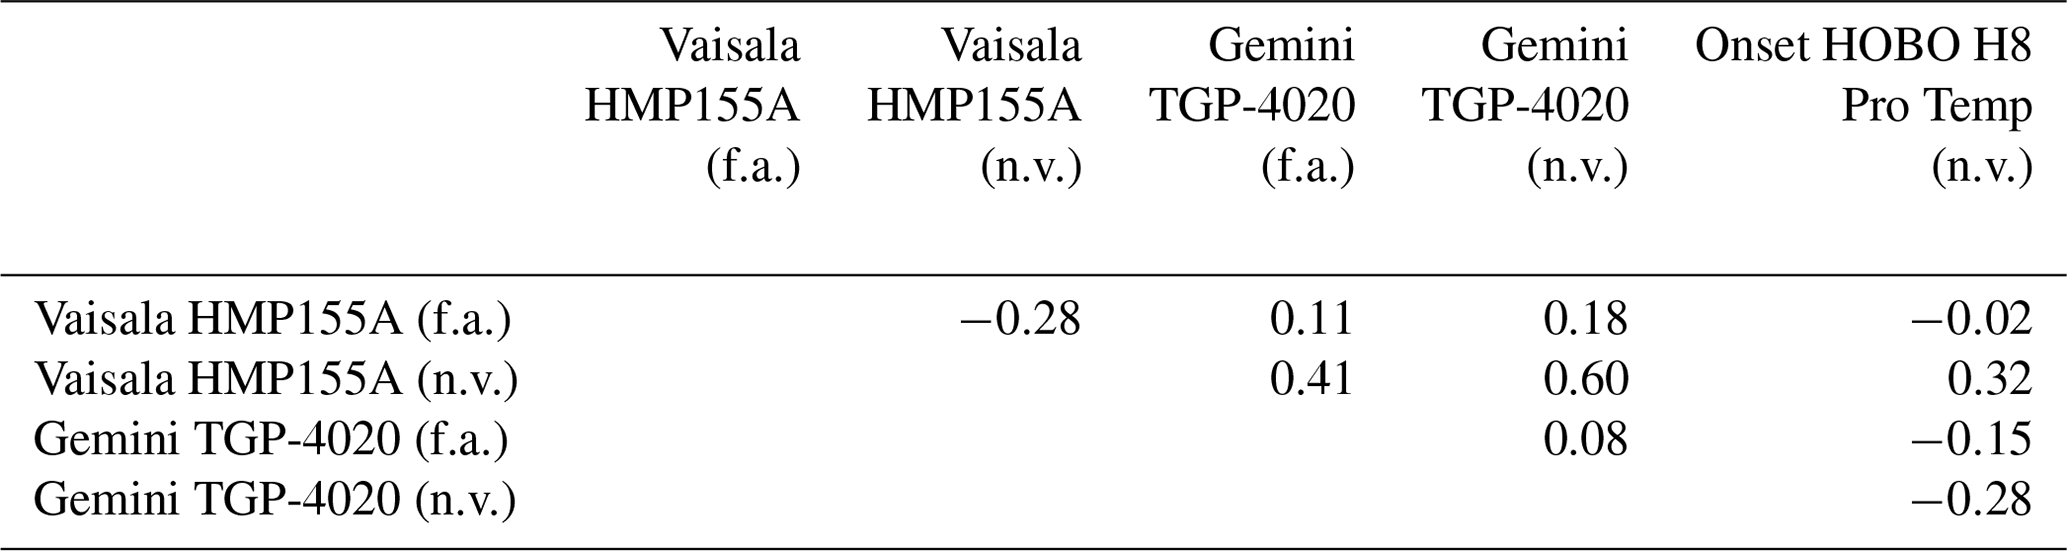
Table 3Mean annual air temperature recorded at the automatic weather station on Mt Ortles, with five different sensors (f.a. = fan-aspirated; n.v. = natural ventilation). The mean temperature is reported only for years with less than 1 month of missing data and is calculated between 1 September and 31 August.
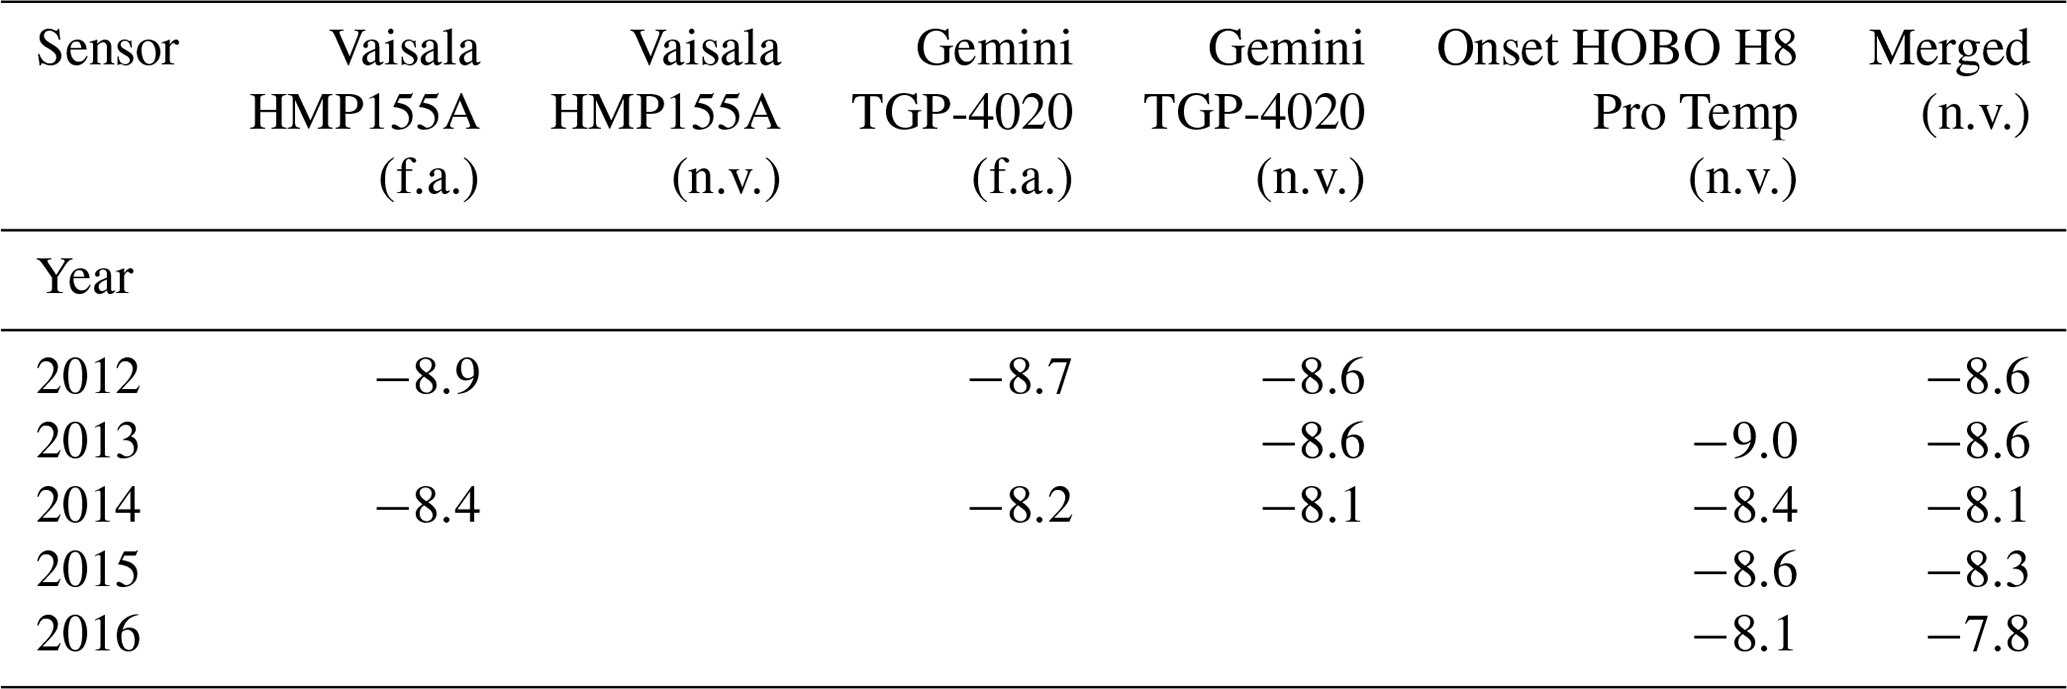
Table 4Mean annual ground surface temperature (MAGST) recorded at six different sites on Mt Ortles. Site locations are reported in Fig. 1. MAGST is reported only for years with less than 1 month of missing data and is calculated between 1 September and 31 August.
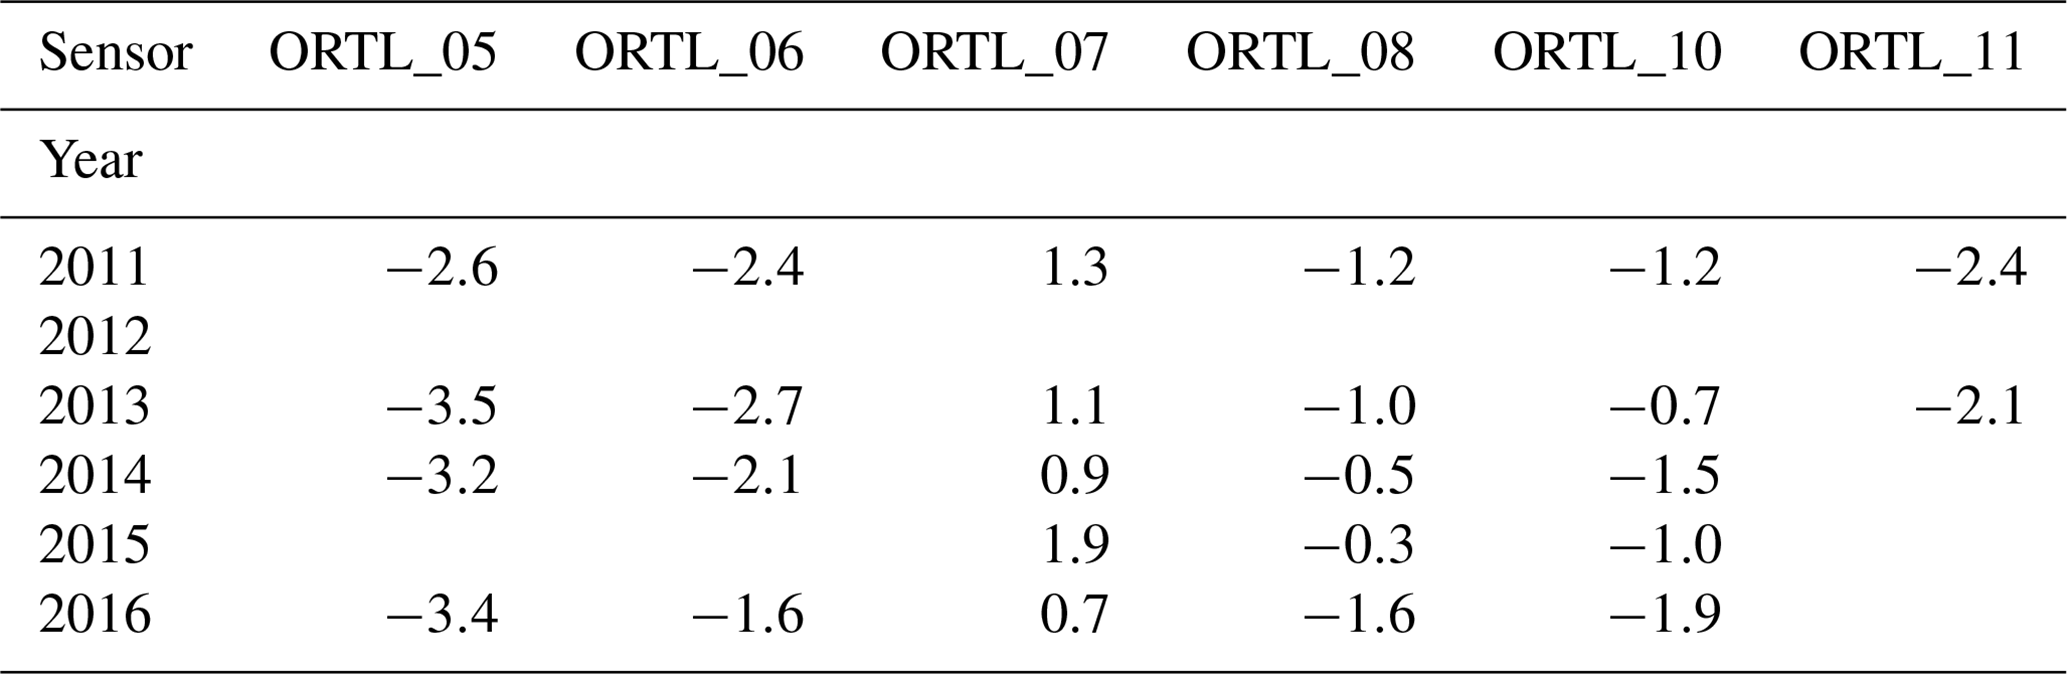
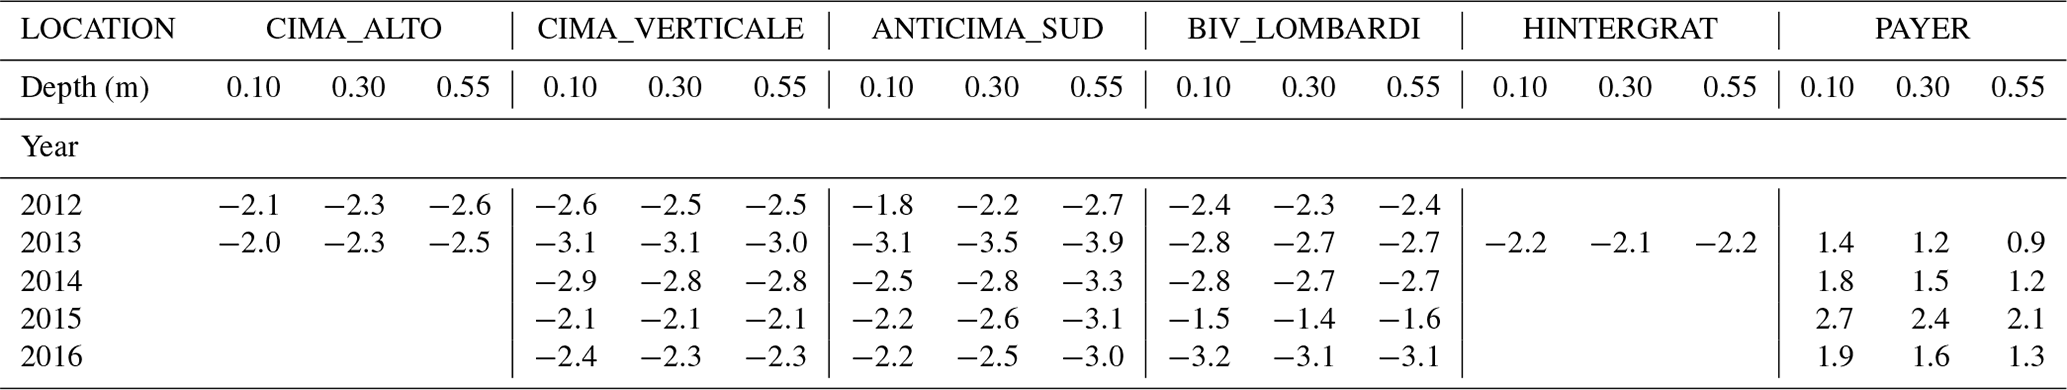
Table 5Mean annual rock surface temperature (MARST) recorded at six different sites on Mt Ortles. Site locations are reported in Fig. 1. MARST is reported only for years with less than 1 month of missing data and is calculated between 1 September and 31 August.
The datasets collected on Mt Ortles enable a description of its thermal state within a time window of 6 years (2011–2016). This period is long enough to provide a picture of modern average conditions and interannual variability, and it is useful as a baseline for possible future studies aimed at detecting changes and trends in monitored variables.
In the period from 2 October 2011 to 1 September 2016, the mean daily air temperature ranged between −30.1 ∘C (12 February 2012) and 6.1 ∘C (3 August 2013), averaging −8.3 ∘C. These statistics have been extracted from a merged time series, which combines the sensors that have the longest time coverage (Fig. 2), i.e. the GEMINI TGP-4020 with natural ventilation before 15 June 2015 and the ONSET HOBO H8 (natural ventilation) from 15 June 2015. The air temperature reached hourly extremes of −33.3 ∘C (9 February 2012 at 24:00 UTC) and 10.1 ∘C (20 August 2012 at 10:00 UTC). These extremes must be viewed with caution due to the high sensitivity of short-term temperature fluctuations to possible errors, mainly due to low natural ventilation. The aspirated shield installed at the weather station proved to be subject to damage and malfunction. However, it was operational at the time when the two extreme values were recorded, providing an identical minimum temperature of −33.3 ∘C and a maximum of 8.0 ∘C at 13:00 of 20 August 2012. In the common period of operation (overlaps are shown in Fig. 5), the average difference in mean daily air temperature among pairs of installed sensors did not exceed 0.60 ∘C in absolute value (Table 2).
The mean daily air temperature was above 0 ∘C for 39 d in 2012, 48 d in 2013, 15 d in 2014, 44 d in 2015 and 31 d in 2016. These results highlight a significant interannual variability in the length of the melt season at this high-elevation site. The mean annual air temperature averaged −8.3 ∘C, ranging between −8.6 ∘C in 2012 and 2013 and −7.8 ∘C in 2016 (Table 3).
Englacial temperature measurements reveal warm firn and isothermal summer conditions down to a depth of 25 m on the upper part of the Alto dell'Ortles Glacier. The summer was cold (and snowy) enough only in 2014 to preserve below-zero temperature in firn and snow down to a depth of about 15 m at the AWS and 10 m at the drilling site. On the other hand, deep borehole data available until 10 April 2013 confirm that glacier ice below the firn–ice transition is cold throughout the year, as detected during ice coring operations at the drilling site in October 2011 (Gabrielli et al., 2012). The ice temperature decreased with depth reaching a minimum of −3 ∘C at the glacier bed, at 75 m below the surface, and did not change significantly throughout the year.
The Hintergrat Glacier is also composed of cold ice, which is subject to net surface ablation at the string installation site. Indeed, the sensor at 1.5 m initial depth was exposed at the surface in August 2013. A 1.2 m layer of firn formed in 2014 but underwent complete ablation by the end of the following summer.
Soil surface temperature measurements and in particular the mean annual ground surface temperature (MAGST, Table 4) suggest the existence of permafrost on most of the monitored sites (Guglielmin et al., 2003; Ballantyne, 2018), with the exception of the ORTL_07 site which is at 2994 m a.s.l., close to the Payer refuge (Fig. 1). The results of ORTL_10 and ORTL_11 can be compared to analogous observations (unpublished) carried out in the same period on Mt Vioz (3520 m a.s.l., 14 km south of Mt Ortles), using the same devices and field techniques at two sites with similar elevation and exposure. On Mt Vioz the MAGST was −2.1 ∘C for the site with southern exposure and −2.9 ∘C for the site with eastern exposure, indicating slightly colder soil surface thermal conditions.
Rock wall temperature provided results that are in line with soil surface temperature measurements. The warmest site was close to the Payer refuge, with mean annual rock surface temperature (MARST) above the freezing level (Table 5). All the other monitored rock walls displayed below-freezing MARST and similar behaviour, with the exception of CIMA_ALTO, close to the Mt Ortles summit, where rock temperature fluctuations appear to be dampened by snow accumulation between September and May (Fig. 8).
The collected data are being analysed for the interpretation of the ice core drilled in the framework of the Ortles Project. In particular, air and englacial temperature data are used for developing and validating a model that aims at reproducing the formation of the isotopic record in snow and firn.
Together with rock wall and soil surface temperature, these datasets represent unique observations at such an elevation in the eastern European Alps, and they may contribute to the study and understanding of specific aspects of the climatic sensitivity of the alpine cryosphere. For example, they can be used for the development of permafrost distribution and degradation models, air temperature simulations over glacierized areas (including the so-called glacier cooling effect), snow and glacier mass balance models, glacio-hydrological forecasting systems, or dynamic glacier models that take into account the thermal state of glaciers and its variability.
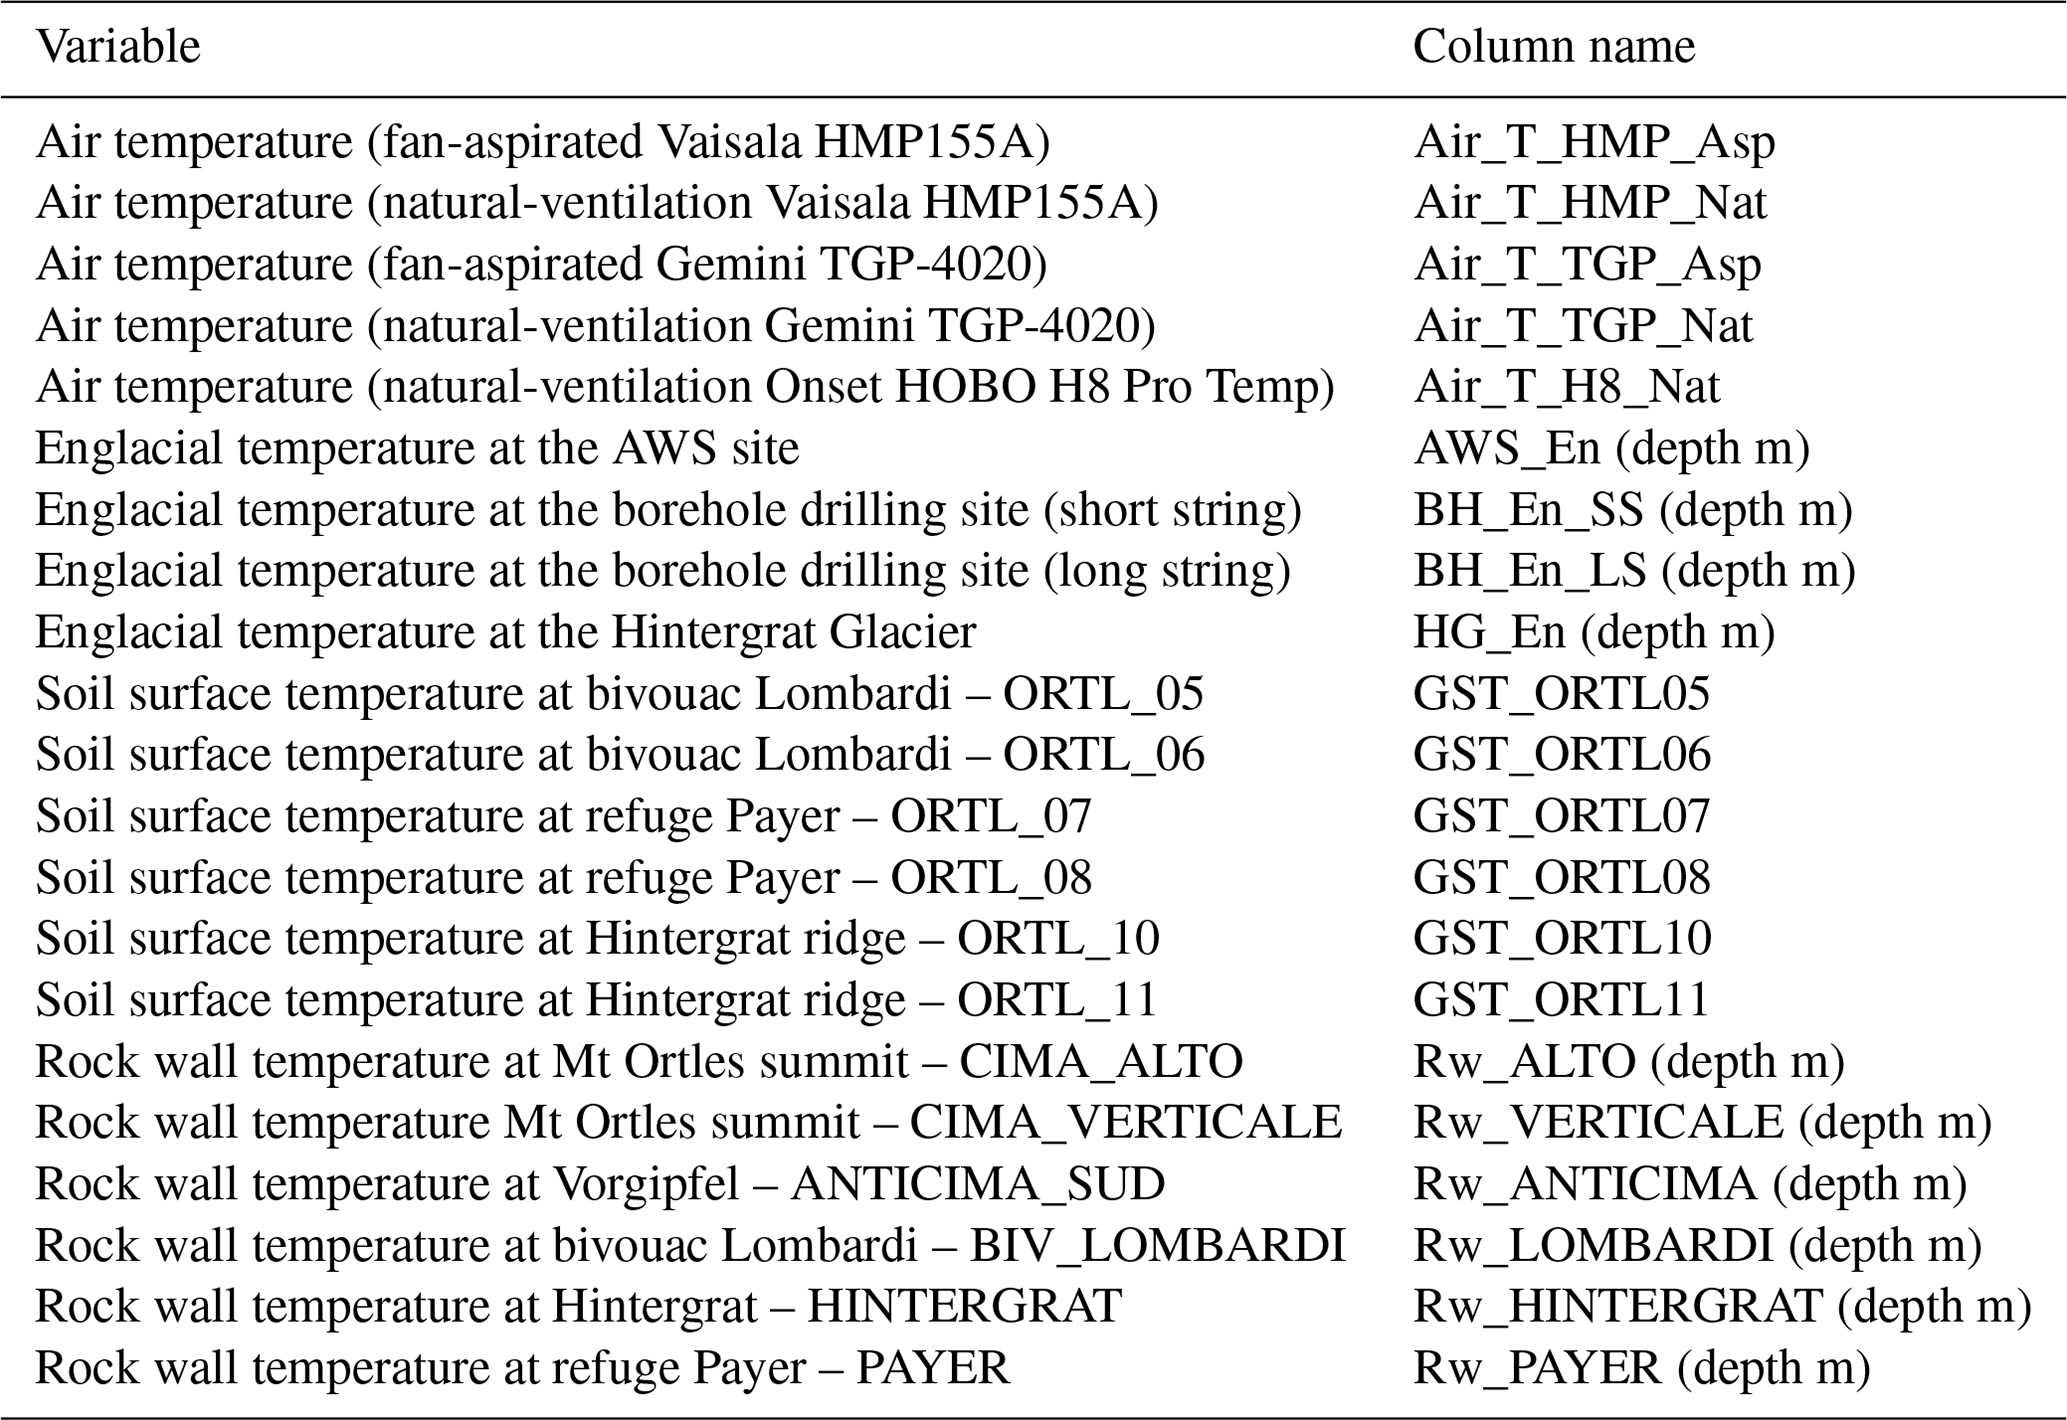
Table B1Quality code flags reported in data files, their meaning and explanations.
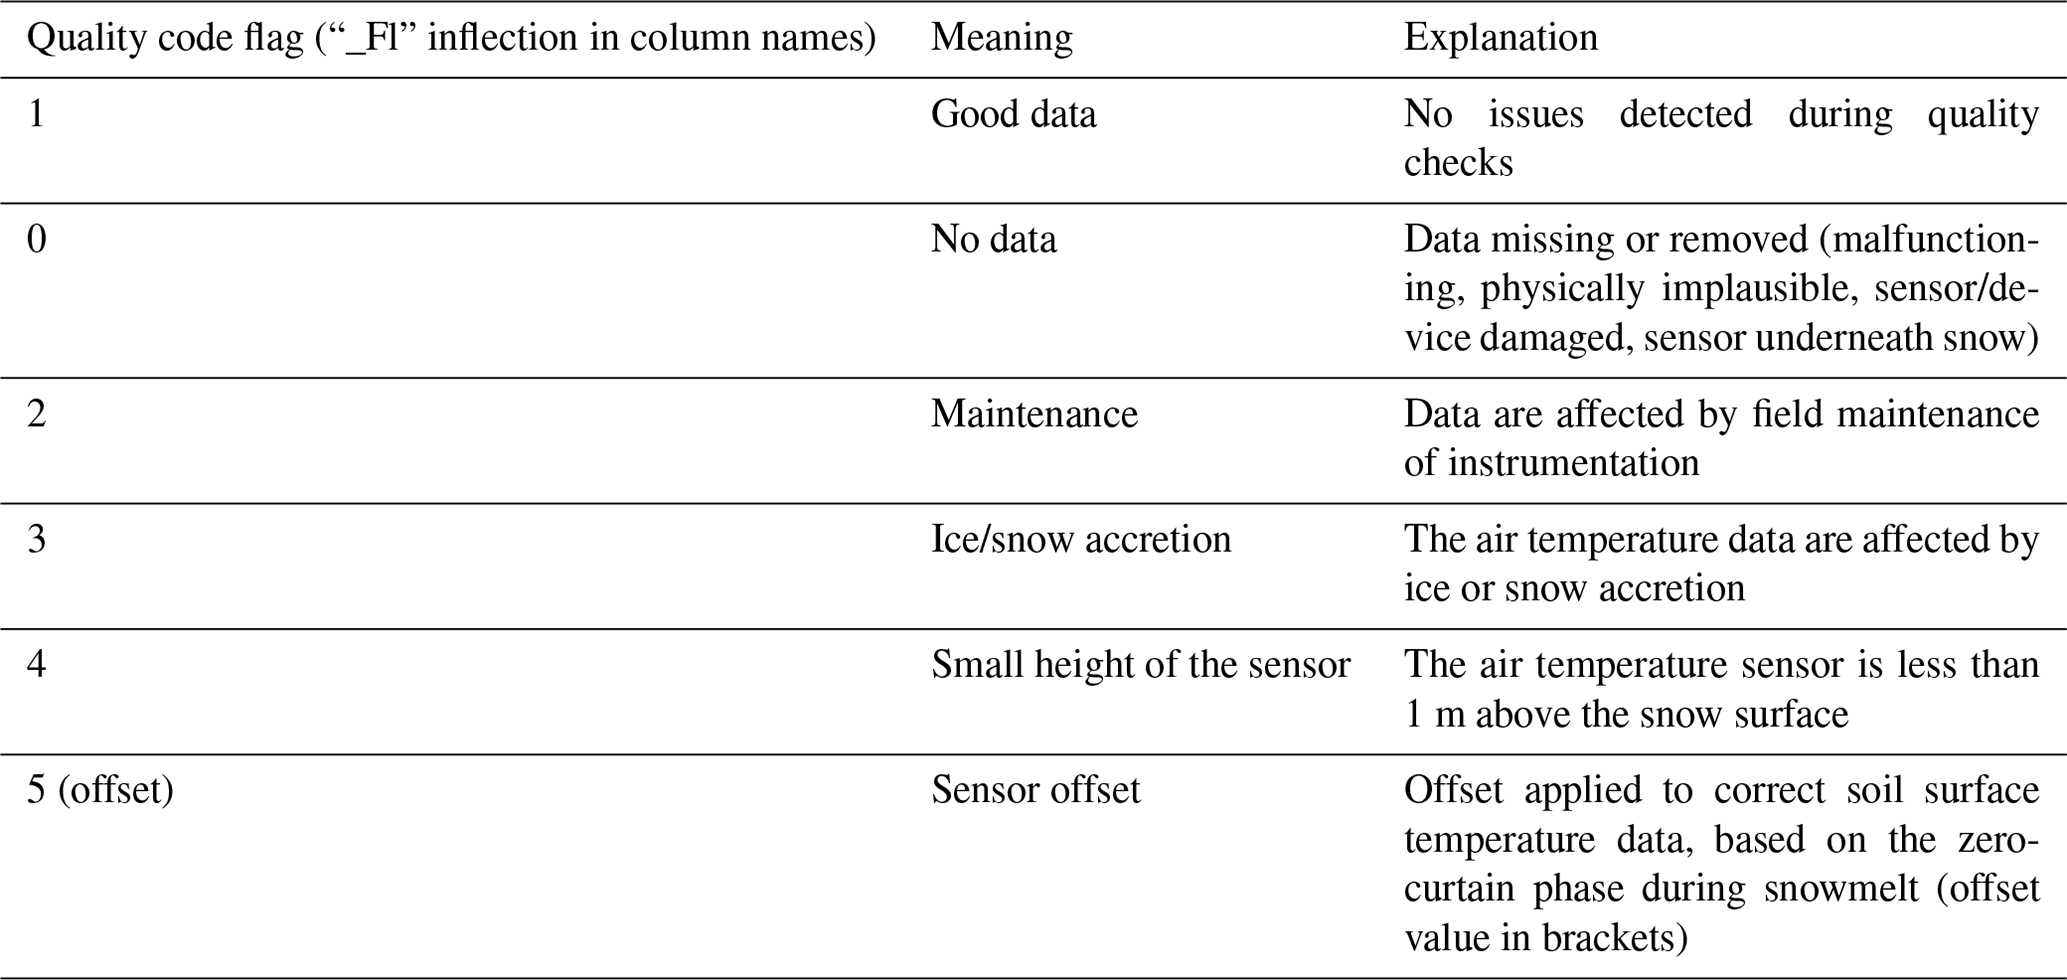
Table C1Structure of data files. For sensors at different depth below the surface, the depth in m is reported after the variable name, in brackets.
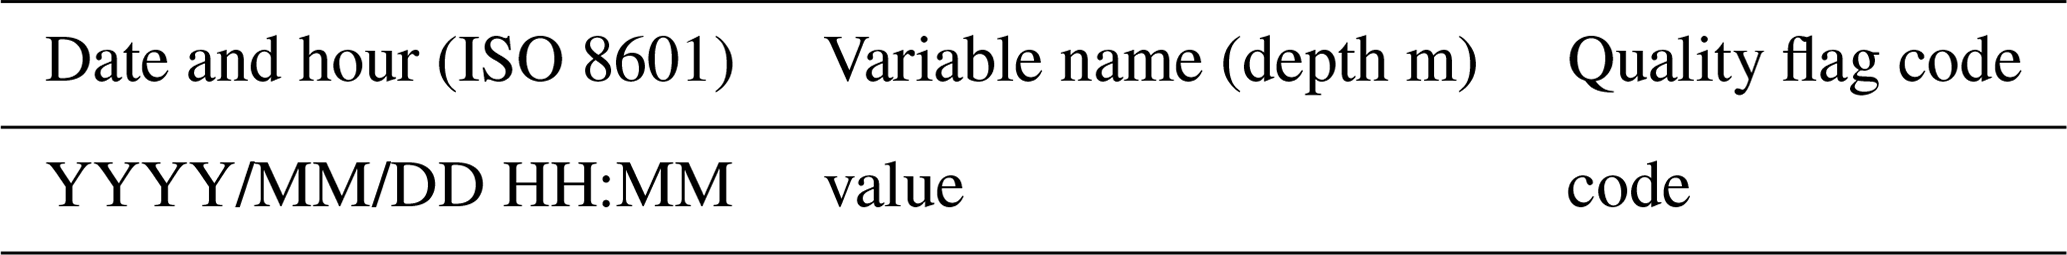
Table D1Field operations and maintenance for the air temperature sensors mounted at the AWS on Mt Ortles.
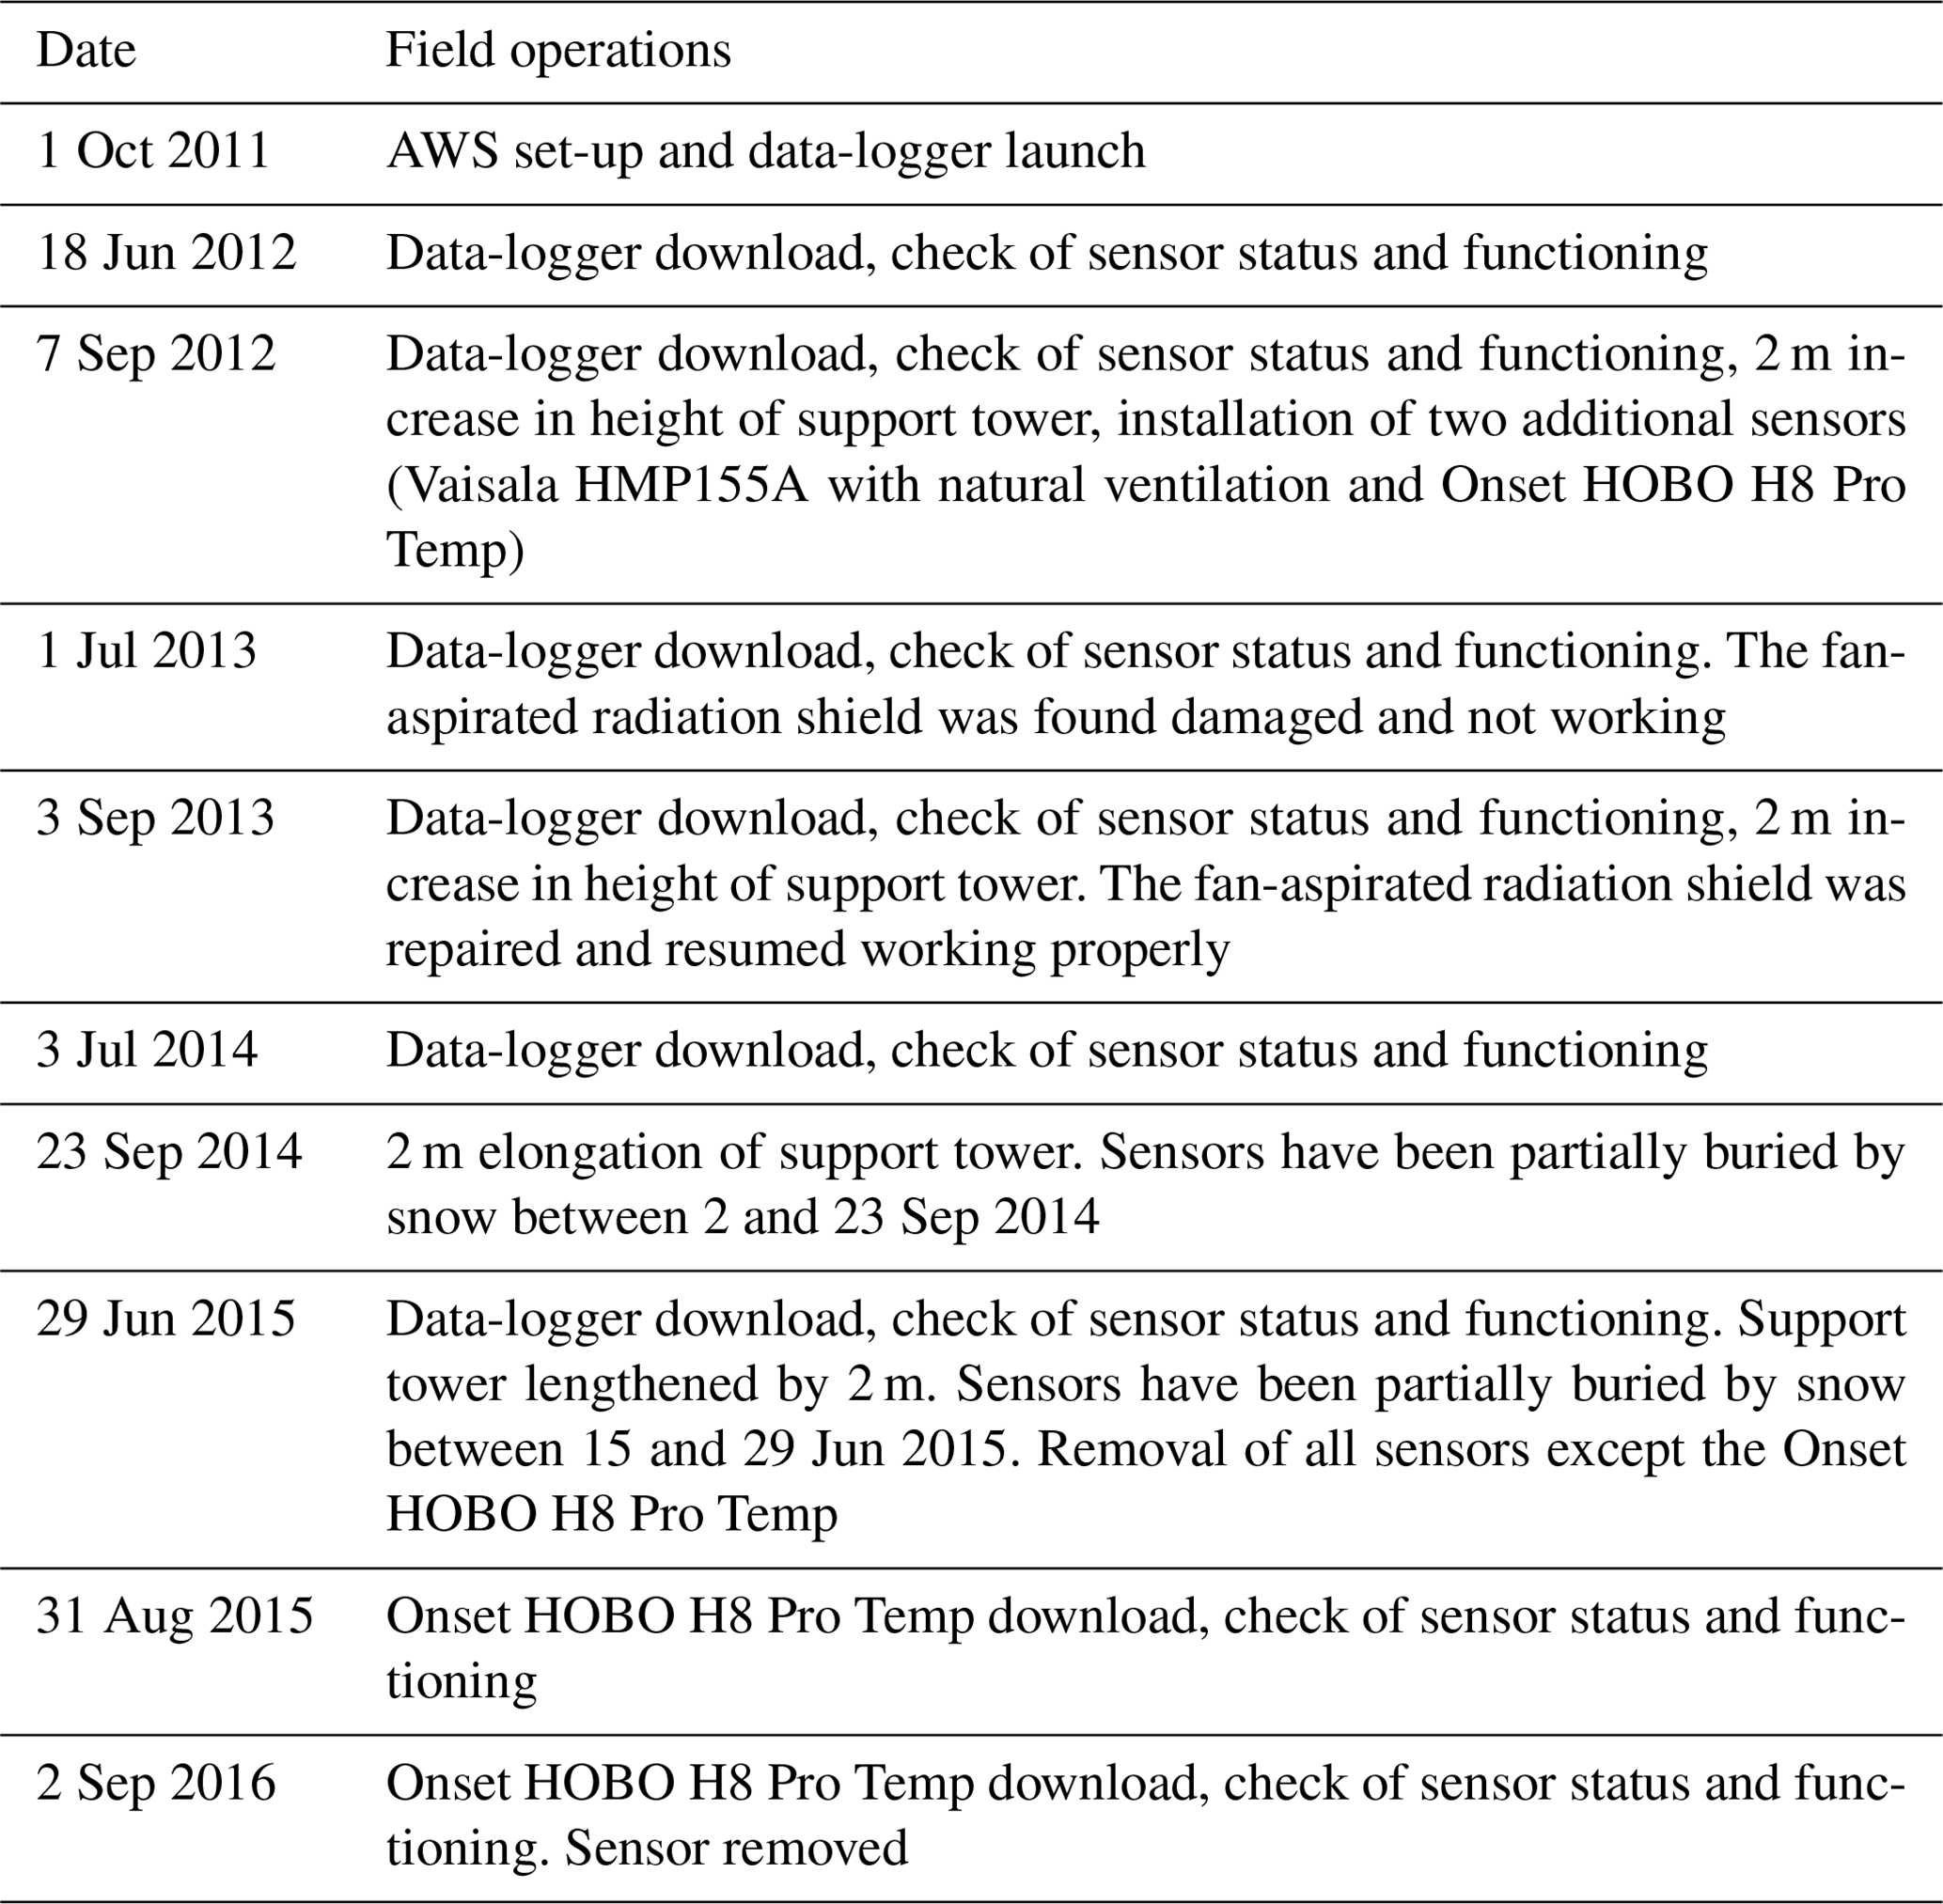
Table D2Field operations and maintenance for the englacial temperature sensors installed on Mt Ortles.
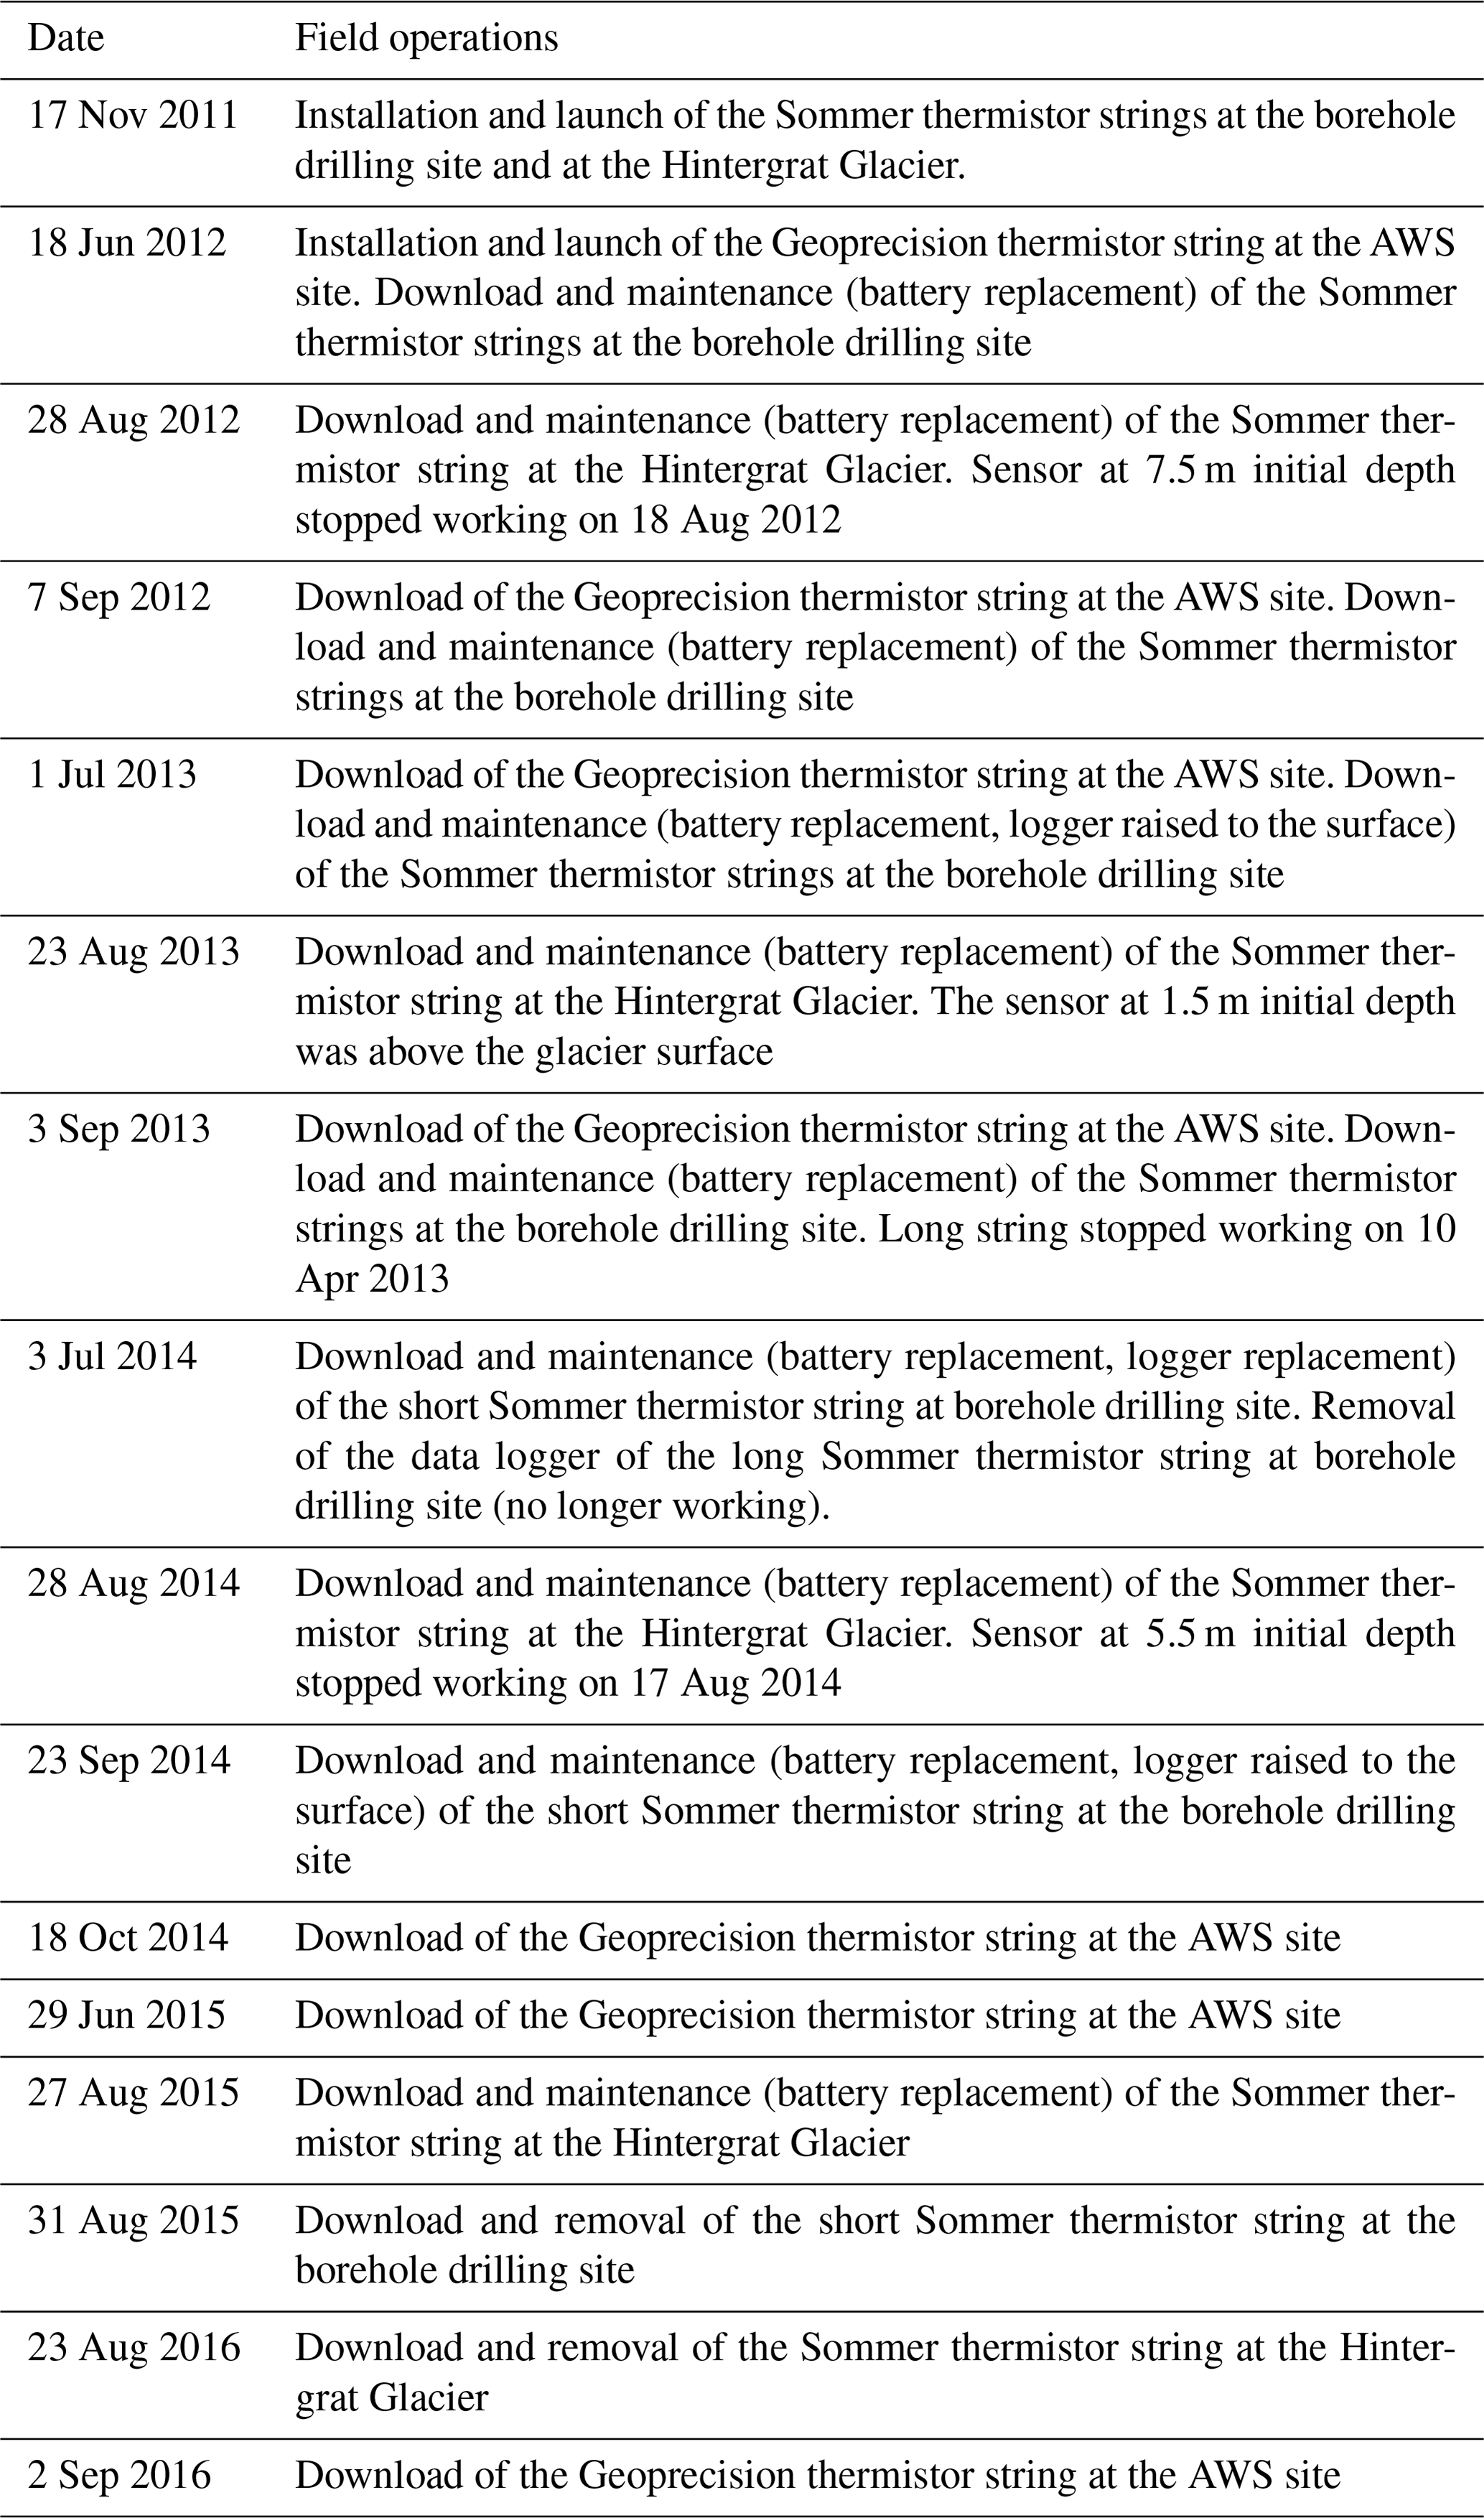
Table D3Field operations and maintenance for the soil surface temperature sensors installed on Mt Ortles.
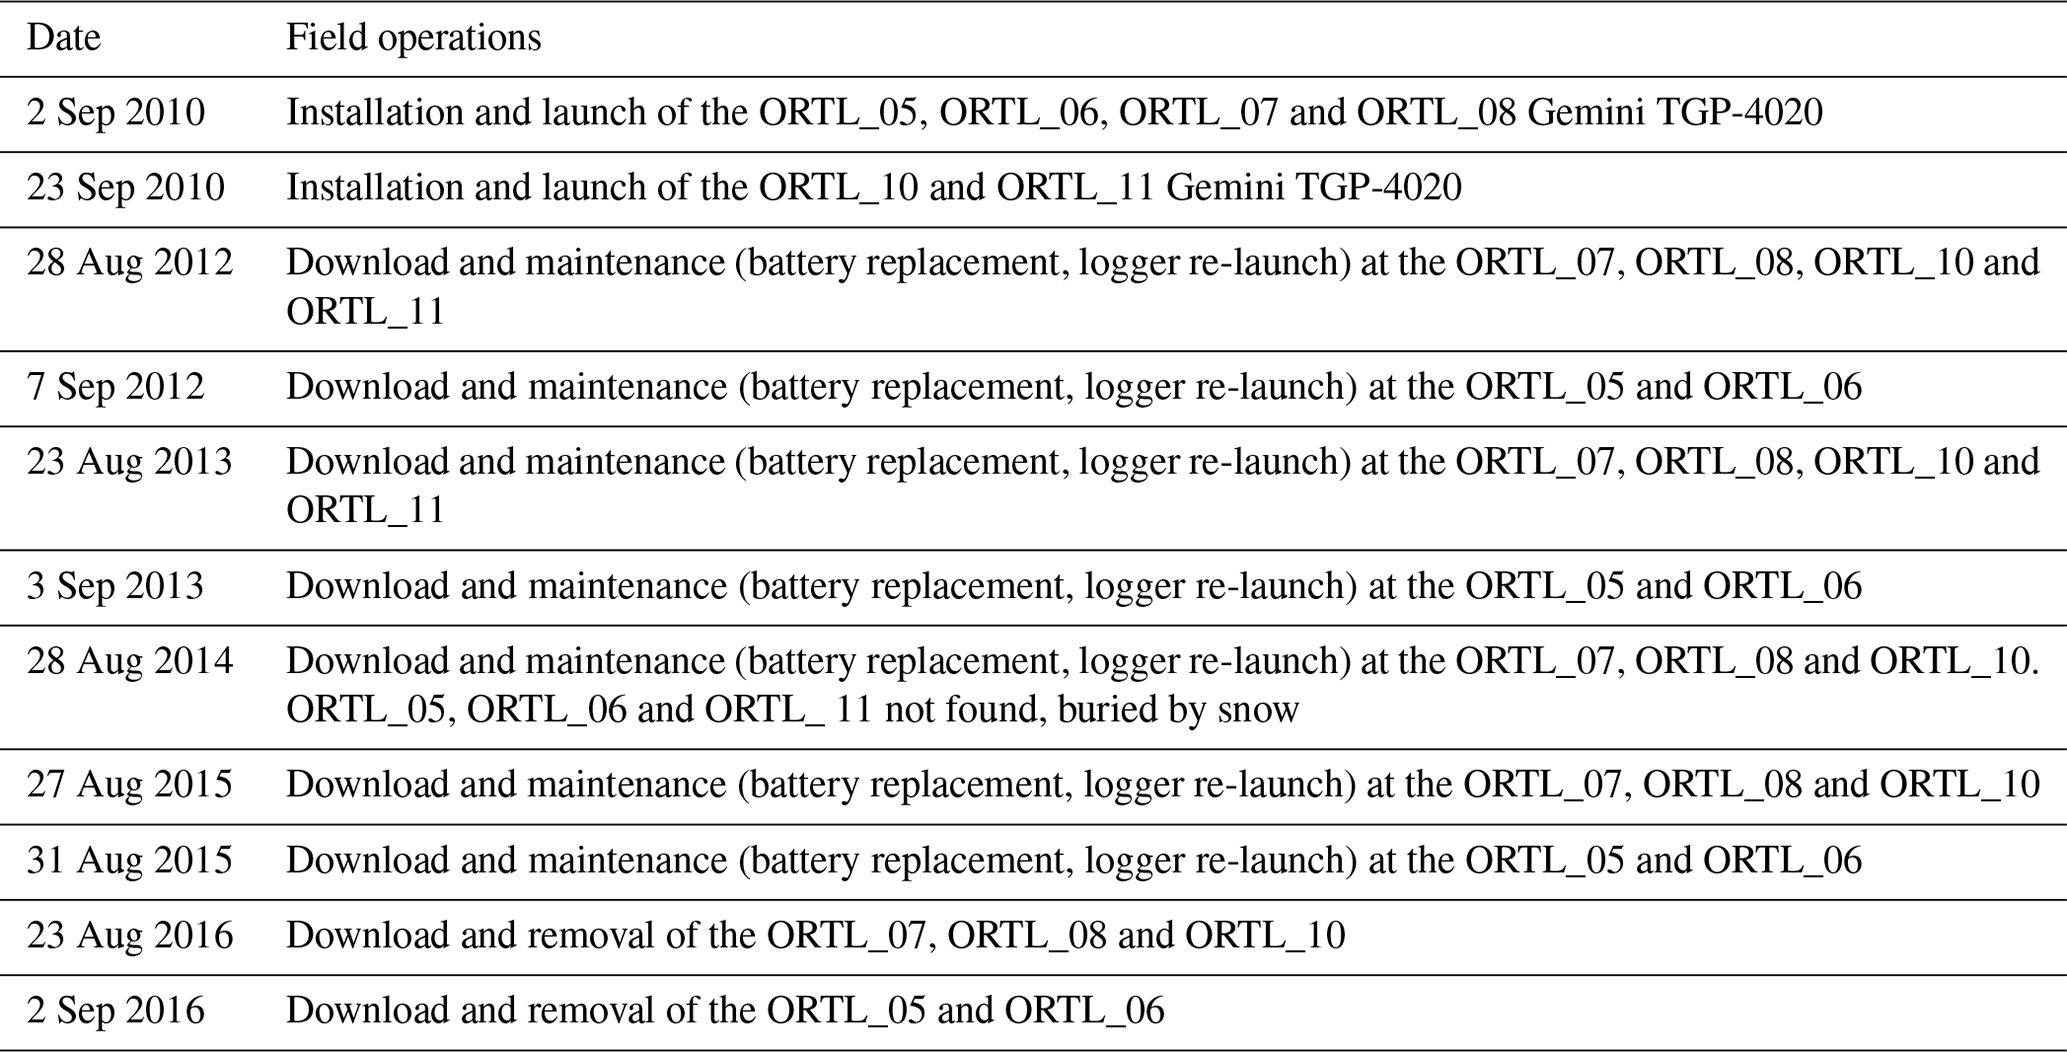
Table D4Field operations and maintenance for the rock wall temperature sensors installed on Mt Ortles.
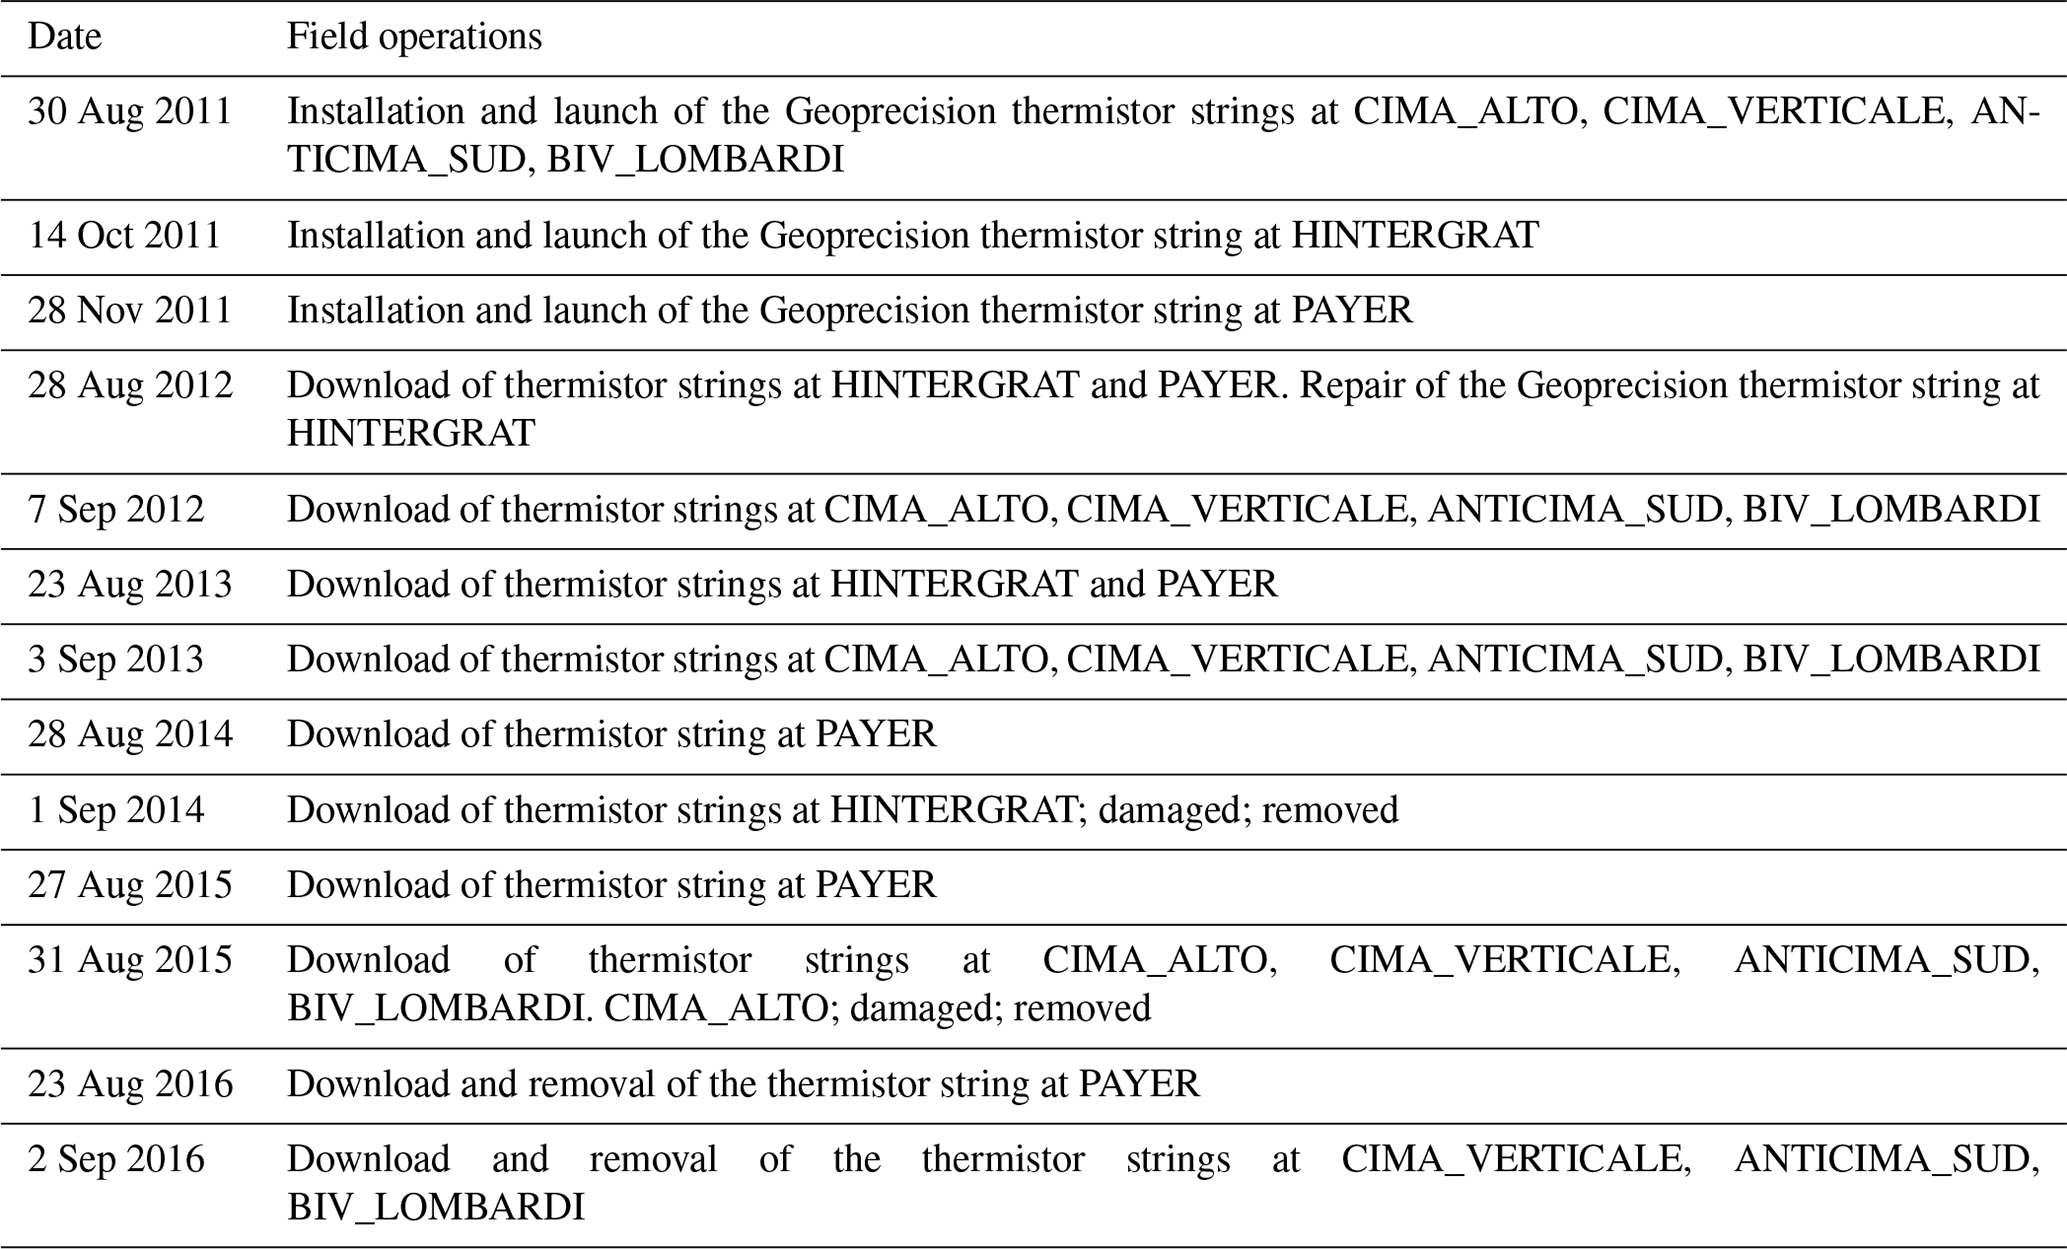
Table E1Topographic and geomorphological characteristics of sites instrumented for temperature measurements. (CRS represents coordinate reference system).
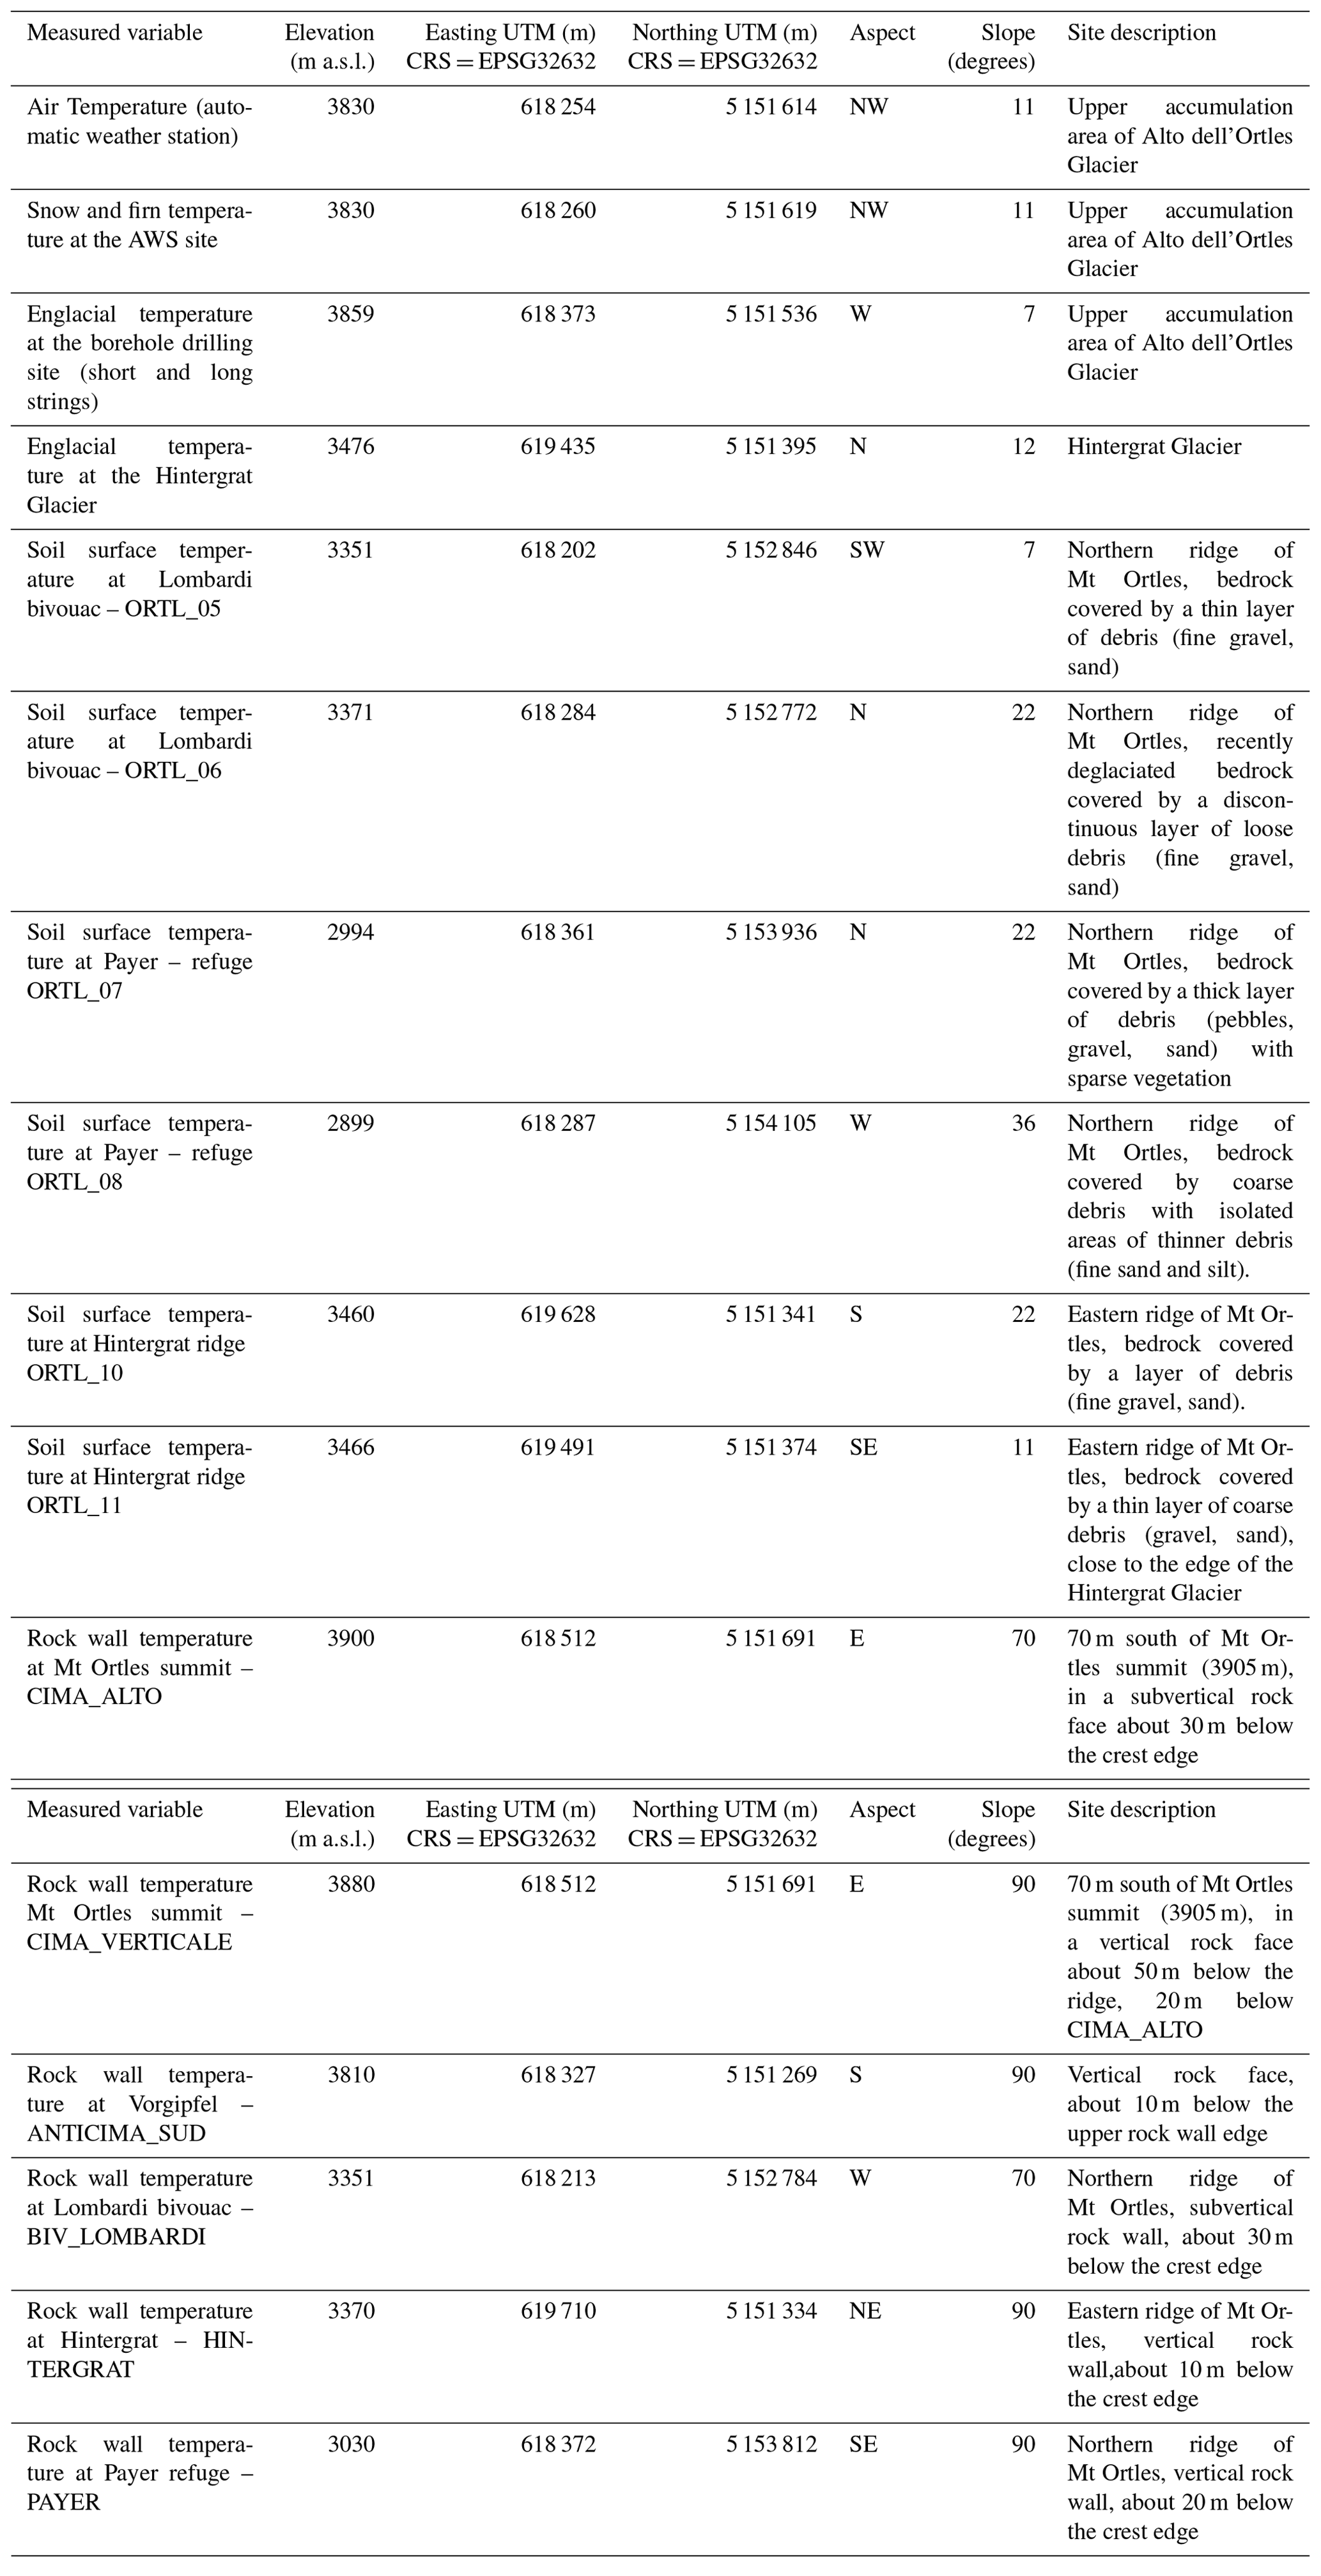
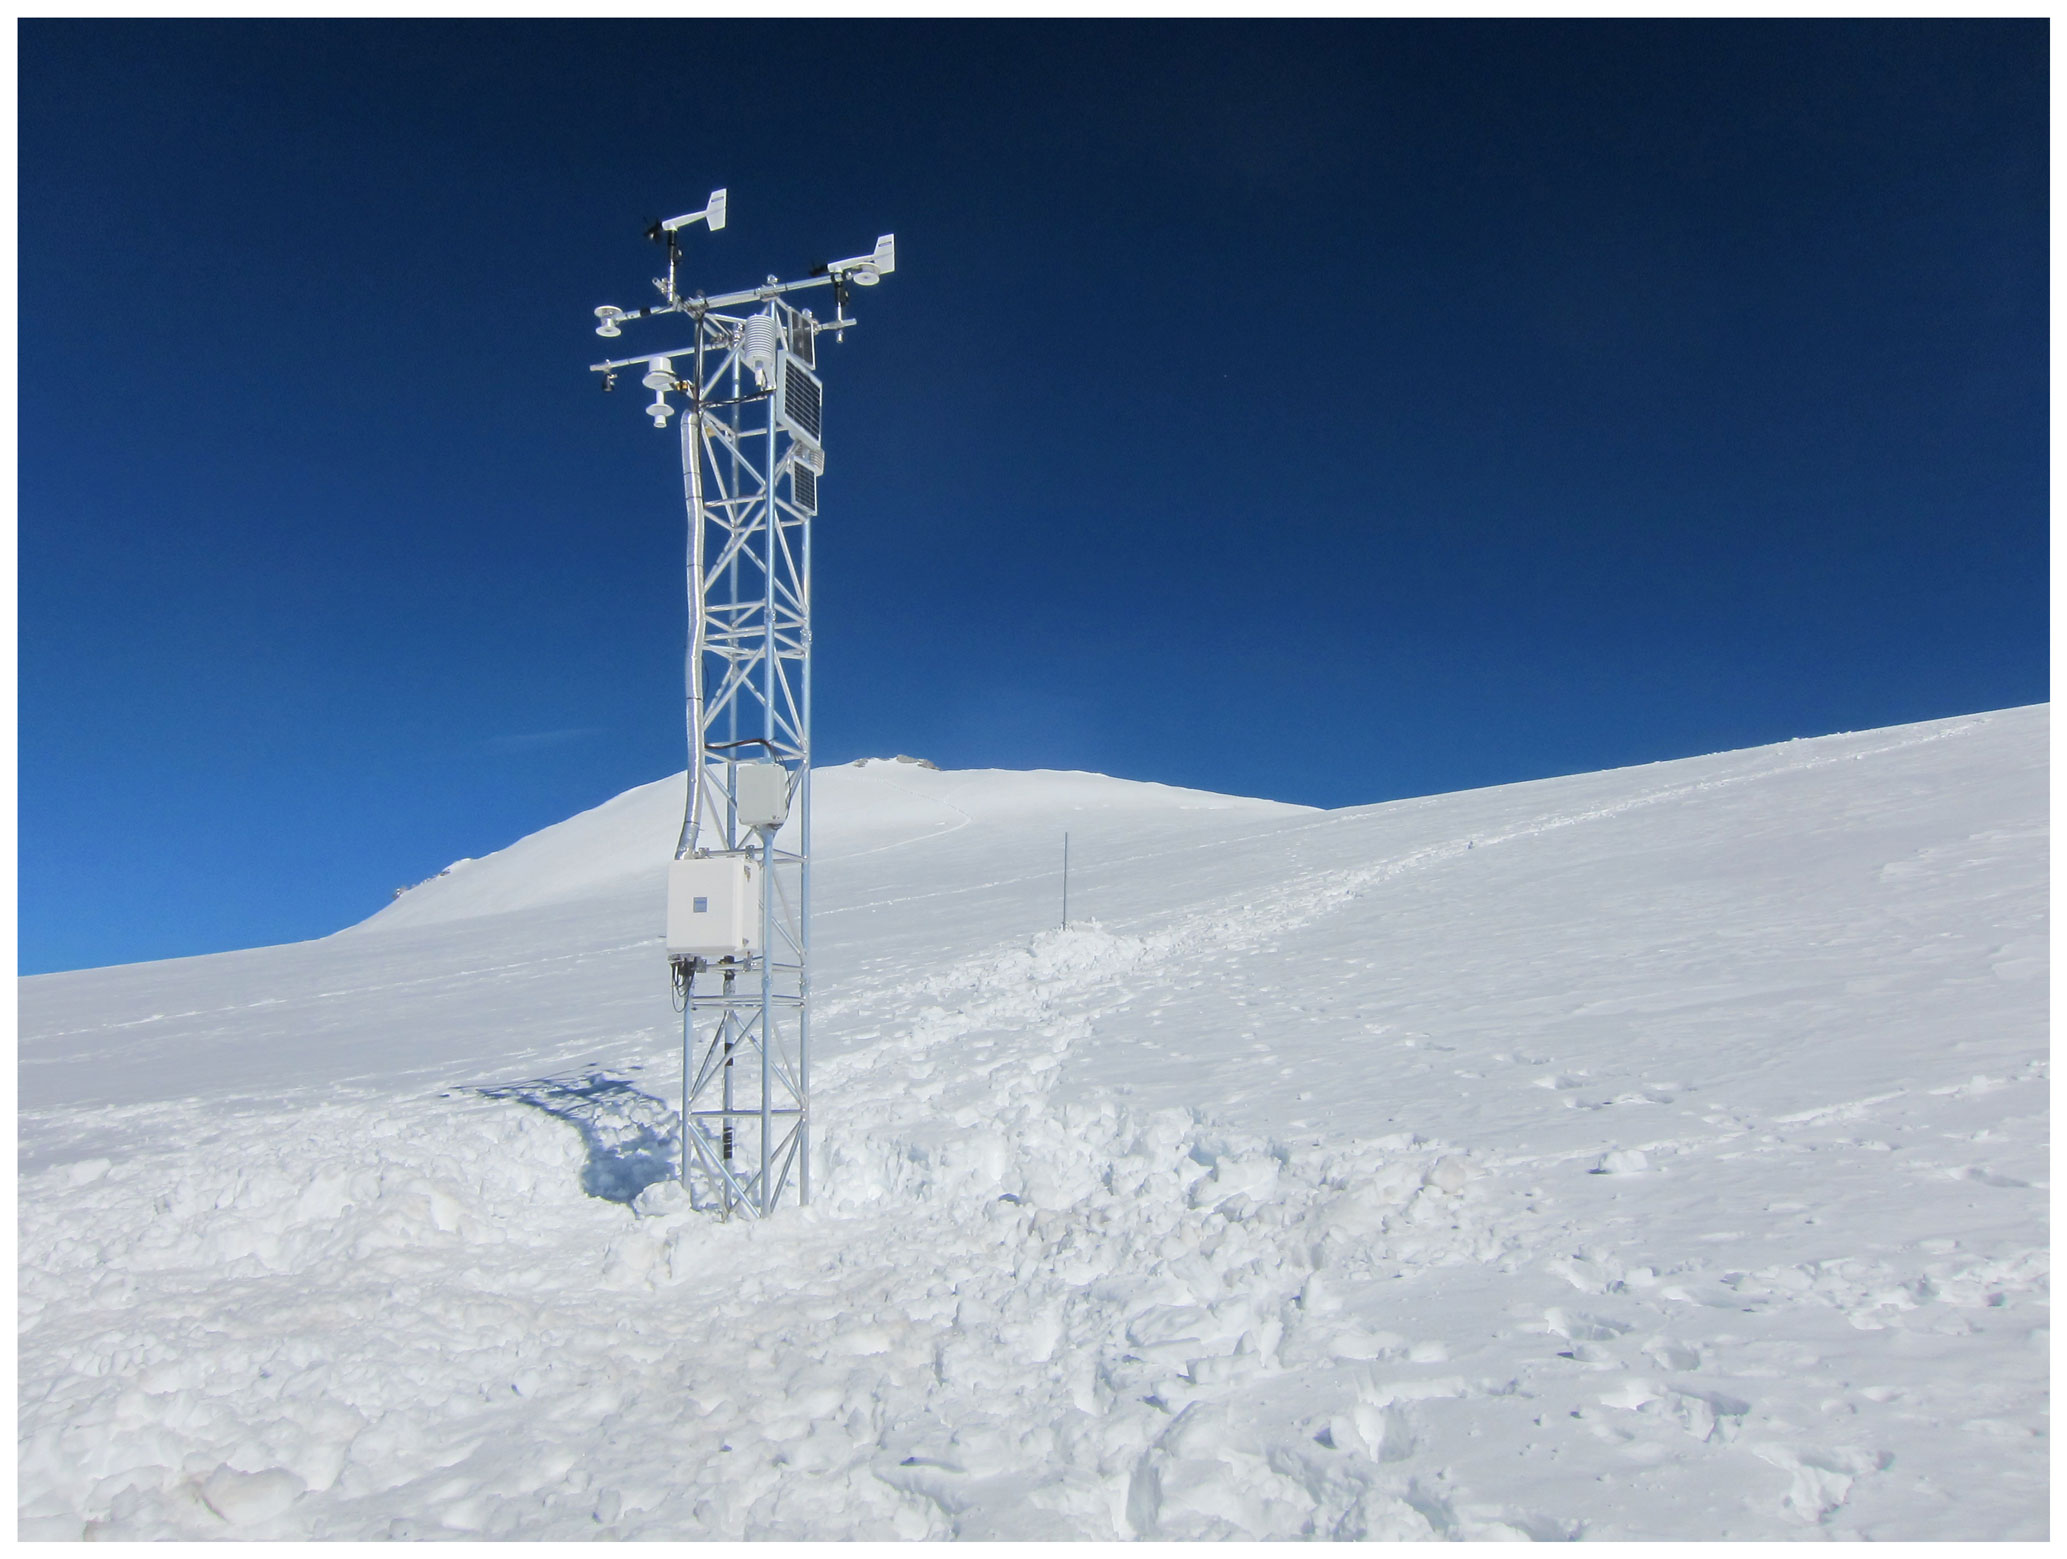
Figure F1The automatic weather station (AWS) installed on Mt Ortles, whose summit is visible in the background. The stake behind the weather station indicates the site of the Geoprecision thermistor string. Photo taken on 7 September 2012, after the lengthening of the support tower.
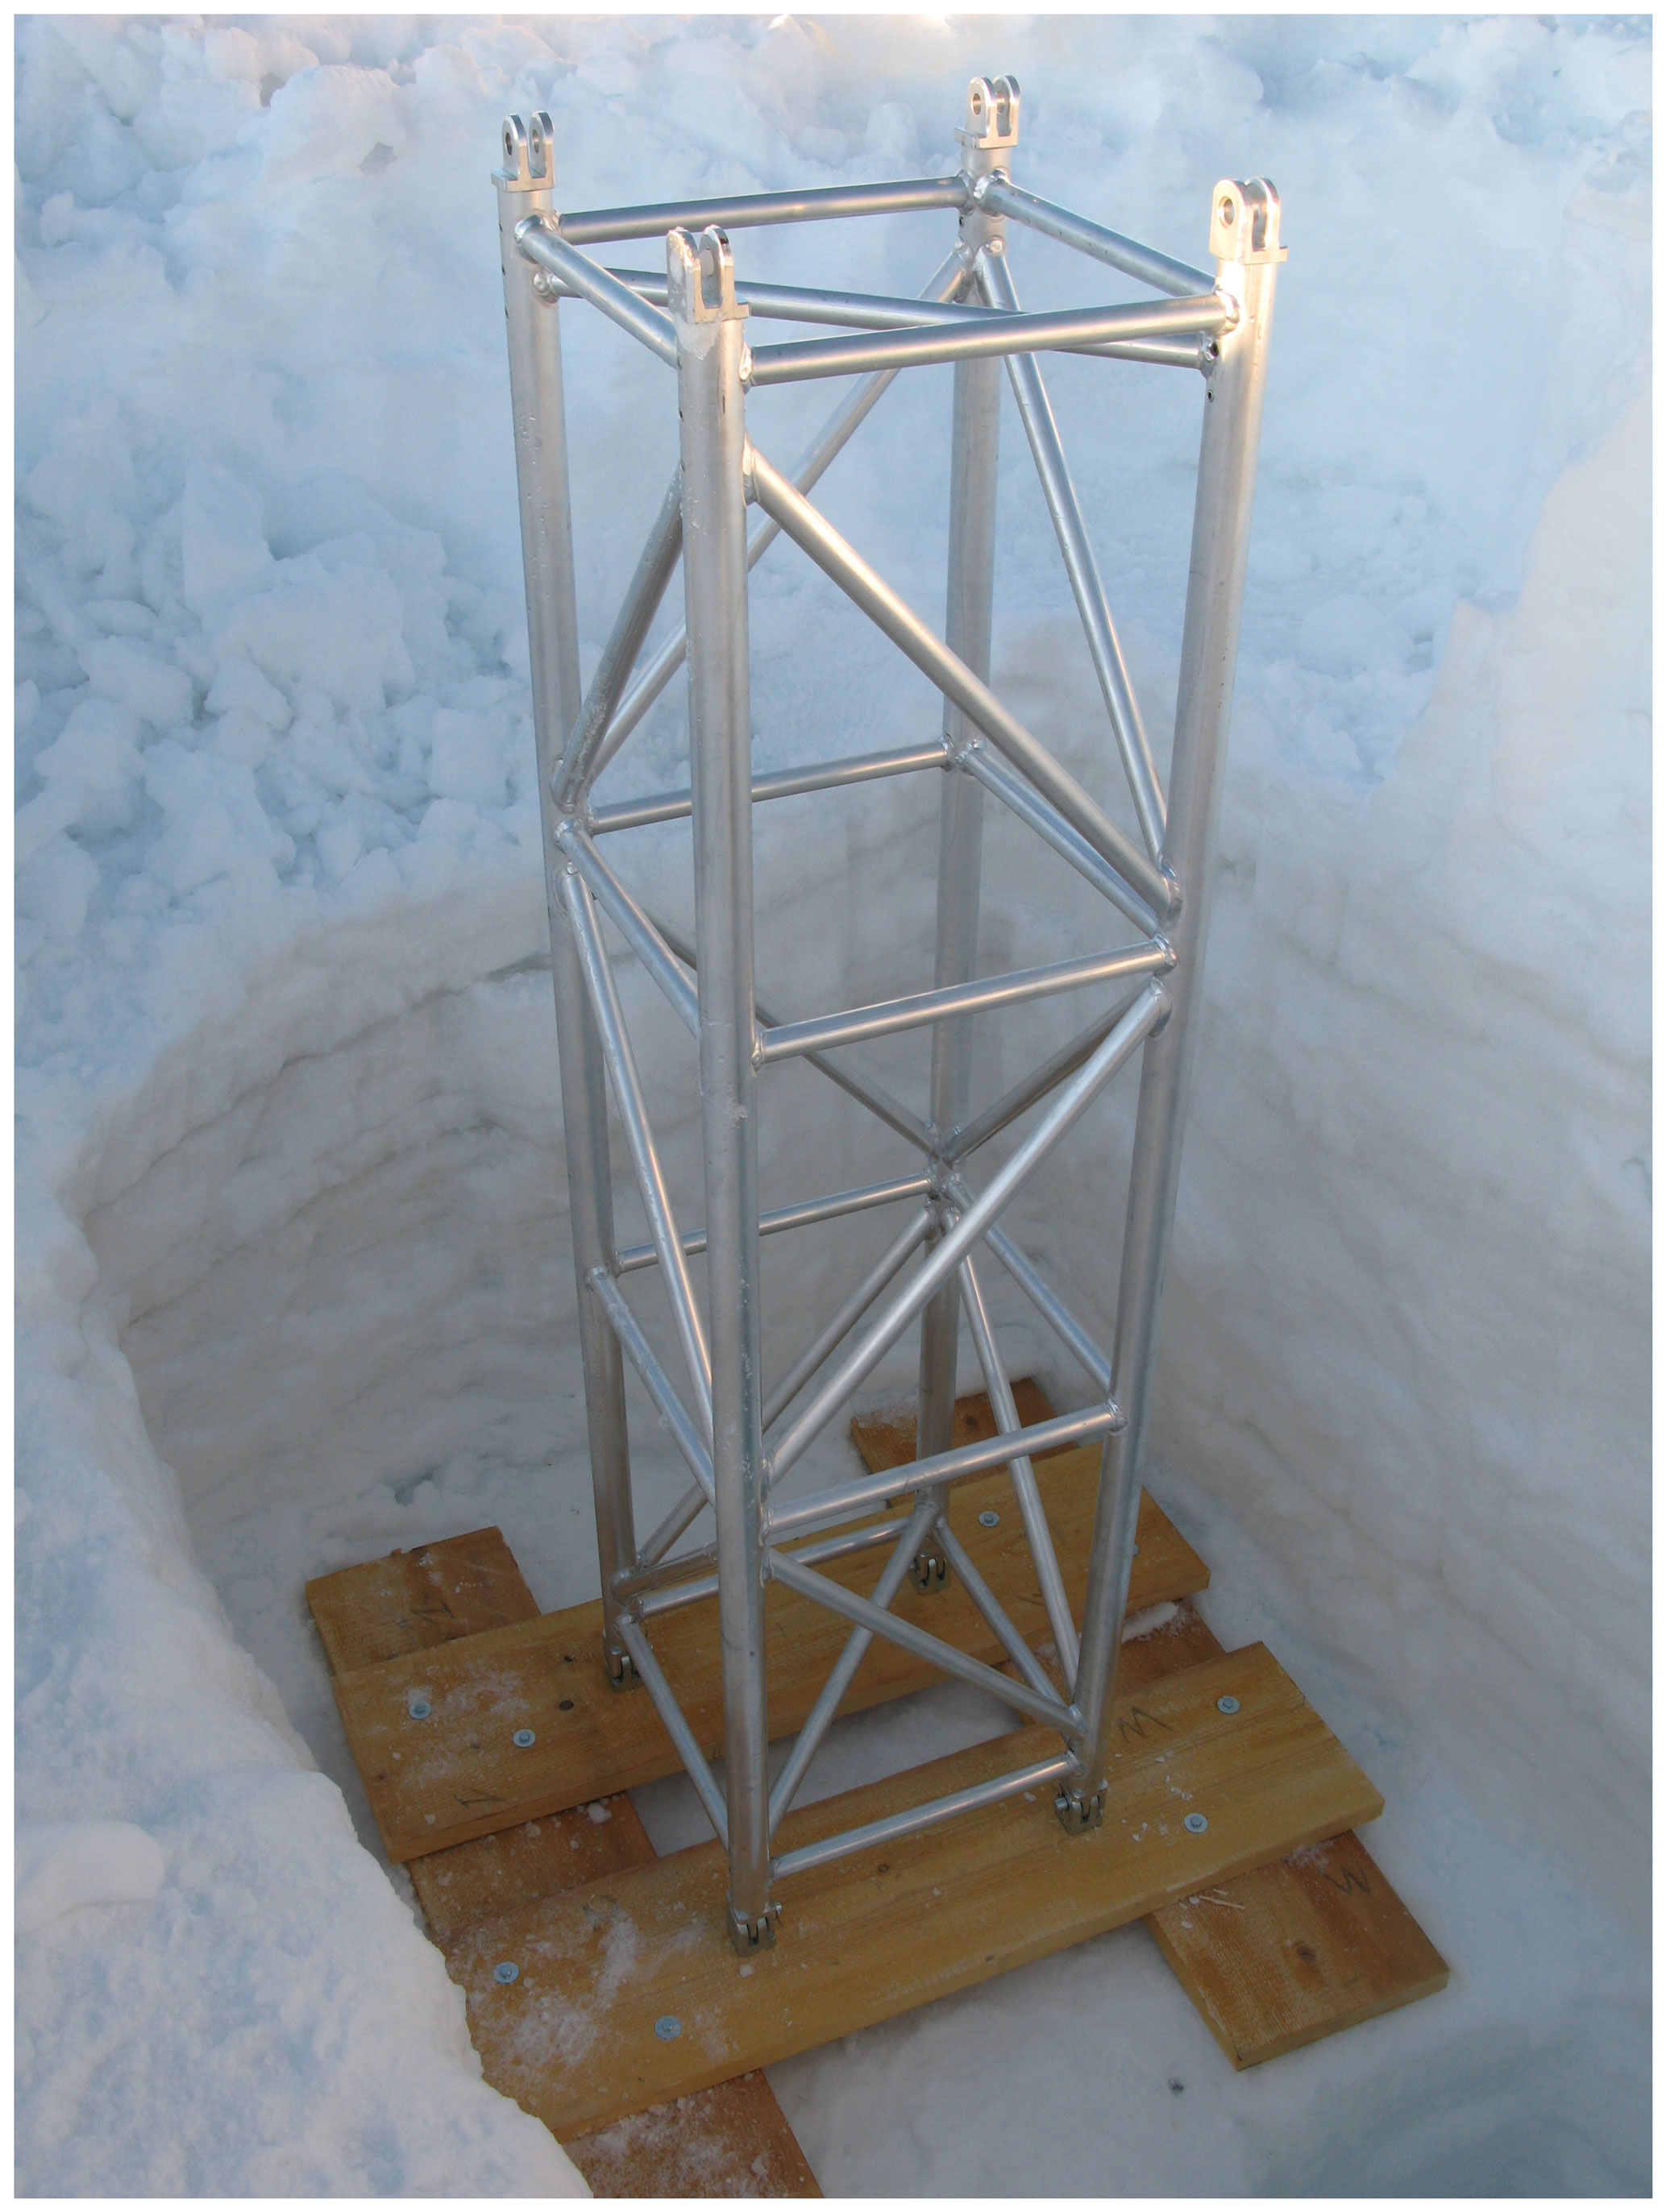
Figure F2The wooden boards placed at the bottom of the aluminium support tower, at 2 m depth in the firn, during the AWS installation. Photo taken on 30 September 2011.
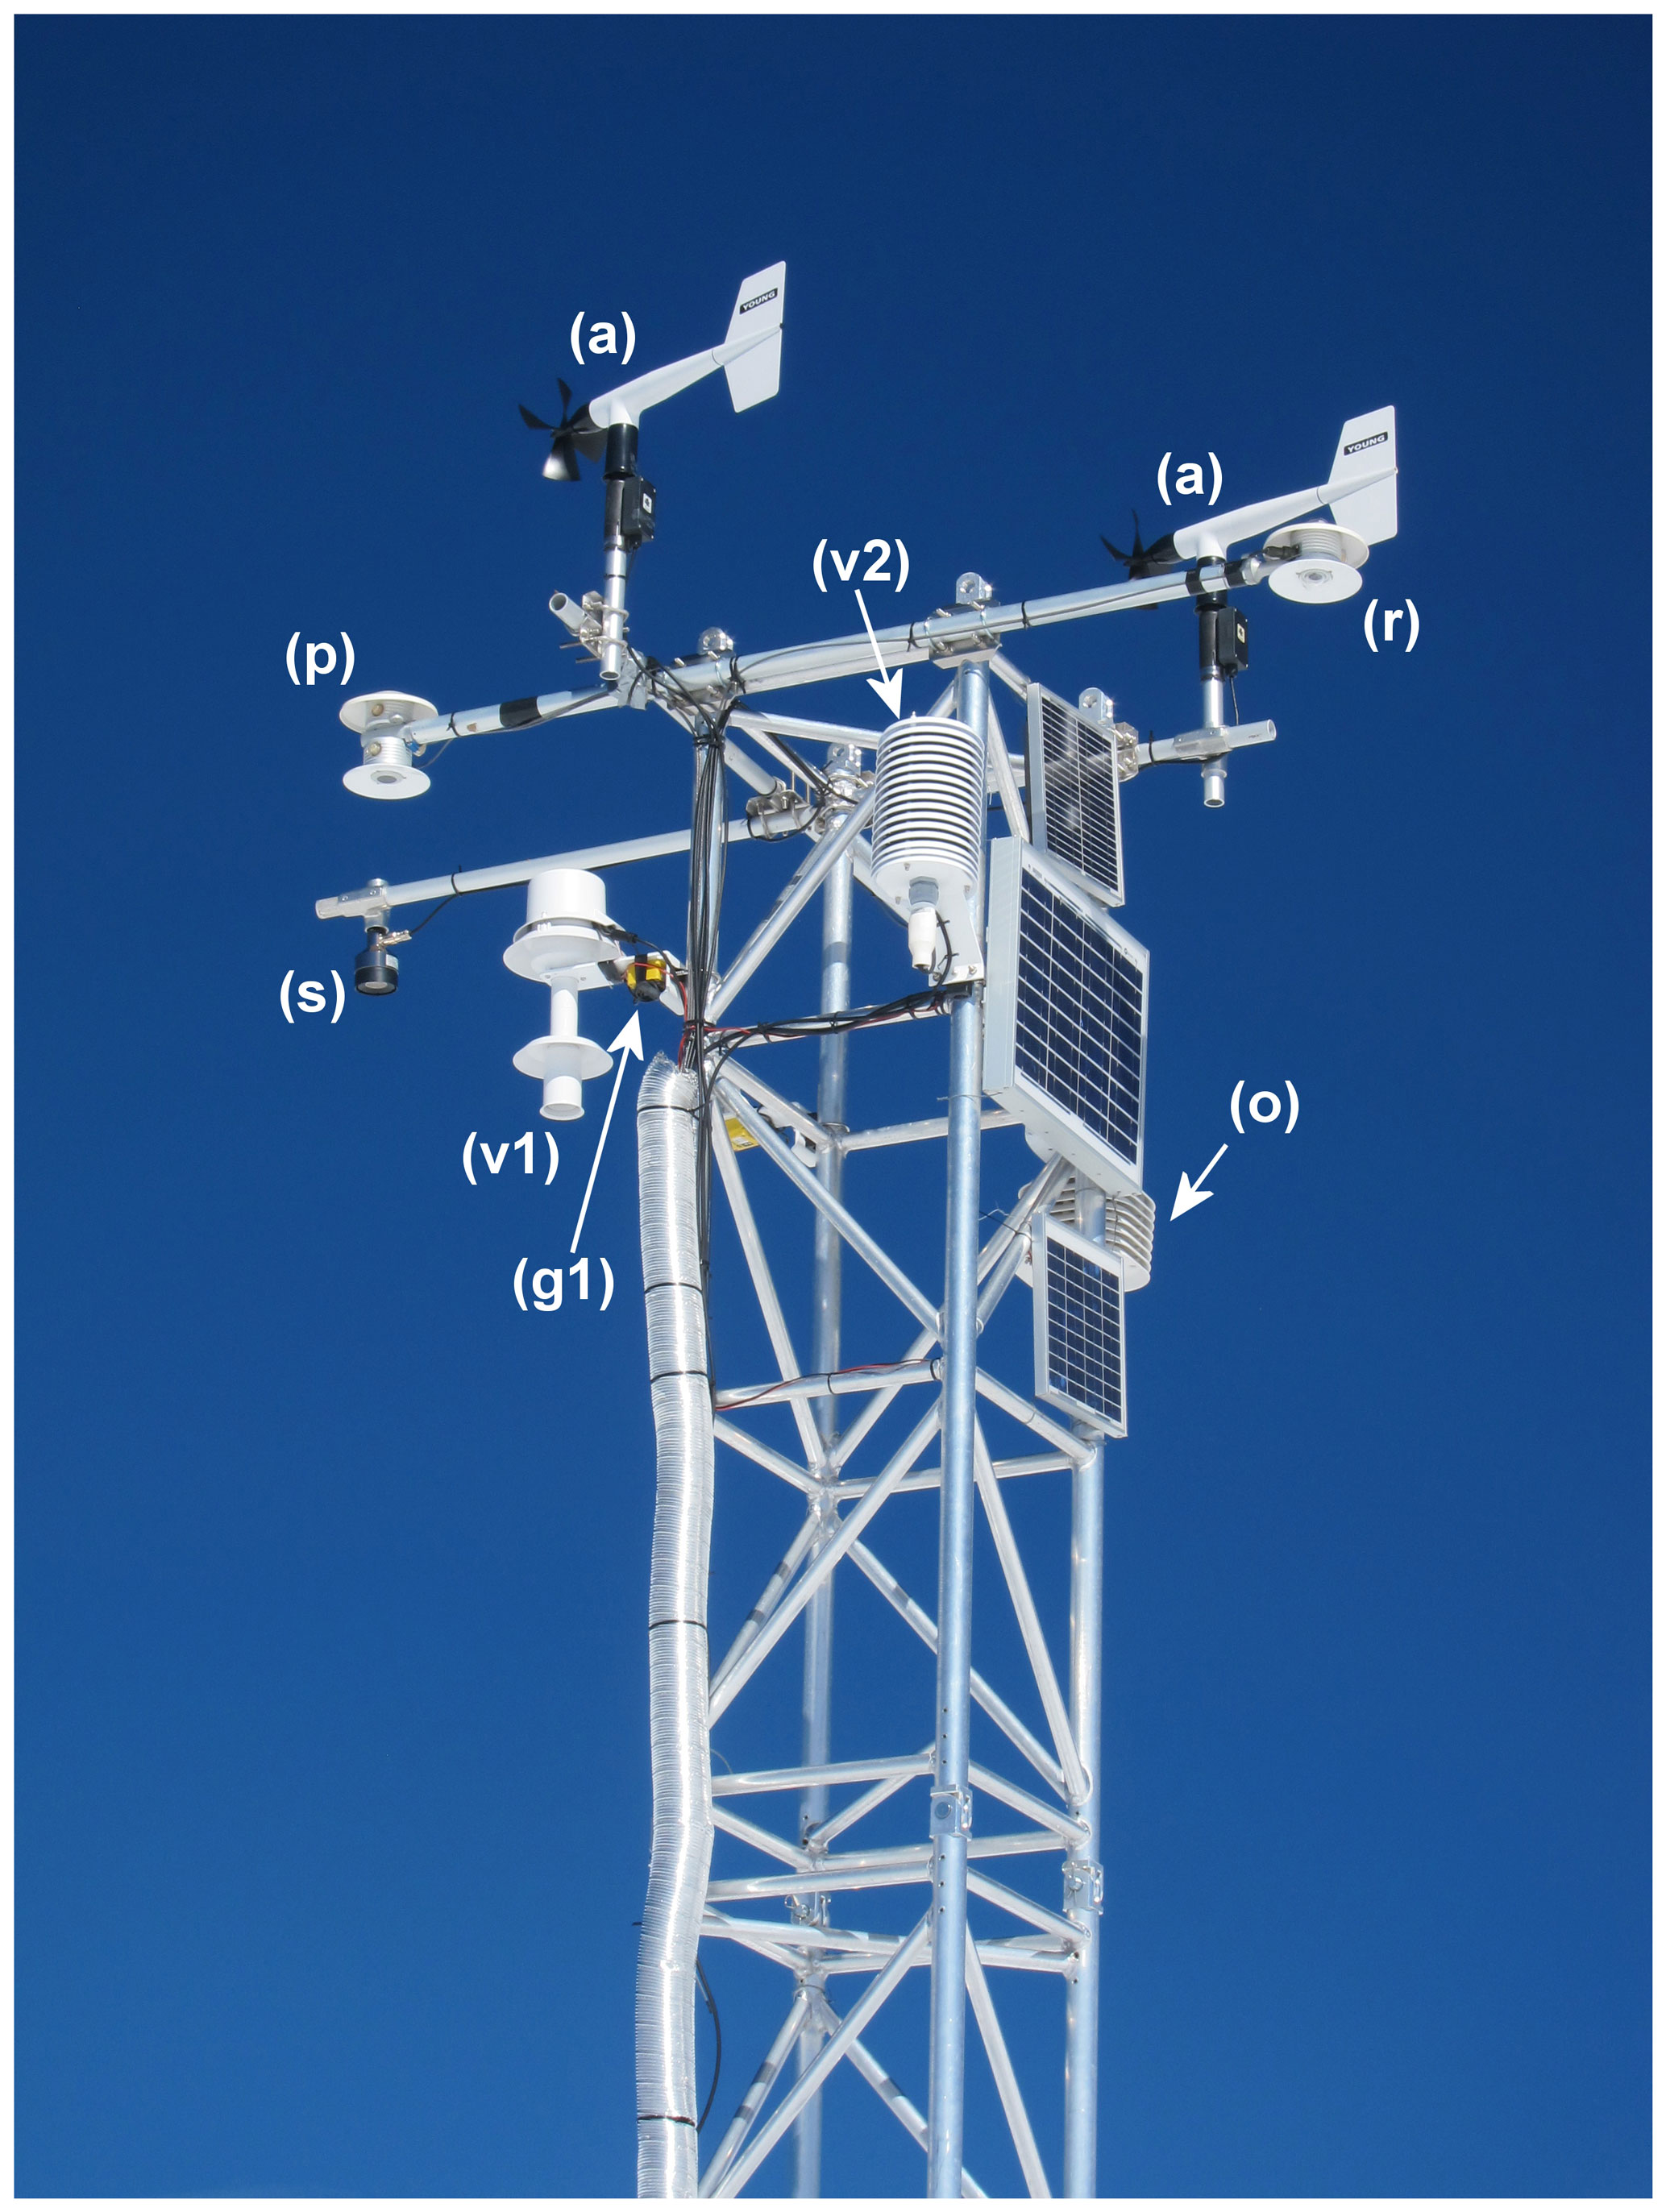
Figure F3Details of the AWS seen from the west: (a) R. M. Young 05103 anemometers, (p) Delta Ohm LP PIRG 01 pyrgeometers, (r) Delta Ohm LP Pyra 05 radiometers, (s) Campbell Scientific SR50A snow depth sensors, (v1) Vaisala HMP155A inside the R. M. Young 43502 fan-aspirated radiation shield, (g1) Gemini TGP-4020 data logger inside the R. M. Young 43502 fan-aspirated radiation shield, (v2) Vaisala HMP155A inside the 15-plate Campbell Scientific MET 21 radiation shield with natural ventilation, (o) Onset HOBO H8 Pro Temp data logger inside the eight-plate Davis 7714 radiation shield with natural ventilation. Photo taken on 7 September 2012.
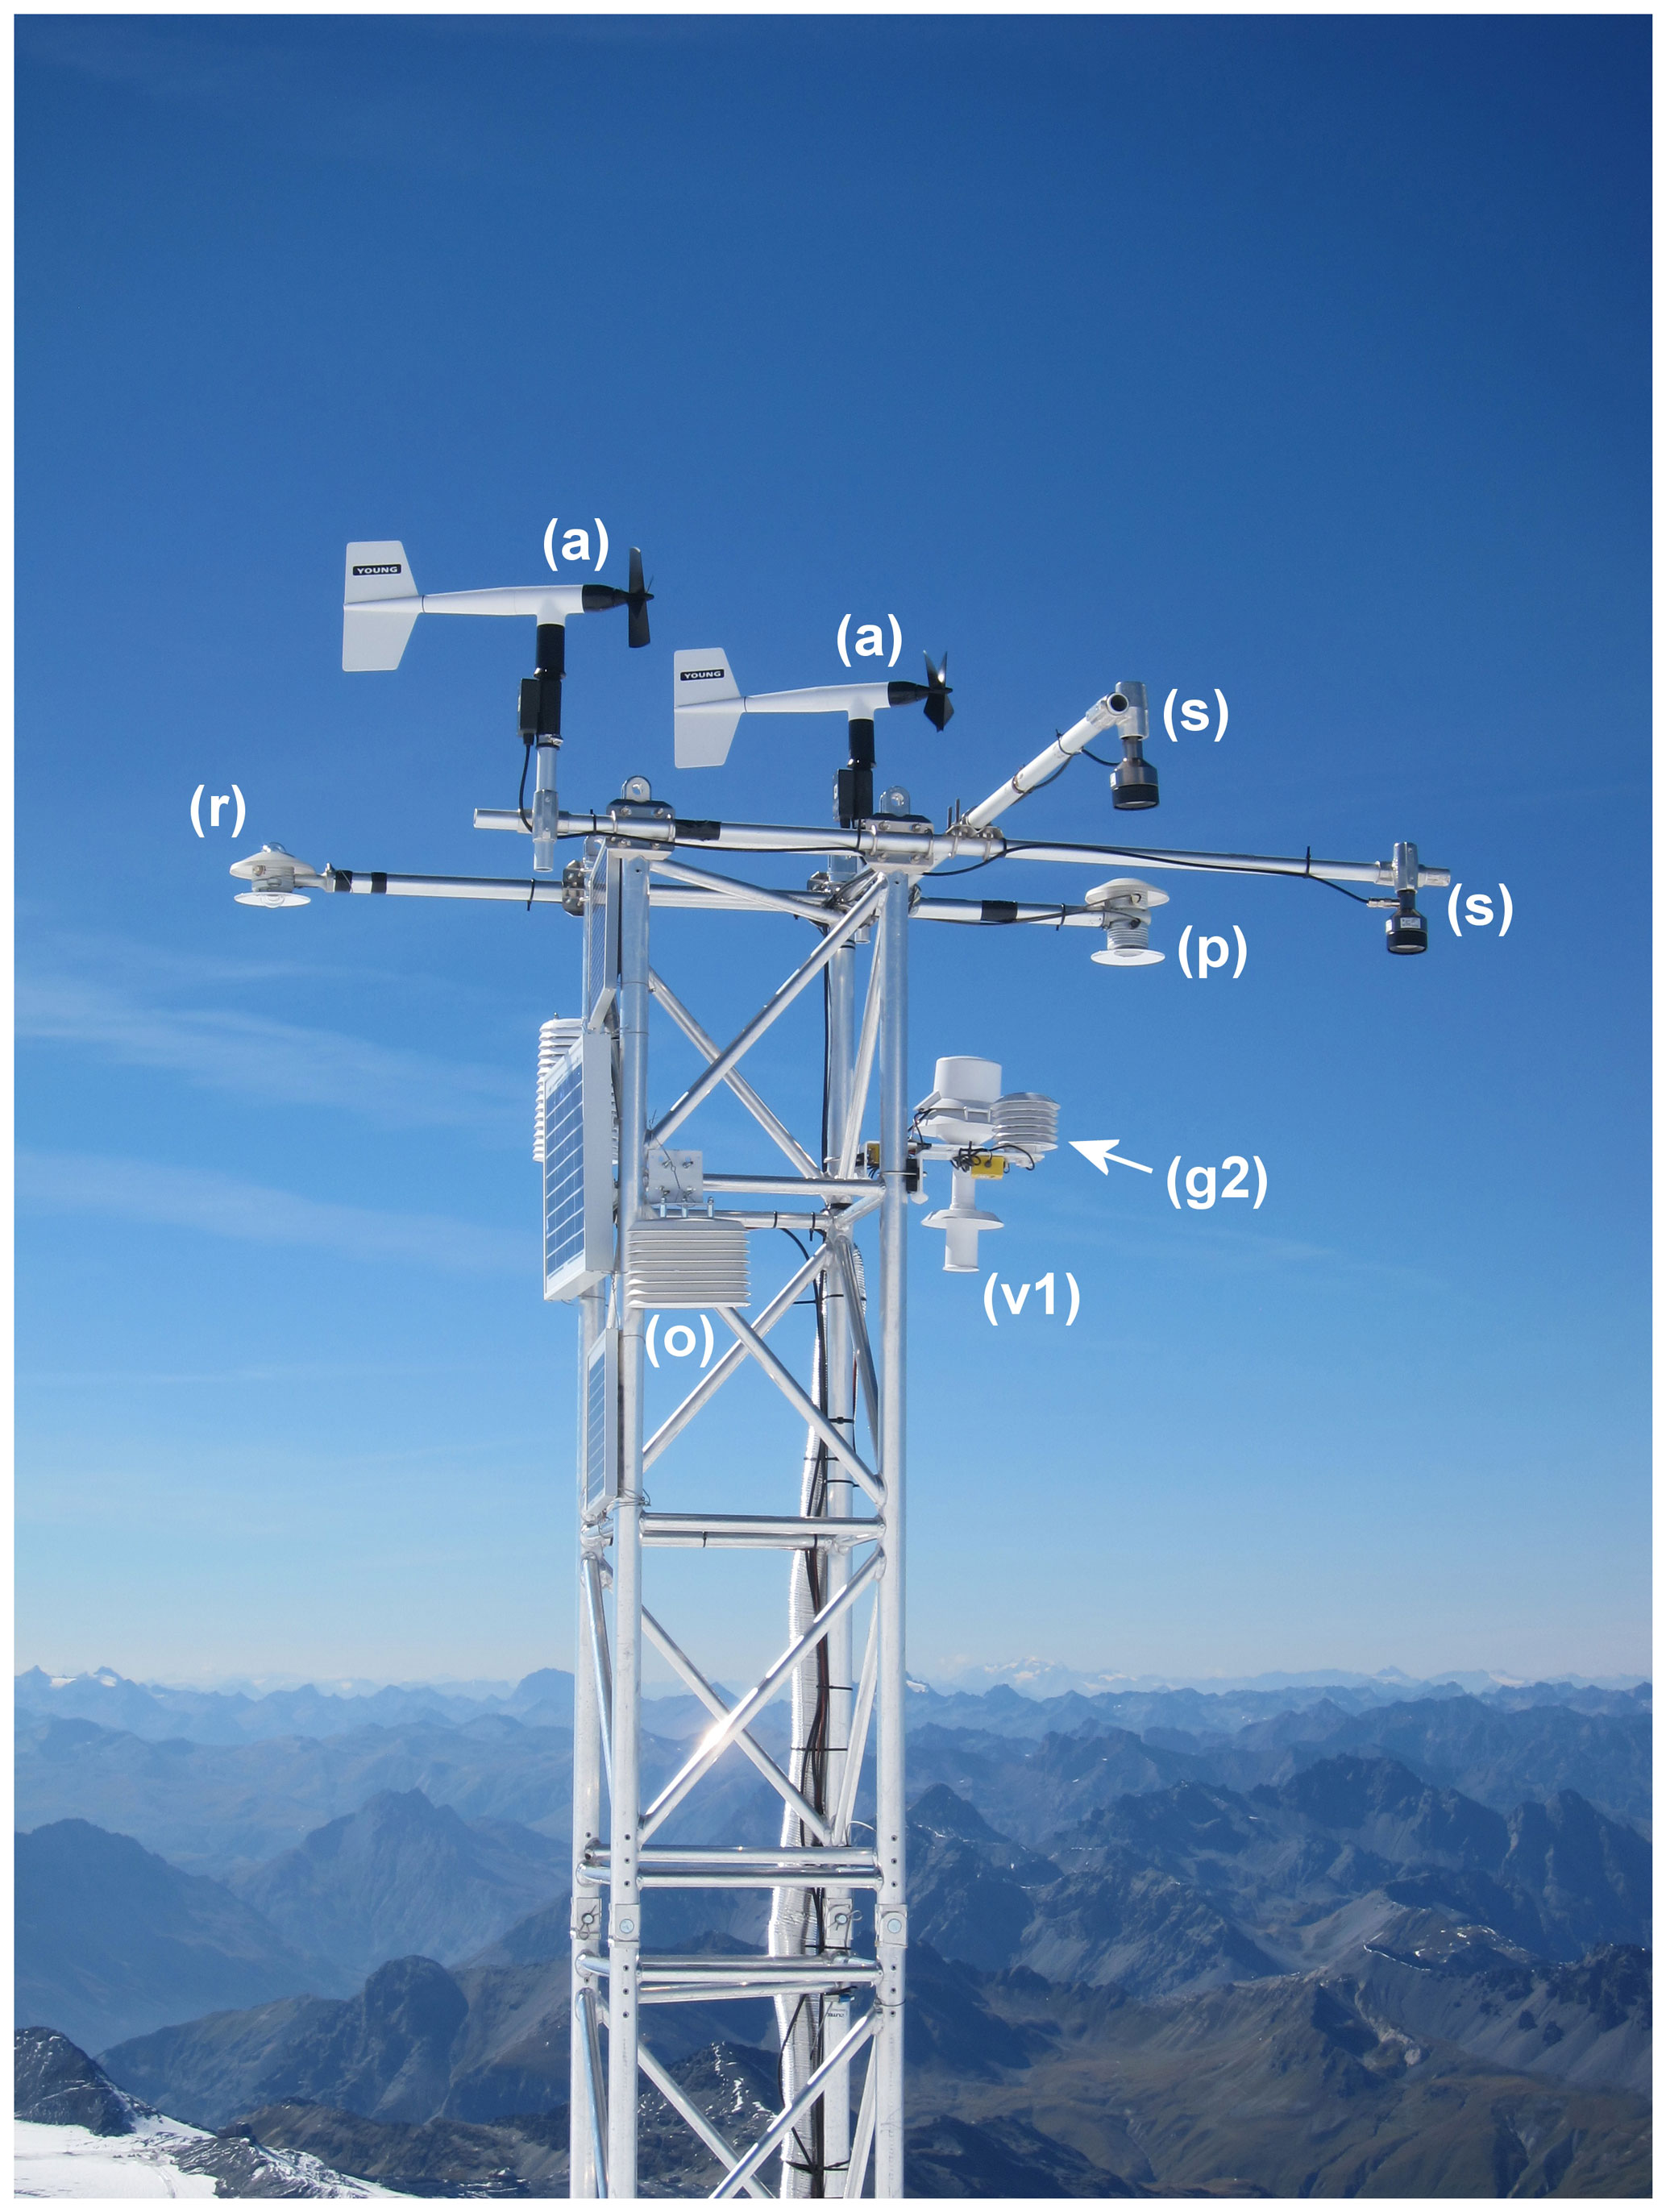
Figure F4Details of the AWS seen from the east: (a) R. M. Young 05103 anemometers, (p) Delta Ohm LP PIRG 01 pyrgeometers, (r) Delta Ohm LP Pyra 05 radiometers, (s) Campbell Scientific SR50A snow depth sensors, (v1) Vaisala HMP155A inside the R. M. Young 43502 fan-aspirated radiation shield, (g2) Gemini TGP-4020 data logger inside the six-plate R. M. Young 41303-5 radiation shield with natural ventilation, (o) Onset HOBO H8 Pro Temp data logger inside the eight-plate Davis 7714 radiation shield with natural ventilation. Photo taken on 7 September 2012.
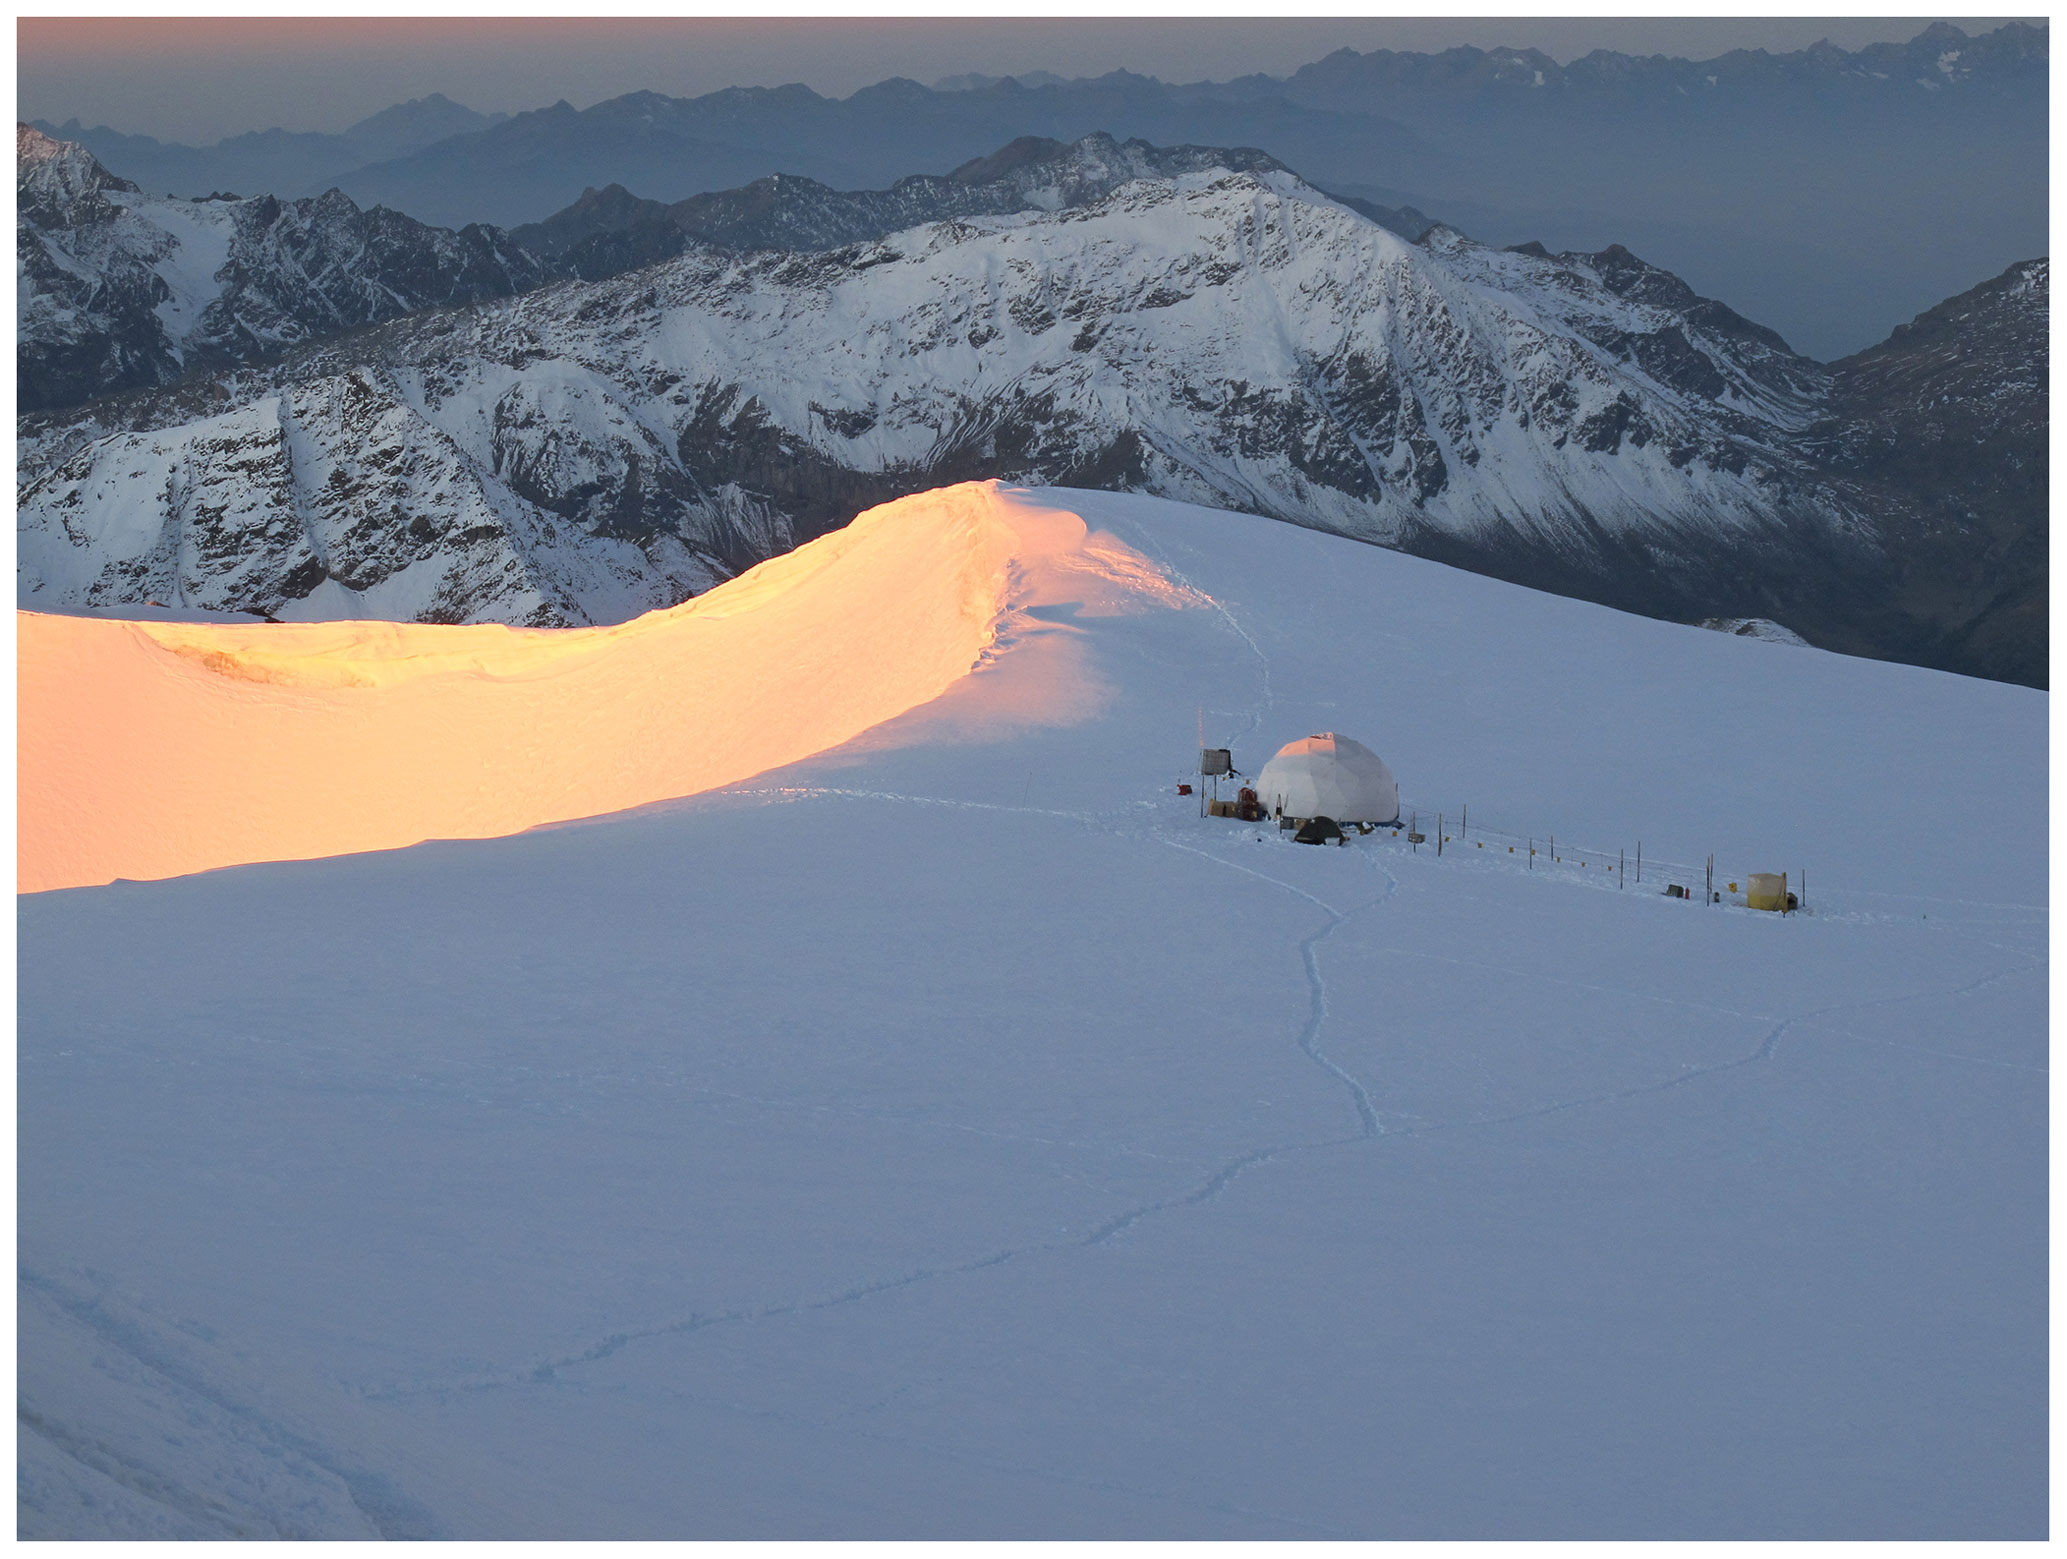
Figure G1The drilling site seen from the summit of Mt Ortles. The Vorgipfel–Anticima Sud is visible in the background. Photo taken on 1 October 2011 during the ice drilling operations and before setting up the drilling site thermistor strings for englacial temperature measurements.
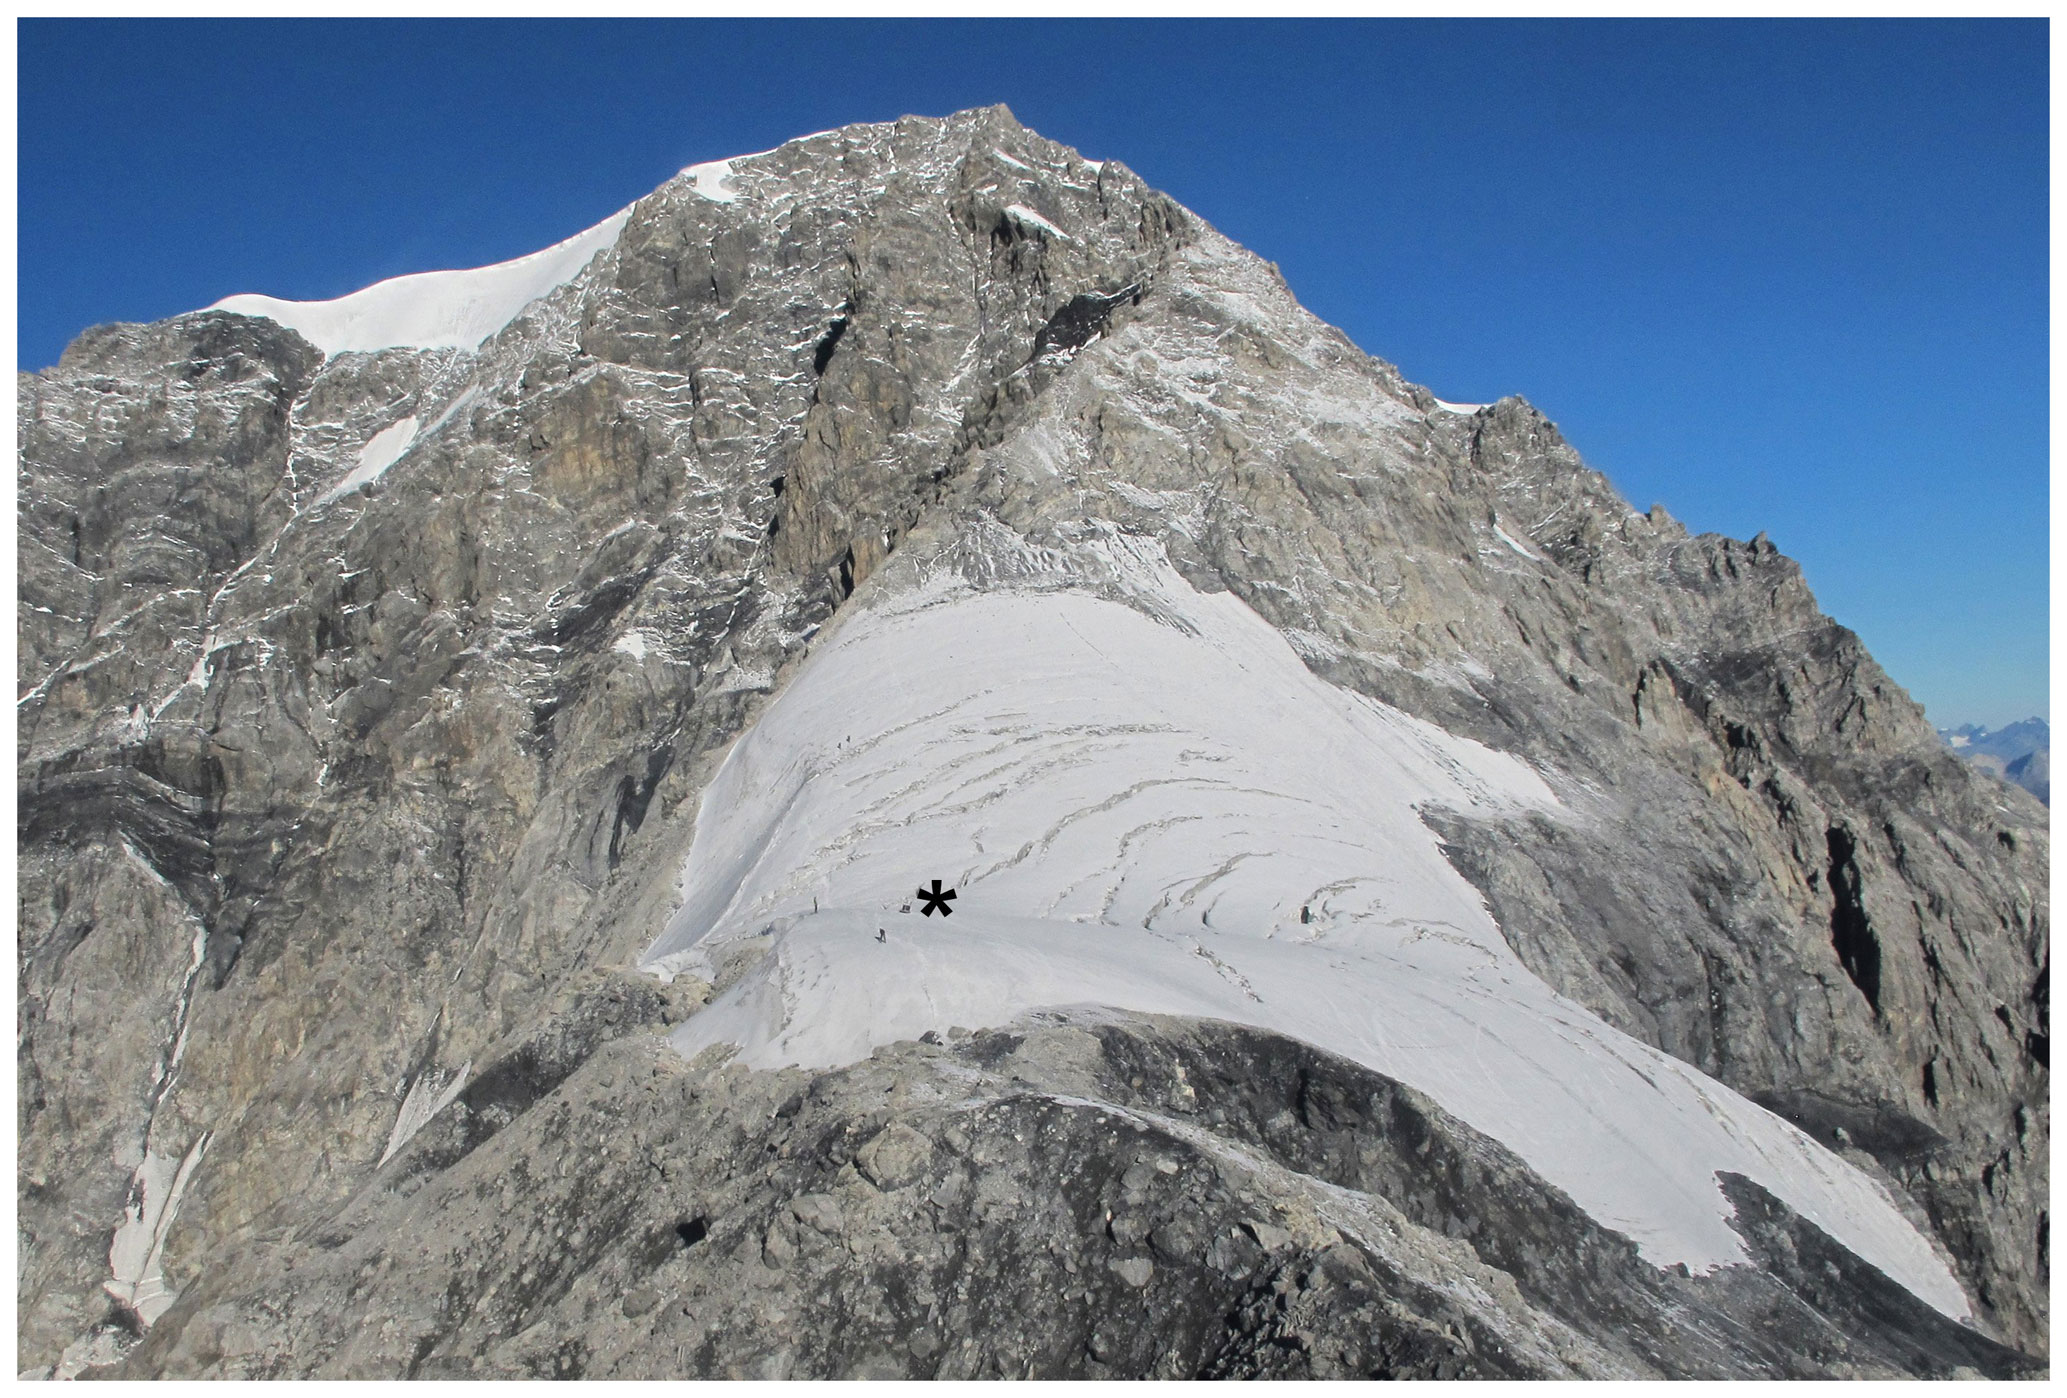
Figure G2The Hintergrat Glacier seen from the southeast (aerial photo taken on 28 August 2012). The black asterisk indicates the location of the borehole equipped with the thermistor string.
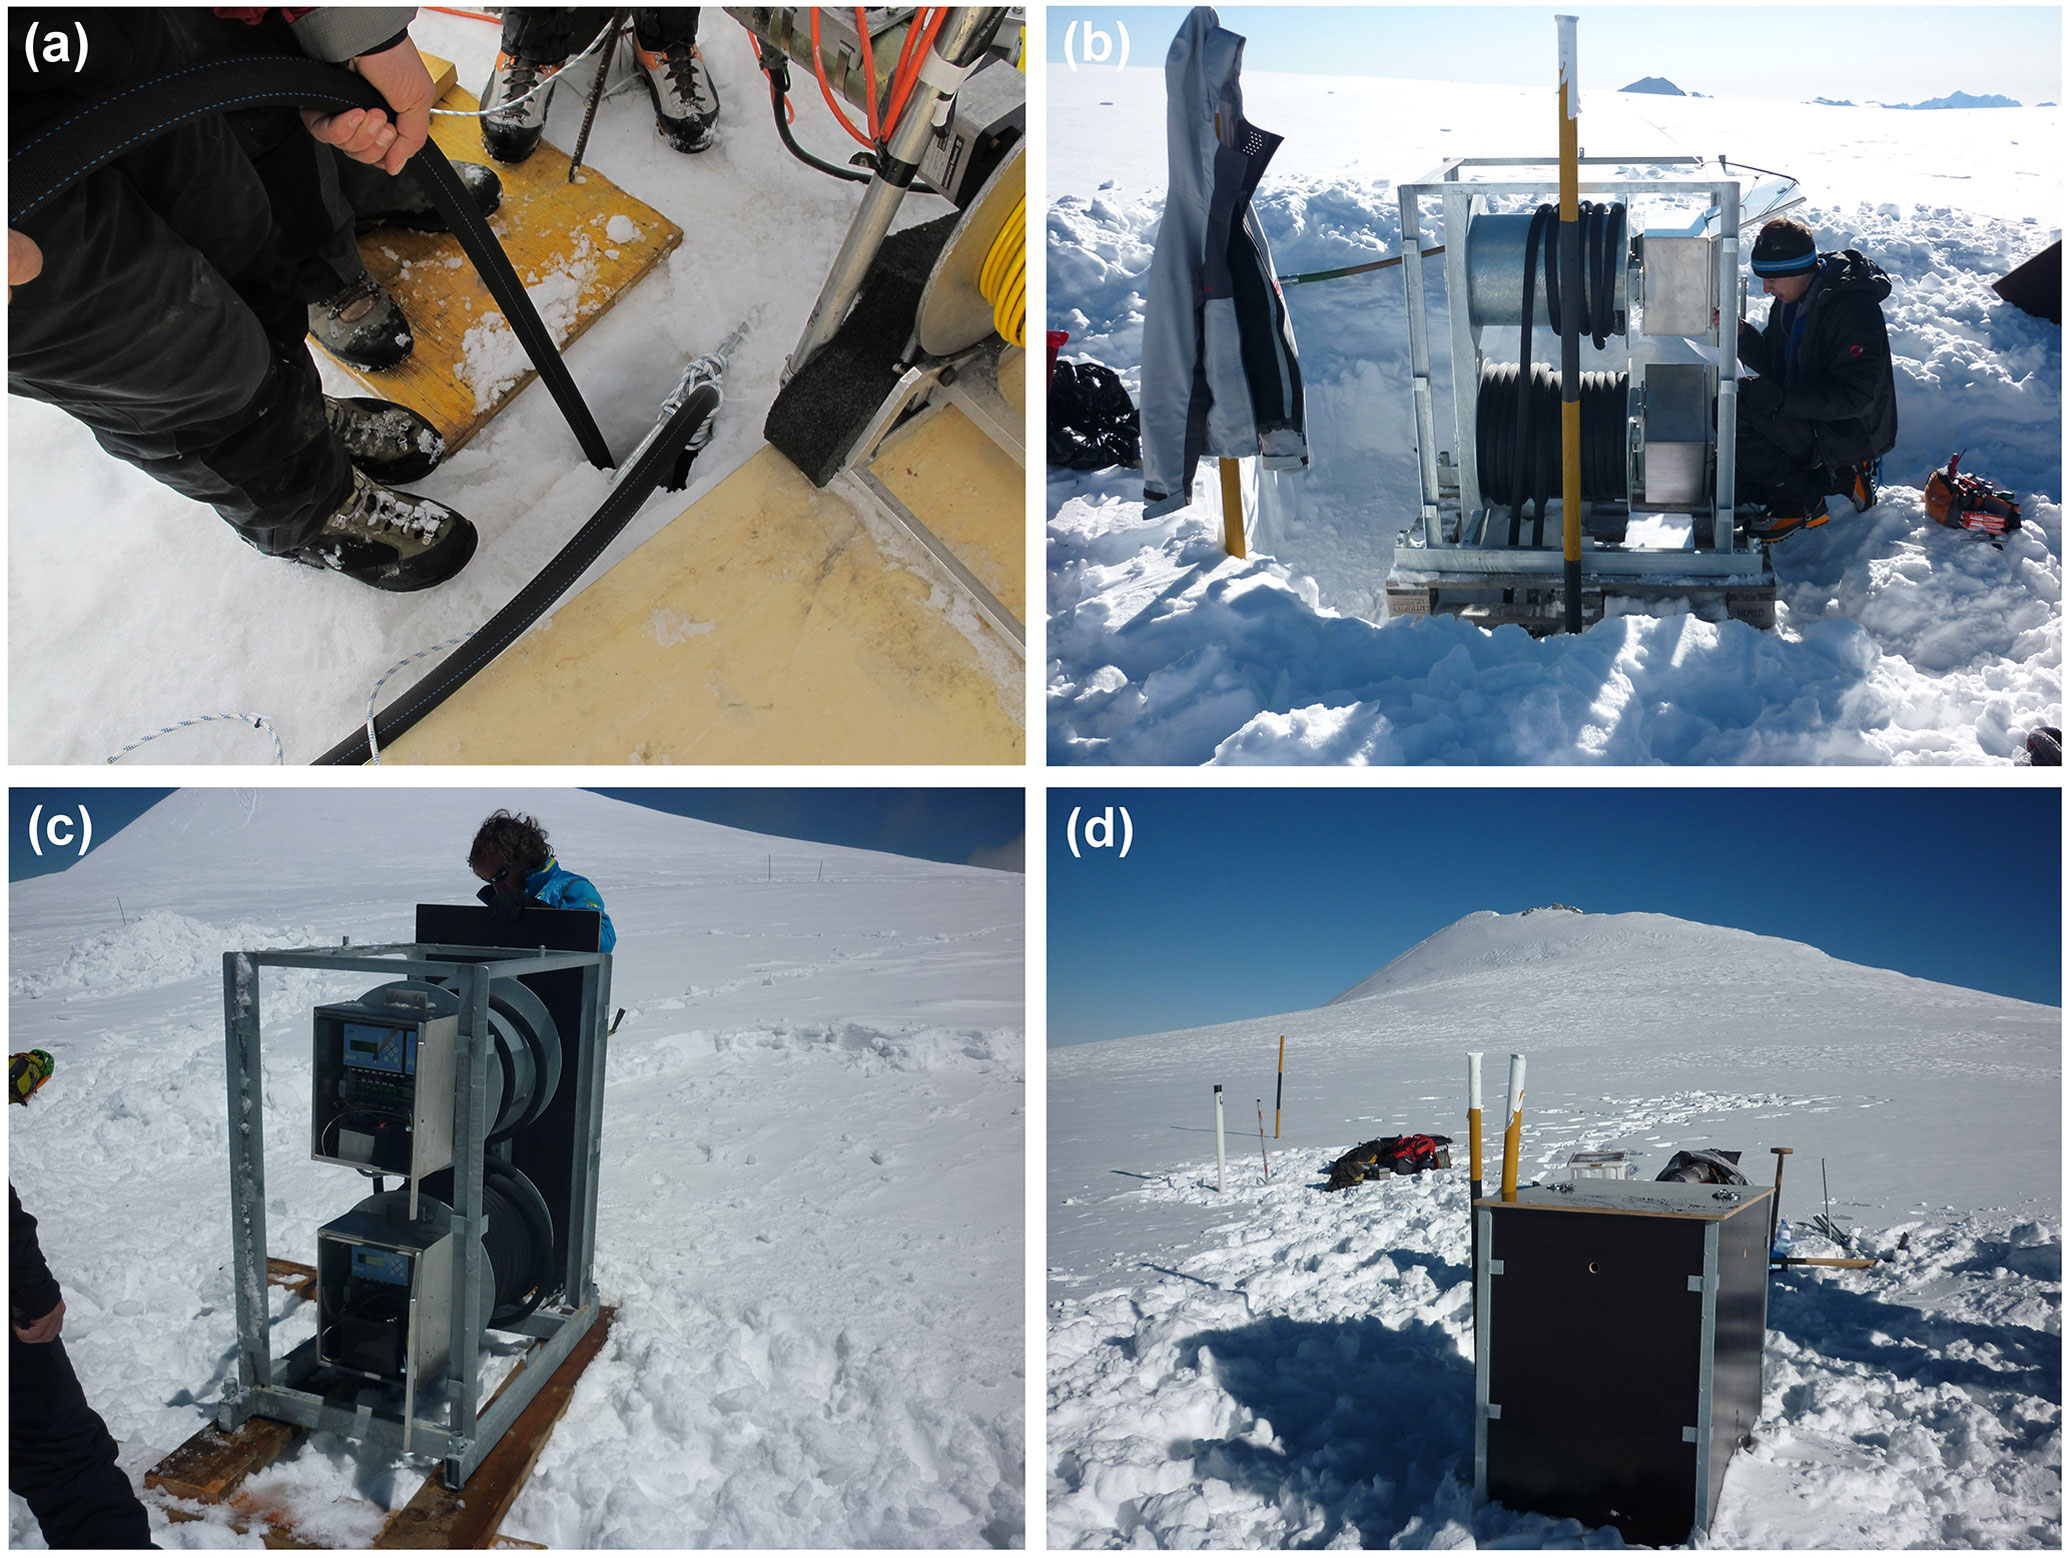
Figure G3(a) Lowering of a thermistor string into borehole no. 3 at the drilling site. (b) The winding systems of the two thermistor strings installed at the drilling site. (c) The two metal boxes containing the thermistor string data loggers and the batteries. (d) Final arrangement of the box, housing the winding systems and the data loggers. The summit of Mt Ortles is visible in the background. Photos taken on 17 November 2011.
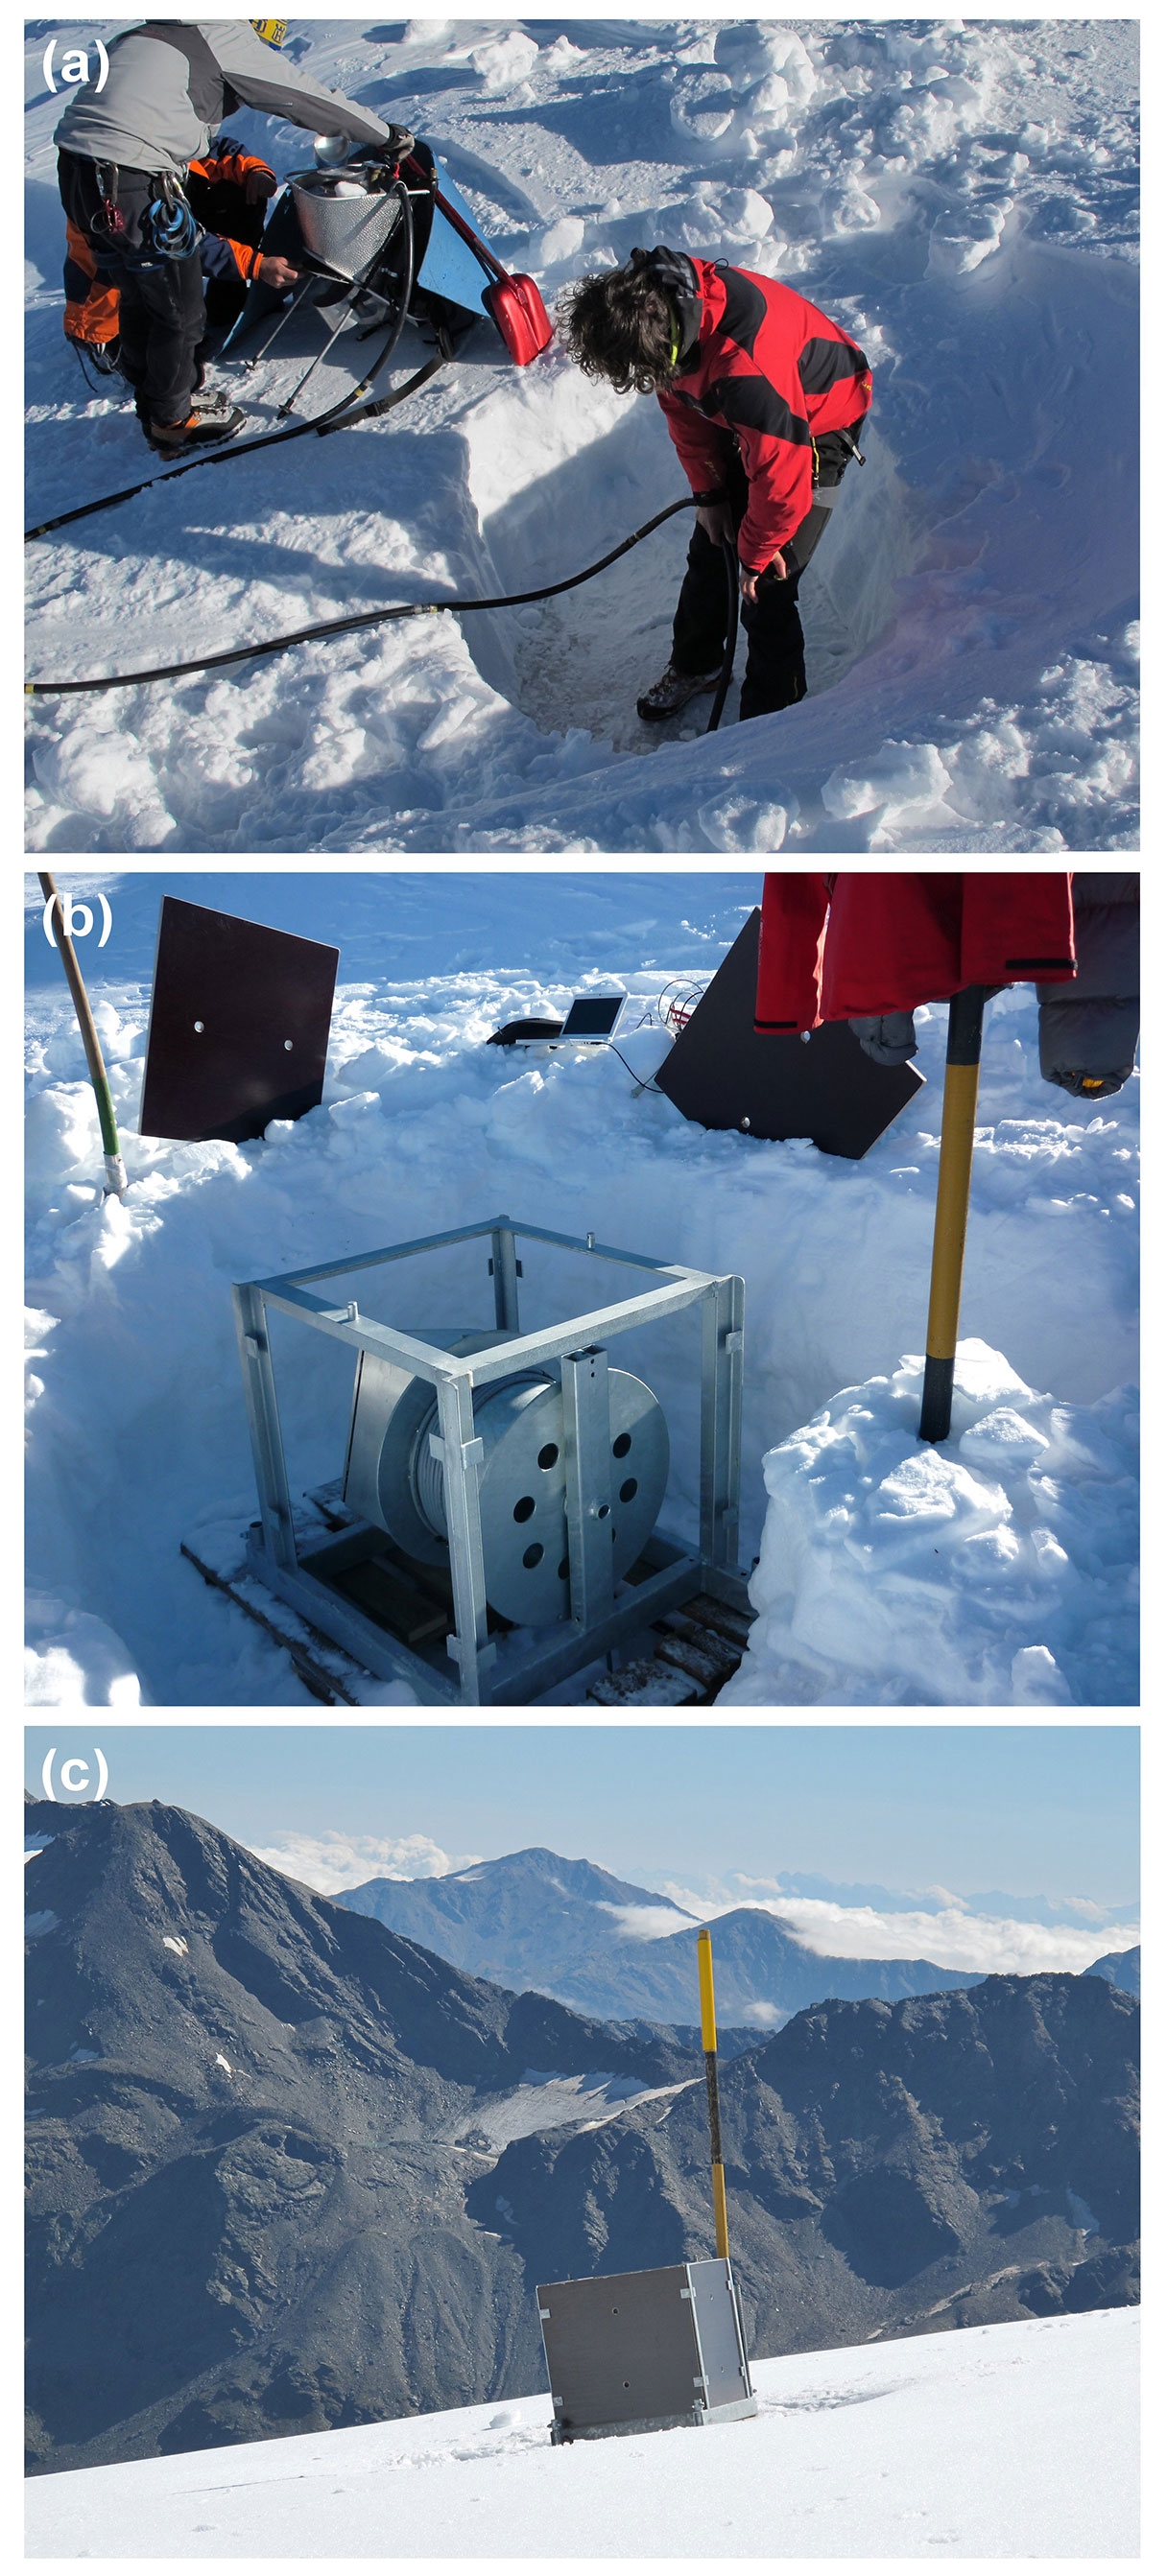
Figure G4(a) Borehole drilling at Hintergrat Glacier using a steam ice drill. (b) The box containing the winding system, the thermistor string data logger and the batteries. (c) Final arrangement of the box housing the winding systems and the data logger. Photos taken on 17 November 2011 and 27 August 2015.
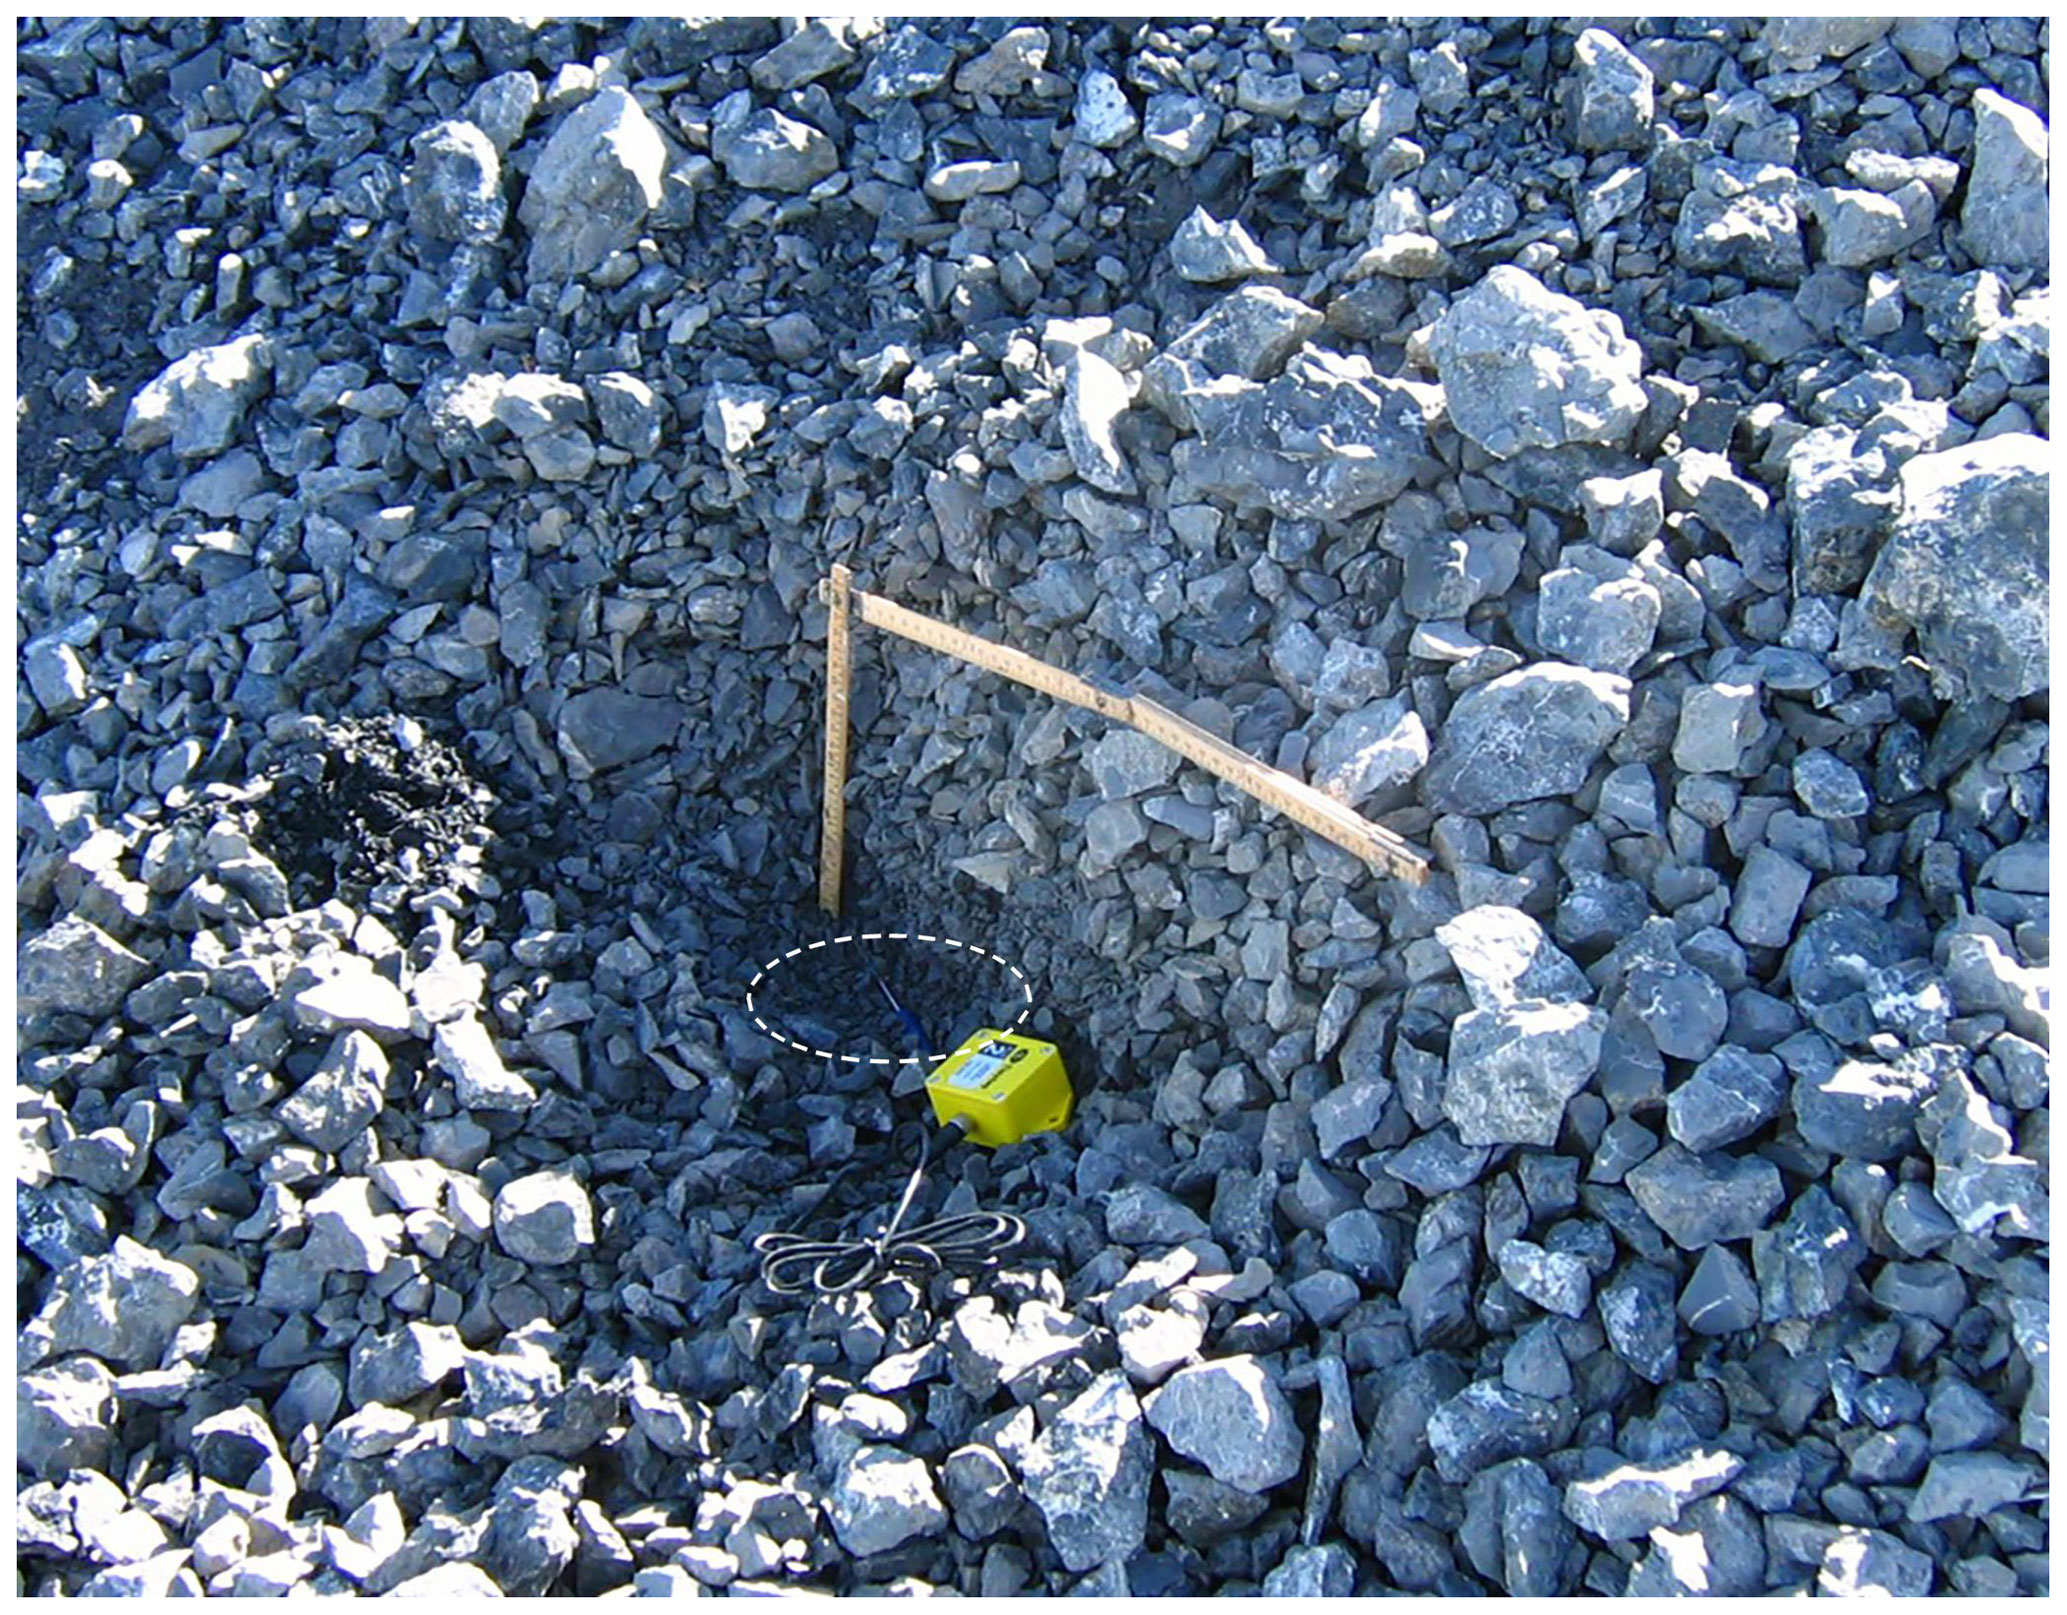
Figure H1The soil surface temperature data logger (Gemini TGP-4020) installed at the ORTL_05 site, close to the Lombardi bivouac. The white ellipse indicates the PB-5001 external probe placed underneath the debris surface. Photo taken on 2 September 2010.
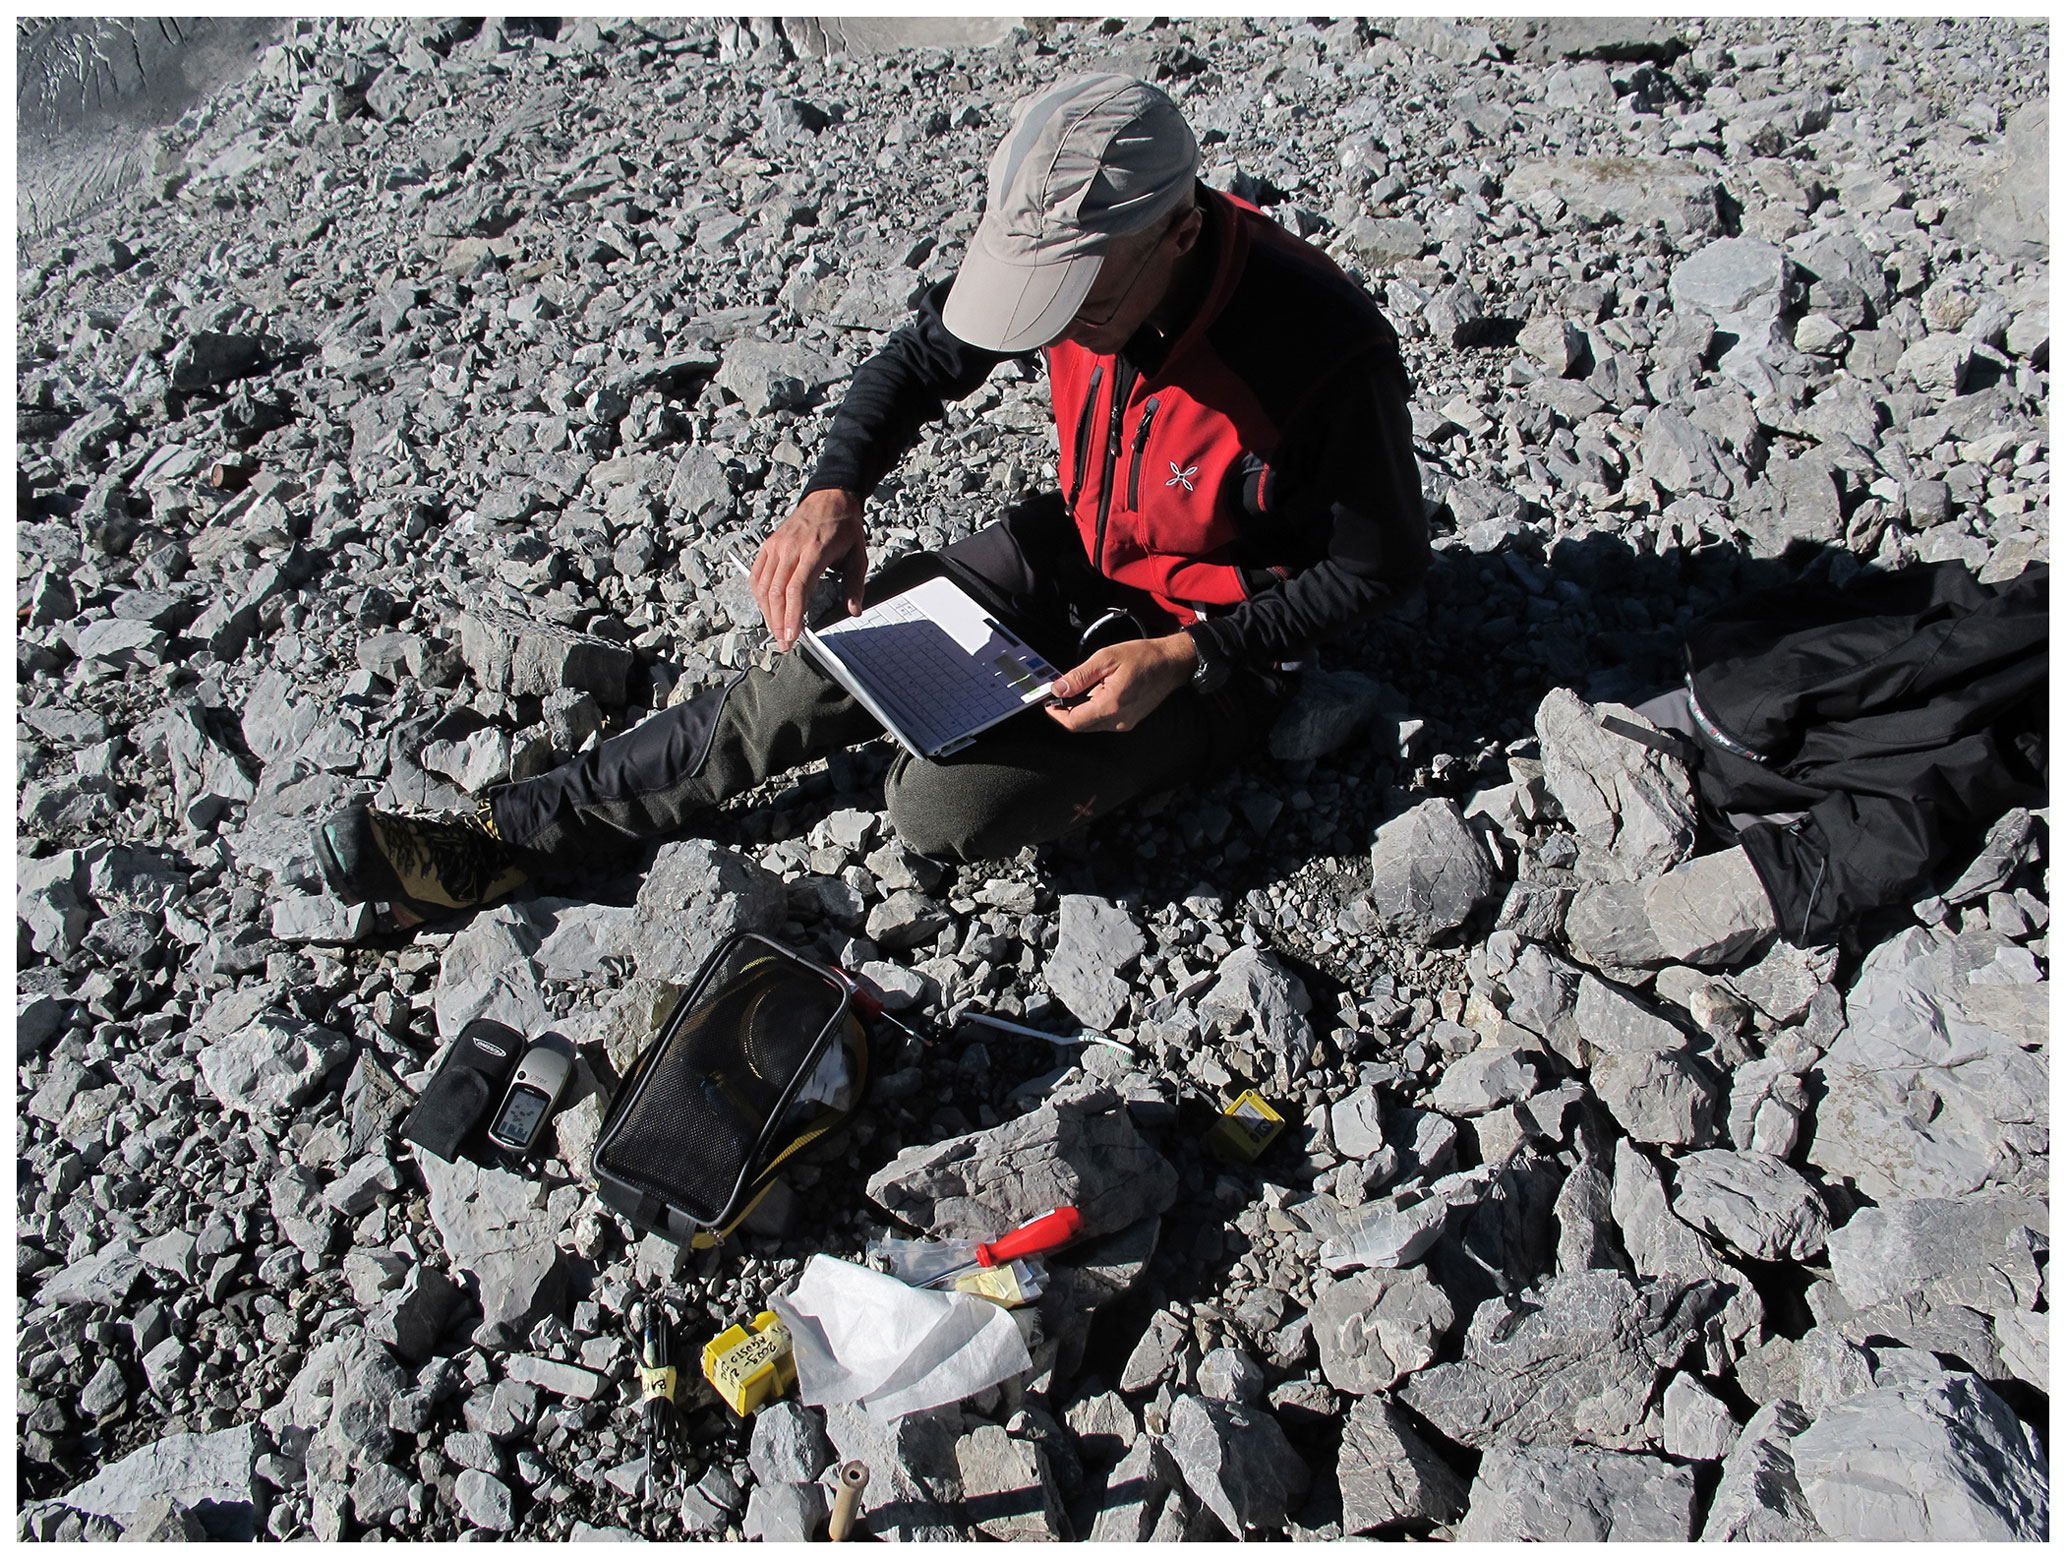
Figure H2Data download and logger maintenance at the ORTL_10 soil surface temperature site on 28 August 2012.
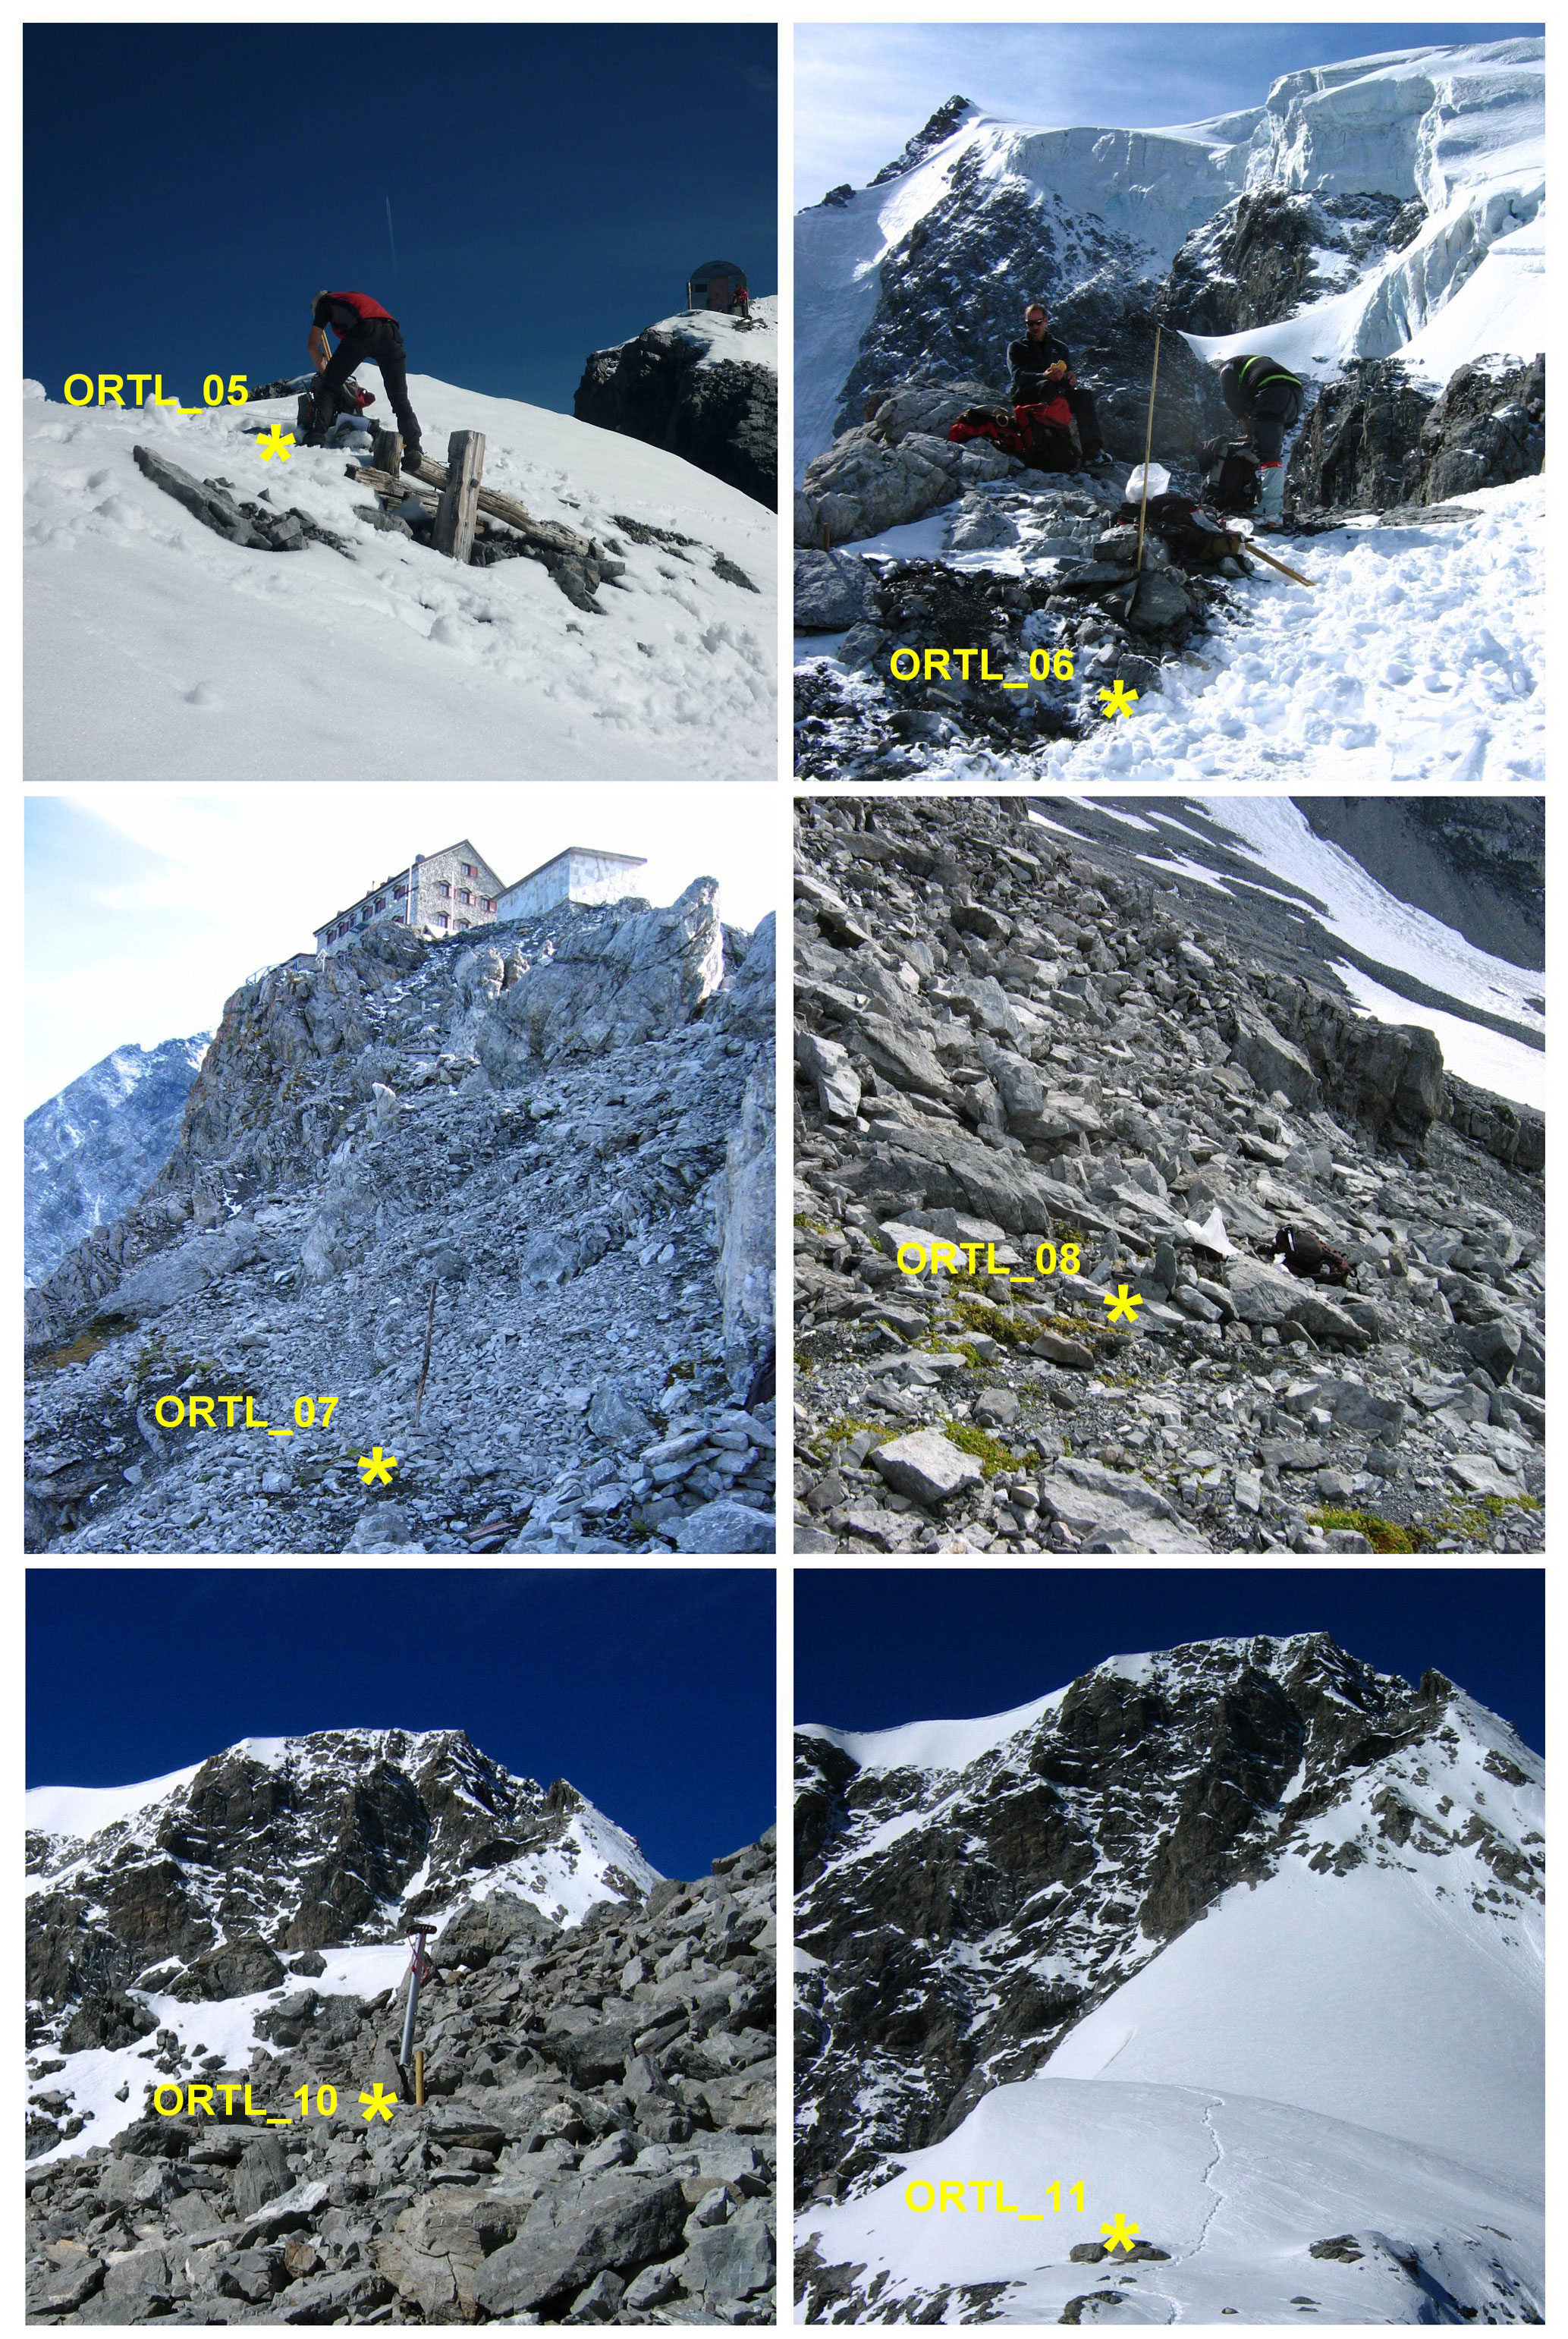
Figure H3Locations of the six sites equipped with data loggers for soil surface temperature measurements on Mt Ortles.
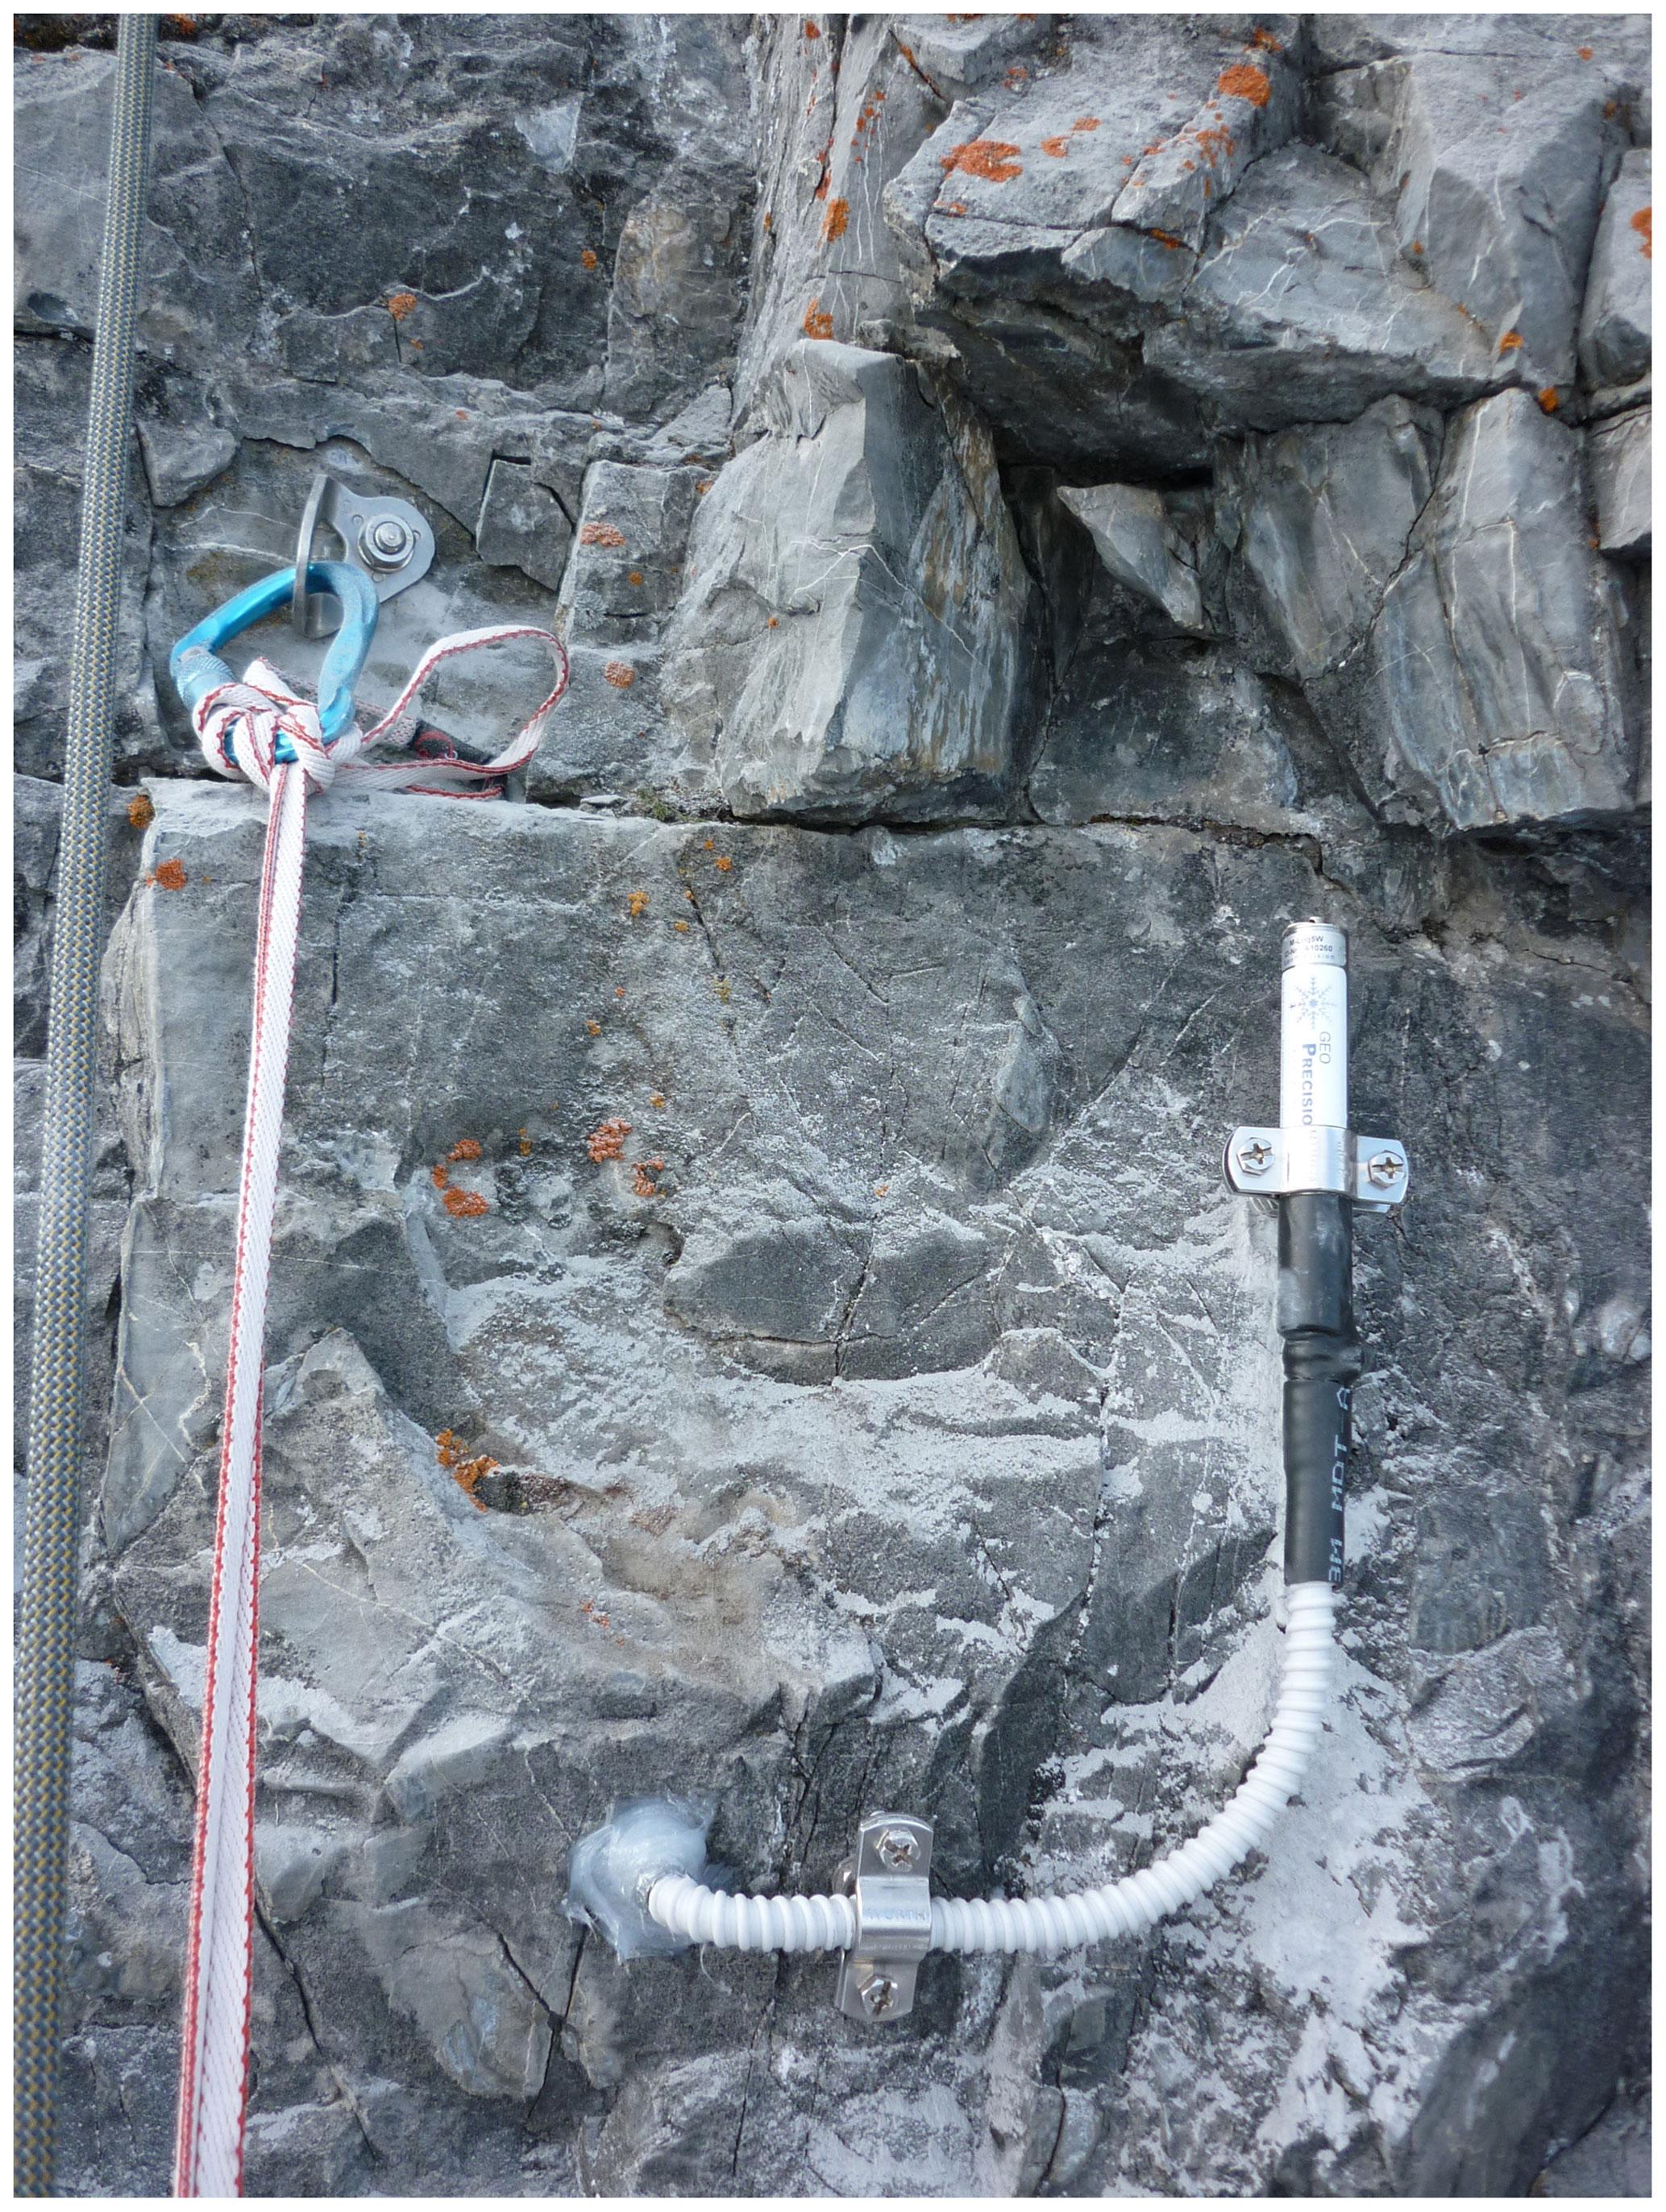
Figure I1The rock wall temperature data logger (Geoprecision thermistor string) installed close to the Payer refuge. The data logger is anchored to the rock wall and is connected to three temperature sensors placed at 0.1, 0.3 and 0.55 m depth inside a horizontal hole drilled into the rock wall. Photo taken on 28 November 2011.
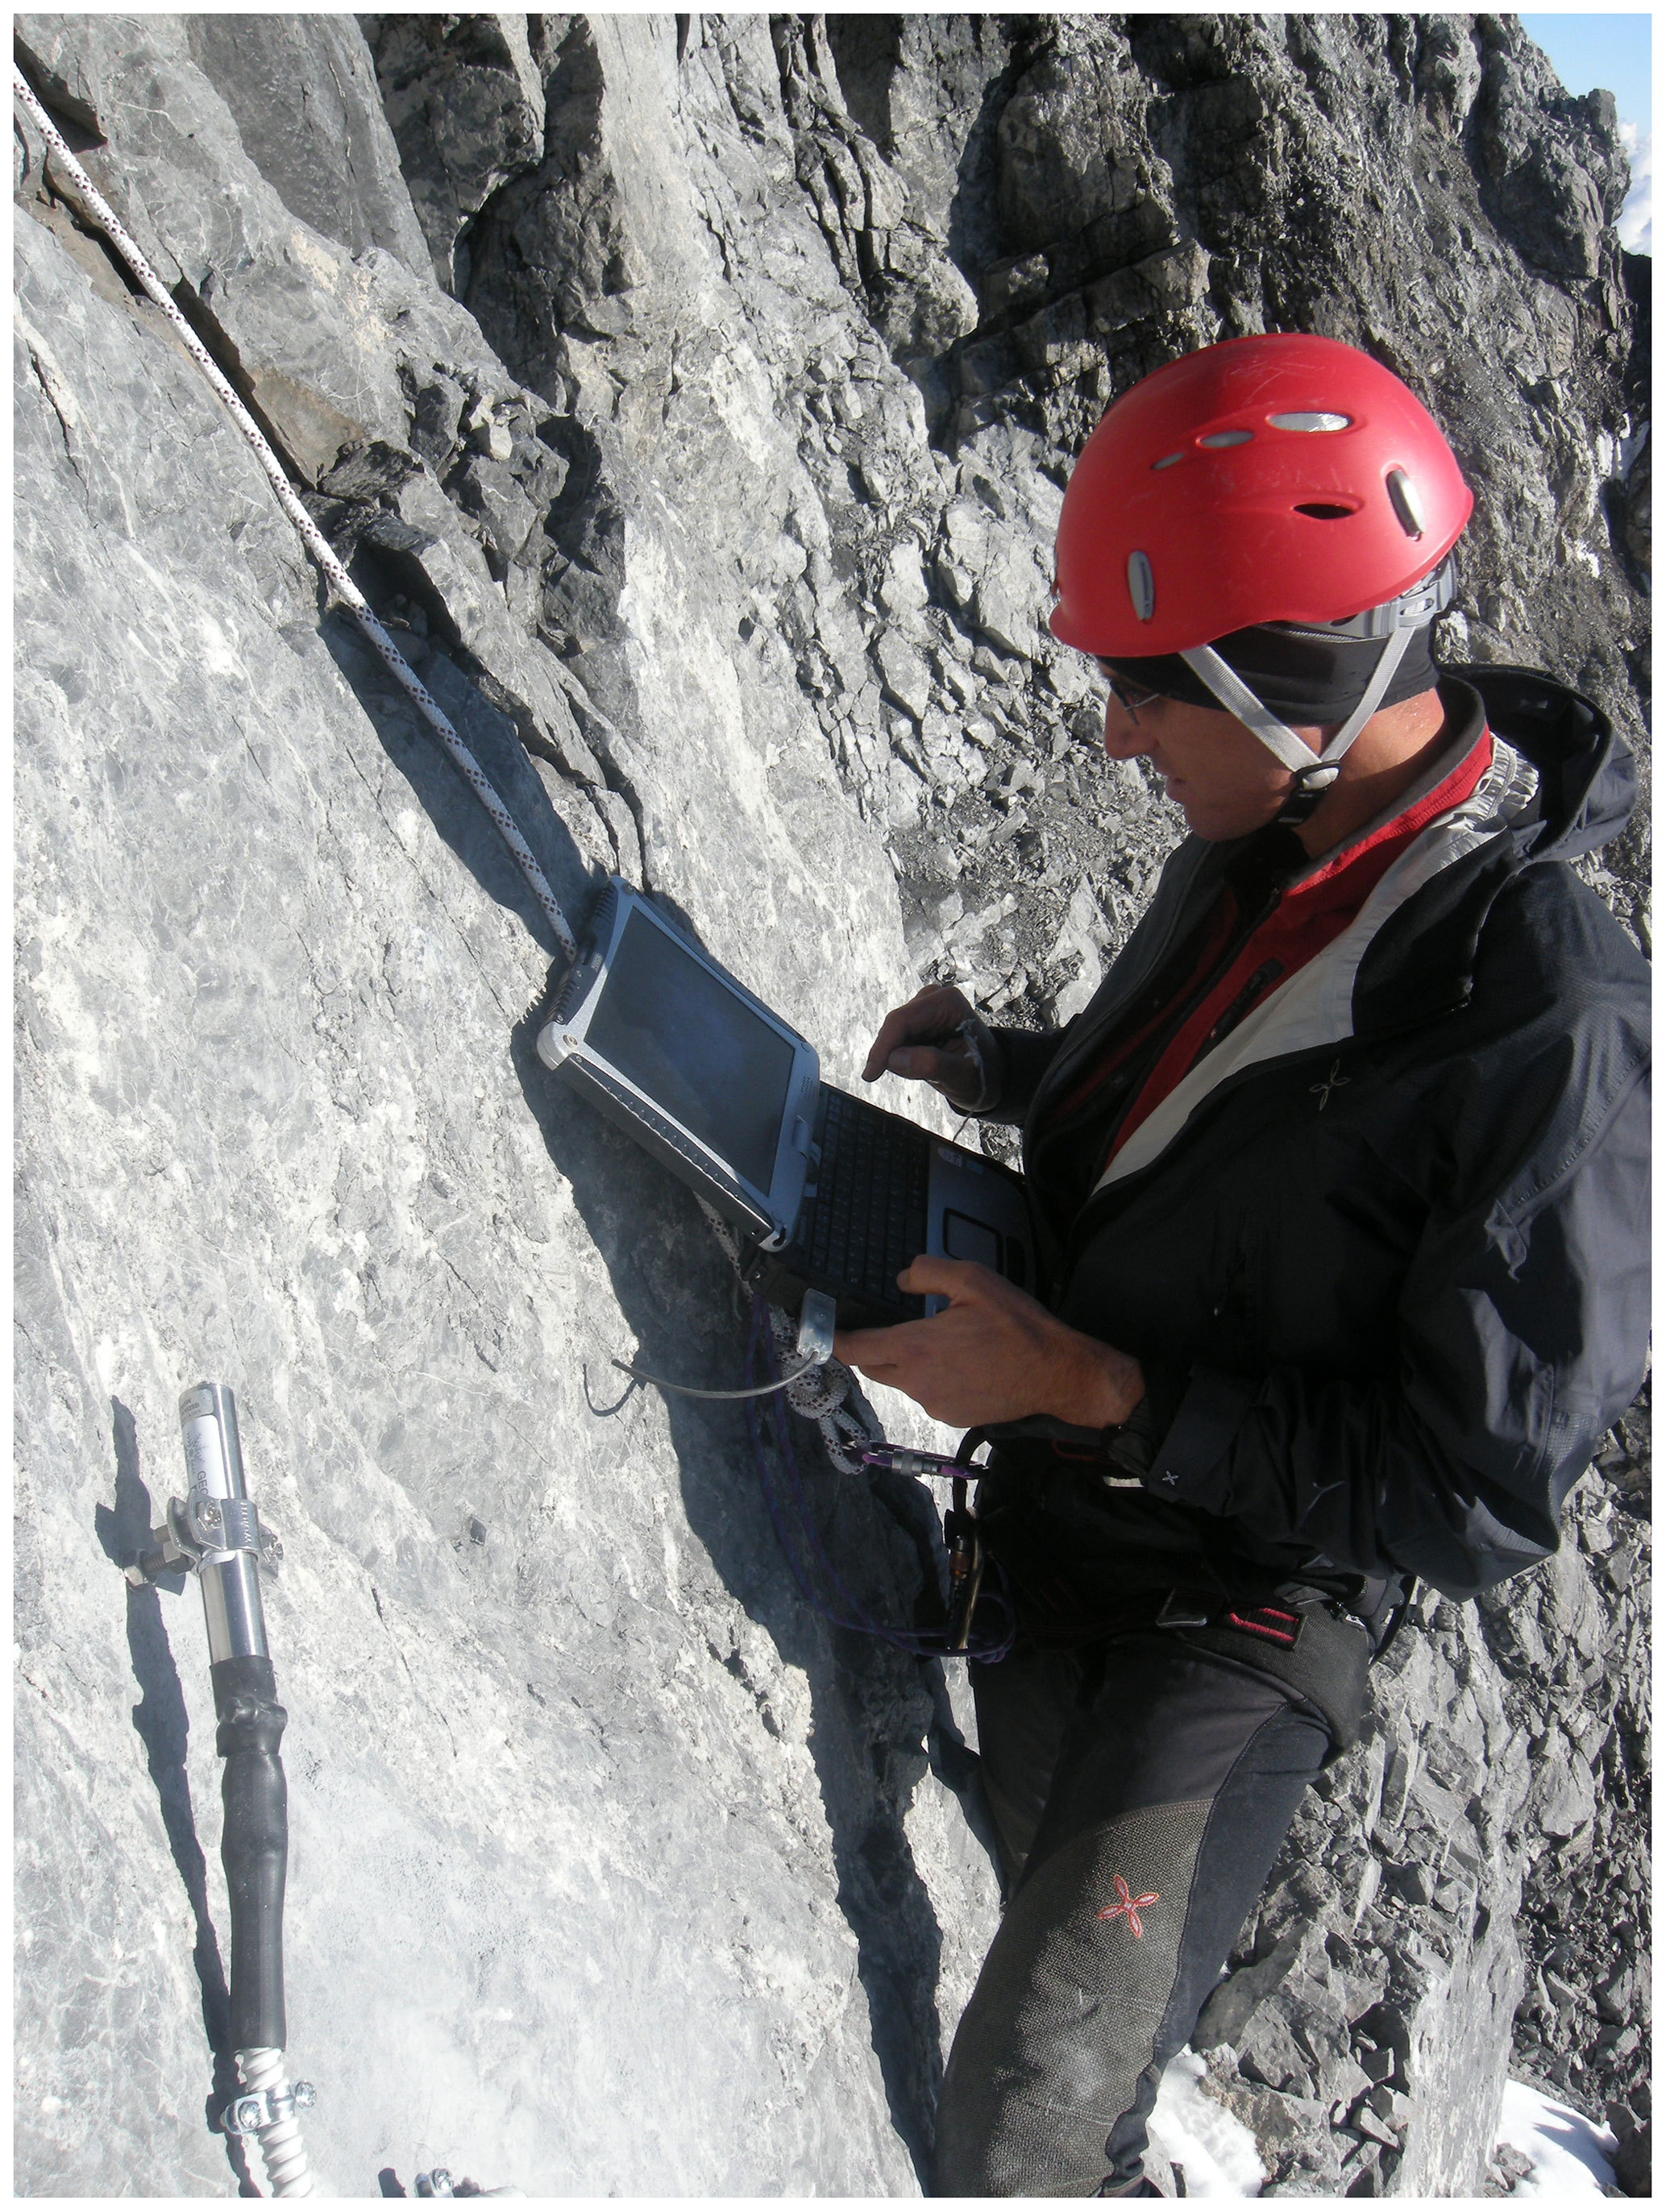
Figure I2Launching of the CIMA_ALTO data logger. A wireless USB dongle handles the wireless connection to the laptop used for launching the logger and for downloading the temperature data. Photo taken on 30 August 2011.
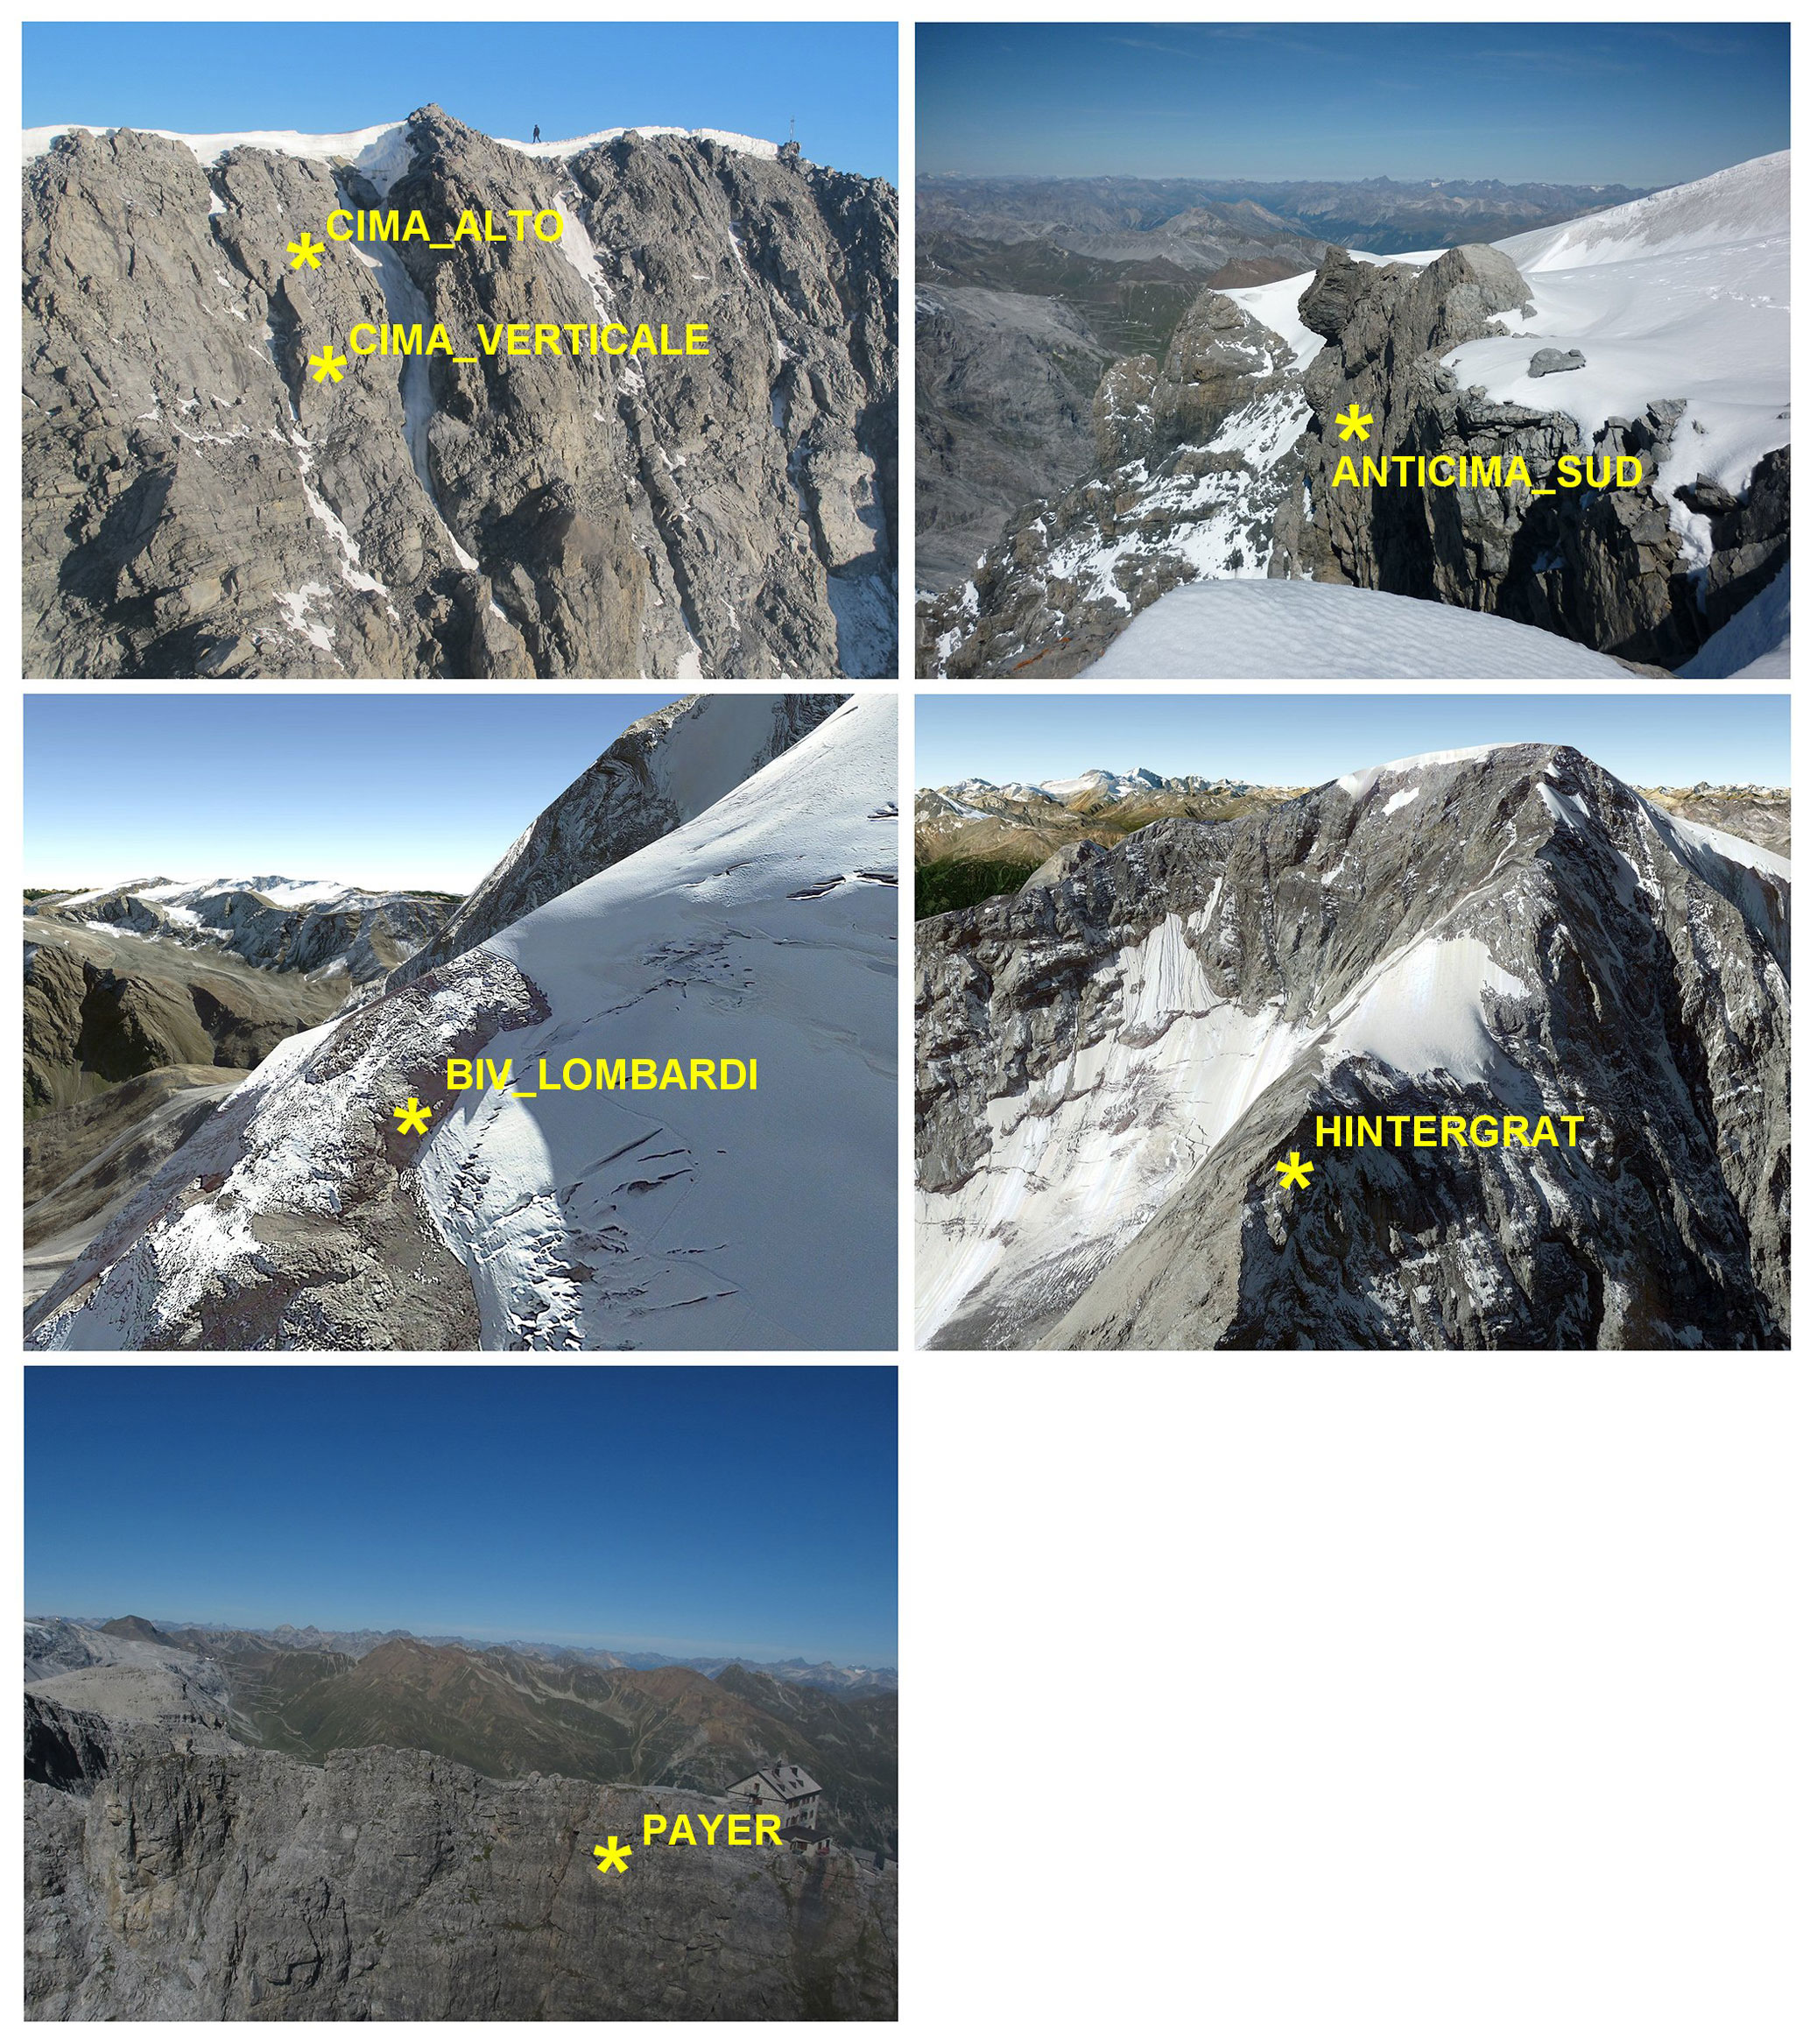
Figure I3Locations of the six sites equipped with data loggers for rock wall temperature measurements on Mt Ortles (BIV_LOMBARDI and HINTERGRAT © Google Earth Pro 7.3 2022).
Conceptualization: PG, RD, LC, RS, VM, DT; data curation: LC, FDB, GD, PG, RS, VM, DT, TZ, TLZ; funding acquisition: PG, RD, GDF; validation: LC, FDB, RS, TLZ; writing (original draft preparation): LC, PG, RS, TLZ; writing (review and editing): LC, FDB, RD, GD, PG, VM, RS, DT, TZ, TLZ, GDF.
The contact author has declared that none of the authors has any competing interests.
Publisher's note: Copernicus Publications remains neutral with regard to jurisdictional claims made in the text, published maps, institutional affiliations, or any other geographical representation in this paper. While Copernicus Publications makes every effort to include appropriate place names, the final responsibility lies with the authors.
This work is a contribution to the Ortles Project, a programme supported by two US National Science Foundation awards (nos. 1060115 and 1461422) to The Ohio State University and by the Ripartizione Protezione Antincendi e Civile of the Autonomous Province of Bolzano in collaboration with the Ripartizione Opere idrauliche e Ripartizione Foreste of the Autonomous Province of Bolzano and Stelvio National Park. This is Ortles Project publication 11 (http://www.ortles.org, last access: 10 October 2023). The research was funded by the Italian MIUR Project (PRIN 2010-11), “Response of morphoclimatic system dynamics to global changes and related geomorphological hazards” (local and national coordinators are Giancarlo Dalla Fontana and Carlo Baroni).
The authors wish to thank Henry Brecher for the formal editing of the original draft as well as the editor and two anonymous reviewers for their comments and suggestions. The authors are grateful to all the students, technicians and scientists who contributed to the field activities in the period from 2009 to 2016; the alpine guides of the Alpinschule of Solda; the helicopter companies Airway, Air Service Center, Star Work Sky; and the Hotel Franzenshöhe for logistical support.
The authors acknowledge the support of Vinicio Carraro (TeSAF, department of the University of Padua) for the setup of the automatic weather station and of Umberto Morra di Cella and Paolo Pogliotti (ARPA Val d'Aosta) for the setup of the rock wall temperature data loggers. The soil surface temperature measured on Mt Vioz were kindly provided by the Servizio Geologico of the Autonomous Province of Trento (Matteo Zumiani).
This research has been supported by the US National Science Foundation (grant nos. 1060115 and 1461422).
This paper was edited by James Thornton and reviewed by two anonymous referees.
Ballantyne, C. K.: Periglacial geomorphology, John Wiley & Sons Ltd., Hoboken, NJ, USA, 472 pp., ISBN 978-1-405-10006-9, 2018.
Boeckli, L., Brenning, A., Gruber, S., and Noetzli, J.: Permafrost distribution in the European Alps: calculation and evaluation of an index map and summary statistics, The Cryosphere, 6, 807–820, https://doi.org/10.5194/tc-6-807-2012, 2012.
Bohleber, P., Wagenbach, D., Schöner, W., and Böhm, R.: To what extent do water isotope records from low accumulation Alpine ice cores reproduce instrumental temperature series?, Tellus B, 65, 1–17, https://doi.org/10.3402/tellusb.v65i0.20148, 2013.
Braithwaite, R. J., Zhang, Y., and Raper, S. C. B.: Temperature sensitivity of the mass balance of mountain glaciers and icecaps as a climatological characteristic, Z. Gletsch. Glazialgeol., 38, 35–61, 2002.
Carturan, L.: Climate change effects on the cryosphere and hydrology of a high-altitude watershed, PhD thesis, TeSAF – University of Padua, 187 pp., 2010.
Carturan, L., Cazorzi, F., and Dalla Fontana, G.: Distributed mass-balance modelling on two neighbouring glaciers in Ortles-Cevedale Italy, from 2004 to 2009, J. Glaciol., 58, 467–486, https://doi.org/10.3189/2012JoG11J111, 2012a.
Carturan, L., Dalla Fontana, G., and Borga, M.: Estimation of winter precipitation in a high-altitude catchment of the Eastern Italian Alps: Validation by means of glacier mass balance observations, Geogr. Fis. Din. Quat., 35, 37–48, https://doi.org/10.4461/GFDQ.2012.35.4, 2012b.
Carturan, L., Filippi, R., Seppi, R., Gabrielli, P., Notarnicola, C., Bertoldi, L., Paul, F., Rastner, P., Cazorzi, F., Dinale, R., and Dalla Fontana, G.: Area and volume loss of the glaciers in the Ortles-Cevedale group (Eastern Italian Alps): controls and imbalance of the remaining glaciers, The Cryosphere, 7, 1339–1359, https://doi.org/10.5194/tc-7-1339-2013, 2013.
Carturan, L., Cazorzi, F., De Blasi, F., and Dalla Fontana, G.: Air temperature variability over three glaciers in the Ortles–Cevedale (Italian Alps): effects of glacier fragmentation, comparison of calculation methods, and impacts on mass balance modeling, The Cryosphere, 9, 1129–1146, https://doi.org/10.5194/tc-9-1129-2015, 2015.
Carturan, L., De Blasi, F., Dinale, R., Dragà, G., Gabrielli, P., Mair, V., Seppi, R., Tonidandel, D., Zanoner, T., Zendrini, T. L., and Dalla Fontana, G.: Data from air, englacial and permafrost temperature measurements on Mt. Ortles (Eastern European Alps) (Version 2.0), Zenodo [data set], https://doi.org/10.5281/zenodo.8330289, 2023.
Charbonneau, R., Lardeau, J. P., and Obled, C.: Problems of modelling a high mountainous drainage basin with predominant snow yields, Hydrol. Sci. B., 26, 345–361, https://doi.org/10.1080/02626668109490899, 1981.
Cicoira, A., Beutel, J., Faillettaz, J., Gärtner-Roer, I., and Vieli, A.: Resolving the influence of temperature forcing through heat conduction on rock glacier dynamics: a numerical modelling approach, The Cryosphere, 13, 927–942, https://doi.org/10.5194/tc-13-927-2019, 2019.
Deline, P., Gruber, S., Delaloye, R., Fischer, L., Geertsema, M., Giardino, M., Hasler, A., Kirkbride, M., Krautblatter, M., Magnin, F., McColl, S., Ravanel, L., and Schoeneich, P.: Ice Loss and Slope Stability in High-Mountain Regions, Snow and Ice-Related Hazards, Risks, and Disasters, Academic Press, 521–561, https://doi.org/10.1016/B978-0-12-394849-6.00015-9, 2015.
Gabrielli, P., Carturan, L., Gabrieli, J., Dinale, R., Krainer, K., Hausmann, H., Davis, M., Zagorodnov, V., Seppi, R., Barbante, C., Fontana, G. D., and Thompson, L. G.: Atmospheric warming threatens the untapped glacial archive of Ortles mountain, South Tyrol, J. Glaciol,, 56, 843–853, https://doi.org/10.3189/002214310794457263, 2010.
Gabrielli, P., Barbante, C., Carturan, L., Cozzi, G., Fontana, G. D., Dinale, R., Dragà, G., Gabrieli, J., Kehrwald, N., Mair, V., Thompson, L. G., and Tonidandel, D.: Discovery of cold ice in a new drilling site in the eastern European Alps, Geogr. Fis. Din. Quat., 35, 101–105, https://doi.org/10.4461/GFDQ.2012.35.10, 2012.
Gabrielli, P., Barbante, C., Bertagna, G., Bertó, M., Binder, D., Carton, A., Carturan, L., Cazorzi, F., Cozzi, G., Dalla Fontana, G., Davis, M., De Blasi, F., Dinale, R., Dragà, G., Dreossi, G., Festi, D., Frezzotti, M., Gabrieli, J., Galos, S. P., Ginot, P., Heidenwolf, P., Jenk, T. M., Kehrwald, N., Kenny, D., Magand, O., Mair, V., Mikhalenko, V., Lin, P. N., Oeggl, K., Piffer, G., Rinaldi, M., Schotterer, U., Schwikowski, M., Seppi, R., Spolaor, A., Stenni, B., Tonidandel, D., Uglietti, C., Zagorodnov, V., Zanoner, T., and Zennaro, P.: Age of the Mt. Ortles ice cores, the Tyrolean Iceman and glaciation of the highest summit of South Tyrol since the Northern Hemisphere Climatic Optimum, The Cryosphere, 10, 2779–2797, https://doi.org/10.5194/tc-10-2779-2016, 2016.
Guglielmin, M., Aldighieri, B., and Testa, B.: PERMACLIM: A model for the distribution of mountain permafrost, based on climatic observations, Geomorphology, 51, 245–257, https://doi.org/10.1016/S0169-555X(02)00221-0, 2003.
Harris, C., Arenson, L. U., Christiansen, H. H., Etzelmüller, B., Frauenfelder, R., Gruber, S., Haeberli, W., Hauck, C., Hölzle, M., Humlum, O., Springman, S. M., and Vonder Mühll, D.: Permafrost and climate in Europe: Monitoring and modelling thermal, geomorphological and geotechnical responses, Earth Sci. Rev., 92, 117–171, https://doi.org/10.1016/j.earscirev.2008.12.002, 2009.
Huggel, C., Carey, M., Clague, J. J., and Kääb, A.: The high-mountain cryosphere: Environmental changes and human risks, Cambridge University Press, 1–371, https://doi.org/10.1017/CBO9781107588653, 2015.
Irvine-Fynn, T. and Hubbard, B.: Glacier Hydrology and Runoff, In International Encyclopedia of Geography: People, the Earth, Environment and Technology, Elsevier, https://doi.org/10.1002/9781118786352.wbieg0709, 2017.
Kinnard, C., Larouche, O., Demuth, M. N., and Menounos, B.: Modelling glacier mass balance and climate sensitivity in the context of sparse observations: application to Saskatchewan Glacier, western Canada, The Cryosphere, 16, 3071–3099, https://doi.org/10.5194/tc-16-3071-2022, 2022.
Knight, J. and Harrison, S.: The sensitivity and evolutionary trajectory of the mountain cryosphere: Implications for mountain geomorphic systems and hazards, Land Degrad. Dev., 34, 2464–2482, https://doi.org/10.1002/ldr.4630, 2023.
Langsdorf, S., Löschke, S., Möller, V., Okem, A., Officer, S., Rama, B., Belling, D., Dieck, W., Götze, S., Kersher, T., Mangele, P., Maus, B., Mühle, A., Nabiyeva, K., Nicolai, M., Niebuhr, A., Petzold, J., Prentzler, E., Savolainen, J., Scheuffele, H., Weisfeld, S., Weyer, N., Pörtner, H.-O., Roberts, D. C., Tignor, M., Poloczanska, E. S., Mintenbeck, K., Alegría, A., Craig, M., Langsdorf, S., Löschke, S., Möller, V., Okem, A., and Rama, B.: IPCC, 2022: Climate Change 2022: Impacts, Adaptation and Vulnerability. Working Group II Contribution to the Sixth Assessment Report of the Intergovernmental Panel on Climate Change, Cambridge University Press, Cambridge, UK and New York, NY, USA, 3056 pp., https://doi.org/10.1017/9781009325844, 2022.
Machguth, H., Purves, R. S., Oerlemans, J., Hoelzle, M., and Paul, F.: Exploring uncertainty in glacier mass balance modelling with Monte Carlo simulation, The Cryosphere, 2, 191–204, https://doi.org/10.5194/tc-2-191-2008, 2008.
Montrasio, A., Berra, F., Cariboni, M., Ceriani, M., Deichmann, N., Ferliga, C., Gregnanin, A., Guerra, S., Guglielmin, M., Jadoul, F., Longhin, M., Mair, V., Mazzoccola, D., Sciesa, E., and Zappone, A.: Note illustrative della Carta Geologica d'Italia – Foglio 024 Bormio, ISPRA, Roma, Italy, 16–26 pp., 2012.
Pepin, N., Bradley, R. S., Diaz, H. F., Baraer, M., Caceres, E. B., Forsythe, N., Fowler, H., Greenwood, G., Hashmi, M. Z., Liu, X. D., Williamson, S. N., and Yang, D. Q.: Elevation-dependent warming in mountain regions of the world, Nat. Clim. Change, 5, 424–430, https://doi.org/10.1038/nclimate2563, 2015.
Pepin, N. C., Arnone, E., Gobiet, A., Haslinger, K., Kotlarski, S., Notarnicola, C., Palazzi, E., Seibert, P., Serafin, S., Schöner, W., Terzago, S., Thornton, J. M., Vuille, M., and Adler, C.: Climate Changes and Their Elevational Patterns in the Mountains of the World, Rev. Geophys., 60, e2020RG000730, https://doi.org/10.1029/2020RG000730, 2022.
Rathore, N., Thakur, D., and Chawla, A.: Seasonal variations coupled with elevation gradient drives significant changes in eco-physiological and biogeochemical traits of a high altitude evergreen broadleaf shrub, Rhododendron anthopogon, Plant Physiol. Bioch., 132, 708–719, https://doi.org/10.1016/J.PLAPHY.2018.08.009, 2018.
Shaw, T. E., Buri, P., McCarthy, M., Miles, E. S., Ayala, Á., and Pellicciotti, F.: The Decaying Near-Surface Boundary Layer of a Retreating Alpine Glacier, Geophys. Res. Lett., 50, e2023GL103043, https://doi.org/10.1029/2023gl103043, 2023.
Troxler, P., Ayala, Á., Shaw, T. E., Nolan, M., Brock, B. W., and Pellicciotti, F.: Modelling spatial patterns of near-surface air temperature over a decade of melt seasons on McCall Glacier, Alaska, J. Glaciol., 1–15, 386–400, https://doi.org/10.1017/jog.2020.12, 2020.
World Meteorological Organization (WMO): Guide to Instruments and Methods of Observation, Volume I, Measurement of Meteorological Variables (WMO No. 8), Geneva, Switzerland, 2021.
Zolles, T., Maussion, F., Galos, S. P., Gurgiser, W., and Nicholson, L.: Robust uncertainty assessment of the spatio-temporal transferability of glacier mass and energy balance models, The Cryosphere, 13, 469–489, https://doi.org/10.5194/tc-13-469-2019, 2019.
- Abstract
- Introduction
- Site description
- Data description
- Data quality control and assessment
- Data availability
- Summary of observations and research outlook
- Appendix A: Variables in data files
- Appendix B: Quality flags for data files
- Appendix C: Data files structure
- Appendix D: Maintenance logs
- Appendix E: Characteristics of measurement sites
- Appendix F: Description of the measuring equipment for air temperature
- Appendix G: Description of the measuring equipment for englacial temperature
- Appendix H: Description of the measuring equipment for soil surface temperature
- Appendix I: Description of the measuring equipment for rock wall temperature
- Author contributions
- Competing interests
- Disclaimer
- Acknowledgements
- Financial support
- Review statement
- References