the Creative Commons Attribution 4.0 License.
the Creative Commons Attribution 4.0 License.
 | 12 Oct 2023
A database of aircraft measurements of carbon monoxide (CO) with high temporal and spatial resolution during 2011–2021
Chaoyang Xue
Gisèle Krysztofiak
Vanessa Brocchi
Stéphane Chevrier
Michel Chartier
Patrick Jacquet
Claude Robert
Valéry Catoire
To understand tropospheric air pollution at regional and global scales, the SPIRIT (SPectromètre Infra-Rouge In situ Toute altitude) airborne instrument was developed and used on aircraft to measure volume mixing ratios of carbon monoxide (CO), an important indicator of air pollution, during the last decade. SPIRIT provides high-quality CO measurements with 1σ precision of 0.3 ppbv at a time resolution of 1.6 s thanks to the coupling of a quantum cascade laser to a Robert optical multi-pass cell. It can be operated on different aircraft such as Falcon-20 and ATR-42 from the German Aerospace Agency (DLR) and from SAFIRE (CNRS-CNES-Météo France). With support from various projects, measurements were taken for more than 200 flight hours over three continents (Europe, Asia, and Africa), including two intercontinental transects (Europe–Asia and Europe–Africa). Levels of CO and its spatial distribution are briefly discussed and compared between different regions/continents. CO generally decreases with altitude except in some cases, indicating the important contribution of long-distance transport to CO levels. A 3D trajectory mapped by CO level was plotted for each flight and is presented in this study (which includes a Supplement). The database is archived in the AERIS database (https://doi.org/10.25326/440), the French national center for atmospheric observations (Catoire et al., 2023). In addition, it could help to validate model performance and satellite measurements. For instance, the database covers measurements at high-latitude regions (i.e., Kiruna, Sweden, 68∘ N), where satellite measurements are still challenging, and at low-latitude regions (West Africa and Southeast Asia), where in situ data are scarce and satellites need more validation by airborne measurements.
- Article
(24526 KB) - Full-text XML
-
Supplement
(5175 KB) - BibTeX
- EndNote


The study of atmospheric composition has been widely conducted and understood through comprehensive field campaigns and ground level air quality monitoring networks (including mountain summit- and tower-based platforms) throughout the world (e.g., Acharja et al., 2020; Andreae et al., 2015; Brown et al., 2013; Daellenbach et al., 2020; David et al., 2021; Guo et al., 2014; Hanke et al., 2003; Harrison et al., 2012; Ravi Kant Pathak et al., 2009; Ryerson et al., 2013; Sellers et al., 1995; Shi et al., 2019; Tang et al., 2021). The very recent fifth WHO Air Quality Database (https://www.who.int/data/gho/data/themes/air-pollution/who-air-quality-database, last access: 18 July 2023) compiles ground measurements on air quality for over 6000 cities/human settlements in more than 100 countries. This provides a large body of datasets to understand air quality, its health impacts, and atmospheric chemistry/dynamics in the lower atmosphere as well as its interaction with the biosphere, as well as to assess model performance in predicting near-ground atmospheric composition. However, these measurements are typically limited to the boundary layer, raising challenges and limitations in understanding the atmospheric chemistry and dynamics above this layer (i.e., free troposphere, stratosphere) and showing the necessity of airborne measurements. Airborne measurements are also necessary for the validation of satellite observations which have undergone fast development and shown important prospects in the past decades. However, measurements at high-latitude regions are still challenging for satellites, and hence, validation of satellites in these regions is highly necessary (Hegarty et al., 2022; Wizenberg et al., 2021). Moreover, many important gases for atmospheric chemistry, air quality, and global climate have too low abundance to be detected by satellite. The vertical profile and regional distribution of these species must be detected by in situ airborne measurements.
Aircraft began serving as research platforms in the late 1920s with meteorological measurements such as temperature and altitude in the UK (Gratton, 2012, and therein). Since the 1940s, scientists have used aircraft to sample air to better understand the composition and related processes of the atmosphere far above the surface (https://earthobservatory.nasa.gov/blogs/fromthefield/2016/07/26/long-history-of-using-aircraft-to-understand-the-atmosphere/, last access: 18 July 2023). Owing to the development of rapid-response and high-precision instruments, aircraft measurement has become increasingly popular, particularly in North America and Europe (Ryerson et al., 2013; Fast et al., 2007; Hamburger et al., 2011; Fehsenfeld et al., 2006; Mallet et al., 2016; Andrés Hernández et al., 2022; Machado et al., 2018; Crawford et al., 2021). In addition to measurements within the boundary layer, aircraft platforms have allowed for measurement through the troposphere and even the lower stratosphere (<20 km above sea level (a.s.l.)), through which understanding the atmospheric dynamics and the distribution of pollution at both horizontal and vertical scales can be achieved.
Carbon monoxide (CO) is an important atmospheric carbon compound, mainly emitted by incomplete combustion processes, e.g., biomass burning, fossil fuel combustion. Its moderate lifetime of ca. 1–2 months indicates that its abundance is generally impacted by emissions at a regional scale. In polluted atmospheres such as urban areas, CO is mainly produced from incomplete combustion processes, such as coal, gasoline, diesel, and biomass combustion, and its concentration can reach levels of several ppmv (Xue et al., 2020; Dekker et al., 2019). In the background atmosphere (e.g., remote areas, marine boundary layer) and the upper troposphere, CO is generally low (<100 ppbv; Lelieveld et al., 2008), mainly resulting from atmospheric oxidization processes, e.g., the oxidation of methane by OH radicals. A high level of CO in background atmosphere typically indicates impacts of regional transport (or convection/eruption for the upper troposphere; Krysztofiak et al., 2018). Therefore, aircraft CO measurements can provide an overview of pollution in the studied region and are a good indicator of regional pollution levels and intensive emission events, e.g., wildfires (Jaffe and Wigder, 2012; Jaffe et al., 2022). There are already available aircraft CO measurements that provide broader spatial distributions. These are mainly from US projects, such as TRACE-P in 2001 (Palmer et al., 2003), INTEX-B in 2006 (Luo et al., 2007), GoAmazon2014/5 in Brazil (Machado et al., 2018), WE-CAN in 2018 (Permar et al., 2021), and FIREX-AQ in 2019 (Bourgeois et al., 2022), as well as European projects, such as DABEX in 2006 (Johnson et al., 2008), EUCAARI-LONGREX and APPRAISE-ADIENT in 2008 (McMeeking et al., 2010), CLARIFY in 2017 (Haywood et al., 2021), EMeRGe-EU in 2017 and EMeRGe-Asia in 2018 (Forster et al., 2023), and BLUESKY in 2020 (Voigt et al., 2022).
Another important utilization of aircraft measurements is the validation of chemical transport model simulations. Satellite observations have become increasingly popular in studying atmospheric composition. Many satellites can detect CO, such as MOPITT (https://terra.nasa.gov/about/terra-instruments/mopitt, last access: 18 July 2023), IASI (https://www.eumetsat.int/iasi, last access: 18 July 2023), and TROPOMI (http://www.tropomi.eu/, last access: 18 July 2023). However, satellite observations of CO need to be validated by measurements in different regions. For instance, recently, Wizenberg et al. (2021) compared CO measurements from TROPOMI, the Atmospheric Chemistry Experiment (ACE) Fourier transform spectrometer (FTS), and a high-Arctic ground-based FTS. They found different biases in different regions, e.g., positive biases (ca. +7 %) in northern and southern polar regions and negative biases (ca. −9 %) in equatorial regions.
Herein, based on a sensitive airborne instrument, (SPectromètre Infra-Rouge In situ Toute altitude – SPIRIT) with high-resolution and high-precision CO detection, seven aircraft campaigns funded by European and French national projects were conducted worldwide between 2011 and 2021, accompanied by two intercontinental measurements. This paper summarizes all the data obtained during those aircraft campaigns.
2.1 Setup
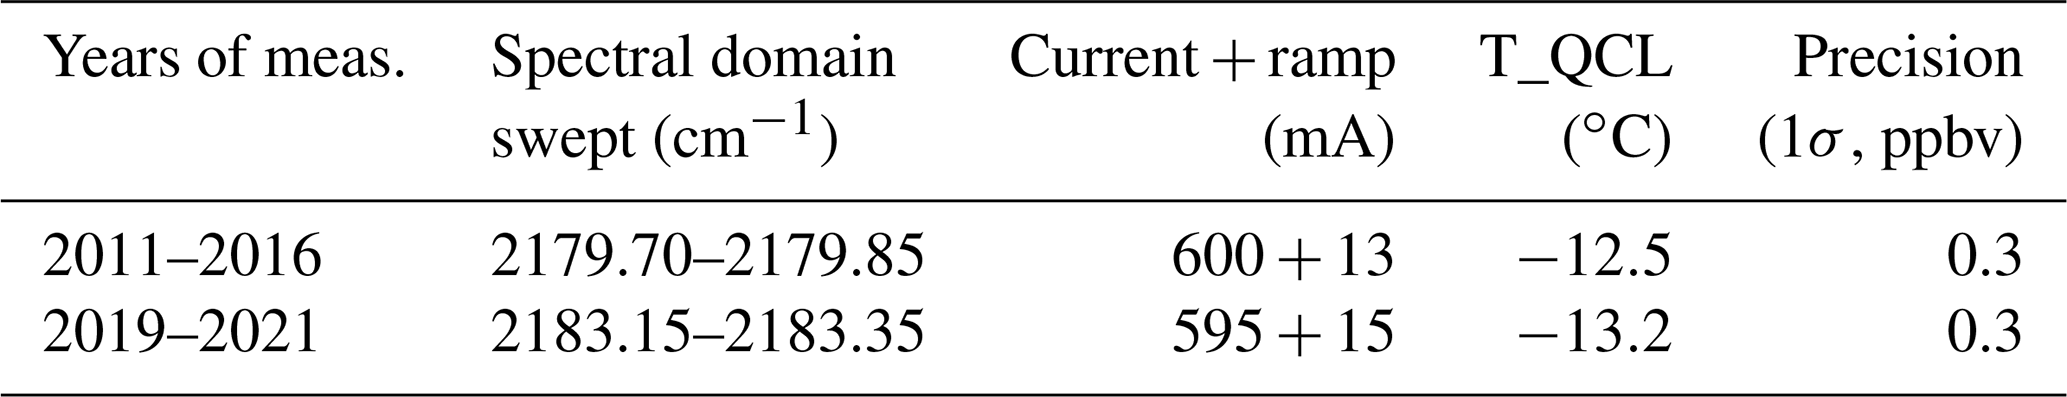
In 2011, the infrared laser absorption spectrometer SPIRIT was developed at LPC2E for airborne measurement of trace gases in the troposphere. Details about this instrument can be found in Catoire et al. (2017). Briefly, the coupling of a single Robert multi-pass optical cell (with a path length to be adjusted up to 167.78 m) with three interchangeable quantum cascade lasers (QCLs) was designed, which allows selecting trace gases to be measured according to the scientific objectives. Absorptions of the laser radiation by species in the cell at reduced pressure (<40 hPa) is quantified using a HgCdTe photodetector cooled by the Stirling cycle, according to the Beer–Lambert law. For CO, two absorption rovibrational lines were successively used, namely 2179.772 and 2183.224 cm−1, with the functioning conditions for the lasers indicated in Table 1. CO was measured on all the scientific flights regarding its essential role in atmospheric chemistry, as discussed in Sect. 1. Hence, in this database, all the airborne CO measurements during the last decade are summarized.
2.2 QA/QC (quality assurance/quality control)
In Catoire et al. (2017), laboratory experiments and in-flight intercomparisons with other instruments were conducted to assess the performance of SPIRIT and the quality of the data. In addition, for each field campaign, in-flight calibrations were also conducted during every flight. It was noted that until 2016 (see Sect. 3.5), SPIRIT could provide high-quality CO data with a precision of 0.3 ppbv (1σ) and an overall uncertainty of less than 1 ppbv when regular in-flight calibration vs. the WMO standard was performed. This has continued to be true since 2016. As an example, in Sect. 3.7, we present data with in-flight calibrations.
During the 2011–2021 period, SPIRIT was used in seven aircraft campaigns with 74 scientific flights. In total, 208.8 h of in-flight CO measurements were obtained (Table 2). Figure 1 summarizes the locations of all the measurements presented in this paper, i.e., over three continents: Europe, Asia, and Africa. Except for the SHIVA (Stratospheric Ozone: Halogen Impacts in a Varying Atmosphere) winter campaign, all campaigns were conducted in late spring or summer. In general, most campaigns were conducted in Europe, except the SHIVA and DACCIWA (Dynamics-Aerosol-Chemistry-Cloud Interactions in West Africa) campaigns conducted in Southeast Asia and West Africa, respectively. A wide area was covered by the measurements, for example, including tropical regions (SHIVA and DACCIWA) and northern mid-latitude regions (all others). Measurements during the MAGIC (2021) campaign also covered a part of the northern high-latitude region. In general, the CO level depends on pollution, with the highest values in the boundary layers (<2 km altitude) of areas influenced by anthropogenic activities. The upper troposphere (>6 km altitude) is cleaner (except for the MAGIC (2021) high-latitude area influenced by long-range transport; see details in Sect. 3.8 and 3.10). Also, it is worth noting that the two intercontinental flights, one from Europe to South Asia and the other from Europe to West Africa, were conducted during the transition flights for SHIVA and DACCIWA projects (more details in Sect. 3.9).
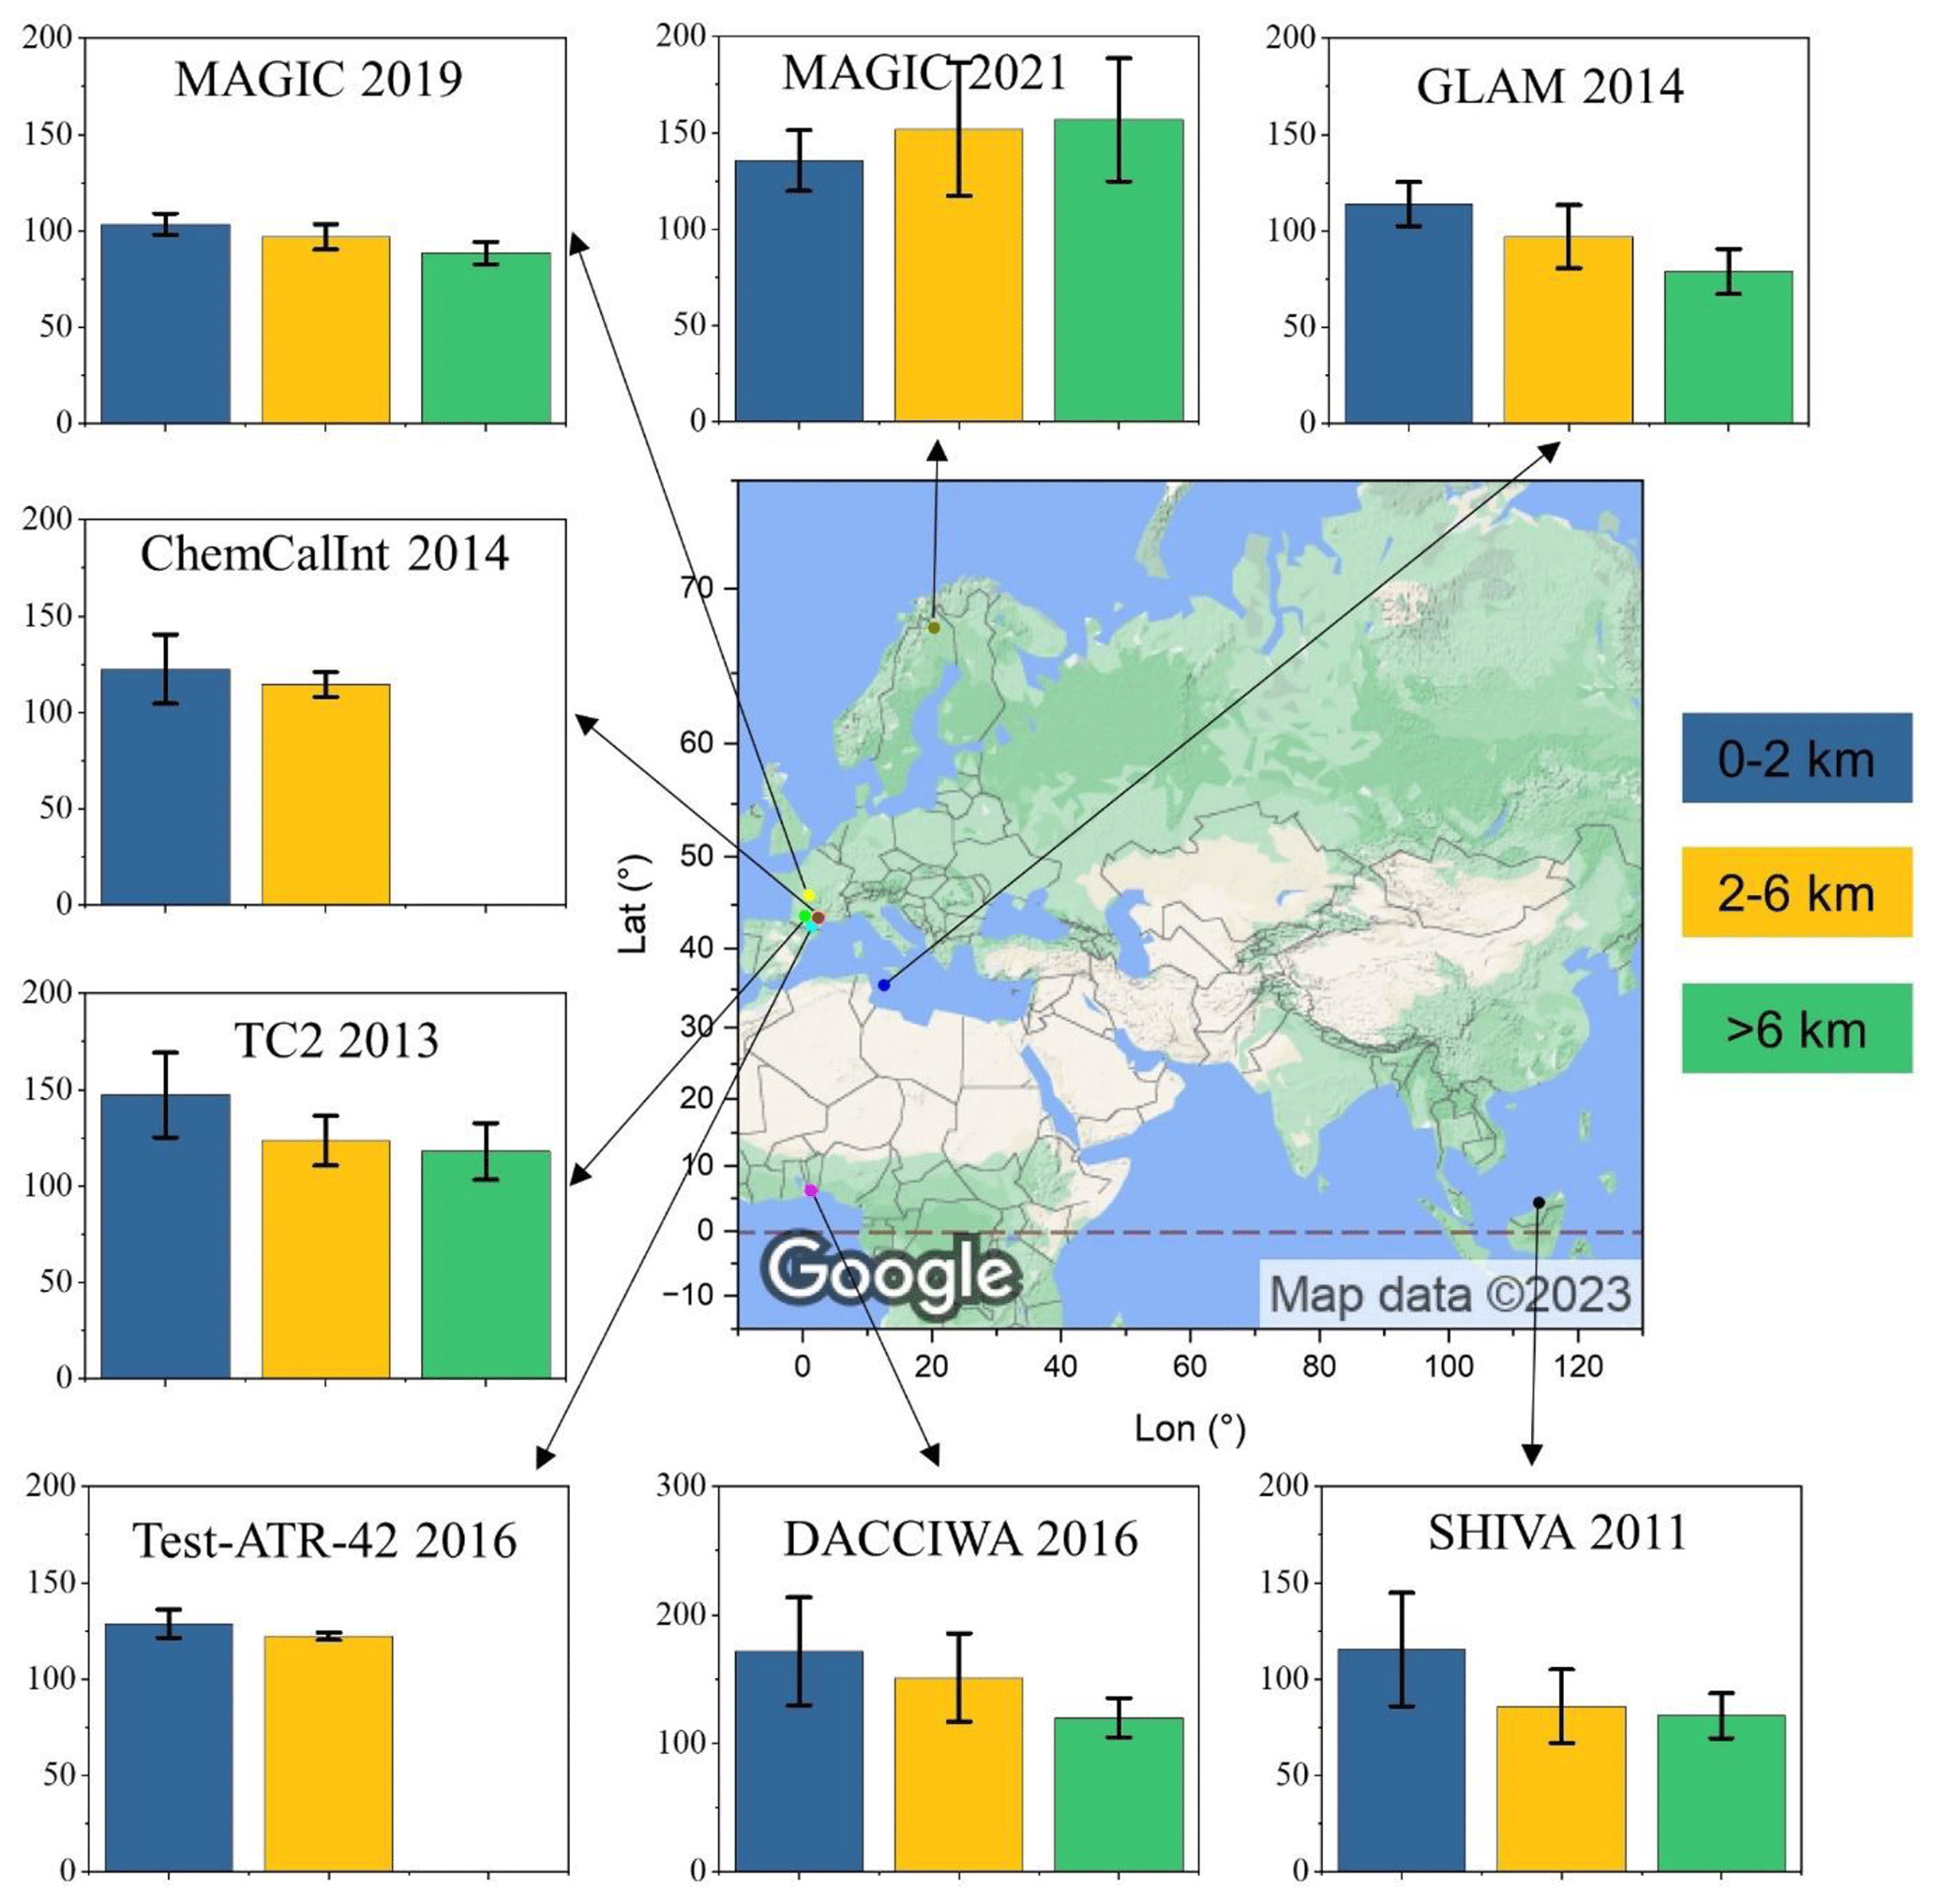
Figure 1Locations of the main airports used for each project. Map copyright: © Google Maps. The same airport in Toulouse was used for TC2 (2013), ChemCallnt (2014), and Test-ATR-42 (2016), so the overlapped points are offset and plotted horizontally. Lampedusa Airport is selected for GLAM (2014) as it is in the center of the measurement area. Bar plots show the average CO levels in the boundary layer (0–2 km), lower free troposphere (2–6 km), and upper free troposphere (>6 km) for each project.
Table 2Information about SPIRIT CO measurements.
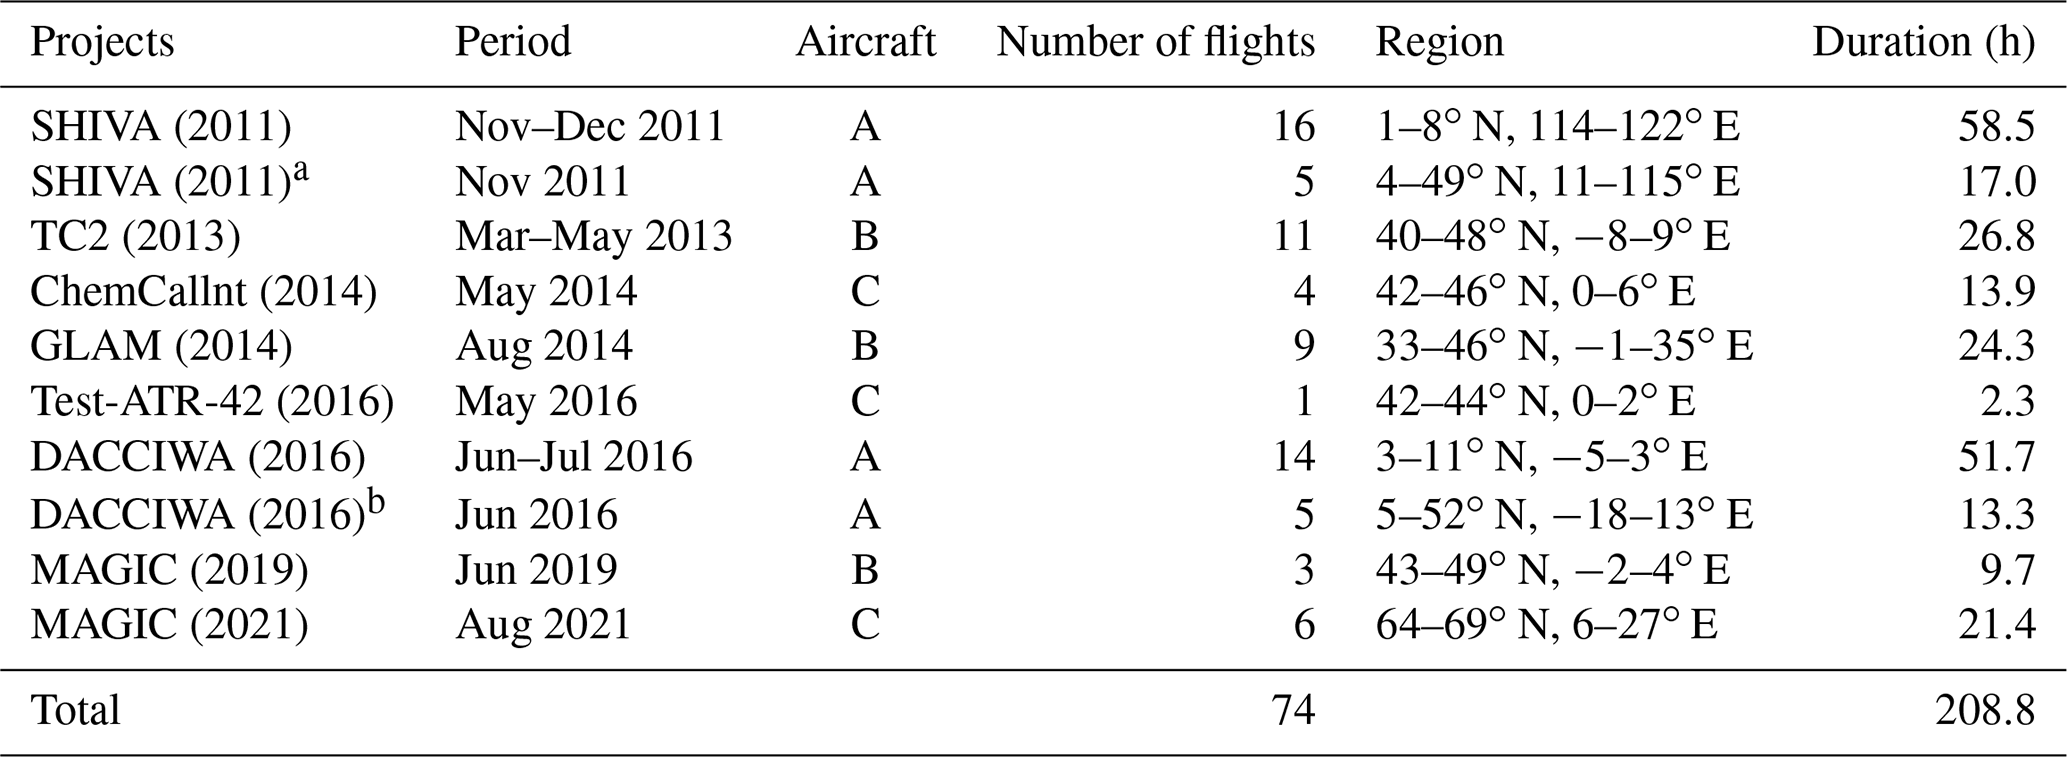
a Five intercontinental flights from Europe to Asia; b Five
intercontinental flights from Europe to Africa.
A: Falcon-20; B: Falcon-20 and SAFIRE; C: ATR-42 and SAFIRE.
3.1 SHIVA – Malaysia (2011)
In the framework of the SHIVA project of the European Commission FP7-Environment Program (https://cordis.europa.eu/project/id/226224, last access: 18 July 2023), 16 research flights were conducted using the German Aerospace Agency (DLR) Falcon-20 aircraft in Malaysia (Borneo) between 16 November and 11 December 2011. The three-dimensional trajectories with CO volume mixing ratios (VMRs) are displayed in Figs. S1–S16 in the Supplement. Measurements during the five intercontinental flights from Europe to Asia are presented in Sect. 3.9.
The SPIRIT instrument was on board all flights (58.5 h) during the measurement of CO VMRs. Figure 2 shows all trajectories of these flights. Most measurements were conducted along the coastal lines of Malaysia and Brunei, with several flights reaching the hinterland of Borneo and several flights crossing the South China Sea and reaching the region of Malacca Strait. The measurement domain represents a typical tropical region (latitude scale: 1–7∘ N).
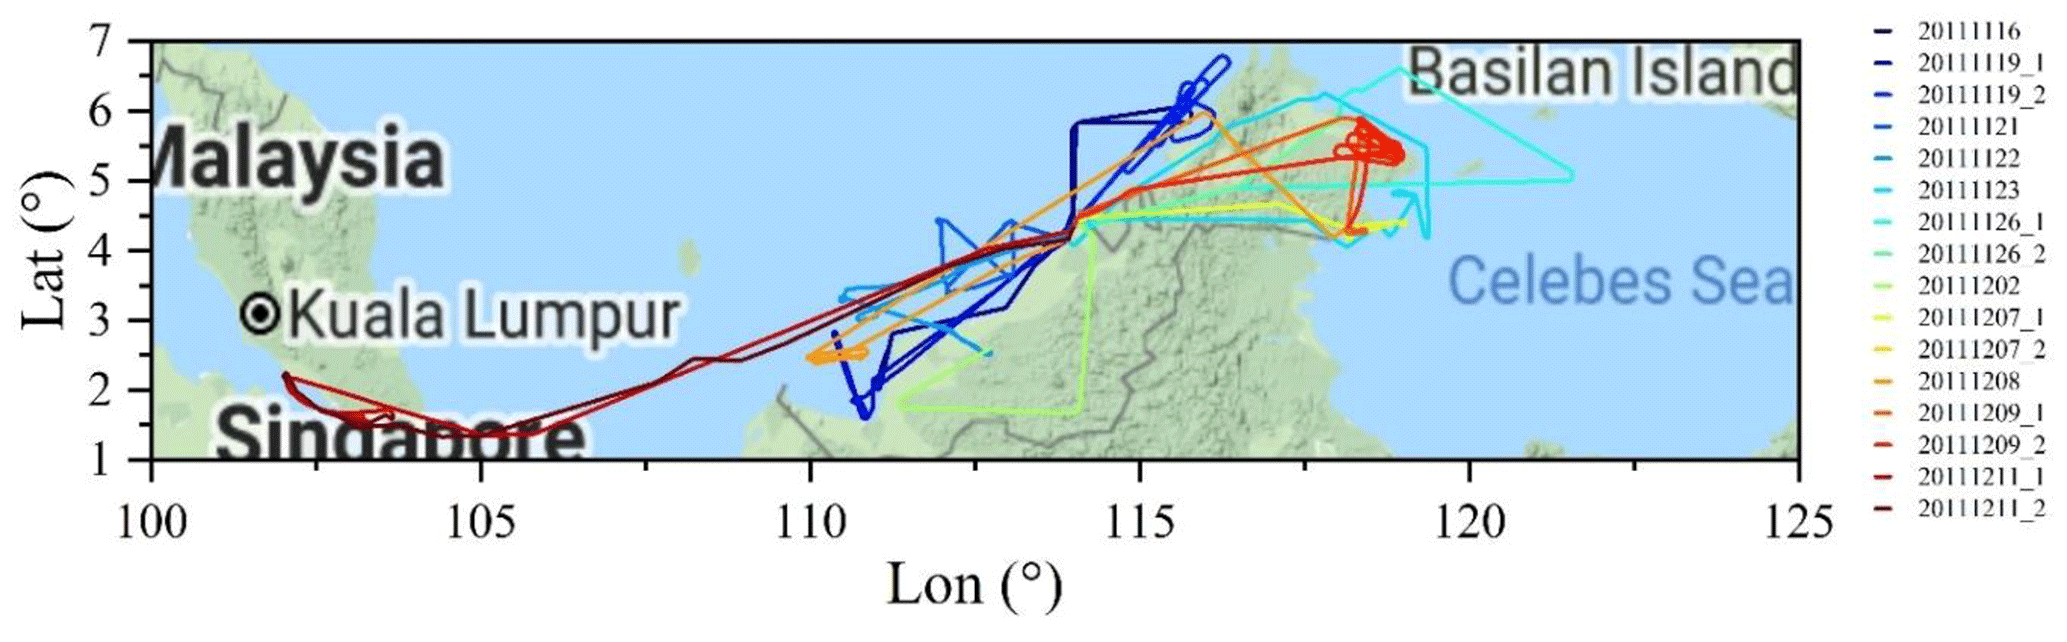
Figure 2Flight trajectories during the SHIVA (2011) campaign. Map copyright: © Google Maps.
Figure 3 exhibits the trajectory of the first scientific flight on 19 November 2011, which gives insight of the CO level in the boundary layer and free troposphere of Borneo. The aircraft took off from Miri Airport (Malaysia), gradually increasing its altitude to 8400 m a.s.l. It flew along the coastal line of the state of Sarawak (Malaysia) and reduced its flying height before reaching the southwest of the state. Then, after conducting horizontal measurements over the ocean boundary layer, the aircraft increased its flying height and flew back to Miri Airport. After about 2.4 h of measurements, the aircraft landed at Miri Airport. During the flight, the observed CO reached 140 ppbv in the boundary layer (0–2 km) and <100 ppbv in the lower free troposphere (2–6 km) but was relatively stable around 100 ppbv at ∼8 km. Moreover, based on the measurements on flights referenced as 20111119_2, 20111209, 20111211_1, and 20111211_2 in the SHIVA project, Krysztofiak et al. (2018) found correlated enhancements of CO, CH4, and short-lived halogen species (i.e., CH3I and CHBr3) at heights around 11–13 km a.s.l., which is interpreted as the fingerprint of the vertical transport from the boundary layer driven by the convective updraft. The fraction of air mass in the boundary layer can reach 67 %, indicating the significant impact of the convective system on the composition of the upper troposphere in tropical regions (Hamer et al., 2021).
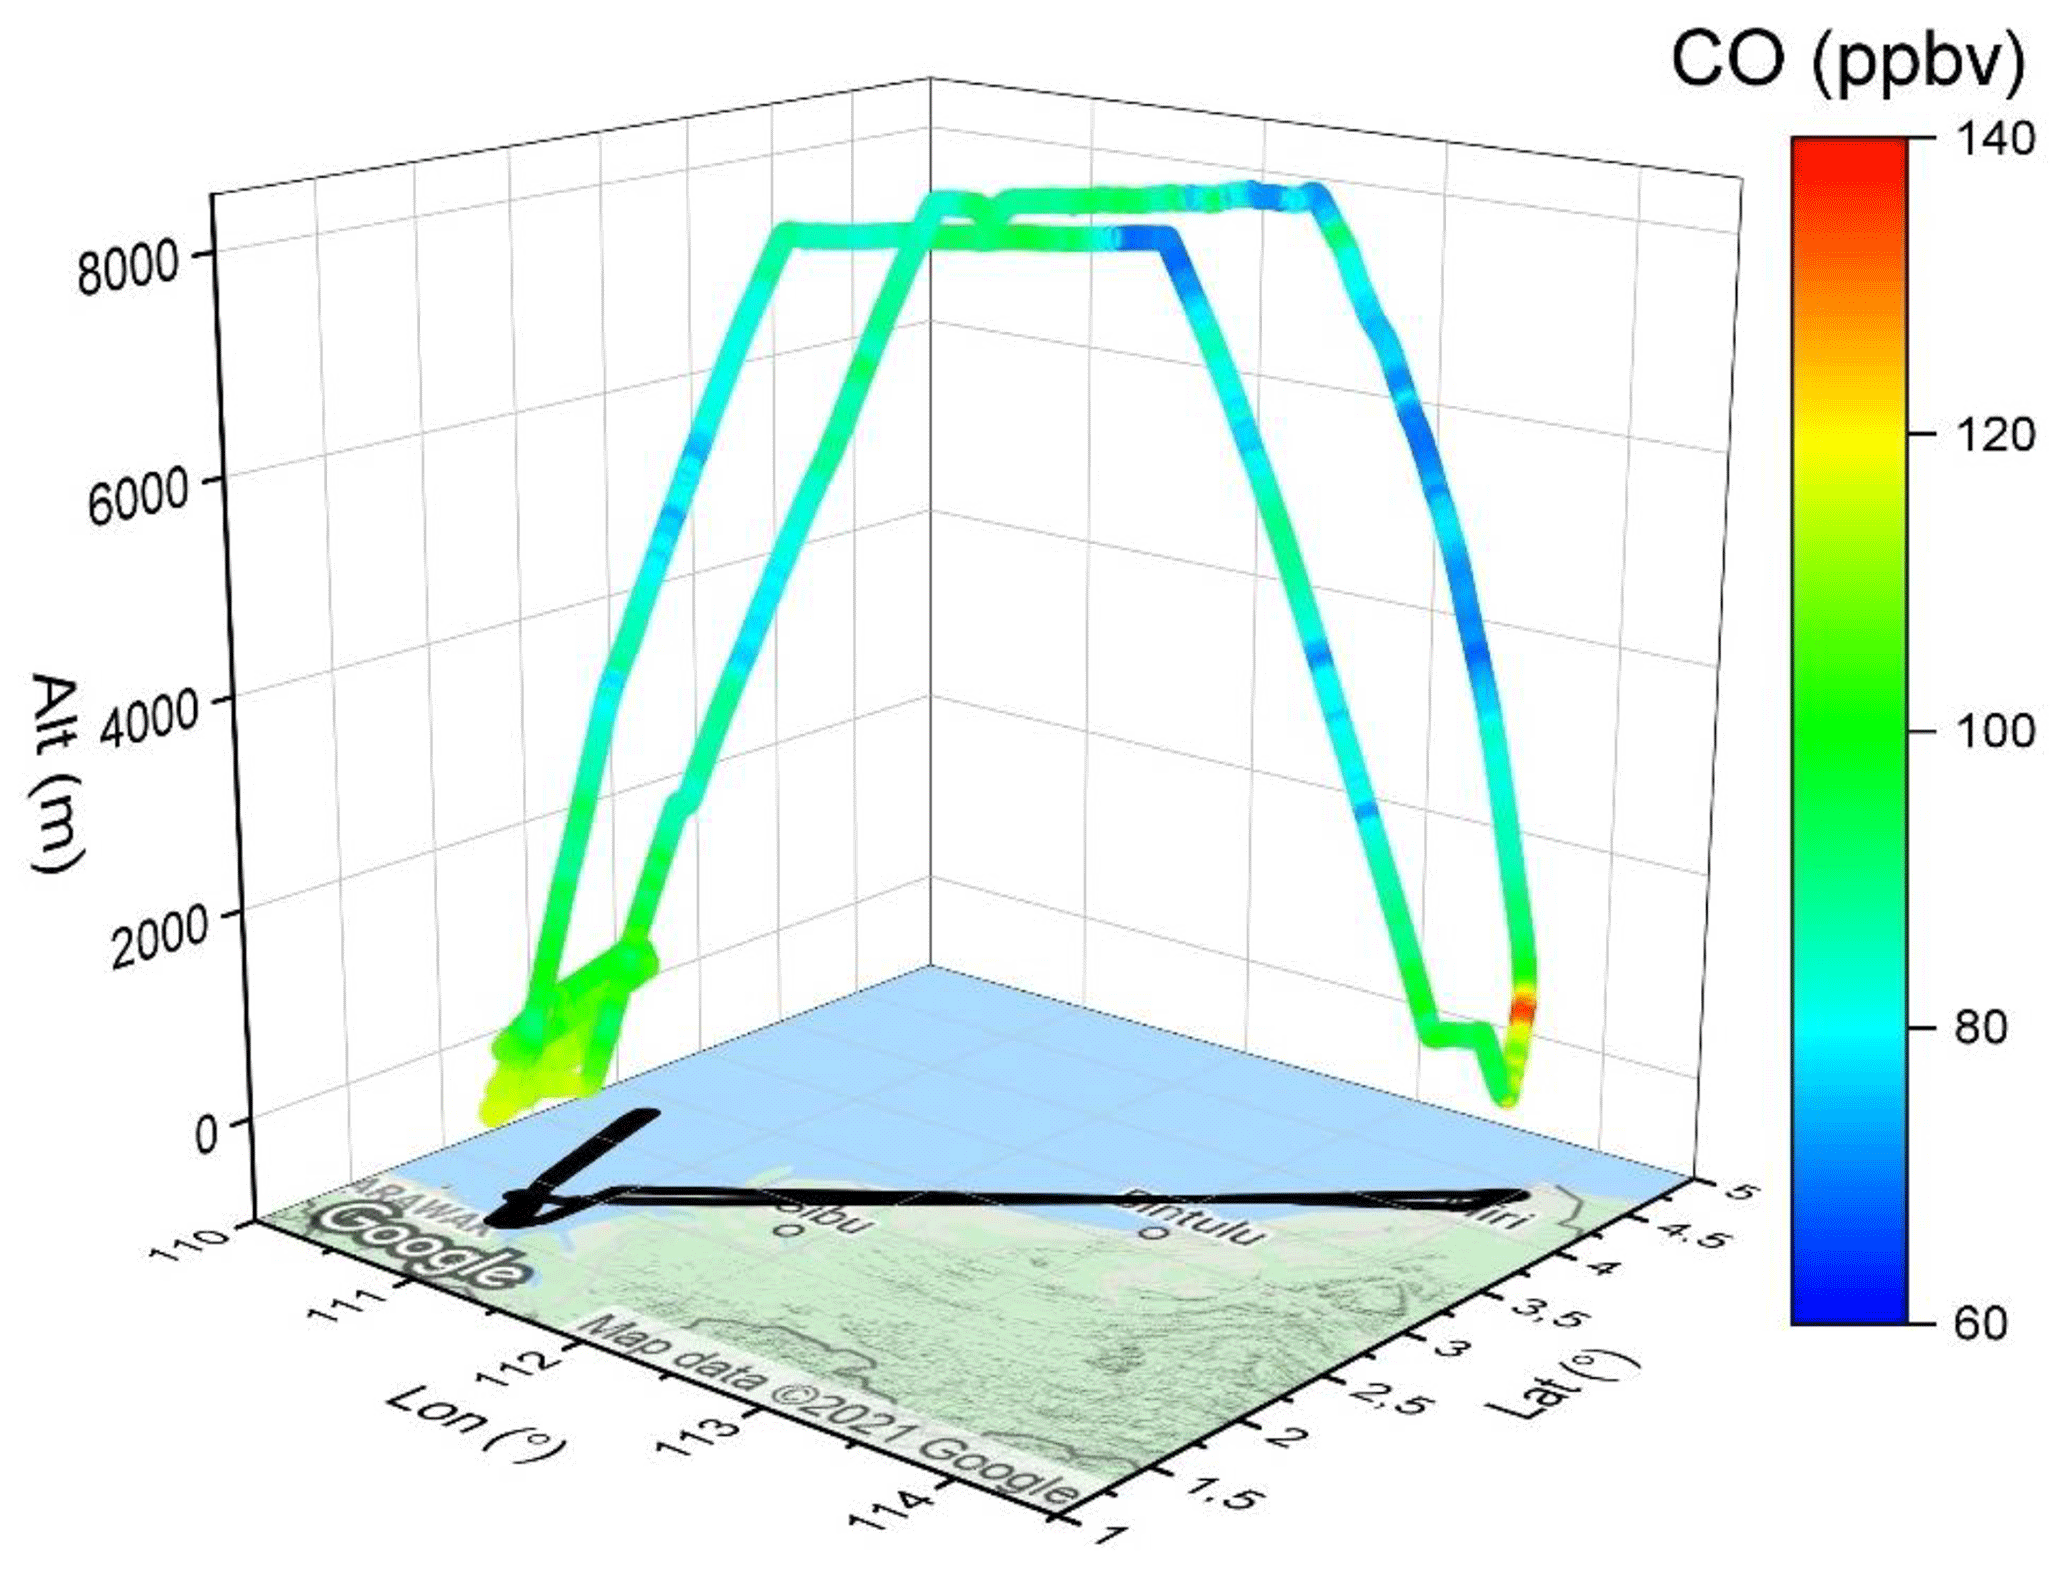
Figure 3Flight trajectory colored by CO levels on flight SHIVA_20111119_1. Map copyright: © Google Maps.
3.2 Traînées de Condensation et Climat: TC2 – France (2013)
In the framework of the contrails and climate project TC2 (each time the sampling inlet is connected to the cylinder containing the WMO CO standard de Condensation et Climat, http://www.cerfacs.fr/TC2/index.html, last access: 18 July 2023), 11 measurement flights (Figs. S17–S27) were conducted from 12 March to 31 May 2013, with a total measurement duration of around 27 h. For each flight, the Falcon-20 aircraft with SPIRIT on board flew in the wake of commercial flights, most of which were on the Paris–North Africa route. This allows for the detection of aircraft emissions and the study of the air mass aging of contrails. As shown in Fig. 4, most measurements were conducted in the region over Toulouse and the southwest of France, and several flights reached the Atlantic Ocean and the Mediterranean Sea.
Figure 5 shows the measurements during the 20 March 2013 flight, since they are at the heart of the study, i.e., the emissions of NO2 and CO by aircraft. Sudden NO2 increases by a few ppbv (from a background level of less than 0.5 ppbv) were observed a few minutes behind the wake of aircraft, but there was no increase in CO as seen here in the middle of ceiling altitude (10.5 km), suggesting complete combustion in aircraft engines or very rapid dilution process if there were emissions.
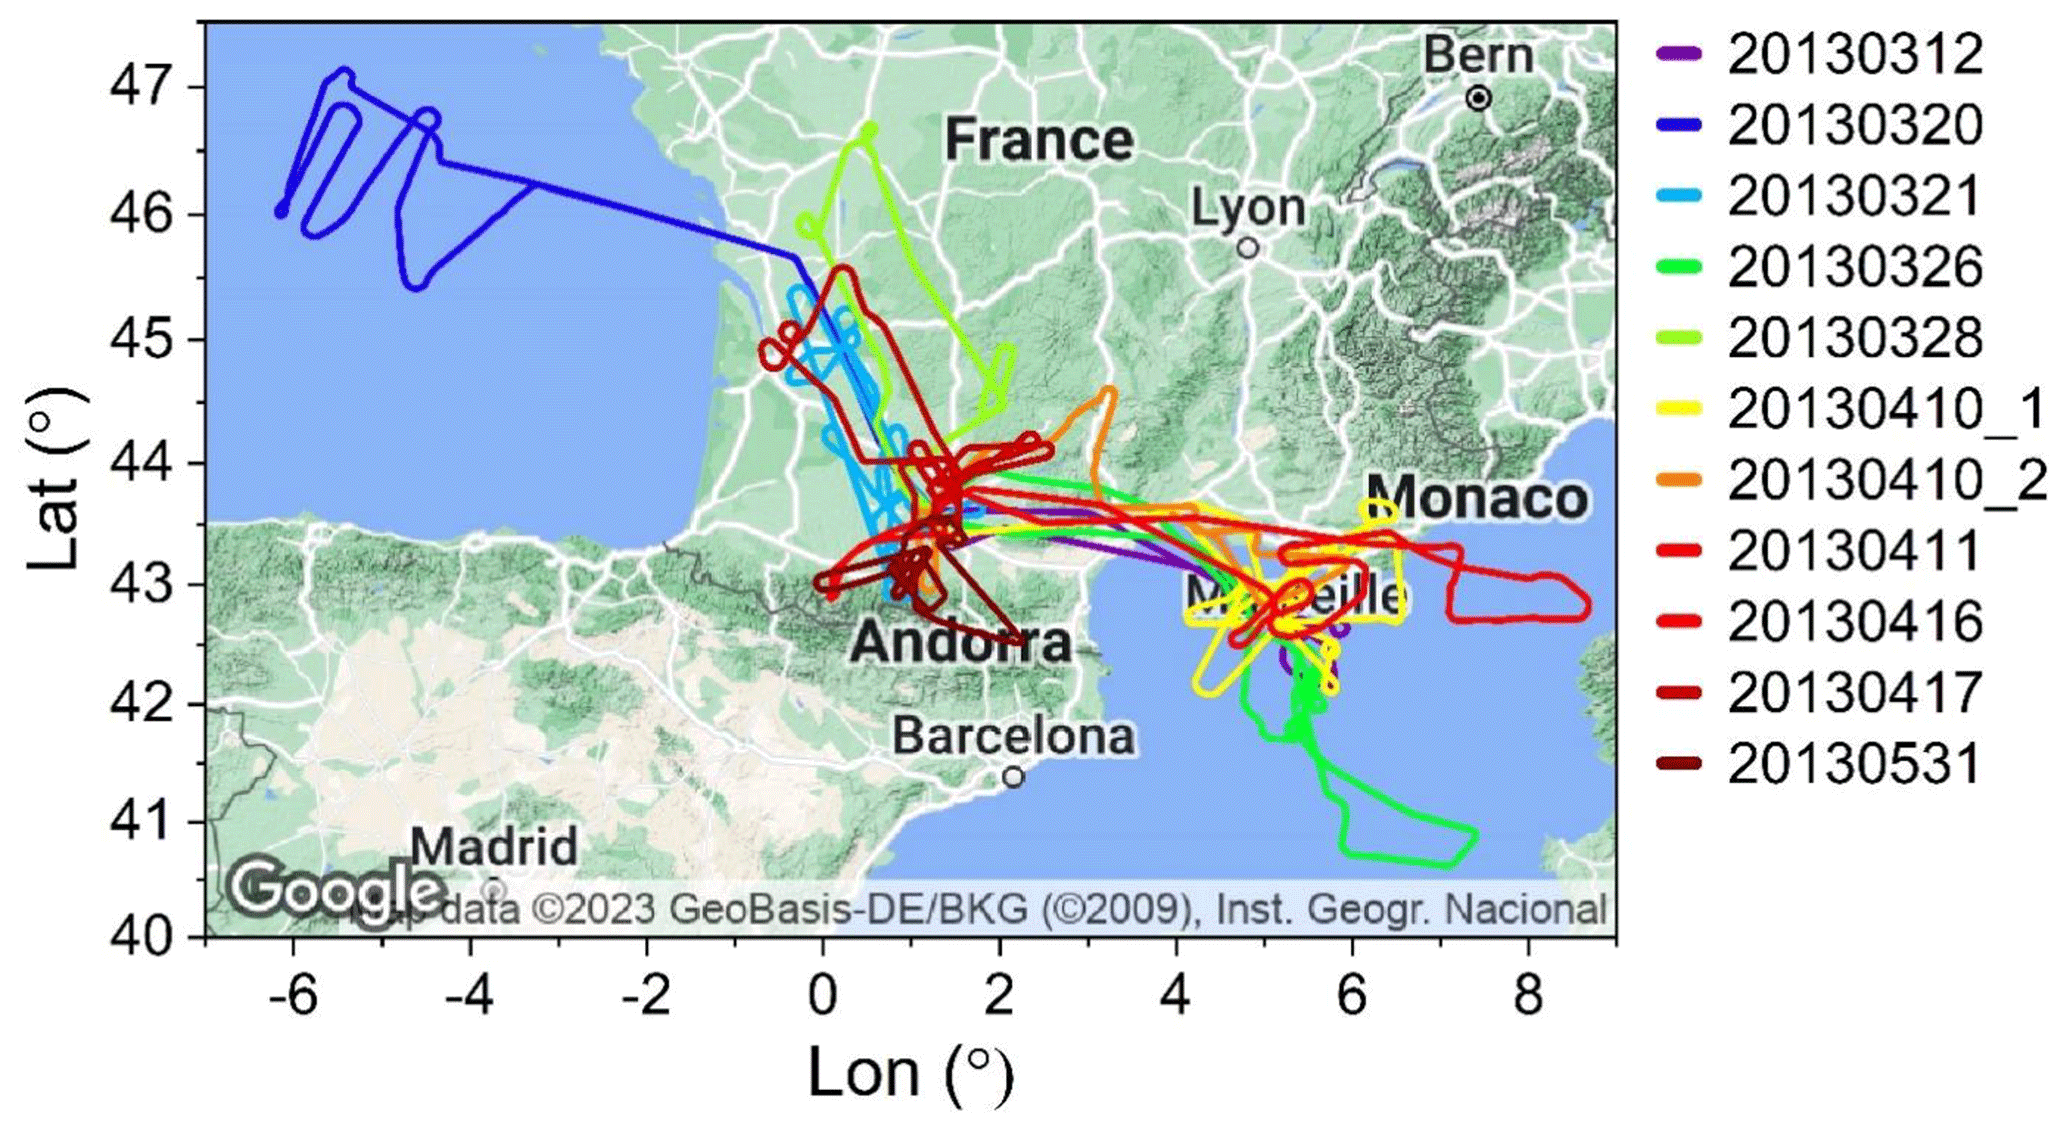
Figure 4Flight trajectories during the TC2 (2013) campaign. Map copyright: © Google Maps.
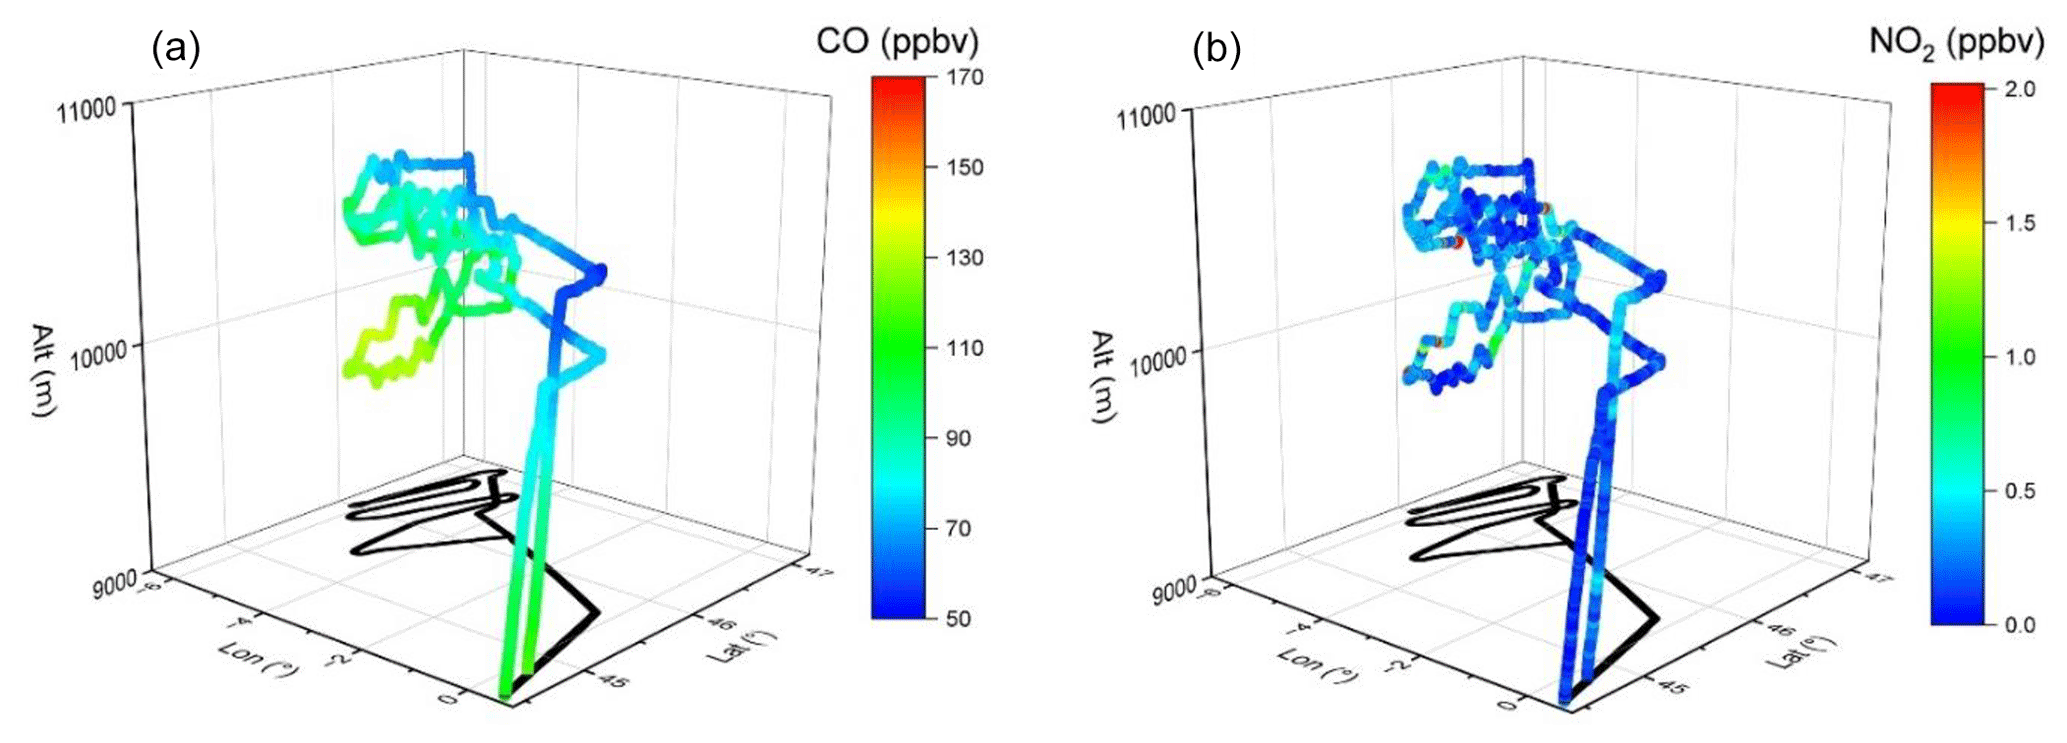
Figure 5Flight trajectory colored by (a) CO and (b) NO2 VMRs on flight TC2_20130320_1. Three NO2 VMRs suddenly increasing up to more than 2 ppbv (symbolized by red dots) are seen when our research aircraft was inside the contrails emitted by commercial aircraft, whereas there was no such increase in CO level.
3.3 ChemCallnt – France (2014)
The ChemCallnt project is a French initiative, part of the Joint Research Activity (JRA) Traceability in Gas-phase Observations (TGOE) of EUFAR, the EUropean Facility for Airborne Research. This project was built to compare the measurements of CO and CH4 by different airborne instruments in order to ensure their consistency and their performance and to implement adapted calibration procedures in future campaigns. Figure 6 shows all the flight trajectories during this project. Four flights were conducted in southern France, generally between/around Toulouse, Clermont-Ferrand, and the Pyrenees Mountains (Figs. S28–S31).
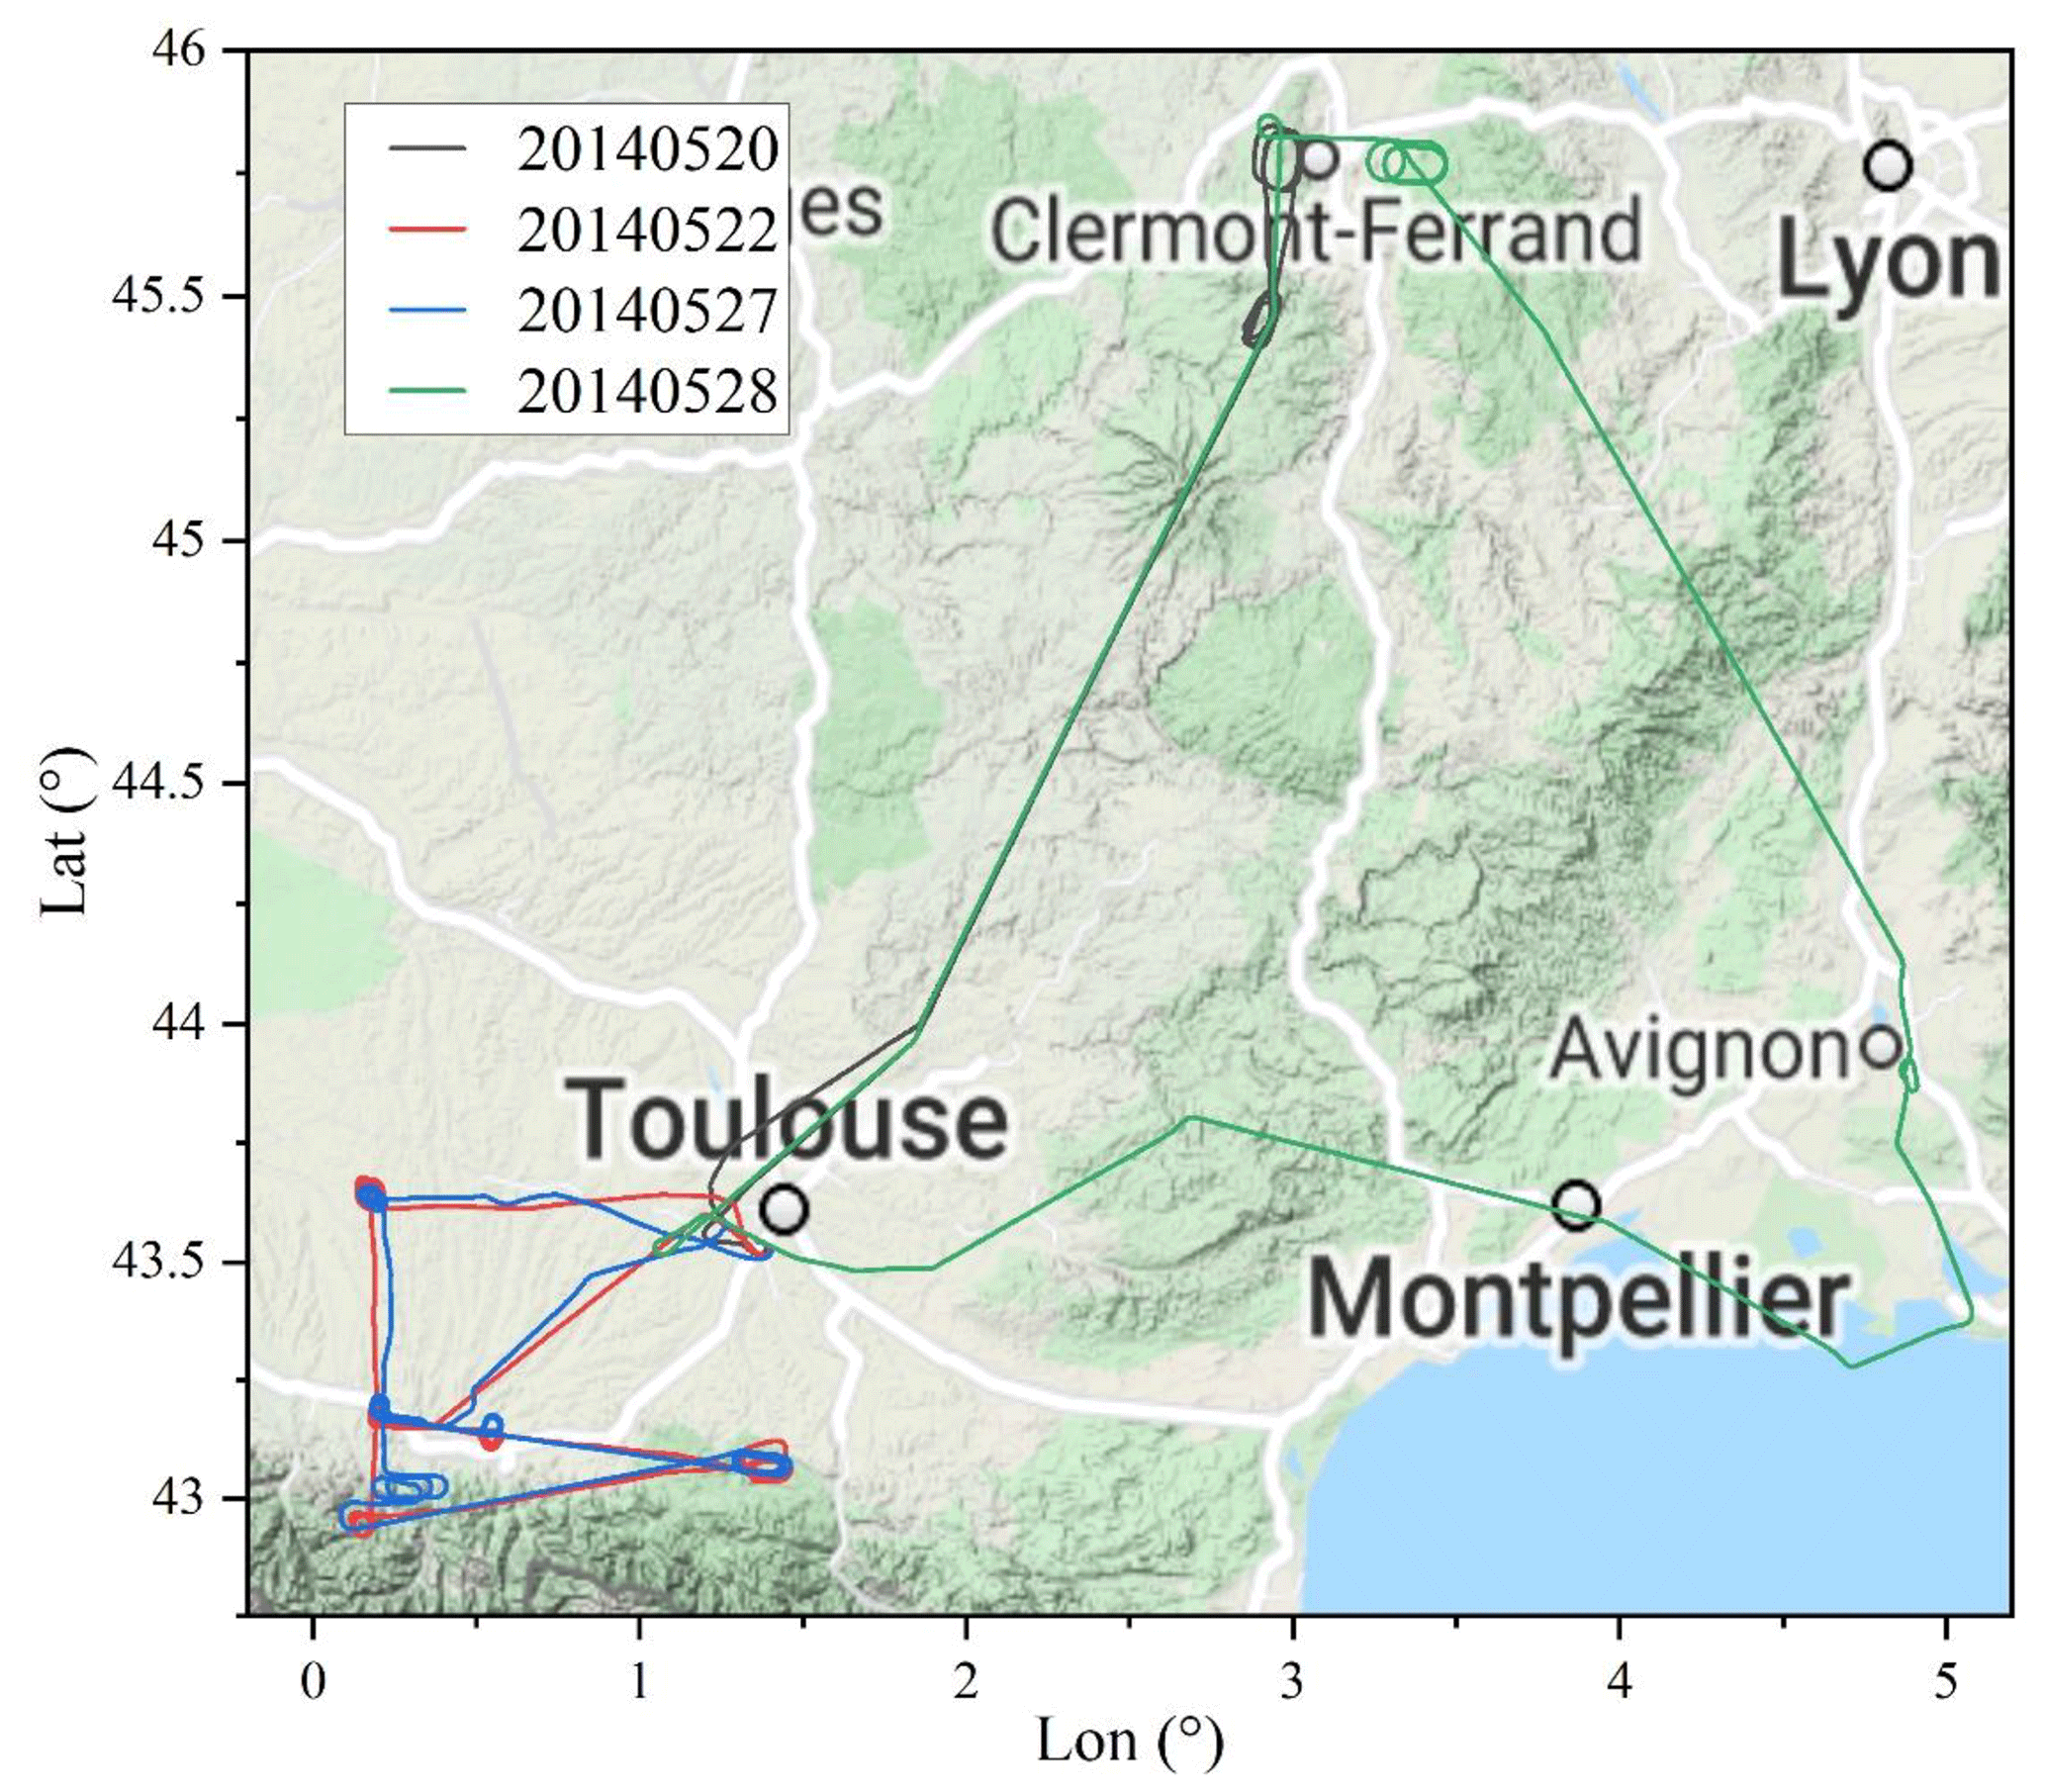
Figure 6Flight trajectories during the ChemCallnt (2014) campaign. Map copyright: © Google Maps.
In Fig. 7, CO measurements along with the flight trajectories on 22 May 2014 are shown since they represent the typical CO distribution and level in this region. The aircraft flew to the meteorological station of Peyrusse-Vieille, the Centre de Recherches Atmosphériques de Lannemezan (OMP), the Pyrenees National Park, and the Regional Natural Park of the Ariegean Pyrenees. Over this natural park, a background measurement of the vertical profile of CO (i.e., <115 ppbv) was observed. In general, the measured CO VMR during this flight was lower than 120 ppbv, with an exception over Toulouse. This is the typical CO level in southwest France with no large cities and no significant anthropogenic emissions in this region. The vertical homogeneity of CO over the regional park is representative of the CO distribution over this region, as seen in Sect. 3.9 and Fig. 25.
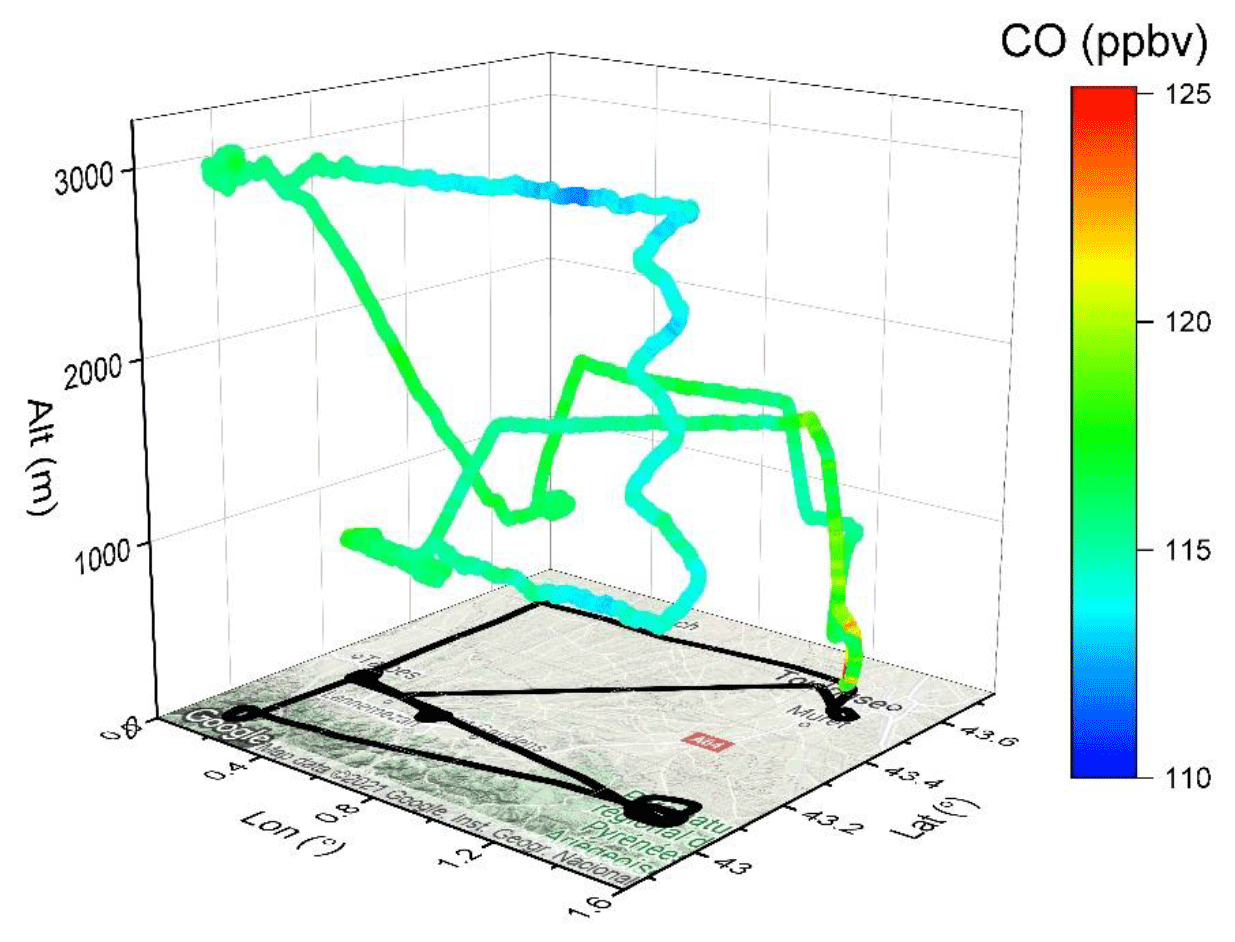
Figure 7Flight trajectory colored by CO levels on flight ChemCallnt_20140522_1. Map copyright: © Google Maps.
3.4 ChArMEx – GLAM Mediterranean (2014)
Within the framework of the MISTRALS (Mediterranean Integrated Studies At Local And Regional Scales) ChArMEx (the Chemistry-Aerosol Mediterranean Experiment) program (https://programmes.insu.cnrs.fr/mistrals/programmes/charmex/, last access: 18 July 2023), the GLAM experiment (Gradient in Longitude of Atmospheric constituents above the Mediterranean basin, https://www.safire.fr/content_page/32-campagnes-passees/106-glam.html?lang=fr, last access: 18 July 2023) aims to describe the high-resolution horizontal and vertical distribution of pollutants over the Mediterranean Basin along an east–west axis (Ricaud et al., 2018; Brocchi et al., 2018). As shown in Fig. 8, the measurement domain of the nine flights covers the target region, west from the France–Spain border and east to Cyprus (Figs. S32–S40). Measurements were mostly conducted over the sea, with some exceptions for islands, including the Balearic Islands, Sardinia, Crete, and Cyprus, drawing the whole picture of CO profiles over the Mediterranean Basin.
Data obtained in this project can be used to study anthropogenic emissions in the Mediterranean region, for which measurements on 8 August 2014 provide an excellent example. Figure 9 shows measurements during this flight with a measurement area over Cyprus and surrounding regions. High levels of CO up to 130 ppbv were observed in the boundary layer (<2 km altitude) over the coastal regions of southeastern Cyprus and the sea on the west of Cyprus, indicating impacts of urban and shipping emissions, respectively.
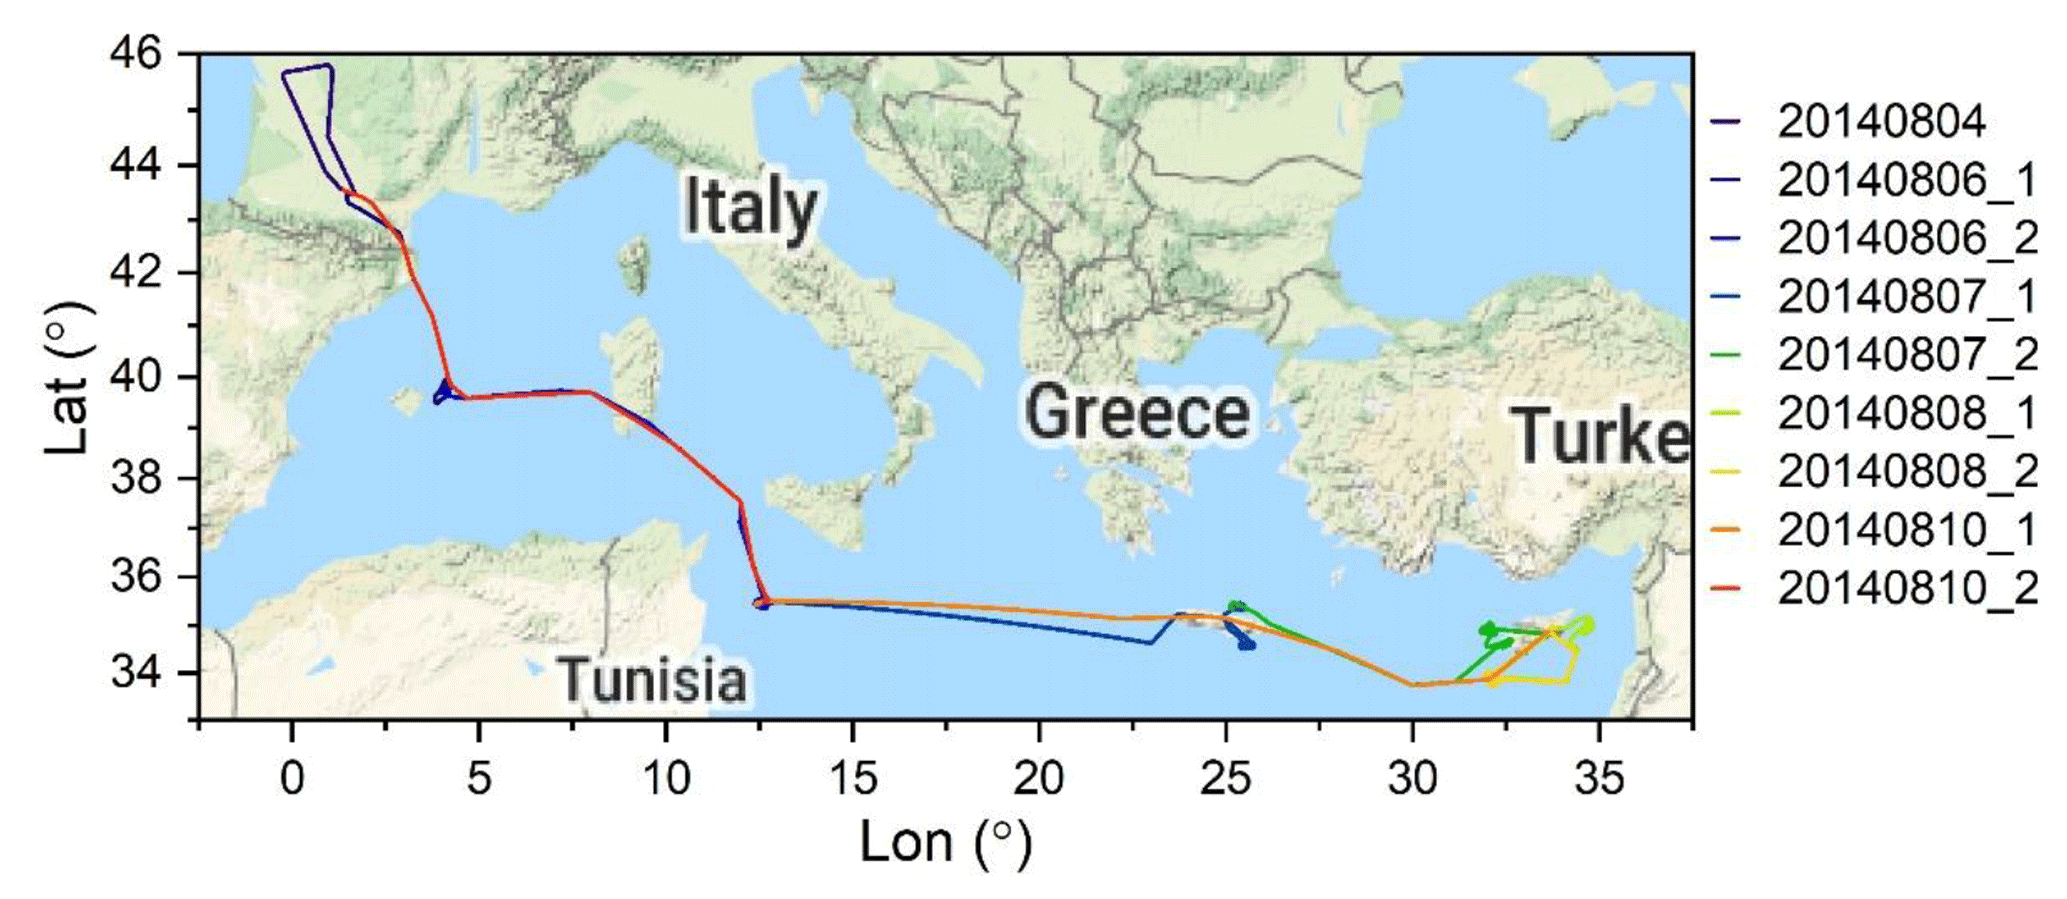
Figure 8Flight trajectories during the GLAM (2014) campaign. Map copyright: © Google Maps.
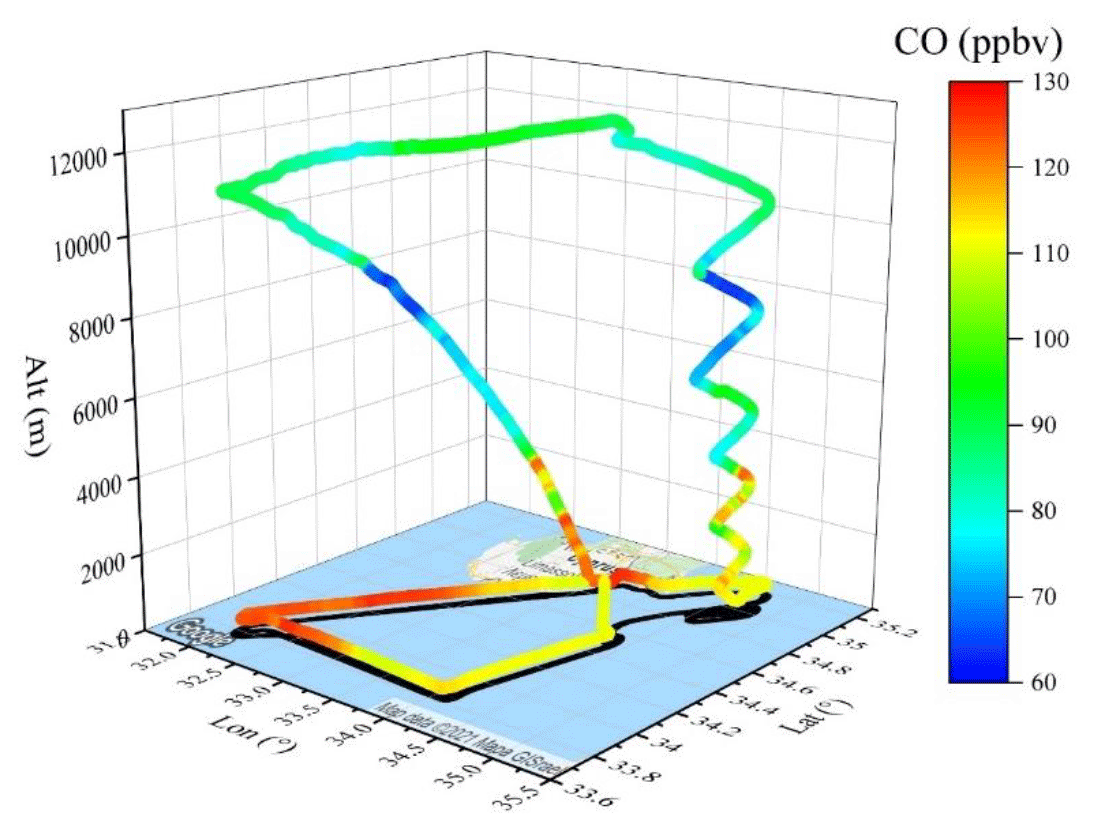
Figure 9Flight trajectory colored by CO levels on flight GLAM_20140808_1. Map copyright: © Google Maps.
3.5 Test-ATR-42 (2016)
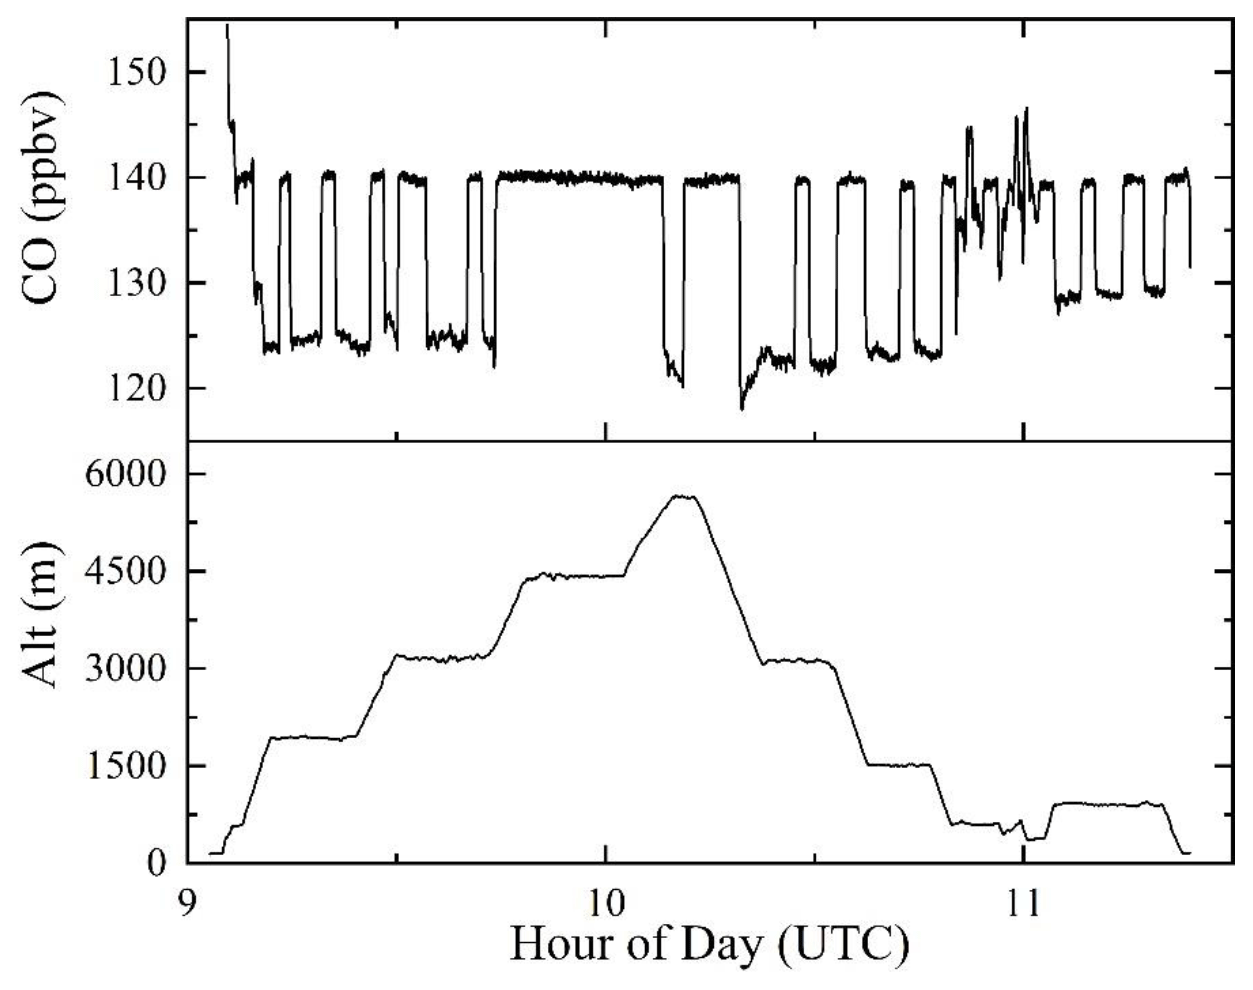
The Test-ATR-42 project aims to test the performance of SPIRIT, with more intensive calibrations during the flight compared to other field campaigns, as detailed in Catoire et al. (2017). As shown in Fig. 10, 17 calibrations with the WMO CO standard of 136.1±0.4 ppbv were made during the flight on 5 February 2016. These calibrations cover both aircraft ascent and descent in the altitude range of 0–6 km, showing no dependence of the results on temperature or pressure. Each time the sampling inlet is connected to the cylinder containing the WMO CO standard, measurements rapidly (in 10 s) reach a stable value around 140 ppbv, with small scattering (<1 ppbv at 1σ, Fig. 11), highlighting the accuracy and reproducibility of SPIRIT in aircraft measurements.
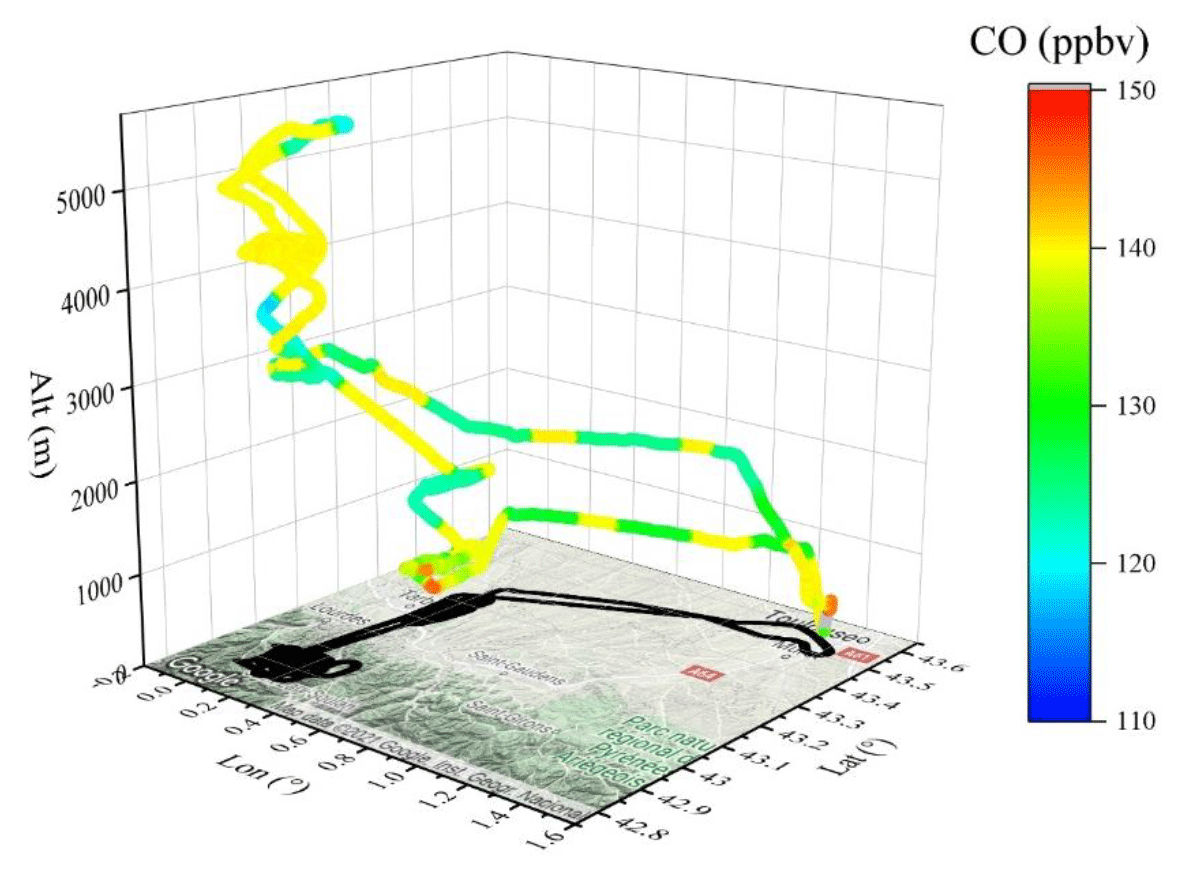
Figure 10Flight trajectory colored by CO levels on flight Test-ATR-42_20160205_1. Map copyright: © Google Maps.
3.6 DACCIWA – West Africa (2016)
In the summer of 2016, the EU FP7 project DACCIWA was implemented to investigate the atmospheric impacts of anthropogenic and natural emissions in West Africa, where high-quality airborne measurements are quite scarce (Knippertz et al., 2015; Hahn et al., 2023; Taylor et al., 2019; Wu et al., 2021; Formenti et al., 2019; Redemann et al., 2021; Haywood et al., 2021). Fourteen flights (>50 h measurements; Figs. S42–S55) were conducted in coastal regions as well as the surrounding Atlantic Ocean and continental regions of West Africa (Fig. 12). In general, CO levels in West Africa are higher than those in the Mediterranean Basin (Sect. 3.4).
For example, Fig. 13 shows a flight along the coastal lines and over the Gulf of Guinea. This represents a typical measurement as it is impacted by different types of pollution. High CO values (200–300 ppbv) were observed within 2 km above Lomé (Togo), suggesting urban emissions and/or shipping emissions (see ship positions near the Lomé port in Fig. S65). Moreover, Brocchi et al. (2019) found that offshore oil rig emissions (e.g., CO, NOx, and aerosol within the boundary layer) also showed an impact on regional air quality. The pollutants emitted above the ocean by ships and oil rigs are thus transported along the West African Monsoon (southwesterly in summer) to the continents (Kniffka et al., 2019; Brocchi et al., 2019), affecting the air quality in those regions. Notably, a pollution plume caused by biomass burning emissions, with aerosols visible live through the aircraft window and higher CO levels (150–200 ppbv) than the background (100–150 ppbv, Fig. 13), was observed at 2.8–4.0 km and was captured again at a similar altitude but further from the coast.
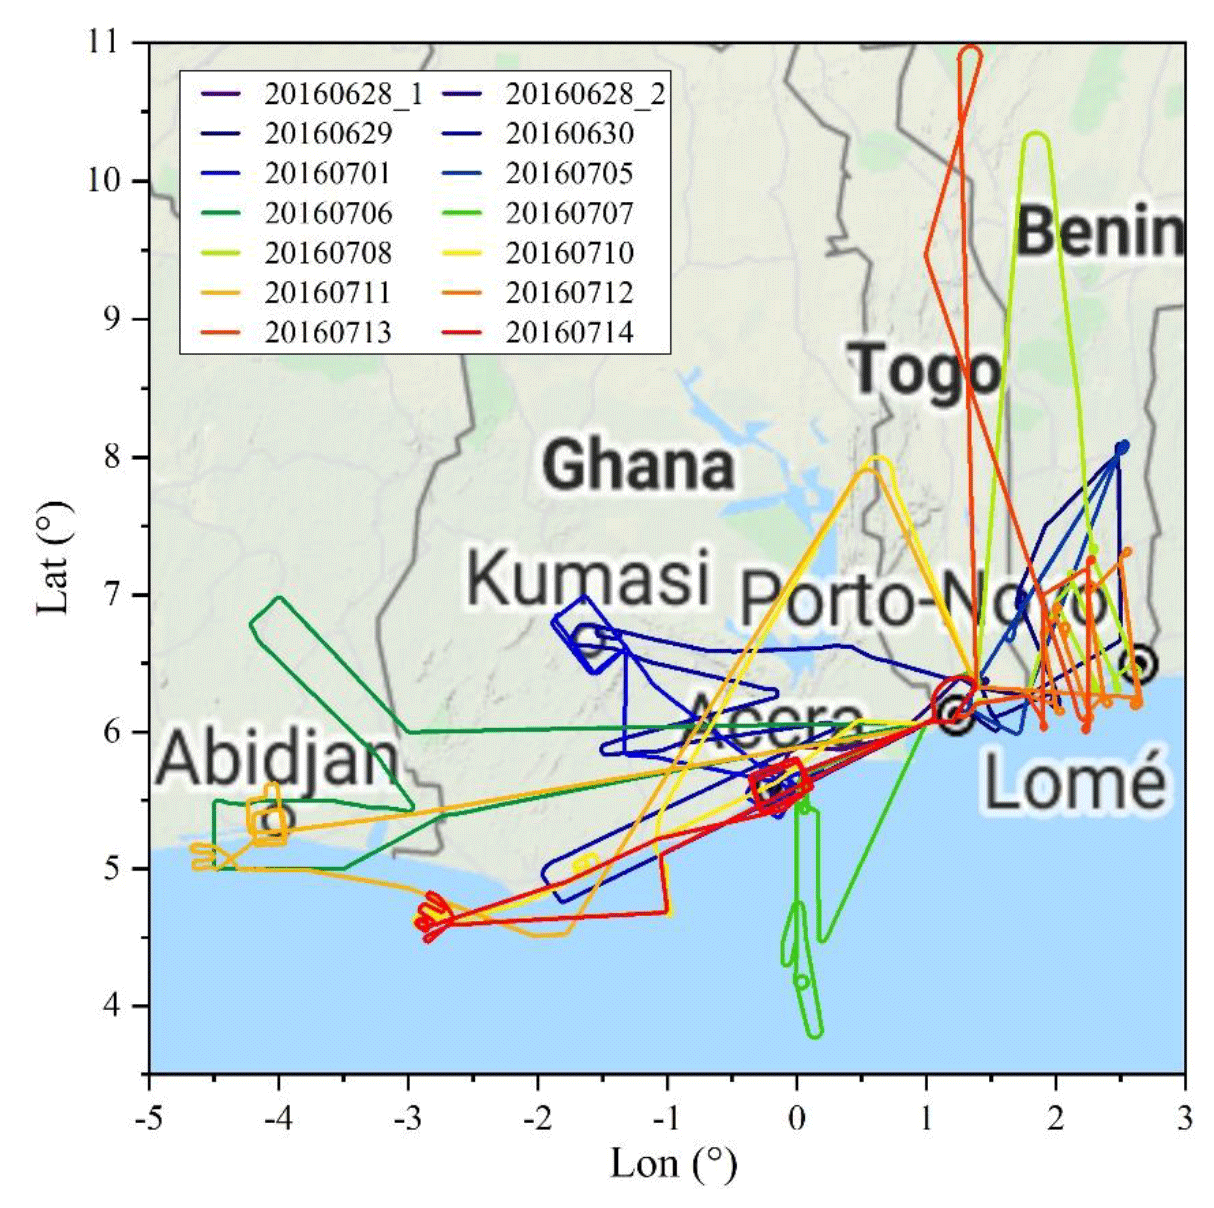
Figure 12Flight trajectories during the DACCIWA (2016) campaign. Map copyright: © Google Maps.
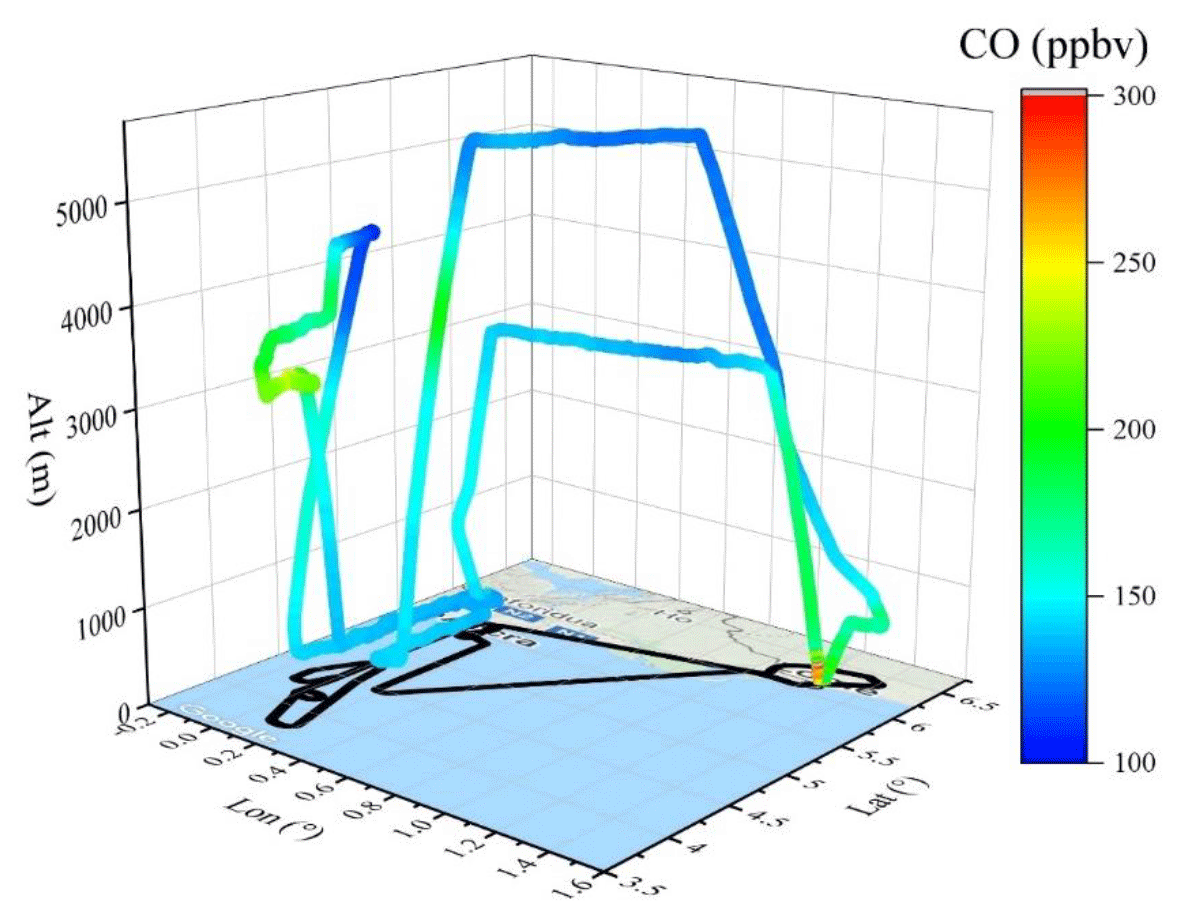
Figure 13Flight trajectory colored by CO levels on flight DACCIWA_20160707_1. Map copyright: © Google Maps.
Local emissions were frequently observed during this campaign. For instance, as shown in Fig. 14, the flight on 12 July 2016 allowed intensive measurements between Lomé (Togo) and Porto-Novo (Benin). Most measurements over the continent showed higher CO levels than those over the ocean, with several CO peaks up to 200 ppbv, occasionally accompanied by peaks of NO2 and SO2 (not shown). These peaks were observed within the boundary layer, indicating the impact of anthropogenic emissions in this region. These measurements are important for documenting and understanding local air pollution, considering that the increasing population and economy lead to more anthropogenic emissions (Knippertz et al., 2015). Also, aerosol pollution traced by CO levels (>155 ppbv) is shown to slightly enhance atmospheric cooling by low-level clouds in tropical West Africa by increasing the droplet number concentration and reducing the droplet size in the clouds (Hahn et al., 2023; Taylor et al., 2019).
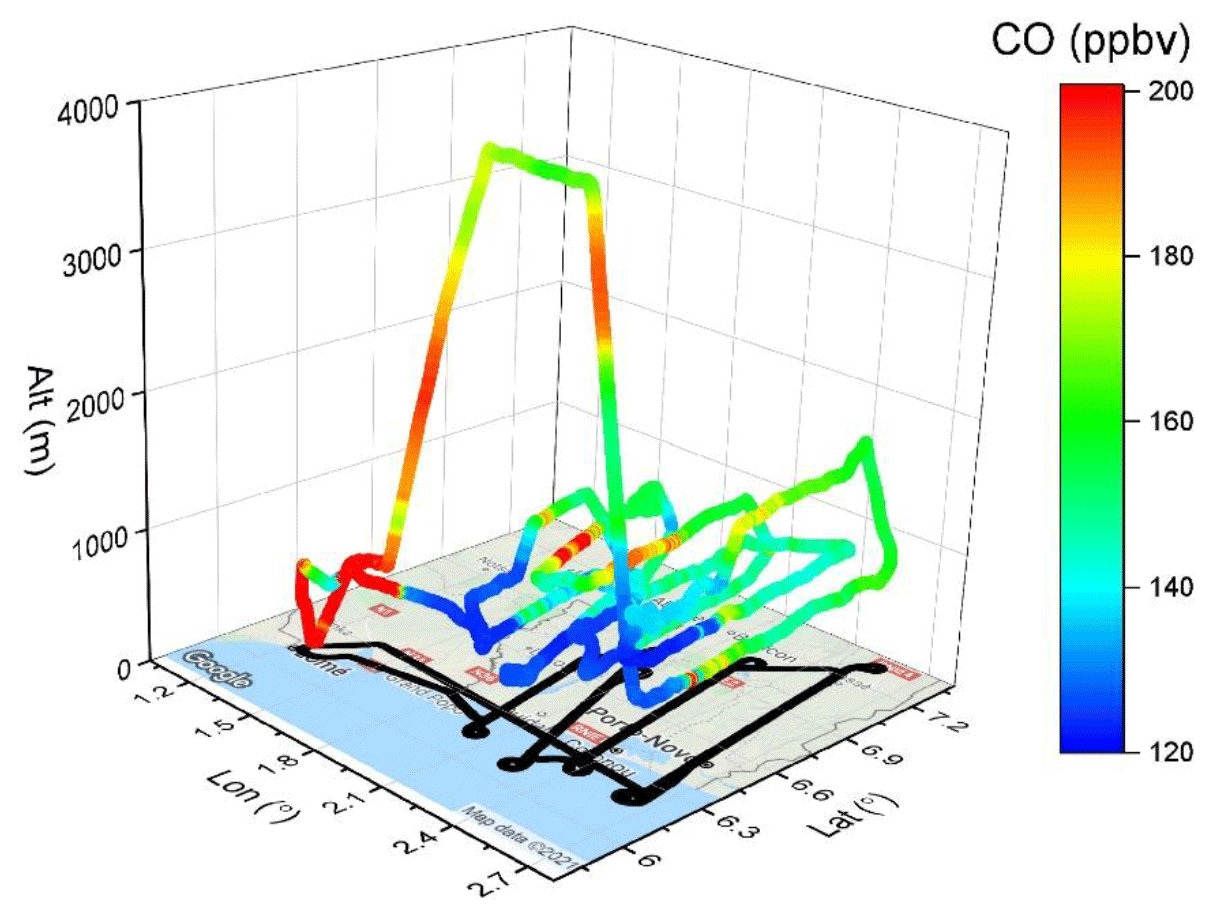
Figure 14Flight trajectory colored by CO levels on flight DACCIWA_20160712_1. Map copyright: © Google Maps.
3.7 MAGIC (2019)
MAGIC (Monitoring Atmospheric composition and Greenhouse gases through multi-Instrument Campaigns, https://magic.aeris-data.fr/, last access: 18 July 2023) is a long-term CNES-CNRS French project, with two main goals: (i) to better understand the vertical exchange of greenhouse gases along the atmospheric column, in connection with atmospheric transport, and sources and sinks of the gases at the surface and in the atmosphere and (ii) to contribute to the validation of the satellite products of IASI-MetOpC (CNES), Tropomi-Sentinel 5P (ESA), GOSAT 2 (JAXA), and OCO-2 (NASA) and to prepare the validation of the space missions MicroCarb, IASI-NG (CNES), and Merlin (CNES-DLR) dedicated to the monitoring of greenhouse gases and other species. In June 2019, the MAGIC campaign was conducted in France, with three flights over the Toulouse–La Rochelle–Orléans–Clermont–Ferrand region (Figs. 15 and S56–S58 for 3D trajectories with CO VMRs).
Similar to the Test-ATR project (Sect. 3.5), intensive in-flight calibrations were conducted, which led to the plots of CO versus flight trajectories (Figs. S56–S58). Figure 16 shows the measurements during calibration for the two flights on 18 June 2019. The eight calibration processes cover ascending, descending, and cruise periods in the altitude range of 0–12 km. This results in an agreement between the WMO CO_X2014A standard and the SPIRIT instrument of within 3.2±0.6 ppbv (1σ) out of 149.0 ppbv, confirming the accuracy and stability of SPIRIT for aircraft measurements.
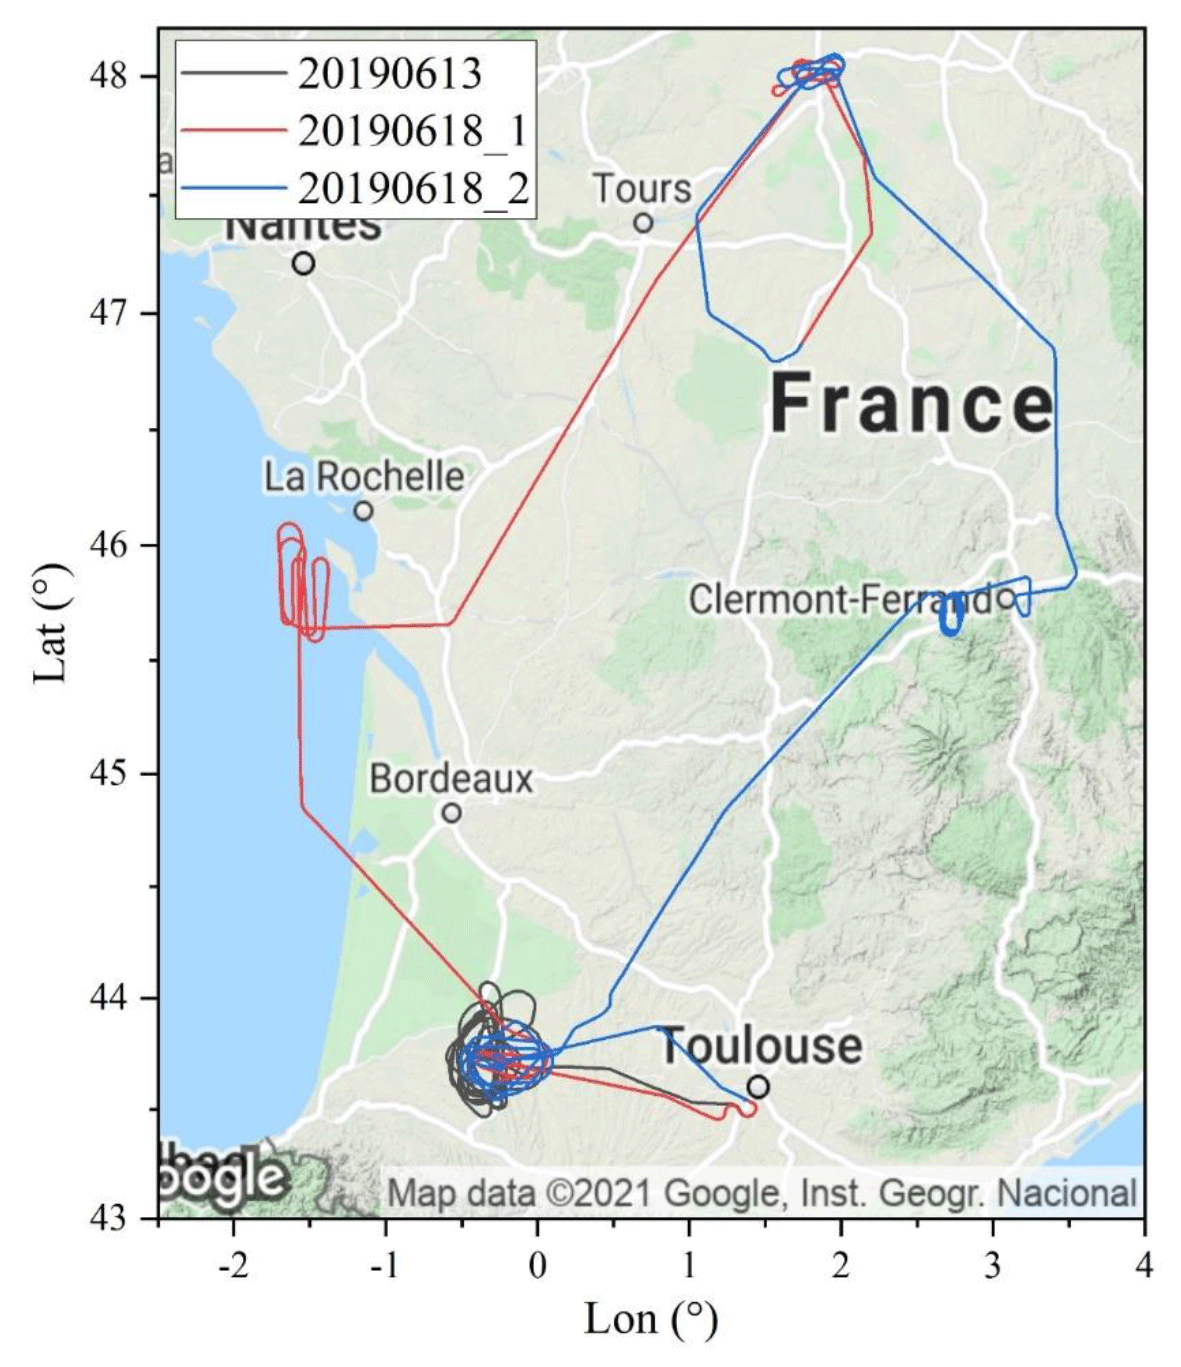
Figure 15Flight trajectories during the MAGIC (2019) campaign. Map copyright: © Google Maps.
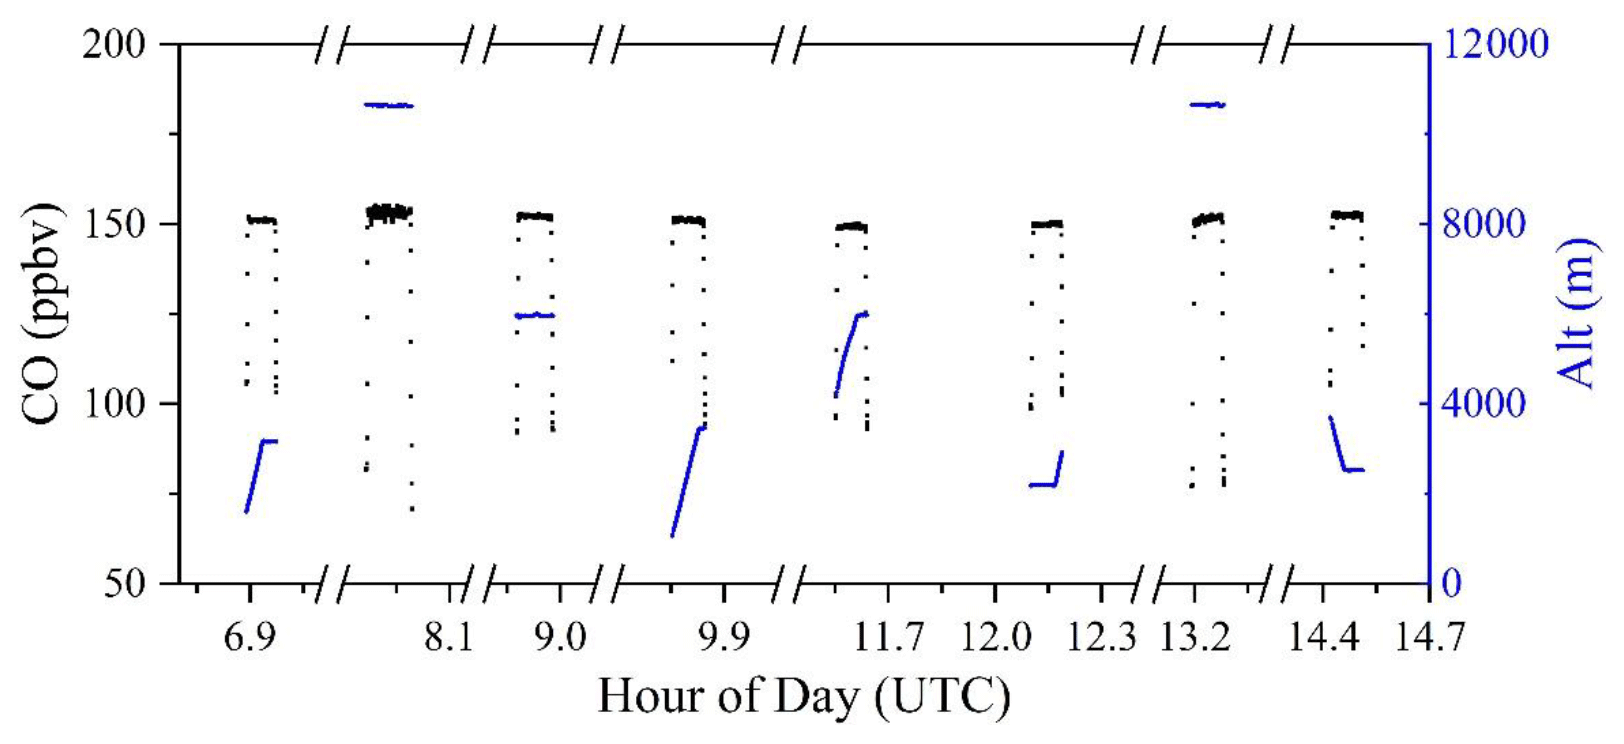
Figure 16Time series of CO values (black dot) and altitude (blue dot) during calibration on flight MAGIC_20190618_1 and MAGIC_20190618_2.
3.8 MAGIC (2021)
In the continuation of the MAGIC (2019) project above, exploring high-latitude regions, is of interest since these areas are warming faster than the average as a result of anthropogenic and natural emissions and transport of pollution. However, airborne measurements are scarce in high-latitude regions, which limits the understanding of the horizontal and vertical distribution of pollution and causes problems in validating satellite performance in those regions. In August 2021, the international MAGIC (2021) campaign (https://magic.aeris-data.fr/, last access: 18 July 2023) took place in Kiruna (67.9∘ N, 21.1∘ E), Sweden. As shown in Fig. 17, the six flights mainly took measurements over northern Sweden and northern Finland, with one flight reaching the Norwegian Sea (Figs. S59–S64).
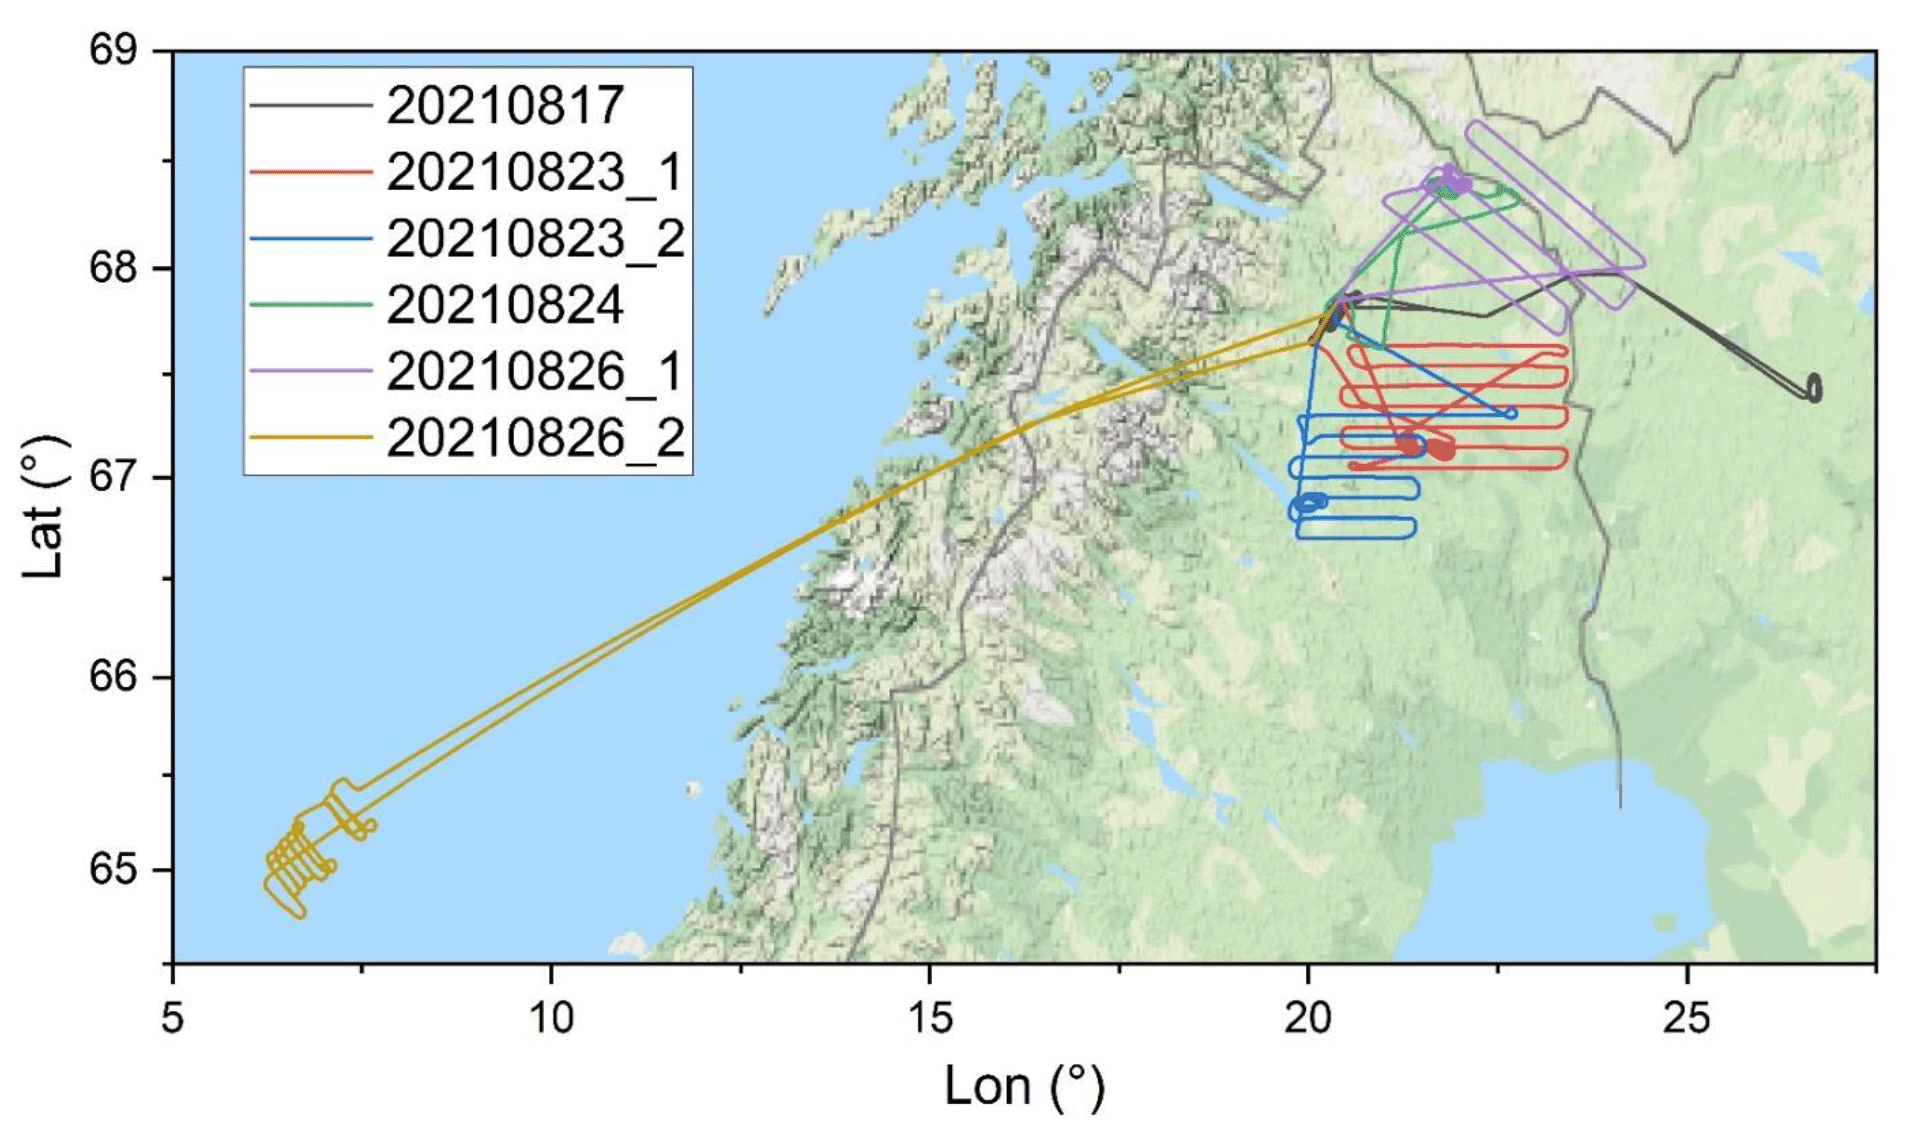
Figure 17Flight trajectories during the MAGIC (2021) campaign. Map copyright: © Google Maps.
On the morning of 23 August 2021, a flight was designed to provide measurements for the validation of the satellite products mentioned in Sect. 3.7. Intensive vertical and horizontal measurements were taken, synchronized with several satellite overpasses. As shown in Fig. 18, the aircraft spiralled up, achieving two vertical measurement profiles within an altitude range of 0–7.5 km a.s.l. At the maximum altitude, the aircraft descended to 4.5 km a.s.l. and conducted intensive horizontal measurements in the region of 67.0–67.6∘ N and 20.0–23.5∘ E. CO VMR was mostly around 150–250 ppbv in this region. After that, it spiralled up again to 7.5 km a.s.l., followed by spiraling down to the ground level before landing back at Kiruna Airport. CO was mostly around 150 ppbv within the boundary layer of ∼2 km a.s.l. However, it increased with altitude above the boundary layer (peak of 285 ppbv at ∼5.5 km a.s.l., Fig. 29), likely due to long-range transported fire pollution (study in progress).
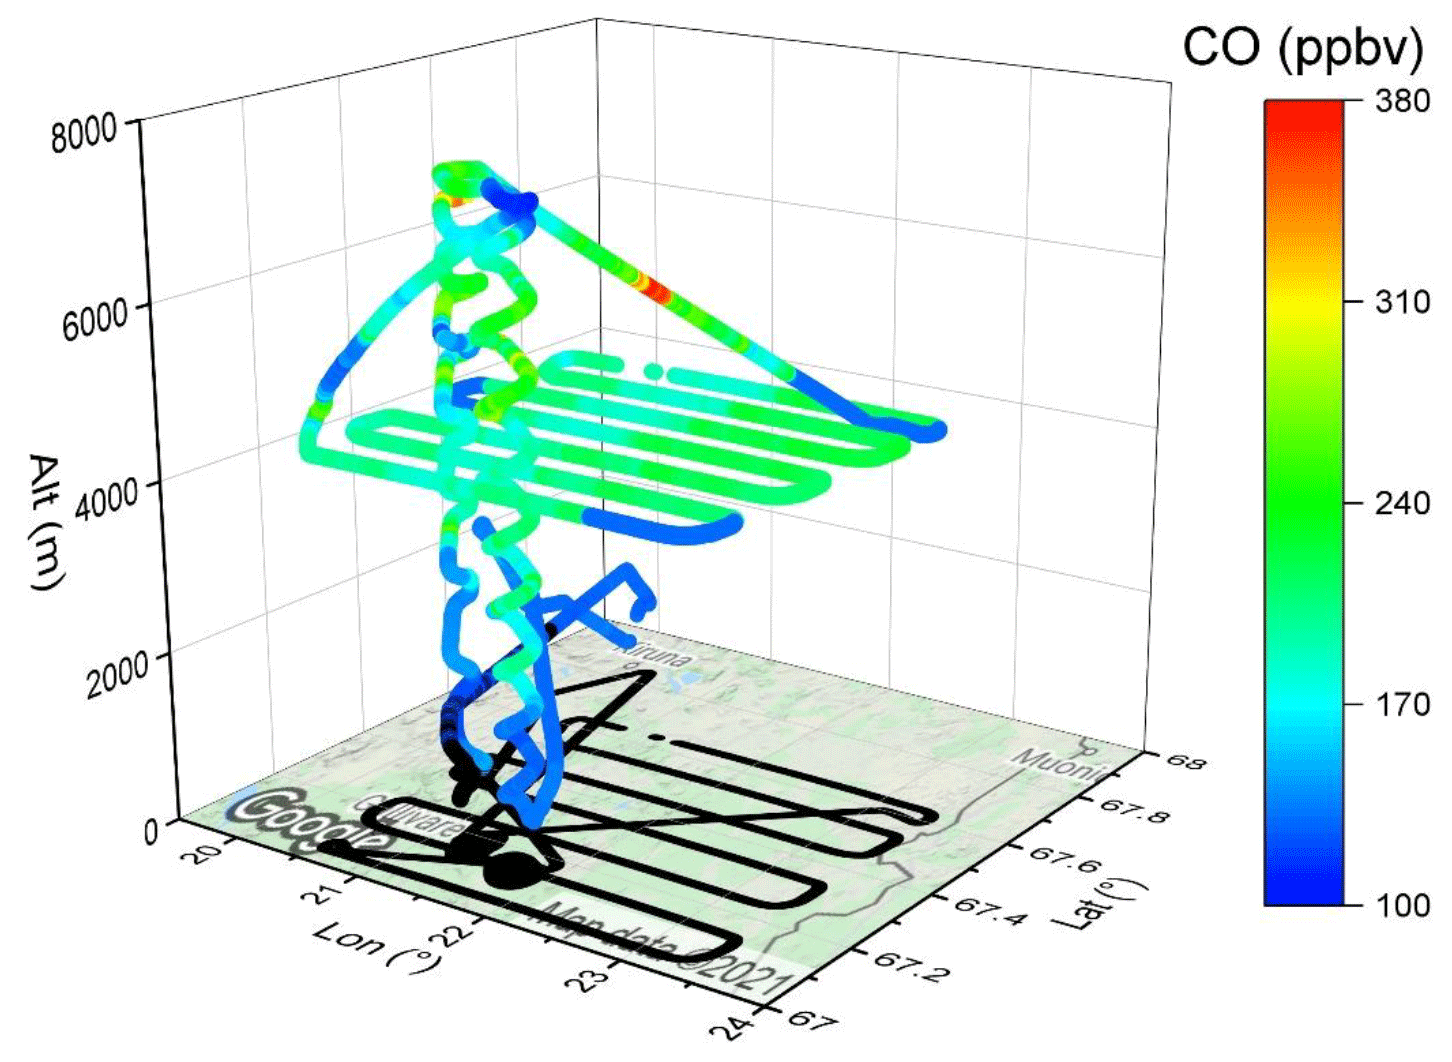
Figure 18Flight trajectory colored by CO levels on flight MAGIC_20210823_1. Map copyright: © Google Maps.
In addition to long-range transport, local emissions from fires were also observed. Measurements on 26 August showed the impact of two pollution sources. On the morning of 26 August, a fire caused by a rocket engine test occurred at the Swedish Space Corporation Esrange Space Center (67.9∘ N, 21.1∘ E), which burned parts of the launching facility for sounding rockets and parts of nearby buildings (red star in Fig. 19). The plume of this fire was captured by our measurements. As shown in Fig. 19, the aircraft took off at Kiruna Airport at around 09:05 LT. Around 5 min after the take-off, high CO peaks of more than 200 ppbv were observed at an altitude of 2000–2750 m a.s.l., which is nearly above the location of the fire at the Esrange Space Center. The plume was also frequently observed at higher altitudes, i.e., four CO peaks of above 200 ppbv were observed at around 5600 m a.s.l. and distributed on a straight line, indicating the wide spread of the plume.
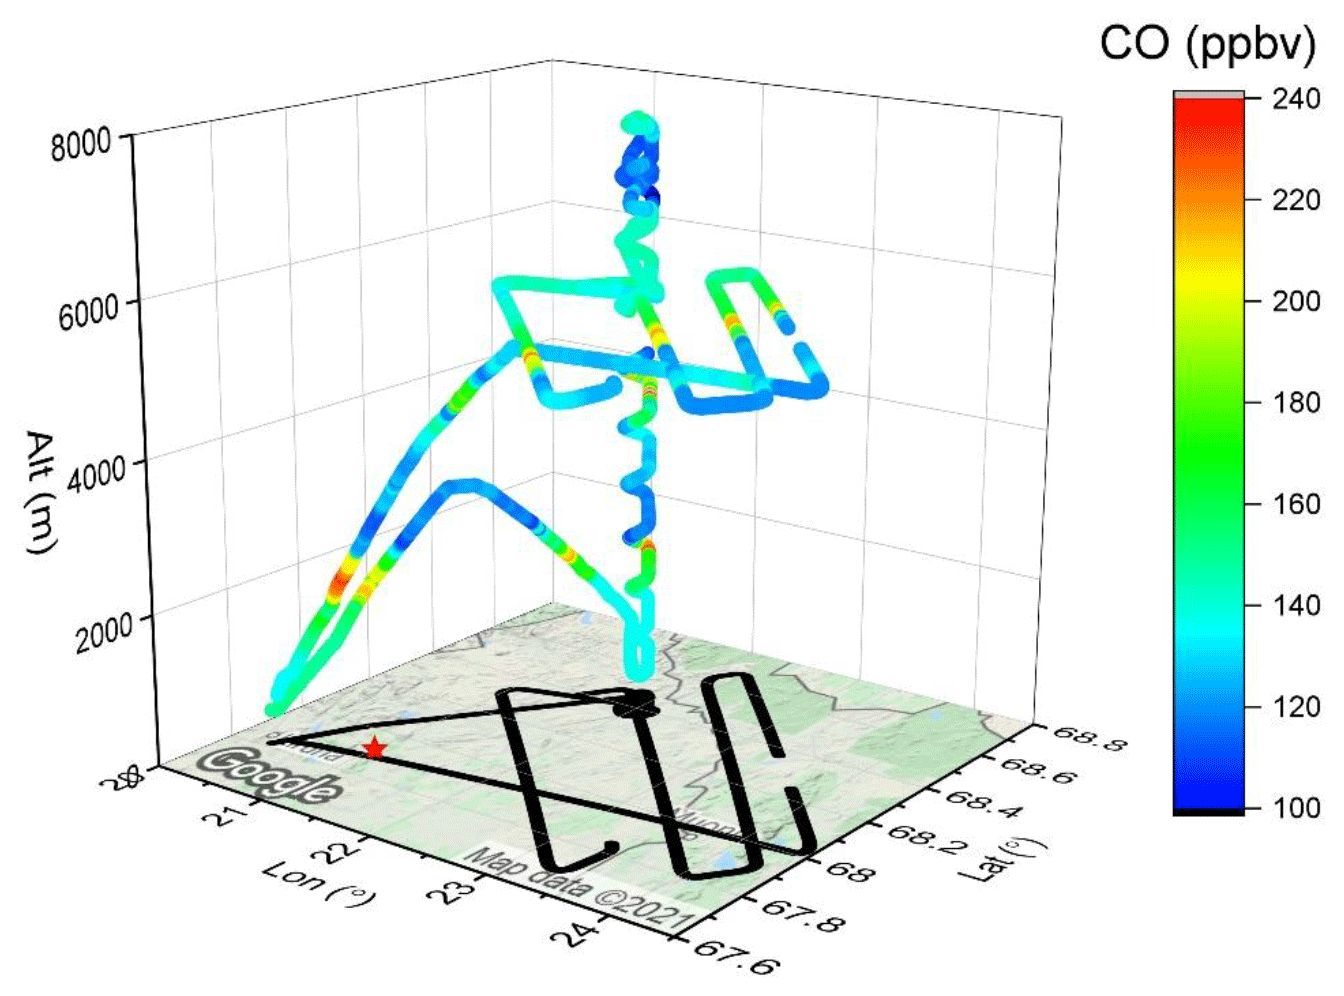
Figure 19Flight trajectory colored by CO levels on flight MAGIC_20210826_1. The red star represents the location of the fire at Esrange. Map copyright: © Google Maps.
3.9 Intercontinental measurements
Two intercontinental measurements were achieved during the SHIVA and DACCIWA projects. Aircraft traveled from Germany to Malaysia in Southeast Asia in November 2011 and to Ghana in West Africa in June 2016. Except for landing and take-off, the measurement height was typically constant at a typical cruise altitude of ∼10 km a.s.l. This allowed for assessment of the performance of chemical transport models and validation of satellite observations on a global scale.
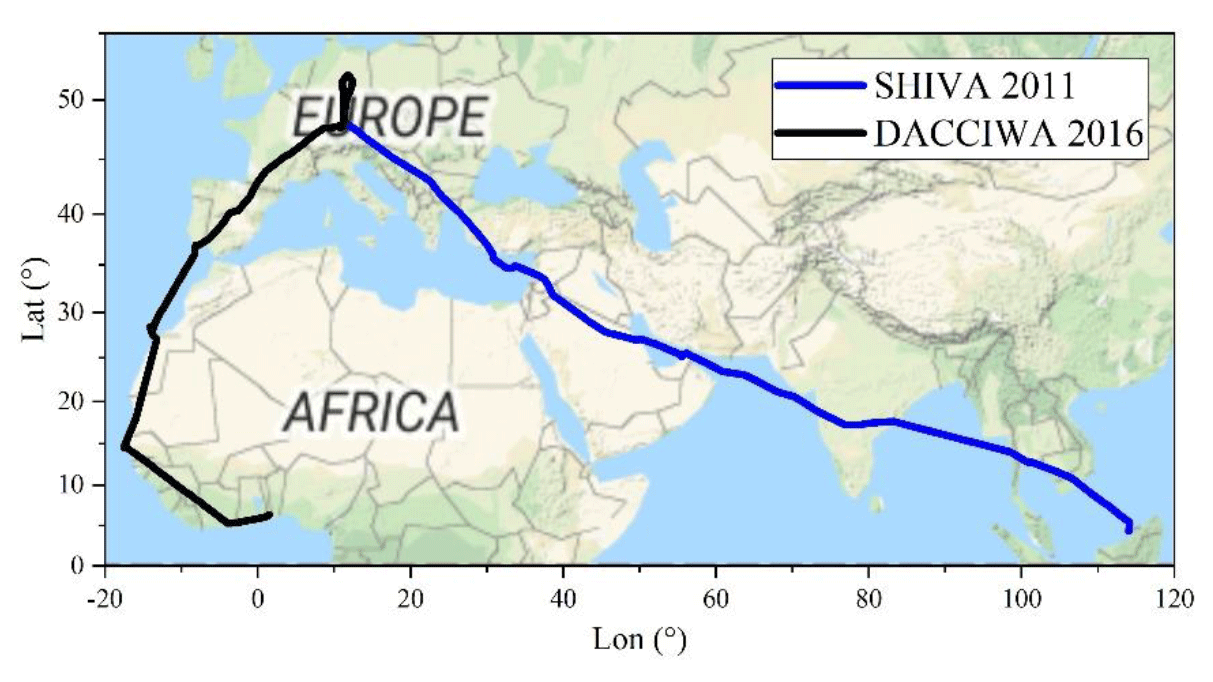
Figure 20Trajectories of the two intercontinental flights during the SHIVA (2011) and DACCIWA (2016) campaigns. Map copyright: © Google Maps.
3.9.1 Europe–Asia
In the framework of SHIVA, intercontinental measurements were taken from Munich (Germany) to Miri (Malaysia), with four stops, at Larnaca (Cyprus), Dubai (United Arab Emirates), Hyderabad (India), and U-Tapao Airport, Pattaya (Thailand), respectively (Fig. 21). Except for CO peaks observed after the take-off, the measured CO was typically lower than 110 ppbv. Higher CO levels (>130 ppbv) were observed in the boundary layer over Hyderabad and Pattaya, indicating the impacts of local anthropogenic emissions. The pollution of the boundary layer above these last two cities is clearly visible, with CO levels well above 200 ppbv. Also, before landing at Miri, a polluted plume, with significant CO enhancements from around 80 to 200 ppbv, was observed at 10680 m a.s.l. The width of the measured plume was about 630 km, indicating a large emission event and a wide spread. The observed plume may have originated from events with intensive emissions, such as wildfires, and convective transport (Krysztofiak et al., 2018; Hamer et al., 2021).
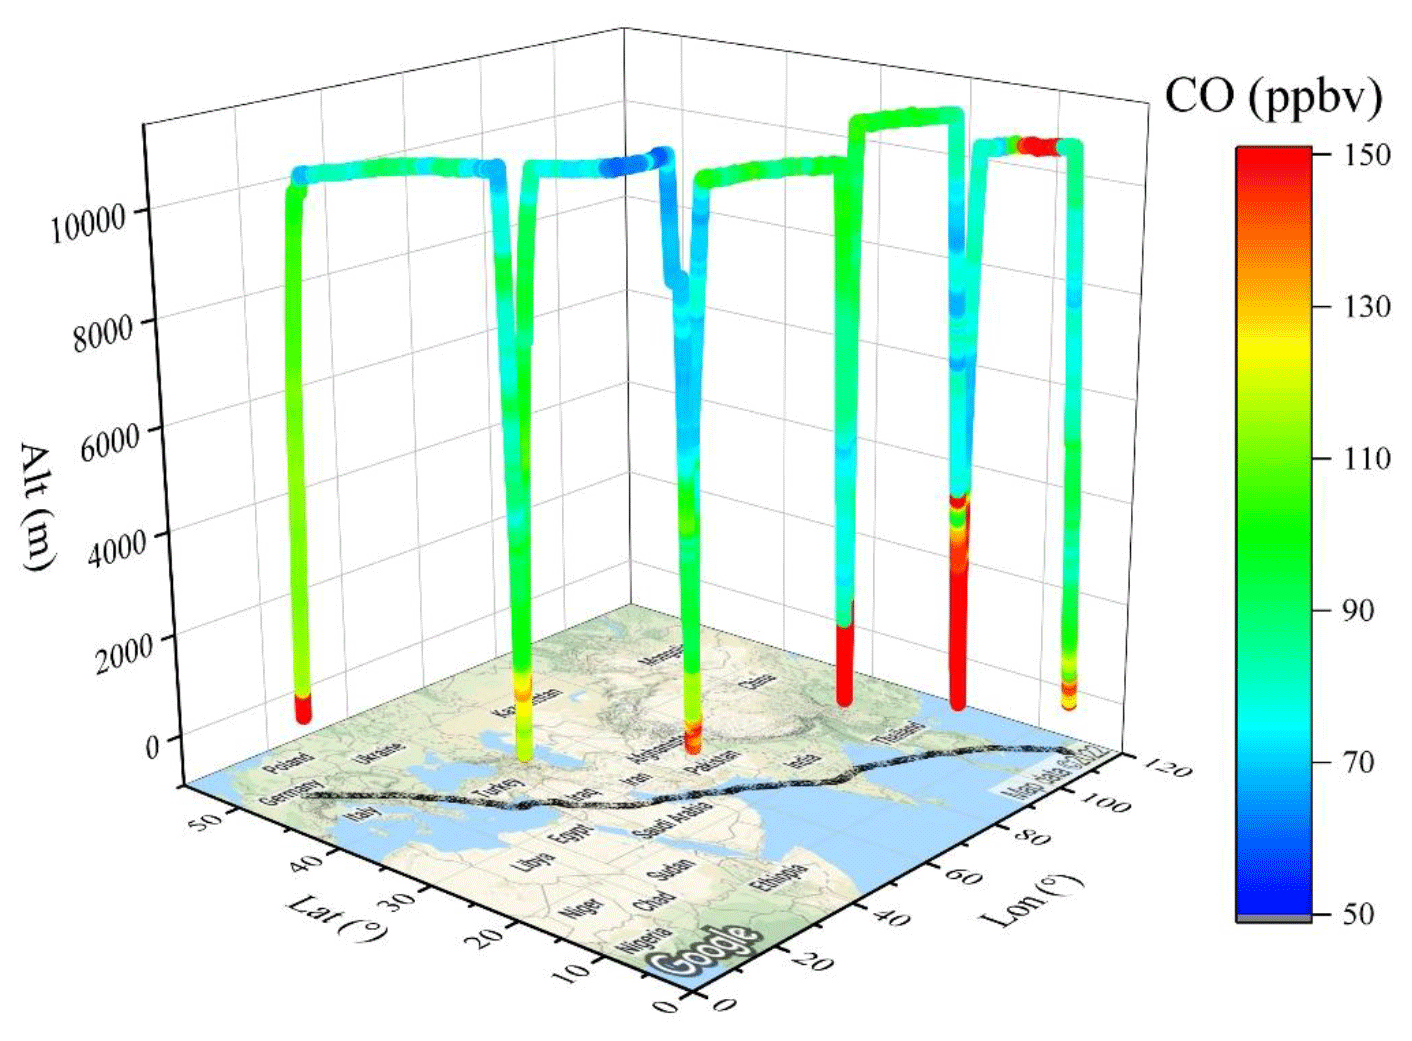
Figure 21Flight trajectory colored by CO levels during the intercontinental flight during the SHIVA (2011) campaign. Map copyright: © Google Maps.
3.9.2 Europe–Africa
During the DACCIWA project, the SPIRIT instrument was on board the DLR Falcon-20 for measurements during the transit flights from Germany to Togo. There were three stops: Faro (Portugal), Fuerteventura (Canary Islands, Spain), and Dakar (Senegal), which allowed for measurements to be taken across western Europe and along the coastal lines of North and West Africa. CO measured over western Europe and North Africa is typically lower than 100 ppbv. However, higher CO levels were observed over West Africa in the boundary layer and the upper troposphere. For example, before landing at Lomé (Togo), polluted plumes with CO up to 150 ppbv were observed in the altitude range of 20–4700 m a.s.l., suggesting strong impacts of regional anthropogenic emissions.
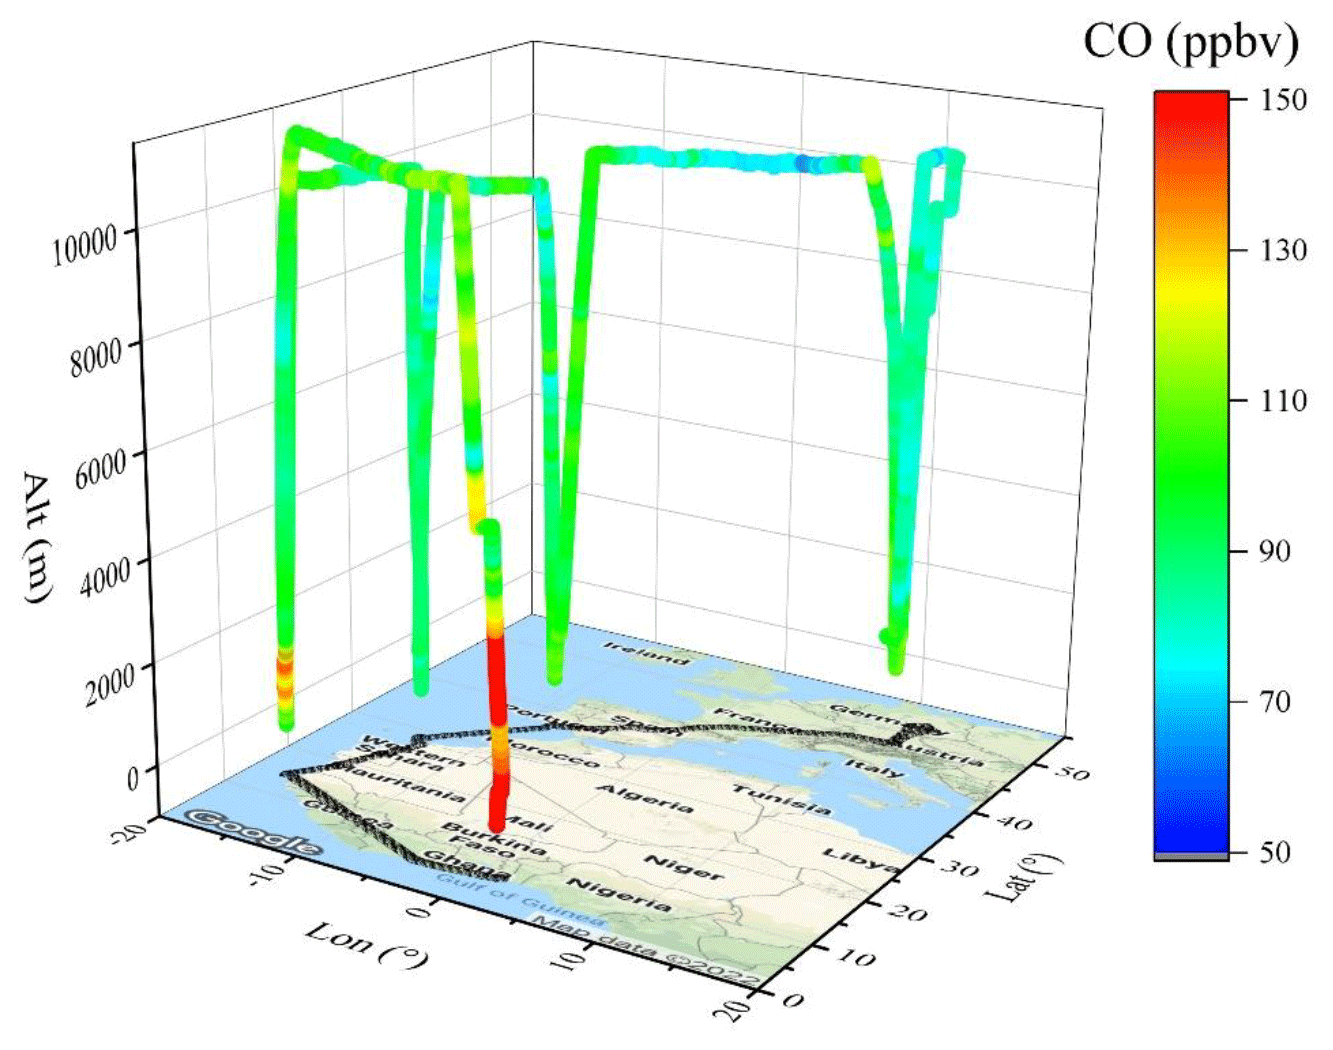
Figure 22Flight trajectory colored by CO levels during the intercontinental flight during the DACCIWA (2016) campaign. Map copyright: © Google Maps.
3.10 Vertical profiles of CO in the different regions
Figures 23–29 show the vertical profiles of CO observed during the campaigns. In most cases, CO levels decrease with altitude within the boundary layer (∼1–2 km a.s.l.) from 100–200 ppbv (depending on the region) to lower values in the free troposphere; characterized as such, these indicate the strong impact of anthropogenic emissions. Similar observations are made in Alaska, where a nearly constant CO value was observed in an altitude range of 0–2 km a.s.l. (Spackman et al., 2010). However, surface CO VMRs in West Africa (Fig. 27) are generally in the range of 200–300 ppbv. They are higher than in other regions. Indeed, in Europe and the whole Mediterranean Basin (including TC2 (2013), ChemCallnt (2014), and GLAM (2014)), most surface CO levels are lower than 150 ppbv. In southern Asia, surface CO is typically at a similar level to Europe, with exceptions reaching more than 200 ppbv.
Unlike other regions, the CO vertical profile measured in high-latitude regions (Kiruna, Sweden) during the MAGIC (2021) campaign increases with altitude, with CO levels of up to 300 ppbv in the altitude range of 5000–7000 m a.s.l. (Fig. 28). CO levels during summer seem similar or higher than inland Europe although a lower anthropogenic emission is expected, suggesting a large contribution from the transport of plumes from wildfires at high-latitude regions. Indeed, assimilated TROPOMI satellite observations and CAMS model simulations reported large CO emissions from wildfires over North America and Russia in July and August 2021, which led to high CO column concentrations in the Arctic region.
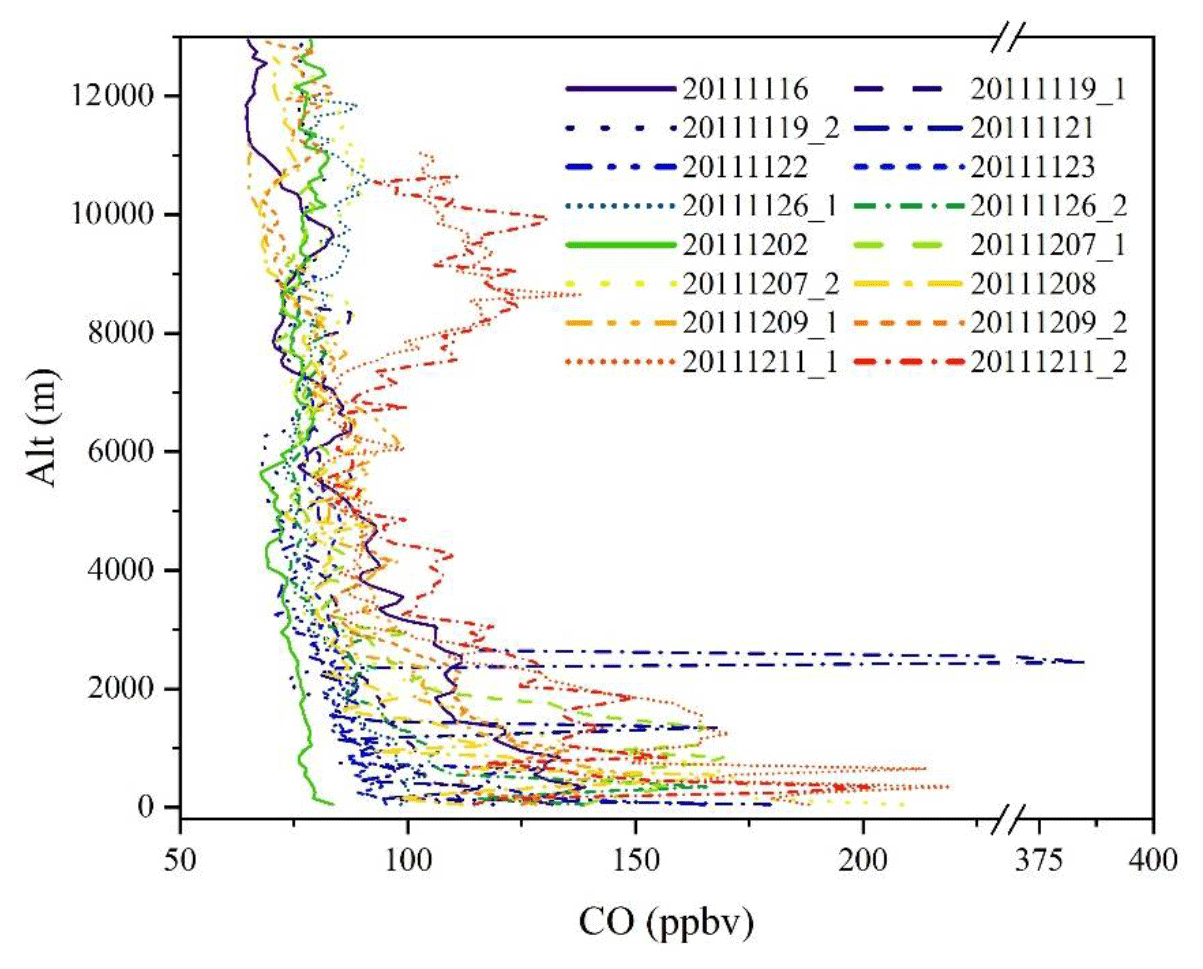
Figure 23Vertical profiles of CO of all flights during the SHIVA (2011) campaign in South Asia. Vertical average bin: 100 m.
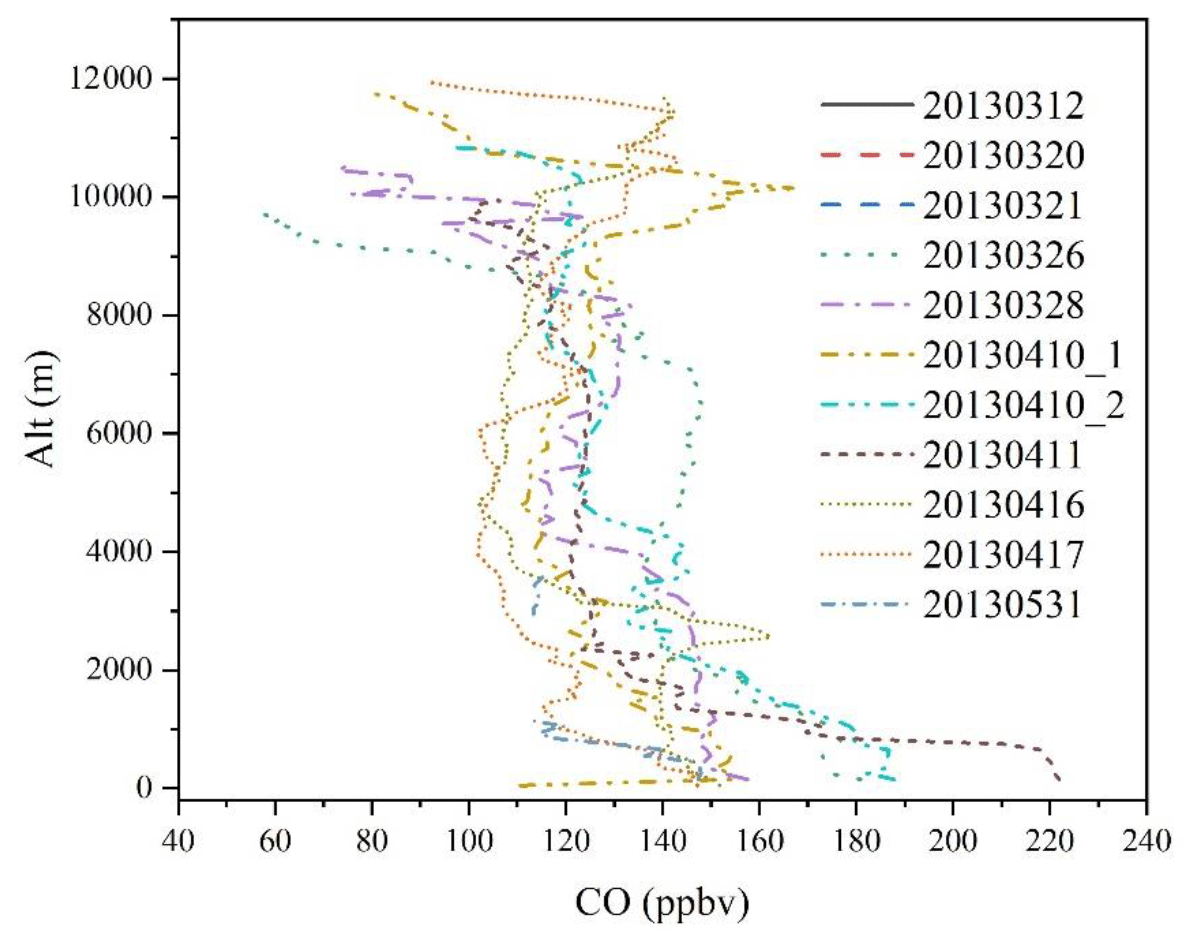
Figure 24Vertical profiles of CO of all flights during the TC2 (2013) campaign in southwestern France. Vertical average bin: 100 m.
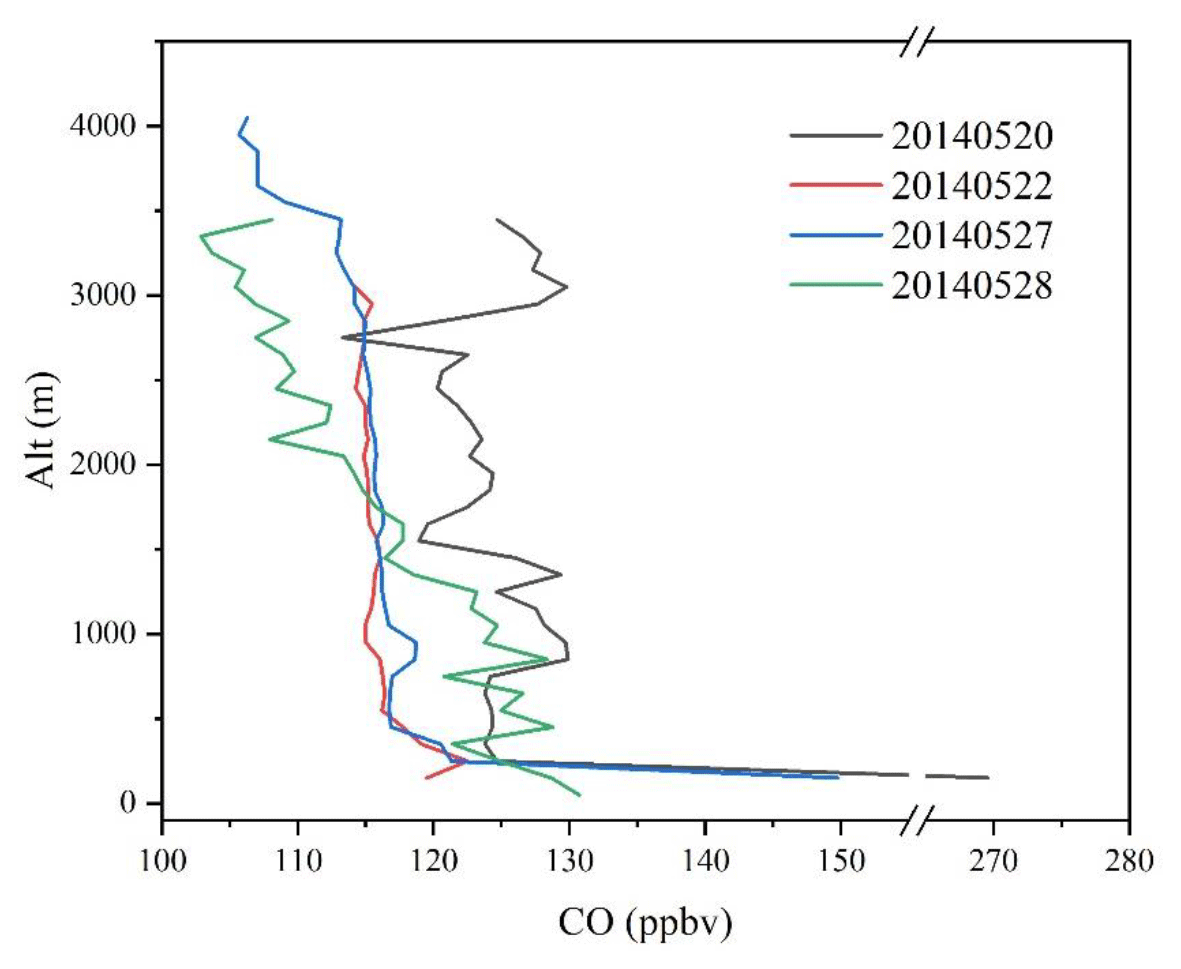
Figure 25Vertical profiles of CO of all flights during the ChemCallnt (2014) campaign in southern France. Vertical average bin: 100 m.
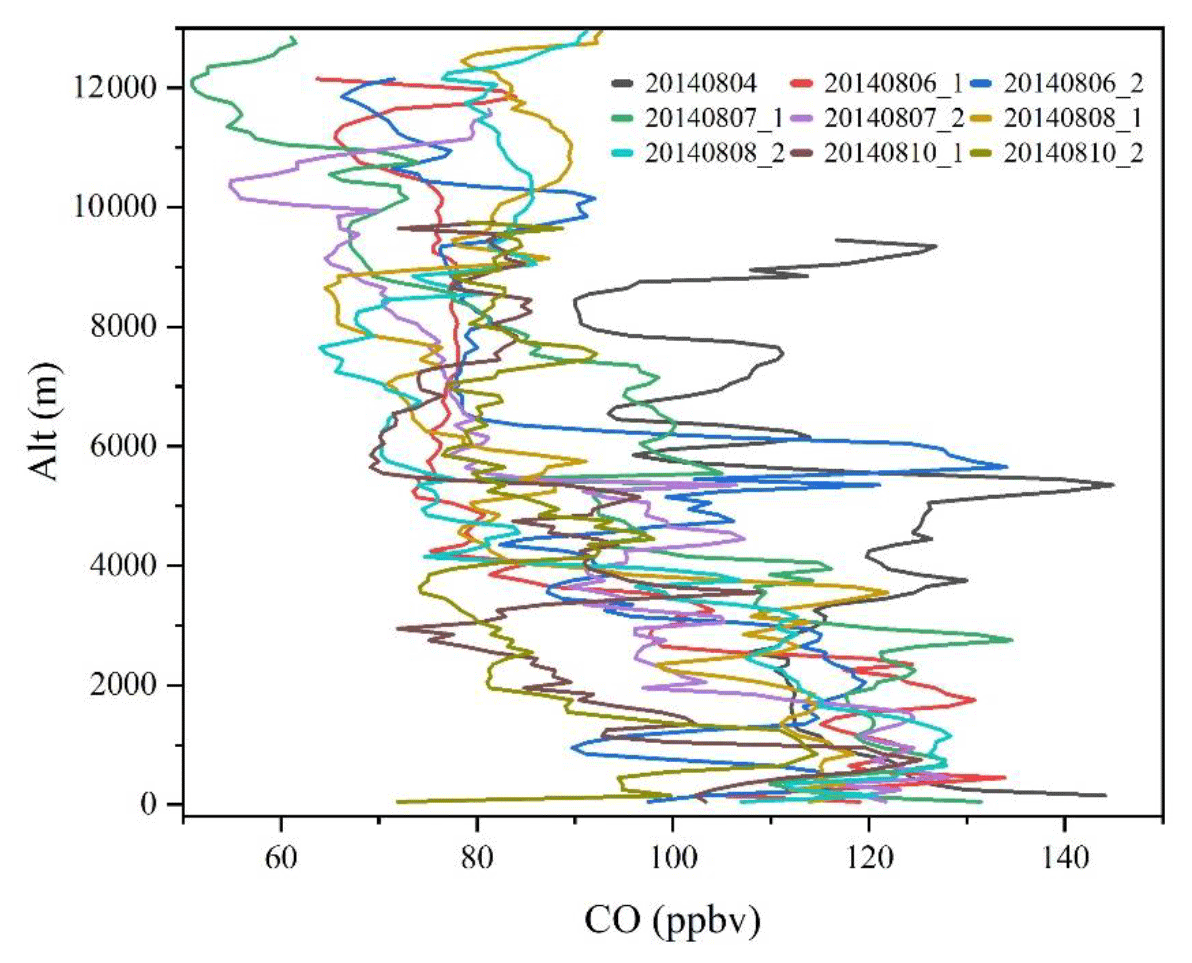
Figure 26Vertical profiles of CO of all flights during the GLAM (2014) campaign over the Mediterranean Basin. Vertical average bin: 100 m.
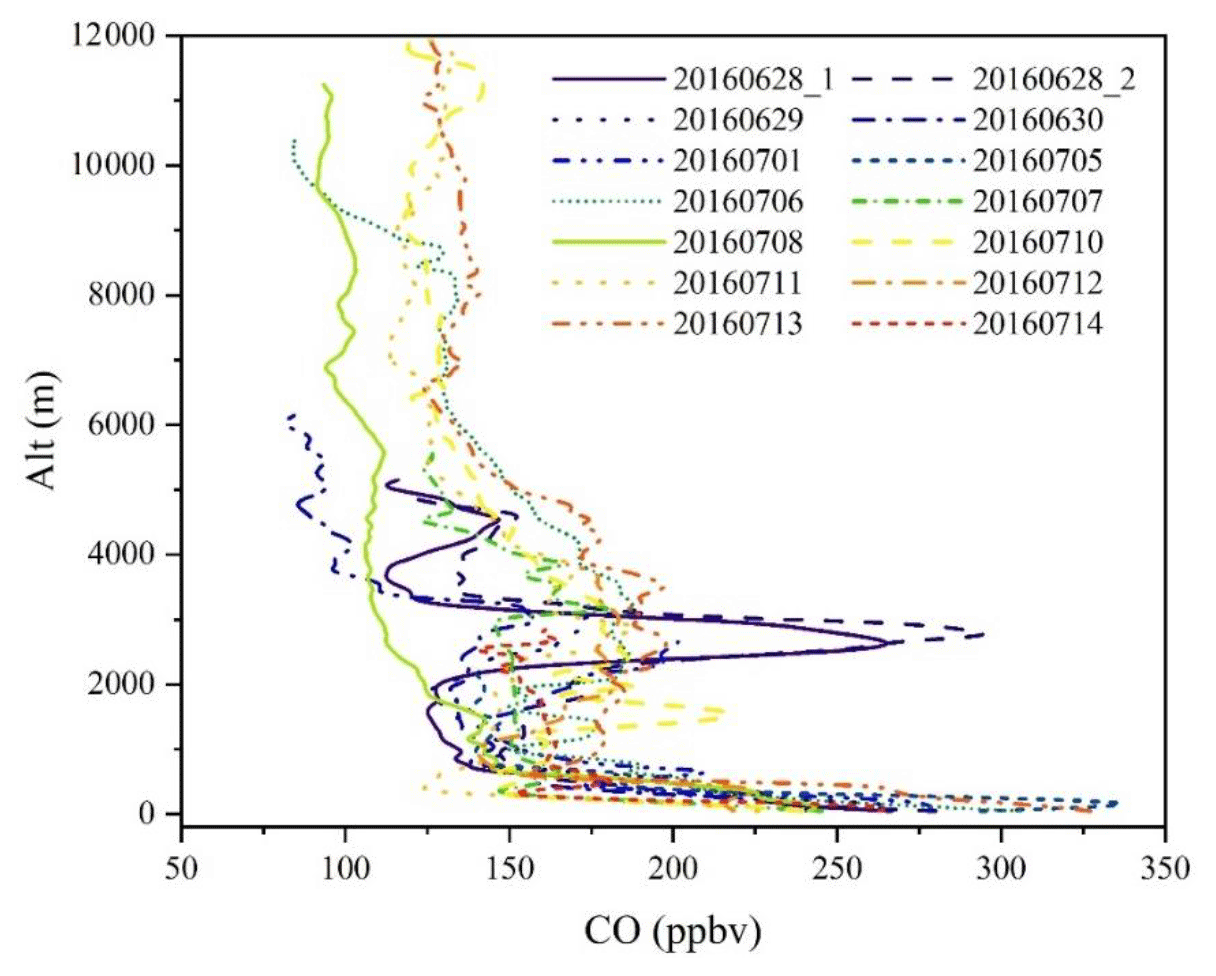
Figure 27Vertical profiles of CO of all flights during the DACCIWA (2016) campaign in West Africa. Vertical average bin: 100 m.
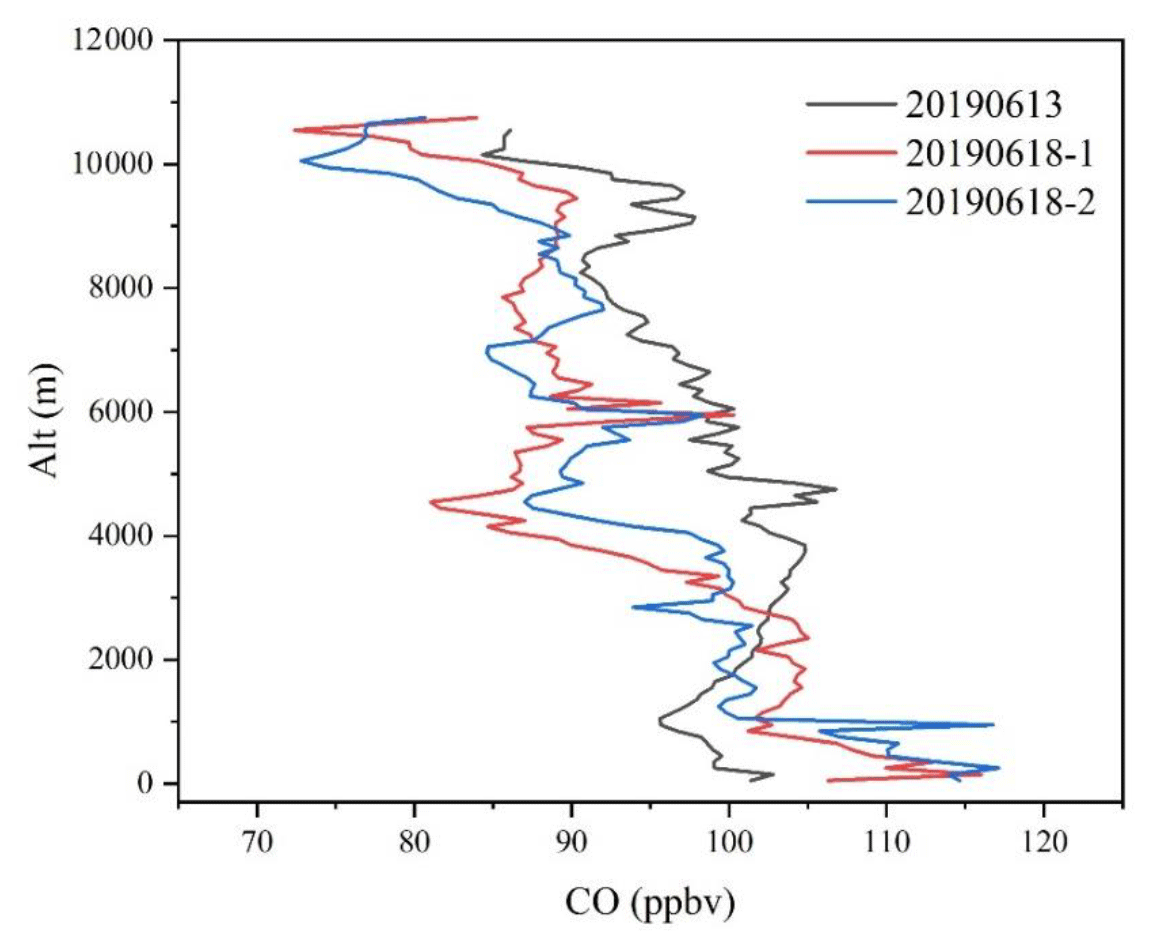
Figure 28Vertical profiles of CO of all flights during the MAGIC (2019) campaign in France. Vertical average bin: 100 m.
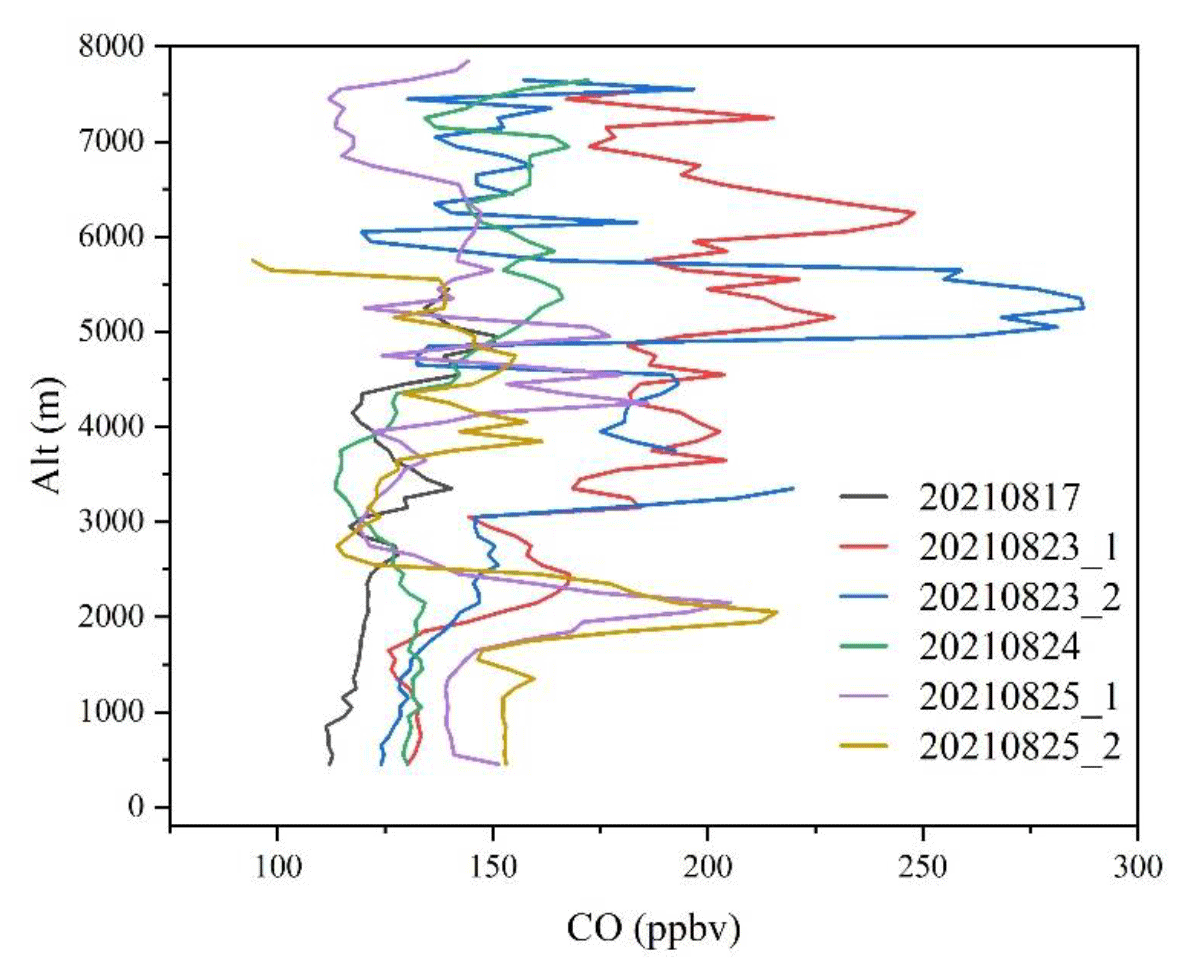
Figure 29Vertical profiles of CO of all flights during the MAGIC (2021) campaign in northern Sweden. Vertical average bin: 100 m.
All the data used in this study are publicly available on the AERIS database (Catoire et al., 2023: https://doi.org/10.25326/440). Any questions concerning this current database or the scheduled SPIRIT aircraft measurements in the future are welcomed; please contact the corresponding author. Furthermore, there are also CO measurements on aircraft and balloon platforms referenced in AERIS database, such as in situ measurements during StraPolÉté in 2009 (Krysztofiak et al., 2012) and off-line AirCore measurements in 2017 (Hooghiem et al., 2020).
The 3D aircraft trajectories were plotted by OriginPro 2021 (https://www.originlab.com/, last access: 18 July 2023, license needed; OriginLab, 2023a), and the background maps were inputted by a built-in application (Google Map Import, created by OriginLab Technical Support, available at https://www.originlab.com/fileExchange/details.aspx?fid=344, last access: 18 July 2023; OriginLab, 2023b).
Thanks to the development of the SPIRIT instrument, accurate airborne CO measurement (0.3 ppbv precision at 1σ and overall uncertainty <4 ppbv) was achieved during the past decade (2011–2021). This database describes all aircraft CO measurements by SPIRIT during this period. More than 200 h of airborne measurement was conducted in Europe, South Asia, and West Africa. The measurement domain covers a wide area, including tropical, northern mid-latitude, and northern high-latitude regions. This database also includes two unique intercontinental measurements, one from Germany to Ghana via the West African coast, and the other from Germany to Malaysia.
Generally, surface CO levels in South Asia, Europe, and the whole Mediterranean Basin region are at a similar level, namely with mixing ratios <150 ppbv, which are lower than that the coastal region of West Africa (200–300 ppbv). Moreover, CO levels decrease with altitude for most measurements except at high-latitude regions, where CO increases with altitude. This database can be of particular interest for studying anthropogenic emissions (DACCIWA (2016)), aviation emissions (TC2 (2013)), wildfire emissions (SHIVA (2011), DACCIWA (2016)), shipping and offshore oil rig emissions (GLAM (2014), DACCIWA (2016)), convective plumes (SHIVA (2011)), urban background (ChemCallnt (2014), MAGIC (2019)), and long-distance transport (GLAM (2014), MAGIC (2021)). This database helps in understanding such events and in constraining and improving relevant model approaches. For instance, based on SHIVA data, it is found that the convective system can significantly affect the composition of the upper troposphere (Krysztofiak et al., 2018; Hamer et al., 2021). Siberian forest fires can affect the atmosphere over the Mediterranean Basin through long-distance transport, which was confirmed by measurements taken during the GLAM (2014) project, with a combination of a trajectory model and a chemical transport model (Brocchi et al., 2018). Brocchi et al. (2019) analyzed DACCIWA measurements and found that offshore oil rigs could contribute to deteriorating air quality in coastal regions of West Africa. Moreover, with the emerging utilization of satellite images, the importance of the calibration of those measurements at a regional and/or a global scale becomes more and more significant, revealing the importance of the SPIRIT database. For example, CO measurements during the DACCIWA (2016) project will be used to validate satellite product from Measurement of Pollution in the Troposphere (MOPITT).
The supplement related to this article is available online at: https://doi.org/10.5194/essd-15-4553-2023-supplement.
CX, GK, and VC lead this study. All authors participated in development, data acquisition, and/or maintenance of SPIRIT during at least one field campaign. All authors commented on and approved this article.
The contact author has declared that none of the authors has any competing interests.
Publisher's note: Copernicus Publications remains neutral with regard to jurisdictional claims in published maps and institutional affiliations.
We are grateful to LPC2E colleagues Gilles Chalumeau, Thierry Vincent, Kevin Le Letty, Olivier Chevillon, and Anne-Laure Pelé for mechanical, electronic, and optical development, aircraft campaign support, and data analysis of the SPIRIT instrument, as well as the master's students Guillaume Robelet and Abdelmalek Bakha (University of Orléans) for their help with data retrieval and visualization. We thank Hans Schlager (DLR) for facilitating access to the SHIVA and DACCIWA projects and the associated DLR Falcon-20 aircraft. We thank SAFIRE (CNRS, Météo-France, CNES) for flying research aircraft in excellent conditions.
This paper was edited by Yuqiang Zhang and reviewed by two anonymous referees.
This work was supported by the PIVOTS project provided by the Region Centre – Val de Loire (ARD 2020 program and CPER 2015–2020) and the Labex VOLTAIRE project (grant no. ANR-10-LABX-100-01, managed by the University of Orléans). Funding also came from the projects SHIVA (grant no. 226224-FP7-ENV-2008-1), EUFAR2 TransNational Access, DACCIWA (grant no. 603502), ChArMEx-MISTRALS, ChemCallnt French initiative, and MAGIC (CNRS-INSU, CNES, ADEME, Météo-France, CEA).
Acharja, P., Ali, K., Trivedi, D. K., Safai, P. D., Ghude, S., Prabhakaran, T., and Rajeevan, M.: Characterization of atmospheric trace gases and water soluble inorganic chemical ions of PM1 and PM2.5 at Indira Gandhi International Airport, New Delhi during 2017–18 winter, Sci. Total Environ., 729, 138800, https://doi.org/10.1016/j.scitotenv.2020.138800, 2020.
Andreae, M. O., Acevedo, O. C., Araùjo, A., Artaxo, P., Barbosa, C. G. G., Barbosa, H. M. J., Brito, J., Carbone, S., Chi, X., Cintra, B. B. L., da Silva, N. F., Dias, N. L., Dias-Júnior, C. Q., Ditas, F., Ditz, R., Godoi, A. F. L., Godoi, R. H. M., Heimann, M., Hoffmann, T., Kesselmeier, J., Könemann, T., Krüger, M. L., Lavric, J. V., Manzi, A. O., Lopes, A. P., Martins, D. L., Mikhailov, E. F., Moran-Zuloaga, D., Nelson, B. W., Nölscher, A. C., Santos Nogueira, D., Piedade, M. T. F., Pöhlker, C., Pöschl, U., Quesada, C. A., Rizzo, L. V., Ro, C.-U., Ruckteschler, N., Sá, L. D. A., de Oliveira Sá, M., Sales, C. B., dos Santos, R. M. N., Saturno, J., Schöngart, J., Sörgel, M., de Souza, C. M., de Souza, R. A. F., Su, H., Targhetta, N., Tóta, J., Trebs, I., Trumbore, S., van Eijck, A., Walter, D., Wang, Z., Weber, B., Williams, J., Winderlich, J., Wittmann, F., Wolff, S., and Yáñez-Serrano, A. M.: The Amazon Tall Tower Observatory (ATTO): overview of pilot measurements on ecosystem ecology, meteorology, trace gases, and aerosols, Atmos. Chem. Phys., 15, 10723–10776, https://doi.org/10.5194/acp-15-10723-2015, 2015.
Andrés Hernández, M. D., Hilboll, A., Ziereis, H., Förster, E., Krüger, O. O., Kaiser, K., Schneider, J., Barnaba, F., Vrekoussis, M., Schmidt, J., Huntrieser, H., Blechschmidt, A.-M., George, M., Nenakhov, V., Harlass, T., Holanda, B. A., Wolf, J., Eirenschmalz, L., Krebsbach, M., Pöhlker, M. L., Kalisz Hedegaard, A. B., Mei, L., Pfeilsticker, K., Liu, Y., Koppmann, R., Schlager, H., Bohn, B., Schumann, U., Richter, A., Schreiner, B., Sauer, D., Baumann, R., Mertens, M., Jöckel, P., Kilian, M., Stratmann, G., Pöhlker, C., Campanelli, M., Pandolfi, M., Sicard, M., Gómez-Amo, J. L., Pujadas, M., Bigge, K., Kluge, F., Schwarz, A., Daskalakis, N., Walter, D., Zahn, A., Pöschl, U., Bönisch, H., Borrmann, S., Platt, U., and Burrows, J. P.: Overview: On the transport and transformation of pollutants in the outflow of major population centres – observational data from the EMeRGe European intensive operational period in summer 2017, Atmos. Chem. Phys., 22, 5877–5924, https://doi.org/10.5194/acp-22-5877-2022, 2022.
Bourgeois, I., Peischl, J., Neuman, J. A., Brown, S. S., Allen, H. M., Campuzano-Jost, P., Coggon, M. M., DiGangi, J. P., Diskin, G. S., Gilman, J. B., Gkatzelis, G. I., Guo, H., Halliday, H. A., Hanisco, T. F., Holmes, C. D., Huey, L. G., Jimenez, J. L., Lamplugh, A. D., Lee, Y. R., Lindaas, J., Moore, R. H., Nault, B. A., Nowak, J. B., Pagonis, D., Rickly, P. S., Robinson, M. A., Rollins, A. W., Selimovic, V., St. Clair, J. M., Tanner, D., Vasquez, K. T., Veres, P. R., Warneke, C., Wennberg, P. O., Washenfelder, R. A., Wiggins, E. B., Womack, C. C., Xu, L., Zarzana, K. J., and Ryerson, T. B.: Comparison of airborne measurements of NO, NO2, HONO, NOy, and CO during FIREX-AQ, Atmos. Meas. Tech., 15, 4901–4930, https://doi.org/10.5194/amt-15-4901-2022, 2022.
Brocchi, V., Krysztofiak, G., Catoire, V., Guth, J., Marécal, V., Zbinden, R., El Amraoui, L., Dulac, F., and Ricaud, P.: Intercontinental transport of biomass burning pollutants over the Mediterranean Basin during the summer 2014 ChArMEx-GLAM airborne campaign, Atmos. Chem. Phys., 18, 6887–6906, https://doi.org/10.5194/acp-18-6887-2018, 2018.
Brocchi, V., Krysztofiak, G., Deroubaix, A., Stratmann, G., Sauer, D., Schlager, H., Deetz, K., Dayma, G., Robert, C., Chevrier, S., and Catoire, V.: Local air pollution from oil rig emissions observed during the airborne DACCIWA campaign, Atmos. Chem. Phys., 19, 11401–11411, https://doi.org/10.5194/acp-19-11401-2019, 2019.
Brown, S. S., Thornton, J. A., Keene, W. C., Pszenny, A. A. P., Sive, B. C., Dubé, W. P., Wagner, N. L., Young, C. J., Riedel, T. P., Roberts, J. M., Vandenboer, T. C., Bahreini, R., Öztürk, F., Middlebrook, A. M., Kim, S., Hübler, G., and Wolfe, D. E.: Nitrogen, Aerosol Composition, and Halogens on a Tall Tower (NACHTT): Overview of a wintertime air chemistry field study in the front range urban corridor of Colorado, J. Geophys. Res.-Atmos., 118, 8067–8085, https://doi.org/10.1002/jgrd.50537, 2013.
Catoire, V., Robert, C., Chartier, M., Jacquet, P., Guimbaud, C., and Krysztofiak, G.: The SPIRIT airborne instrument: a three-channel infrared absorption spectrometer with quantum cascade lasers for in situ atmospheric trace-gas measurements, Appl. Phys. B, 123, 244, https://doi.org/10.1007/s00340-017-6820-x, 2017.
Catoire, V., Krysztofiak, G., and Xue, C.: CO measured by SPIRIT during airborne campaigns, Aeris [data set], https://doi.org/10.25326/440, 2023.
Crawford, J. H., Ahn, J. Y., Al-Saadi, J., Chang, L., Emmons, L. K., Kim, J., Lee, G., Park, J. H., Park, R. J., Woo, J. H., Song, C. K., Hong, J. H., Hong, Y. D., Lefer, B. L., Lee, M., Lee, T., Kim, S., Min, K. E., Yum, S. S., Shin, H. J., Kim, Y. W., Choi, J. S., Park, J. S., Szykman, J. J., Long, R. W., Jordan, C. E., Simpson, I. J., Fried, A., Dibb, J. E., Cho, S. Y., and Kim, Y. P.: The Korea-United States air quality (KORUS-AQ) field study, Elementa, 9, 1–27, https://doi.org/10.1525/elementa.2020.00163, 2021.
Daellenbach, K. R., Uzu, G., Jiang, J., Cassagnes, L., Leni, Z., Vlachou, A., Stefenelli, G., Canonaco, F., Weber, S., Segers, A., Kuenen, J. J. P., Schaap, M., Favez, O., Albinet, A., Aksoyoglu, S., Dommen, J., Baltensperger, U., Geiser, M., El Haddad, I., Jaffrezo, J., and Prévôt, A. S. H.: Sources of particulate-matter air pollution and its oxidative potential in Europe, Nature, 587, 414–419, https://doi.org/10.1038/s41586-020-2902-8, 2020.
David, L. M., Ravishankara, A. R., Brey, S. J., Fischer, E. V, Volckens, J., and Kreidenweis, S.: Could the exception become the rule? “Uncontrollable” air pollution events in the U.S. due to wildland fires, Environ. Res. Lett., 16, 034029, https://doi.org/10.1088/1748-9326/abe1f3, 2021.
Dekker, I. N., Houweling, S., Pandey, S., Krol, M., Röckmann, T., Borsdorff, T., Landgraf, J., and Aben, I.: What caused the extreme CO concentrations during the 2017 high-pollution episode in India?, Atmos. Chem. Phys., 19, 3433–3445, https://doi.org/10.5194/acp-19-3433-2019, 2019.
Fast, J. D., de Foy, B., Acevedo Rosas, F., Caetano, E., Carmichael, G., Emmons, L., McKenna, D., Mena, M., Skamarock, W., Tie, X., Coulter, R. L., Barnard, J. C., Wiedinmyer, C., and Madronich, S.: A meteorological overview of the MILAGRO field campaigns, Atmos. Chem. Phys., 7, 2233–2257, https://doi.org/10.5194/acp-7-2233-2007, 2007.
Fehsenfeld, F. C., Ancellet, G., Bates, T. S., Goldstein, A. H., Hardesty, R. M., Honrath, R., Law, K. S., Lewis, A. C., Leaitch, R., McKeen, S., Meagher, J., Parrish, D. D., Pszenny, A. A. P., Russell, P. B., Schlager, H., Seinfeld, J., Talbot, R., and Zbinden, R.: International Consortium for Atmospheric Research on Transport and Transformation (ICARTT): North America to Europe – Overview of the 2004 summer field study, J. Geophys. Res.-Atmos., 111, D23S01, https://doi.org/10.1029/2006JD007829, 2006.
Formenti, P., D'Anna, B., Flamant, C., Mallet, M., Piketh, S. J., Schepanski, K., Waquet, F., Auriol, F., Brogniez, G., Burnet, F., Chaboureau, J. P., Chauvigné, A., Chazette, P., Denjean, C., Desboeufs, K., Doussin, J. F., Elguindi, N., Feuerstein, S., Gaetani, M., Giorio, C., Klopper, D., Mallet, M. D., Nabat, P., Monod, A., Solmon, F., Namwoonde, A., Chikwililwa, C., Mushi, R., Welton, E. J., and Holben, B.: The aerosols, radiation and clouds in southern Africa field campaign in Namibia overview, illustrative observations, and way forward, B. Am. Meteorol. Soc., 100, 1277–1298, https://doi.org/10.1175/BAMS-D-17-0278.1, 2019.
Förster, E., Bönisch, H., Neumaier, M., Obersteiner, F., Zahn, A., Hilboll, A., Kalisz Hedegaard, A. B., Daskalakis, N., Poulidis, A. P., Vrekoussis, M., Lichtenstern, M., and Braesicke, P.: Chemical and dynamical identification of emission outflows during the HALO campaign EMeRGe in Europe and Asia, Atmos. Chem. Phys., 23, 1893–1918, https://doi.org/10.5194/acp-23-1893-2023, 2023.
Gratton, G. B.: The Meteorological Research Flight and its predecessors and successors, J. Aeronaut. Hist., 6, 83–111, 2012.
Guo, S., Hu, M., Zamora, M. L., Peng, J., Shang, D., Zheng, J., Du, Z., Wu, Z., Shao, M., Zeng, L., Molina, M. J., and Zhang, R.: Elucidating severe urban haze formation in China, P. Natl. Acad. Sci. USA, 111, 17373–17378, https://doi.org/10.1073/pnas.1419604111, 2014.
Hahn, V., Meerkötter, R., Voigt, C., Gisinger, S., Sauer, D., Catoire, V., Dreiling, V., Coe, H., Flamant, C., Kaufmann, S., Kleine, J., Knippertz, P., Moser, M., Rosenberg, P., Schlager, H., Schwarzenboeck, A., and Taylor, J.: Pollution slightly enhances atmospheric cooling by low-level clouds in tropical West Africa, Atmos. Chem. Phys., 23, 8515–8530, https://doi.org/10.5194/acp-23-8515-2023, 2023.
Hamburger, T., McMeeking, G., Minikin, A., Birmili, W., Dall'Osto, M., O'Dowd, C., Flentje, H., Henzing, B., Junninen, H., Kristensson, A., de Leeuw, G., Stohl, A., Burkhart, J. F., Coe, H., Krejci, R., and Petzold, A.: Overview of the synoptic and pollution situation over Europe during the EUCAARI-LONGREX field campaign, Atmos. Chem. Phys., 11, 1065–1082, https://doi.org/10.5194/acp-11-1065-2011, 2011.
Hamer, P. D., Marécal, V., Hossaini, R., Pirre, M., Krysztofiak, G., Ziska, F., Engel, A., Sala, S., Keber, T., Bönisch, H., Atlas, E., Krüger, K., Chipperfield, M., Catoire, V., Samah, A. A., Dorf, M., Siew Moi, P., Schlager, H., and Pfeilsticker, K.: Cloud-scale modelling of the impact of deep convection on the fate of oceanic bromoform in the troposphere: a case study over the west coast of Borneo, Atmos. Chem. Phys., 21, 16955–16984, https://doi.org/10.5194/acp-21-16955-2021, 2021.
Hanke, M., Umann, B., Uecker, J., Arnold, F., and Bunz, H.: Atmospheric measurements of gas-phase HNO3 and SO2 using chemical ionization mass spectrometry during the MINATROC field campaign 2000 on Monte Cimone, Atmos. Chem. Phys., 3, 417–436, https://doi.org/10.5194/acp-3-417-2003, 2003.
Harrison, R. M., Dall'Osto, M., Beddows, D. C. S., Thorpe, A. J., Bloss, W. J., Allan, J. D., Coe, H., Dorsey, J. R., Gallagher, M., Martin, C., Whitehead, J., Williams, P. I., Jones, R. L., Langridge, J. M., Benton, A. K., Ball, S. M., Langford, B., Hewitt, C. N., Davison, B., Martin, D., Petersson, K. F., Henshaw, S. J., White, I. R., Shallcross, D. E., Barlow, J. F., Dunbar, T., Davies, F., Nemitz, E., Phillips, G. J., Helfter, C., Di Marco, C. F., and Smith, S.: Atmospheric chemistry and physics in the atmosphere of a developed megacity (London): an overview of the REPARTEE experiment and its conclusions, Atmos. Chem. Phys., 12, 3065–3114, https://doi.org/10.5194/acp-12-3065-2012, 2012.
Haywood, J. M., Abel, S. J., Barrett, P. A., Bellouin, N., Blyth, A., Bower, K. N., Brooks, M., Carslaw, K., Che, H., Coe, H., Cotterell, M. I., Crawford, I., Cui, Z., Davies, N., Dingley, B., Field, P., Formenti, P., Gordon, H., de Graaf, M., Herbert, R., Johnson, B., Jones, A. C., Langridge, J. M., Malavelle, F., Partridge, D. G., Peers, F., Redemann, J., Stier, P., Szpek, K., Taylor, J. W., Watson-Parris, D., Wood, R., Wu, H., and Zuidema, P.: The CLoud–Aerosol–Radiation Interaction and Forcing: Year 2017 (CLARIFY-2017) measurement campaign, Atmos. Chem. Phys., 21, 1049–1084, https://doi.org/10.5194/acp-21-1049-2021, 2021.
Hegarty, J. D., Cady-Pereira, K. E., Payne, V. H., Kulawik, S. S., Worden, J. R., Kantchev, V., Worden, H. M., McKain, K., Pittman, J. V., Commane, R., Daube Jr., B. C., and Kort, E. A.: Validation and error estimation of AIRS MUSES CO profiles with HIPPO, ATom, and NOAA GML aircraft observations, Atmos. Meas. Tech., 15, 205–223, https://doi.org/10.5194/amt-15-205-2022, 2022.
Hooghiem, J. J. D., Popa, M. E., Röckmann, T., Grooß, J.-U., Tritscher, I., Müller, R., Kivi, R., and Chen, H.: Wildfire smoke in the lower stratosphere identified by in situ CO observations, Atmos. Chem. Phys., 20, 13985–14003, https://doi.org/10.5194/acp-20-13985-2020, 2020.
Jaffe, D. A. and Wigder, N. L.: Ozone production from wildfires: A critical review, Atmos. Environ., 51, 1–10, https://doi.org/10.1016/j.atmosenv.2011.11.063, 2012.
Jaffe, D. A., Schnieder, B., and Inouye, D.: Technical note: Use of PM2.5 to CO ratio as an indicator of wildfire smoke in urban areas, Atmos. Chem. Phys., 22, 12695–12704, https://doi.org/10.5194/acp-22-12695-2022, 2022.
Johnson, B. T., Osborne, S. R., Haywood, J. M., and Harrison, M. A. J.: Aircraft measurements of biomass burning aerosol over West Africa during DABEX, J. Geophys. Res.-Atmos., 113, 1–15, https://doi.org/10.1029/2007JD009451, 2008.
Kniffka, A., Knippertz, P., and Fink, A. H.: The role of low-level clouds in the West African monsoon system, Atmos. Chem. Phys., 19, 1623–1647, https://doi.org/10.5194/acp-19-1623-2019, 2019.
Knippertz, P., Coe, H., Chiu, J. C., Evans, M. J., Fink, A. H., Kalthoff, N., Liousse, C., Mari, C., Allan, R. P., Brooks, B., Danour, S., Flamant, C., Jegede, O. O., Lohou, F., and Marsham, J. H.: The DACCIWA Project: Dynamics–Aerosol–Chemistry–Cloud Interactions in West Africa, B. Am. Meteorol. Soc., 96, 1451–1460, https://doi.org/10.1175/BAMS-D-14-00108.1, 2015.
Krysztofiak, G., Thiéblemont, R., Huret, N., Catoire, V., Té, Y., Jégou, F., Coheur, P. F., Clerbaux, C., Payan, S., Drouin, M. A., Robert, C., Jeseck, P., Attié, J.-L., and Camy-Peyret, C.: Detection in the summer polar stratosphere of pollution plume from East Asia and North America by balloon-borne in situ CO measurements, Atmos. Chem. Phys., 12, 11889–11906, https://doi.org/10.5194/acp-12-11889-2012, 2012.
Krysztofiak, G., Catoire, V., Hamer, P. D., Marécal, V., Robert, C., Engel, A., Bönisch, H., Grossmann, K., Quack, B., Atlas, E., and Pfeilsticker, K.: Evidence of convective transport in tropical West Pacific region during SHIVA experiment, Atmos. Sci. Lett., 19, 1–7, https://doi.org/10.1002/asl.798, 2018.
Lelieveld, J., Butler, T. M., Crowley, J. N., Dillon, T. J., Fischer, H., Ganzeveld, L., Harder, H., Lawrence, M. G., Martinez, M., Taraborrelli, D., and Williams, J.: Atmospheric oxidation capacity sustained by a tropical forest, Nature, 452, 737–740, https://doi.org/10.1038/nature06870, 2008.
Luo, M., Rinsland, C., Fisher, B., Sachse, G., Diskin, G., Logan, J., Worden, H., Kulawik, S., Osterman, G., Eldering, A., Herman, R., and Shephard, M.: TES carbon monoxide validation with DACOM aircraft measurements during INTEX-B 2006, J. Geophys. Res.-Atmos., 112, D24S48, https://doi.org/10.1029/2007JD008803, 2007.
Machado, L. A. T., Calheiros, A. J. P., Biscaro, T., Giangrande, S., Silva Dias, M. A. F., Cecchini, M. A., Albrecht, R., Andreae, M. O., Araujo, W. F., Artaxo, P., Borrmann, S., Braga, R., Burleyson, C., Eichholz, C. W., Fan, J., Feng, Z., Fisch, G. F., Jensen, M. P., Martin, S. T., Pöschl, U., Pöhlker, C., Pöhlker, M. L., Ribaud, J.-F., Rosenfeld, D., Saraiva, J. M. B., Schumacher, C., Thalman, R., Walter, D., and Wendisch, M.: Overview: Precipitation characteristics and sensitivities to environmental conditions during GoAmazon2014/5 and ACRIDICON-CHUVA, Atmos. Chem. Phys., 18, 6461–6482, https://doi.org/10.5194/acp-18-6461-2018, 2018.
Mallet, M., Dulac, F., Formenti, P., Nabat, P., Sciare, J., Roberts, G., Pelon, J., Ancellet, G., Tanré, D., Parol, F., Denjean, C., Brogniez, G., di Sarra, A., Alados-Arboledas, L., Arndt, J., Auriol, F., Blarel, L., Bourrianne, T., Chazette, P., Chevaillier, S., Claeys, M., D'Anna, B., Derimian, Y., Desboeufs, K., Di Iorio, T., Doussin, J.-F., Durand, P., Féron, A., Freney, E., Gaimoz, C., Goloub, P., Gómez-Amo, J. L., Granados-Muñoz, M. J., Grand, N., Hamonou, E., Jankowiak, I., Jeannot, M., Léon, J.-F., Maillé, M., Mailler, S., Meloni, D., Menut, L., Momboisse, G., Nicolas, J., Podvin, T., Pont, V., Rea, G., Renard, J.-B., Roblou, L., Schepanski, K., Schwarzenboeck, A., Sellegri, K., Sicard, M., Solmon, F., Somot, S., Torres, B., Totems, J., Triquet, S., Verdier, N., Verwaerde, C., Waquet, F., Wenger, J., and Zapf, P.: Overview of the Chemistry-Aerosol Mediterranean Experiment/Aerosol Direct Radiative Forcing on the Mediterranean Climate (ChArMEx/ADRIMED) summer 2013 campaign, Atmos. Chem. Phys., 16, 455–504, https://doi.org/10.5194/acp-16-455-2016, 2016.
McMeeking, G. R., Hamburger, T., Liu, D., Flynn, M., Morgan, W. T., Northway, M., Highwood, E. J., Krejci, R., Allan, J. D., Minikin, A., and Coe, H.: Black carbon measurements in the boundary layer over western and northern Europe, Atmos. Chem. Phys., 10, 9393–9414, https://doi.org/10.5194/acp-10-9393-2010, 2010.
OriginLab: OriginPro 2021, OriginLab [software], https://www.originlab.com/, last access: 18 July 2023a.
OriginLab: Google Map Import, OriginLab Technical Support [software], https://www.originlab.com/fileExchange/details.aspx?fid=344, last access: 18 July 2023b.
Palmer, P. I., Jacob, D. J., Jones, D. B. A., Heald, C. L., Yantosca, R. M., Logan, J. A., Sachse, G. W., and Streets, D. G.: Inverting for emissions of carbon monoxide from Asia using aircraft observations over the western Pacific, J. Geophys. Res.-Atmos., 108, 8828, https://doi.org/10.1029/2003JD003397, 2003.
Pathak, R. K., Wu, W. S., and Wang, T.: Summertime PM2.5 ionic species in four major cities of China: nitrate formation in an ammonia-deficient atmosphere, Atmos. Chem. Phys., 9, 1711–1722, https://doi.org/10.5194/acp-9-1711-2009, 2009.
Permar, W., Wang, Q., Selimovic, V., Wielgasz, C., Yokelson, R. J., Hornbrook, R. S., Hills, A. J., Apel, E. C., Ku, I. T., Zhou, Y., Sive, B. C., Sullivan, A. P., Collett, J. L., Campos, T. L., Palm, B. B., Peng, Q., Thornton, J. A., Garofalo, L. A., Farmer, D. K., Kreidenweis, S. M., Levin, E. J. T., DeMott, P. J., Flocke, F., Fischer, E. V., and Hu, L.: Emissions of Trace Organic Gases From Western U.S. Wildfires Based on WE-CAN Aircraft Measurements, J. Geophys. Res.-Atmos., 126, 1–29, https://doi.org/10.1029/2020JD033838, 2021.
Redemann, J., Wood, R., Zuidema, P., Doherty, S. J., Luna, B., LeBlanc, S. E., Diamond, M. S., Shinozuka, Y., Chang, I. Y., Ueyama, R., Pfister, L., Ryoo, J.-M., Dobracki, A. N., da Silva, A. M., Longo, K. M., Kacenelenbogen, M. S., Flynn, C. J., Pistone, K., Knox, N. M., Piketh, S. J., Haywood, J. M., Formenti, P., Mallet, M., Stier, P., Ackerman, A. S., Bauer, S. E., Fridlind, A. M., Carmichael, G. R., Saide, P. E., Ferrada, G. A., Howell, S. G., Freitag, S., Cairns, B., Holben, B. N., Knobelspiesse, K. D., Tanelli, S., L'Ecuyer, T. S., Dzambo, A. M., Sy, O. O., McFarquhar, G. M., Poellot, M. R., Gupta, S., O'Brien, J. R., Nenes, A., Kacarab, M., Wong, J. P. S., Small-Griswold, J. D., Thornhill, K. L., Noone, D., Podolske, J. R., Schmidt, K. S., Pilewskie, P., Chen, H., Cochrane, S. P., Sedlacek, A. J., Lang, T. J., Stith, E., Segal-Rozenhaimer, M., Ferrare, R. A., Burton, S. P., Hostetler, C. A., Diner, D. J., Seidel, F. C., Platnick, S. E., Myers, J. S., Meyer, K. G., Spangenberg, D. A., Maring, H., and Gao, L.: An overview of the ORACLES (ObseRvations of Aerosols above CLouds and their intEractionS) project: aerosol–cloud–radiation interactions in the southeast Atlantic basin, Atmos. Chem. Phys., 21, 1507–1563, https://doi.org/10.5194/acp-21-1507-2021, 2021.
Ricaud, P., Zbinden, R., Catoire, V., Brocchi, V., Dulac, F., Hamonou, E., Canonici, J. C., El Amraoui, L., Massart, S., Piguet, B., Dayan, U., Nabat, P., Sciare, J., Ramonet, M., Delmotte, M., Di Sarra, A., Sferlazzo, D., Di Iorio, T., Piacentino, S., Cristofanelli, P., Mihalopoulos, N., Kouvarakis, G., Pikridas, M., Savvides, C., Mamouri, R. E., Nisantzi, A., Hadjimitsis, D., Attié, J. L., Ferré, H., Kangah, Y., Jaidan, N., Guth, J., Jacquet, P., Chevrier, S., Robert, C., Bourdon, A., Bourdinot, J. F., Etienne, J. C., Krysztofiak, G., and Theron, P.: The GLAM airborne campaign across the Mediterranean Basin, B. Am. Meteorol. Soc., 99, 361–380, https://doi.org/10.1175/BAMS-D-16-0226.1, 2018.
Ryerson, T. B., Andrews, A. E., Angevine, W. M., Bates, T. S., Brock, C. A., Cairns, B., Cohen, R. C., Cooper, O. R., De Gouw, J. A., Fehsenfeld, F. C., Ferrare, R. A., Fischer, M. L., Flagan, R. C., Goldstein, A. H., Hair, J. W., Hardesty, R. M., Hostetler, C. A., Jimenez, J. L., Langford, A. O., McCauley, E., McKeen, S. A., Molina, L. T., Nenes, A., Oltmans, S. J., Parrish, D. D., Pederson, J. R., Pierce, R. B., Prather, K., Quinn, P. K., Seinfeld, J. H., Senff, C. J., Sorooshian, A., Stutz, J., Surratt, J. D., Trainer, M., Volkamer, R., Williams, E. J., and Wofsy, S. C.: The 2010 California Research at the Nexus of Air Quality and Climate Change (CalNex) field study, J. Geophys. Res.-Atmos., 118, 5830–5866, https://doi.org/10.1002/jgrd.50331, 2013.
Sellers, P., Hall, F., Ranson, K. J., Margolis, H., Kelly, B., Baldocchi, D., den Hartog, G., Cihlar, J., Ryan, M. G., Goodison, B., Crill, P., Lettenmaier, D., and Wickland, D. E.: The Boreal Ecosystem–Atmosphere Study (BOREAS): An Overview and Early Results from the 1994 Field Year, B. Am. Meteorol. Soc., 76, 1549–1577, https://doi.org/10.1175/1520-0477(1995)076<1549:TBESAO>2.0.CO;2, 1995.
Shi, Z., Vu, T., Kotthaus, S., Harrison, R. M., Grimmond, S., Yue, S., Zhu, T., Lee, J., Han, Y., Demuzere, M., Dunmore, R. E., Ren, L., Liu, D., Wang, Y., Wild, O., Allan, J., Acton, W. J., Barlow, J., Barratt, B., Beddows, D., Bloss, W. J., Calzolai, G., Carruthers, D., Carslaw, D. C., Chan, Q., Chatzidiakou, L., Chen, Y., Crilley, L., Coe, H., Dai, T., Doherty, R., Duan, F., Fu, P., Ge, B., Ge, M., Guan, D., Hamilton, J. F., He, K., Heal, M., Heard, D., Hewitt, C. N., Hollaway, M., Hu, M., Ji, D., Jiang, X., Jones, R., Kalberer, M., Kelly, F. J., Kramer, L., Langford, B., Lin, C., Lewis, A. C., Li, J., Li, W., Liu, H., Liu, J., Loh, M., Lu, K., Lucarelli, F., Mann, G., McFiggans, G., Miller, M. R., Mills, G., Monk, P., Nemitz, E., O'Connor, F., Ouyang, B., Palmer, P. I., Percival, C., Popoola, O., Reeves, C., Rickard, A. R., Shao, L., Shi, G., Spracklen, D., Stevenson, D., Sun, Y., Sun, Z., Tao, S., Tong, S., Wang, Q., Wang, W., Wang, X., Wang, X., Wang, Z., Wei, L., Whalley, L., Wu, X., Wu, Z., Xie, P., Yang, F., Zhang, Q., Zhang, Y., Zhang, Y., and Zheng, M.: Introduction to the special issue “In-depth study of air pollution sources and processes within Beijing and its surrounding region (APHH-Beijing)”, Atmos. Chem. Phys., 19, 7519–7546, https://doi.org/10.5194/acp-19-7519-2019, 2019.
Spackman, J. R., Gao, R. S., Neff, W. D., Schwarz, J. P., Watts, L. A., Fahey, D. W., Holloway, J. S., Ryerson, T. B., Peischl, J., and Brock, C. A.: Aircraft observations of enhancement and depletion of black carbon mass in the springtime Arctic, Atmos. Chem. Phys., 10, 9667–9680, https://doi.org/10.5194/acp-10-9667-2010, 2010.
Tang, Y. S., Flechard, C. R., Dämmgen, U., Vidic, S., Djuricic, V., Mitosinkova, M., Uggerud, H. T., Sanz, M. J., Simmons, I., Dragosits, U., Nemitz, E., Twigg, M., van Dijk, N., Fauvel, Y., Sanz, F., Ferm, M., Perrino, C., Catrambone, M., Leaver, D., Braban, C. F., Cape, J. N., Heal, M. R., and Sutton, M. A.: Pan-European rural monitoring network shows dominance of NH3 gas and NH4NO3 aerosol in inorganic atmospheric pollution load, Atmos. Chem. Phys., 21, 875–914, https://doi.org/10.5194/acp-21-875-2021, 2021.
Taylor, J. W., Haslett, S. L., Bower, K., Flynn, M., Crawford, I., Dorsey, J., Choularton, T., Connolly, P. J., Hahn, V., Voigt, C., Sauer, D., Dupuy, R., Brito, J., Schwarzenboeck, A., Bourriane, T., Denjean, C., Rosenberg, P., Flamant, C., Lee, J. D., Vaughan, A. R., Hill, P. G., Brooks, B., Catoire, V., Knippertz, P., and Coe, H.: Aerosol influences on low-level clouds in the West African monsoon, Atmos. Chem. Phys., 19, 8503–8522, https://doi.org/10.5194/acp-19-8503-2019, 2019.
Voigt, C., Lelieveld, J., Schlager, H., Schneider, J., Curtius, J., Meerkötter, R., Sauer, D., Bugliaro, L., Bohn, B., Crowley, J. N., Erbertseder, T., Groß, S., Hahn, V., Li, Q., Mertens, M., Pöhlker, M. L., Pozzer, A., Schumann, U., Tomsche, L., Williams, J., Zahn, A., Andreae, M., Borrmann, S., Bräuer, T., Dörich, R., Dörnbrack, A., Edtbauer, A., Ernle, L., Fischer, H., Giez, A., Granzin, M., Grewe, V., Harder, H., Heinritzi, M., Holanda, B. A., Jöckel, P., Kaiser, K., Krüger, O. O., Lucke, J., Marsing, A., Martin, A., Matthes, S., Pöhlker, C., Pöschl, U., Reifenberg, S., Ringsdorf, A., Scheibe, M., Tadic, I., Zauner-Wieczorek, M., Henke, R., and Rapp, M.: Cleaner Skies during the COVID-19 Lockdown, B. Am. Meteorol. Soc., 103, E1796–E1827, https://doi.org/10.1175/BAMS-D-21-0012.1, 2022.
Wizenberg, T., Strong, K., Walker, K., Lutsch, E., Borsdorff, T., and Landgraf, J.: Intercomparison of CO measurements from TROPOMI, ACE-FTS, and a high-Arctic ground-based Fourier transform spectrometer, Atmos. Meas. Tech., 14, 7707–7728, https://doi.org/10.5194/amt-14-7707-2021, 2021.
Wu, H., Taylor, J. W., Langridge, J. M., Yu, C., Allan, J. D., Szpek, K., Cotterell, M. I., Williams, P. I., Flynn, M., Barker, P., Fox, C., Allen, G., Lee, J., and Coe, H.: Rapid transformation of ambient absorbing aerosols from West African biomass burning, Atmos. Chem. Phys., 21, 9417–9440, https://doi.org/10.5194/acp-21-9417-2021, 2021.
Xue, C., Zhang, C., Ye, C., Liu, P., Catoire, V., Krysztofiak, G., Chen, H., Ren, Y., Zhao, X., Wang, J., Zhang, F., Zhang, C., Zhang, J., An, J., Wang, T., Chen, J., Kleffmann, J., Mellouki, A., and Mu, Y.: HONO Budget and Its Role in Nitrate Formation in the Rural North China Plain, Environ. Sci. Technol., 54, 11048–11057, https://doi.org/10.1021/acs.est.0c01832, 2020.