the Creative Commons Attribution 4.0 License.
the Creative Commons Attribution 4.0 License.
 | 25 Sep 2023
MAREL Carnot data and metadata from the Coriolis data center
Raed Halawi Ghosn
Émilie Poisson-Caillault
Guillaume Charria
Armel Bonnat
Michel Repecaud
Jean-Valery Facq
Loïc Quéméner
Vincent Duquesne
Camille Blondel
The French coast of the eastern English Channel (ECC) is classified as a potential eutrophication zone by the Oslo and Paris (OSPAR) Convention and as moderate to poor according to the phytoplankton quality element of the Water Framework Directive (WFD). It is regularly affected by Phaeocystis globosa bloom events, which have detrimental effects on the marine ecosystem, economy, and public health. In this context and to improve our observation strategy, MAREL Carnot, a multi-sensor oceanographic station, was installed in the eastern English Channel in 2004 at the Carnot wall in Boulogne-sur-Mer. The aim of this station was to collect high-frequency measurements of several water quality parameters to complement conventional low-resolution monitoring programs. The purpose of this paper is to describe the MAREL Carnot dataset and show how it can be used for several research objectives. MAREL Carnot collects high-frequency, multi-parameter observations from surface water as well as meteorological measurements and sends the data in near real-time to an onshore data center. In this paper, we present several physical, chemical, and biological parameters measured by this station. We also demonstrate that the MAREL Carnot dataset can be used to assess environmental or ecological statuses and conduct research in the field of marine phytoplankton ecology and oceanography. In addition, we show that this dataset may indirectly aid in improving European environmental management strategies. The MAREL Carnot dataset is publicly accessible via https://doi.org/10.17882/39754 (MAREL Carnot, 2023).
- Article
(4578 KB) - Full-text XML
- BibTeX
- EndNote


For millennia, the marine environment has been subjected to various sources of pollution. Major inputs of nitrate, phosphate, and other pollutants have been causing detrimental effects on the marine environment, including harmful algal blooms (HABs) and eutrophication (Le Moal et al., 2019). Since phytoplankton are at the base of the food web, their blooms can affect higher trophic levels and cause serious changes in marine biodiversity and water quality (e.g., oxygen deficiency) (Kazmi et al., 2022; Young et al., 2020). HABs can produce toxins that degrade water quality and cause health problems in humans and marine animals (Ross Brown et al., 2022; Young et al., 2020). They can also be associated with mass foam accumulations on beaches, as with Phaeocystis globosa blooms (Blauw et al., 2010; Spilmont et al., 2009). Furthermore, they can detrimentally cause economic losses in sectors such as fish farms, shellfish aquaculture, tourism, and recreational activities, as well as public health (Derot et al., 2020; Hallegraeff et al., 2021).
Understanding the processes underlying HABs and eutrophication necessitates continuous monitoring of the marine environment in order to prevent the associated deterioration effects and achieve optimized environmental assessment and management strategies. Traditionally, monitoring aquatic and marine ecosystems was done using low-frequency in situ measurements (weekly to monthly sampling frequency). It was performed by collecting water samples through Niskin bottles and then performing several laboratory analyses to determine various physical, chemical, and biological parameters, including salinity, temperature, conductivity, and organic and inorganic matter, as well as phytoplankton biomass, abundance, and diversity. Despite the fact that these data helped scientists to have an overview of the processes taking place in the marine environment, they are of insufficient temporal resolution to advance the understanding of phytoplankton dynamics and eutrophication.
In order to implement proper management strategies that prevent further deterioration of the marine ecosystem, it is crucial to enhance our understanding of algal blooms, eutrophication; recurrent, rare, and extreme events; and phytoplankton dynamics. Thus, it is necessary to collect continuous measurements not only on a monthly or weekly basis but also on an hourly or even sub-hourly timescale. Satellites and models can provide data of high spatio-temporal resolution (Chai et al., 2020), but such data must be validated with in situ data (Lefebvre and Schmitt, 2016). This motivated scientists to study the marine environment using in situ high-frequency (high temporal resolution) monitoring systems such as buoys, FerryBox systems, etc. (Dickey and Bidigare, 2005).
Over the past decades, the advancement of sensor technology and data science has shed light on the importance of time series in marine research. This urged the construction of autonomous systems capable of supporting long-term time series for key physical, chemical, and biological parameters. The implementation of such automated systems enabled the measurement of essential ocean variables (EOVs) and essential biodiversity variables (EBVs) at high frequency, which aided in reorienting marine research from low-frequency measurements to high-frequency measurements (Blain et al., 2004).
In the eastern English Channel (EEC), HABs are mainly caused by the Prymnesiophyceae Phaeocystis globosa, which is often associated with Pseudo-nitzschia (Karasiewicz and Lefebvre, 2022). When the temperature of the water rises in the spring and summer and when nutrient concentration is optimal, Phaeocystis globosa forms a large biomass. Phaeocystis globosa was identified as a potentially harmful species for several reasons. First, it releases dimethyl sulfide (DMS) gas, which can irritate people's eyes, skin, and respiratory system (Riegman and Van Boekel, 1996). Second, mucopolysaccharides are abundant in its colonies (Zhu et al., 2021). These polysaccharides are broken up by external factors like turbulence as well as internal factors like lysis and aging, which cause the accumulation of a thick, odorous foam on the coast. Besides, needle-shaped Pseudo-nitzschia can stick into Phaeocystis globosa colonies and form structures that irritate filter feeders during Phaeocystis globosa blooms (Sazhin et al., 2007). These structures can also injure fish, making them more susceptible to bacterial and viral infections (Lefebvre and Devreker, 2023). Moreover, the neurotoxin domoic acid (DA) produced by Pseudo-nitzschia is responsible for the neurological disorder known as amnesic shellfish poisoning (ASP) in humans (Bates et al., 2018; Petroff et al., 2021). Additionally, marine mammals and seabirds may get poisoned if they consume DA-contaminated planktivorous prey (Delegrange et al., 2018).
The French monitoring of phytoplankton population and associated environmental factors in the eastern English Channel (ECC) started in 1979 with RNO (Réseau National d'Observation) or RNC (Réseau Nationale de Contrôle). Then, in 1984, a national network called REPHY (le REseau de surveillance du PHYtoplankton et des phycotoxines) was established by Ifremer to estimate the abundance and taxonomic composition of phytoplankton, describe their spatio-temporal dynamics, detect toxin-producing species, and monitor and alert for harmful blooms (https://doi.org/10.17882/47248, REPHY – French Observation and Monitoring program for Phytoplankton and Hydrology in coastal waters, 2022). After that, in 1992, the Artois-Picardie Water Agency and Ifremer decided to establish SRN (Suivi Régional des Nutriments) to accurately monitor nutrient concentrations (Lefebvre and Devreker, 2023). Although these monitoring networks enhanced our knowledge of phytoplankton dynamics, they remain inadequate to thoroughly understand recurrent, rare, and extreme events occurring in the marine environment.
In 2004, the MAREL (Mesures Automatisées en Réseau pour l'Environnement Littoral) Carnot monitoring station was installed in the French part of the ECC. The MAREL Carnot station, developed and implemented by Ifremer (French Research Institute for Sea Exploitation), is a moored buoy protected by a tube and equipped with physical, chemical, and biological measuring devices and sensors that operate continuously and autonomously. This multi-sensor station is located in the Boulogne-sur-Mer harbor (eastern English Channel), which is influenced by both marine water and freshwater. It is equipped with high-performance systems for seawater analysis and data transmission in near real-time. It measures the following parameters with high-frequency resolution (20 min): estimated sea level, wind direction relative to true north, horizontal wind speed, photosynthetically active radiation (PAR), seawater temperature, practical salinity, pH, dissolved oxygen, oxygen saturation, fluorescence, and turbidity. For nutrients, including nitrate, phosphate, and silicate, the sampling frequency is set to 12 h.
The purpose of this article is to describe the MAREL Carnot dataset and provide an overview of the variability of its physical, chemical, and biological parameters. For future users of the related dataset, we will offer a thorough description of the MAREL Carnot station, including its deployment and measurements. Based on previous research papers, we aim to demonstrate that the MAREL Carnot dataset can be used to evaluate the environmental or ecological status and conduct research in marine phytoplankton ecology and oceanography.
3.1 Location and study area
The MAREL station was installed on the Carnot sea wall in 2004, hence the name MAREL Carnot. It is located at 50.7405∘ N, 1.5677∘ E on the French side of the eastern English Channel, near the exit of the port of Boulogne-sur-Mer, which is France's greatest fishing port in terms of annual tonnage. Figure 1 depicts the location of the MAREL Carnot station on the map.
There is no seasonal pycnocline in the eastern English Channel (ECC), and stratification is limited and sporadic depending on freshwater discharge levels. Water can be extremely turbid due to the continental shelf nature of its seabed, which can reach a maximum depth of 180 m depending on tidal regimes. The ECC has a macro-tidal regime in the Dover Strait that varies from 3 to 9 m during neap and spring tides, respectively (Jouanneau et al., 2013). This regime produces significant residual tidal currents from the English Channel to the North Sea, as well as high tidal currents that are nearly parallel to the shore. Fluvial supplies distributed throughout the French coast from Baie de Seine (Seine Bay) to Cap Gris-Nez form a nearshore coastal water mass that is protected from the open ocean by a frontal area (Brylinski et al., 1996). This coastal water mass is tide-dependent and can extend from 3 to 5 nautical miles offshore (Brylinski et al., 1991). The frontal area plays a significant role in structuring biological and non-biological exchange between coastal and offshore water masses. It is more sloped from the vertical during neap tides, resulting in a greater surface of exchange between the two water masses (Brylinski et al., 1991). Thus, particle and nutrient movement between inshore and offshore water masses is greater during neap tides than during spring tides (Lefebvre and Devreker, 2023).
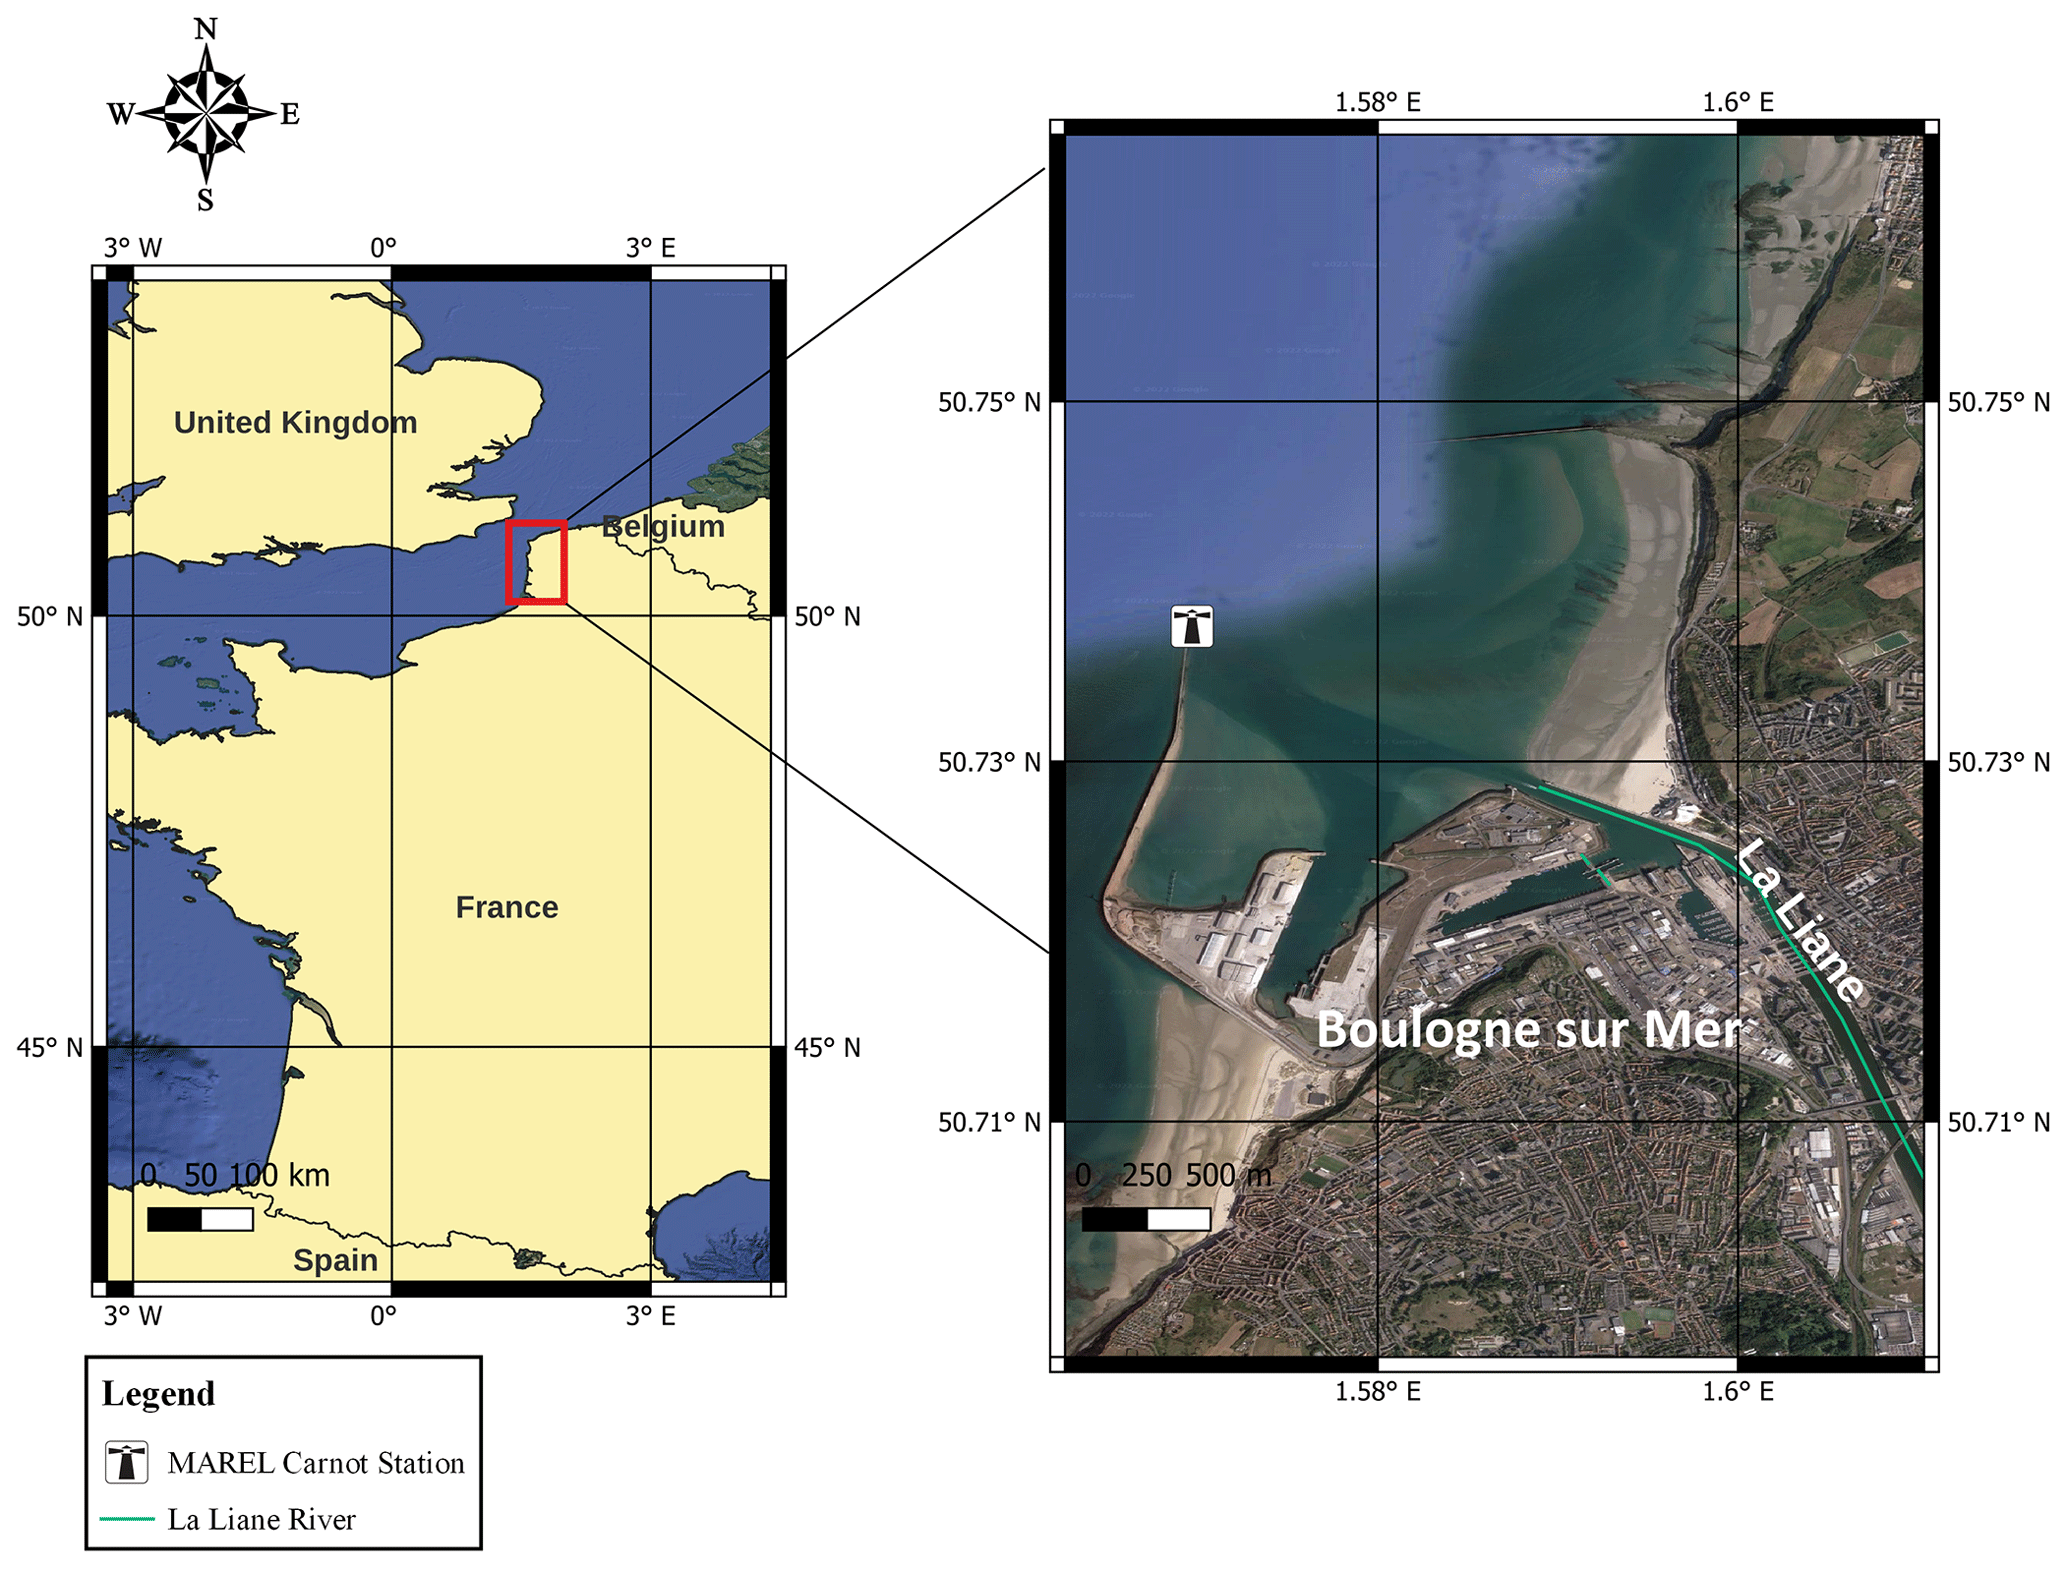
Figure 1Location of the MAREL Carnot station in the eastern English Channel (EEC) (map data © Google 2022).
3.2 Description of the MAREL Carnot station
MAREL is a French acronym for Mesures Automatisées en Réseau pour l'Environnement Littoral (automated sampling network for coastal waters). It belongs to a network of fixed platforms extending across the entire French coast called COAST-HF (https://coast-hf.fr, last access: 7 September 2023), which is a component of the ILICO research infrastructure at the French national level (https://www.ir-ilico.fr/, last access: 7 September 2023). MAREL Carnot station consists of a tube weighing 12 t and measuring 15 m in length. Because MAREL Carnot is located in a macrotidal zone, it is encased in a tube to be protected from strong currents, frequent storms, and boat collisions near the port. Indeed, buoys are not designed to withstand such challenging environments, so an infrastructure to maintain the buoy in a specific location and provide necessary protection was required. However, such an infrastructure would be huge and expensive, so the tube was the best solution. Figure 2 shows the MAREL Carnot station, consisting of the MAREL tube and the lighthouse platform which is used for meteorological sensors.
Its sensors are placed on a float inside the tube in order to follow tidal movements. A pulley system is placed in a chamber inside the harbor structure to manage the cables during high and low tides and to easily lift the station for maintenance when needed. Until 2014, it was made up of a measurement cell containing several sensors. The seawater was pumped upward to be analyzed. During periods when there were no measurement cycles, the system was chlorinated via electrolysis to prevent biofouling. Water was extracted from the subsurface at an approximate depth of 1.5 m and then sent to a measurement chamber to be redistributed to different sensors.
The first version of the measuring system was constructed using electronic, computer, and mechanical equipment that date back to the 1990s. Some of these elements deteriorated over time, particularly those submerged in seawater, and they had to be replaced with new equipment. In 2014, the prior measuring equipment was replaced with a new automated measuring probe. The objective was to conduct direct in situ measurements using an in situ multi-parameter probe. Thus, water circulation in the chamber was no longer performed to avoid air intake which would compromise measurements and data quality. The replacement of the old measuring system with a new one consumed time due to financial and technological challenges; hence, most of the data for 2014 are missing. Table 1 shows the characteristics of the sensors installed on MAREL Carnot from 2004 to 2022. Sensor calibration was performed on a regular basis, usually every 3 months.
Table 1The characteristics of the sensors installed on the MAREL Carnot station from 2004 to 2022.
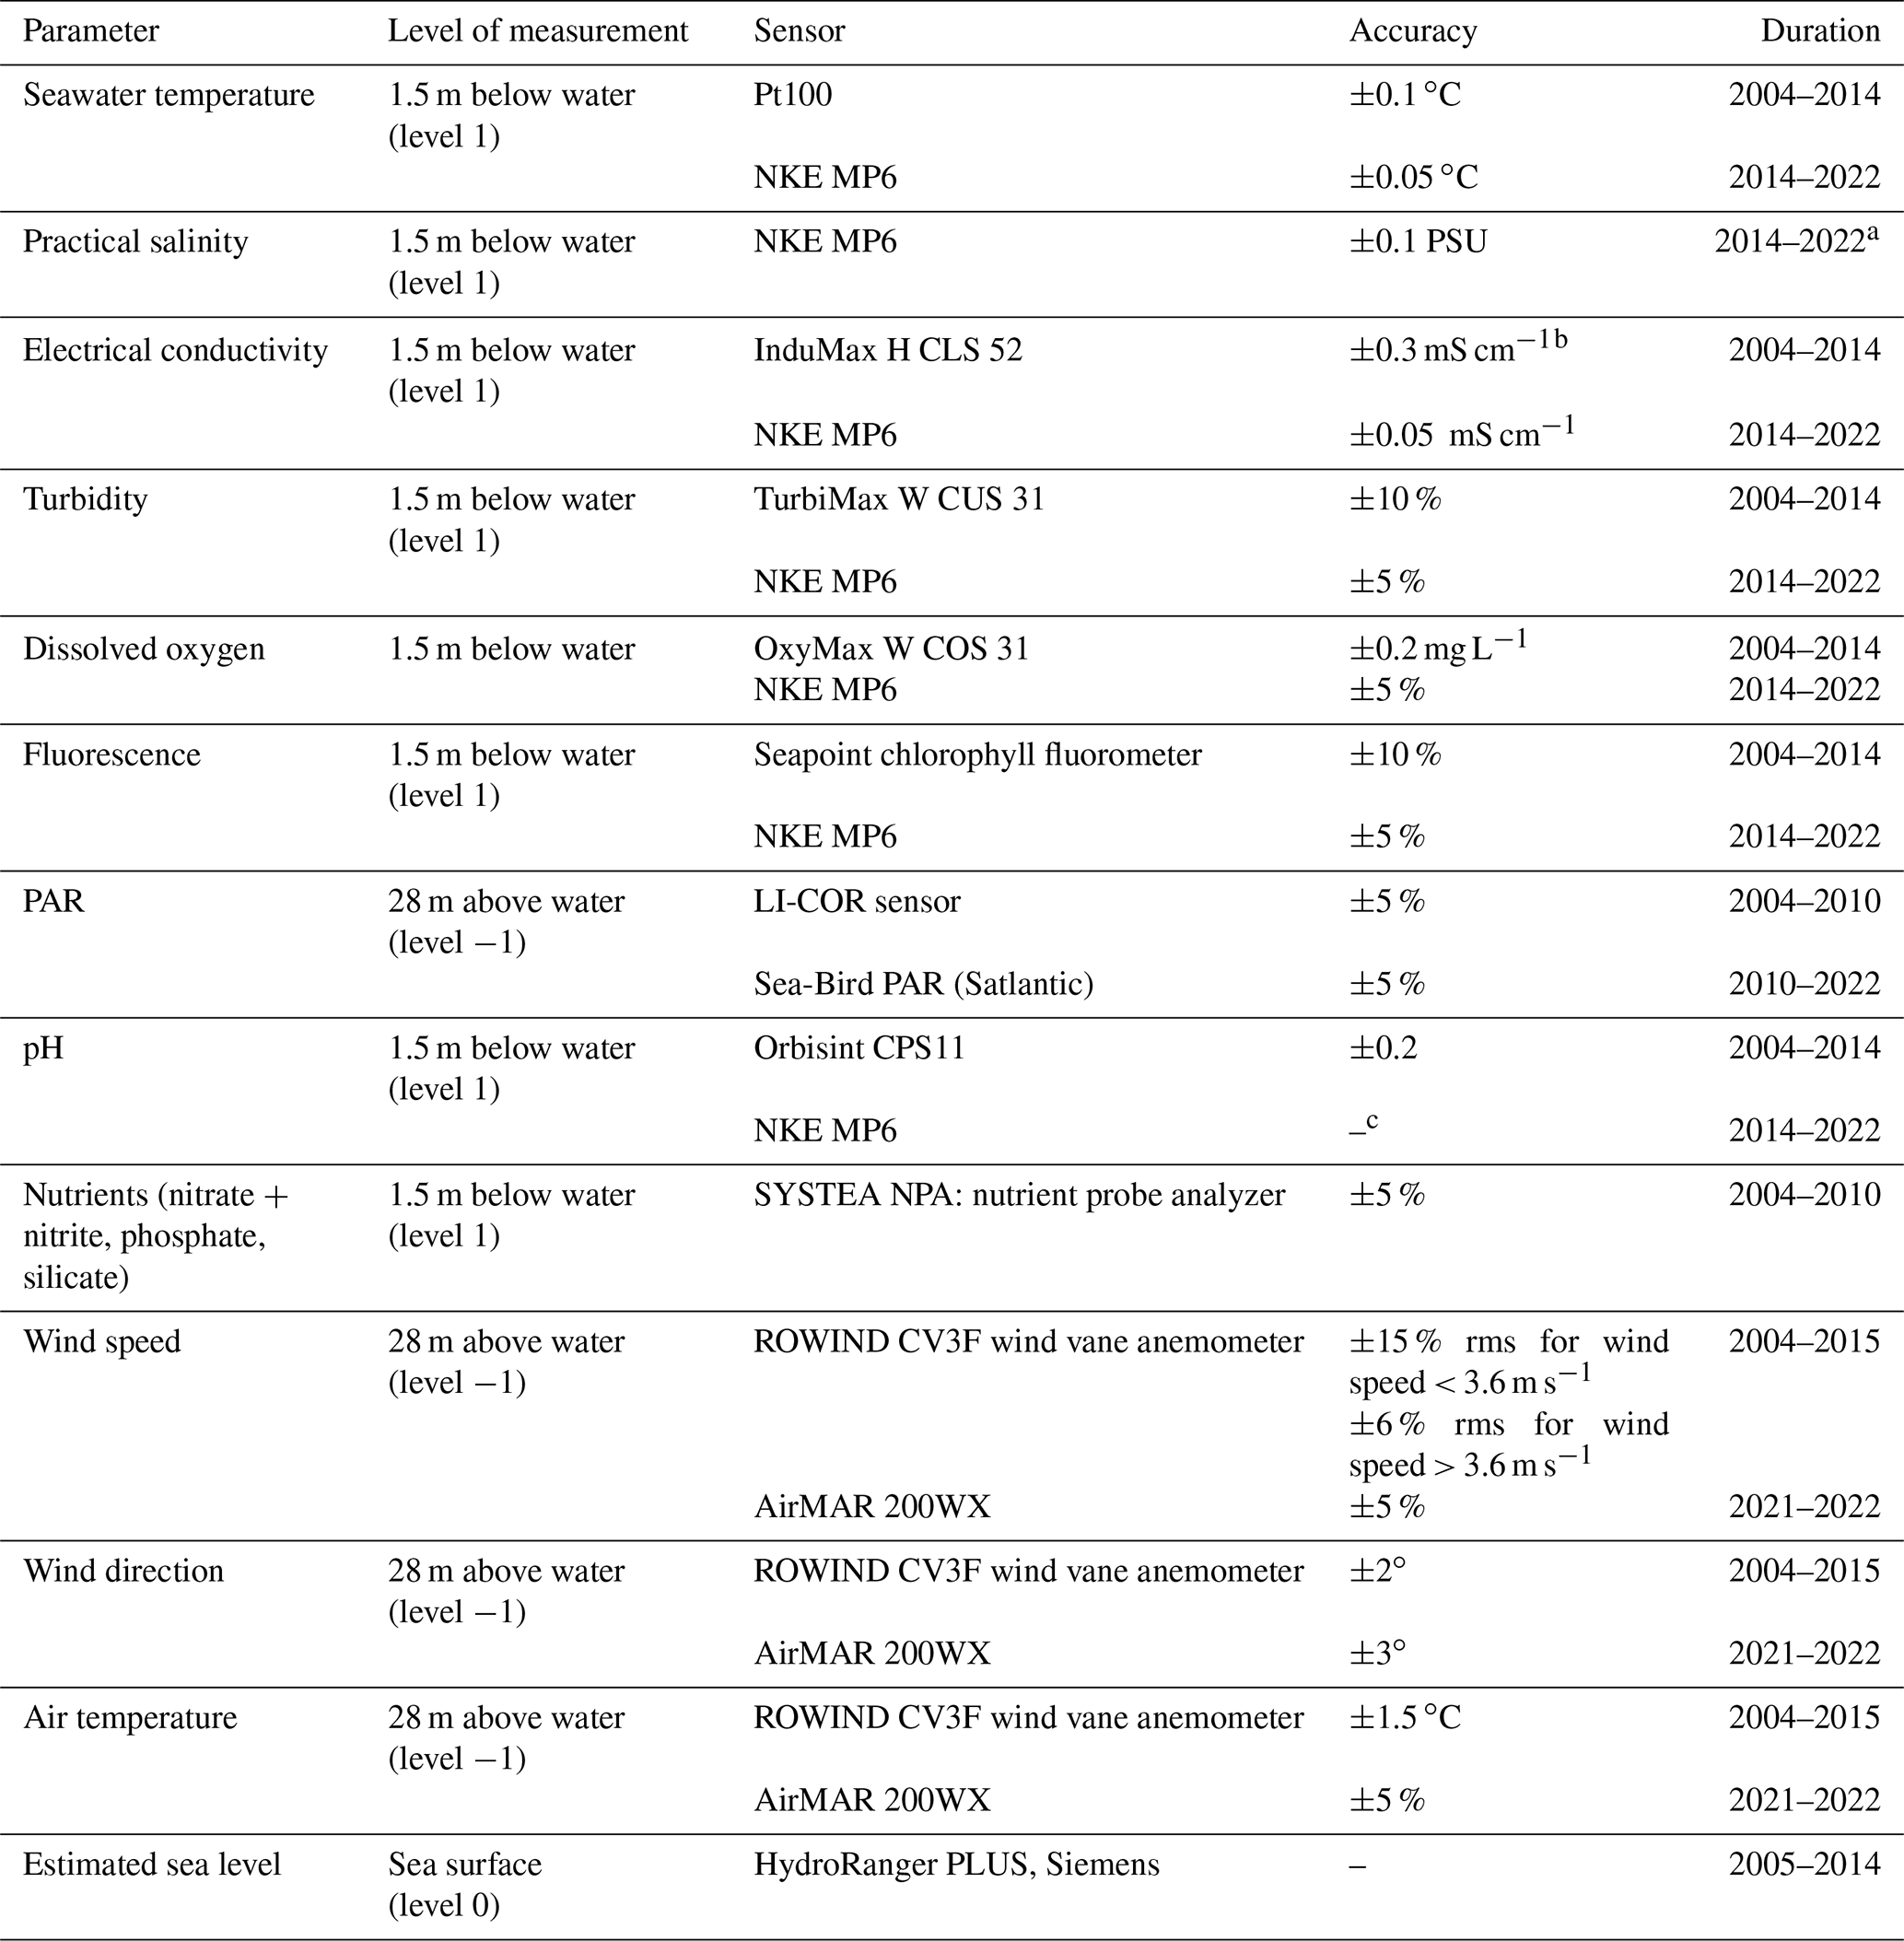
a Salinity was derived from conductivity before 2014. b The conductivity data before 2014 were deleted by Coriolis. c pH sensor failure after 2015.
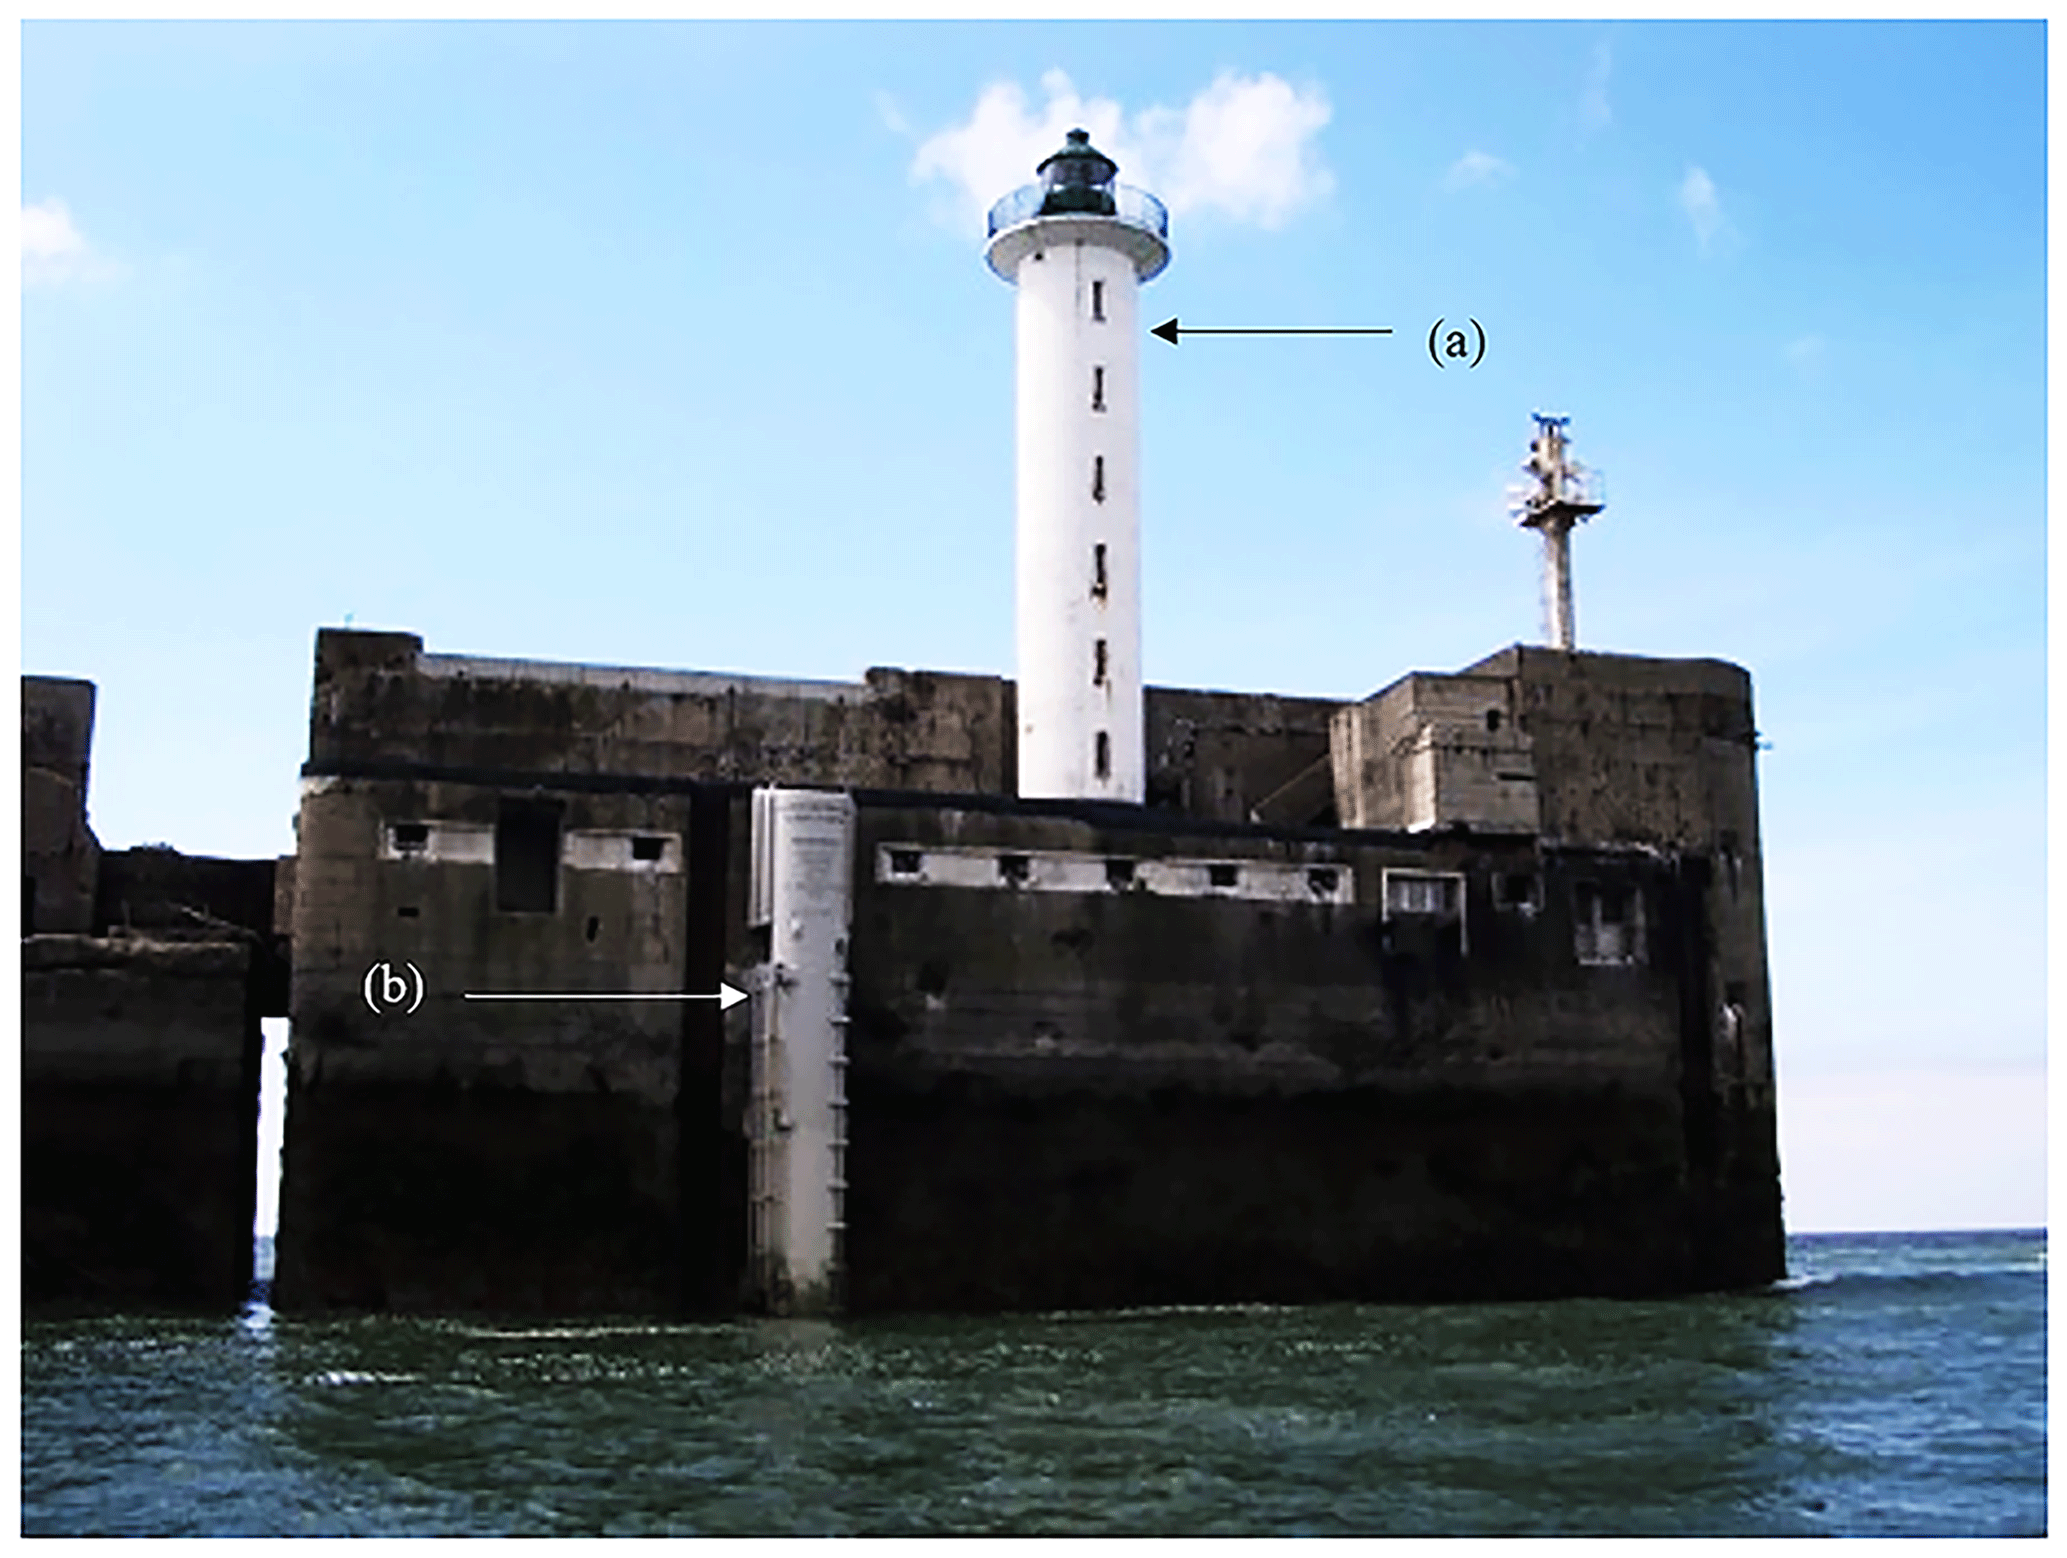
Figure 2MAREL Carnot station consisting of the lighthouse (a) and the MAREL Carnot tube (b) (photo © Ifremer).
3.3 Measured and calculated parameters
The MAREL Carnot multi-sensor station measures physical, chemical, and biological parameters in a continuous and autonomous mode. With a sampling frequency of 20 min, it is capable of providing high-resolution data for conductivity (siemens per meter), water and air temperatures (degrees Celsius), pH, fluorescence (fluoresceine fluorescence unit, FFU), turbidity (nephelometric turbidity unit, NTU), dissolved oxygen concentration (milligram per liter), photosynthetically active radiation (PAR) (micromole per square meter per second or microeinstein per square meter per second), wind direction (degree), gust wind direction (degree), wind speed (meter per second) and gust wind speed (meter per second), relative humidity (percentage), atmospheric pressure (hectopascal), and sea level (meter). On the other hand, nutrient concentrations like nitrate, phosphate, and silicate were only measured once every 12 h in order to limit the volume of chemical reagents required for the in situ analysis. Apart from salinity, which was calculated from conductivity prior to the installation of the NKE MP6 sensor in 2014, the only estimated parameter is sea level. Table 1 shows the different parameters measured by the MAREL Carnot station.
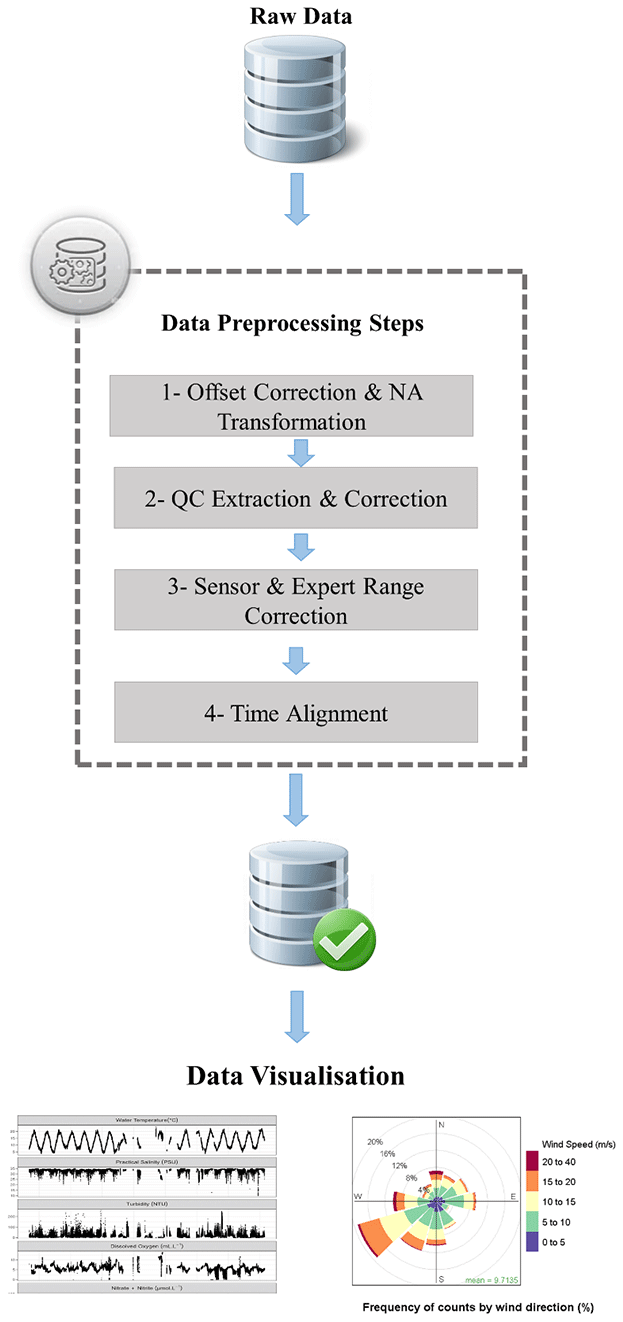
3.4 Preprocessing of the MAREL Carnot dataset
Data acquired by the MAREL Carnot station are transmitted in near real-time to the Coriolis data center. Coastal Coriolis, or simply Coriolis, is a data portal for all in situ data platforms in Coastal French waters, including MAREL Carnot (https://data.coriolis-cotier.org, last access: 7 September 2023). After downloading the dataset, the variables represented in Table 1 were selected, and several preprocessing steps were performed including offset correction and NA (“not available”) transformation, quality code (QC) extraction and correction, sensor and expert range correction, and time alignment (Fig. 3). The subsections below provide details for each step.
3.4.1 Offset correction and NA transformation
We corrected the offset present in the photosynthetically active radiation (PAR) and salinity variables. Then, we noticed that some nutrient values were present on level 2. Since no measurements are carried out at level 2 in MAREL Carnot, these measurements were deleted.
In addition, missing values in datasets are typically represented as “NA”, which stands for “not available”. However, in some cases, NA values are replaced with other numbers such as 77.77, 7777, 999, 999.999, and 9999.99. A dataset may also include values like “Inf” and “Nan”, which stand for “infinity” and “not a number”, respectively. Because these types of observations can affect or even obstruct further processing steps, we convert them into something feasible, which is NA.
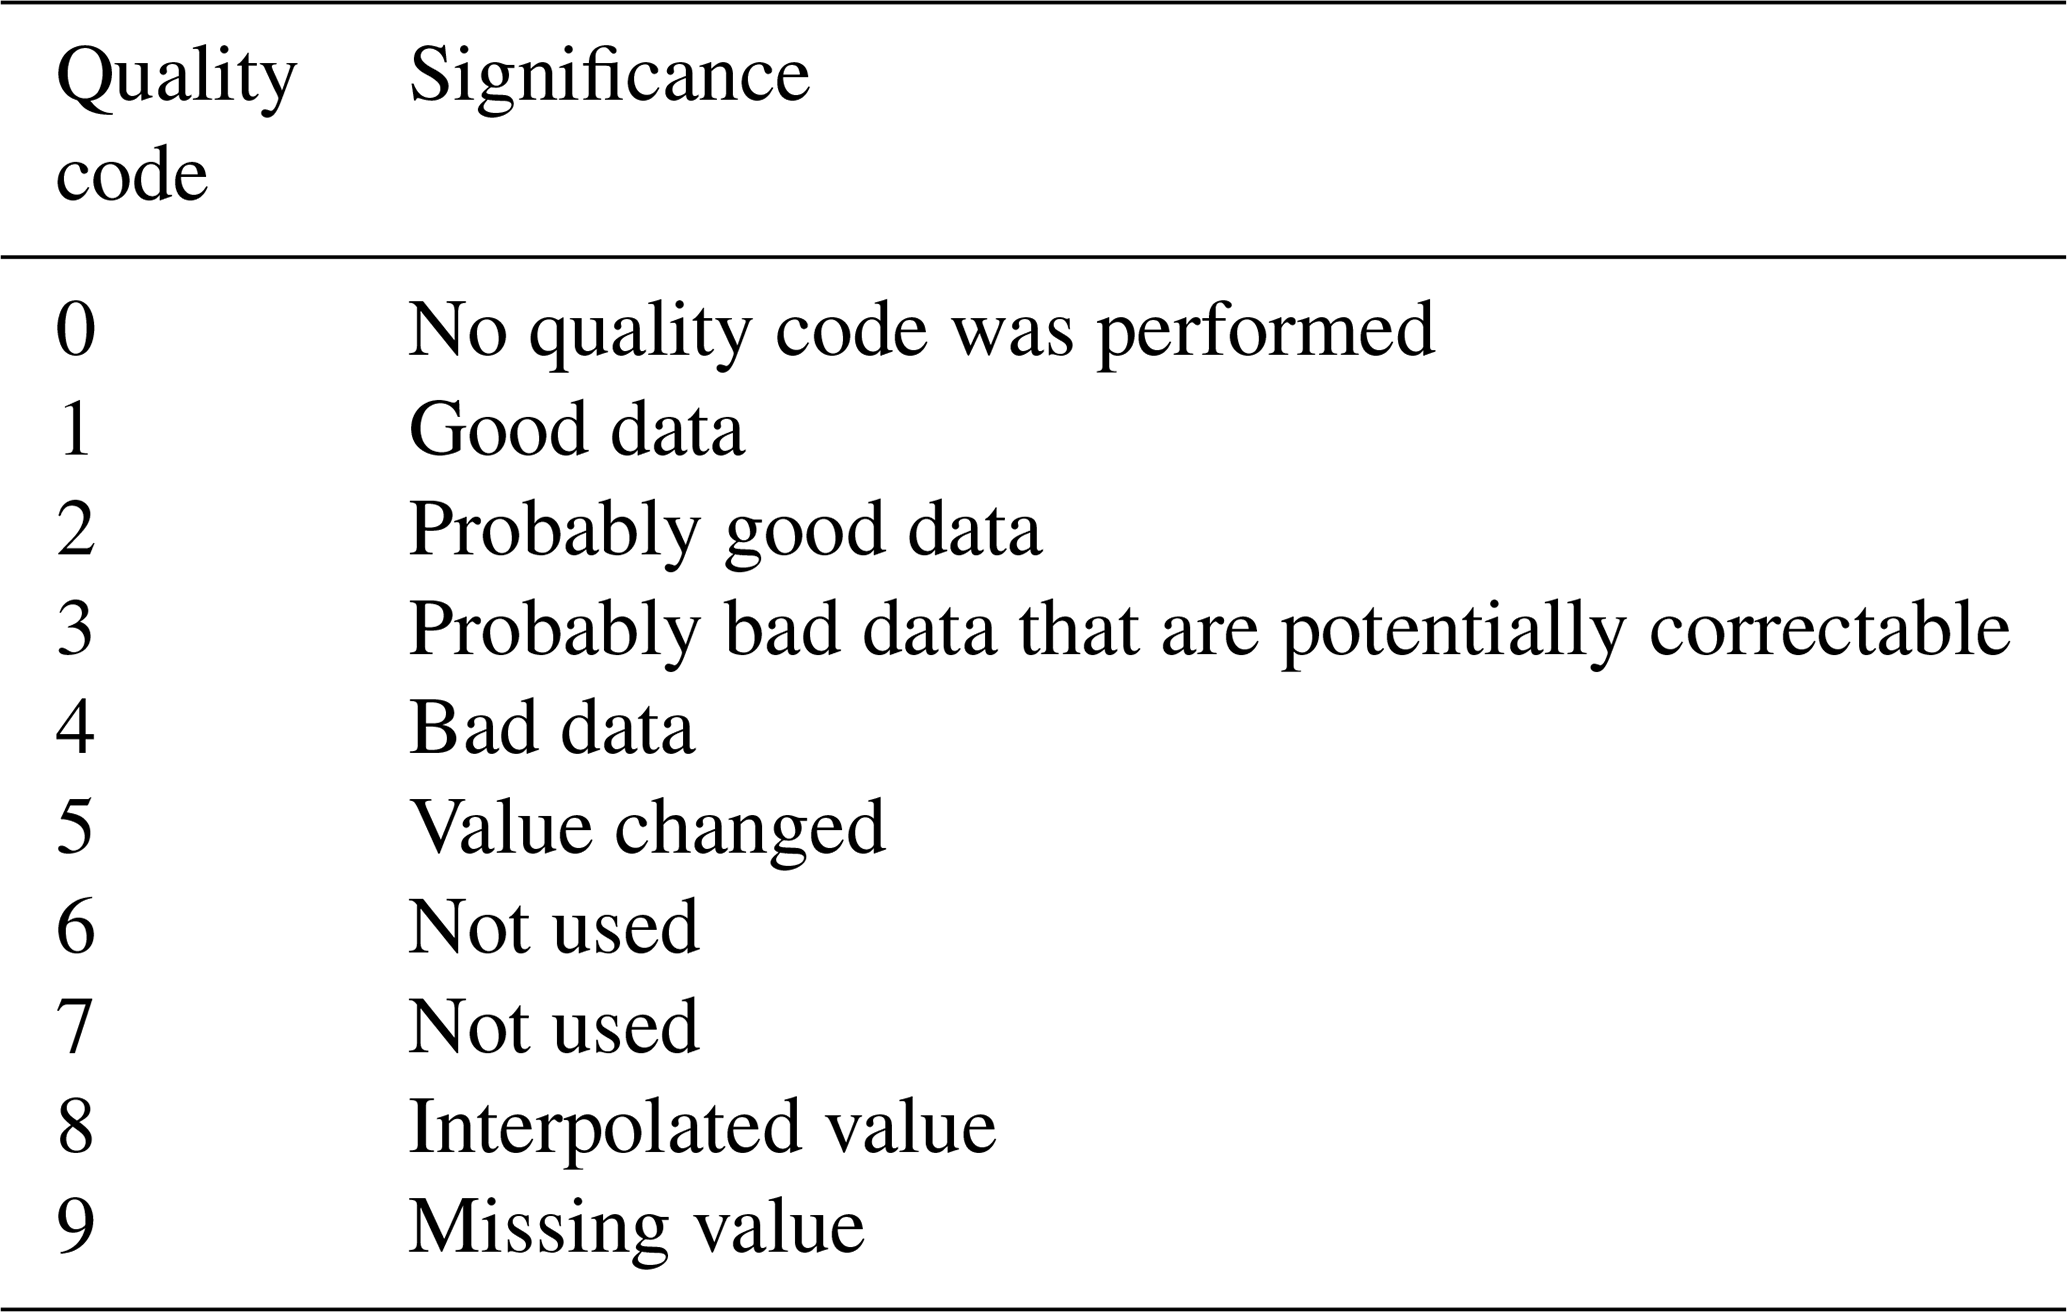
3.4.2 Quality code extraction and correction
Coriolis quality control procedures provide the users with the quality of each measurement as a quality code (QC) (Table 2). Quality codes are assigned according to the Argo quality control flag scale (Wong et al., 2022) and are part of the Coriolis harmonized procedure applied to all its in situ data platforms.
In the raw dataset, the quality codes are present in one single column and require de-serialization. To extract the quality code of each observation, we de-serialized the QC data and returned them into matrix form. According to the Argo quality control manual, measurements given a QC of 4 are not to be used. A flag “4” is assigned when a relevant real-time QC test has failed or for bad measurements that are known to be not adjustable, e.g., due to sensor failure (Wong et al., 2022). Thus, all data with QC = 4 (bad data) were deleted and replaced with NA.
At the end of this step, we converted the dissolved oxygen measurements from milliliter per liter to milligram per liter according to Aminot and Kérouel (2004) using Eq. (1):
Even after QC correction, the data may still contain errors. For instance, a pH measurement of 1 might not have a quality code of 4, and it will therefore appear correct despite being false. For this reason, we performed sensor and expert range correction to remove values that are unusual in marine coastal waters.
3.4.3 Sensor and expert range correction
The sensor range is a range of correct values from the highest possible measurement to the lowest possible measurement set by the manufacturer. The expert range is a range of correct values set by a field expert. The sensor range was obtained from the information provided by the sensor suppliers and MAREL (Ifremer), whereas the expert range was derived from expert knowledge acquired in the studied area through previous research activities. For all parameters, only the values that fall within the sensor and expert ranges are kept. Values that fall outside of the ranges are replaced with NA (not available).
The expert range and the sensor range are represented in Table 3. Indeed, the expert range is more precise than the sensor range. For instance, the sensor may give us a salinity value of 38, but our specialists know that salinity can only reach 35 in the Boulogne-sur-Mer, so the sensor's result is qualified as false and must be removed.
Table 3Sensor and expert ranges of parameters measured by MAREL Carnot.
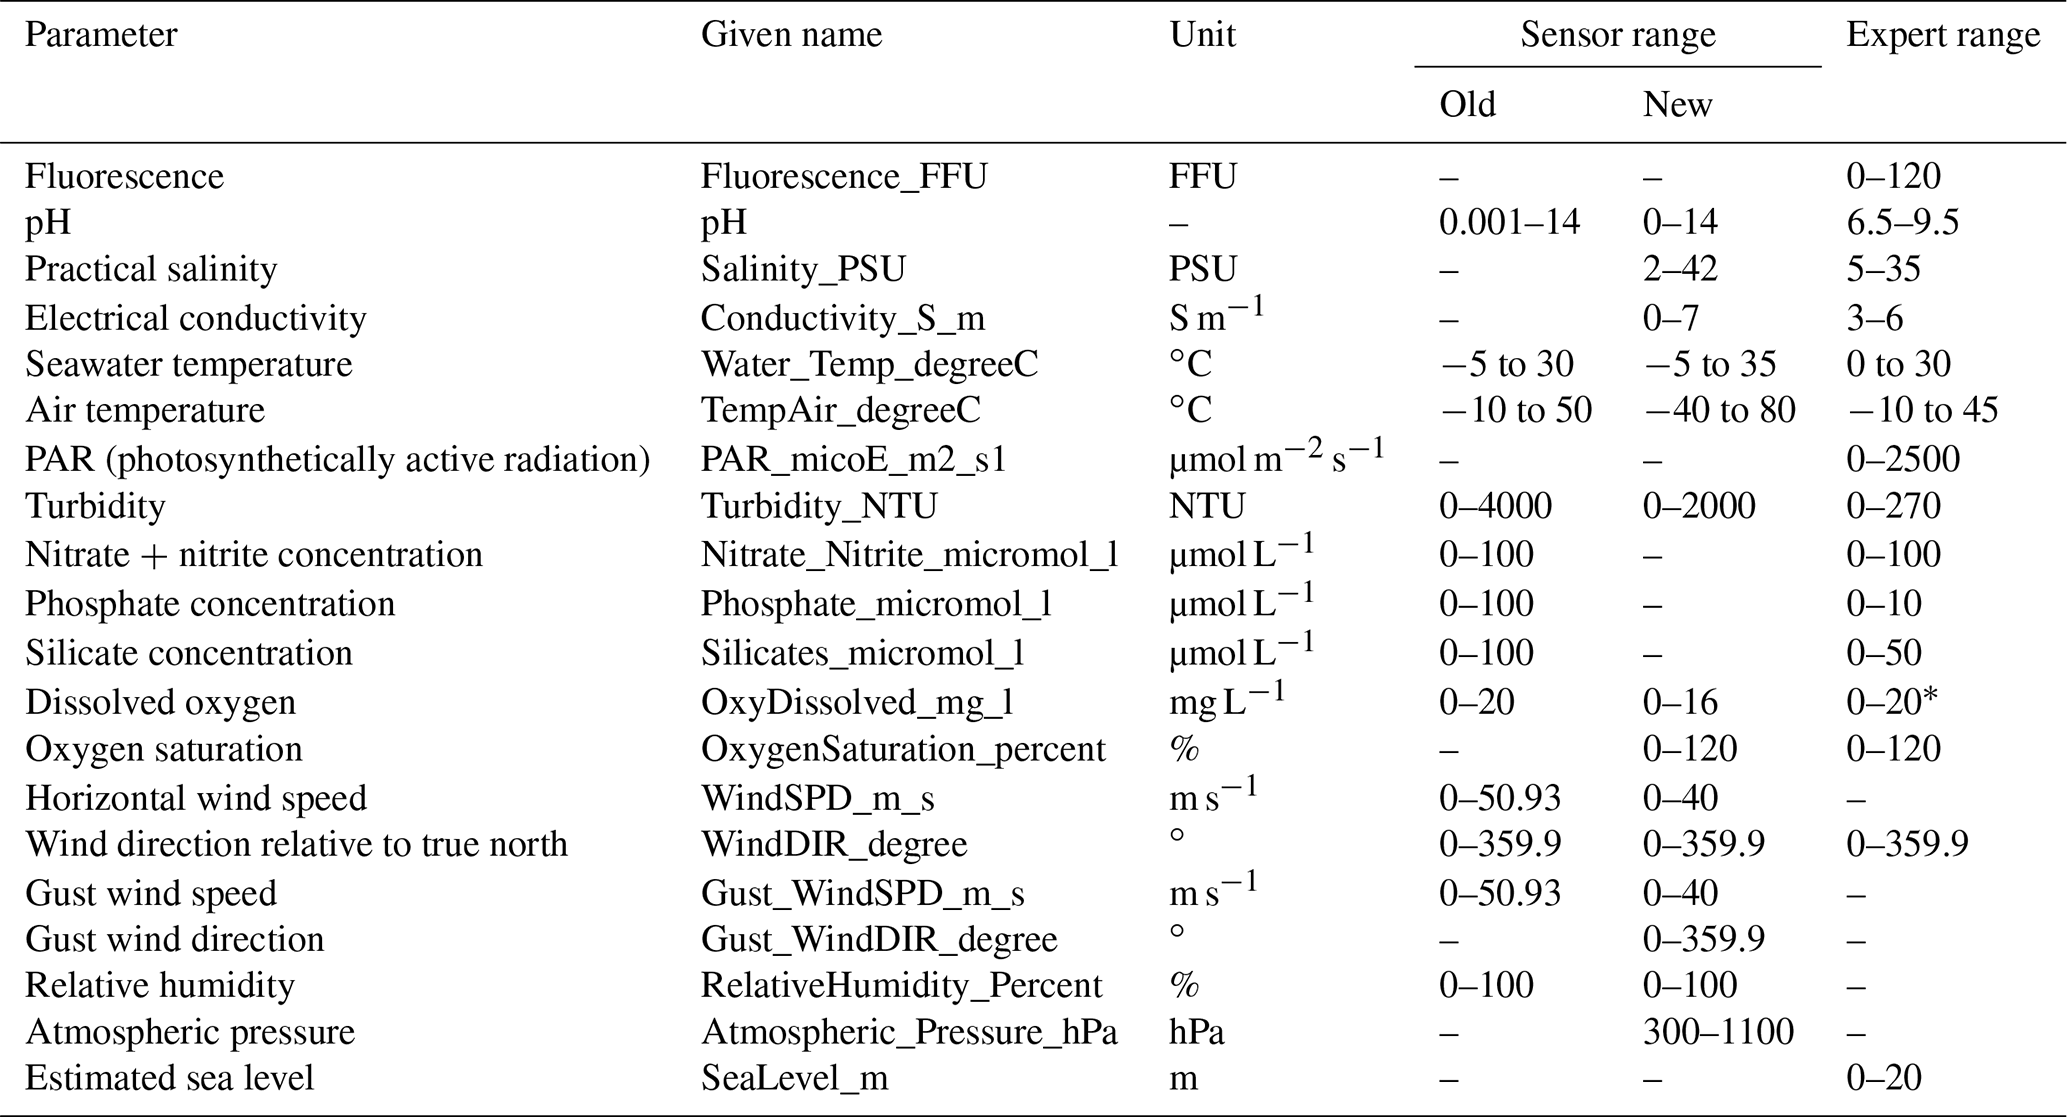
* Value determined for the entire period from 2004 to 2022.
3.4.4 Time alignment
The measurements of the various sensors are not taken at the same time, resulting in a time lag that can range from a few seconds to several minutes. In addition, the series may contain duplicates in some cases. Before statistical methods can be applied to the dataset, it must have an identical time interval between each measurement.
In order to synchronize the dataset and eliminate potential replicates, we performed a time alignment step. After extracting the day, month, years, and hours initially present in the raw dataset, we extracted the minute's column and set minutes 0 through 19 to 10, minutes 20 through 39 to 30, and minutes 40 through 59 to 50. From this, we generated a time sequence of 20 min interval and merged it with the original data. After that, we aggregated the data at the obtained regular time step (20 min). If multiple measurements of the same variable exist within the same time step, the maximum, minimum, or average can be returned. In order to focus on the most critical environmental conditions posing risk of eutrophication, the maximum value was chosen for all parameters except oxygen, where the minimum value was chosen. The QC value of each observation was then retained, and a quality code of 9 was assigned to all NA values, including those removed by previously mentioned preprocessing steps.
Table 4 represents the descriptive statistics for the main parameters measured by MAREL Carnot from 2004 until 2022. The results show a high percentage of missing data, denoted as NA or “not available”. A major problem in time series is missing data. It is primarily due to sensor failure, communication problems, or sensor maintenance disability.
Table 4Statistical summary (minimum, first quartile, median, mean, third quartile, maximum, and percentage of NA) of the parameters measured by the MAREL Carnot station.
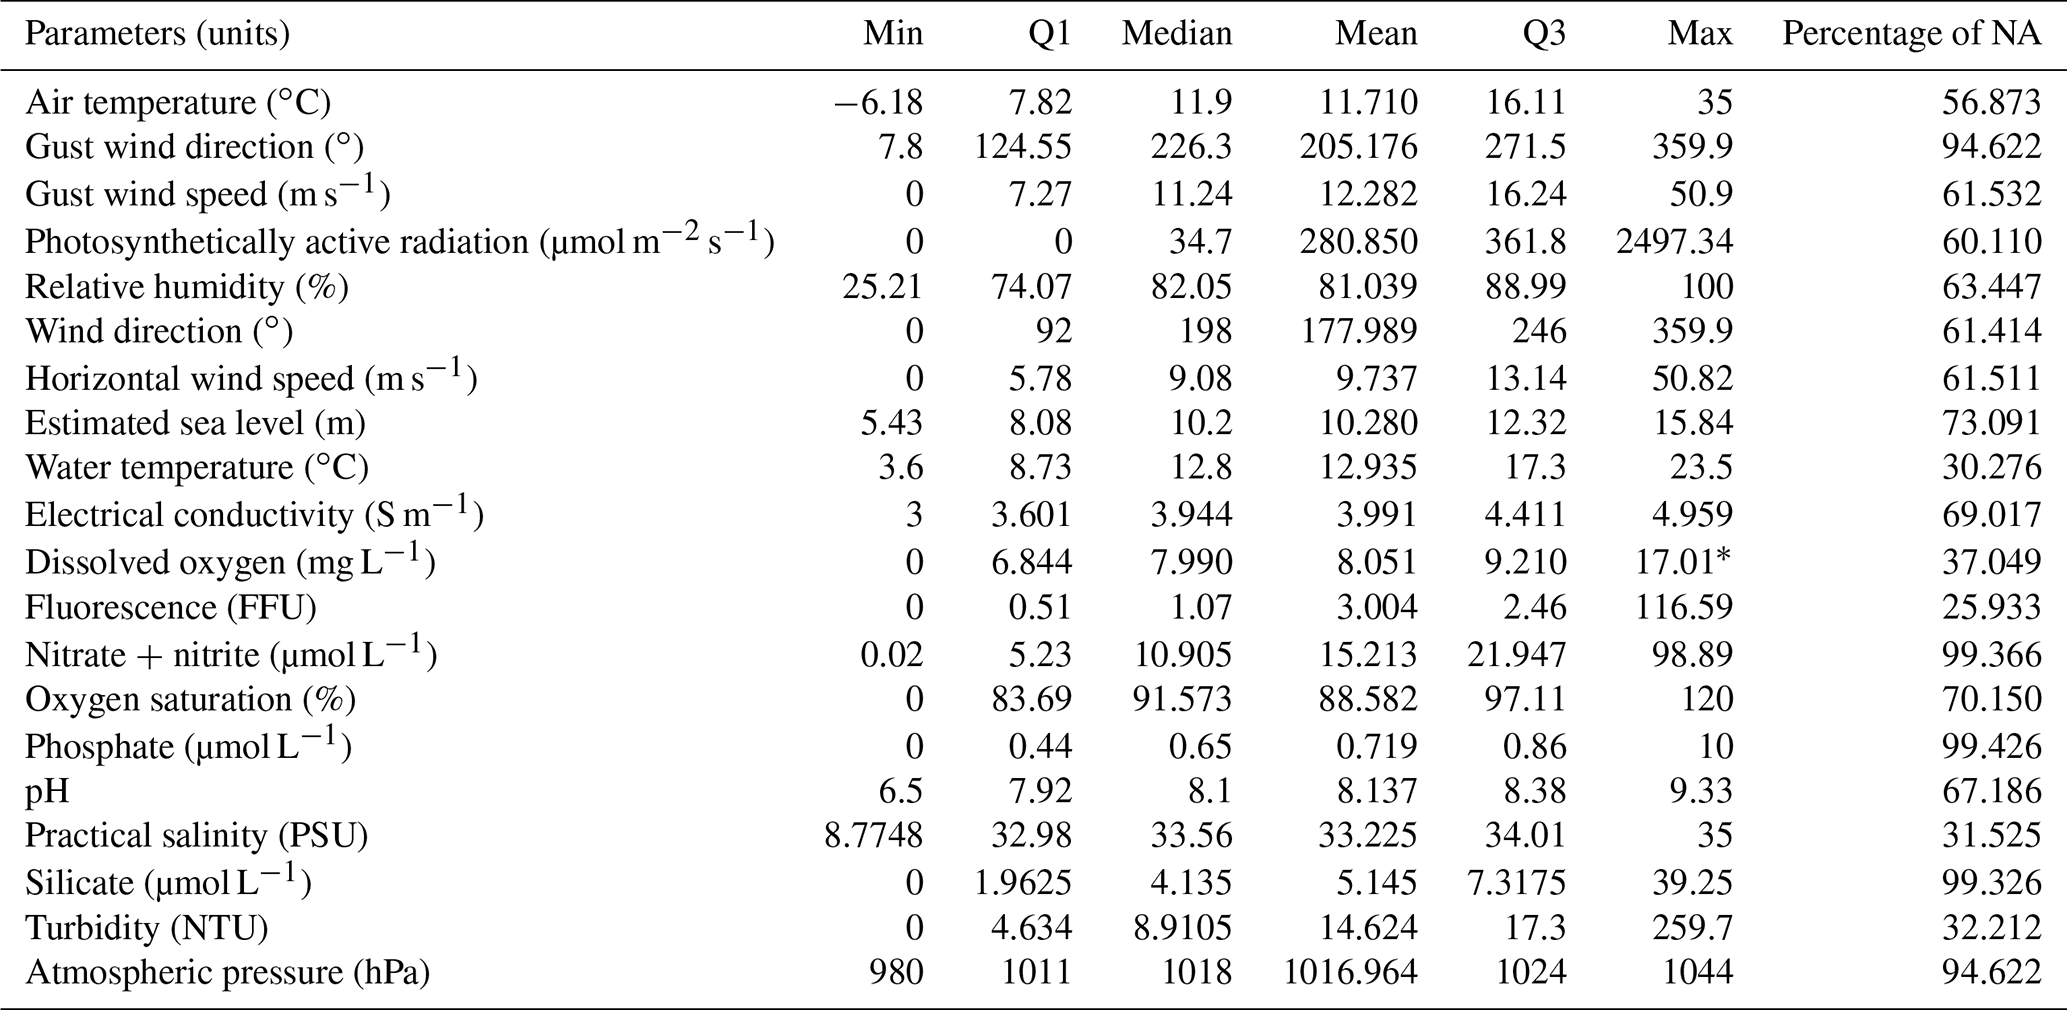
* Value obtained before 2014.
Figures 4 and 5 show the time series of parameters collected from MAREL Carnot station from 2004 until 2022. We noticed that some signals have seasonal cycles, such as water and air temperatures as well as photosynthetically active radiation (PAR). In addition, the signals contain episodic or continuous missing values over several time periods. For instance, a large number of missing values can be found around the year 2014 in most time series. This is due to station and sensor alterations that occurred during that time, particularly the replacement of several sensors with a multi-parameter probe (Lefebvre and Schmitt, 2016). Likewise, the signals of air temperature, PAR, wind speed, and sea level were lost for several years while waiting for new funding resources to ensure the renewal of sensors and associated electronic systems. Conductivity data prior to 2015 were deleted by the Coriolis data center, probably under the presumption that salinity is more relevant to the scientific community. This highlights the added value of our research, which is to ensure that all observations collected by MAREL Carnot remain permanently available and accessible to everyone.
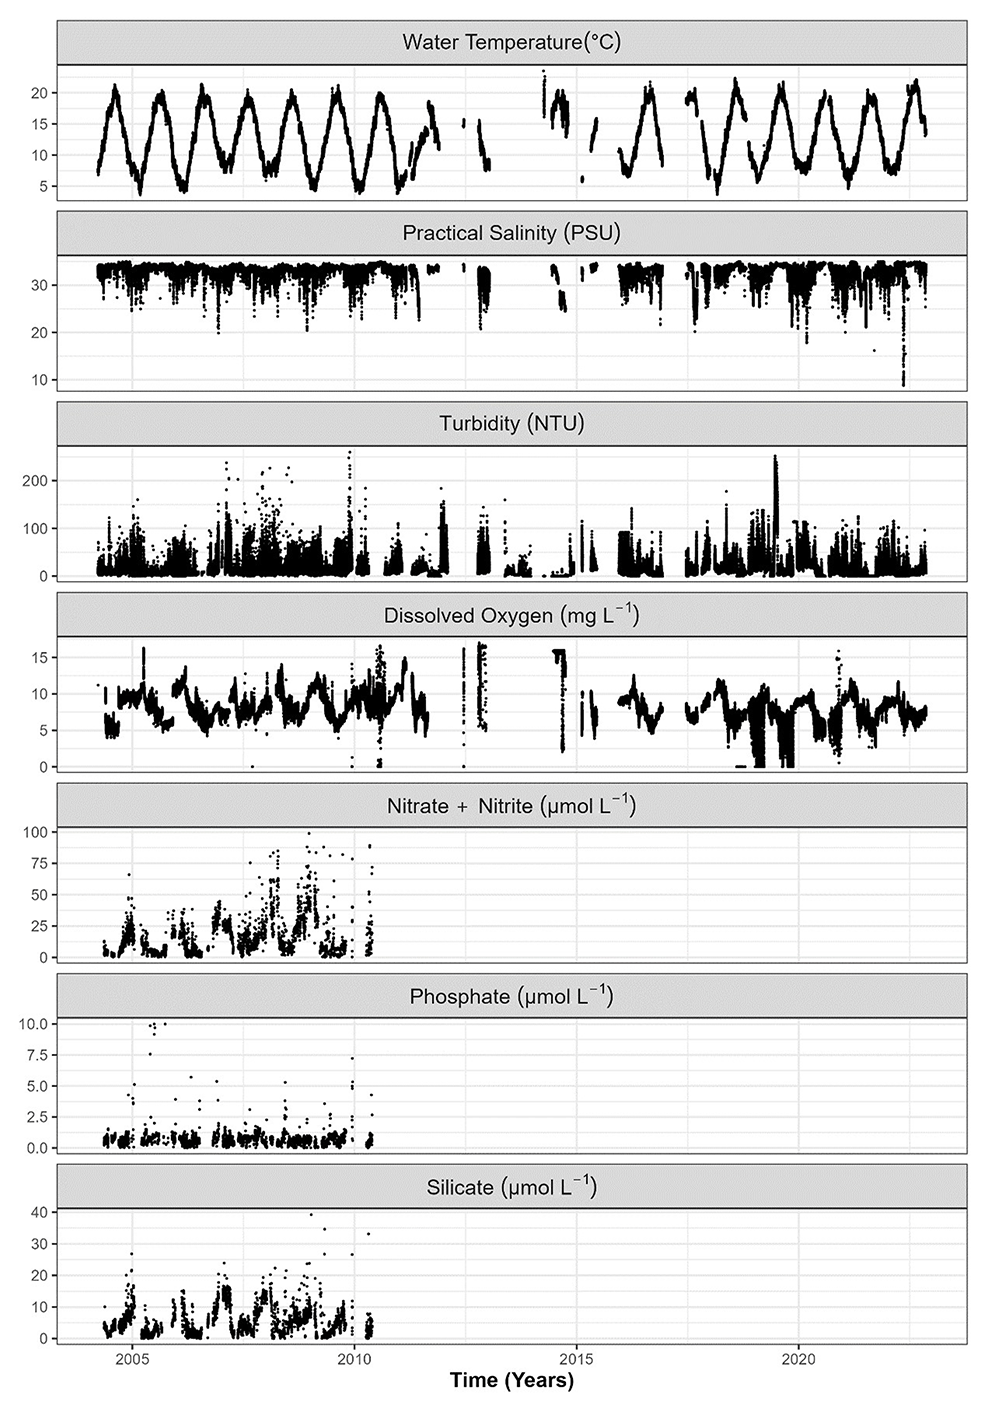
Figure 4Time series of parameters collected from MAREL Carnot station during the period 2004–2022.
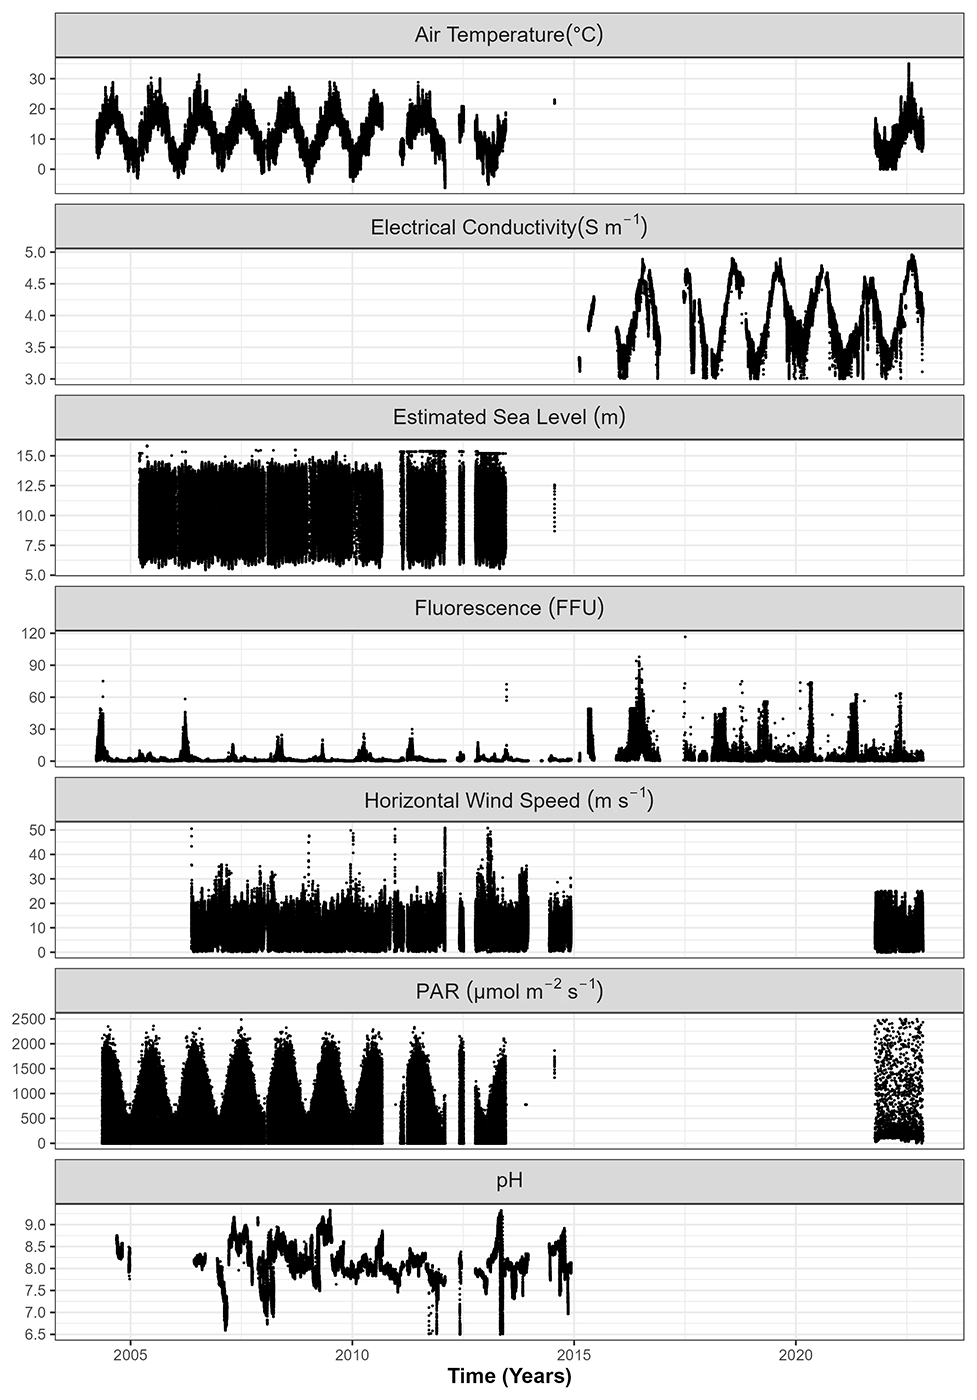
Figure 5Time series of parameters collected from MAREL Carnot station during the period 2004–2022.
Nutrient signals such as phosphate, nitrate, and silicate are only available until 2010. This is caused by a previous sensor failure and the inability to replace it.
Figure 6 shows a wind rose showing the frequency (%) and wind speed (m s−1) for different wind directions measured by MAREL Carnot from 2004 until 2022.
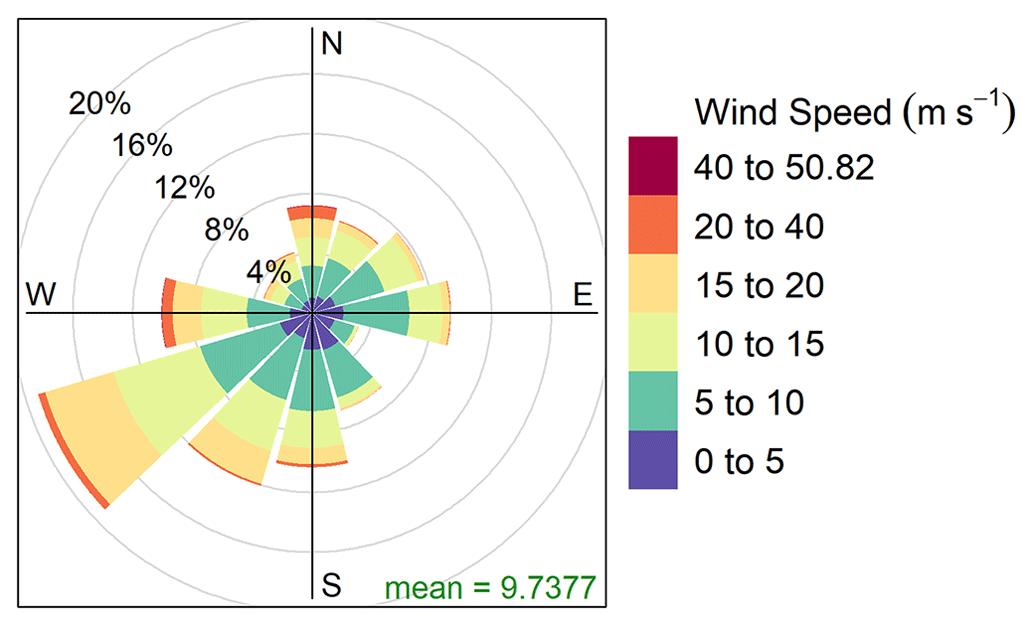
Figure 6Wind rose showing the frequency (%) and wind speed (m s−1) for different wind directions measured by the MAREL Carnot station from 2004 until 2022.
Scientists from several disciplinary backgrounds have utilized MAREL Carnot data to accomplish a wide range of research objectives. In the following paragraphs, we will go over some of the most significant findings from several research efforts. The scientific community that is interested in the MAREL Carnot dataset may find this evaluation useful in determining which topics may or may not require further study based on the results of this evaluation. This dataset allows researchers to investigate the dynamics of phytoplankton as well as to detect blooms caused by human activities and/or climate change.
For instance, Rousseeuw et al. (2015) developed an unsupervised hidden Markov model (uHMM) for monitoring the marine environment, specifically for detecting algal blooms and understanding phytoplankton dynamics. In their uHMM, parameters were estimated using spectral clustering rather than the commonly used iterative expectation maximization. The results obtained using the MAREL Carnot dataset showed that the proposed system is efficient at detecting the main productive and non-productive periods, as used for the purposes of the EU Water Framework Directive to assess good environmental status, and refining knowledge about phytoplankton bloom dynamics in a temperate ecosystem, temporarily dominated by a harmful algae, e.g., Phaeocystis globosa. Thus, the suggested uHMM system successfully characterizes phytoplankton dynamics from new incoming data (in near real-time), and it will enable researchers to gain a better understanding of the main controlling or forcing parameters (e.g., nutrient pressure, light availability, turbidity), the environmental status (e.g., phytoplankton biomass), and the direct and/or indirect effects of algal blooms (e.g., oxygen concentration) (Rousseeuw et al., 2015).
Following the unsupervised approach by Rousseeuw et al. (2015), Grassi et al. (2019) suggested a multilevel spectral clustering (M-SC) to split multivariate time series from general patterns to extreme events without a priori knowledge. The results obtained from the MAREL Carnot dataset have shown that we can extract knowledge on dynamics of events or environmental states. In addition, it was shown that M-SC allows for unsupervised labeling of time series, which is a basic part of machine learning needed to build an event prediction system and improve sampling strategies to operate in near real-time (Grassi et al., 2019). As a result, scientists should be able to create a HAB early-warning expert system to warn shellfish farmers and prevent both public health risks and commercial losses in the shellfish farming business.
The application of M-SC and uHMM on the MAREL Carnot dataset can reveal rare, recurrent, and extreme events, which may aid in improving coastal assessment and defining what constitutes a desirable environmental state. This can indirectly help improve management strategies established by the Water Framework Directive (WFD), Marine Strategy Framework Directive (MSFD) and Oslo and Paris (OSPAR) Convention.
The MAREL Carnot dataset can also be beneficial to data scientists and machine learning specialists. This dataset contains some missing data due to sensor failure and harsh weather conditions that prevent immediate sensor maintenance. It was used to evaluate the performance of a proposed “dynamic time warping” method to fill in successive missing values of univariate time series (Phan et al., 2020) and low, uncorrelated multivariate time series (Phan et al., 2017). It was also utilized in the application of a fuzz-logic-based similarity measure to impute large gaps of uncorrelated multivariate time series (Phan et al., 2018). These data imputation approaches are published on the Comprehensive R Archive Network (CRAN) and accessible through DTWBI (Imputation of Time Series Based on Dynamic Time Warping) and DTWUMI (Imputation of Multivariate Time Series Based on Dynamic Time Warping) packages, respectively.
This dataset can also be utilized to assess the performance of time series analysis methods on marine datasets. For instance, Kbaier Ben Ismail et al. (2016) used four parameters measured by MAREL Carnot to compare the classical techniques of time series analysis to recent ones. Also, Huang and Schmitt (2014) performed empirical mode decomposition (EMD) to study time-dependent intrinsic correlation of temperature and dissolved oxygen time series measured by MAREL Carnot.
Derot et al. (2020) investigated the impact of different sampling frequencies on forecasting harmful algal blooms. They applied a random forest (RF) and sliding-window strategy on 12 parameters derived from the MAREL Carnot dataset. The research demonstrated that the sampling frequency has a direct impact on the forecast performance of a RF model as high-frequency datasets might provide useful information to the RF model. This type of model sets the groundwork for the creation of a numerical decision-making tool that could help mitigate the impact of algal blooms and can recreate interactions that closely resemble the real biological processes (Derot et al., 2020).
Moreover, the MAREL Carnot dataset might be useful for studying turbulence. Derot et al. (2015) studied the phytoplankton biomass during bloom events by applying empirical mode decomposition (EMD) on a fluorescence dataset from MAREL Carnot. Results revealed that bloom events include considerable internal variations. Blooms are not smooth and “mountain-like” but exhibit high-frequency oscillations possibly due to turbulent advection and complex population dynamics (Derot et al., 2015). Besides, Zongo and Schmitt (2011) demonstrated that pH fluctuations in marine waters are strongly influenced by turbulent hydrodynamical transport and may be considered a turbulent active scalar.
Moreover, the sensors placed on the lighthouse provide valuable data for meteorological research and may improve local weather forecasts by measuring variables including wind speed, wind direction, and air temperature. Also, the MAREL Carnot high-frequency dataset can be used to validate satellite-derived products such as fluorescence. It also provides measurements for parameters that cannot be measured from space such as nutrient concentration (Lefebvre and Schmitt, 2016). Our dataset may assist fisheries research. For instance, Toomey et al. (2023) incorporated MAREL Carnot water temperature time series in the supplementary material of their study on the impact of temperature on Downs herring.
Overall, the MAREL Carnot station provides automatic, continuous, and long-term observation of various physical, chemical, and biological parameters that enhance our knowledge about the environmental state of the coastal environment and bloom events. Hence, the MAREL Carnot dataset aligns with objectives of SRN (Suivi Régional des Nutriments in French, Regional Nutrients Monitoring Program), especially by assessing the influence of continental inputs on the marine environment and their implication on possible eutrophication, which can assist in estimating the effectiveness of development and management policies in the marine coastal zone (Lefebvre and Devreker, 2023). To clarify, MAREL Carnot is the first coastal sampling station for the SRN transect. Thus, it assists in understanding phytoplankton dynamics by determining recurrent, extreme, and rare events in this highly impacted and vulnerable coastal area.
Furthermore, the MAREL Carnot dataset can be complementary to both REPHY (Observation and Surveillance Network for Phytoplankton and Hydrology in coastal waters) (https://doi.org/10.17882/47248, REPHY – French Observation and Monitoring program for Phytoplankton and Hydrology in coastal waters, 2022) and REPHYTOX (Monitoring Network for Phycotoxins in marine organisms) (https://doi.org/10.17882/47251, REPHYTOX – French Monitoring program for Phycotoxins in marine organisms, 2022). The goal of REPHY is to measure the biomass, abundance, and composition of marine phytoplankton as well as hydrological parameters in coastal and lagoon waters. REPHYTOX is designed to find and track three types of toxins that can build up in bivalve mollusks and cause DSP (diarrheic shellfish poisoning), PSP (paralytic shellfish poisoning), and ASP (amnesic shellfish poisoning) (Belin et al., 2021). Monitoring carried out by MAREL Carnot in parallel with REPHY and REPHYTOX permits continuous adaptation to the objectives, developing analysis strategies with extensive and complex data, thereby ensuring sustainability, which were challenges faced by REPHY and REPHYTOX before.
While MAREL Carnot has made substantial progress toward automating marine ecosystem monitoring, there are still some significant challenges to overcome. Indeed, it can be interrupted by rough sea conditions, such as strong tidal currents and storms. In addition, biofouling presents a major problem for sensors in the coastal environment, which explains why only a few moored autonomous systems have been deployed in the coastal environment (Blain et al. 2004). Due to sensor failure, phosphate, nitrate, and silicate measurements are not available after 2010. To better explain the large data gap, we should emphasize that we were in an interim phase, facing difficulties in maintaining a system developed and built in the early 2000s, with electronic parts that were no longer available and waiting for the improvement of the smart multi-sensor marine observation platform, COSTOF2, which was driving all of the sensors and dataflow.
As our knowledge and understanding of coastal ecosystems is growing with time, the EOVs (essential ocean variables) and EBVs (essential biodiversity variables) may be updated in the future. This may necessitate the installation of new sensors on the MAREL Carnot station to measure these new variables or parameters.
In future work, we plan to use a multi-scale, multi-source, multi-criteria, and multi-parameter approach to characterize and predict harmful algal blooms in the eastern English Channel caused by Phaeocystis globosa and Pseudo-nitzschia spp. We will do this by combining high-frequency datasets from MAREL Carnot, satellite, and modeling data with low-frequency datasets from other sources. This integrated observing system will be used to identify environmental states present in the region and develop an early-warning system that can anticipate harmful algal blooms in particular, as well as changes in water quality and environmental state in general.
The raw data are present on the official Coriolis website. These data were collected and made freely available by the Coriolis project and programs that contribute to it (http://www.coriolis.eu.org). The dataset after quality control procedures is present on the SEANOE (SEA scieNtific Open data Edition) website (https://doi.org/10.17882/39754) (MAREL Carnot, 2023) in file “2004–2022 Coriolis processed data”. Our data are made available according to the FAIR approach (Findable, Accessible, Interoperable, and Reusable).
In conclusion, high-frequency data from the MAREL Carnot instrumented station are useful in many scientific fields, such as phytoplankton ecology, data science, and oceanography. They can be used to describe the environmental state and forecast algal blooms in the eastern English Channel, which is important to warn shellfish farmers and prevent economic losses and health problems. It can also be used with satellite, modeling, and low-frequency in situ data to enhance our understanding of the marine ecosystem.
RHG wrote the paper. AL led the conceptualization, the writing of the paper, the funding acquisition, and the scientific coordination of activities related to MAREL Carnot since 2002. We highly appreciate the efforts of ÉP-C, GC, AB, and MR for their contributions to data preprocessing. We would also like to sincerely thank J-VF, LQ, VD, and CB for all their efforts in providing technical information and for maintaining the MAREL Carnot station.
The contact author has declared that none of the authors has any competing interests.
Publisher's note: Copernicus Publications remains neutral with regard to jurisdictional claims in published maps and institutional affiliations.
We would like to thank all laboratory technicians and crew members from boats for their contribution in field work needed for sensor calibration and station maintenance. We sincerely acknowledge the efforts of scientists, engineers and workers involved in engineering and implementation of MAREL Carnot in 2004.
The PhD of Raed Halawi Ghosn is supported by the Office Français de la Biodiversité (grant no. OFB.21.0578) and the Institut Français de Recherche pour l’Exploitation de la Mer (grant no. OFB.21.0578). MAREL Carnot is part of the COAST-HF National Observation Service within the research infrastructure ILICO. Its implementation and maintenance have been supported by (i) the European Union (ERDF), the French state, the French region Hauts-de- France, and Ifremer in the framework of the project CPER MARCO 2015-2021; (ii) by the European Union’s Horizon 2020 research and innovation program under grant agreement no. 654410 in the framework of the project JERICO S3; and (iii) by the Artois-Picardie Water Agency.
This paper was edited by Giuseppe M. R. Manzella and reviewed by two anonymous referees.
Aminot, A. and Kérouel, R.: Hydrologie des écosystèmes marins: paramètres et analyses, Ifremer Edition, France, 110–118, ISBN 2-84433-133-5, 2004.
Bates, S. S., Hubbard, K. A., Lundholm, N., Montresor, M., and Leaw, C. P.: Pseudo-nitzschia, Nitzschia, and domoic acid: New research since 2011, Harmful Algae, 79, 3–43, https://doi.org/10.1016/j.hal.2018.06.001, 2018.
Belin, C., Soudant, D., and Amzil, Z.: Three decades of data on phytoplankton and phycotoxins on the French coast: Lessons from REPHY and REPHYTOX, Harmful Algae, 102, 101733, https://doi.org/10.1016/J.HAL.2019.101733, 2021.
Blain, S., Guillou, J., Tréguer, P., Woerther, P., Delauney, L., Follenfant, E., Gontier, O., Hamon, M., Leildé, B., Masson, A., Tartu, C., and Vuillemin, R.: High frequency monitoring of the coastal marine environment using the MAREL buoy, J. Environ. Monitor., 6, 569–575, https://doi.org/10.1039/b314073c, 2004.
Blauw, A. N., Los, F. J., Huisman, J., and Peperzak, L.: Nuisance foam events and Phaeocystis globosa blooms in Dutch coastal waters analyzed with fuzzy logic, J. Marine Syst., 83, 115–126, https://doi.org/10.1016/j.jmarsys.2010.05.003, 2010.
Brylinski, J.-M., Lagadeuc, Y., Gentilhomme, V., Dupont, J.-P., Lafite, R., Dupeuble, P.-A., Huault, M.-F., Auger, Y., Puskarlc, E., Wartel, M., and Cabioch, L.: Le “fleuve côtier”: un phénomène hydrologique important en Manche orientale. Exemple du Pas de Calais, Oceanol. Acta, 11, 197–203, 1991.
Brylinski, J. M., Brunet, C., Bentley, D., Thoumelin, G., and Hilde, D.: Hydrography and phytoplankton biomass in the Eastern English Channel in spring 1992, Estuar. Coast. Shelf S., 43, 507–519, https://doi.org/10.1006/ecss.1996.0084, 1996.
Chai, F., Johnson, K. S., Claustre, H., Xing, X., Wang, Y., Boss, E., Riser, S., Fennel, K., Schofield, O., and Sutton, A.: Monitoring ocean biogeochemistry with autonomous platforms, Nat. Rev. Earth Environ., 1, 315–326, https://doi.org/10.1038/s43017-020-0053-y, 2020.
Delegrange, A., Lefebvre, A., Gohin, F., Courcot, L., and Vincent, D.: Pseudo-nitzschia sp. diversity and seasonality in the southern North Sea, domoic acid levels and associated phytoplankton communities, Estuar. Coast. Shelf S., 214, 194–206, https://doi.org/10.1016/j.ecss.2018.09.030, 2018.
Derot, J., Schmitt, F. G., Gentilhomme, V., and Zongo, S. B.: Long-term high frequency phytoplankton dynamics, recorded from a coastal water autonomous measurement system in the eastern English Channel, Cont. Shelf Res., 109, 210–221, https://doi.org/10.1016/J.CSR.2015.09.015, 2015.
Derot, J., Yajima, H., and Schmitt, F. G.: Benefits of machine learning and sampling frequency on phytoplankton bloom forecasts in coastal areas, Ecol. Inform., 60, 101174, https://doi.org/10.1016/j.ecoinf.2020.101174, 2020.
Dickey, T. D. and Bidigare, R. R.: Interdisciplinary oceanographic observations: The wave of the future, Sci. Mar., 69, 23–42, https://doi.org/10.3989/scimar.2005.69s123, 2005.
Grassi, K., Poisson Caillault, E., and Lefebvre, A.: Multilevel spectral clustering for extreme event characterization, OCEANS 2019 – Marseille, Marseille, France, 17–20 June 2019, 1–7, https://doi.org/10.1109/OCEANSE.2019.8867261, 2019.
Hallegraeff, G. M., Anderson, D. M., Belin, C., Bottein, M. Y. D., Bresnan, E., Chinain, M., Enevoldsen, H., Iwataki, M., Karlson, B., McKenzie, C. H., Sunesen, I., Pitcher, G. C., Provoost, P., Richardson, A., Schweibold, L., Tester, P. A., Trainer, V. L., Yñiguez, A. T., and Zingone, A.: Perceived global increase in algal blooms is attributable to intensified monitoring and emerging bloom impacts, Commun. Earth Environ., 2, 117, https://doi.org/10.1038/s43247-021-00178-8, 2021.
Huang, Y. and Schmitt, F. G.: Time dependent intrinsic correlation analysis of temperature and dissolved oxygen time series using empirical mode decomposition, J. Marine Syst., 130, 90–100, https://doi.org/10.1016/J.JMARSYS.2013.06.007, 2014.
Jouanneau, N., Sentchev, A., and Dumas, F.: Numerical modelling of circulation and dispersion processes in Boulogne-sur-Mer harbour (Eastern English Channel): Sensitivity to physical forcing and harbour design, Ocean Dynam., 63, 1321–1340, https://doi.org/10.1007/s10236-013-0659-4, 2013.
Karasiewicz, S. and Lefebvre, A.: Environmental Impact on Harmful Species Pseudo-nitzschia spp. and Phaeocystis globosa Phenology and Niche, J. Mar. Sci. Eng., 10, 174, https://doi.org/10.3390/jmse10020174, 2022.
Kazmi, S. S. U. H., Yapa, N., Karunarathna, S. C., and Suwannarach, N.: Perceived Intensification in Harmful Algal Blooms Is a Wave of Cumulative Threat to the Aquatic Ecosystems, Biology, 11, 852,https://doi.org/10.3390/biology11060852, 2022.
Kbaier Ben Ismail, D., Lazure, P., and Puillat, I.: Statistical properties and time-frequency analysis of temperature, salinity and turbidity measured by the MAREL Carnot station in the coastal waters of Boulogne-sur-Mer (France), J. Marine Syst., 162, 137–153, https://doi.org/10.1016/j.jmarsys.2016.03.010, 2016.
Lefebvre, A. and Devreker, D.: How to learn more about hydrological conditions and phytoplankton dynamics and diversity in the eastern English Channel and the Southern Bight of the North Sea: the Suivi Régional des Nutriments data set (1992–2021), Earth Syst. Sci. Data, 15, 1077–1092, https://doi.org/10.5194/essd-15-1077-2023, 2023.
Lefebvre, A. and Schmitt, F. G.: In Mesures à haute résolution dans l'environnement marin côtier, CNRS Editions, 162 pp., ISBN 978-2-271-08592-4, 2016.
Le Moal, M., Gascuel-Odoux, C., Ménesguen, A., Souchon, Y., Étrillard, C., Levain, A., Moatar, F., Pannard, A., Souchu, P., Lefebvre, A., and Pinay, G.: Eutrophication: A new wine in an old bottle?, Sci. Total Environ., 651, 1–11, https://doi.org/10.1016/j.scitotenv.2018.09.139, 2019.
MAREL Carnot: High Frequency measurement of the coastal environment in the eastern English Channel. Data from MAREL CARNOT – COAST-HF (Coastal ocean observing system – High frequency) monitoring programme within the Research Infrastructure ILICO, SEANOE [data set], https://doi.org/10.17882/39754, 2023.
Petroff, R., Hendrix, A., Shum, S., Grant, K. S., Lefebvre, K. A., and Burbacher, T. M.: Public health risks associated with chronic, low-level domoic acid exposure: A review of the evidence, Pharmacol. Therapeut., 227, 107865, https://doi.org/10.1016/j.pharmthera.2021.107865, 2021.
Phan, T. T. H., Poisson Caillault, É., Bigand, A., and Lefebvre, A.: DTW-Approach for uncorrelated multivariate time series imputation, in: 2017 IEEE 27th International Workshop on Machine Learning for Signal Processing (MLSP), Tokyo, Japan, 25–28 September 2017, 1–6, https://doi.org/10.1109/MLSP.2017.8168165, 2017.
Phan, T. T. H., Bigand, A., and Possoin Caillault E.: A New Fuzzy Logic-Based Similarity Measure Applied to Large Gap Imputation for Uncorrelated Multivariate Time Series, Appl. Comput. Intell. Soft Comput., 2018, 9095683, https://doi.org/10.1155/2018/9095683, 2018.
Phan, T. T. H., Poisson Caillault, É., Lefebvre, A., and Bigand, A.: Dynamic time warping-based imputation for univariate time series data, Pattern Recogn. Lett., 139, 139–147, https://doi.org/10.1016/j.patrec.2017.08.019, 2020.
REPHY – French Observation and Monitoring program for Phytoplankton and Hydrology in coastal waters: REPHY dataset – French Observation and Monitoring program for Phytoplankton and Hydrology in coastal waters, Metropolitan data, SEANOE [data set], https://doi.org/10.17882/47248, 2022.
REPHYTOX – French Monitoring program for Phycotoxins in marine organisms: REPHYTOX dataset, French Monitoring program for Phycotoxins in marine organisms. Data since 1987, SEANOE [data set], https://doi.org/10.17882/47251, 2022.
Riegman, R. and Van Boekel, W.: The ecophysiology of Phaeocystis globosa: A review, J. Sea Res., 35, 235–242, https://doi.org/10.1016/S1385-1101(96)90750-9, 1996.
Ross Brown, A., Lilley, M. K. S., Shutler, J., Widdicombe, C., Rooks, P., McEvoy, A., Torres, R., Artioli, Y., Rawle, G., Homyard, J., Tyler, C. R., and Lowe, C.: Harmful Algal Blooms and their impacts on shellfish mariculture follow regionally distinct patterns of water circulation in the western English Channel during the 2018 heatwave, Harmful Algae, 111, 102166, https://doi.org/10.1016/j.hal.2021.102166, 2022.
Rousseeuw, K., Poisson Caillault, E., Lefebvre, A., and Hamad, D.: Hybrid hidden markov model for marine environment monitoring, IEEE J. Sel. Top. Appl, 8, 204–213, https://doi.org/10.1109/JSTARS.2014.2341219, 2015.
Sazhin, A. F., Artigas, L. F., Nejstgaard, J. C., and Frischer, M. E.: The colonization of two Phaeocystis species (Prymnesiophyceae) by pennate diatoms and other protists: A significant contribution to colony biomass, Biogeochemistry, 83, 137–145, https://doi.org/10.1007/s10533-007-9086-2, 2007.
Spilmont, N., Denis, L., Artigas, L. F., Caloin, F., Courcot, L., Créach, A., Desroy, N., Gevaert, F., Hacquebart, P., Hubas, C., Janquin, M. A., Lemoine, Y., Luczak, C., Migné, A., Rauch, M., and Davoult, D.: Impact of the Phaeocystis globosa spring bloom on the intertidal benthic compartment in the eastern English Channel: A synthesis, Mar. Pollut. Bull., 58, 55–63, https://doi.org/10.1016/j.marpolbul.2008.09.007, 2009.
Toomey, L., Giraldo, C., Loots, C., Mahé, K., Marchal, P., and MacKenzie, K.: Impact of temperature on Downs herring (Clupea harengus) embryonic stages: First insights from an experimental approach, PLoS One, 18, e0284125, https://doi.org/10.1371/journal.pone.0284125, 2023.
Wong, A., Keeley, R., Carval, T., and Argo Data Management Team: Argo Quality Control Manual For CTD and Trajectory Data, 1–58, https://doi.org/10.13155/33951, 2022.
Young, N., Sharpe, R. A., Barciela, R., Nichols, G., Davidson, K., Berdalet, E., and Fleming, L. E.: Marine harmful algal blooms and human health: A systematic scoping review, Harmful Algae, 98, 101901, https://doi.org/10.1016/j.hal.2020.101901, 2020.
Zhu, Z., Meng, R., Smith, W. O., Doan-Nhu, H., Nguyen-Ngoc, L., and Jiang, X.: Bacterial Composition Associated With Giant Colonies of the Harmful Algal Species Phaeocystis globosa, Front. Microbiol., 12, https://doi.org/10.3389/fmicb.2021.737484, 2021.
Zongo, S. B. and Schmitt, F. G.: Scaling properties of pH fluctuations in coastal waters of the English Channel: pH as a turbulent active scalar, Nonlin. Processes Geophys., 18, 829–839, https://doi.org/10.5194/npg-18-829-2011, 2011.