the Creative Commons Attribution 4.0 License.
the Creative Commons Attribution 4.0 License.
 | 22 Aug 2023
A dataset for investigating socio-ecological changes in Arctic fjords
Robert W. Schlegel
Jean-Pierre Gattuso
The collection of in situ data is generally a costly process, with the Arctic being no exception. Indeed, there has been a perception that the Arctic is lacking in situ sampling; however, after many years of concerted effort and international collaboration, the Arctic is now rather well sampled, with many cruise expeditions every year. For example, the GLODAP (Global Ocean Data Analysis Project) product has a greater density of in situ sampling points within the Arctic than along the Equator. While this is useful for open-ocean processes, the fjords of the Arctic, which serve as crucially important intersections of terrestrial, coastal, and marine processes, are sampled in a much more ad hoc process. This is not to say they are not well sampled but rather that the data are more difficult to source and combine for further analysis. It was therefore noted that the fjords of the Arctic are lacking in FAIR (findable, accessible, interoperable, and reusable) data. To address this issue, a single dataset has been created from publicly available, predominantly in situ data from seven study sites in Svalbard and Greenland. After finding and accessing the data from a number of online platforms, they were amalgamated into a single project-wide standard, ensuring their interoperability. The dataset was then uploaded to PANGAEA so that it can be findable and reusable in the future. The focus of the data collection was driven by the key drivers of change in Arctic fjords identified in a companion review paper. To demonstrate the usability of this dataset, an analysis of the relationship between the different drivers was performed. Via the use of an Arctic biogeochemical model, these relationships were projected forward to 2100 via Representative Carbon Pathways (RCPs) 2.6, 4.5, and 8.5. This dataset is a work in progress, and as new datasets containing the relevant key drivers are released, they will be added to an updated version planned for the middle of 2024.
The dataset (Schlegel and Gattuso, 2022) is available on PANGAEA at https://doi.org/10.1594/PANGAEA.953115.
A live version is available at the FACE-IT WP1 site and can be accessed by clicking the “Data access” tab: https://face-it-project.github.io/WP1/ (last access: 17 August 2023).
- Article
(1915 KB) - Full-text XML
-
Supplement
(1034 KB) - BibTeX
- EndNote


The Arctic is a region of extreme contrasts. In the winter, life must contend with constant darkness, sea water that can freeze solid, and a pervasive silence punctuated only by violent gusts of wind, whereas the summer has 24 h of daylight, dramatically warmer air temperatures, and the arrival of migratory seabirds for the noisy business of breeding (Descamps et al., 2019). While much of the Arctic tundra is relatively barren throughout the year compared to ecoregions further south, coastal Arctic waters can be teaming with life. Of these systems, fjords provide a diverse range of habitats for many important species, thereby acting as both sources for extractive human activities and possible refuges against some of the oncoming ravages of climate change (Węsławski et al., 2011; Bonnet-Lebrun et al., 2022). The work outlined below focuses on the European Arctic, the definition of which is taken from Copernicus (https://climate.copernicus.eu/european-arctic, last access: 17 August 2023) and closely matches the AMAP (Arctic Monitoring and Assessment Programme) definition of the Arctic Circle (https://www.amap.no/about/geographical-coverage, last access: 17 August 2023).
The rate of loss for the Arctic cryosphere driven by the changing climate is alarmingly rapid (Schlegel et al., 2023), making it critical that Arctic fjord systems be as actively monitored as possible. Even though this monitoring in the polar north is both challenging and costly, there has been a concerted international effort to maintain and increase it. The majority of this in situ data collection, both at the surface and at depth, is conducted via large research ships or autonomous platforms, and the sampling of data throughout all but the mouths of fjords tends to be limited due to their depth. The sampling of data within fjords is therefore carried out in a more ad hoc manner, with many smaller teams and experiments creating disparate datasets that suffer from issues with regard to FAIR (findable, accessible, interoperable, and reusable) data, and some fjords are sampled much more heavily than others (Bischof et al., 2019). This is a known issue, and there has already been work done to create unified datasets for specific aspects of Arctic fjords (e.g. physical oceanography via the UNIS CTD database; Skogseth et al., 2019; https://data.npolar.no/dataset/39d9f0f9-af12-420c-a879-10990df2e22d, last access: 17 August 2023). However, there is not yet a unified dataset that provides data for investigating the range of possible relationships throughout the entire socio-ecological fjord system. The dataset detailed in this report aims to address this shortcoming.
The combination of the many different socio-ecological datasets is not as simple as identifying the sources of in situ data and putting them together into a folder. With the exception of a network of meteorological stations operated by the Norwegian Meteorological Institute (https://frost.met.no/index.html, last access: 17 August 2023) and a few well established instrument installations (e.g. Fischer et al., 2020), there are precious few long-running time series collected within or adjacent to the fjords of the EU Arctic. Because maintaining these stations in the Arctic is so expensive and because the hostility of the terrain dramatically limits their potential size or scope, there is always much more demand for research support than can be given. This is managed in part by running seasonal projects (1–3 month duration). In order to extend the time series for these projects, research teams may occasionally leave instrumentation in the field to continue sampling until the teams arrive the following year and begin a new (though usually similar) project (Bartsch et al., 2022). While this has proven to be an effective strategy for optimising the available fieldwork time in the Arctic, it effectively creates many short time series with a range of interoperability issues. There are now many well-funded international projects and research institutions that are working to close knowledge gaps in Arctic systems, but they tend to continue to produce these smaller datasets.
Therefore, a primary consideration during the creation of an Arctic fjord dataset designed to allow for the investigation of the full socio-ecological system within fjords is how to combine many spatially and temporally disjointed datasets when they may not have the same units of measurement or have otherwise not been sampled with comparable methodologies. To begin to address this issue, a panel of experts in a range of natural and social science fields identified the most relevant aspects of Arctic fjord socio-ecological systems (Schlegel et al., 2023). The structure of these systems was organised as follows: category → driver → variable. For example, the proportion of sea ice cover within a fjord is a variable of the driver sea ice, which is in the category of the cryosphere. This structure was used to guide the collection of data and to organise how the many small yet very important datasets in the Arctic were amalgamated. This structuring of the available data also allowed for better management and conversion of the different units and methodologies into a project-wide standard. This structure did, however, prevent the inclusion of some data types that cannot be effectively stored as a column of values, such as glacier shapefiles and photographic transects.
In the following text, we first explain why certain study sites were focused on when collecting the datasets that contained the variables of interest. We then document the methods by which these datasets were accessed, assembled, and quality controlled. A basic summary is then presented based on the different categories of the data (e.g. cryosphere, biology). To demonstrate possible uses of this dataset, drivers with known important relationships (i.e. seawater temperature and sea ice cover) are compared.
2.1 Study sites
Many of the long-running continuously sampled time series in EU Arctic fjords that contain the data of interest for socio-ecological systems are located in one of seven study sites. Across these sites, one also finds a gradient in the effects of the changing climate on the Arctic cryosphere and all downstream processes. The future of what much of the Arctic may look like is represented by fjords in mainland northern Norway, in this case Porsangerfjorden (Fig. 1). This fjord completely lacks a glacier and frequently lasts the winter with little to no sea ice cover. There are then fjords further to the north on the Svalbard archipelago (e.g. Kongsfjorden, Isfjorden, and Storfjorden), which do have glaciers and sea ice but at variously advanced rates of melt. Most projections show these fjords as resembling those on the mainland at some point within the century (Hop and Wiencke, 2019). Different again from the Svalbard fjords are those found in Greenland, with those on the east coast (e.g. Young Sound) currently being less influenced by warming coastal waters than the fjord systems on the west coast (e.g. Qeqertarsuup Tunua and Nuup Kangerlua). For these reasons, it was determined that the seven sites provide a scientifically useful basis for socio-ecological investigations, which is why a broader amalgamation of all possible data for all EU Arctic fjords was not performed. Using the names of these seven sites (accounting for various different spellings) and also their geographical coordinates, the databases detailed below were queried to create individual data collections per site. The main city and research station were also used in queries for data at Kongsfjorden (Ny-Alesund/Ny Alesund/Ny-Ålesund), Isfjorden (Longyearbyen), Young Sound (Zackenberg), Qeqertarsuup Tunua (Qeqertarsuup), and Nuup Kangerlua (Nuuk). The search parameters were not case sensitive.
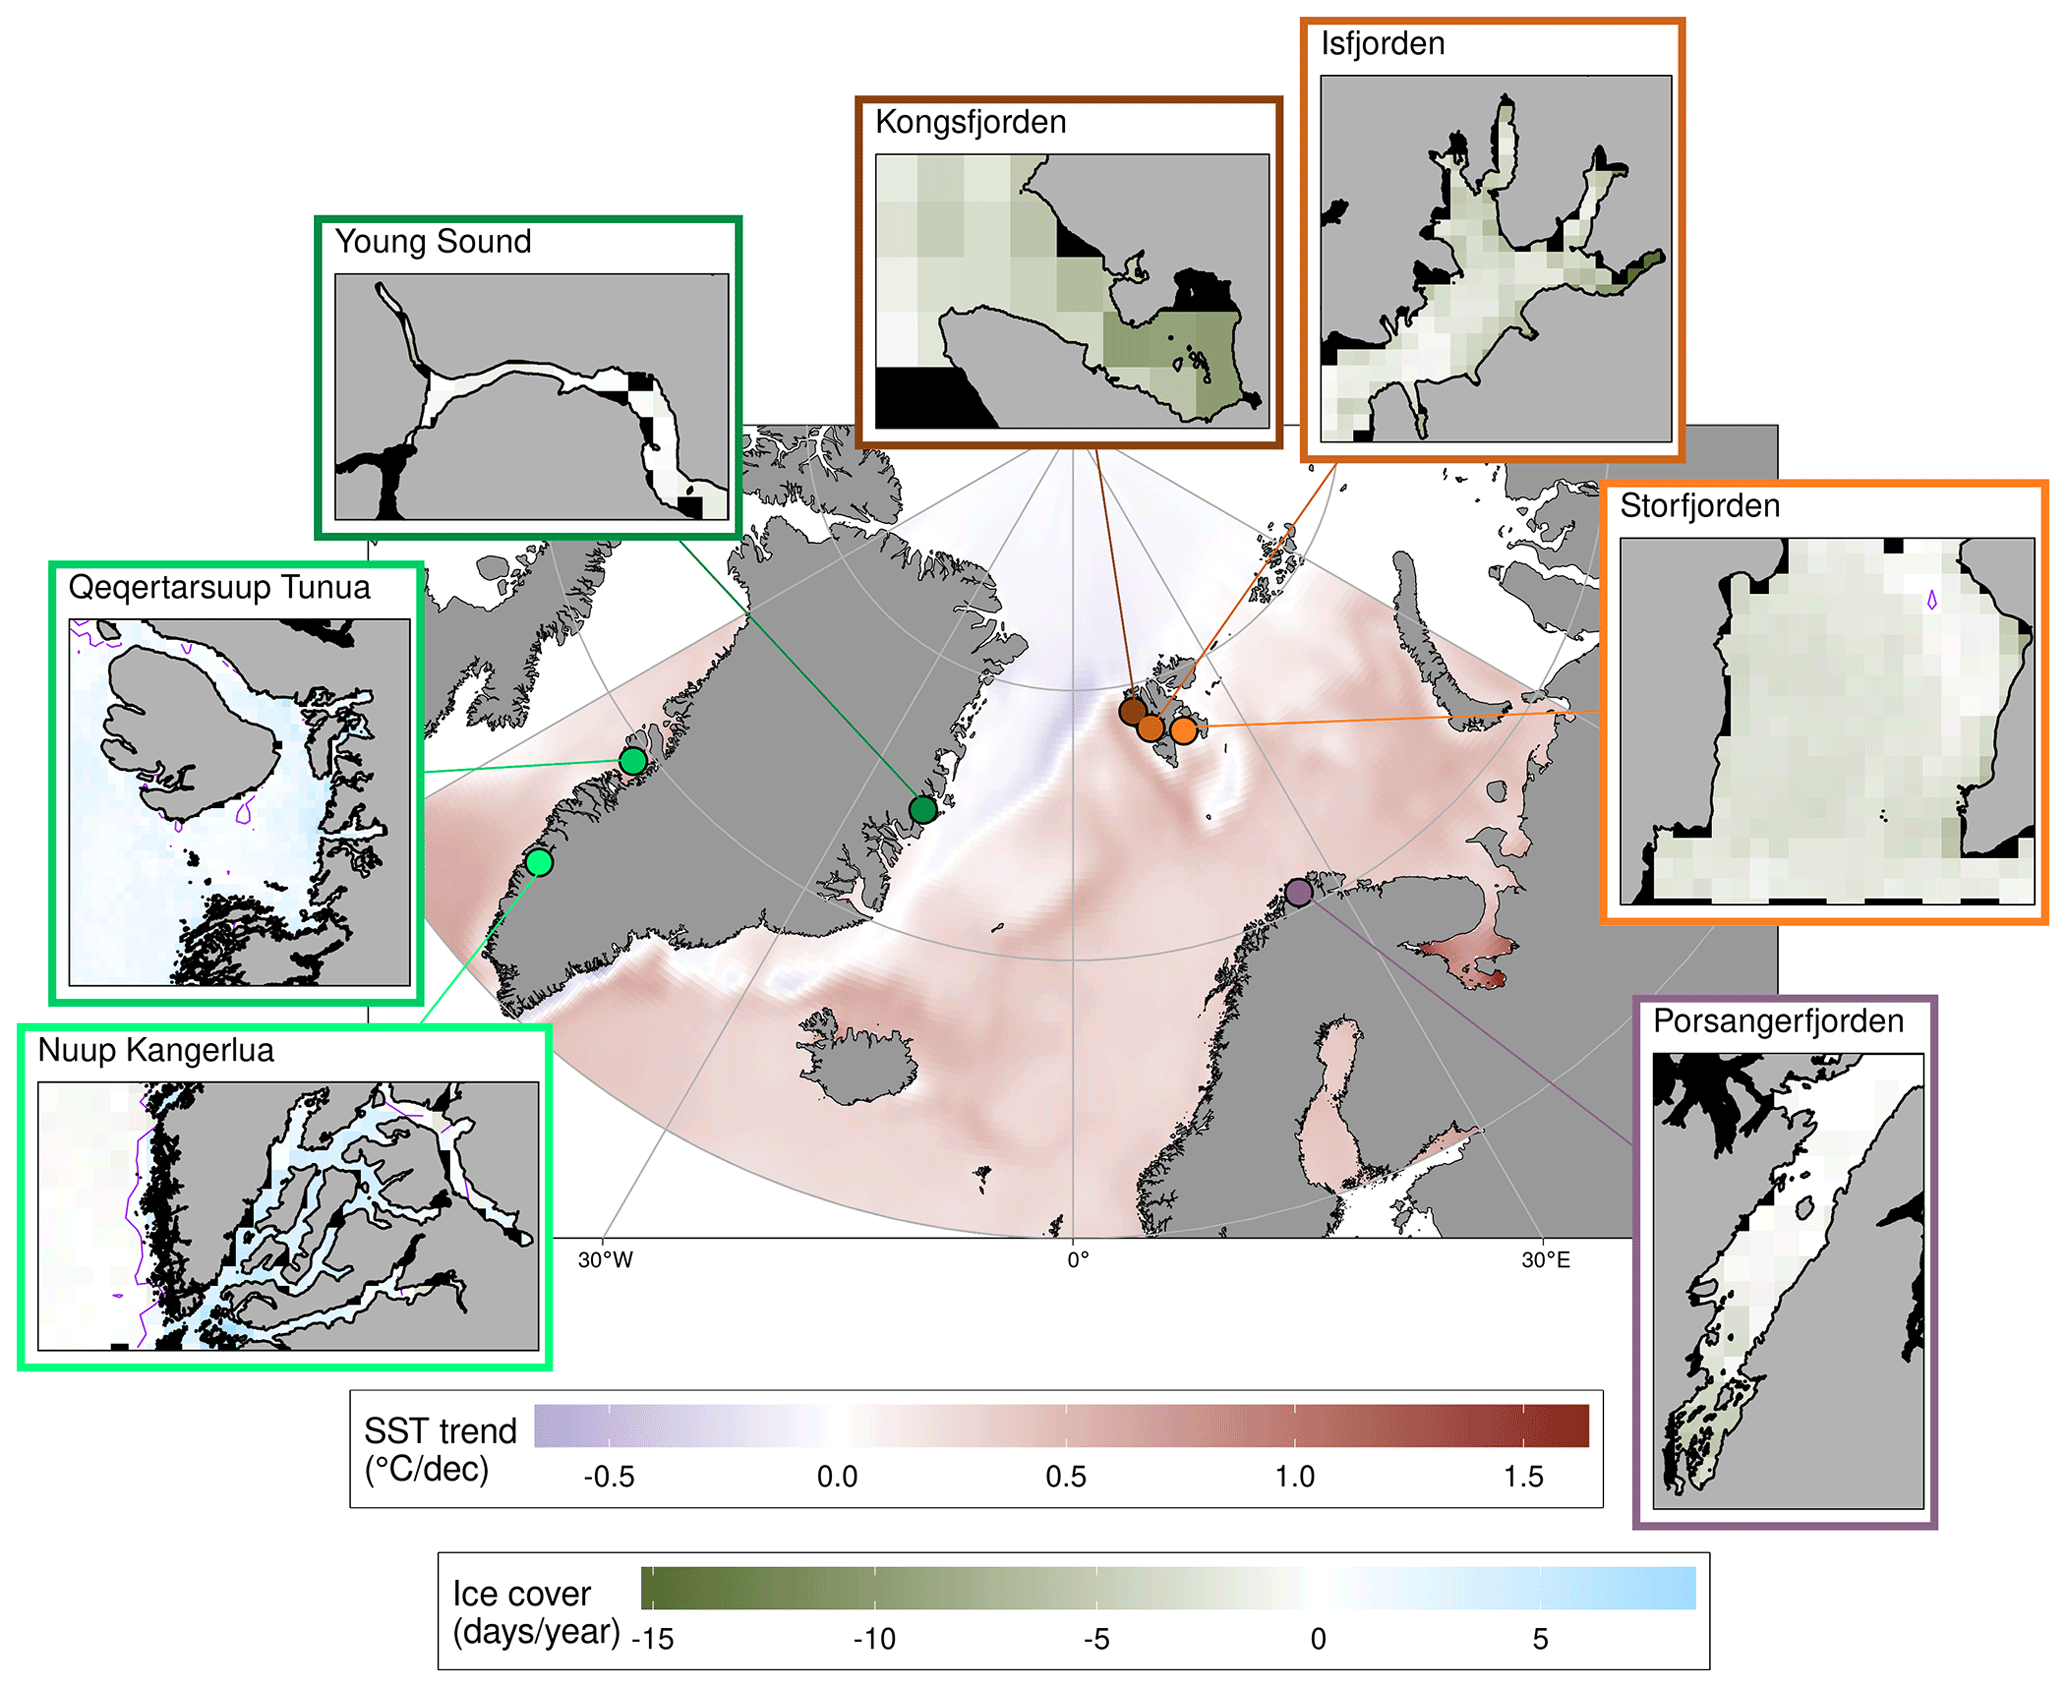
Figure 1Decadal trends in sea surface temperature (SST) throughout the Arctic waters surrounding the seven study sites (roughly 60∘ N–90∘ N and 60∘ W–60∘ E) and annual trends in sea ice cover. The colour of the pixels in the central panel shows the decadal rate of change from a simple linear model of the annual average temperatures during the period 1982–2021 from the daily NOAA OISST 0.25∘ gridded product (Huang et al., 2021). The locations of the study sites are denoted with coloured points and are shown with colour-coordinated inset windows. The rates of change in sea ice cover (days per year) for each study site were determined with a simple linear model on the number of open-water days per year from the MASIE ∼ 0.04∘ gridded product (NSIDC, 2022). The thin purple contours found in some windows show the 0 d yr−1 contour line, while pixels outside of the study site are shown in black. Note that the size of the study sites differ, and this is not accurately reflected by the size of the windows.
2.2 Categories → drivers → variables
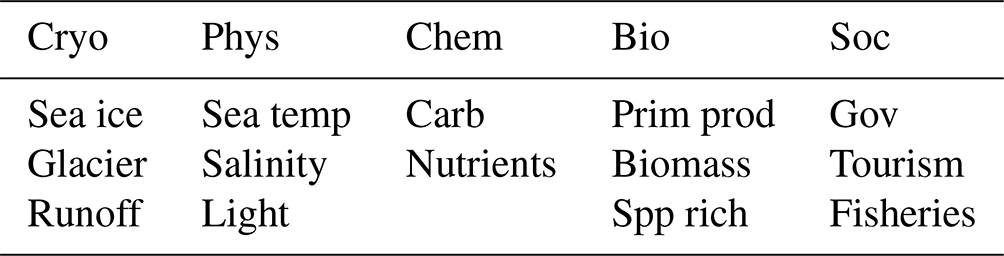
Due to the diverse range of avenues of inquiry one must consider when amalgamating data across the scope of a socio-ecological system, it was necessary to establish a consistent terminology. Each individual variable of measurement of the natural and social world (e.g. the presence of ice, tourist arrivals, or nitrate concentration; Table A1 in the Appendix) was characterised into 1 of 14 drivers (sensu Möller et al., 2022), with each of these being grouped into one of five categories (Table 1).
Table 1Categories and drivers into which all data points in this dataset are classified. The categories are as follows: cryo refers to cryosphere, phys refers to physics, chem refers to chemistry, bio refers to biology, and soc refers to social. The drivers are as follows: sea ice refers to sea ice cover, glacier refers to glacier mass balance, runoff refers to terrestrial runoff, sea temp refers to seawater temperature, light refers to spectral radiation (PAR (photosynthetically available radiation) + UV–B (ultraviolet B)), carb refers to carbonate system, nutrients refers to nutrients, prim prod refers to primary production, biomass refers to biomass, spp rich refers to species richness, gov refers to governance, tourism refers to tourism, and fisheries refers to fisheries.
The list of 14 drivers was not initially evident nor was there a consensus on them from the start. At the outset of the project, a long list of relevant variables was agreed upon, and links to the necessary datasets were provided when possible. When no link was provided, a series of data sources (Sect. 2.3) were queried using keywords or units of measure (e.g. sea water or degrees Celsius) from the list of variables. While all of the data originally identified were aggregated, a literature review performed for this same project revealed that the important interactions within socio-ecological systems would be better expressed as broad drivers rather than individual variables (Schlegel et al., 2023). In reaction to this, further pruning of the dataset outlined here revealed that many of the variables from the initial list had little to no available data. After a couple rounds of editing, the final list of 5 categories, 14 drivers, and the variables therein were established. Thanks to the companion review paper (Schlegel et al., 2023), it was also possible to determine which relationships between drivers are the most important and what the directions of those relationships are. It is these important dependent relationships that are used to demonstrate the utility of the product (Sect. 4). Finally, it should be noted that not all variables have equally accessible amounts of data, and the collection of data was heavily skewed in favour of the well-sampled variables of seawater temperature and salinity (Fig. 2). A total of 7 564 441 data points was collected, with nearly half being seawater temperature (3 606 138) and the other half being salinity (3 482 342). Of the 1565 datasets that have been collected, 880 contain seawater temperature data. Of the 107 different variables, 81 of them are only found in a single dataset, with these primarily being variables for biological, cryospheric, and social drivers (Fig. 2). Finally, it must be noted that all of the data points presented here represent either daily, monthly, or annual values. When data are available at a higher temporal resolution than daily (e.g. seawater temperature sampling made every minute on a mooring), they are averaged into one daily value.
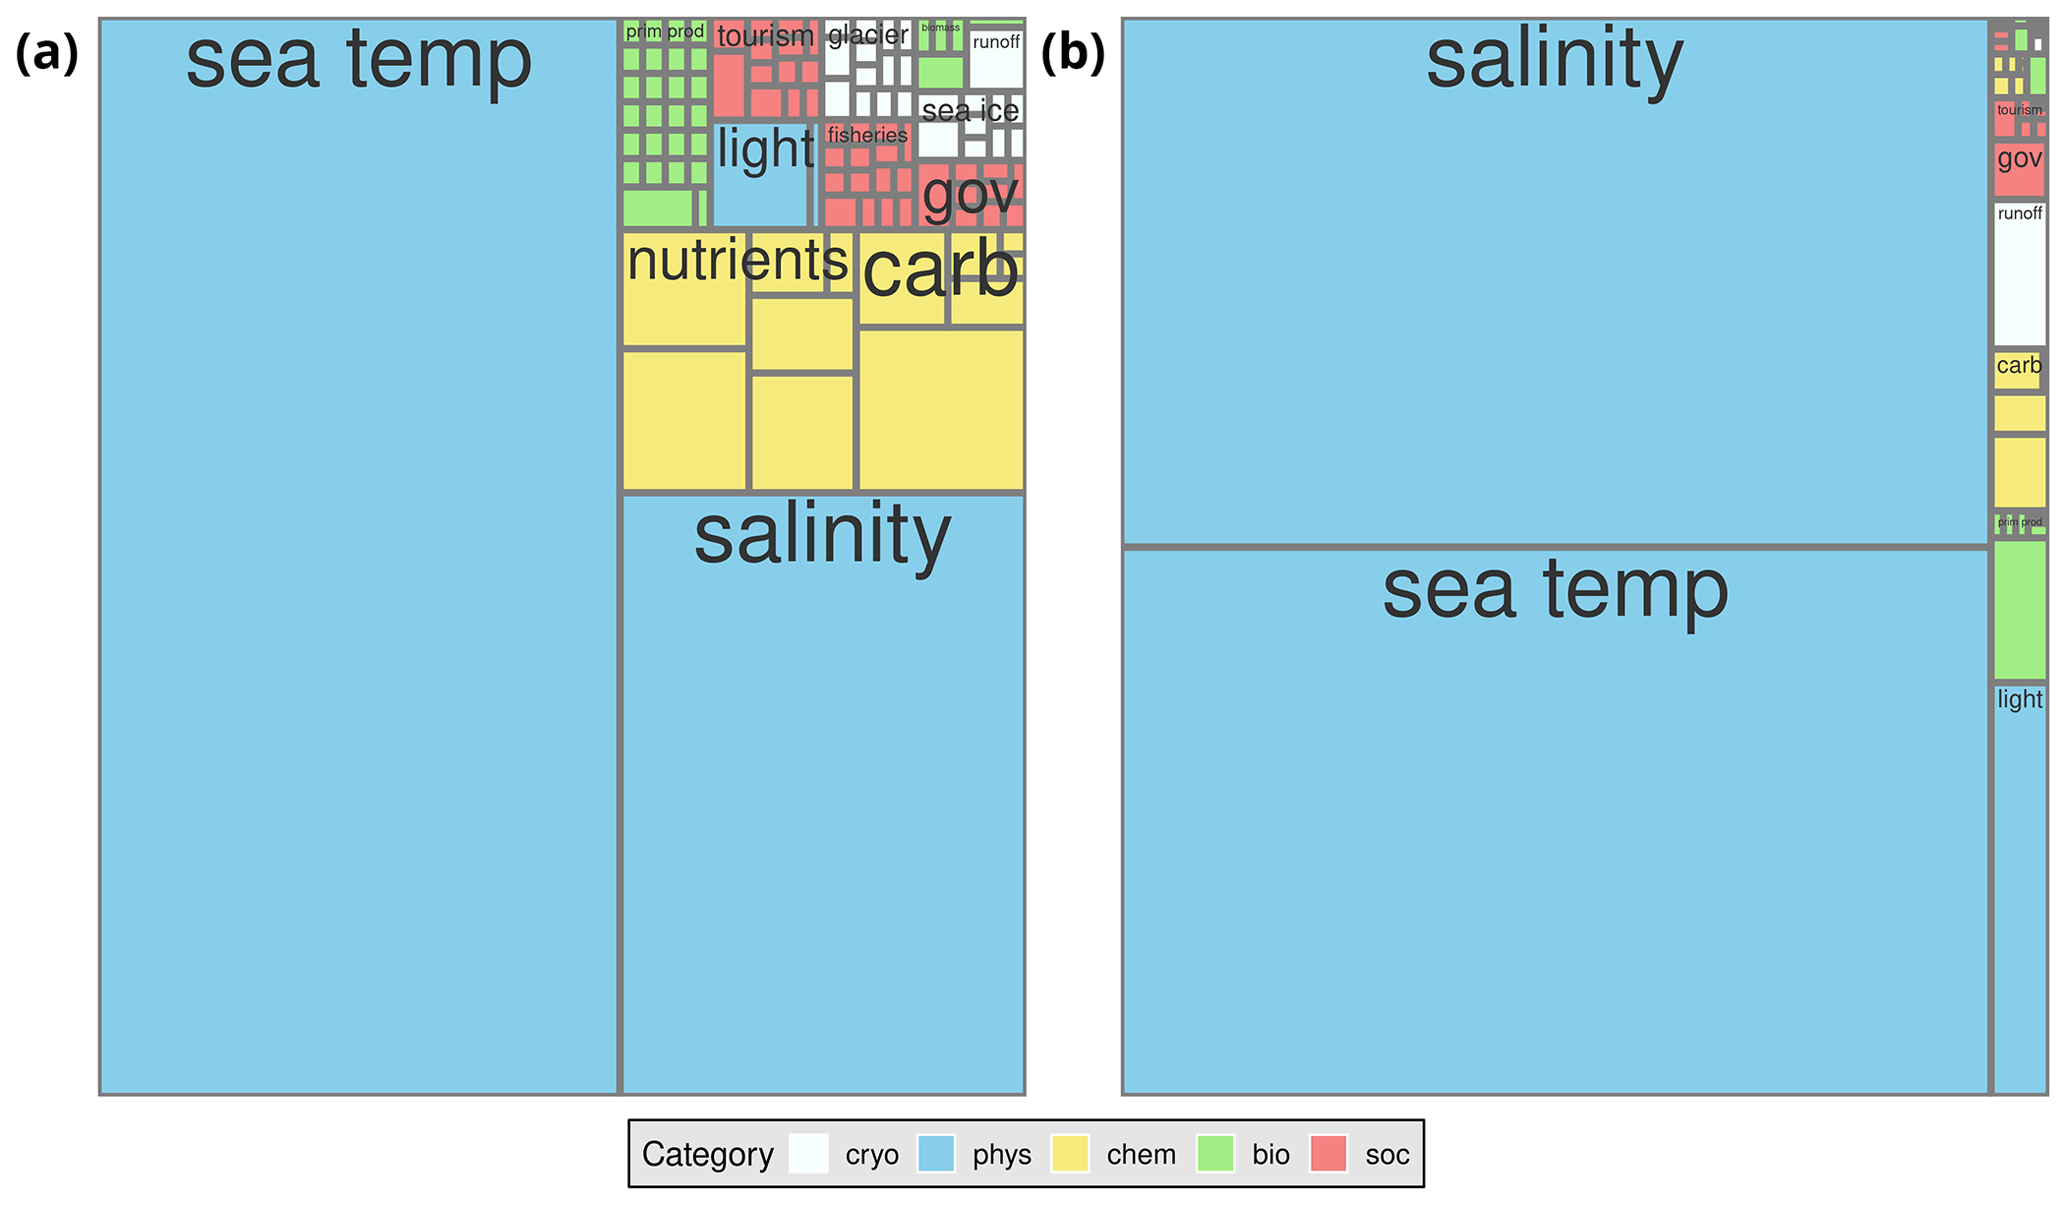
Figure 2Square tree plot showing the relative presence of the data collected for this dataset. Each box represents one variable. The clusters of variables per driver are labelled, with the colour of the boxes indicating the category of the data. If the numbers of data points for the variables constituting a driver are not numerous enough, no label is plotted. Definitions for the contractions used here (e.g. carb, sea temp) are given in Table 1. Panel (a) shows the relative count of datasets containing the indicated driver. Note that these boxes are not independent of one another because a single dataset could potentially contain multiple drivers. Panel (b) shows the relative count of individual daily data points per variable. These boxes are independent of one another.
2.3 Data sources
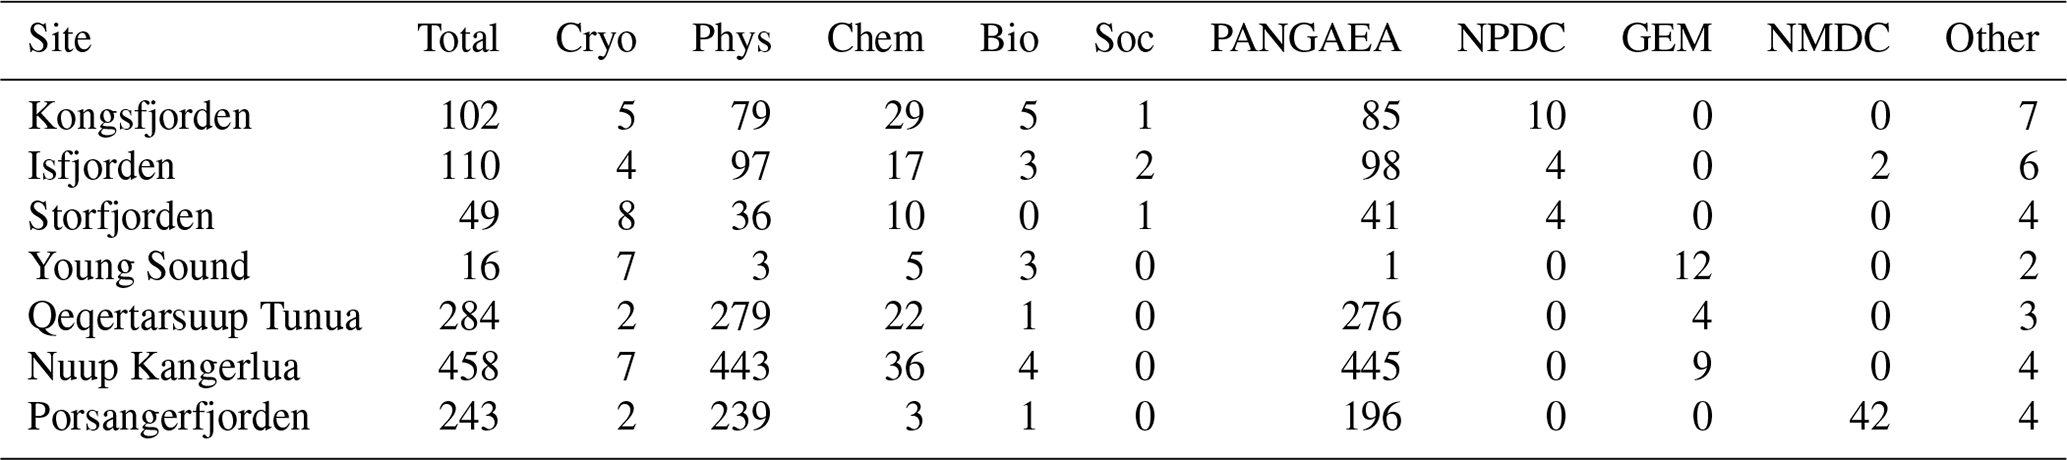
The vast majority of the data aggregated for this dataset were publicly available and accessed via four data repositories: (1) PANGAEA, (2) the Norwegian Polar Data Centre (NPDC), (3) the Norwegian Marine Data Centre (NMDC), and (4) Greenland Ecosystem Monitoring (GEM) (Table 2). A description of these repositories and how the datasets within each were accessed is detailed in the following subsections. Other notable databases that provided important access to data are also mentioned below.
Table 2The total count of datasets identified per site that contain data for the 14 drivers identified in this study. The count of datasets contributed by the four largest sources are listed in individual columns: PANGAEA, NPDC (Norwegian Polar Data Centre), NMDC (Norwegian Marine Data Centre), GEM (Greenland Ecosystem Monitoring), with the other minor sources combined into one column. The number of datasets containing data for a driver within one of the five categories is also listed; cryosphere (cryo), physics (phys), chemistry (chem), biology (bio), and social (soc) are also numerated. Note that a single dataset may contain data for multiple sites or categories.
2.3.1 PANGAEA
The PANGAEA data portal (https://pangaea.de, last access: 17 August 2023) hosts a very large collection of datasets produced primarily via Earth system research. It is an open-access portal with only some datasets under password-protected embargo while the authors await a corresponding research article to finish the publication process. The administrators of this portal provide an application programming interface (API) through which one may programmatically interrogate the entire database of a few hundred thousand datasets using Boolean search operators and keywords. While it must be noted that this data portal does not specialise in Arctic data, it is possible to filter data within a long–lat range, ensuring that the search results remain relevant. For this particular project, the R package pangaeaR (Chamberlain et al., 2021) was used. Through the initial search process, 14 063 datasets were identified as potentially being within the scope of the search for the key drivers and study sites. This first filter was based primarily on which datasets were geolocated within the bounding boxes covering the seven sites (Fig. 1), as well as on filtering out datasets that were specifically bathymetric, terrestrial, or aerial in nature. After downloading the datasets and amalgamating them, the list of parameters for the PANGAEA data was consulted, and those applying to the 14 drivers determined for this dataset were used as a second filter on the downloaded data. Through this process it was determined that 840 of the PANGAEA datasets would be aggregated, at least in part, with the final dataset.
2.3.2 NPDC
The Norwegian Polar Data Centre (NPDC; https://data.npolar.no, last access: 17 August 2023) is designed to cater to the needs of the Arctic research community and specifically hosts datasets related to research conducted for, or funded by, Norwegian institutions. This portal provides a more classic user interface in which one has a search bar that understands Boolean logic. Because the indexing of datasets on this website is tailored to Arctic research, it was not necessary to use the keywords for the drivers in searches. Rather, it was sufficient to search just for the names of the study sites. A total of 11 datasets were downloaded from this website, and all of them were aggregated into the final dataset.
2.3.3 NMDC
The Norwegian Marine Data Centre (NMDC; https://www.nmdc.no/, last access: 17 August 2023) is also designed to host Norwegian data but focuses on the marine realm and not necessarily the Arctic. This is not, however, an issue as the database interface combines a keyword search bar, common categories that can be excluded or included via radio buttons, and an interactive map that allows one to filter via spatial domain. In this way, one can rapidly and accurately search for datasets containing drivers of interest within the predetermined spatial domains of the seven sites chosen for this project. A total of 44 datasets were downloaded from this portal, all of which were included in the final dataset.
2.3.4 GEM
The Greenland Ecosystem Monitoring Database (GEM; https://data.g-e-m.dk/, last access: 17 August 2023) focuses on the management and dissemination of data relevant specifically to the three Greenland study sites identified for this project. This database is therefore oriented around inquiries into one of these three sites, and while a search bar is available, it is generally more direct to follow the links provided for the individual sites and to use the file structures listed therein to find datasets of interest. Overall, 31 datasets were downloaded from this portal; however, due to the data portal requirements for acknowledging the use of each unique download, it is not possible to include these datasets in the final dataset presented in this paper.
2.3.5 Additional sources of note
The Svalbard Integrated Arctic Earth Observing System (SIOS; https://sios-svalbard.org/, last access: 17 August 2023) is effectively a meta-search database of other Arctic databases that contain datasets specifically of interest to researchers on Svalbard. This data portal provides an advanced user interface, similarly to the NMDC, in which a range of criteria may be imputed in some way in order to limit the resulting output. After searching through the NPDC and NMDC databases, SIOS was used to perform a meta-search of many additional databases to catch anything that was not hosted on the two primary Norwegian sites. Several datasets were discovered through this method, all of which were included in the final dataset.
Another database with a strictly Arctic focus that provides publicly accessible data is the Environmental Monitoring of Svalbard and Jan Mayen (MOSJ; https://mosj.no/en/, last access: 17 August 2023). This database has a drop-down tab menu that allows users to select broad categories like climate → ocean. Therein, one can select from several variables such as sea ice extent or sea level. One then directly downloads these data as .csv files. This website was of particular importance for direct and useful glacier mass balance data. But it also provides a full range of variables from the cryosphere, physics, and biology categories. In total, two datasets were downloaded here, both of which were included in the database.
Governance data were provided exclusively via the national statistics websites of Norway (https://www.ssb.no/en, last access: 17 August 2023) and Greenland (https://bank.stat.gl/pxweb/en/Greenland/, last access: 17 August 2023). The Norwegian statistics website focuses more on the national concerns of an economy oriented around more developed service industries and therefore has fewer resources available for dedicated inquiry into the human impact on the marine realm. The Greenland national statistics website, in contrast, focuses more on the importance of the marine realm to the economy and therefore has a deeper range of available statistics of interest for the effect of governance on other drivers in Arctic fjord socio-ecological systems. Overall, 8 datasets were downloaded for Norway, and 16 were downloaded for Greenland, and all were included in the database. It must be noted that the spatial scale of these data is much greater than for the other categories. For example, the site of collection for a national statistic is usually an entire province and not a single fjord. Where possible, the national-scale sites are associated with their local-scale fjord (e.g. Nuup Kangerlua is within the Sermersooq Municipality).
There are also a few very large datasets of interest to this project which are themselves an amalgamation of smaller existing datasets. The first of these is the UNIS database (Skogseth et al., 2019), which is a compilation of all of the temperature and salinity profiles (collected via ship transects and moorings) found around Svalbard (75–83∘ N and 0–34∘ E), which partially explains the dominance of these two variables in the dataset (Fig. 2b). The other two datasets, SOCAT (Surface Ocean CO2 Atlas; Bakker et al., 2016) and GLODAP (The Global Ocean Data Analysis Project; Lauvset et al., 2022), focus more on the carbonate system of the ocean. These are global products, but only the Arctic region encompassing the seven study sites (∼ 60 to 90∘ N, ∼ 60∘ W to 60∘ E) has been amalgamated into the dataset for this project. Finally, the Norwegian Meteorological Institute (https://www.met.no/en, last access: 17 August 2023) provided 13 very long and high-quality multi-variable atmospheric time series generated by long-running MET stations; however, the final dataset for this project was limited to focusing directly on the marine realm, not the atmosphere, so these time series were not amalgamated.
2.4 Data assembly
Once the data portals had been thoroughly interrogated and the files downloaded and saved according to their data sharing permissions, they were combined into a single data product. Each of the data portals outlined above have their own requirements for the data they host, with some portals being more strict than others. Much of the aggregation of the hundreds of different datasets was aided by the very strict quality controlling for data hosted on PANGAEA. All of these datasets were first aggregated during the download process into a PANGAEA-specific format, which was close to the final project-wide standard. The other data portals allow for a wider variety in which the raw data within the dataset, as well as the different file types within which those data are stored, may be oriented. Using the R language (R Core Team, 2023), a series of scripts were written to create a pipeline that first loaded all of the PANGAEA files and then the individual files from the other data portals before combining them into a single shared project-wide standard based on tidy data principles (Wickham, 2014). Each datum in the dataset therefore has the same corresponding columns of meta-data: (1) download date, (2) URL, (3) citation, (4) type of data (e.g. in situ or remotely sensed), (5) site (mostly one of the seven study sites; Fig. 1), (6) category, (7) driver, (8) variable (9) longitude, (10) latitude, (11) date of sampling, and (12) depth of sampling. Where possible, the URL provided for the data is the link to its digital object identifier (DOI) page. Importantly, all values in the dataset are numeric so that they can be listed in one single column that extends along millions of rows of data. It should therefore be noted that non-numeric data were not amalgamated and that data spanning multiple dates or depths were taken at either the mean date or depth or the maximum date or depth, as would be appropriate for the data type. Once a single row of meta-data was finalised for each datum, any duplicate rows (i.e. hourly data) were averaged to a single value. This important decision was made because it was determined that, for a data product of this scale, it would not be beneficial to have sub-daily data. Indeed, seawater temperature already dominates this data product, and if it was left at its native resolution (often hourly values for moorings), then this would effectively be a seawater temperature and/or salinity product with < 0.1 % of the space being dedicated to the other 12 drivers.
2.5 Quality control
Because all of the data aggregated for this dataset were taken from published sources, it was determined that they should not require the application of rigorous quality control (QC). Therefore the primary function of QC for this process was to ensure that the data aggregated into the final product could be classified into one of the 14 drivers identified above. This was necessary in part because many of the datasets listed at the outset of the project contained data for drivers outside of the final 14, requiring that they be filtered during the amalgamation process.
Even though this dataset is composed almost entirely of published data, it was noted while performing the example analyses below (Sect. 4) that some issues persisted. When the issue was simply an anomalous data point (e.g. a negative chlorophyll value), it was removed, and the data analyses carried on. However, there were cases when systemic issues were identified in a dataset (e.g. consistently low salinity values), in which case the entire dataset was omitted. When possible the contact person for the dataset was notified about the potentially erroneous data.
One would generally assume that the availability of data within the Arctic would be highly seasonal, but with the exception of the cryosphere, this is not the case (Fig. 3). The coverage of sea ice data is much lower in spring and summer because a complete lack of sea ice cover is generally calculated as a missing value rather than a 0. Curiously, glacier mass balance data are missing in the winter. Upon closer inspection it was discovered that this is because sampling tends to end in September and resume in April. We also note that the values for social drivers (i.e. governance, tourism, and fisheries) are so low because these data are only available at monthly or annual rates, whereas the data from the other categories (i.e. not social data) are available at daily rates.
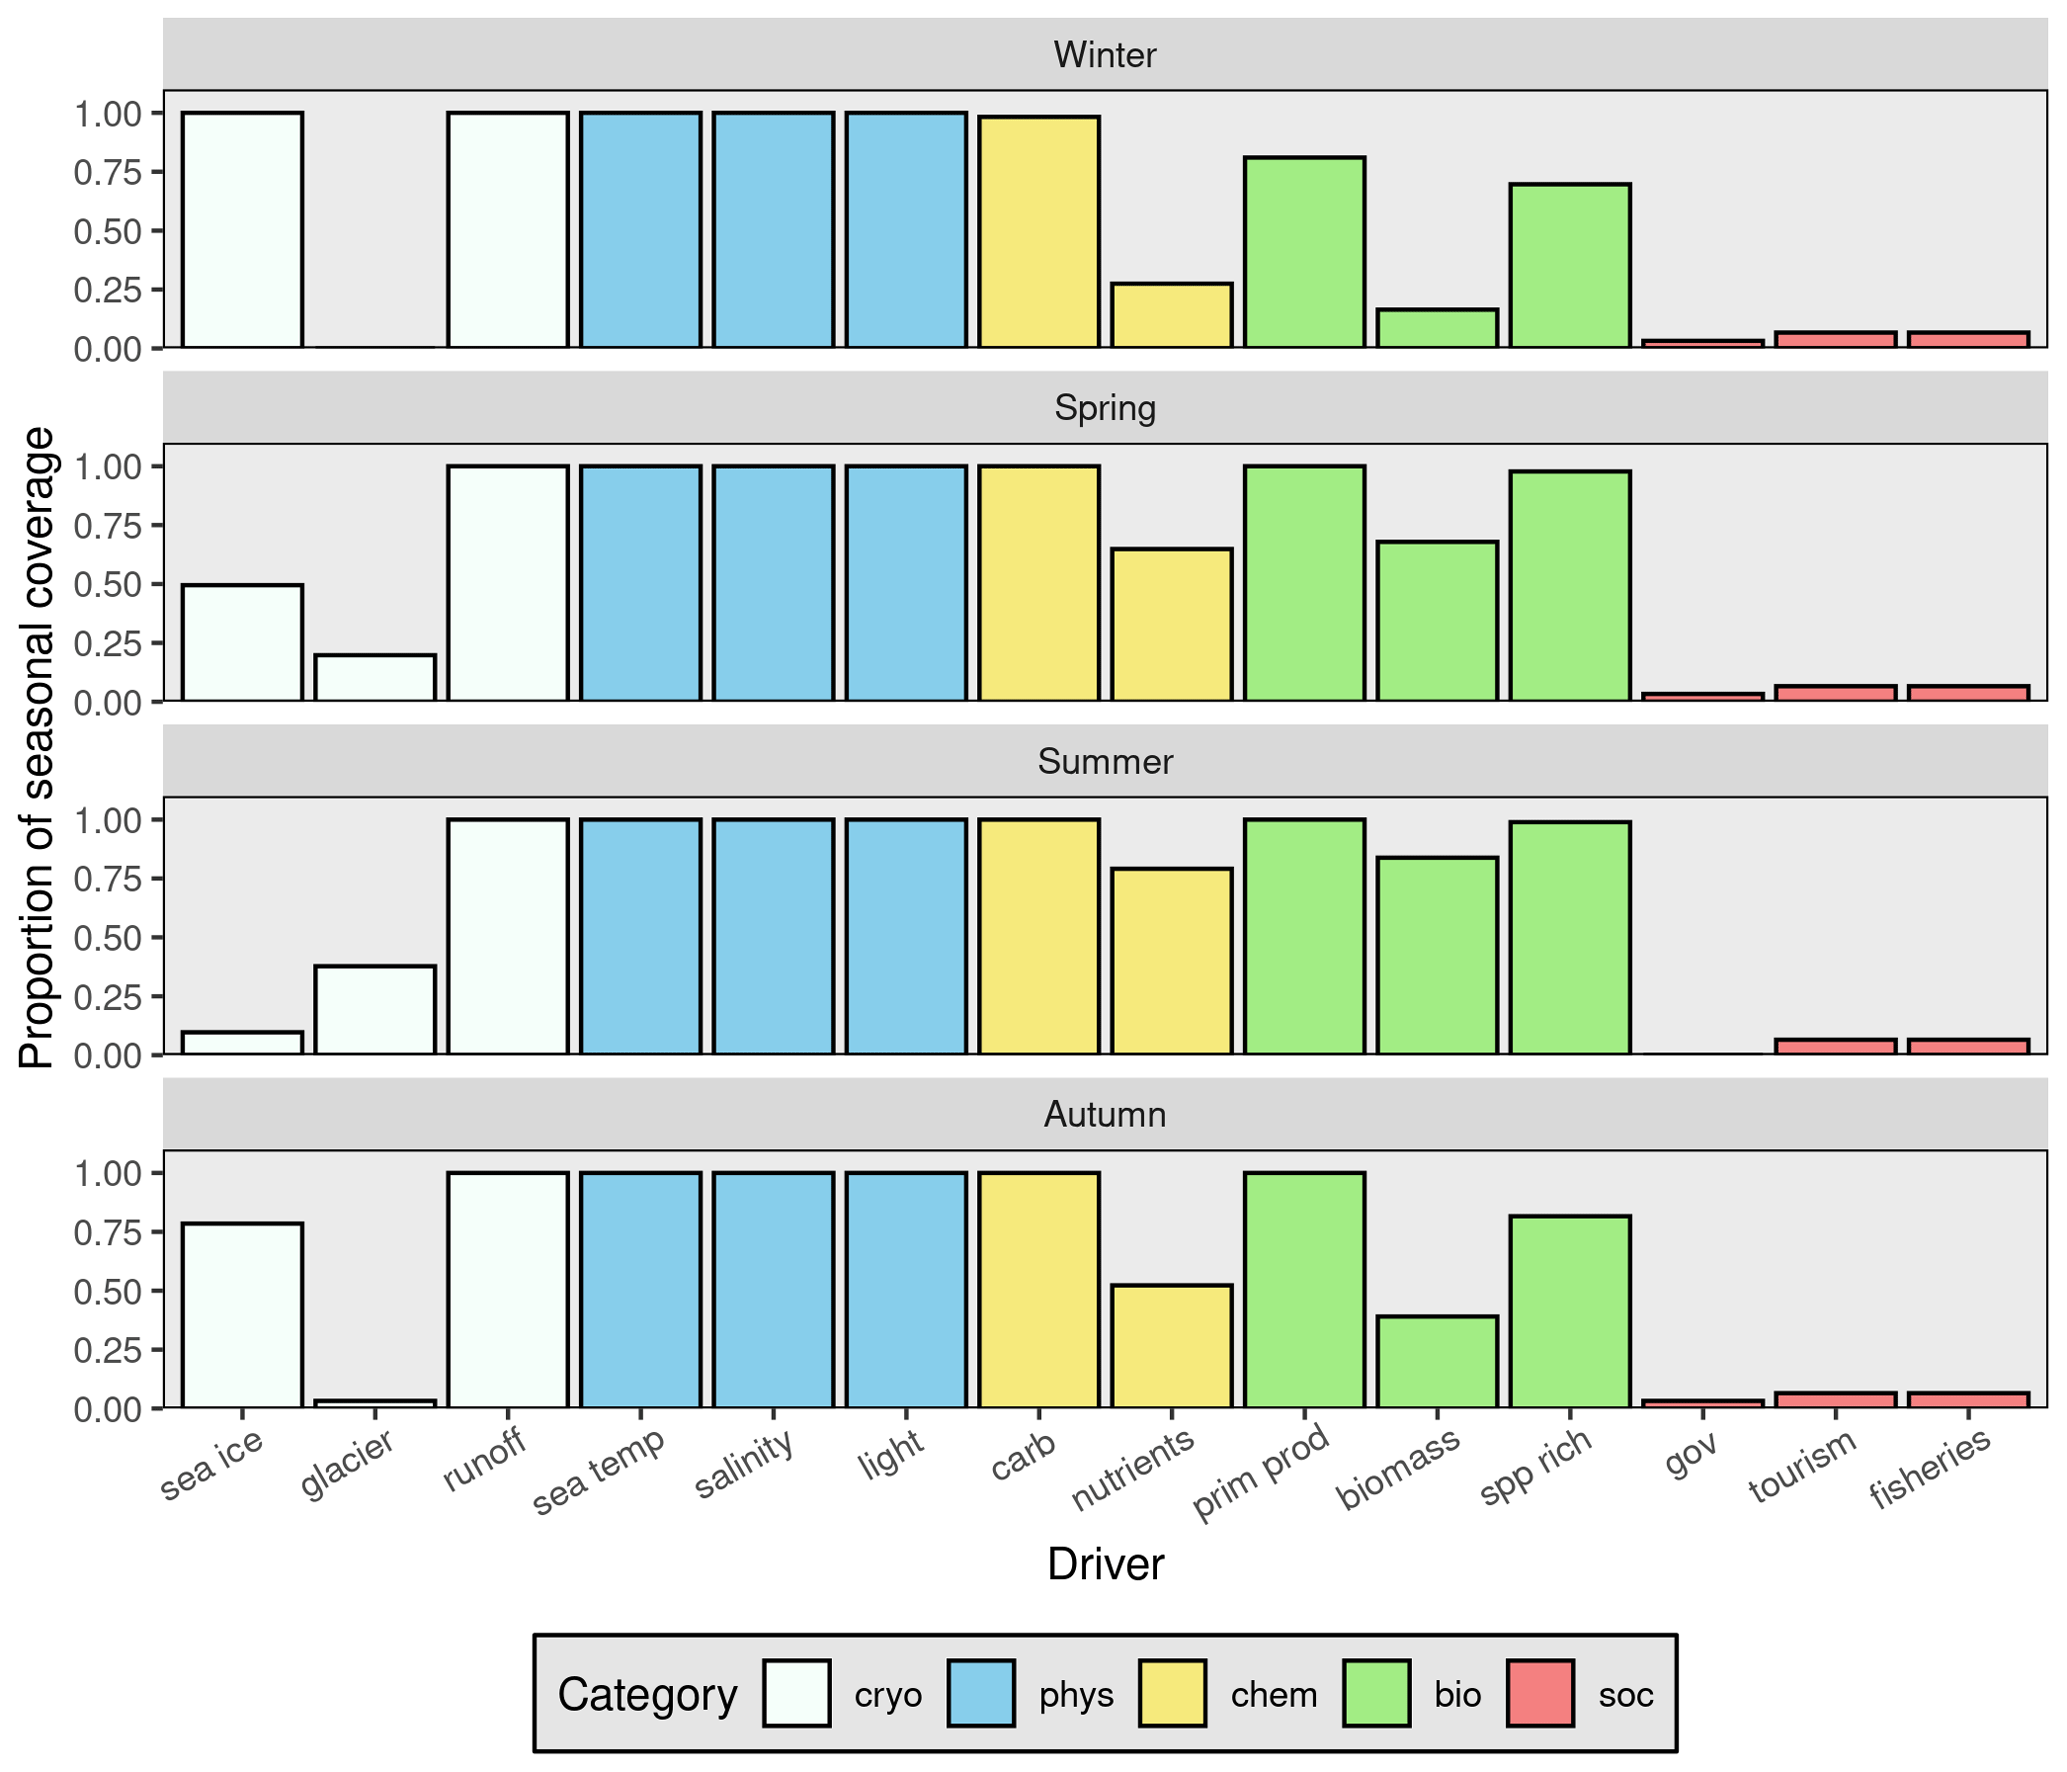
Figure 3Summary of available data for the drivers identified for this project. Each panel shows the coverage per driver for the given season, with winter being comprised of January, February, and March. Seasonal coverage is calculated by the total number of unique days of the year within a season that have at least one datum present for the given driver. The colours of the bars indicate the category to which the drivers belong. The very low social-driver values indicate that these data are only available at a monthly or annual resolution and not daily like the other drivers.
Besides differences in seasonal coverage, some drivers have data available for a much longer period of time than others (Fig. 4). Seawater temperature and salinity are once again the most well sampled of the drivers, with data starting in 1876. Somewhat surprisingly though, nutrient data have been sampled since 1934. After that began the consistent measurement of carbonate chemistry, terrestrial runoff, and glacier mass balance data in 1957, 1957, and 1967 respectively (Fig. 4). The measurement of the rest of the drivers tends to begin in the 1990s to 2000s. We may also see that data for all of the drivers tend not to be present at all seven study sites at the same time (Fig. 4). The data available for the 14 drivers within each of the five categories are summarised in the following sub-sections, and any specific filtering or unit conversions made are detailed.
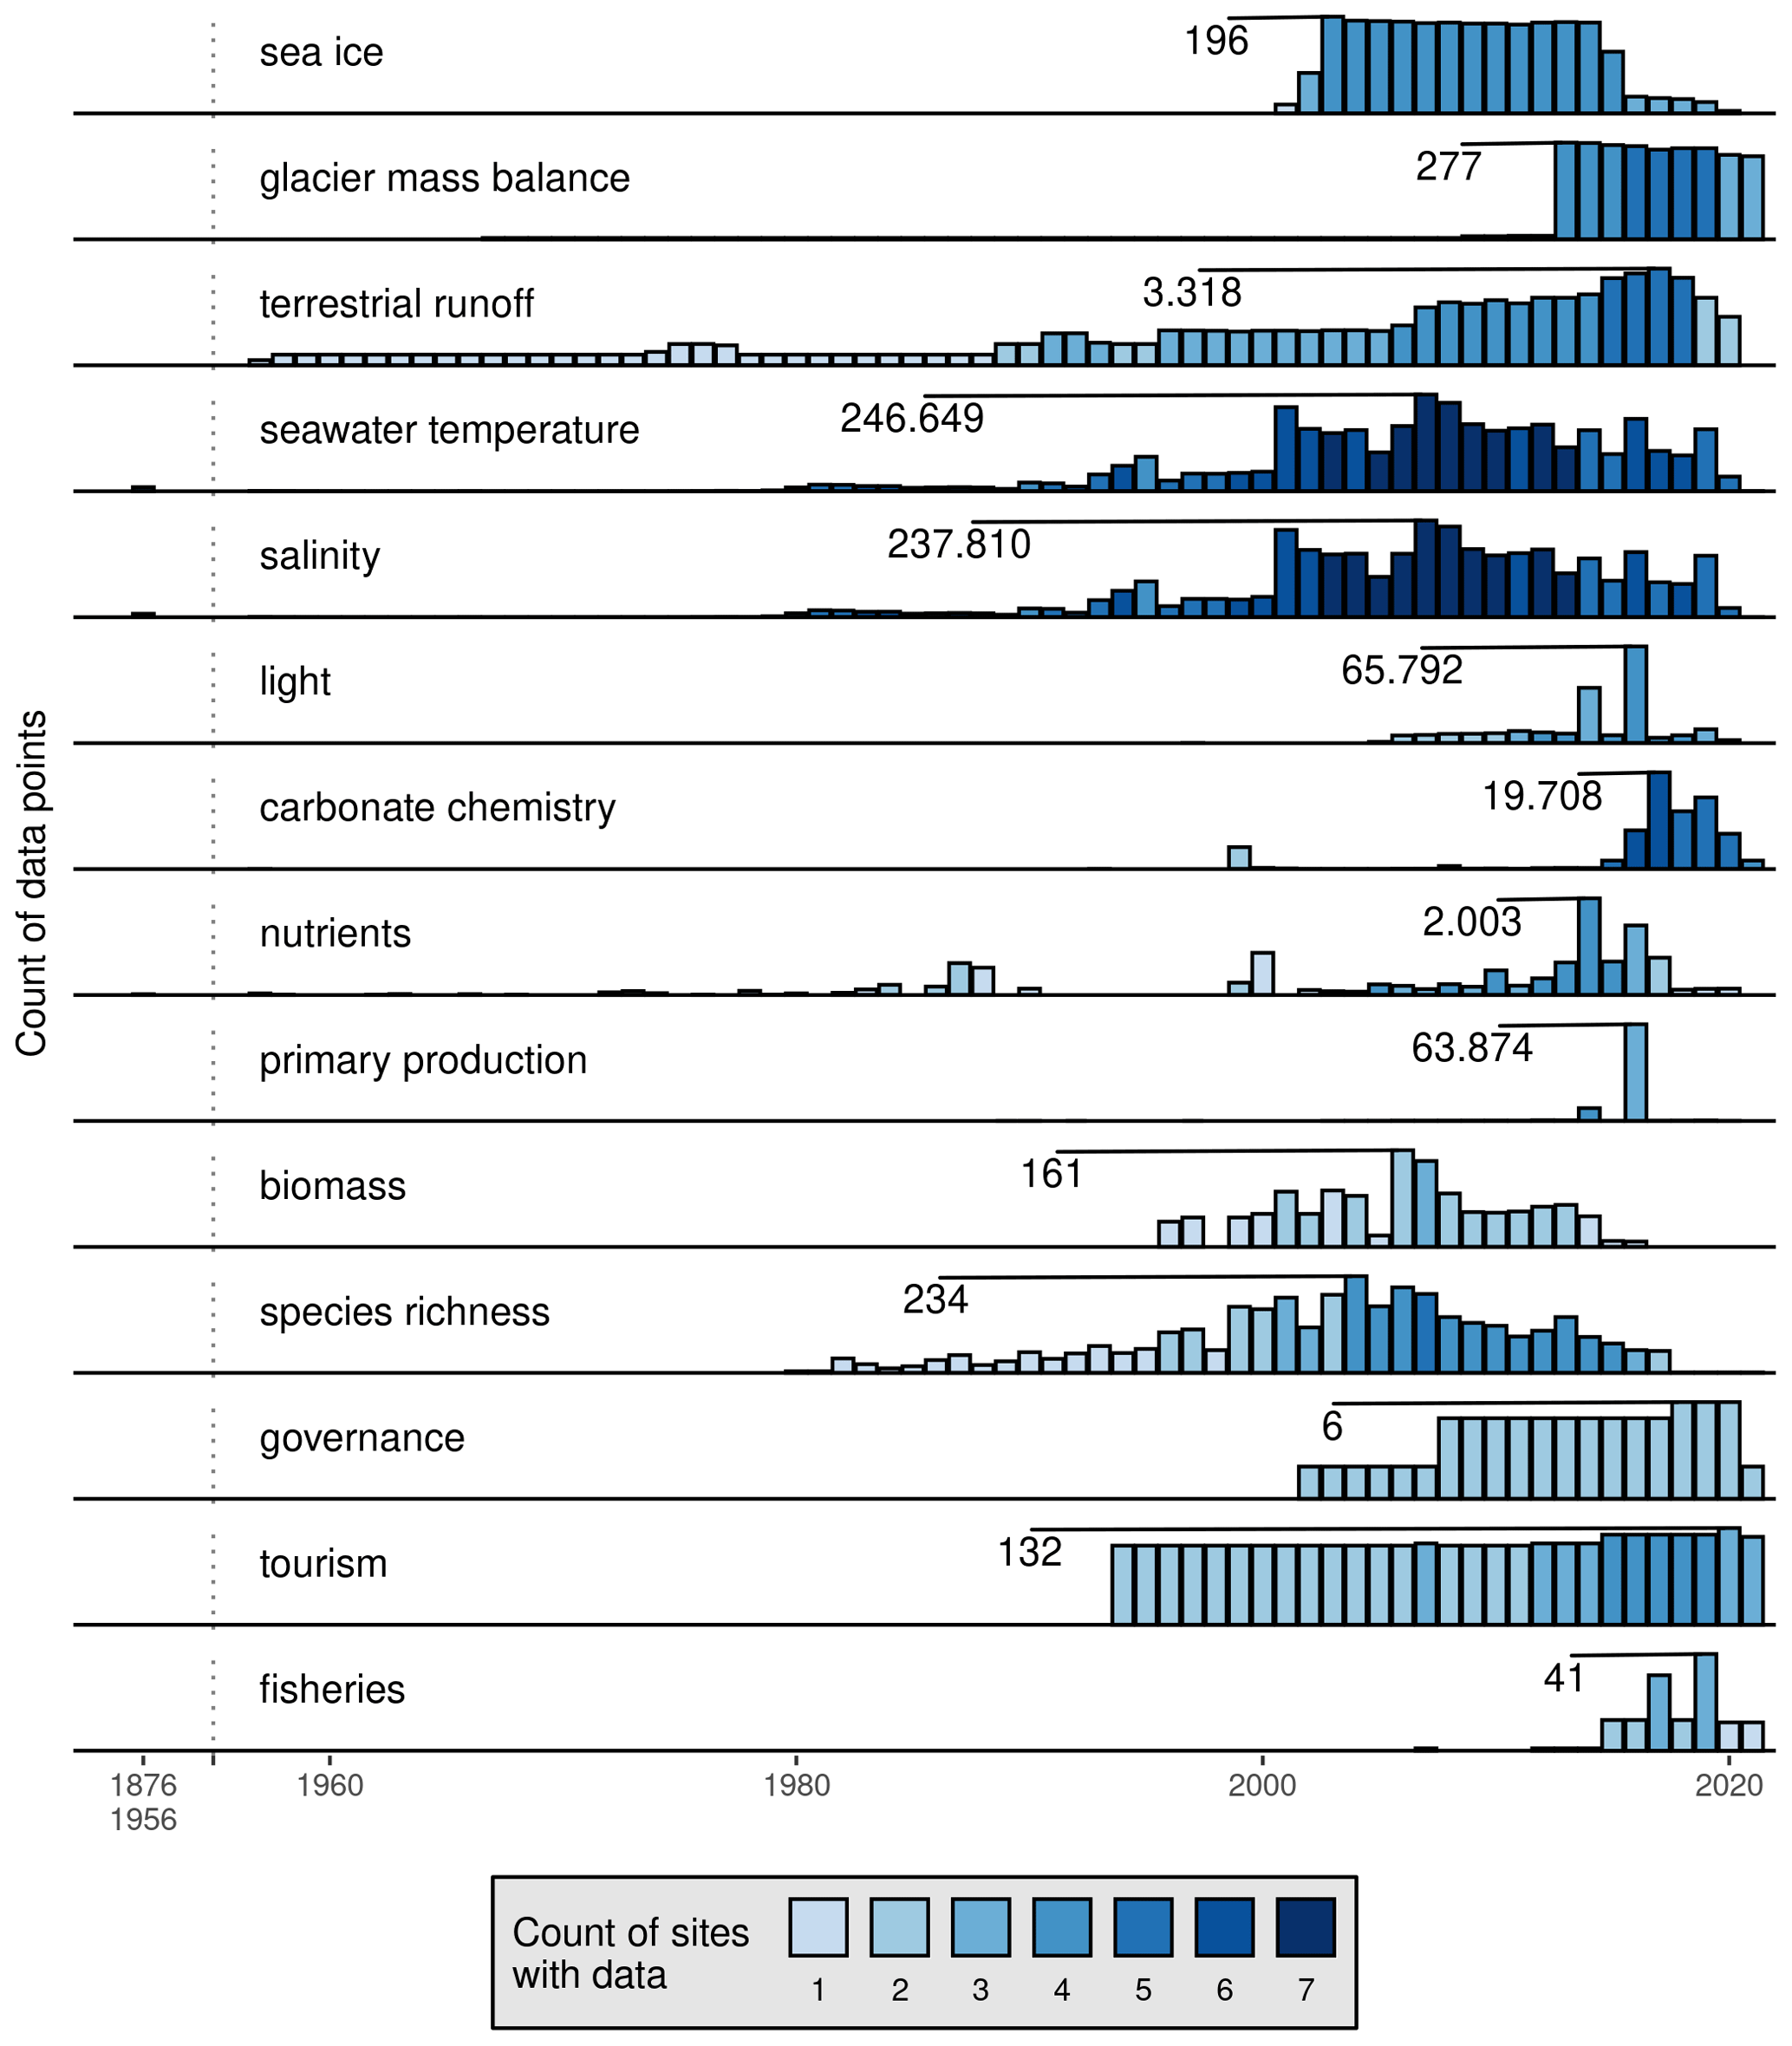
Figure 4The annual count of data for each driver across the seven study sites in this data product. The colour of the bars shows how many total sites have data present in a given year, with the height showing the total count of the data. Note that the y axes differ for each driver, with seawater temperature and salinity being much greater than the others. The year with the highest count of data for each driver is labelled. There is a break on the x axis at 1957, denoted by a vertical dotted line. Seawater temperature and salinity have data going back from 1956 to 1876, and the sum of all of these annual values are shown as bars to the left of the dotted line.
3.1 Cryosphere drivers
Cryosphere data are readily available throughout the Arctic, though usually not at a daily resolution. Measurements of winter ice cover are generally available for all but the western Greenland sites. The glaciers for Svalbard and eastern Greenland have annual measurements available in August–September for Svalbard and April–May for eastern Greenland. Conspicuously, there are no measurements of sea ice across sites using the same methods or units. Comparisons of in situ sea ice cover across the Arctic are thus not currently possible. The Global Runoff Data Centre (GRDC) provides a global database of river discharge values, though their data-sharing restrictions prevent us from aggregating the data here. Likewise, there are many discharge values available for Greenland via GEM. The terrestrial runoff data that were subset from the larger GRDC database were determined by spatially filtering the time series whose long–lat values fell within the bounding boxes of the study sites (Fig. 1). The number of datasets providing cryosphere data is relatively low compared to those for chemistry or physics data but higher than for biology and social drivers (Table 2).
Due to its broad importance for the understanding of change within Arctic fjord socio-ecological systems, sea ice cover is one of the two drivers in this data product for which remotely sensed data were included. Pixels were extracted from the MASIE 4 km resolution ice cover product (NSIDC, 2022) for the seven study sites (Fig. 1), and average daily sea ice cover values were created from 2006 to 2021. This created only one additional time series per site, thereby avoiding overrepresentation of remotely sensed data in this data product, which aims to be a collection of primarily in situ data. While a 1 km product is available, it only starts in 2014, which is too short to be useful for trend analysis. A comparison was made between the 4 and 1 km product for years of overlapping data in Kongsfjorden, and the values were found to be very similar. For this reason, it was decided that the lower-resolution, longer time series was preferable. While sea ice thickness rather than cover would be preferable for inclusion in this amalgamated dataset, at the time of this writing, the authors were not aware of any such product on an Arctic scale.
3.2 Physics drivers
Data measuring the physical properties of the EU Arctic are the most readily available (Fig. 2, Table 2). Seawater temperature measurements are available at a daily to monthly resolution for all sites, with the most frequent measurements being taken at Kongsfjorden and the least frequent measurements being taken at Young Sound, where there are no values during the winter months. Salinity data are often sampled alongside seawater temperature, and so their availability largely matches the former. Light data, while important, are much more difficult to come by. There are many daily values available at Kongsfjorden but only for 1 or 2 years. There have been a few years of summer light measurements in Young Sound, and the western Greenland sites have enough data to create a rough monthly climatology. No data have yet been sourced for northern Norway.
The importance of seawater temperature within Arctic fjords made it the second of the two drivers for which remotely sensed data were sourced. Data for the entire bounding box of the study area (Fig. 1) were subset from the daily NOAA OISST v2.1 0.25∘ resolution product (Huang et al., 2021). The pixels within the bounding boxes for the seven study sites were combined into a single daily time series from 1982 to 2021. However, while a resolution of 0.25∘ may be sufficient for ocean-scale studies, for many of the fjords in this data product, this resolution is too coarse. Therefore, seawater temperatures for each site were also sourced from v2.1 of the Climate Change Initiative (CCI) daily 5 km resolution product produced by the European Space Agency (Merchant et al., 2019). Time series were created for the period 1982–2020 by averaging the daily values over all pixels found within the bounding boxes for the sites (e.g. Fig. 1).
3.3 Chemistry drivers
The chemical composition of seawater is generally well sampled in the Arctic, with the study sites having data available for the carbonate system for all months of the year (Fig. 3). Daily carbonate system data are available for several years in Kongsfjorden and to a lesser extent in Nuup Kangerlua. Nutrient data availability is greatest during the ice-free months (Fig. 3), particularly in Kongsfjorden and Young Sound. While less frequent, the western Greenland sites also have data available for much of the year. Datasets providing chemistry data are the second most numerous after physical data (Table 2).
The filtering and grouping of variables for the chemistry drivers required more consideration than the previously described categories because each of these drivers contained variables that were notably different from one another. For example, while sea ice cover data might be in units of percentage (%) or square kilometres (km2), one can still filter through datasets for any reference or variable name containing “ice”. However, the carbonate system encompasses the partial pressure of CO2 (pCO2) in seawater, total alkalinity (TA or AT), dissolved inorganic carbon (DIC or CT), pH, and the saturation state of calcium carbonate. Likewise, nutrients contain nitrate (NO3), nitrite (NO2), ammonium (NH4), phosphate (PO4), and silicate (SiO4). All of the variables for these two drivers tend to come in a variety of units of measurement so it was necessary to choose a standard unit and convert data as necessary. For the carbonate system this was either in units of micromoles per kilogram (µmol kg−1) (TA, DIC), standard atmosphere (µatm) (pCO2), and total scale (pHT) when possible (unfortunately, many pH values have an unknown scale, which is noted in the units for the variable). For the nutrients, all values are in micromoles per litre (µmol L−1). While this does not match the established best practice of using micromoles per kilogram (µmol kg−1) for nutrient measurements (Jiang et al., 2022), one must have seawater temperature and salinity values to convert from litres to kilograms (Becker et al., 2020), and these data tend to be missing from datasets that report nutrients in units of litres, making a conversion impossible.
3.4 Biology drivers
Datasets providing data for biology drivers are not numerous (Table 2). Indeed, no FAIR datasets were identified for Storfjorden or Porsangerfjorden, with only primary production data in August available at Qeqertarsuup Tunua. Nuup Kangerlua is the only site with data available for all of the biology drivers for all months of the year, with Young Sound having all drivers during some ice-free months. Isfjorden has primary production data available over the full calendar year, with some daily datasets available. Note that Seabird data exist for much of Svalbard (e.g. https://data.npolar.no/dataset/0ea572cd-1e4c-47a3-b2a5-5d7cc75aaeb4, last access: 17 August 2023), but these were considered to be outside of the scope of the marine data collected for this dataset.
It is important to note that, while the rate of primary production is known to be a very important driver in Arctic fjords, data for the direct measurement of this driver are almost non-existent, with the exception of data from Young Sound (Holding et al., 2019). Otherwise, most primary production values come from personal communications (e.g. Hop et al., 2002) or from a couple of historic data points (e.g. Eilertsen et al., 1989). To address this shortcoming, the data collected for chlorophyll (Chl a [µg L−1]) were grouped with primary production. This is a potentially controversial choice, but it was made because it was necessary to make additional compromises for the other biology drivers, which left primary production as the best classification for Chl a data. One could argue that these data would be better placed in the biomass driver; however, data for this driver were also lacking in public availability. Because of this, the data classified here as biomass are species survey data when the units are reported in individuals per cubic metre (m−3) or cells per cubic metre (m−3). While not ideal, providing these data to the community still allows for researchers who know which species they are looking for to readily access them via this data product and to perform the biomass calculations for themselves. It is beyond the scope of the data amalgamation for this product to perform these calculations for the 751 species that have data available in this product. Lastly, that brings us to species richness. No publicly available data exist that report on this driver directly. To address this we removed the units (e.g. individuals per cubic metre) from every measure of a species and tabulated them per site, day, and depth to get the count of species, which then forms the basis of what could be an investigation into species richness. The presence of the individual species per site, day, and depth was also maintained so that researchers can access this information. Again it was determined to be outside of the scope of the data amalgamation for this project to perform analysis on these data, such as calculation of Shannon Wiener diversity indices. Future versions of this dataset will elaborate on the species richness driver by creating more meaningful groups by taxa or ecological function (e.g. algae, zooplankton).
3.5 Social drivers
Of all the categories of drivers identified in this study, datasets for social drivers were the most difficult to source. This is primarily due to the fact that there are no applicable social datasets on PANGAEA, which is by far the largest provider of data in this project (Table 2). Of the hundreds of datasets sourced, only 28 of them provide social data. A total of 3 provide monthly tourism values over the past several years for Kongsfjorden and/or Isfjorden (Table 2, Fig. 3), 1 provides ship Automatic Identification System (AIS) data in western Svalbard, 10 provide data for monthly governance statistics for Greenland, and another 8 provide data for Norway. Fisheries are a very well-quantified driver, with a very well-established body of statistical analyses for comparison with the natural world. Six such datasets were sourced via national statistics websites for Greenland, and three were sourced for Norway. There are 19 fishery datasets available via the IMR site (https://gbif.imr.no/ipt/, last access: 17 August 2023), three of which have been amalgamated.
More so than with the other categories of data, there is overlap in the variables for the drivers within this category. For example, boat traffic within the fjords is an important social consideration but must be classified either into the tourism or fishery drivers depending on the ship in question. The variable names are otherwise the same, which required that the reference in question be consulted in order to accurately rename them (i.e. vessels − tourism [n] vs. vessels − commercial [n]). The division and regrouping of these variables was by far the most time consuming of all of the categories due to how many small exceptions there were.
In order to illustrate the potential uses of this dataset, a comparison of the different drivers is outlined below. This is not an exhaustive comparison nor is it meant to be proscriptive in terms of the use of these data. That would depend on the question(s) being asked by a given researcher. It must also be noted that any values determined in a course analysis of these data do not necessarily reflect the changes that exist within the fjord. We have performed large aggregations of the data here in the interest of simplifying the analysis . Additionally, it would also not be useful to compare every driver in this dataset to each other. Rather it is necessary to follow a guiding principle for which drivers are compared and why. This is found in Fig. 2 of Schlegel et al. (2023), which shows the key relationships between drivers and the direction of their interactions, as determined from the literature. Because the aim of this dataset is to allow for investigations of the interactions between drivers within a given Arctic fjord socio-ecological system, we did not compare data across sites. In order to broadly quantify the comparisons that can be made for drivers within fjords, the data have been binned into a few consistent depth ranges and averaged into monthly means. Time series with only annual values were not used as these created skewed comparisons against other drivers for just the months of January or December accordingly. Finally, comparisons were only made when there were at least 3 months of overlapping data, and only data from 1982 to 2020 were used as this is the period available for the CCI SST product.
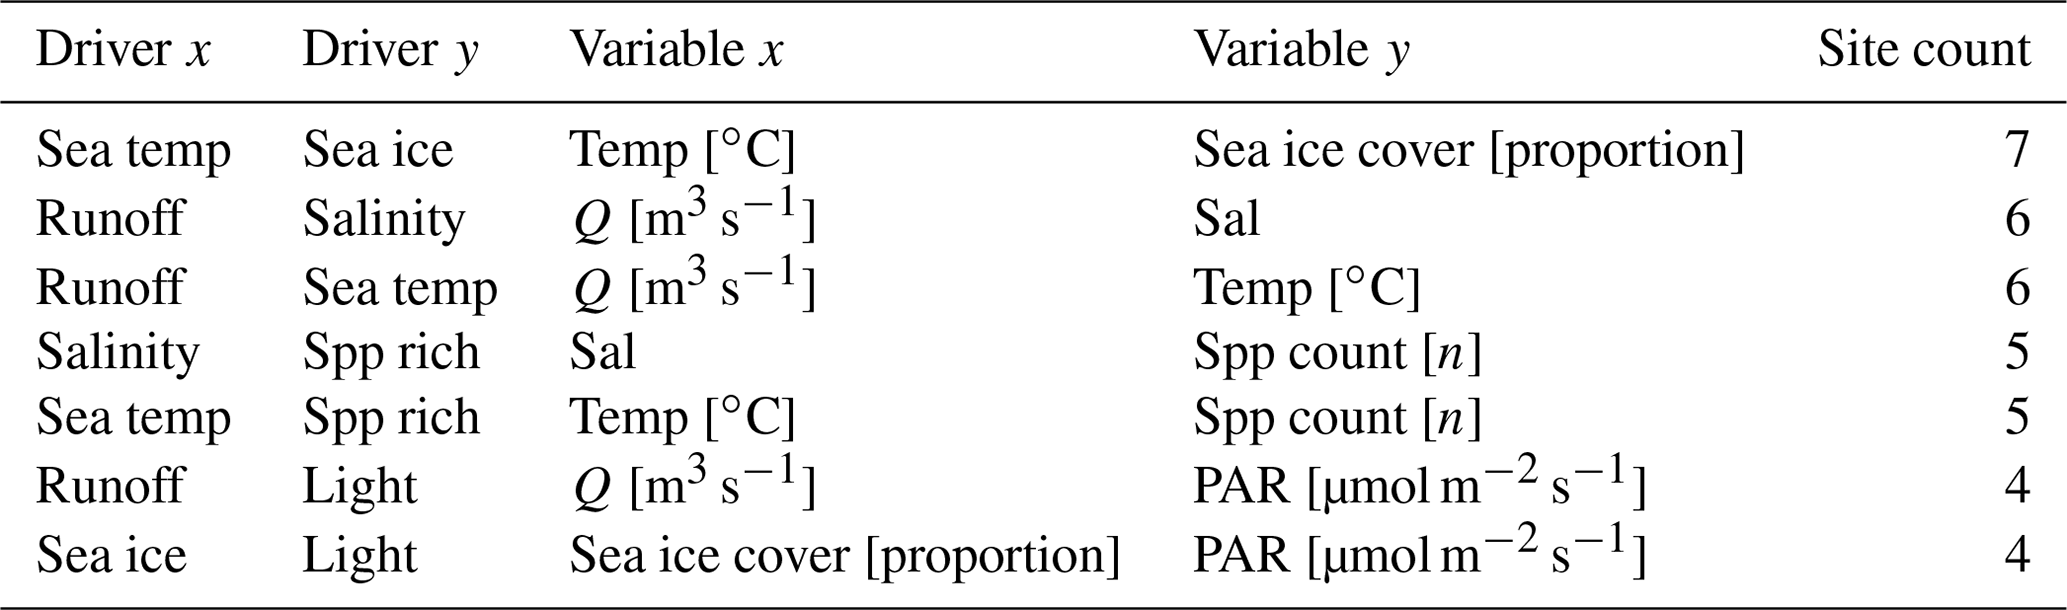
It must be noted that, even though the methodology used for data comparison is coarse, there are still many drivers with either no overlapping monthly values or only a couple of sites that have overlap. For many sites there are almost no drivers that overlap with anything other than seawater temperature (Table 3). Of the 217 relationships that exist between the variables within drivers, only 1 was able to be quantified across all of the seven sites contained within this dataset (Table 3, Fig. S1). A total of 18 comparisons could be made between just two different sites, 7 could be made between three sites, and 7 more comparisons could be made between four or more sites. For drivers comparable between at least four or more sites, the mean (median) number of overlapping months was 82 (54), with a minimum and maximum range of 6 to 360 months.
Table 3The drivers and variables with overlapping monthly data that could be compared within multiple sites. The independent drivers and variables are shown in the columns with an x, and the dependent drivers and variables are shown in the columns with a y. The site count column shows the number of sites within which the indicated comparison could be made. Note that, for seawater temperature and sea ice, this includes remotely sensed data. Note that Q [m3 s−1] is a measure of flow rates and is used here as a measurement of river runoff into a given fjord.
As detailed above, certain decisions were made about which variables to group into which categories and about drivers that may not be agreed on by all researchers. Regardless, due to the meta-data columns attached to each datum in this data product, it is possible to quickly isolate which data are of interest and extract them. For research projects making heavy use of data from a limited number of references for data within this product, it is advised that these sources be cited in addition to the citation of this larger data amalgamation. This advice is similar to that for the use of data within the SOCAT (Bakker et al., 2016) and GLODAP (Lauvset et al., 2022) datasets.
The live code base within which the sourcing, cleaning, and amalgamation of this dataset occurs may be found on GitHub at https://github.com/FACE-IT-project/WP1 (last access: 17 August 2023). Please note however that this is an ongoing process, and the code has already changed in anticipation of v2.0 of the dataset. That being said, the code used for the analyses, figures, and tables seen in this publication was published in its original state and is available at https://doi.org/10.5281/zenodo.8263692 (Schlegel, 2023).
A meta-database providing a high-level summary of the individually sourced datasets in this data product (i.e. not scraped from PANGAEA) is available here: https://face-it-project.github.io/WP1/metadatabase.html (last access: 17 August 2023). A user interface (UI) for the live version of the data product may be accessed on the same website by clicking the “Data access” tab. The full data product is published on PANGAEA at https://doi.org/10.1594/PANGAEA.953115 (Schlegel and Gattuso, 2022).
The data product described in this report was assembled in order to address the needs of researchers who are investigating the interactions between and changes to key drivers within Arctic fjord socio-ecological systems. This was accomplished by sourcing and amalgamating numeric data available for 14 different drivers categorised into either the cryosphere, physical oceanography, chemical oceanography, biology, or social science. These data began to be regularly sampled as far back as the 1950s (or even the 1900s) but were more consistently sampled from the 1990s onward. The distribution of the available data is not equal between categories or drivers, with the majority of available data coming from seawater temperature and salinity.
There are enough overlapping data, both within and across the seven study sites, to allow for a range of transdisciplinary analyses. It must be noted, however, that most of these analyses across sites are aided by the inclusion of remotely sensed seawater temperature and sea ice cover data. Without these, the out-of-the-box applicability of this amalgamated data product to Arctic research would be reduced. Within the individual sites, however, there are enough in situ collected data for many interesting analyses.
The in situ collected data for many of the drivers in this data product required additional filtering (e.g. terrestrial runoff) and in some cases the conversion of the units of measurement (e.g. carbonate system and nutrients). Most of the data classified into the biology drivers also required careful consideration as to how best present the raw data to the user while still maintaining a consistent project-wide standard for this dataset. This necessarily required the calculation of a species richness value, which was not present in any of the sourced datasets but will be further improved upon in later versions of this data product.
This data product represents the first version of a data collection effort that will be ongoing for the next 2 years. Central to this process is the expansion of efforts to collect biological and social datasets, which are currently underrepresented here. The quantification of interview data is also something that is being investigated and will be addressed in the future version of this dataset. The monitoring of the primary online databases that have contributed to this project is ongoing, and as datasets therein are updated, they will be amalgamated here. The future versions of this dataset will also be published on PANGAEA, with backward references to this first version, as is standard practice.
There are two important data sources referred to in this paper whose data cannot be shared directly in this product due to data access restrictions. Almost the entirety of the terrestrial runoff data are found in the GRDC (Global Runoff Data Centre; https://www.bafg.de/GRDC/EN/04_spcldtbss/41_ARDB/ardb_node.html, last access: 17 August 2023). Additionally, almost every source of coastal (non-social) data for Greenland is stored on the Greenland Ecosystem Monitoring database (GEM; https://data.g-e-m.dk/, last access: 17 August 2023). No full socio-ecological analysis of Arctic fjords can be conducted without data from these sources.
A table containing the list of categories, drivers, and the cleaned names for the individual variables within this dataset is available at https://github.com/FACE-IT-project/WP1/blob/main/data/analyses/table_A1.csv (last access: 17 August 2023).
The supplement related to this article is available online at: https://doi.org/10.5194/essd-15-3733-2023-supplement.
The paper was conceived by JPG, with the data collection and analyses implemented by RWS. Both authors contributed to the writing and editing of the paper, which was submitted by RWS.
The contact author has declared that neither of the authors has any competing interests.
Publisher's note: Copernicus Publications remains neutral with regard to jurisdictional claims in published maps and institutional affiliations.
This study is a contribution to the project FACE-IT (The Future of Arctic Coastal Ecosystems – Identifying Transitions in Fjord Systems and Adjacent Coastal Areas). We gratefully acknowledge the input of our FACE-IT colleagues for pointing to relevant data repositories. Special thanks are due to Morten Skogen for supplying the NORWECOM model data. Thanks are due to Jan Marcin Węsławski and an anonymous referee for their comments on an earlier version of this paper.
FACE-IT has received funding from the European Union's Horizon 2020 research and innovation programme under grant agreement no. 869154.
This paper was edited by Giuseppe M. R. Manzella and reviewed by Jan Marcin Węsławski and two anonymous referees.
Bakker, D. C. E., Pfeil, B., Landa, C. S., Metzl, N., O'Brien, K. M., Olsen, A., Smith, K., Cosca, C., Harasawa, S., Jones, S. D., Nakaoka, S., Nojiri, Y., Schuster, U., Steinhoff, T., Sweeney, C., Takahashi, T., Tilbrook, B., Wada, C., Wanninkhof, R., Alin, S. R., Balestrini, C. F., Barbero, L., Bates, N. R., Bianchi, A. A., Bonou, F., Boutin, J., Bozec, Y., Burger, E. F., Cai, W.-J., Castle, R. D., Chen, L., Chierici, M., Currie, K., Evans, W., Featherstone, C., Feely, R. A., Fransson, A., Goyet, C., Greenwood, N., Gregor, L., Hankin, S., Hardman-Mountford, N. J., Harlay, J., Hauck, J., Hoppema, M., Humphreys, M. P., Hunt, C. W., Huss, B., Ibánhez, J. S. P., Johannessen, T., Keeling, R., Kitidis, V., Körtzinger, A., Kozyr, A., Krasakopoulou, E., Kuwata, A., Landschützer, P., Lauvset, S. K., Lefèvre, N., Lo Monaco, C., Manke, A., Mathis, J. T., Merlivat, L., Millero, F. J., Monteiro, P. M. S., Munro, D. R., Murata, A., Newberger, T., Omar, A. M., Ono, T., Paterson, K., Pearce, D., Pierrot, D., Robbins, L. L., Saito, S., Salisbury, J., Schlitzer, R., Schneider, B., Schweitzer, R., Sieger, R., Skjelvan, I., Sullivan, K. F., Sutherland, S. C., Sutton, A. J., Tadokoro, K., Telszewski, M., Tuma, M., van Heuven, S. M. A. C., Vandemark, D., Ward, B., Watson, A. J., and Xu, S.: A multi-decade record of high-quality fCO2 data in version 3 of the Surface Ocean CO2 Atlas (SOCAT), Earth Syst. Sci. Data, 8, 383–413, https://doi.org/10.5194/essd-8-383-2016, 2016.
Bartsch, I., Paar, M., Fredriksen, S., Schwanitz, M., Daniel, C., Hop, H., and Wiencke, C.: PAR measurements at Hansneset, Kongsfjorden, above and below kelp canopies from 2012 to 2013, PANGAEA [data set], https://doi.org/10.1594/PANGAEA.945341, 2022.
Becker, S., Aoyama, M., Woodward, E. M. S., Bakker, K., Coverly, S., Mahaffey, C., and Tanhua, T.: GO-SHIP Repeat Hydrography Nutrient Manual: The Precise and Accurate Determination of Dissolved Inorganic Nutrients in Seawater, Using Continuous Flow Analysis Methods, Front. Mar. Sci., 7, 581790, https://doi.org/10.3389/fmars.2020.581790, 2020.
Bischof, K., Convey, P., Duarte, P., Gattuso, J.-P., Granberg, M., Hop, H., Hoppe, C., Jiménez, C., Lisitsyn, L., Martinez, B., Roleda, M. Y., Thor, P., Wiktor, J. M., and Gabrielsen, G. W.: Kongsfjorden as Harbinger of the Future Arctic: Knowns, Unknowns and Research Priorities, in: The Ecosystem of Kongsfjorden, Svalbard, edited by: Hop, H. and Wiencke, C., Springer International Publishing, 537–562, https://doi.org/10.1007/978-3-319-46425-1_14, 2019.
Bonnet-Lebrun, A.-S., Larsen, T., Thórarinsson, T. L., Kolbeinsson, Y., Frederiksen, M., Morley, T. I., Fox, D., Boutet, A., le Bouard, F., Deville, T., Hansen, E. S., Hansen, T., Roberts, P., and Ratcliffe, N.: Cold comfort: Arctic seabirds find refugia from climate change and potential competition in marginal ice zones and fjords, Ambio, 51, 345–354, https://doi.org/10.1007/s13280-021-01650-7, 2022.
Chamberlain, S., Woo, K., MacDonald, A., Zimmerman, N., and Simpson, G.: pangaear: pangaear: Client for the “Pangaea” Database, CRAN [code, v1.1.0], https://CRAN.R-project.org/package=pangaear (last access: 17 August 2023), 2021.
Descamps, S., Ramírez, F., Benjaminsen, S., Anker-Nilssen, T., Barrett, R. T., Burr, Z., Christensen-Dalsgaard, S., Erikstad, K.-E., Irons, D. B., Lorentsen, S.-H., Mallory, M. L., Robertson, G. J., Reiertsen, T. K., Strøm, H., Varpe, Ø., and Lavergne, S.: Diverging phenological responses of Arctic seabirds to an earlier spring, Glob. Change Biol., 25, 4081–4091, https://doi.org/10.1111/gcb.14780, 2019.
Eilertsen, H. C., Taasen, J. P., and WesIawski, J. M.: Phytoplankton studies in the fjords of West Spitzbergen: Physical environment and production in spring and summer, J. Plankton Res., 11, 1245–1260, https://doi.org/10.1093/plankt/11.6.1245, 1989.
Fischer, P., Brix, H., Baschek, B., Kraberg, A., Brand, M., Cisewski, B., Riethmüller, R., Breitbach, G., Möller, K. O., Gattuso, J.-P., Alliouane, S., van de Poll, W. H., and Witbaard, R.: Operating Cabled Underwater Observatories in Rough Shelf-Sea Environments: A Technological Challenge, Front. Mar. Sci., 7, 551, https://doi.org/10.3389/fmars.2020.00551, 2020.
Holding, J. M., Markager, S., Juul-Pedersen, T., Paulsen, M. L., Møller, E. F., Meire, L., and Sejr, M. K.: Seasonal and spatial patterns of primary production in a high-latitude fjord affected by Greenland Ice Sheet run-off, Biogeosciences, 16, 3777–3792, https://doi.org/10.5194/bg-16-3777-2019, 2019.
Hop, H., Pearson, T., Hegseth, E. N., Kovacs, K. M., Wiencke, C., Kwasniewski, S., Eiane, K., Mehlum, F., Gulliksen, B., Wlodarska-Kowalczuk, M., Lydersen, C., Weslawski, J. M., Cochrane, S., Gabrielsen, G. W., Leakey, R. J. G., Lønne, O. J., Zajaczkowski, M., Falk-Petersen, S., Kendall, M., and Gerland, S.: The marine ecosystem of Kongsfjorden, Svalbard, Polar Res., 21, 167–208, https://doi.org/10.3402/polar.v21i1.6480, 2002.
Hop, H. and Wiencke, C. (Eds.): The Ecosystem of Kongsfjorden, Svalbard, in: The Ecosystem of Kongsfjorden, Svalbard, 1–20, Springer International Publishing, https://doi.org/10.1007/978-3-319-46425-1_1, 2019.
Huang, B., Liu, C., Freeman, E., Graham, G., Smith, T., and Zhang, H.-M.: Assessment and Intercomparison of NOAA Daily Optimum Interpolation Sea Surface Temperature (DOISST) Version 2.1, J. Climate, 34, 7421–7441, https://doi.org/10.1175/JCLI-D-21-0001.1, 2021.
Jiang, L.-Q., Pierrot, D., Wanninkhof, R., Feely, R. A., Tilbrook, B., Alin, S., Barbero, L., Byrne, R. H., Carter, B. R., Dickson, A. G., Gattuso, J.-P., Greeley, D., Hoppema, M., Humphreys, M. P., Karstensen, J., Lange, N., Lauvset, S. K., Lewis, E. R., Olsen, A., and Xue, L.: Best Practice Data Standards for Discrete Chemical Oceanographic Observations, Front. Mar. Sci., 8, 705638, https://doi.org/10.3389/fmars.2021.705638, 2022.
Lauvset, S. K., Lange, N., Tanhua, T., Bittig, H. C., Olsen, A., Kozyr, A., Alin, S., Álvarez, M., Azetsu-Scott, K., Barbero, L., Becker, S., Brown, P. J., Carter, B. R., da Cunha, L. C., Feely, R. A., Hoppema, M., Humphreys, M. P., Ishii, M., Jeansson, E., Jiang, L.-Q., Jones, S. D., Lo Monaco, C., Murata, A., Müller, J. D., Pérez, F. F., Pfeil, B., Schirnick, C., Steinfeldt, R., Suzuki, T., Tilbrook, B., Ulfsbo, A., Velo, A., Woosley, R. J., and Key, R. M.: GLODAPv2.2022: the latest version of the global interior ocean biogeochemical data product, Earth Syst. Sci. Data, 14, 5543–5572, https://doi.org/10.5194/essd-14-5543-2022, 2022.
Merchant, C. J., Embury, O., Bulgin, C. E., Block, T., Corlett, G. K., Fiedler, E., Good, S. A., Mittaz, J., Rayner, N. A., Berry, D., Eastwood, S., Taylor, M., Tsushima, Y., Waterfall, A., Wilson, R., and Donlon, C.: Satellite-based time-series of sea-surface temperature since 1981 for climate applications, Sci. Data, 6, 1, https://doi.org/10.1038/s41597-019-0236-x, 2019.
Möller, V., van Diemen, R., Matthews, J., Méndez, C., Semenov, S., Fuglestvedt, J., and Reisinger, A.: Annex II: Glossary, in: Climate Change 2022: Impacts, Adaptation and Vulnerability. Contribution of Working Group II to the Sixth Assessment Report of the Intergovernmental Panel on Climate Change, edited by: Pörtner, H.-O., Roberts, D. C., Tignor, M., Poloczanska, E. S., Mintenbeck, K., Alegría, A., Craig, M., Langsdorf, S., Löschke, S., Möller, V., Okem, A., and Rama, B., Cambridge University Press, 2897–2930, https://doi.org/10.1017/9781009325844.029, 2022.
NSIDC: U.S. National Ice Center and National Snow and Ice Data Center, compiled by: Fetterer, F., Savoie, M., Helfrich, S., and Clemente-Colón, P., 2010, updated daily, Multisensor Analyzed Sea Ice Extent—Northern Hemisphere (MASIE-NH), Version 1. 4km resolution, NSIDC: National Snow and Ice Data Center [data set], https://doi.org/10.7265/N5GT5K3K, 2022.
R Core Team: R: A Language and Environment for Statistical Computing, R Foundation for Statistical Computing [code, v4.3.1], https://www.R-project.org/ (last access: 17 August 2023), 2023.
Schlegel, R.: Code used for the analysis of a dataset for investigating socio-ecological changes in Arctic fjords, Zenodo [code v1.0], https://doi.org/10.5281/zenodo.8263692, 2023.
Schlegel, R. and Gattuso, J.-P.: A Dataset for Investigating Socio-ecological Changes in Arctic Fjords, PANGAEA [data set], https://doi.org/10.1594/PANGAEA.953115, 2022.
Schlegel, R., Bartsch, I., Bischof, K., Bjørst, L. R., Dannevig, H., Diehl, N., Duarte, P., Hovelsrud, G. K., Juul-Pedersen, T., Lebrun, A., Merillet, L., Miller, C., Ren, C., Sejr, M., Søreide, J. E., Vonnahme, T. R., and Gattuso, J.-P.: Drivers of change in Arctic fjord socio-ecological systems: Examples from the European Arctic, Cambridge Prisms, Coastal Futures, 1, e13, https://doi.org/10.1017/cft.2023.1, 2023.
Skogseth, R., Ellingsen, P., Berge, J., Cottier, F., Falk-Petersen, S., Ivanov, B., Nilsen, F., Søreide, J., and Vader, A.: UNIS hydrographic database, Norwegian Polar Institute [data set], https://doi.org/10.21334/unis-hydrography, 2019.
Węsławski, J. M., Kendall, M. A., Włodarska-Kowalczuk, M., Iken, K., Kędra, M., Legezynska, J., and Sejr, M. K.: Climate change effects on Arctic fjord and coastal macrobenthic diversity – Observations and predictions, Mar. Biodivers., 41, 71–85, https://doi.org/10.1007/s12526-010-0073-9, 2011.
Wickham, H: Tidy Data, J. Stat. Softw., 59, 1–23, https://doi.org/10.18637/jss.v059.i10, 2014.