the Creative Commons Attribution 4.0 License.
the Creative Commons Attribution 4.0 License.
 | 27 Jul 2023
Three years of soil moisture observations by a dense cosmic-ray neutron sensing cluster at an agricultural research site in north-east Germany
Maik Heistermann
Till Francke
Lena Scheiffele
Katya Dimitrova Petrova
Christian Budach
Martin Schrön
Benjamin Trost
Daniel Rasche
Andreas Güntner
Veronika Döpper
Michael Förster
Markus Köhli
Lisa Angermann
Nikolaos Antonoglou
Manuela Zude-Sasse
Sascha E. Oswald
Cosmic-ray neutron sensing (CRNS) allows for the estimation of root-zone soil water content (SWC) at the scale of several hectares. In this paper, we present the data recorded by a dense CRNS network operated from 2019 to 2022 at an agricultural research site in Marquardt, Germany – the first multi-year CRNS cluster. Consisting, at its core, of eight permanently installed CRNS sensors, the cluster was supplemented by a wealth of complementary measurements: data from seven additional temporary CRNS sensors, partly co-located with the permanent ones; 27 SWC profiles (mostly permanent); two groundwater observation wells; meteorological records; and Global Navigation Satellite System reflectometry (GNSS-R). Complementary to these continuous measurements, numerous campaign-based activities provided data by mobile CRNS roving, hyperspectral imagery via UASs, intensive manual sampling of soil properties (SWC, bulk density, organic matter, texture, soil hydraulic properties), and observations of biomass and snow (cover, depth, and density). The unique temporal coverage of 3 years entails a broad spectrum of hydro-meteorological conditions, including exceptional drought periods and extreme rainfall but also episodes of snow coverage, as well as a dedicated irrigation experiment. Apart from serving to advance CRNS-related retrieval methods, this data set is expected to be useful for various disciplines, for example, soil and groundwater hydrology, agriculture, or remote sensing. Hence, we show exemplary features of the data set in order to highlight the potential for such subsequent studies. The data are available at doi.org/10.23728/b2share.551095325d74431881185fba1eb09c95 (Heistermann et al., 2022b).
- Article
(6723 KB) - Full-text XML
- BibTeX
- EndNote


1.1 Towards closing the scale gap in soil moisture observation
A large body of literature highlights the significance of soil moisture as a key state variable of the earth system. Yet, soil moisture appears to elude our attempts to obtain representative observations: point-based measurements lack both representativeness and coverage (Blöschl and Grayson, 2000), while remote sensing struggles with issues such as small penetration depth and low overpass frequencies (Peng et al., 2021). Since Zreda et al. (2008), cosmic-ray neutron sensing (CRNS) has emerged as a promising option to address these issues and hence to close the scale gap between point measurements and large-scale soil moisture retrievals. The advantage of the CRNS sensor is its considerable horizontal (100–200 m) and vertical (20–50 cm) footprint (Schrön et al., 2017). It is hence considered to efficiently average across small-scale heterogeneity, allowing users to obtain continuous estimates of “root-zone” soil moisture at the scale of several hectares (see, for example, Zreda et al., 2008; Desilets et al., 2010; Köhli et al., 2020, for further details). To that end, soil moisture is estimated from the epithermal neutron intensity by means of a conversion function. This typically involves the calibration of one parameter, N0, on the basis of a sufficient number of soil moisture measurements in the sensor footprint (Schrön et al., 2017; Köhli et al., 2020).
Furthermore, different application scenarios of the CRNS technology have been developed in order to obtain spatial soil moisture estimates beyond the isolated footprint of a single, stationary CRNS sensor. The application of CRNS roving, for instance, involves a mobile neutron detector that is moved within a study area (Desilets et al., 2010; Schrön et al., 2018). That way, the spatial distribution of soil moisture along the roving transect can be inferred in terms of a snapshot in time, given that potential sources of bias (e.g. from road material or biomass effects) are sufficiently addressed (Fersch et al., 2018; Schrön et al., 2021).
As an alternative, dense clusters of stationary CRNS sensors were proposed as an option to retrieve the spatial and temporal distribution of soil moisture. While also employing a number of detectors, they differ from CRNS networks (e.g. COSMOS, COSMOS UK, and COSMOS Europe; see Zreda et al., 2012; Evans et al., 2016; Bogena et al., 2022) by having adjacent or even overlapping footprints. So far, data from two campaigns have been published which implemented dense clusters for a period of 2 months: the first, in the early summer of 2019, took place in a pre-alpine, mainly pastoral headwater catchment in southern Germany, where 24 CRNS sensors were placed within an area of 1 km2 (Fersch et al., 2020; Heistermann et al., 2021). The second, in the autumn of 2020, took place in the Eifel mountains, western Germany, where 15 CRNS sensors were operated in the forested 0.4 km2 Wüstebach catchment for 3 months (Heistermann et al., 2022a).
1.2 Three years of dense CRNS observations: the Marquardt cluster
In August 2019, the research unit “Cosmic Sense”, funded by the German Research Foundation (DFG), launched a dense CRNS cluster at an agricultural research site in Marquardt (about 10 km north-west of Potsdam, Germany) – the first of its kind designed for long-term operation. This effort will be referred to as the “Marquardt cluster” (MqC). As of today, MqC is still operational, and its core consists of eight CRNS sensors operated in an area of around 10 ha. As in the CRNS clusters previously presented by Fersch et al. (2020) and Heistermann et al. (2022a), MqC was integrated in existing research infrastructure, here provided by the Leibniz Institute for Agricultural Engineering and Bioeconomy (ATB) and complemented by various observations, for example, conventional reference measurements of soil moisture (“ground truth”), mapping of soil and biomass, groundwater observations, and CRNS roving, as well as alternative soil moisture retrieval techniques based on UAS-based remote sensing and GNSS-R (Global Navigation Satellite System reflectometry). The underlying motivation of the dense CRNS cluster was, on the one hand, to obtain representative soil moisture estimates for an area beyond the footprint of a single CRNS sensor and, on the other hand, to obtain information about the spatial variability of soil moisture at a length scale that is smaller than the diameter of a single CRNS footprint.
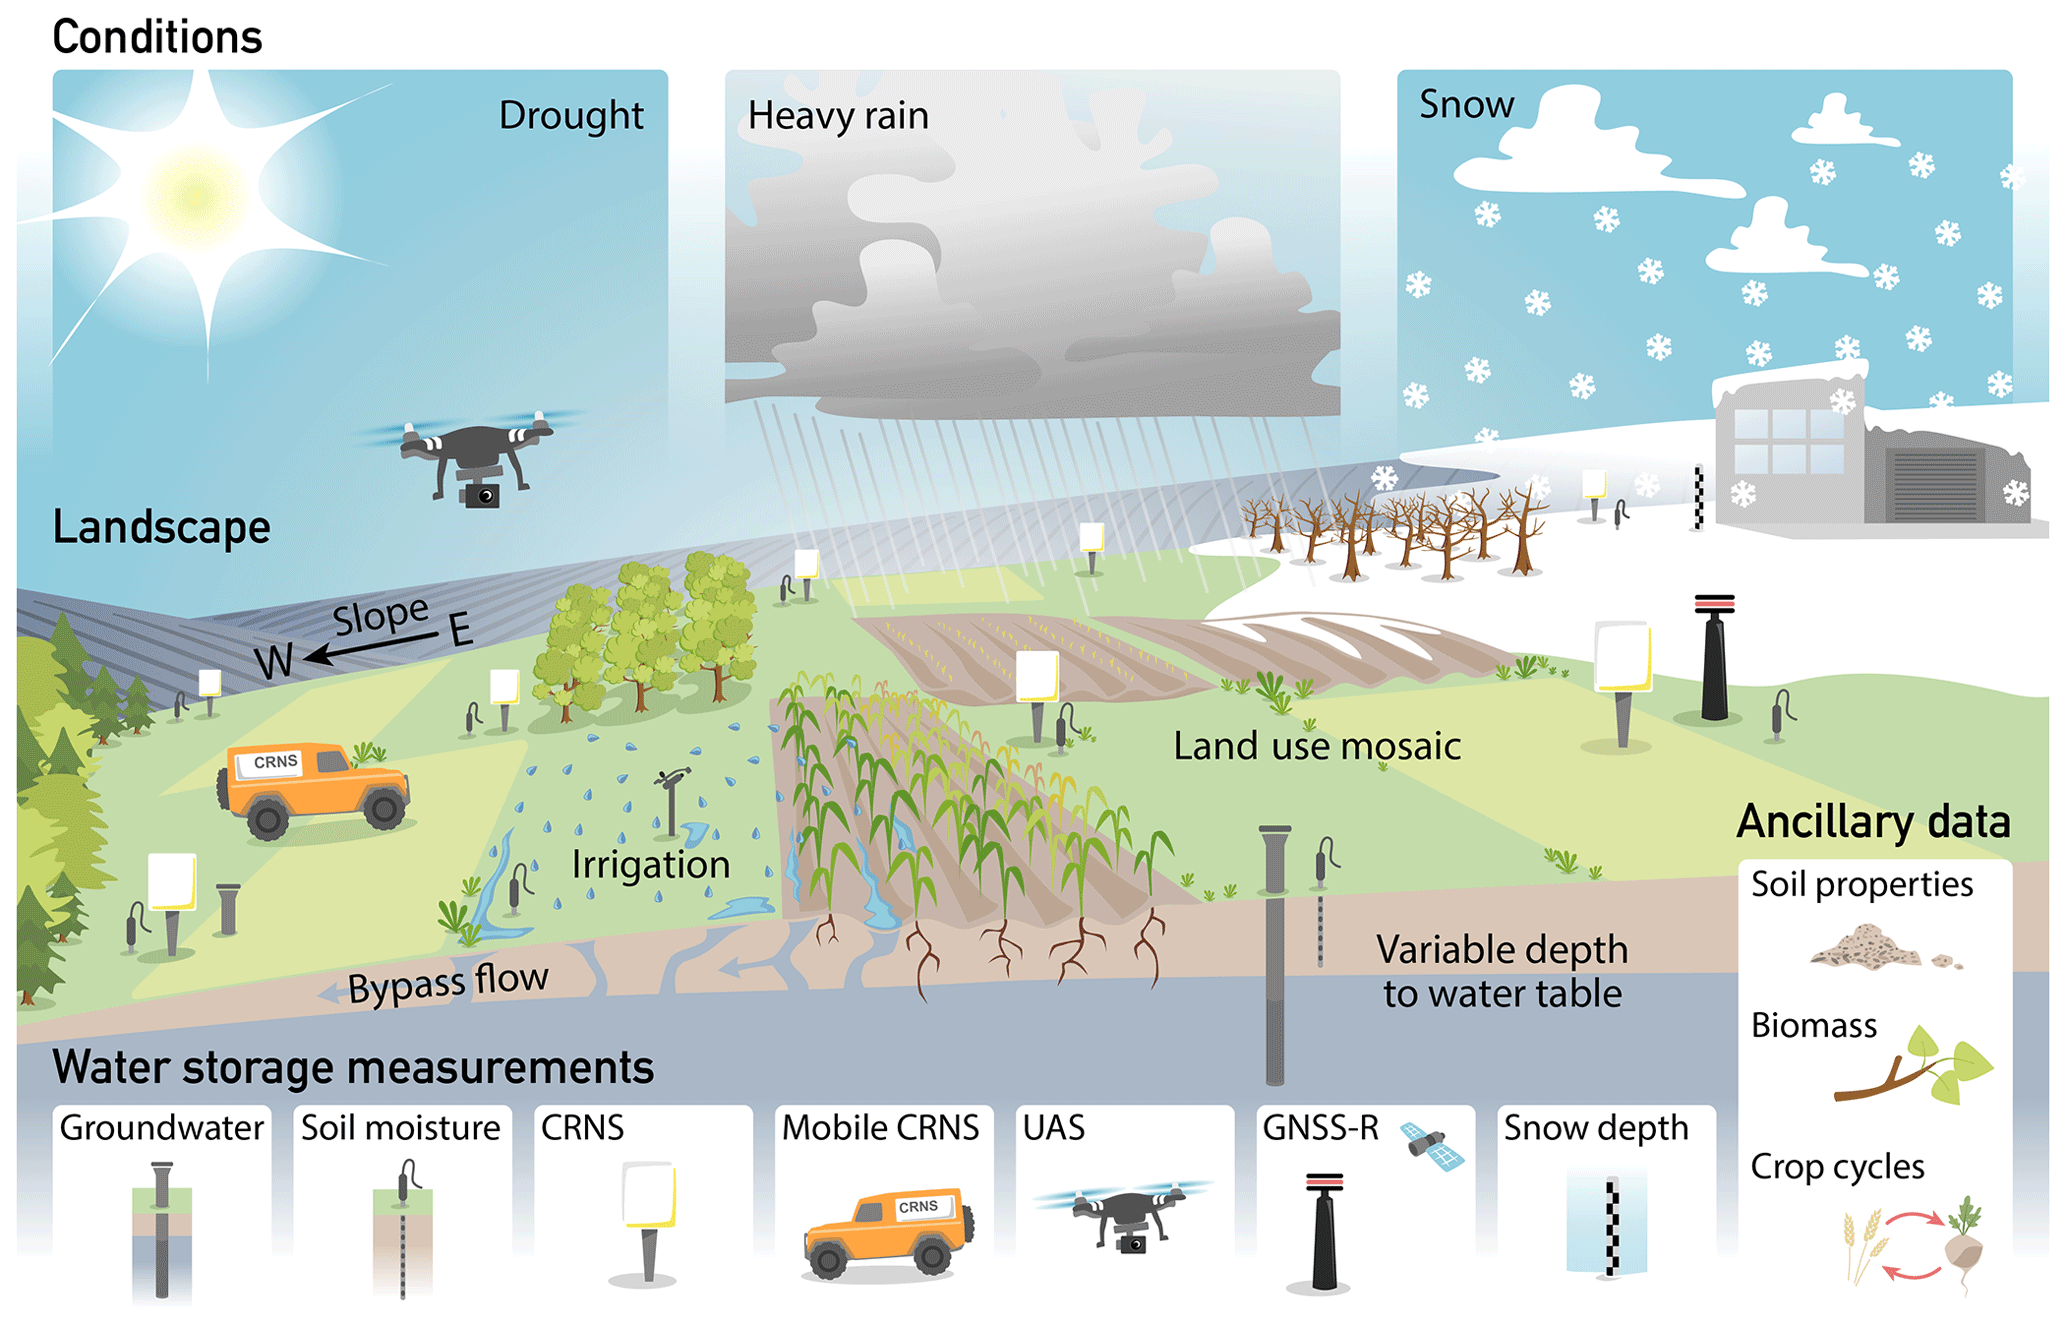
Figure 1Graphical overview of the Marquardt cluster, including a schematic view of the landscape, applied measurement techniques, and notable weather conditions over the study period.
Figure 1 provides a graphical overview of the MqC. There are various features which are specific to this endeavour and which make it unique in comparison to both previous CRNS clusters, hence allowing for new research opportunities:
-
With a density of eight CRNS sensors per 10 ha, MqC features a significant leap in density compared to previous clusters (3 and 2.4 sensors per 10 ha in Heistermann et al., 2022a, and Fersch et al., 2020, respectively) and hence a considerable overlap of footprints; this aims for an improved identification of heterogeneity at the sub-footprint scale.
-
The two aforementioned clusters span a few months each; the MqC is the first dense CRNS cluster operated over several years, spanning all seasons and providing observations across more diverse conditions and processes, including periods of drought and snow cover, as well as a set of heavy rainfall events at different durations.
-
The focus is on an agro-ecosystem with very diverse management types: the site comprises traditional field crops, meadows, biomass crops and orchards, irrigated as well as rainfed management, and adjacent forests.
-
A large number of vertical soil moisture profile probes not only allows for the study of the effect of the vertical soil moisture distribution on the CRNS signal but also, together with groundwater observations, facilitates investigation of the processes of infiltration and groundwater recharge.
-
The data set includes a dedicated irrigation experiment: a selected plot was intensively irrigated while being monitored with a cross-scale combination of sensors, including hyperspectral UAS-based remote sensing and CRNS roving.
-
On-site muon monitoring allows for the study of novel methods for the local correction of the incoming neutron flux.
-
MqC is a typical lowland site in the transition from maritime to continental climate, thus representing a landscape typical for large parts of northern central Europe.
1.3 Structure of this paper
This paper presents the MqC data acquired between August 2019 and November 2022. The study area is introduced in Sect. 2; the acquisition and, partly, the processing of different subsets of the data are documented in Sect. 3. Other relevant data from third parties are addressed in Sect. 4. In Sect. 5, we highlight selected features of the obtained data with regard to various event types (snow, drought, heavy rainfall, irrigation), while the conclusions in Sect. 7 outline research perspectives with regard to the published data set.
The study area in Marquardt is a lowland agricultural site in the north-east of Germany. Various practical features made it a suitable candidate location for MqC, for example, the vicinity to the participating institutions, the integration in an existing research context, and the security provided by a complete fencing of the perimeter. The diversity of agricultural land use and management types, together with its high-level documentation, was a desirable feature with regard to the investigation of a heterogeneous landscape.
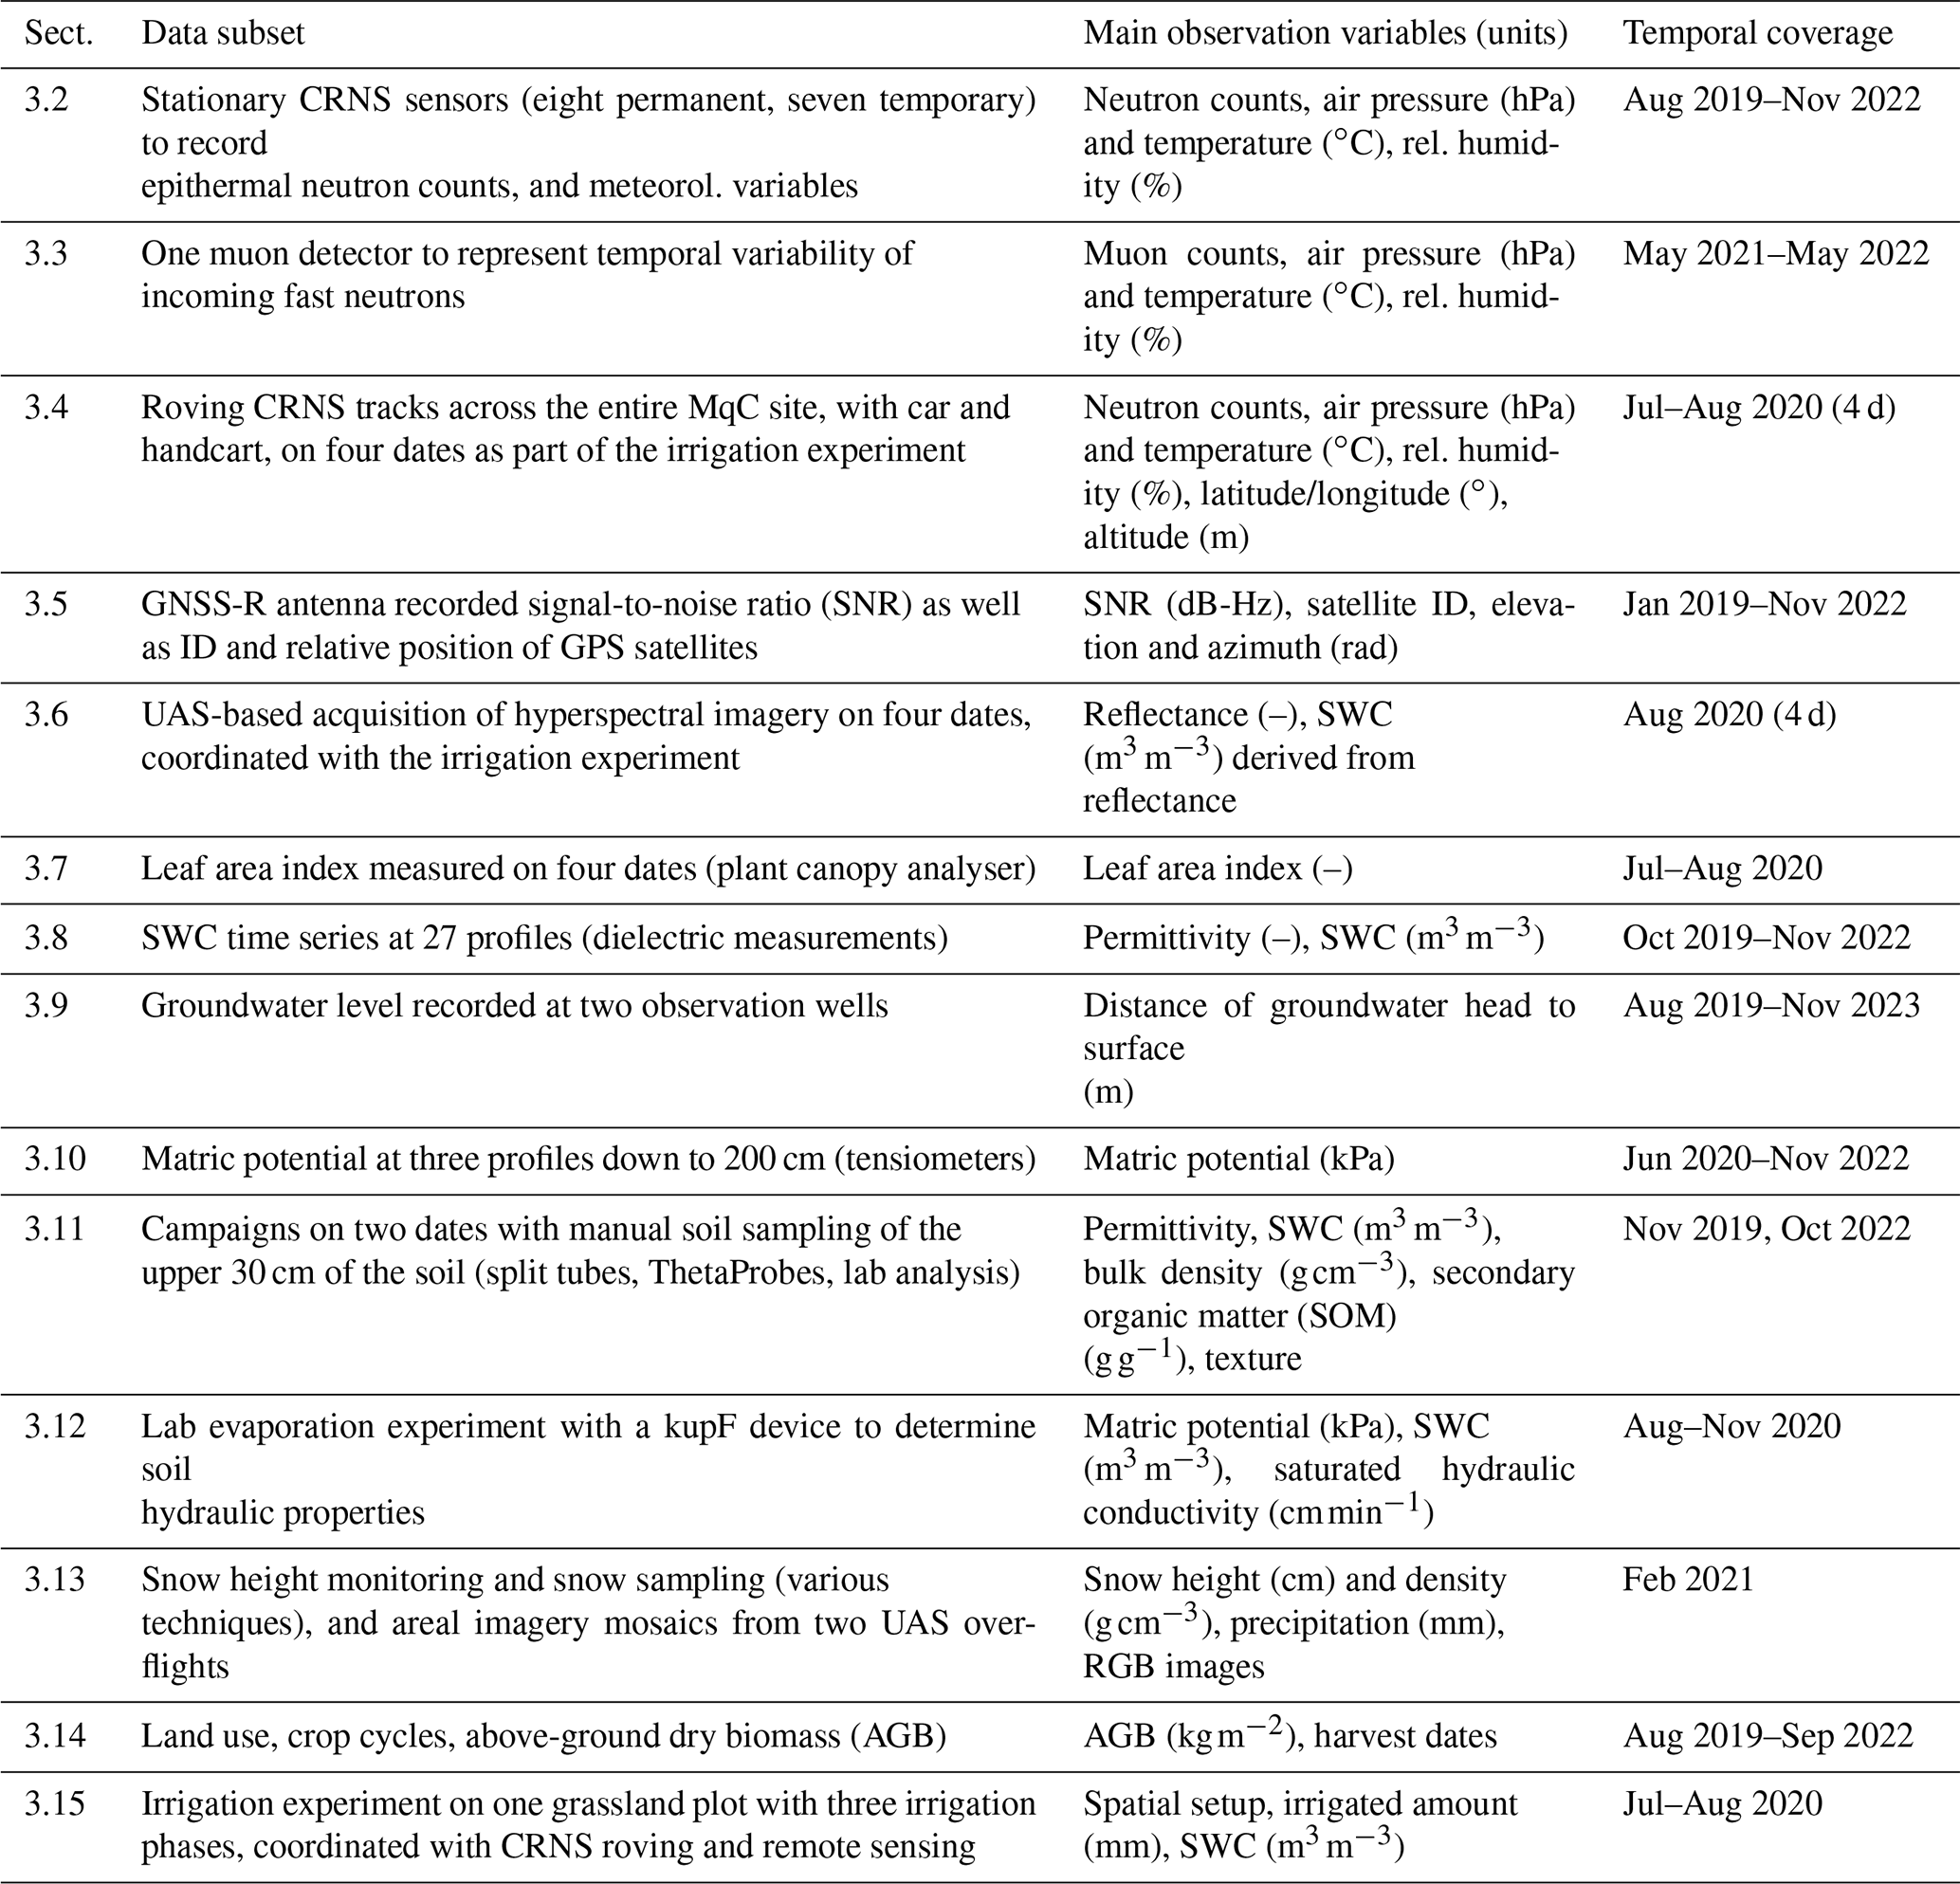
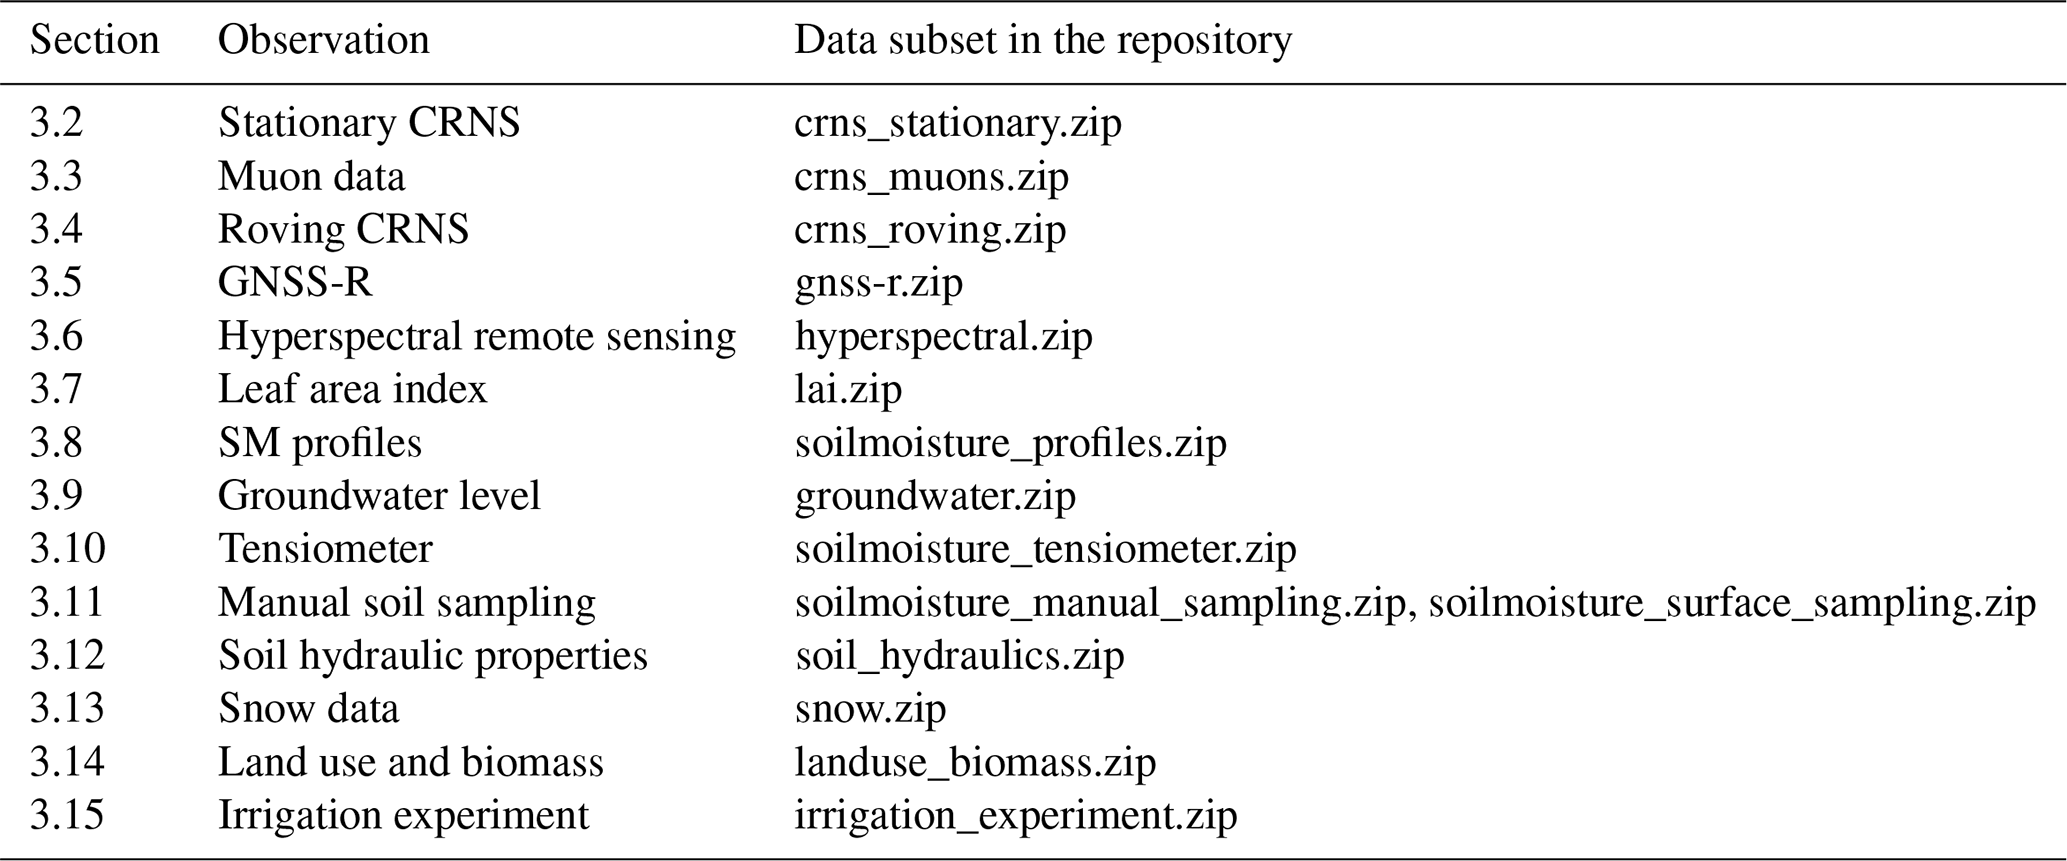
Table 1Overview of Sect. 3: brief summary of each data subset, main observed variables and units, and temporal coverage. Specific details can be found in the subsections and the json files which document each data subset in the repository (see also Table 4).
On-site meteorological monitoring has been available since 2009. The closest long-term climate station is located in Potsdam (at 12 km distance), operated by the German national meteorological service (Deutscher Wetterdienst, denoted DWD hereafter). At this DWD station, the average annual precipitation is 584 mm (1981–2010), and the average annual temperature is 9.3 ∘C (Cfb according to Köppen's climate classification). The Marquardt site is located at about 40 It sits on a gentle hillslope sloping westwards, with distances to the unconfined groundwater table ranging from around 1.5 to 10 m. The soils are dominated by periglacial sand deposits over glacial till. The sand content ranges between 68 % and 91 %, silt content is 8 %–27 %, and clay content is 0.6 %–4.4 %. The soil organic matter content ranges between 0.4 % and 17.3 %.
The Marquardt site comprises approx. 20 field plots, which host annual and permanent crops. In the observation period of 2019–2022, the core area covered by the MqC was dominated by orchards (cherry, apple), field crops (cereals, alfalfa, sugar beets, maize), meadows, and a biomass plantation stocked with young poplars. Details are contained in the data repository.
3.1 Overview
This section documents the data acquired so far at the Marquardt site. The core of the data set consists of continuous time series of eight CRNS sensors (Sect. 3.2), together with a set of 27 vertical SWC profiles (Sect. 3.8). A comprehensive overview of the various data subsets is provided in Table 1.
Table 2Properties of CRNS sensors used in the MqC (including manufacturer, model, and detector technology), the availability of detector tubes for epithermal neutrons (moderated – “mod”) and thermal neutrons (“bare”), the operation period, and the ratio of the sensor's raw counts of epithermal neutrons to the counts of a calibrator sensor (consistent with Fersch et al., 2020; Heistermann et al., 2022a), referred to as sensitivity.
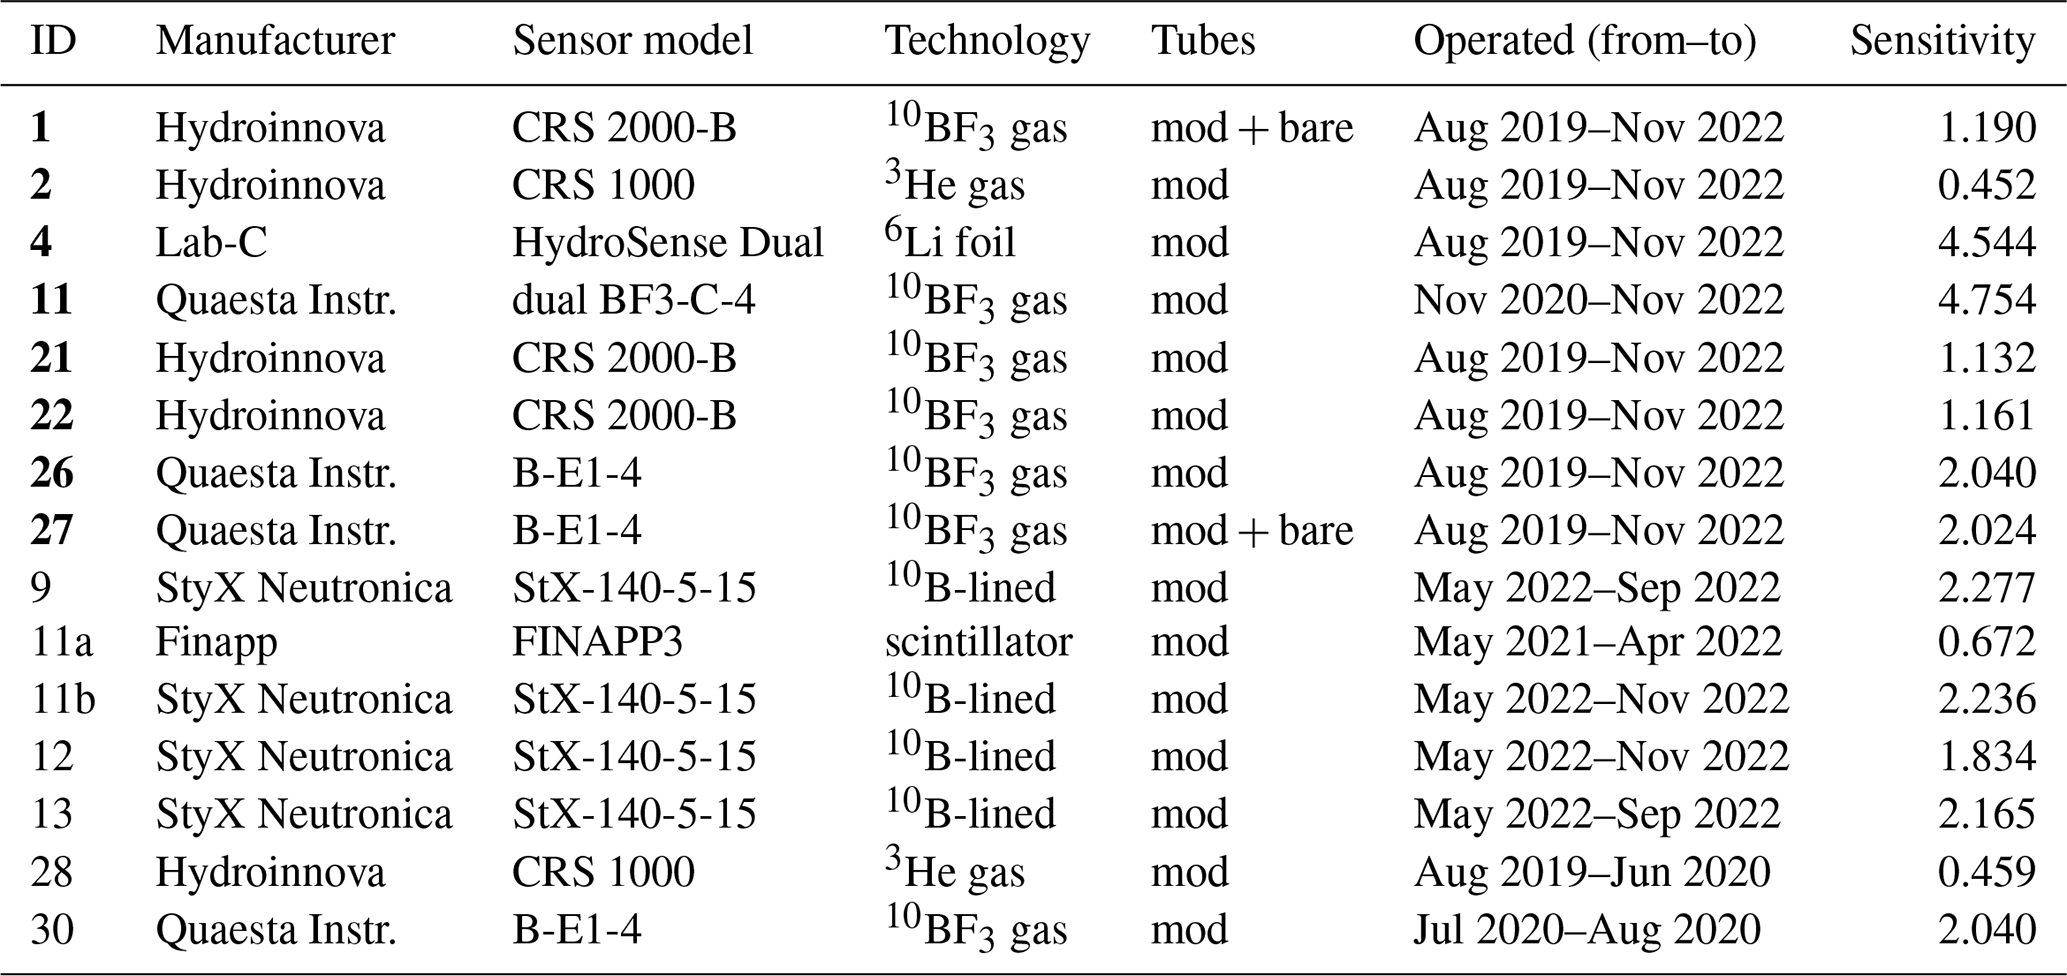
Bold IDs mark the permanent core cluster, and non-bold IDs were only operated during shorter time periods (see Fig. 3).
3.2 Stationary CRNS data
Between August 2019 and November 2022, eight stationary CRNS sensors were operated as a core component of the MqC. Sensors from different manufacturers were included: four devices were manufactured by Hydroinnova LLC (Albuquerque, USA), three by Quaesta Instruments LLC (Tucson, USA), and one by Lab-C LLC (Sheridan, USA), now linked to Quaesta Instruments. Seven additional sensors were operated for limited time periods, including devices from StyX Neutronica GmbH (Mannheim, Germany) and Finapp S.r.l. (San Pietro in Cariano, Italy). Table 2 provides an overview of the detectors and their sensitivities relative to a reference device (see Heistermann et al., 2022a, for details). Divided by the sensitivity, neutron count rates observed by different sensors become comparable. As for neutron detection, most of the sensors are based on detector gases such as 3He gas (CRS-1000, CRS-2000) or 10BF3 enriched gas (CRS-1000-B, CRS-2000-B, B-E1-4). “HydroSense Dual” uses a multiwire proportional chamber with solid 6Li (Fersch et al., 2020; Patrignani et al., 2021), StX-140-5-15 instruments apply 10B-lined converters, and the FINAPP3 probe relies on a multi-layer zinc sulfide and Ag-100 doped scintillator mixed with 6Li fluoride powder (Gianessi et al., 2022). In addition to epithermal neutrons, two devices also recorded thermal neutron count rates which might have the potential to support the separation of signals from soil moisture, vegetation, or snow (Tian et al., 2016; Jakobi et al., 2018). Further recorded variables include relative humidity, air temperature, and barometric pressure.
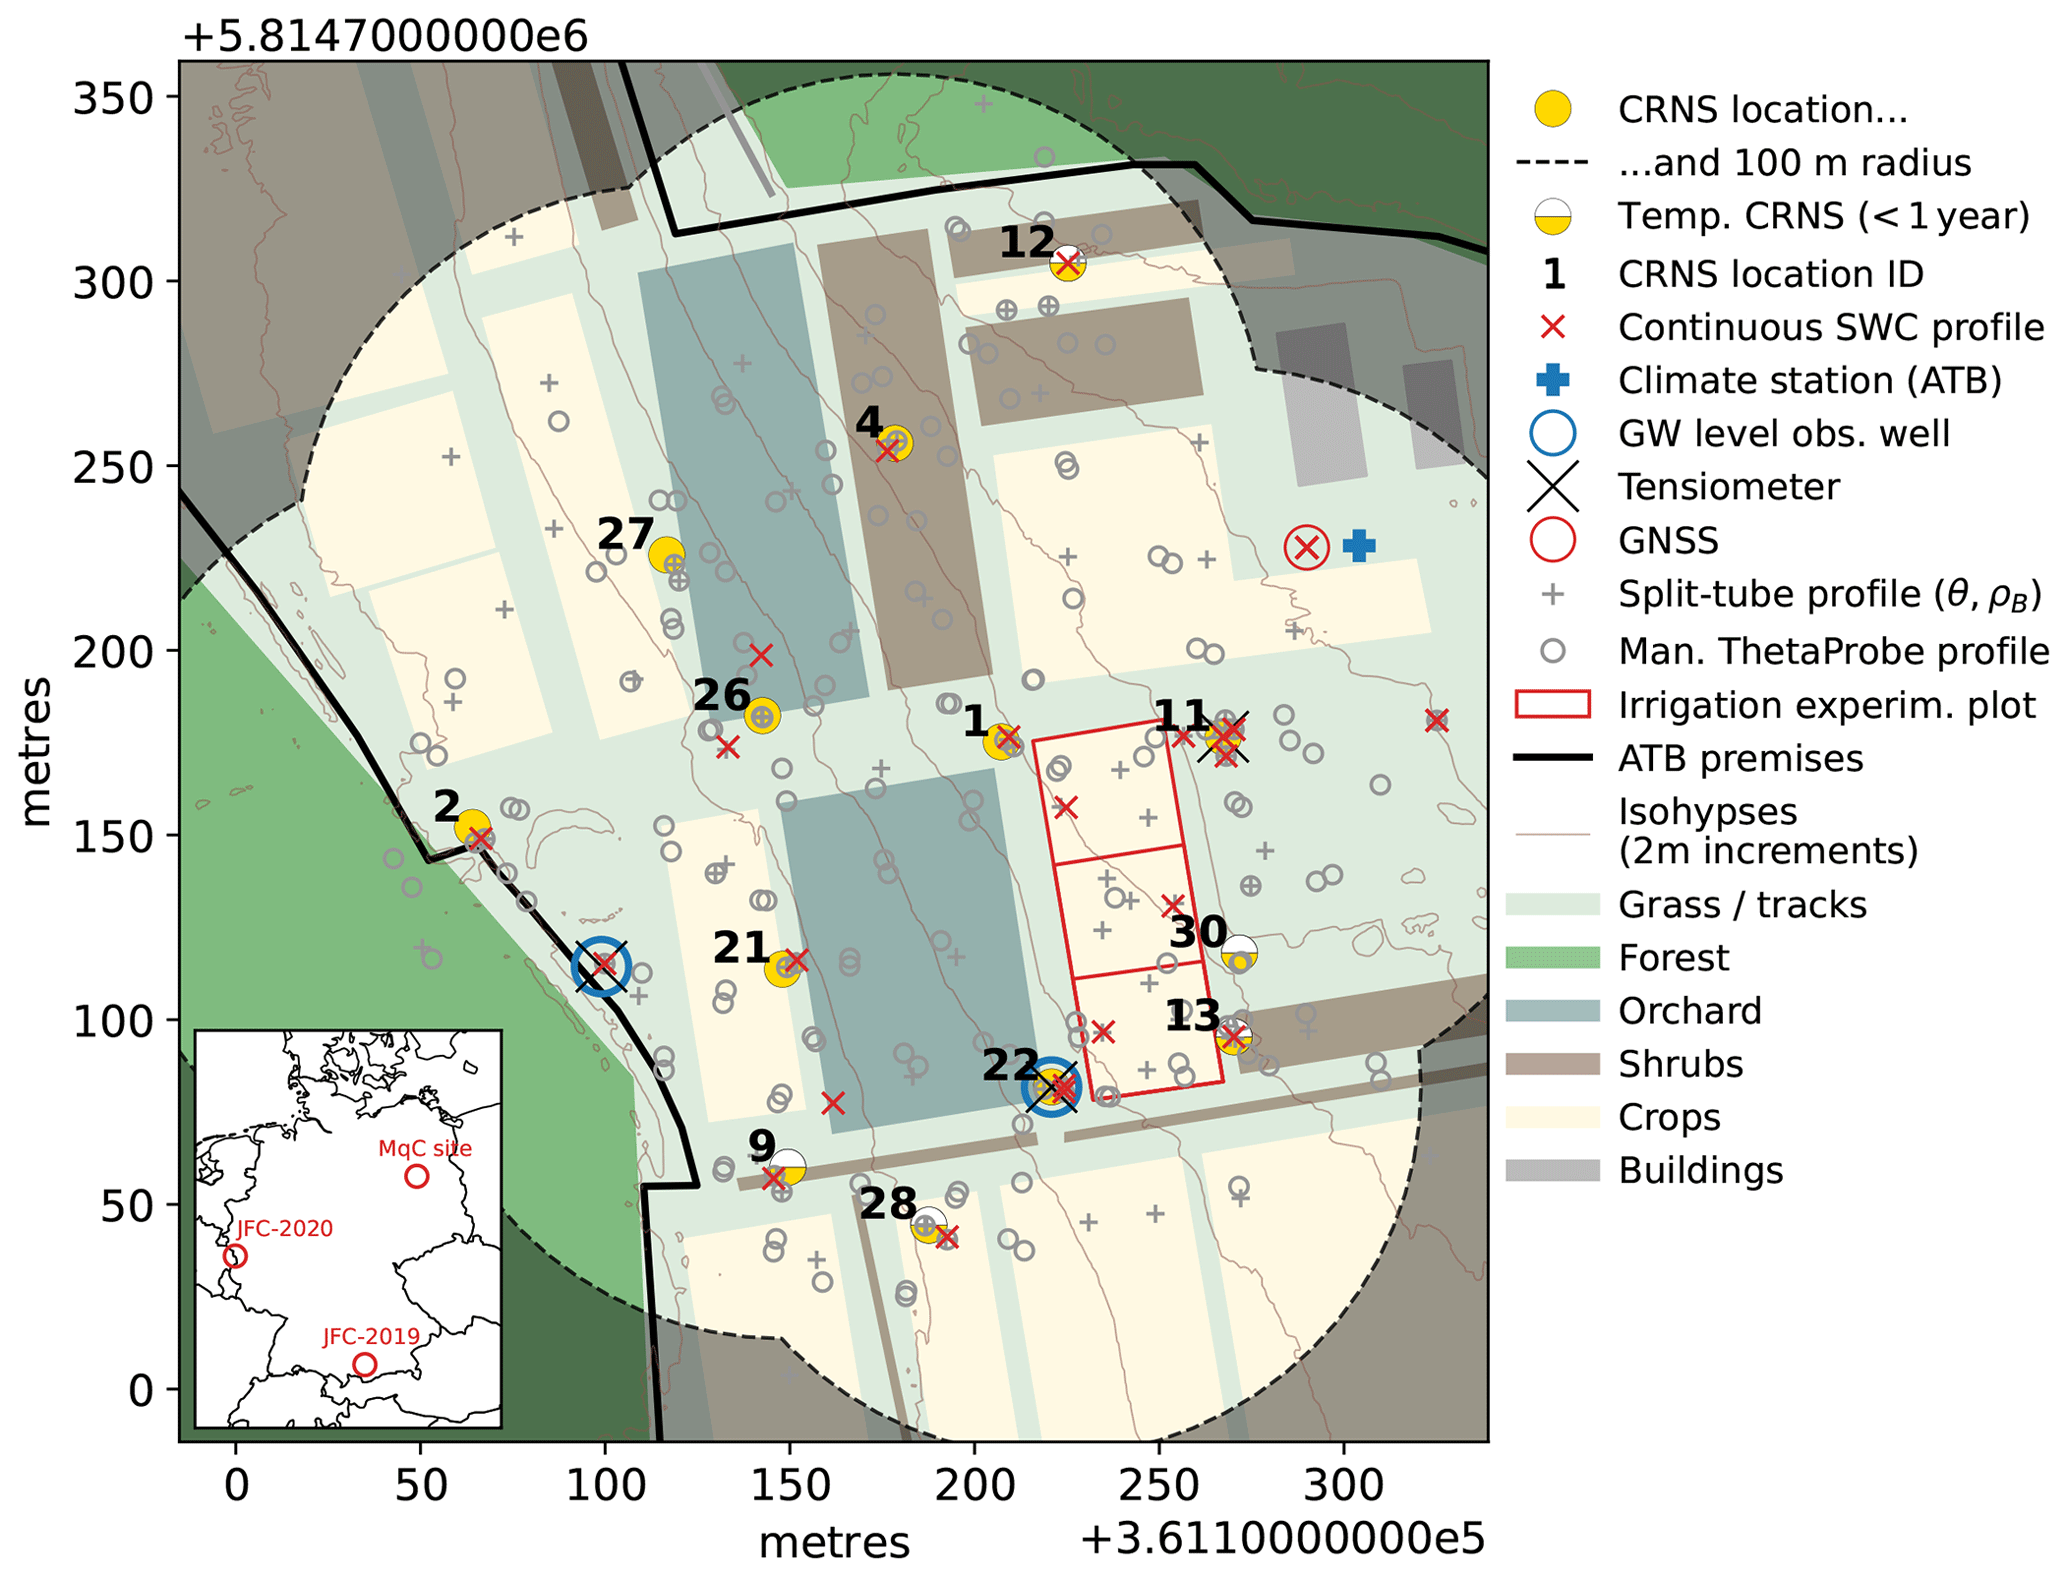
Figure 2Overall setup of the MqC cluster at the ATB research site in Marquardt (permanent and temporary CRNS, SWC profiles, groundwater observations, tensiometer, GNSS antenna, climate station), and calibration sampling points from November 2019 and October 2022; the shown orchard plots (blueish green) are drip-irrigated; the irrigation experiment (red outline) was performed with a sprinkler; OpenStreetMap (OSM) layers were used to represent buildings and forested areas (© OpenStreetMap contributors, 2023, distribution under ODbL license). Inset map: location of MqC in Germany and the two previous (short-term) CRNS clusters (JFC-2019 and JFC-2020; see Heistermann et al., 2022a).
The locations of the CRNS sensors are shown in Fig. 2. Sensor placement was guided by various criteria: (i) to create significant overlap in the core area of the cluster, (ii) to cover the site along the hillslope gradient, (iii) to place some sensors close to the irrigated orchards, and (iv) to minimize interference with agricultural management operations (sensors could not be placed on cropped fields).
The prime observation variable of the CRNS sensors is the count rate of detected neutrons. The sensitive energy range for the individual detectors is different though (Köhli et al., 2018). The stochastic uncertainty of the observed neutron count rate N at an arbitrary integration interval Δt amounts to (Francke et al., 2022). The uncertainty of soil moisture estimates based on CRNS, however, is subject to a wide range of effects, including the correction for effects of the atmosphere and other hydrogen pools, the collection and weighting of calibration measurements, and the propagation of errors through the non-linear conversion from neutron intensities to soil moisture (see, for example, Jakobi et al., 2020; Weimar et al., 2020; Baroni et al., 2018; Iwema et al., 2021, for a discussion).
3.3 Muons as a reference for incoming neutron intensity
Recent studies have indicated that local counts of muon and gamma particles might have the potential to support methods to correct CRNS data for the variability of incoming neutrons (Stevanato et al., 2022; Gianessi et al., 2022). Conventionally, neutron monitor data are used for that purpose (see Sect. 4.2). In order to allow for further benchmarking studies with regard to correction approaches, a muon and gamma detector (as part of the scintillator-based sensor FINAPP3; see CRNS sensor 11a in Table 2) was operated from May 2021 until May 2022. For detector-related technical details, we refer to Gianessi et al. (2022).
3.4 Roving CRNS
Roving CRNS snapshots were acquired as part of the irrigation experiment between July and August 2020 (see Sect. 3.15). The UFZ Hydroinnova rover is a moderated CRNS unit (Hydroinnova LLC, Albuquerque, USA) based on 3He gas and has been used by car, by train, by aircraft, or by handcart or carried by hand in many previous studies (Schrön et al., 2018; Fersch et al., 2020; Schrön et al., 2021; Heistermann et al., 2022a). Here, we placed the detector in a car to survey the whole MqC area and then used it on a handcart to map the irrigated plot and nearby fields inaccessible by car. The uncertainty of the neutron count measurements from roving follows the same counting statistics as outlined for stationary sensors (Sect. 3.2). The same applies to the uncertainty of corresponding soil moisture estimates. For roving, specific uncertainties arise from the spatial heterogeneity of hydrogen pools or soil properties, the effect of roads (Schrön et al., 2018), and the trade-off between integration time and spatial resolution (Jakobi et al., 2020; Schrön et al., 2021). All these uncertainties depend on the chosen processing methods and should be discussed by users of this data set.
Table 3Data acquisition during the irrigation experiment, July–August 2020.
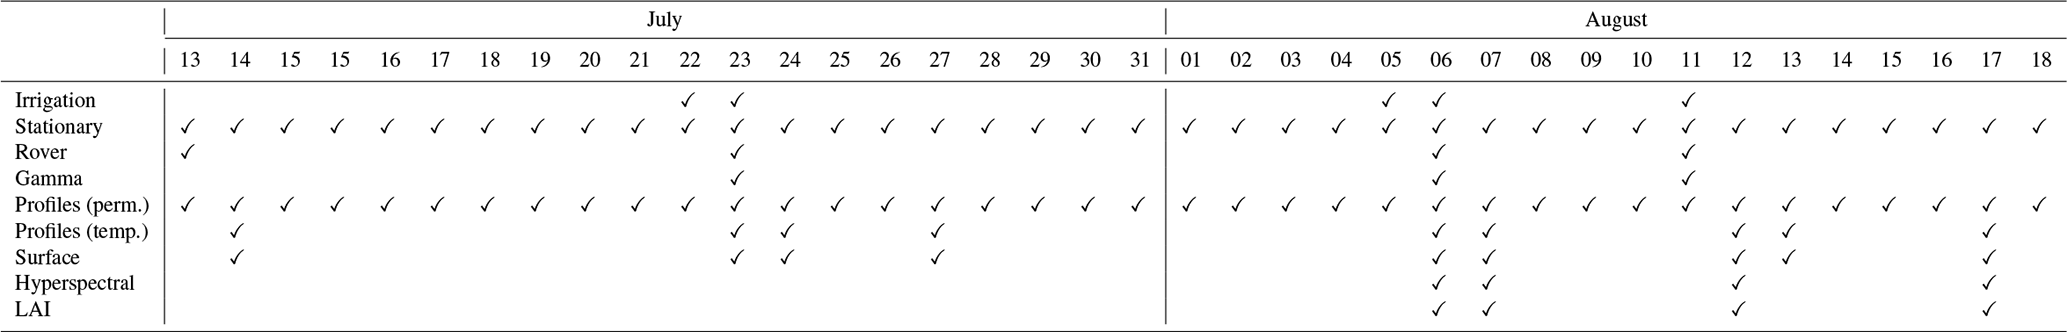
Measurements were conducted on 4 d, 1 d before the irrigation events (13 July) and 3 d right after the irrigation events (23 July and 6 and 11 August; see Table 3). The handcart has been used in stop-and-go mode with typically 5–10 min residence time per point. Raw data in this repository have been cleaned and contain detector-relevant variables and GPS records, as well as meteorological observations from an external mobile weather sensor mounted on the handcart. In order to visualize the observations (see Sect. 5.2), the data recorded at intervals of 10 s were smoothed temporally with a moving average window of 1 min and spatially within a 5 m radius using the distance-weighting function Wr (Schrön et al., 2017). Further corrections and the conversion to soil moisture followed the procedures outlined in Schrön et al. (2018). In relation to the calibrator CRNS sensor (compare Table 2 and Sect. 3.2), the handcart rover has a sensitivity of 5.51; i.e. in the same interval, it will count 5.51 times the number of epithermal neutrons detected by the calibrator probe (see also Heistermann et al., 2021).
3.5 GNSS reflectometry
GNSS reflectometry (GNSS-R) is a non-conventional methodology which uses measurements of reflected signals from navigational satellites to estimate soil moisture. The theoretical background was introduced by Larson et al. (2008b), Larson et al. (2009), Rodriguez-Alvarez et al. (2009b), Zavorotny et al. (2009), and Chew et al. (2014), and the efficiency of this method was demonstrated by various research studies (e.g. Larson et al., 2008a; Rodriguez-Alvarez et al., 2009a; Vey et al., 2016).
The GNSS antenna receives the direct signal as well as the signal reflected by the earth's surface. For the purpose of soil moisture retrieval, Larson et al. (2008b) suggested to use the signal-to-noise ratio (SNR) recorded by the antenna, as it is independent of the effects of orbits, atmosphere, or clocks. Equation (1) in Larson et al. (2008b) provides the key relationship between the SNR and a phase offset ϕ. This offset directly relates to the apparent reflection depth of the GPS signal which, in turn, depends on permittivity and hence soil moisture. Accordingly, relative soil moisture changes can be retrieved by comparing different phase offsets ϕ, assuming that other surface properties remain constant. The corresponding penetration depth and hence representativeness of the signal amounts to around 1 cm for wet and up to 6 cm for very dry soils (Larson et al., 2010). Please note that some more filtering is required to take into account the dominance of the direct signal in high elevation angles (see Larson et al., 2008a, for details).
Actual SWC can then be estimated by relating these relative changes to representative SWC measurements on the ground. In the MqC context, the obvious choice for such measurements would be the four co-located time domain reflectometry (TDR) profiles at a depth of 9 cm (see Sect. 3.8).
Among all constellations, the Global Positioning System (GPS) is the most suitable for GNSS-R soil moisture applications. The repetition period of the orbits is 1 sidereal day (23 h 56 min 4.0905 s), and each satellite yields two individual tracks over each location. In combination with the track splitting into two arcs (ascending and descending), all GPS satellites provide more than 100 reflection paths per day, each of them potentially providing a soil moisture estimate. The footprint of the reflection corresponds to a projected ellipse on the ground and is not constant in time. Its shape and size depend on the antenna height, the wavelength of the carrier frequency, and the elevation angle of the satellite. Its position is related to the unique orbit of the satellite and the antenna height (Larson et al., 2009). For a 3 m high antenna, the L2 GPS signals yield an ellipse of 33.66 m by 2.93 m size, when the satellite is located 5∘ above the horizon. The present setup hence accumulates observations from a circular area of approximately 33 m radius around the station, recorded with a Delta TRE-G3T receiver (JAVAD GNSS, Inc., San Jose, USA) and a S67 antenna (Antcom Corporation, Torrance, USA).
3.6 UAS-based hyperspectral remote sensing
In order to be able to observe high-resolution SWC patterns and to analyse plant–soil interactions, hyperspectral imagery was acquired during the irrigation experiment (Sect. 3.15). Table 3 displays the four dates of the image acquisitions in the context of the irrigation experiment. We performed the flights at solar noon (± 1 h) during cloudless-sky conditions using a flight altitude of 100 m and a flight speed of approximately 5 m s−1. The carrier platform was a DJI Matrice 600 Pro (Da-Jiang Innovations Science and Technology Co., Ltd., China), which is coupled to the Nano-Hyperspec sensor (Headwall Photonics, Inc., USA). This hyperspectral sensor is a linescanner which captures 271 bands in the VIS–NIR spectral range (399 to 1000 nm) with a full width at half maximum (FWHM) of approximately 6 nm. The lens has an angular field of view of 15.3∘. Together with the flight altitude, this results in a spatial resolution of approximately 4 cm × 4 cm.
We performed the following steps to process the hyperspectral data:
-
Raw data were converted to radiance and reflectance using the Headwall SpectralView software and a reflectance tarp, which was scanned during the image acquisition.
-
The reflectance data were geo-referenced using the Georeferencing tool of ArcGIS (Esri Inc., USA) and high-resolution multi-spectral UAS data as a basemap. Details of the basemap creation can be found in Döpper et al. (2022).
-
The spectral signal was corrected for spikes and drops.
-
The data were spectrally filtered with the Savitzky–Golay filter (Savitzky and Golay, 1964), as implemented in the Python SciPy module (Virtanen et al., 2020). We applied a window width of seven and a second-order polynomial smoothing.
Besides the processed hyperspectral imagery, we provide the spatial SWC products based on a data-driven approach and a hybrid approach as described in Döpper et al. (2022). For interpretation and accuracy of the products, we refer to Döpper et al. (2022).
3.7 Leaf area index measurements
Over vegetated areas, the hyperspectral signal is dominated by variations of the leaf area index (LAI). We provide LAI measurements as a resource for interpreting the hyperspectral data and disentangling soil moisture-related signals from LAI signals. The LAI was sampled on the four dates of the UAS-based hyperspectral image acquisition (see Table 3) and comprise 31 to 40 measurements per campaign. We measured the LAI using a LAI-2200C plant canopy analyser (LI-COR Biosciences GmbH, Germany). In order to avoid direct sunlight scattering, we sampled the LAI at dawn, starting shortly after sunset. We randomly located the measurements to reduce damage of the vegetation due to repetitive sampling. Each measurement resulted from the mean of five above- and below-canopy measurements at each location. The location was recorded using a Leica Zeno GG04 (Leica Geosystems AG, Switzerland) Differential Global Position System (DGPS) antenna with accuracies at the centimetre level.
3.8 Soil moisture profiles
A variety of soil moisture profile measurements were implemented on the premise, covering different measurement depths and technologies (with a total number of 27 individual profiles, 23 of them with more than 2 years of data). That way, we could obtain detailed records on the vertical SWC dynamics related to infiltration and drying, which are critical to the retrieval and interpretation of CRNS-derived soil moisture (see, for example, Scheiffele et al., 2020).
Soil moisture profile probes were operated at 12 locations at or close to the CRNS sensors to supplement the CRNS cluster with information on the horizontal and vertical variability of soil moisture (Fig. 2). The impedance-based profile probes (three PR2/4 and eight PR2/6 probes, Delta-T Devices LLC, Cambridge, UK) measured at 10, 20, 30, and 40 cm depths (PR2/6 also at 60 and 100 cm). Additionally, eight profiles consisting of four to five single impedance-based probes (ThetaProbe ML2x, Delta-T Devices LLC, Cambridge, UK) installed at depths down to 200 cm complemented the network in locations where profile probes could not be installed or where larger depths needed to be monitored. According to the manufacturer, using the default conversion function, the uncertainty of the soil moisture measurements amounts to ±0.05 m3 m−3 (Delta-T, 2016). To improve this conversion, we performed a two-point calibration (air, water) to correct the raw sensor readings and employed a customized function for converting permittivity to volumetric soil moisture, as described in Sect. 3.11. Please also refer to Jackisch et al. (2020) for a broader assessment of various measurement techniques for soil water content, including impedance-based sensors and the need for recalibration.
Furthermore, five profiles of 20 single TDR soil moisture probes (TDR100, Campbell Scientific Ltd., UK) in close vicinity to the permanent GNSS-R antenna are available (Fig. 2). The probes are installed at 9, 11, 25, 45, and 75 cm depth and operate using the conversion suggested by the manufacturer, i.e. the approach after Topp et al. (1980), to derive volumetric soil water content in cubic metres per cubic metre (m3 m−3) in 15 min intervals.
Finally, three profiles with measurements at 5, 10, 20, 40, and 60 cm depth were equipped with 5TE sensors (5TE, Decagon Devices, Inc., Pullman, USA) and single ML2x ThetaProbes in the same depth. The single ThetaProbes were calibrated with the above approach and removed in 2020. During installation of the 5TE sensors, soil samples were taken to determine volumetric soil moisture (Sect. 3.11) and derive a linear relationship between sensor permittivity and soil moisture. The sensors also provide soil temperature measurements; electrical conductivity values were regarded as unreliable and are not provided here.
3.9 Groundwater level
Two groundwater observation wells were installed in August 2019 within the MqC and equipped with sensors to continuously record groundwater heads. The depth to the groundwater table increases from very shallow (open-water body of the Wublitz, 200 m west of MqC) towards approximately 10 m below ground in the east of MqC. The wells are located close to CRNS sensor 22, approximately at the middle of the hillslope (ground elevation 35.9 ), and in the vicinity of CRNS sensor 2 at the bottom of the hillslope (31.2 ) (Fig. 2). Well pipes of 63 mm diameter were installed at a depth of 4 and 6 m below ground for well 2 and 22, respectively. The pipes are filtered over a length of 1 m at the lower end. A pressure sensor (Hobo U20L, Onset) was installed in well 2 and well 22 at 3.6 and 5.8 m below ground, respectively. Both sensors recorded pressure and temperature at a 30 min interval. In well 22, an additional sensor recorded air pressure and temperature. Regular manual measurements of the groundwater heads were used to validate the continuous measurements and exclude any drift in the pressure sensor measurements.
3.10 Measurement of matric potential (tensiometer)
At locations 2, 11, and 22 (Fig. 2), tensiometer profiles were installed at four depths in June 2020. Alongside each tensiometer, a ThetaProbe (ML2x, Delta-T Devices LLC, Cambridge, UK) measured the soil water content (see Sect. 3.8). Installation depths at location 11 and 22 were 50, 100, 150, and 200 cm. At location 2 the depths of 50, 80, 110, and 140 cm were chosen because of shallow groundwater conditions. The matric potential was measured with full-range tensiometers (TensioMark, echoTech Umwelt-Meßsysteme GmbH, Bonn, Germany) which indirectly measure the matric potential via heat pulse dissipation. During installation, three soil cores were taken at each depth. One core (100 cm3) served to determine water content and texture (see Sect. 3.11). Two larger cores (250 cm3) were used to measure soil hydraulic properties in the laboratory (see Sect. 3.12).
3.11 Campaign-based observation of soil water content and other soil data
In order to increase the spatial density of independent soil moisture observations in addition to the stationary profile probes, two sampling campaigns were carried out on 7 November 2019 and 10 October 2022. These campaigns involved a total of 103/87 (in 2019/2022) locations with manual measurements using soil cores (35/13 sampled locations) and ThetaProbes probes (72/87 sampled locations), typically down to a depth of 30 cm with increments of 5 cm. All sampling locations were surveyed by DGPS (see Fig. 2 for an overview). In October 2020, we retrieved another 29 soil cores specifically for the analysis of bulk density, organic matter, lattice water content, and texture. Additionally, during the installation of the tensiometers (see Sect. 3.10) and the 5TE sensors (Sect. 3.8), soil cores were collected from the installation depths down to 2 m, allowing the retrieval of the mentioned parameters for greater depths.
Soil cores were extracted and treated as described in Heistermann et al. (2022a). Water content and bulk density were derived by oven drying, organic matter and lattice water determined on subsamples by loss on ignition. The texture analysis was done on untreated soil samples by wet-sieving (for gravel, sand) and laser diffraction (silt, clay). The manual measurements with ThetaProbes, too, followed the procedure outlined by Heistermann et al. (2022a), using portable ThetaProbes with sensor-specific calibrations and a site-specific conversion of permittivity to soil moisture, which resulted in an RMSE of 0.03 m3 m−3 for the soil moisture estimates.
In addition to the two campaigns in 7 November 2019 and 10 October 2022, extensive near-surface measurements (ThetaProbes) were conducted on 13 d between 18 July 2019 and 17 August 2020. These comprised 5-fold replicates at 35 to 71 random locations with electrodes inserted from the surface (i.e. effective measurement depth 2.5 cm), processed as described above.
3.12 Evaporation experiment to determine soil hydraulic parameters
Two undisturbed soil cores of 250 cm3 were taken during the installation of the three tensiometer and deep soil moisture profiles at each installation depth (see Sect. 3.10). The resulting 24 soil cores underwent soil hydraulic analyses in the laboratory. First, saturated hydraulic conductivity was measured by the constant head method (Klute and Dirksen, 1986). Second, the cores were used to determine the unsaturated soil hydraulic properties within an evaporation experiment (Wind, 1968; Schindler and Müller, 2006). This was done using a kupF MP10 device (UGT, Umwelt-Geräte-Technik GmbH, Müncheberg, Germany). At an interval of 10 min, the device records the weight of the soil core as well as the matric potential at two tensiometers vertically inserted at depths of 1.25 and 3.75 cm. Afterwards, the dry weight and bulk density of the samples were determined. Additionally, the water content at a pF value of 4.2 (i.e. suction of 15 000 hPa) was determined using a ceramic plate and pressure chamber on two small subsamples per soil core (Brooks and Corey, 1964; Klute, 1986). The data can be used to determine the retention curve and unsaturated hydraulic properties of the soil (e.g. Peters and Durner, 2008).
3.13 Measurement of snow depth, density and cover
In MqC, an appreciable snow cover can be expected every 2 to 3 years. In February 2021, a snow layer with a maximum depth of approx. 10 cm persisted for about 1 week. During this time, its main properties were measured: snow depth (continuously and campaign-based), precipitation, snow cover, and density (campaign-based).
Snow depth was monitored with an ultrasonic temperature-compensated distance meter (SR50-45, CampbellScientific, Inc., Logan, USA) looking downward on a representative spot of shortly clipped grass. Simultaneously, close to three CRNS sensors (1, 2, and 11; see Fig. 2), wildlife cameras (SECACAM HomeVista, VenTrade GmbH, Köln, Germany) with infrared night vision took hourly images of sets of 10 snow stakes of 50 cm, distributed in clusters of approx. 10 m diameter each. The length of the stakes protruding from the snow was determined manually on the resulting images and used for a simple photogrammetric calculation of time series of the snow depths at the stakes.
Shortly before and during the snow period, total precipitation and air temperature were additionally measured using a weighing pluviometer Pluvio (Pluvio2 L, OTT GmbH, Kempten, Germany and 107-L Temperature Probe, Campbell Scientific, Inc.) with anti-freezing agent to reduce losses by spindrift.
Areal snow cover during snowmelt was surveyed on two dates (17 and 18 February 2021) by UAS imagery using a Mavic Pro (Da-Jiang Innovations Science and Technology Co., Ltd, China) at a flight altitude of 100 m. Mosaicking employed PhotoScan software (Agisoft LLC, St. Petersburg, Russia) and was geo-referenced to 20 cm orthophotos provided by the Federal State of Brandenburg, yielding an RGB image with 3 cm ground resolution.
Manual snow sampling included snow depth measurements with a ruler and density measurements. These were conducted using cylinder cores or collecting (sweeping up, rolling) all snow from a designated area and successively weighing it in the field.
3.14 Land use and biomass
Hydrogen as contained in biomass affects both epithermal and thermal neutron count rates. The corresponding biomass pools in the sensor footprints should hence be accounted for when interpreting the CRNS signal.
For the agricultural plots, the crops, date of operation, and their yields have been determined by weighing the harvest. From these yields, total biomass inventories were computed using literature values for water content and harvest index (Munns et al., 2018; Stöckle et al., 2022; Taes et al., 2022; Kuai et al., 2015).
The highest biomass densities in and around the study area are within the surrounding forests in the west and north (Fig. 2), followed by the orchards (cherry and apple plantations) and a short-rotation plantation of poplar trees. For these areas of higher biomass density, the determination of the average above-ground dry biomass (AGB) was further refined using allometric functions. In the forest stands and the poplar plantation, we used in situ measurements of diameter at breast height (DBH; in cm) and tree height (H; in m) and species-specific allometric relationships to predict AGB (in kg) per tree. To select an appropriate allometric relationship and its parameter values, we chose published studies with a similar climate and a similar range of reported DBH values. The AGB was summed up for all trees in a sampled plot and divided by the plot area to obtain the AGB density (in kg m−2).
-
Forest. The adjacent northern forest area is predominantly covered by black locusts (Robinia pseudoacacia, 70 % of sampled trees), oaks (Quercus robur L.; Quercus petraea (Matt.) Liebl.), and maples (Acer pseudoplatanus, Acer platanoides, and Acer campestre). The western forest stand, part of a local nature reserve, is dominated by alder (Alnus glutinosa, 87 %), with scattered presence of elder (Sambucus nigra) and elm (Ulmus spp.). Allometric relationships were taken from Zell (2008) (Alnus spp., Quercus spp.), Albert et al. (2014) (Acer spp.), Annighöfer et al. (2012) (Robinia pseudoacacia), van de Koppel (1992) (Sambucus nigra), and McHale et al. (2009) (Ulmus spp.). Within each forest area intersecting with a CRNS footprint, we randomly selected three plots with a radius of 12.5 m and measured DBH (at 1.3 m reference height) and H (using a laser-based ranging device, TruPulse 360B, Laser Technology, Inc., Centennial, USA). Herbaceous plants, litter, and understorey vegetation were not taken into account as these represent a minor hydrogen pool as compared to the adult trees. An average of 34.2 kg m−2 was estimated for the northern forest and 26.3 kg m−2 for the western forest, respectively (no estimation error provided due to limited sample size).
-
Short-rotation poplars. The poplar plot consists of 12 rows with three different poplar hybrids (MAX 4, NE42, and Matrix 24). The distances are approximately 2.3 m between the rows and 0.5 m between the individual trees, with some empty parts in the north. A total of 60 trees in six adjacent rows were sampled for DBH. From these 60 trees, 12 trees were cut and weighed, and the water content was determined from mixed samples. An exponential relationship between DBH and dry AGB was fitted for the 12 trees and then used to compute the average dry AGB of the 60 measured trees (4.5 ±0.2 kg per tree). Considering the total number of trees (2564) and the plot size (2880 m2), the total dry AGB estimate per unit area for the poplar plantation amounted to 4.0 ± 0.2 kg m−2.
-
Orchards. For the cherry and apple orchards, we refer to Richter (2021), who measured the average AGB per tree from a representative sample of single trees. Combined with the total number of trees per plot and the plot size, the average AGB density yields 3.8 ± 0.4 kg m−2 for the cherries and 0.49 ± 0.08 kg m−2 for the apples.
-
Other plots. The walnut plot and a row of cornel cherries are the only appreciable woody vegetation for which no biomass or allometric data were collected as part of this study. Nevertheless, for the purpose of correcting the CRNS signal, we used the biomass estimate of the cherry plot as an acceptable approximation.
3.15 Irrigation experiment (July–August 2020)
An irrigation experiment was carried out in order to observe the response of various sensors to pronounced soil moisture contrasts. Between 22 July and 11 August, a plot of 35 m × 100 m (Fig. 2) was repeatedly irrigated with a centre pivot sprinkler (Irriland, Italy): during three phases, 40–50 mm was applied to , , and of the plot, respectively, i.e. the southernmost part receiving three pulses of water (see Table 3). Three rain gauges and one pan (41 cm × 72 cm) served for verifying the respective amount of applied water. Accompanying measurements included the following features (see also Table 3):
-
Three CRNS sensors were operated at close proximity to the irrigated plot, including sensors 1 and 22. The CRNS sensor from location 26 was temporarily relocated to the eastern edge of the plot (location 30) since the CRNS sensors at locations 11 and 13 were not operated at the time.
-
Nine campaigns manually measured soil moisture at the surface (at 46–71 locations; see near-surface measurements given in Sect. 3.11) and in 20 PR2 access tubes. The access tubes were visited nine times with a mobile PR2 profile probe, taking three readings at 0, 120, and 240∘ orientation. A total of 3 of the 20 access tubes were also continuously monitored throughout the experiment.
-
There were four mobile CRNS roving campaigns (see Sect. 3.4 for details).
-
There were four UAS flights to acquire hyperspectral imagery (see Sect. 3.6) for potential mapping of SWC patterns within the irrigated field.
-
There were four leaf area index measurement campaigns (see Sect. 3.7) to complement the remote sensing observations since LAI is one of the most dominant variables in the spectral signal.
The following subsections highlight relevant data sets which have been published already or are provided by other organizations or channels but which we consider as potentially helpful for users of the data presented in Sect. 3.
4.1 Weather data
A climate station with a heated tipping-bucket rain gauge is located in the north-eastern part of the study area (see Fig. 2) and recorded, at an hourly resolution, standard climate variables, including air temperature, relative humidity, precipitation, soil temperature (at 5, 10 and 30 cm), and solar irradiation, as well as wind speed and direction. The original data are publicly available at http://technologygarden.atb-potsdam.de/bsa_wetter.aspx (last access: 30 June 2023).
The closest climate station of the DWD is located in Potsdam about 12 km south-east of the study site (station ID 03987). The data are available via DWD's open data repository https://opendata.dwd.de/climate_environment/CDC/observations_germany/climate/ (last access: 30 June 2023).
For convenience, we have included subsets of both station records in the published data set, spanning the MqC study period.
4.2 Incoming neutron flux
Variations of the incoming cosmic-ray neutron flux on earth are recorded by neutron monitors. The corresponding data are available from the Neutron Monitor Database, http://www.nmdb.eu (last access: 30 June 2023). Following Hawdon et al. (2014), Schrön et al. (2016), Baatz et al. (2015), Jakobi et al. (2018), and Baroni et al. (2018), the neutron monitor at Jungfraujoch (JUNG) is recommended for the correction of the incoming neutron flux at MqC.
4.3 Terrain and soil maps
A digital elevation model (DEM) at the resolution of 1 m × 1 m is freely available at the Landesvermessung und Geobasisinformation Brandenburg (LGB; state survey agency) at https://geobroker.geobasis-bb.de (last access: 30 June 2023), at an accuracy of 30 cm. A soil map for agricultural soils (Mittelmaßstäbige landwirtschaftliche Standortkartierung) is publicly available at a scale of 1:100 000 at https://geoportal.brandenburg.de (last access: 30 June 2023).
4.4 Land use, roads, and waterways
During fieldwork and for visualization, we used OpenStreetMap data layers (OpenStreetMap contributors, 2023), available via http://download.geofabrik.de (last access: 30 June 2023), namely land use, waterways, and traffic ways. The data are distributed under ODbL license (http://www.openstreetmap.org/copyright, last access: 30 June 2023).
A comprehensive presentation and discussion of this large and diverse data set is beyond the scope of this paper. Still, this section provides an overview and also highlights selected details. This involves some level of data processing, specifically with regard to the correction of neutron counts from stationary sensors and CRNS roving, as well as the calibration of the relationship between neutron count rates and volumetric soil moisture. The correction of neutron count rates accounts for the differences in sensor sensitivity and for the dynamics of the incoming cosmic-ray neutron flux, barometric pressure, and air humidity, as well as for the spatial variability of vegetation biomass. With this level of standardization, it is possible to establish a harmonized calibration of the transfer function from neutron count rates to SWC (Desilets et al., 2010) for all locations, based on the data collected during the two soil sampling campaigns (Sect. 3.11). Comprehensive details with regard to the corresponding processing steps are available, for example, in Heistermann et al. (2021, 2022a). The data subset for the stationary CRNS (see Table 4) contains an exemplary daily soil moisture product retrieved from observed neutron counts.
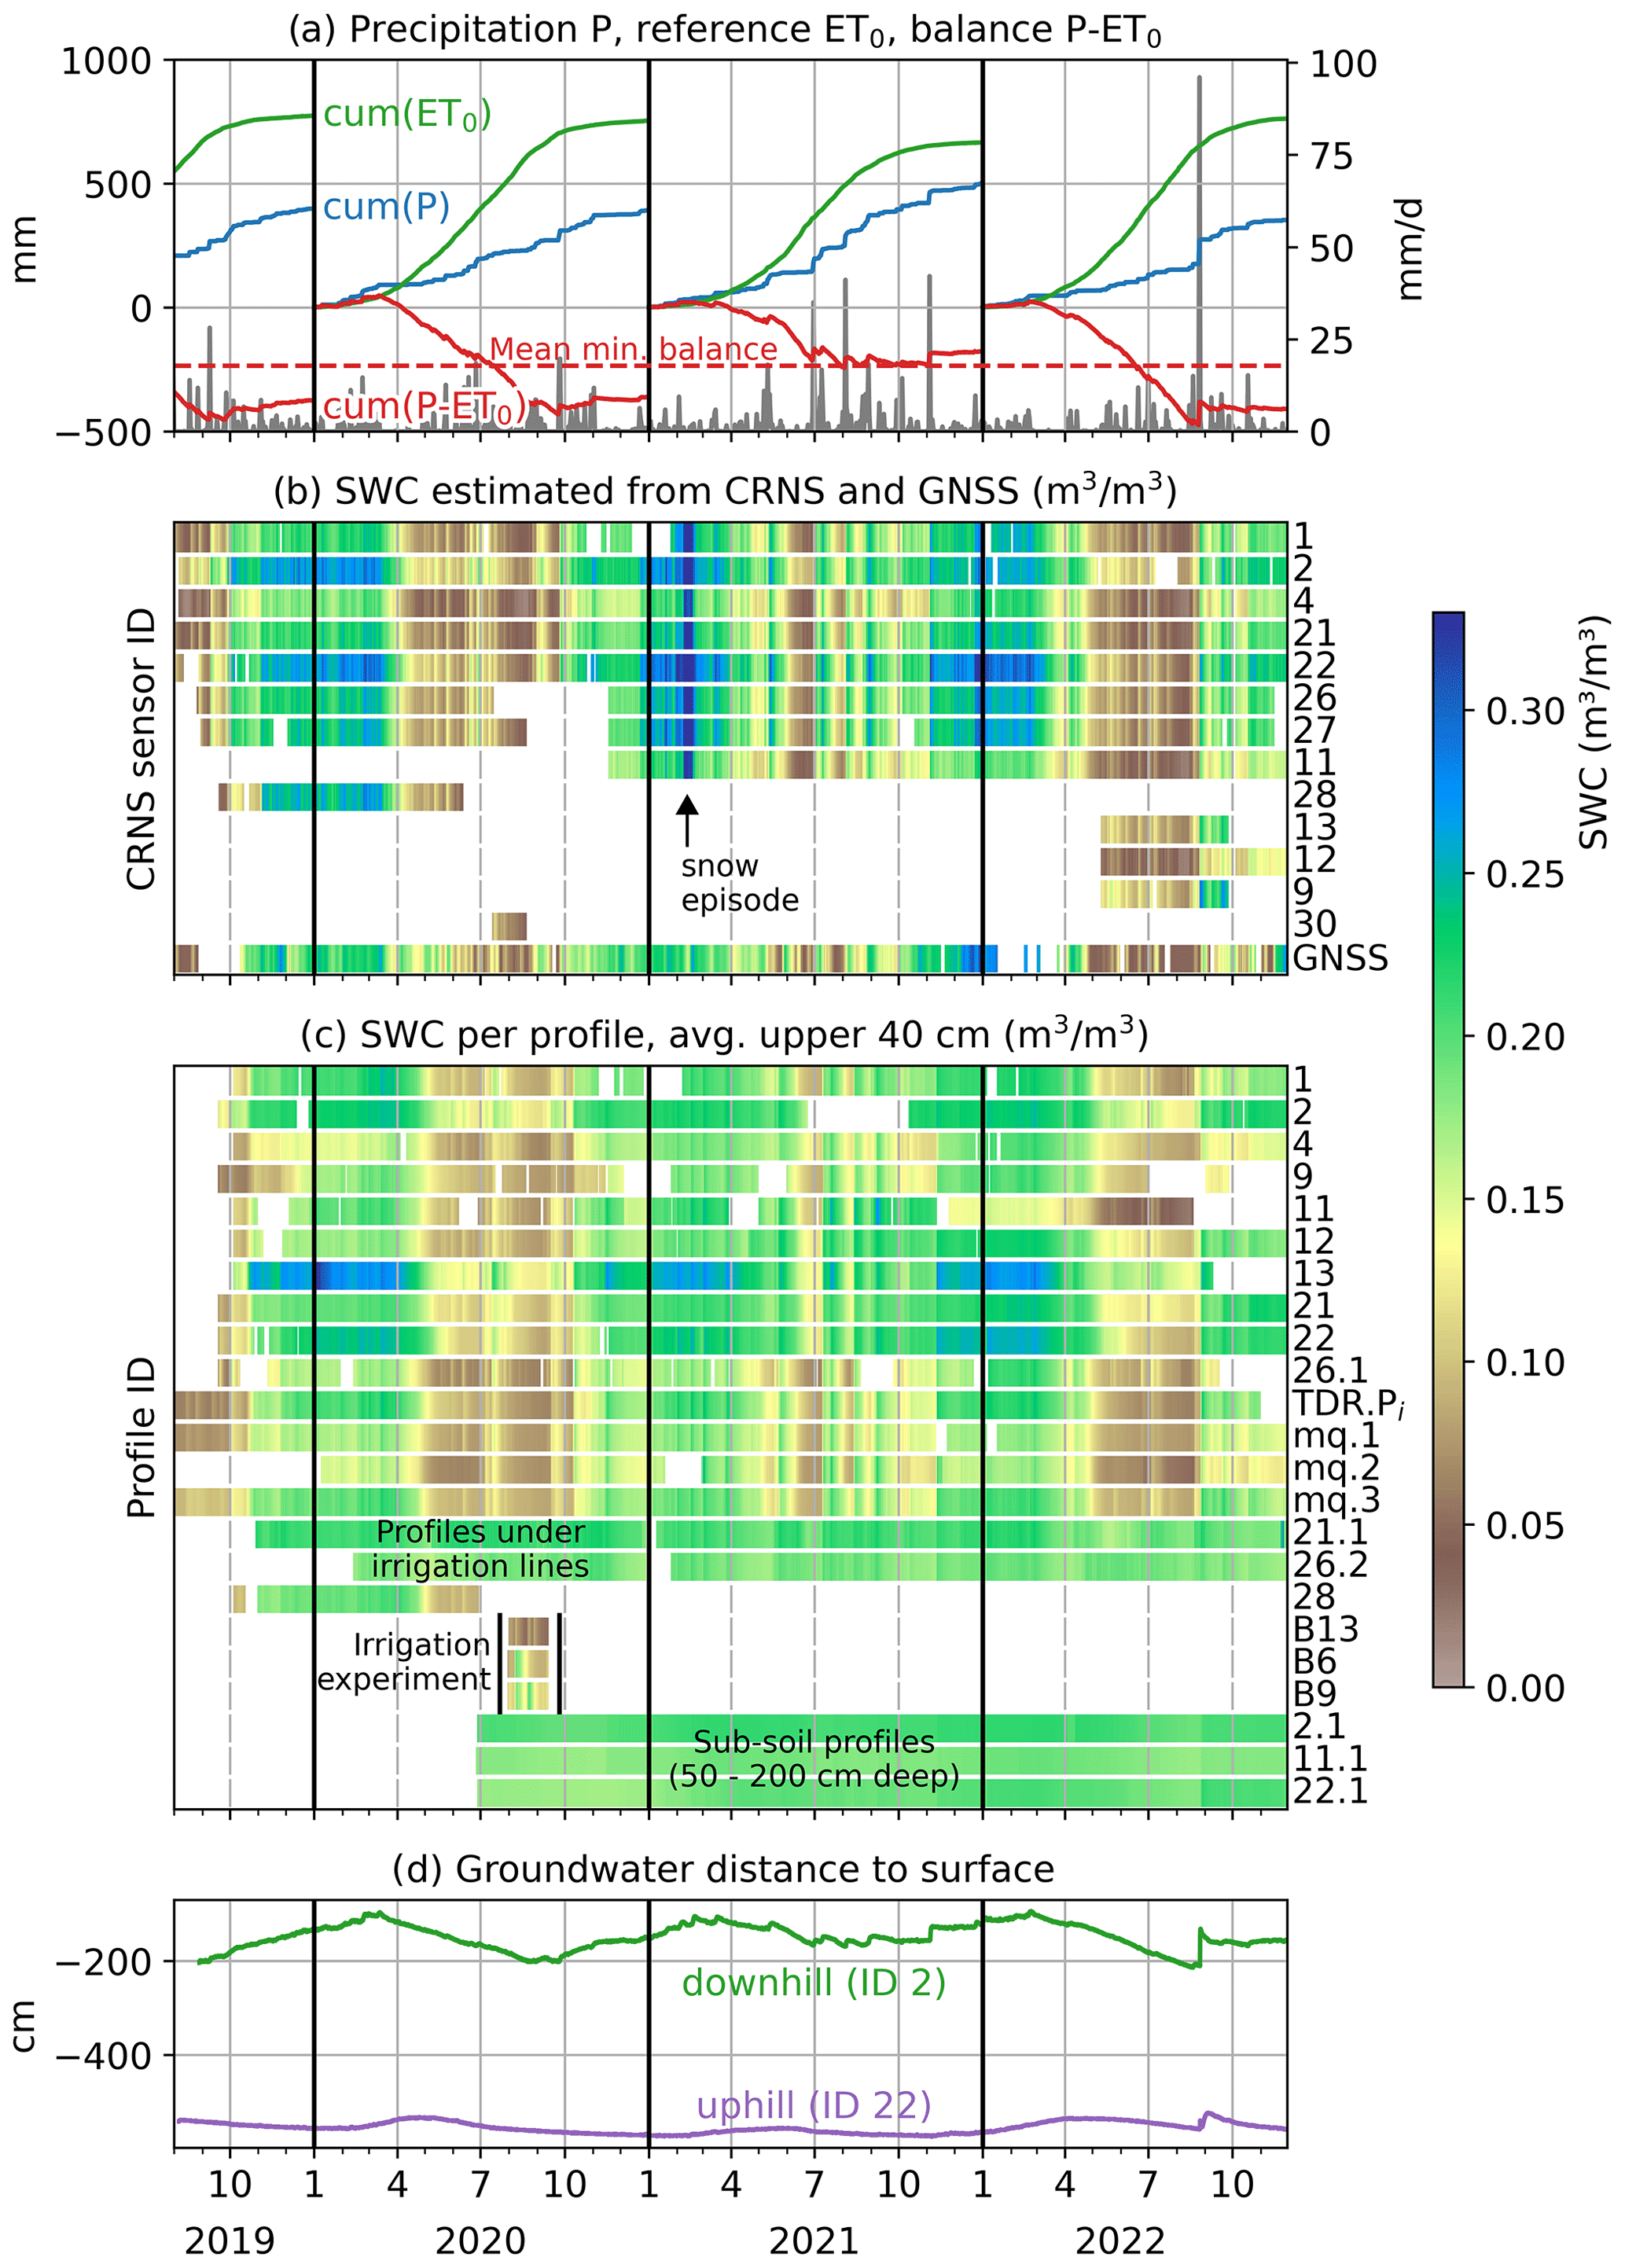
Figure 3Temporal dynamics of recorded variables and data availability from August 2019 to November 2022. (a) Daily precipitation (grey bars), cumulative sums of precipitation P, reference evapotranspiration ET0, and the daily difference P − ET0, separately for each calendar year; (b) soil moisture estimated from neutron count rates (CRNS) and from the GNSS signal (temporary CRNS sensors 11a and 11b (Table 2) not shown as we focus on an overview of locations, not sensors); (c) SWC as recorded at the profiles, averaged over upper 40 cm (TDR.Pi label refers to the average of five TDR profiles closely co-located at the GNSS antenna); and (d) groundwater distance below ground at two wells.
5.1 An overview of the entire study period
Figure 3 provides a summary of the time series recorded from 2019 to 2022. It illustrates both temporal dynamics and data availability for the various locations and sensors.
The study period coincided with 3 major drought years (2019, 2020 and 2022). This becomes apparent from the cumulative difference of precipitation and reference evapotranspiration (Fig. 3a) as well as the soil moisture obtained from the CRNS (Fig. 3b) and the soil moisture profiles (Fig. 3c). While the 2019 drought period was only captured in late summer with the launch of MqC, the droughts in 2020 and 2022 were covered in their full extent, starting already in May and ending in September.
The dynamics of the groundwater level data (Fig. 3d) are consistent with both the cumulative sum of P − ET0 and the soil moisture estimates. Specifically, the groundwater level at the foot of the hill (ID 2) shows distinct seasonal dynamics, with groundwater recharge typically starting in September. In August 2022, an exceptionally heavy rainfall event caused an immediate groundwater level response, which is discussed in Sect. 5.3 in further detail.
In February 2021, the CRNS-based soil moisture estimates (Fig. 3b) exhibited exceptionally high values. This was caused by a period of substantial snow cover, the only such episode in the study period. The effects of snow have not yet been corrected for in the CRNS-based soil moisture estimation. However, independent snow measurements (see Sect. 3.13) in space and time are available to explore options for estimating both soil moisture and snow water equivalent from CRNS data, for example, by exploiting thermal neutron counts.
5.2 Irrigation experiment
Figure 4 highlights the irrigation experiment that took place in July and August 2020. The upper four panels contrast snapshots of spatial soil moisture estimates from CRNS roving, UAS-based hyperspectral remote sensing, profile probes, and surface measurements. The different data density in space and time is apparent; however, in-depth intercomparisons of the different approaches could lead to more insights into their strengths and weaknesses.
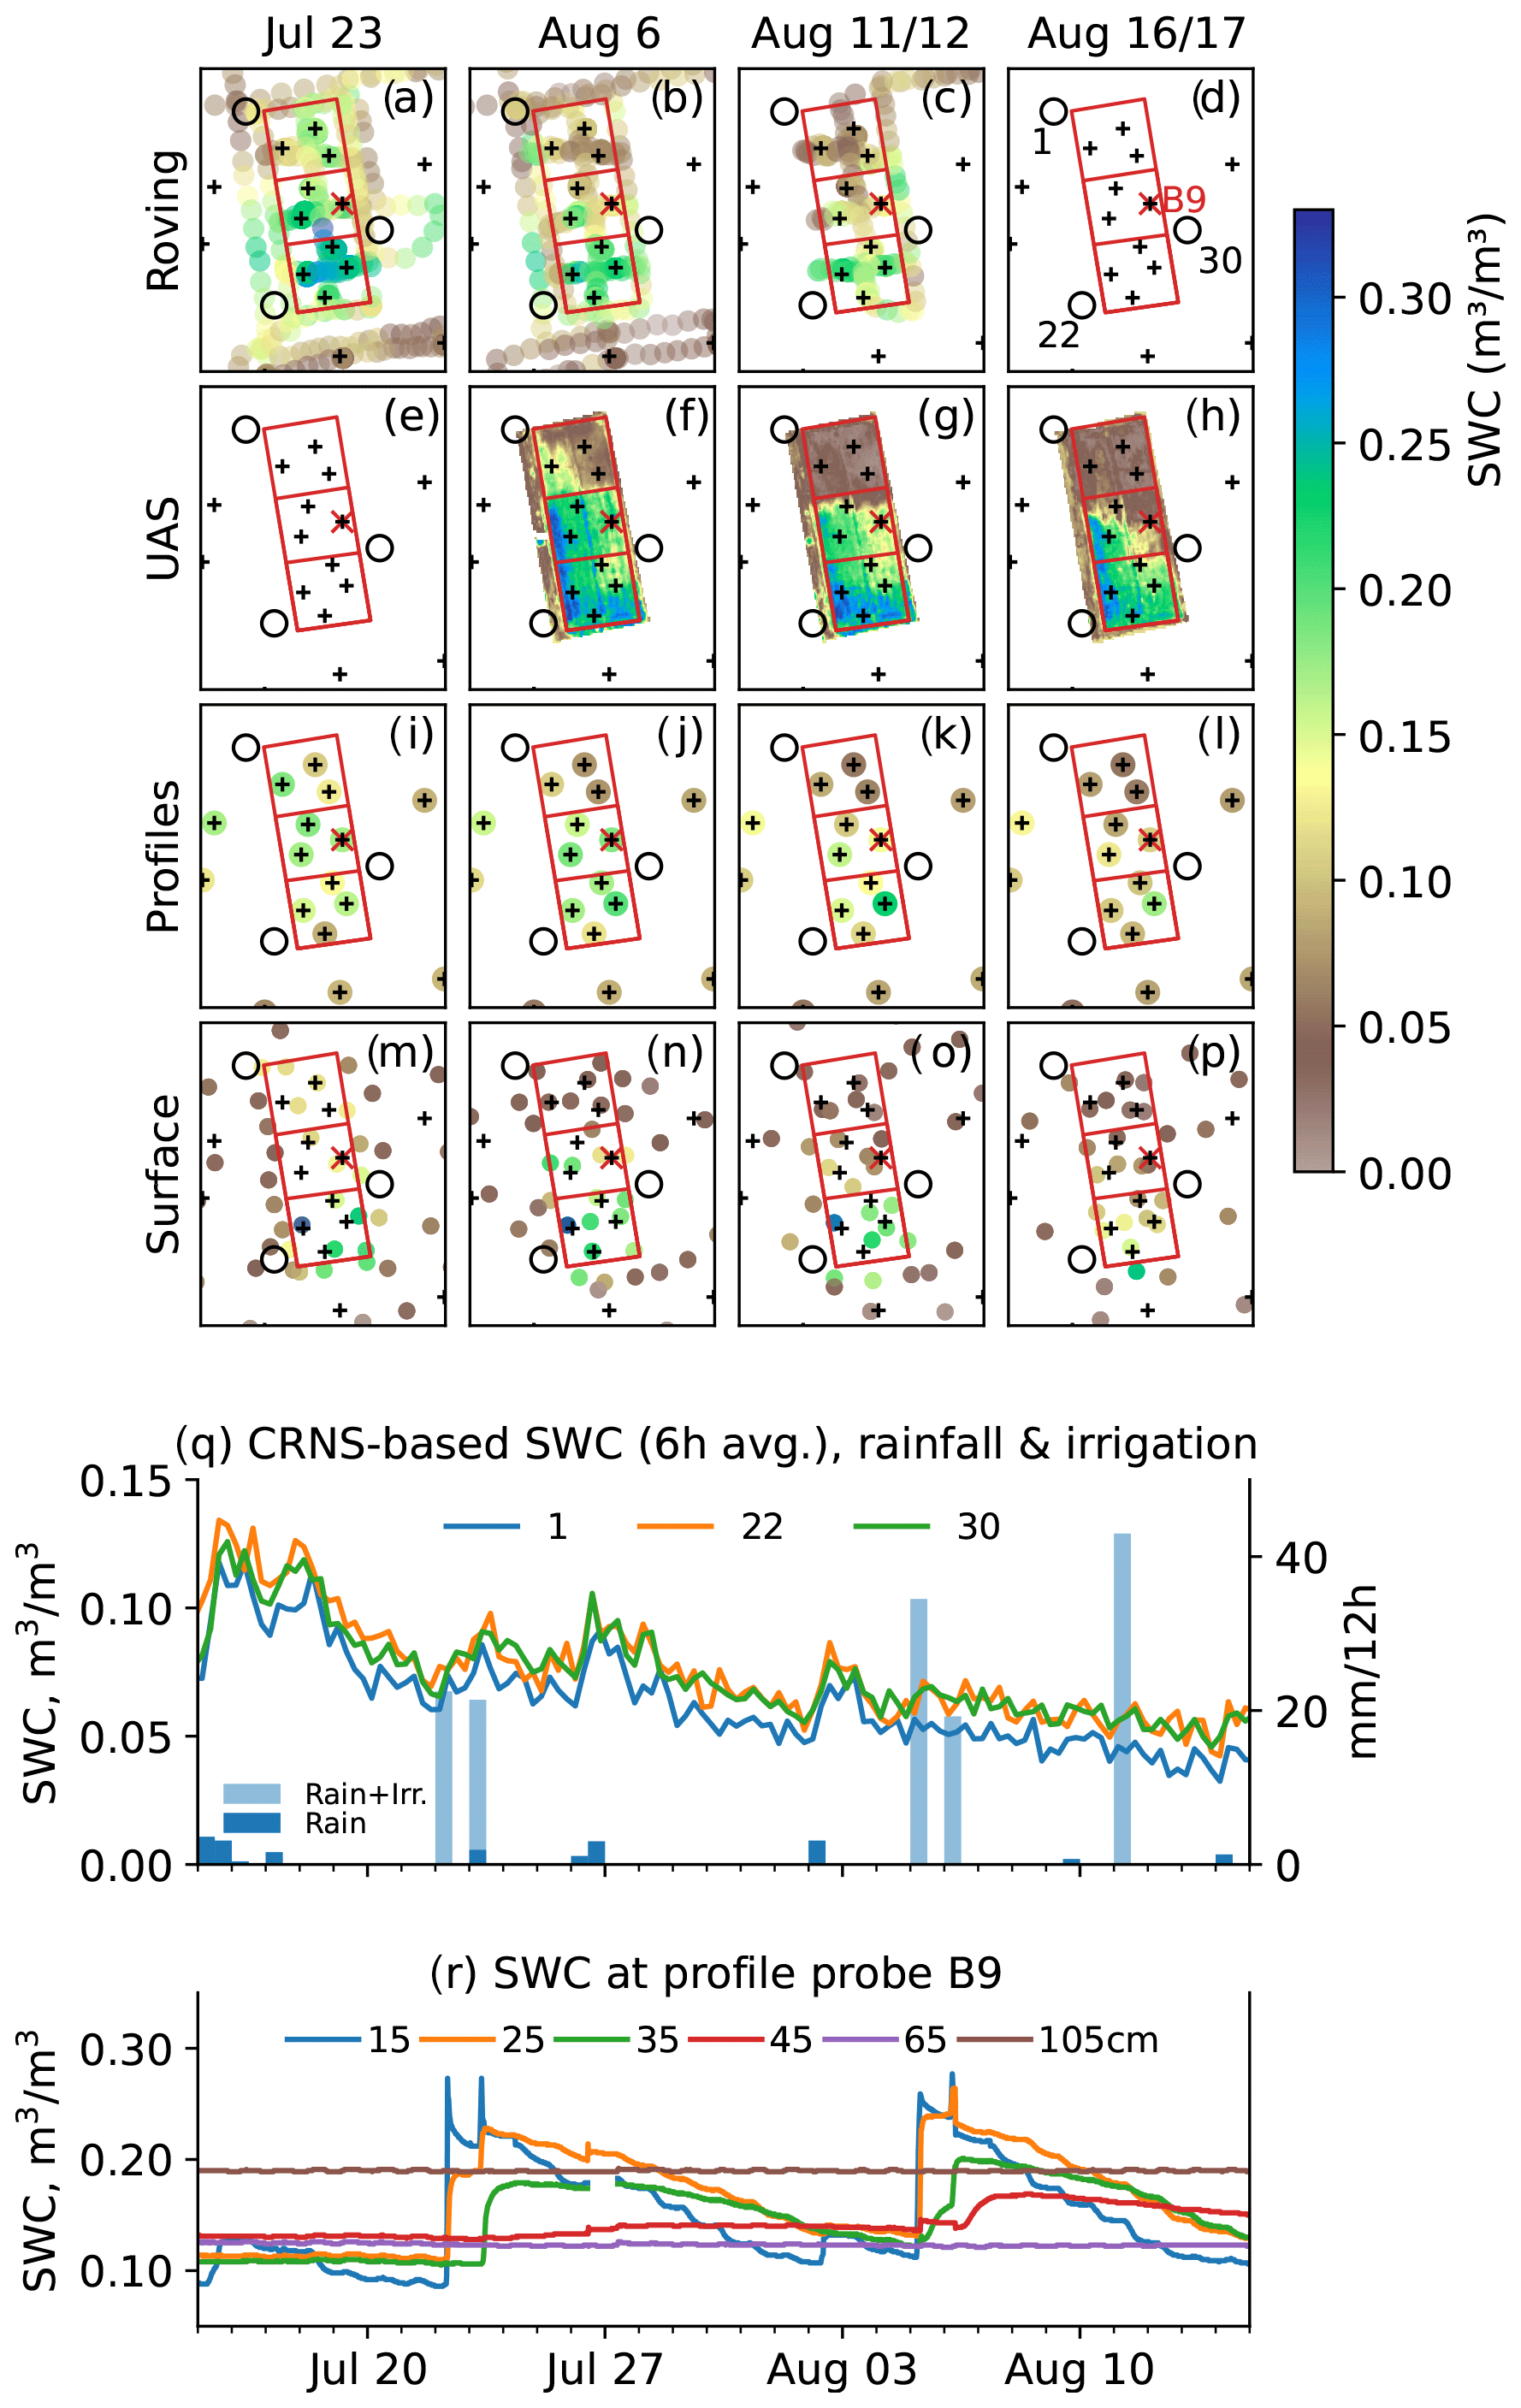
Figure 4Soil moisture observations and products during the irrigation experiment in July and August 2020. (a–d) CRNS roving; (e–h) hyperspectral UAS-imagery; (i–l) intermittent PR2 (impedance-based) profile measurements, averaged over the upper 40 cm; (m–p) intermittent ThetaProbe measurements at the soil surface; (q) stationary CRNS sensors, based on neutron counts average over 6 h intervals locations marked by black circles; and (r) stationary profile probe B9, location marked by red crosses in panels (a–p).
Figure 4q and r show the continuous records obtained from the closest three CRNS probes and one selected profile probe in the irrigated field (ID B9). The profile probe shows a clear response to the first and second irrigation pulse. As the third pulse only covered the southernmost third of the test area, it is not reflected in the profile probe. The irrigated volume of 40–50 mm affects soils moisture in the upper 30–40 cm, while it remains constant below 60 cm. The effects of the smaller rainfall events are merely captured by the uppermost sensor (15 cm).
In contrast, even small rainfall events caused remarkable rise in the CRNS-based soil moisture, demonstrating its pronounced sensitivity to changes in shallow soil depths. The neutron response to the irrigation, in turn, remains relatively small: even for the first irrigation event, the irrigated plot only constitutes a small fraction of the entire CRNS footprint. This becomes even more evident for the second and third irrigation events. Prospective research will show whether it is, despite this low signal-to-noise ratio, possible to resolve the sub-footprint heterogeneity introduced by irrigation (see also Brogi et al., 2022).
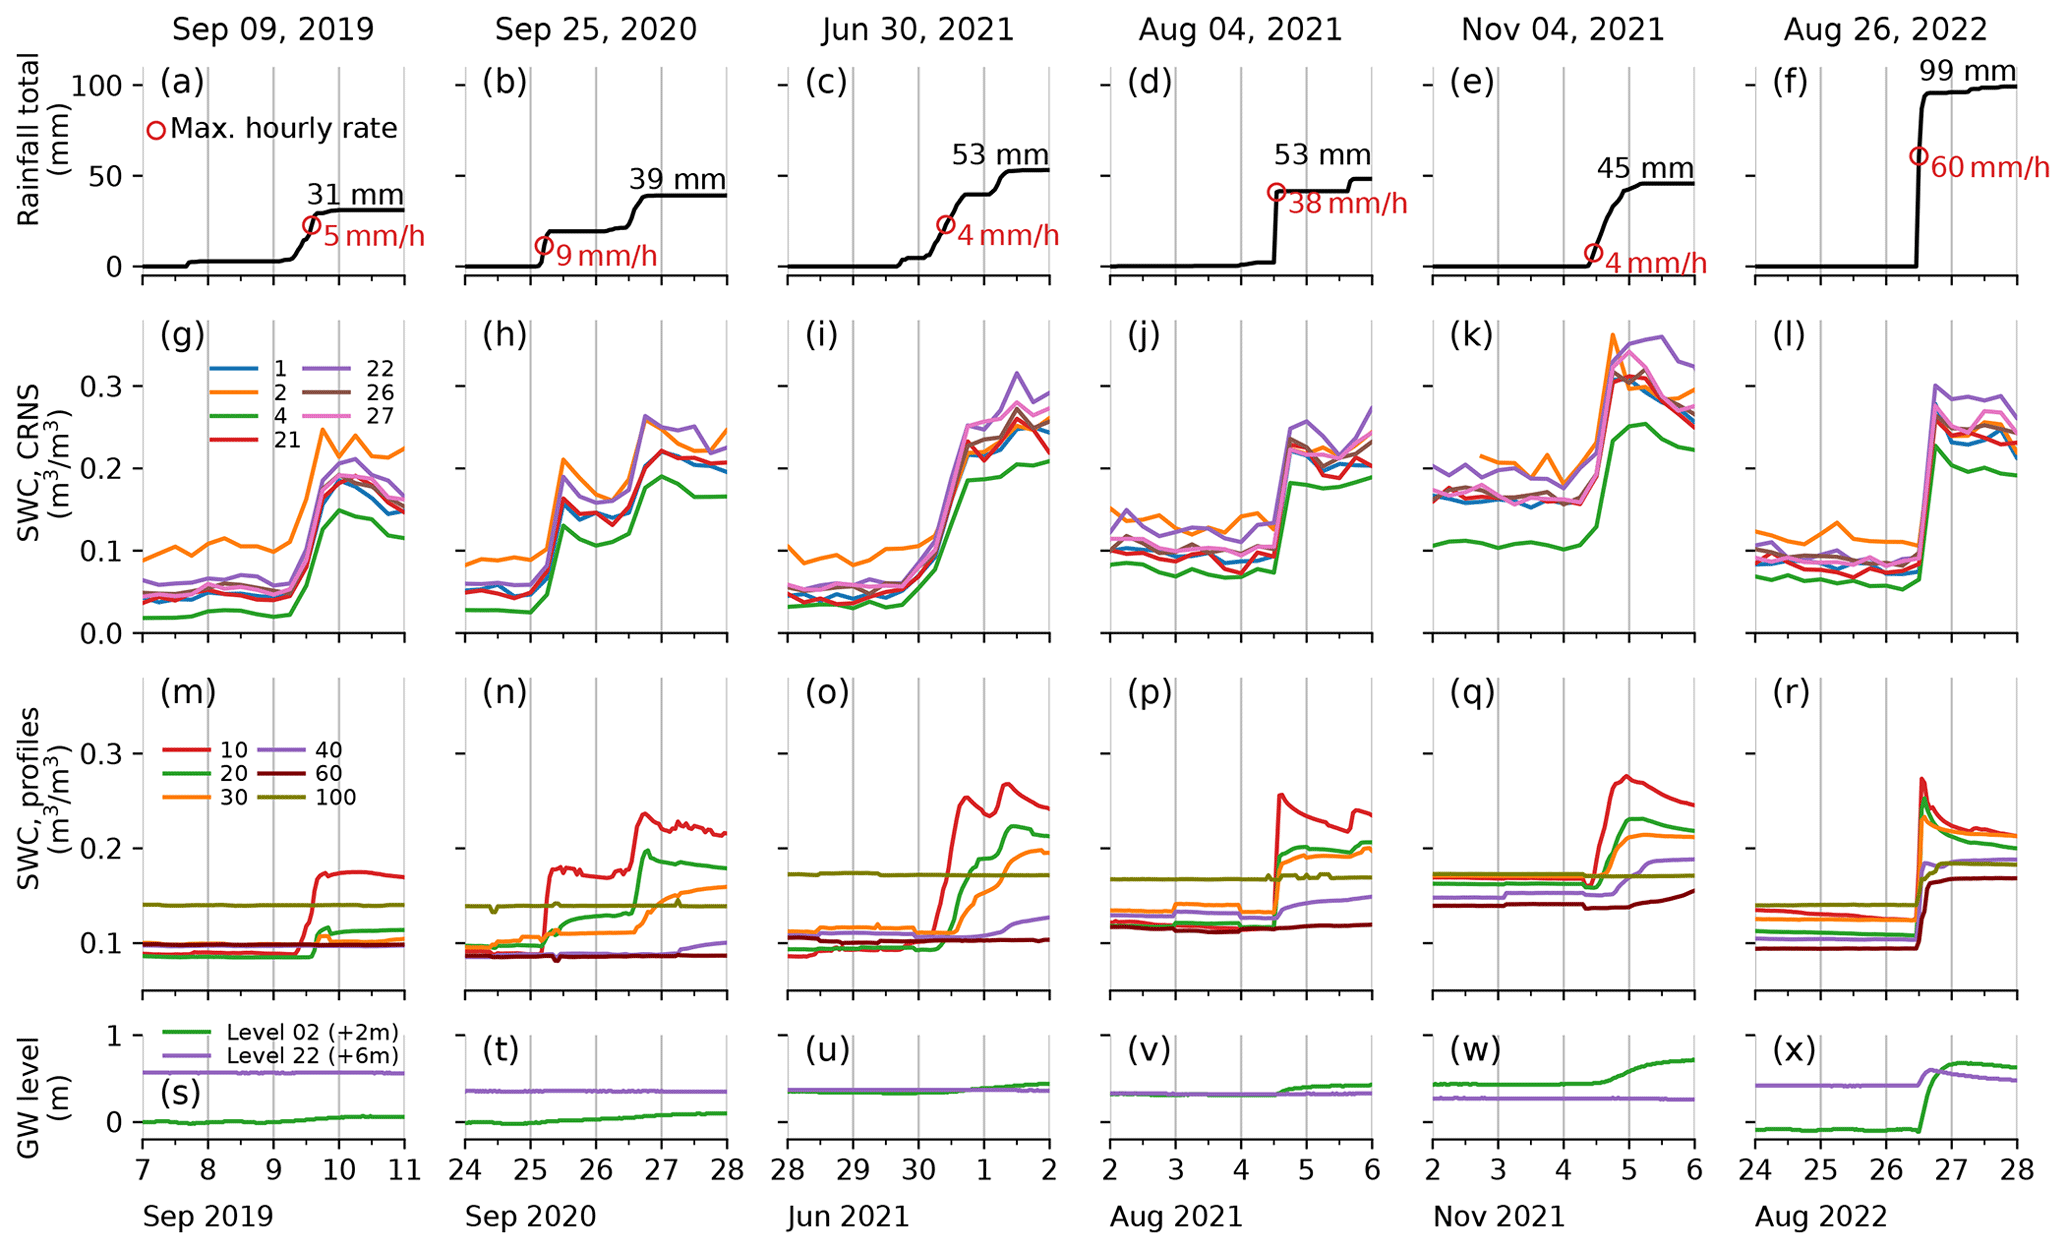
Figure 5The six events with the highest daily rainfall depths during the study period. (a–f) Cumulative hourly rainfall depth; (g–l) soil moisture from CRNS probes; (m–r) soil moisture from profile probes, averaged over all locations; and (s–x) groundwater (GW) levels.
5.3 Heavy rainfall
The observation period comprised six heavy rainfall events with daily totals over 30 mm (Fig. 5a–f), including an extreme event with almost 100 mm per day and a maximum hourly depth of 60 mm in August 2022 (Fig. 5f). Not surprisingly, all events are clearly shown in the signal of the CRNS sensors (Fig. 5g–l). The change in CRNS-based soil moisture not only depends on the total precipitation depth of the event but also on the effective event duration; for example, the short event on 4 August 2021 causes a smaller soil moisture change than the event on 30 June 2021, although the total depth of 53 mm is the same. Interestingly, the soil moisture differences between some CRNS locations can be subject to considerable intra-event dynamics. While sensor 2 tends to be the wettest location before the event, it often ranks closer to the median of the ensemble after the rainfall, while sensor 22 shows the opposite behaviour. It remains to be shown whether these changes are in fact caused by location-specific hydrological processes or whether they could also result from specific parameter constellations along the conversion from neutron count rates to volumetric soil moisture.
Figure 5m–r show the soil moisture profiles, averaged per measurement depth from 10 to 100 cm. Below 40 cm, there is usually no remarkable response of soil moisture during or immediately after a rain event. The event on 26 August 2022, however, shows a remarkable signal over all monitored depths. Furthermore, all depths from 10 to 100 cm respond almost immediately, which suggests fundamentally different processes of the vertical flow (similarly, but less pronounced, on 4 August 2021). The exceptional event on 26 August 2022 even propagates down to the groundwater table for both the uphill and the downhill groundwater level observations (Fig. 5x). Rainfall events of this magnitude could produce surface runoff at MqC; however, only sporadic visual evidence is available, for example, for the 26 August event.
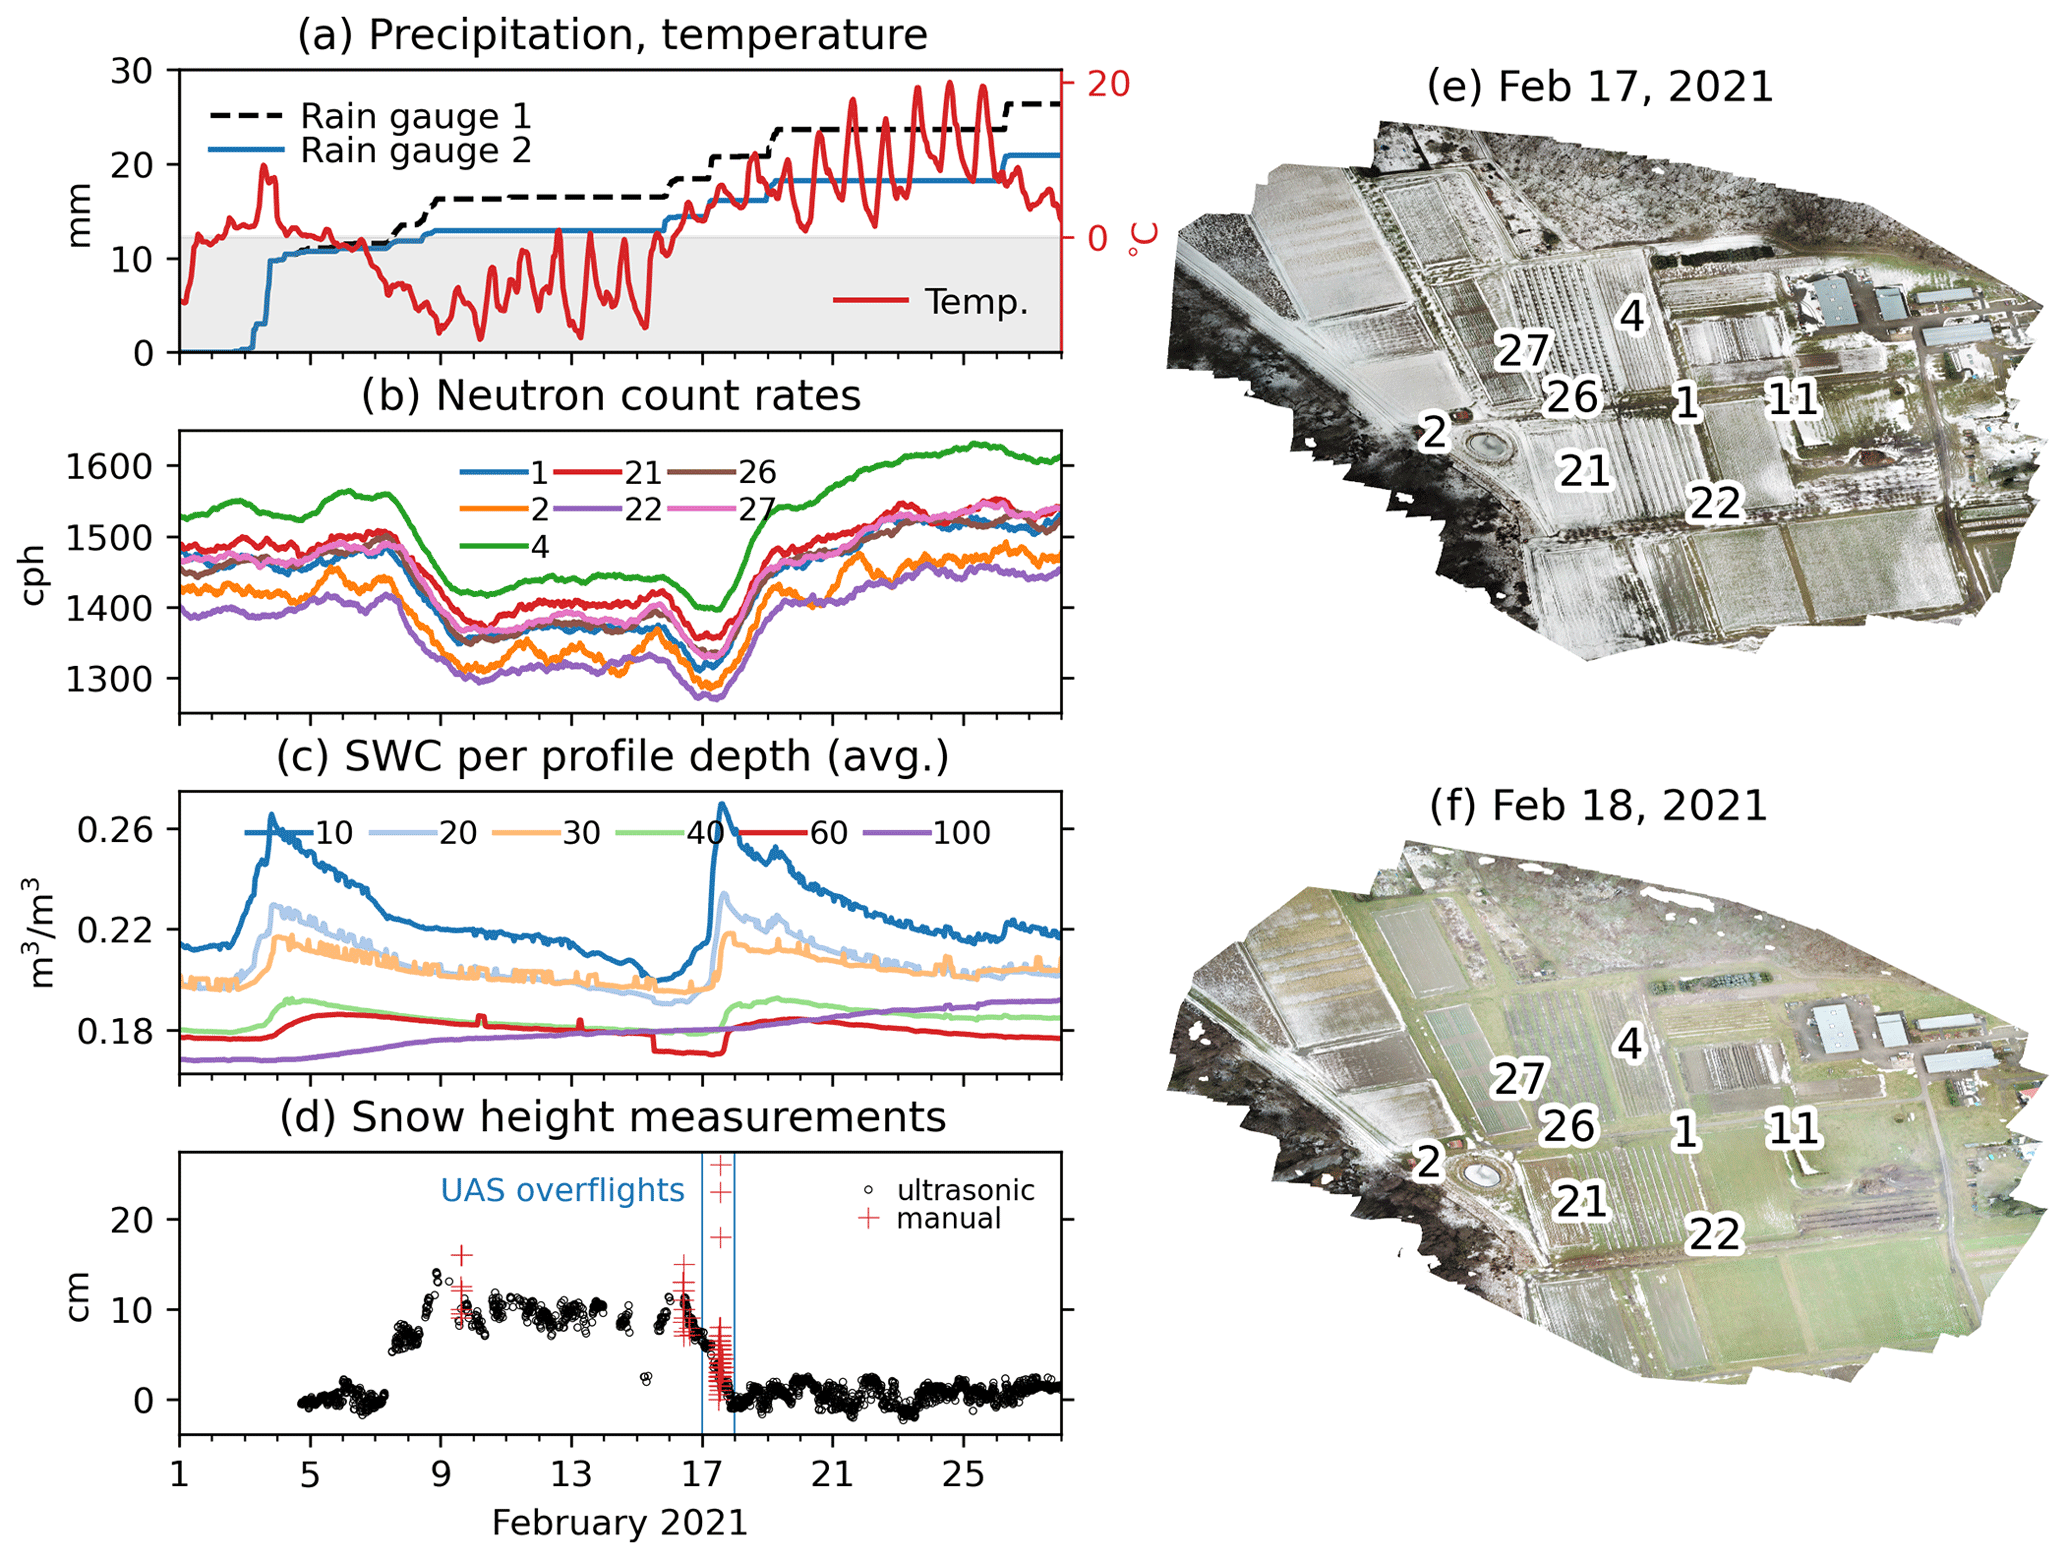
Figure 6Spatial and temporal patterns of snow occurrence in February 2020. (a) Time series of air temperature and cumulative precipitation (rain gauge 1 – weighing pluviometer installed for the snow period and rain gauge 2 – permanent pluviometric station installed at the Marquardt site); (b) corrected (pressure, humidity, incoming, biomass) epithermal neutron counts; (c) soil moisture from profile probes, averaged over all locations; (d) time series of snow depth from ultrasonic snow gauge and manual measurements; and (e, f) optical UAS-based imagery representing spatial snow heterogeneity during melting.
5.4 Snow
Figure 6 summarizes the data acquired during the snow monitoring phase in 2021. The snow cover formed when temperatures had dropped below zero, and precipitation started after 7 February. While the weighing-based pluviometer (rain gauge 1 in Fig 6a) recorded 5 mm, the permanent precipitation gauge (rain gauge 2) recorded significantly less, probably because of insufficient or malfunctioning heating and resulting from wind drift from the device (Fig. 6a). The resulting snow cover at the snow gauge peaked at around 10 cm (Fig. 6d), while the maxima at the snow stakes varied between 8 and 27 cm. The snow cover caused a marked decrease in the CRNS count rates (Fig. 6b). In contrast, the prior rainfall event (4 February), which yielded almost 4 times the precipitation height, resulted in a much lower reduction in the neutron counts. During the approximately 10 d of snow cover, snow depth, soil moisture (Fig. 6c), and neutron counts remained comparatively stable (except CRNS 2). This phase ended with a rapid thawing: the snow melted almost completely within less than 2 d (except for the western margins of the MqC and some leeward structures), resulting in another increase in soil moisture by melt water, very similar to the response of the prior rainfall event. The spatial heterogeneity of snow depth in the thawing phase is represented not only by manual measurements but also by two UAS-borne acquisitions of optical imagery on 17 and 18 February (Fig. 6e and f). Altogether, the comprehensive monitoring of a complete buildup and thawing cycle should provide an excellent research opportunity to investigate the interplay of vertical soil moisture distribution and snow cover on the CRNS signal.
The published data set is organized along instruments and observed variables and follows the structure of Sect. 3 of this paper (Table 4). Each subset of data is documented in a dedicated metadata file in json format. Format conventions follow Fersch et al. (2020) and Heistermann et al. (2022a) and are summarized in a readme file. We used EUDAT infrastructure, namely the services B2SHARE and B2HANDLE, in order to manage identifiers and guarantee long-term persistence. The repository's reference is https://doi.org/10.23728/b2share.551095325d74431881185fba1eb09c95 (Heistermann et al., 2022b).
Table 4Structure of the data repository and the relation of data subsets to the subsections of this paper.
From August 2019 to November 2022, eight CRNS sensors, 23 permanent and 4 temporary SWC profiles, two groundwater gauges, and one climate station were almost continuously operated in an area of 10 ha at an agricultural research site in Marquardt, Germany. If aggregated, the eight CRNS core sensors – some among the most sensitive ones available for stationary CRNS detectors – provide a neutron count rate about 37 times higher than the one of a conventional Hydroinnova CRS-1000 and hence a unique signal-to-noise ratio for continuous measurements at this spatial scale.
The core series were supplemented by a wide range of additional measurements:
-
Additional CRNS sensors and SWC profile measurements were implemented for shorter time periods (weeks to months). Some of these additional measurements aimed to cover, at least temporarily, additional locations or soil depths (e.g. during the irrigation experiment). Others were co-located with the core sensors in order to allow for instrument comparisons.
-
There were various intensive snapshot campaigns, including a large number of manual soil moisture measurements for ground truthing and soil mapping; CRNS roving and UAS-based hyperspectral remote sensing as part of an irrigation experiment; intensive monitoring and mapping of snow depth, density, and coverage; and biomass mapping in areas with an above-ground biomass density substantially higher than observed for field crops (orchards, poplar plantation, adjacent forests).
-
There were complementary time series of additional variables and sensor systems, including GNSS-R, tensiometers, and soil temperature sensors.
-
As part of the agricultural operations, there were detailed records of land use and irrigation management.
We extensively documented this data set and exemplarily highlighted various interesting features, including the representation of soil moisture from CRNS and profile probes during highly contrasting conditions such as drought, irrigation, heavy rainfall, and snow coverage. The long monitoring period of 3 years is a prerequisite to explore the sensor response to and the impact of such contrasting conditions with statistical significance.
This comprehensive data set provides the opportunity to investigate a diverse set of research problems, such as the following:
-
the effects of vertical and horizontal soil moisture on the CRNS signal, in combination with the effects of biomass heterogeneity and snow cover;
-
the retrieval of spatial soil moisture patterns from dense CRNS observations under consideration of different governing processes (irrigation, soil variability, cropping patterns) and with different levels of auxiliary data (e.g. CRNS roving, hyperspectral remote sensing, soil water modelling);
-
the response of different CRNS sensor types that were directly co-located (e.g. at location 11);
-
preferential and bypass flow as well as surface to groundwater connectivity under heavy rainfall conditions;
-
the potential of different sensor combinations to produce representative soil moisture estimates for heterogeneous landscapes, which could serve as a reference for remote sensing or hydrological modelling.
Consequently, the application of this data set is not limited to the CRNS community; it can also serve as a valuable resource to various neighbouring disciplines, including soil and groundwater hydrology, agriculture, remote sensing, and hydrological modelling. Currently, MqC is in the process of being extended: in addition to the dense core network of eight CRNS sensors, positions are being re-arranged, and up to eight additional sensors are in the process of being added to achieve a coverage of a total area of at least 0.5 km2. This modification also implies that November 2022 is a natural endpoint of the MqC data set in the configuration presented here.
TF, MH, LS, and SO designed the study and coordinated the instrumentation; TF and MH coordinated the data management and led the writing of the manuscript; TF processed the soil moisture and snow measurements; MH processed the CRNS data and prepared Figs. 2–6; LS processed the groundwater and soil hydraulic data; KDP processed the tensiometer profiles and quantified the biomass; CB was responsible for setting up and maintaining the instrumentation and supported the data management; MS designed the rover campaign and processed the rover data; BT co-designed the instrument network and provided data on land use, yields, and irrigation water use; DR and AG provided the data for the TDR-based soil moisture profiles; VD and MF provided the UAS-based hyperspectral data and related soil moisture products and LAI measurements; MK processed the data from the StyX sensors and supported their maintenance; LA developed the concept and implemented Fig. 1; NA processed the GNSS data; MZS supported the biomass quantification in the cherry and apple plantation; SO headed the MqC effort and is the principal investigator of this study; and all authors contributed to the writing and proofreading of the manuscript.
Markus Köhli holds a CEO position at Styx Neutronica GmbH.
Publisher's note: Copernicus Publications remains neutral with regard to jurisdictional claims in published maps and institutional affiliations.
We thank Marie-Therese Schmehl for helping with the processing of the snow cover imagery and a number of student assistants for acquiring field data. We gratefully acknowledge the support from Finapp S.r.l., Padova, Italy, for providing a FINAPP3 CRNS muon sensor for operation at the site.
This research has been supported by the Deutsche Forschungsgemeinschaft (research unit FOR 2694 “Cosmic Sense”, project number 357874777).
This paper was edited by Conrad Jackisch and reviewed by two anonymous referees.
Albert, K., Annighöfer, P., Schumacher, J., and Ammer, C.: Biomass equations for seven different tree species growing in coppice-with-standards forests in Central Germany, Scand. J. Forest Res., 29, 210–221, 2014. a
Annighöfer, P., Mölder, I., Zerbe, S., Kawaletz, H., Terwei, A., and Ammer, C.: Biomass functions for the two alien tree species Prunus serotina Ehrh. and Robinia pseudoacacia L. in floodplain forests of Northern Italy, Eur. J. For. Res., 131, 1619–1635, 2012. a
Baatz, R., Bogena, H. R., Hendricks-Franssen, H.-J., Huisman, J. A., Montzka, C., and Vereecken, H.: An empirical vegetation correction for soil water content quantification using cosmic ray probes, Water Resour. Res., 51, 2030–2046, https://doi.org/10.1002/2014WR016443, 2015. a
Baroni, G., Scheiffele, L. M., Schrön, M., Ingwersen, J., and Oswald, S. E.: Uncertainty, sensitivity and improvements in soil moisture estimation with cosmic-ray neutron sensing, J. Hydrol., 564, 873–887, https://doi.org/10.1016/j.jhydrol.2018.07.053, 2018. a, b
Blöschl, G. and Grayson, R.: Spatial Observations and Interpolation, in: Spatial Patterns in Catchment Hydrology – Observations and Modelling, chap. 2, edited by: Blöschl, G. and Grayson, R., Cambridge University Press, Cambridge, 17–50, ISBN 9780521633161, 2000. a
Bogena, H. R., Schrön, M., Jakobi, J., Ney, P., Zacharias, S., Andreasen, M., Baatz, R., Boorman, D., Duygu, M. B., Eguibar-Galán, M. A., Fersch, B., Franke, T., Geris, J., González Sanchis, M., Kerr, Y., Korf, T., Mengistu, Z., Mialon, A., Nasta, P., Nitychoruk, J., Pisinaras, V., Rasche, D., Rosolem, R., Said, H., Schattan, P., Zreda, M., Achleitner, S., Albentosa-Hernández, E., Akyürek, Z., Blume, T., del Campo, A., Canone, D., Dimitrova-Petrova, K., Evans, J. G., Ferraris, S., Frances, F., Gisolo, D., Güntner, A., Herrmann, F., Iwema, J., Jensen, K. H., Kunstmann, H., Lidón, A., Looms, M. C., Oswald, S., Panagopoulos, A., Patil, A., Power, D., Rebmann, C., Romano, N., Scheiffele, L., Seneviratne, S., Weltin, G., and Vereecken, H.: COSMOS-Europe: a European network of cosmic-ray neutron soil moisture sensors, Earth Syst. Sci. Data, 14, 1125–1151, https://doi.org/10.5194/essd-14-1125-2022, 2022. a
Brogi, C., Bogena, H. R., Köhli, M., Huisman, J. A., Hendricks Franssen, H.-J., and Dombrowski, O.: Feasibility of irrigation monitoring with cosmic-ray neutron sensors, Geosci. Instrum. Method. Data Syst., 11, 451–469, https://doi.org/10.5194/gi-11-451-2022, 2022. a
Brooks, R. H. and Corey, A. T.: Hydraulic properties of porous media, Hydrology Paper No. 3, Civil Engineering Department, Colorado State University, Fort Collins, CO, 1964. a
Chew, C. C., Small, E. E., Larson, K. M., and Zavorotny, V. U.: Effects of Near-Surface Soil Moisture on GPS SNR Data: Development of a Retrieval Algorithm for Soil Moisture, IEEE T. Geosci. Remote, 52, 537–543, https://doi.org/10.1109/TGRS.2013.2242332, 2014. a
Delta-T: User Manual for the Profile Probe type PR2 (PR2-UM-5.0), Tech. rep., Delta-T Devices Ltd., https://delta-t.co.uk/wp-content/uploads/2016/09/PR2_SDI-12-_User_Manual_version_4_1.pdf (last access: 30 June 2023), 2016. a
Desilets, D., Zreda, M., and Ferré, T. P. A.: Nature's neutron probe: Land surface hydrology at an elusive scale with cosmic rays, Water Resour. Res., 46, W11505, https://doi.org/10.1029/2009WR008726, 2010. a, b, c
Döpper, V., Rocha, A. D., Berger, K., Gränzig, T., Verrelst, J., Kleinschmit, B., and Förster, M.: Estimating soil moisture content under grassland with hyperspectral data using radiative transfer modelling and machine learning, Int. J. Appl. Earth Obs., 110, 102817, https://doi.org/10.1016/j.jag.2022.102817, 2022. a, b, c
Evans, J. G., Ward, H. C., Blake, J. R., Hewitt, E. J., Morrison, R., Fry, M., Ball, L. A., Doughty, L. C., Libre, J. W., Hitt, O. E., Rylett, D., Ellis, R. J., Warwick, A. C., Brooks, M., Parkes, M. A., Wright, G. M. H., Singer, A. C., Boorman, D. B., and Jenkins, A.: Soil water content in southern England derived from a cosmic-ray soil moisture observing system – COSMOS-UK, Hydrol. Process., 30, 4987–4999, https://doi.org/10.1002/hyp.10929, 2016. a
Fersch, B., Jagdhuber, T., Schrön, M., Völksch, I., and Jäger, M.: Synergies for Soil Moisture Retrieval Across Scales From Airborne Polarimetric SAR, Cosmic Ray Neutron Roving, and an In Situ Sensor Network, Water Resour. Res., 54, 9364–9383, https://doi.org/10.1029/2018wr023337, 2018. a
Fersch, B., Francke, T., Heistermann, M., Schrön, M., Döpper, V., Jakobi, J., Baroni, G., Blume, T., Bogena, H., Budach, C., Gränzig, T., Förster, M., Güntner, A., Hendricks Franssen, H.-J., Kasner, M., Köhli, M., Kleinschmit, B., Kunstmann, H., Patil, A., Rasche, D., Scheiffele, L., Schmidt, U., Szulc-Seyfried, S., Weimar, J., Zacharias, S., Zreda, M., Heber, B., Kiese, R., Mares, V., Mollenhauer, H., Völksch, I., and Oswald, S.: A dense network of cosmic-ray neutron sensors for soil moisture observation in a highly instrumented pre-Alpine headwater catchment in Germany, Earth Syst. Sci. Data, 12, 2289–2309, https://doi.org/10.5194/essd-12-2289-2020, 2020. a, b, c, d, e, f, g
Francke, T., Heistermann, M., Köhli, M., Budach, C., Schrön, M., and Oswald, S. E.: Assessing the feasibility of a directional cosmic-ray neutron sensing sensor for estimating soil moisture, Geosci. Instrum. Method. Data Syst., 11, 75–92, https://doi.org/10.5194/gi-11-75-2022, 2022. a
Gianessi, S., Polo, M., Stevanato, L., Lunardon, M., Francke, T., Oswald, S., Ahmed, H., Tolosa, A., Weltin, G., Dercon, G., Fulajtar, E., Heng, L., and Baroni, G.: Testing a novel sensor design to jointly measure cosmic-ray neutrons, muons and gamma rays for non-invasive soil moisture estimation, Geosci. Instrum. Method. Data Syst. Discuss. [preprint], https://doi.org/10.5194/gi-2022-20, in review, 2022. a, b, c
Hawdon, A., McJannet, D., and Wallace, J.: Calibration and correction procedures for cosmic-ray neutron soil moisture probes located across Australia, Water Resour. Res., 50, 5029–5043, https://doi.org/10.1002/2013WR015138, 2014. a
Heistermann, M., Francke, T., Schrön, M., and Oswald, S. E.: Spatio-temporal soil moisture retrieval at the catchment scale using a dense network of cosmic-ray neutron sensors, Hydrol. Earth Syst. Sci., 25, 4807–4824, https://doi.org/10.5194/hess-25-4807-2021, 2021. a, b
Heistermann, M., Bogena, H., Francke, T., Güntner, A., Jakobi, J., Rasche, D., Schrön, M., Döpper, V., Fersch, B., Groh, J., Patil, A., Pütz, T., Reich, M., Zacharias, S., Zengerle, C., and Oswald, S.: Soil moisture observation in a forested headwater catchment: combining a dense cosmic-ray neutron sensor network with roving and hydrogravimetry at the TERENO site Wüstebach, Earth Syst. Sci. Data, 14, 2501–2519, https://doi.org/10.5194/essd-14-2501-2022, 2022a. a, b, c, d, e, f, g, h, i, j, k
Heistermann, M., Francke, T., Scheiffele, L., Dimitrova Petrova, K., Budach, C., Schrön, M., Trost, B., Rasche, D., Güntner, A., Döpper, V., Förster, M., Köhli, M., Antonoglou, N., Angermann, L., Zude-Sasse, M., and Oswald, S. E.: Three years of observations from a dense CRNS cluster at an agricultural research site in north-east Germany), b2share EUDAT [data set], https://doi.org/10.23728/b2share.551095325d74431881185fba1eb09c95, 2022b. a, b
Iwema, J., Schrön, M., Koltermann Da Silva, J., Schweiser De Paiva Lopes, R., and Rosolem, R.: Accuracy and precision of the cosmic-ray neutron sensor for soil moisture estimation at humid environments, Hydrol. Process., 35, e14419, https://doi.org/10.1002/hyp.14419, 2021. a
Jackisch, C., Germer, K., Graeff, T., Andrä, I., Schulz, K., Schiedung, M., Haller-Jans, J., Schneider, J., Jaquemotte, J., Helmer, P., Lotz, L., Bauer, A., Hahn, I., Šanda, M., Kumpan, M., Dorner, J., de Rooij, G., Wessel-Bothe, S., Kottmann, L., Schittenhelm, S., and Durner, W.: Soil moisture and matric potential – an open field comparison of sensor systems, Earth Syst. Sci. Data, 12, 683–697, https://doi.org/10.5194/essd-12-683-2020, 2020. a
Jakobi, J., Huisman, J. A., Vereecken, H., Diekkrueger, B., and Bogena, H. R.: Cosmic Ray Neutron Sensing for Simultaneous Soil Water Content and Biomass Quantification in Drought Conditions, Water Resour. Res., 54, 7383–7402, https://doi.org/10.1029/2018WR022692, 2018. a, b
Jakobi, J., Huisman, J. A., Schrön, M., Fiedler, J., Brogi, C., Vereecken, H., and Bogena, H. R.: Error Estimation for Soil Moisture Measurements With Cosmic Ray Neutron Sensing and Implications for Rover Surveys, Frontiers in Water, 2, https://doi.org/10.3389/frwa.2020.00010, 2020. a, b
Klute, A. (Ed.): Water Retention: Laboratory Methods, in: Methods of Soil Analysis, section: 26, edited by: John Wiley & Sons, Ltd, 635–662, https://doi.org/10.2136/sssabookser5.1.2ed.c26, 1986. a
Klute, A. and Dirksen, C.: Hydraulic Conductivity and Diffusivity: Laboratory Methods, in: Methods of Soil Analysis, section: 28, John Wiley & Sons, Ltd, 687–734, https://doi.org/10.2136/sssabookser5.1.2ed.c28, 1986. a
Köhli, M., Schrön, M., and Schmidt, U.: Response functions for detectors in cosmic ray neutron sensing, Nucl. Instrum. Meth. A, 902, 184–189, https://doi.org/10.1016/j.nima.2018.06.052, 2018. a
Köhli, M., Weimar, J., Schrön, M., and Schmidt, U.: Moisture and humidity dependence of the above-ground cosmic-ray neutron intensity, Frontiers in Water, 2, 66, https://doi.org/10.3389/frwa.2020.544847, 2020. a, b
Kuai, J., Sun, Y., Zuo, Q., Huang, H., Liao, Q., Wu, C., Lu, J., Wu, J., and Zhou, G.: The yield of mechanically harvested rapeseed (Brassica napus L.) can be increased by optimum plant density and row spacing, Sci. Rep.-UK, 5, 18835, https://doi.org/10.1038/srep18835, 2015. a
Larson, K. M., Small, E. E., Gutmann, E., Bilich, A., Axelrad, P., and Braun, J.: Using GPS multipath to measure soil moisture fluctuations: initial results, GPS Solut., 12, 173–177, https://doi.org/10.1007/s10291-007-0076-6, 2008a. a, b
Larson, K. M., Small, E. E., Gutmann, E. D., Bilich, A. L., Braun, J. J., and Zavorotny, V. U.: Use of GPS receivers as a soil moisture network for water cycle studies, Geophys. Res. Lett., 35, L24405, https://doi.org/10.1029/2008GL036013, 2008b. a, b, c
Larson, K. M., Braun, J. J., Small, E. E., Zavorotny, V. U., Gutmann, E. D., and Bilich, A. L.: GPS multipath and its relation to near-surface soil moisture content, IEEE J. Sel. Top. Appl., 3, 91–99, https://doi.org/10.1109/JSTARS.2009.2033612, 2009. a, b
Larson, K. M., Braun, J. J., Small, E. E., Zavorotny, V. U., Gutmann, E. D., and Bilich, A. L.: GPS Multipath and Its Relation to Near-Surface Soil Moisture Content, IEEE J. Sel. Top. Appl., 3, 91–99, https://doi.org/10.1109/JSTARS.2009.2033612, 2010. a
McHale, M. R., Burke, I. C., Lefsky, M. A., Peper, P. J., and McPherson, E. G.: Urban forest biomass estimates: is it important to use allometric relationships developed specifically for urban trees?, Urban Ecosyst., 12, 95–113, 2009. a
Munns, R., Schmidt, S., Beveridge, C., and Mathesius, U.: Plants in Action, Edn. 2, Tech. rep., Australian Society of Plant Scientists, https://www.asps.org.au/plants-in-action-2nd-edition-pdf-files (last access: 24 July 2023), 2018. a
OpenStreetMap contributors: Planet dump retrieved from https://planet.osm.org, https://www.openstreetmap.org (last access: 9 January 2023), 2023. a, b
Patrignani, A., Ochsner, T. E., Montag, B., and Bellinger, S.: A Novel Lithium Foil Cosmic-Ray Neutron Detector for Measuring Field-Scale Soil Moisture, Frontiers in Water, 3, https://doi.org/10.3389/frwa.2021.673185, 2021. a
Peng, J., Albergel, C., Balenzano, A., Brocca, L., Cartus, O., Cosh, M. H., Crow, W. T., Dabrowska-Zielinska, K., Dadson, S., Davidson, M. W., de Rosnay, P., Dorigo, W., Gruber, A., Hagemann, S., Hirschi, M., Kerr, Y. H., Lovergine, F., Mahecha, M. D., Marzahn, P., Mattia, F., Musial, J. P., Preuschmann, S., Reichle, R. H., Satalino, G., Silgram, M., van Bodegom, P. M., Verhoest, N. E., Wagner, W., Walker, J. P., Wegmüller, U., and Loew, A.: A roadmap for high-resolution satellite soil moisture applications – confronting product characteristics with user requirements, Remote Sens. Environ., 252, 112162, https://doi.org/10.1016/j.rse.2020.112162, 2021. a
Peters, A. and Durner, W.: Simplified evaporation method for determining soil hydraulic properties, J. Hydrol., 356, 147–162, https://doi.org/10.1016/j.jhydrol.2008.04.016, 2008. a
Richter, W.: Einzelbaumbasierte Quantifizierung der oberirdischen Biomasse in zwei Obstkulturen (Prunus avium L. und Malus domestica Borkh.) am Standort Marquart, Bachelor's thesis, Universitaet Potsdam, Institut für Umweltwissenschaften und Geographie, https://doi.org/10.25932/publishup-50636, 2021. a
Rodriguez-Alvarez, N., Bosch-Lluis, X., Camps, A., Vall-Llossera, M., Valencia, E., Marchan-Hernández, J. F., and Ramos-Pérez, I.: Soil moisture retrieval using GNSS-R techniques: Experimental results over a bare soil field, IEEE T. Geosci. Remote, 47, 3616–3624, https://doi.org/10.1109/TGRS.2009.2030672, 2009a. a
Rodriguez-Alvarez, N., Monerris, A., Bosch-Lluis, X., Camps, A., Vall-Llossera, M., Marchan-Hernández, J. F., Ramos-Pérez, I., Valencia, E., Martínez-Fernández, J., Sanchez-Martin, N., Baroncini-Turricchid, G., and Pérez-Gutiérrez, C.: Soil moisture and vegetation height retrieval using GNSS-R techniques, in: 2009 IEEE International Geoscience and Remote Sensing Symposium, IEEE, 3, 869–872, https://doi.org/10.1109/IGARSS.2009.5417907, 2009b. a
Savitzky, A. and Golay, M. J. E.: Smoothing and differentiation of data by simplified least squares procedures, Anal. Chem., 36, 1627–1639, https://doi.org/10.1021/ac60214a047, 1964. a
Scheiffele, L. M., Baroni, G., Franz, T. E., Jakobi, J., and Oswald, S. E.: A profile shape correction to reduce the vertical sensitivity of cosmic-ray neutron sensing of soil moisture, Vadose Zone J., 19, e20083, https://doi.org/10.1002/vzj2.20083, 2020. a
Schindler, U. and Müller, L.: Simplifying the evaporation method for quantifying soil hydraulic properties, J. Plant Nutr. Soil Sc., 169, 623–629, https://doi.org/10.1002/jpln.200521895, 2006. a
Schrön, M., Zacharias, S., Köhli, M., Weimar, J., and Dietrich, P.: Monitoring Environmental Water with Ground Albedo Neutrons from Cosmic Rays, in: The 34th International Cosmic Ray Conference, SISSA Medialab, 236, p. 231, https://doi.org/10.22323/1.236.0231, 2016. a
Schrön, M., Köhli, M., Scheiffele, L., Iwema, J., Bogena, H. R., Lv, L., Martini, E., Baroni, G., Rosolem, R., Weimar, J., Mai, J., Cuntz, M., Rebmann, C., Oswald, S. E., Dietrich, P., Schmidt, U., and Zacharias, S.: Improving calibration and validation of cosmic-ray neutron sensors in the light of spatial sensitivity, Hydrol. Earth Syst. Sci., 21, 5009–5030, https://doi.org/10.5194/hess-21-5009-2017, 2017. a, b, c
Schrön, M., Rosolem, R., Köhli, M., Piussi, L., Schröter, I., Iwema, J., Kögler, S., Oswald, S. E., Wollschläger, U., Samaniego, L., Dietrich, P., and Zacharias, S.: Cosmic-ray Neutron Rover Surveys of Field Soil Moisture and the Influence of Roads, Water Resour. Res., 54, 6441–6459, https://doi.org/10.1029/2017WR021719, 2018. a, b, c, d
Schrön, M., Oswald, S. E., Zacharias, S., Kasner, M., Dietrich, P., and Attinger, S.: Neutrons on Rails: Transregional Monitoring of Soil Moisture and Snow Water Equivalent, Geophys. Res. Lett., 48, e2021GL093924, https://doi.org/10.1029/2021GL093924, 2021. a, b, c
Stevanato, L., Baroni, G., Oswald, S. E., Lunardon, M., Mares, V., Marinello, F., Moretto, S., Polo, M., Sartori, P., Schattan, P., and Rühm, W.: An Alternative Incoming Correction for Cosmic-Ray Neutron Sensing Observations Using Local Muon Measurement, Geophys. Res. Lett., 49, e2021GL095383, https://doi.org/10.1029/2021GL095383, 2022. a
Stöckle, C. O., Nelson, R., and Kemanian, A.: CropSyst, Tech. rep., Washington State University, http://modeling.bsyse.wsu.edu/CS_Suite_4/CropSyst/ (last access: 30 June 2023), 2022. a
Taes, D., Steduto, P., Hsiao, T. C., and Fereres, E.: FAO crop-water productivity model to simulate yield response to water, Annex 1: Crop parameters, Tech. rep., FAO, https://www.fao.org/aquacrop/resources/referencemanuals/en/ (last access: 30 June 2023), 2022. a
Tian, Z., Li, Z., Liu, G., Li, B., and Ren, T.: Soil water content determination with cosmic-ray neutron sensor: Correcting aboveground hydrogen effects with thermal/fast neutron ratio, J. Hydrol., 540, 923–933, https://doi.org/10.1016/j.jhydrol.2016.07.004, 2016. a
Topp, G. C., Davis, J. L., and Annan, A. P.: Electromagnetic determination of soil water content: Measurements in coaxial transmission lines, Water Resour. Res., 16, 574–582, https://doi.org/10.1029/WR016i003p00574, 1980. a
van de Koppel, J.: Accumulation of nutrients and biomass during primary succession and the effect of a shifting allocation pattern on a vegetation, PhD thesis, University of Groningen, the Netherlands, https://fse.studenttheses.ub.rug.nl/10009/ (last access: 30 June 2023), 1992. a
Vey, S., Güntner, A., Wickert, J., Blume, T., and Ramatschi, M.: Long-term soil moisture dynamics derived from GNSS interferometric reflectometry: a case study for Sutherland, South Africa, GPS Solut., 20, 641–654, https://doi.org/10.1007/s10291-015-0474-0, 2016. a
Virtanen, P., Gommers, R., Oliphant, T. E., Haberland, M., Reddy, T., Cournapeau, D., Burovski, E., Peterson, P., Weckesser, W., Bright, J., van der Walt, S. J., Brett, M., Wilson, J., Millman, K. J., Mayorov, N., Nelson, A. R. J., Jones, E., Kern, R., Larson, E., Carey, C. J., Polat, İ., Feng, Y., Moore, E. W., VanderPlas, J., Laxalde, D., Perktold, J., Cimrman, R., Henriksen, I., Quintero, E. A., Harris, C. R., Archibald, A. M., Ribeiro, A. H., Pedregosa, F., van Mulbregt, P., and SciPy 1.0 Contributors: SciPy 1.0: fundamental algorithms for scientific computing in Python, Nat. Methods, 17, 261–272, https://doi.org/10.1038/s41592-019-0686-2, 2020. a
Weimar, J., Köhli, M., Budach, C., and Schmidt, U.: Large-Scale Boron-Lined Neutron Detection Systems as a 3He Alternative for Cosmic Ray Neutron Sensing, Frontiers in Water, 2, 16, https://doi.org/10.3389/frwa.2020.00016, 2020. a
Wind, G. P.: Capillary conductivity data estimated by a simple method, in: Proceedings of Wageningen Syposium, June 1966, vol. 1, edited by: Rijtema, P. E. and Wassink, H., IASAH, Gentbrugge, Belgium, 181–191, 1968. a
Zavorotny, V. U., Larson, K. M., Braun, J. J., Small, E. E., Gutmann, E. D., and Bilich, A. L.: A physical model for GPS multipath caused by land reflections: Toward bare soil moisture retrievals, IEEE J. Sel. Top. Appl., 3, 100–110, https://doi.org/10.1109/JSTARS.2009.2033608, 2009. a
Zell, J.: Abbauraten von Fichtenholz (Picea abies (L.) Karst.): Bohrwiderstandsmessungen als neuer Ansatz zur Bestimmung des Totholzabbaus, einer wichtigen Größe im Kohlenstoffhaushalt mitteleuropäischer Wälder, Master thesis, Albert-Ludwigs-Universität Freiburg, Germany, http://webdoc.sub.gwdg.de/ebook/dissts/Freiburg/Zell2008.pdf (last access: 30 June 2023), 2008. a
Zreda, M., Desilets, D., Ferré, T. P. A., and Scott, R. L.: Measuring soil moisture content non-invasively at intermediate spatial scale using cosmic-ray neutrons, Geophys. Res. Lett., 35, L21402, https://doi.org/10.1029/2008GL035655, 2008. a, b
Zreda, M., Shuttleworth, W. J., Zeng, X., Zweck, C., Desilets, D., Franz, T., and Rosolem, R.: COSMOS: the COsmic-ray Soil Moisture Observing System, Hydrol. Earth Syst. Sci., 16, 4079–4099, https://doi.org/10.5194/hess-16-4079-2012, 2012. a