the Creative Commons Attribution 4.0 License.
the Creative Commons Attribution 4.0 License.
 | 20 Jul 2023
Spatial variability of Saharan dust deposition revealed through a citizen science campaign
Simon Gascoin
Marion Réveillet
Didier Voisin
François Tuzet
Laurent Arnaud
Mylène Bonnefoy
Montse Bacardit Peñarroya
Carlo Carmagnola
Alexandre Deguine
Aurélie Diacre
Lukas Dürr
Olivier Evrard
Firmin Fontaine
Amaury Frankl
Mathieu Fructus
Laure Gandois
Isabelle Gouttevin
Abdelfateh Gherab
Pascal Hagenmuller
Sophia Hansson
Hervé Herbin
Béatrice Josse
Bruno Jourdain
Irene Lefevre
Gaël Le Roux
Quentin Libois
Lucie Liger
Samuel Morin
Denis Petitprez
Alvaro Robledano
Martin Schneebeli
Pascal Salze
Delphine Six
Emmanuel Thibert
Jürg Trachsel
Matthieu Vernay
Léo Viallon-Galinier
Céline Voiron
Saharan dust outbreaks have profound effects on ecosystems, climate, human health, and the cryosphere in Europe. However, the spatial deposition pattern of Saharan dust is poorly known due to a sparse network of ground measurements. Following the extreme dust deposition event of February 2021 across Europe, a citizen science campaign was launched to sample dust on snow over the Pyrenees and the European Alps. This somewhat improvised campaign triggered wide interest since 152 samples were collected from the snow in the Pyrenees, the French Alps, and the Swiss Alps in less than 4 weeks. Among the 152 samples, 113 in total could be analysed, corresponding to 70 different locations. The analysis of the samples showed a large variability in the dust properties and amount. We found a decrease in the deposited mass and particle sizes with distance from the source along the transport path. This spatial trend was also evident in the elemental composition of the dust as the iron mass fraction decreased from 11 % in the Pyrenees to 2 % in the Swiss Alps. At the local scale, we found a higher dust mass on south-facing slopes, in agreement with estimates from high-resolution remote sensing data. This unique dataset, which resulted from the collaboration of several research laboratories and citizens, is provided as an open dataset to benefit a large community and to enable further scientific investigations. Data presented in this study are available at https://doi.org/10.5281/zenodo.7969515 (Dumont et al., 2022a).
- Article
(6852 KB) - Full-text XML
-
Supplement
(1113 KB) - BibTeX
- EndNote


Aeolian dust from the Sahara has a wide range of impacts on the Earth and society. For instance, airborne Saharan dust particles affect the Earth’s radiative budget, cloud formation, solar energy production, and air traffic (Rieger et al., 2017; Varga, 2020; Ginoux, 2017; Nickovic et al., 2021) and could also impact human health (Tobías and Stafoggia, 2020). Once deposited, Saharan dust particles also provide nutrients to marine, aquatic, and terrestrial ecosystems (Okin et al., 2004; Yu et al., 2015). Mountain regions are especially affected by the deposition of Saharan dust through several physical processes. Dust deposited on snow and ice modifies microbial abundance and diversity (Greilinger and Kasper-Giebl, 2021). Dust is also responsible for a darkening of snow- and ice-covered surfaces, which enhances the melting rates, leading to earlier meltwater runoff and the exposition of bare soil to the atmosphere (e.g. Skiles et al., 2018; He and He, 2022; Réveillet et al., 2022). Despite the episodic nature of dust outbreaks, a single event can have a major impact on snow cover duration. For instance, the dust deposition event that occurred in March 2018 over eastern Europe led to a shortening of the snow cover duration by 12 to 30 d (Dumont et al., 2020). Such an effect strongly depends on the deposited dust mass and the dust optical properties (Réveillet et al., 2022).
While dust characteristics are well monitored at a few specific sites, little is known about the spatial variability of dust deposition, especially in complex mountain terrains where measurements are scarce (Baladima et al., 2022; Pey et al., 2020). The physicochemical and optical properties of the dust particles are generally considered to be spatially homogeneous (Mărmureanu et al., 2019; Di Biagio et al., 2019). The mass of dust used in impact studies often originates from atmospheric models and is subject to significant uncertainties (Skiles and Painter, 2019). Indeed, dust deposition fluxes can differ by several orders of magnitude between models (Tuzet et al., 2019; Baladima et al., 2022). Finally, methods to estimate dust content on snow cover from satellite imagery are based on strong assumptions regarding the optical properties of dust particles, which are rarely supported by field data (Dumont et al., 2020) and are known to vary widely with the dust source region (Caponi et al., 2017; Skiles et al., 2018; He and He, 2022; Di Biagio et al., 2019).
In February 2021 (4 to 8 February and 18 to 25 February), two major Saharan dust outbreaks affected a large stretch of western Europe, turning the sky and the snow cover orange (Francis et al., 2022). Both events were associated with atmospheric rivers (Francis et al., 2022). The mass of dust deposited at the surface and the aerosol optical depth exceeded 2 standard deviations from the mean observed between 1980 and 2020 (Varga, 2020; Francis et al., 2022). The first event (4–8 February) was especially strong in terms of dust deposition in southern Europe and was widely reported in the media (see video supplement). The second event (18–25 February) transported dust as far as Scandinavia. Because these events occurred in winter, they represented a unique opportunity to study this phenomenon beyond conventional measurement networks. Indeed, the snow cover retained most of the dust particles and thus contained valuable information on the mass and type of the deposited dust even weeks after deposition (Tuzet et al., 2019). All this prompted us to organise a citizen science campaign to collect dust samples across the European Alps and the Pyrenees. The campaign was launched the day after the publication of the first photographs of orange snow in social media and lasted 4 weeks. The samples resulting from the first deposition event were analysed to determine the mass, size distribution, chemical composition, and optical properties of the dust. Several French news websites stated that the dust plume carried radionuclides from former French nuclear-weapon tests in the Sahara. We thus also performed radionuclide analysis on the samples to verify this claim. This study presents the citizen science campaign and the results of the sample analysis.
2.1 Citizen campaign
We initiated a citizen science campaign to collect samples of the orange snow on 6 February 2021, i.e. a day after the widespread deposition of orange dust on snow in the Pyrenees and the Alps. The sampling protocol was designed to be as simple as possible (Fig. 1). We asked participants to collect a snow sample of 10 × 10 cm2 area (or any known area) up to the depth of the entire dust layer and to report the location of the sampling site. We recommended that a photograph be taken of the sampling site with a smartphone to obtain the coordinates of the sampling site. The call was first posted on social media (Twitter, YouTube, and Facebook) and was quickly relayed by traditional media, mostly local newspapers, TV, and radio. Some people brought the samples directly to us in Toulouse or Grenoble; otherwise, we went to collect them. In any case, the snow was melted before reaching the laboratory.
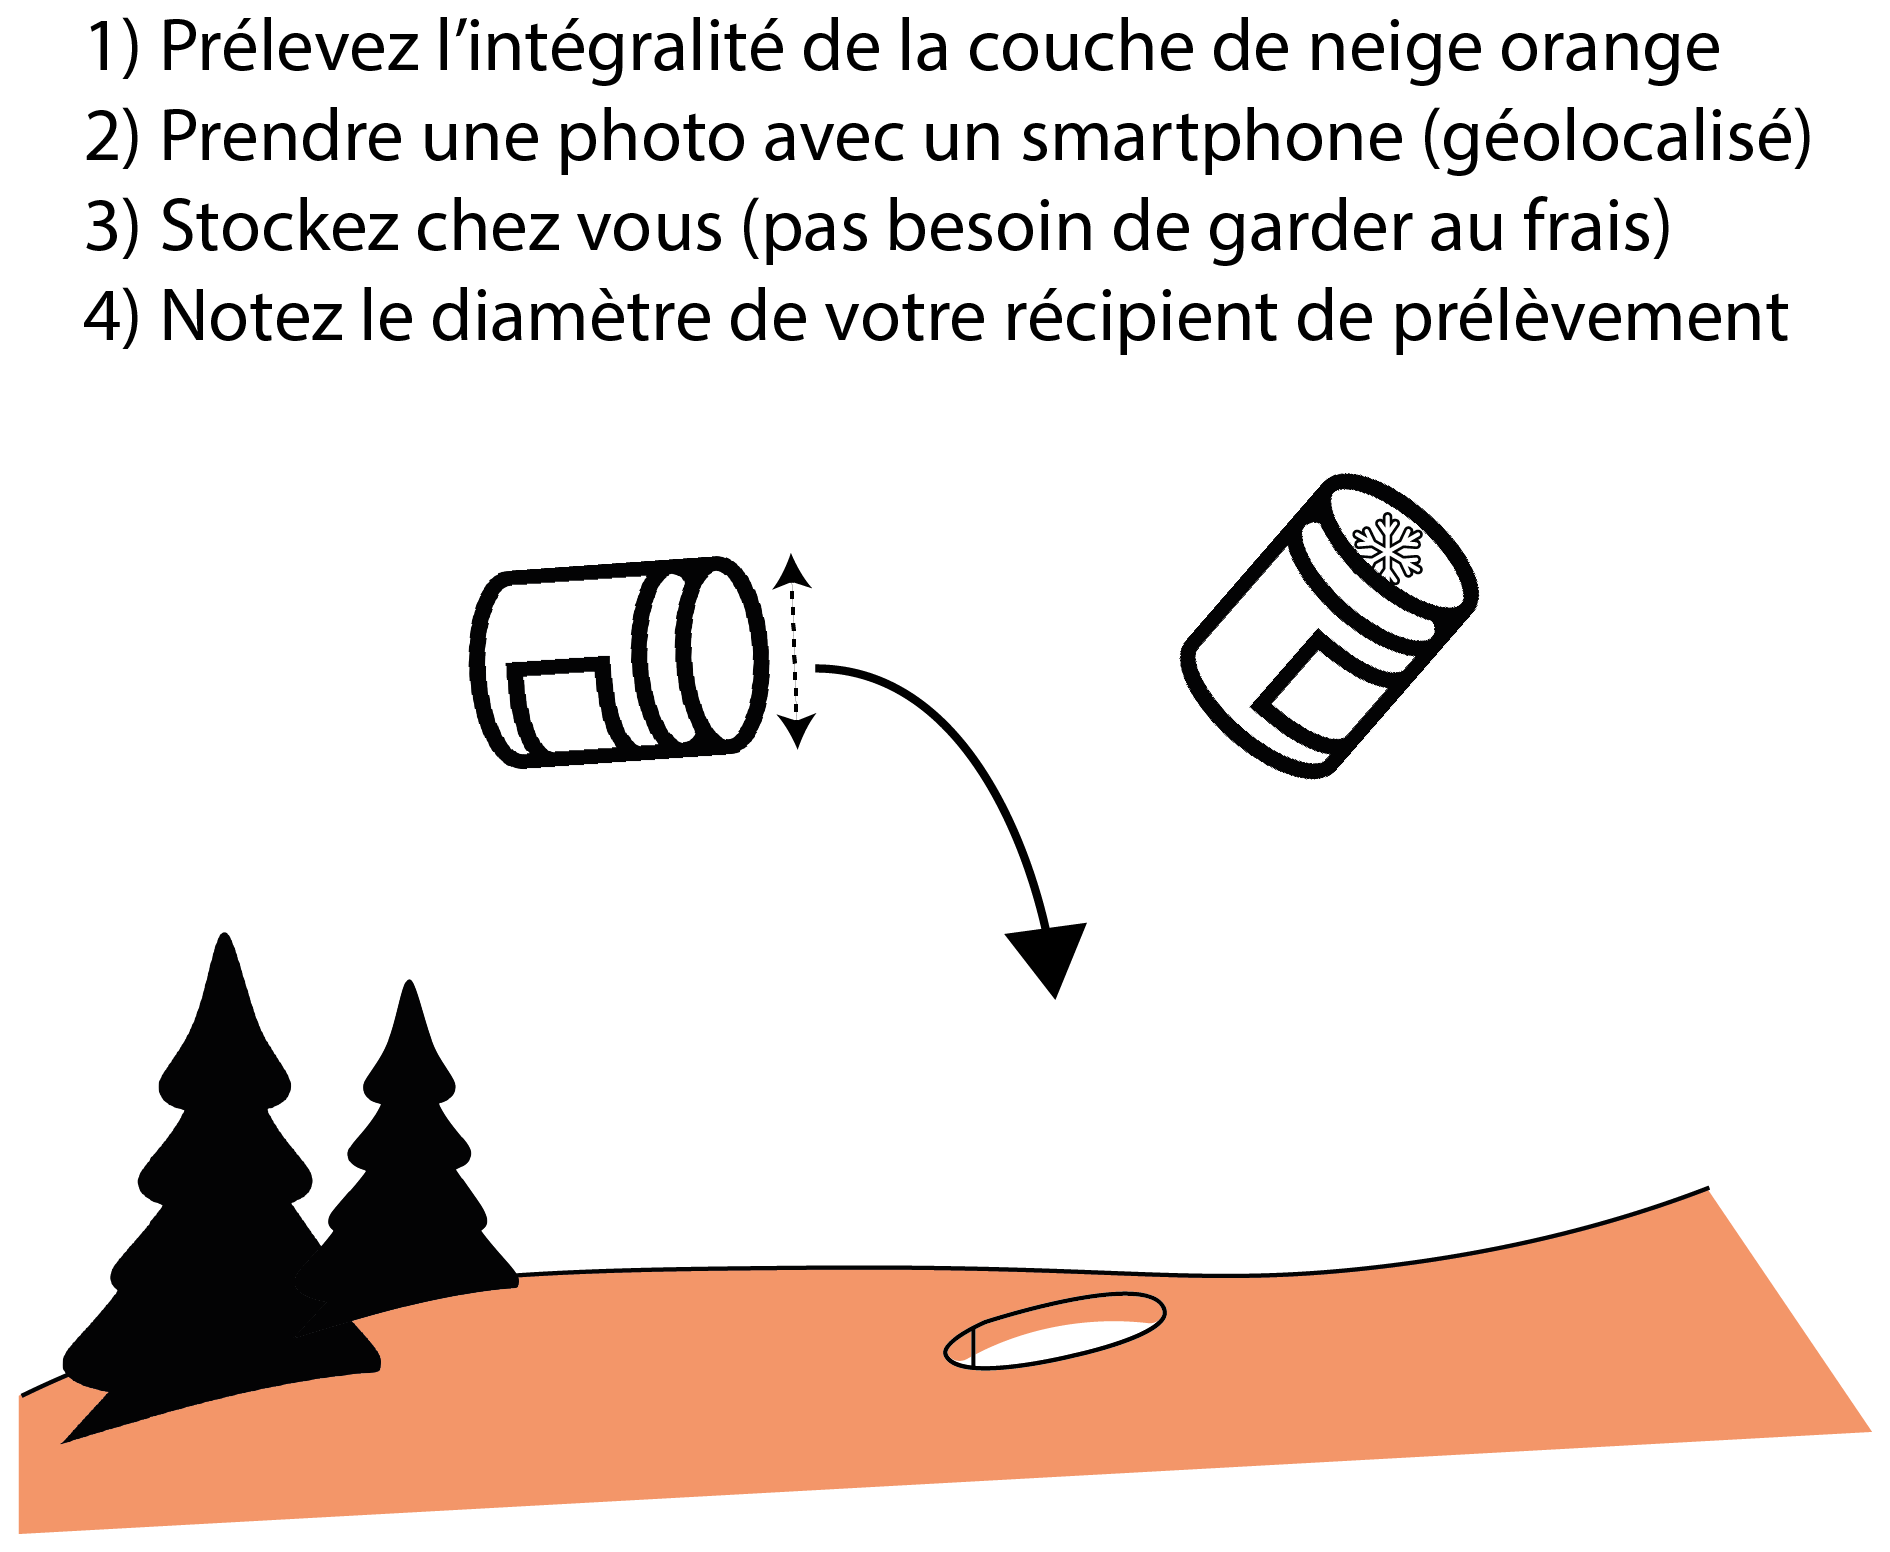
Figure 1Original picture of the sampling protocol as posted on Twitter (in French). Translation in English: (1) sample the whole layer of orange snow, (2) take a picture with a smartphone (geolocalised), (3) store the sample at home (no need to keep it cool), and (4) write down the diameter of the container.
2.2 Meteorological conditions
To characterise the meteorological conditions during the 4–8 February 2021 deposition event, we used simulations from the atmospheric transport model MOCAGE (Josse et al., 2004) and the SAFRAN meteorological reanalysis (Vernay et al., 2022). Deposition and meteorological conditions were analysed at three sites: Pic du Midi (42.84∘ N, 0.44∘ E) in the Pyrenees, Queyras (44.74∘ N, 6.82∘ E) in the southern Alps, and Chartreuse (45.29∘ N, 6.77∘ E) in the northern Alps. The dust load values were obtained using hourly dust deposition from MOCAGE. Dry and wet depositions were redistributed according to precipitation from the SAFRAN reanalysis. We further evaluated the accuracy of the total dust mass deposition from MOCAGE by comparison with the averaged measured mass of the three closest samples for each site. For the Chartreuse and Queyras locations, the three samples are within the grid size resolution of MOCAGE (i.e. 10 km). For the Pyrenees, samples are located 60 to 70 km away, and results must be taken with more caution. The three samples taken for each location covered different slope aspects. The three samples close to Pic du Midi also exhibited a larger spread in mass values that the samples for the two other locations.
2.3 Dust mass and size distribution
First, the samples were homogenised, and 5 mL of each sample was kept for size distribution analysis. The rest of the sample was vacuum filtered on 47 mm diameter pre-weighted polycarbonate membranes (pore size 0.45 µm), resulting in a ≈ 12.5 cm2 loaded area. Those membranes were then dried in a dessicator and weighted to provide the filtered dust mass. The analytical uncertainty of the measured dust mass is well within 5 % (lower than 2 % for 80 % of samples). The dust surface concentration then results from dividing the measured mass by the snow-sampled area, for which the uncertainty was not formally determined, so that 5 % is a lower estimate of the overall uncertainty for that measurement.
Dust size distributions were measured with a Coulter counter (multi-sizer IIe) following protocols adapted from Delmonte et al. (2004). The main adaptation concerns the measured size range, which was set to 4–120 µm by choosing a 200 µm measuring aperture. However, above ≈ 40–60 µm, depending on the sample's concentration, the size distributions measured with the Coulter counter suffer from poor counting statistics, as shown in Fig. 2. We thus determined for each sample a so-called cutoff diameter, which is the lowest diameter where no particle was detected in any of the three individual replicate measurements (see Fig. 2 for an example). This cutoff diameter (see Fig. S4 in the Supplement for values distribution) separates the lower part of the distribution, which is well measured (typically better than 10 % uncertainty), and the tail, which is highly uncertain, although it may represent a significant portion of the measured distribution (Fig. 2).
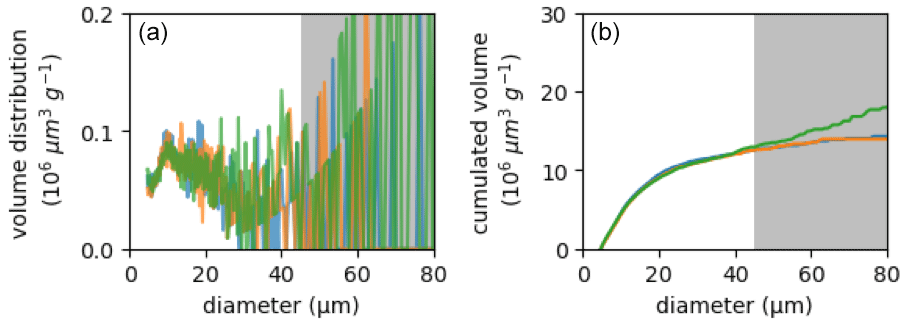
Figure 2Volume size distributions measured by the Coulter counter for a sample. (a) Differential distribution. (b) Cumulative distribution. The shaded area shows the poorly constrained part of the distribution, yet it may represent a significant part of the total volume. The three lines correspond to three measurements for this sample.
2.4 Elemental composition
Before the analysis of the elemental composition, a picture of the dried filters was taken using a Universal Serial Bus (USB) microscope for a visual inspection of the filters and the detection of potential contamination with anthropogenic fibres such as microplastic fibres from the clothes of the person in charge of the sampling. The elemental composition of the filters was determined using an X-ray fluorescence (XRF) analyser (Thermo Fisher Scientific™ Niton™ XL3t). The direct analysis of the filters with relatively thin dust layers (mass loads from 0.001 to 0.3 g) required the development of a specific calibration procedure provided with the dataset (see Data availability section). Standard reference materials, including loess soil RTH 912 and Saharan dust samples, were analysed both after the deposition of a thin layer on a filter and using the standard cup of the XRF analyser. Using these paired measurements, a calibration function was developed by regression for every element between the instrumental calibration for powdered rock measurements in the cup and the measurements of thin layers in filters. Satisfactory results were obtained for Al, Ca, K, Ti, Fe, P, Mn, Si, Rb, As, Pb, V, Cu, and Sr. The calibration function is provided along with the dataset. However, most of the concentrations were below the quantification limits for Rb, As, Pb, V, and Cu. In addition, we also calculated the and ratios and the mass fraction of Fe since these values were used in previous studies to determine the source region of the dust (Caponi et al., 2017).
2.5 Optical properties
For the analysis of optical properties, two specific samples were taken to ensure that a sufficient dust mass was available. We took two additional samples at a similar elevation of 2100 m near Pic du Midi de Bigorre in the Pyrenees and Col du Lautaret in the Alps.
The experimental setup used is extensively described by Hubert et al. (2017), and only a summary of the method is provided hereafter. A few tens of milligrams of dust were introduced into a vessel glass, in which continuous mechanical agitation was maintained using a magnetic stirrer. By means of a continuous flow (≈ 2 L min−1) of pure nitrogen, particles were carried through the multipass cell of a Fourier transform infrared spectrometer (Thermo Fisher Scientific™ iS50) to record the extinction spectra in the spectral range of 650–4000 cm−1 with a resolution of 1 cm−1. To measure the size distribution of the particles over a larger range than that measured using the Coulter analyser, the flow was split into two parts at the exit of the infrared cell: one part was directed to a scanning mobility particle sizer (TSI™ 3936L75), which measures the particle number concentration as a function of the electric mobility diameter from 14.6 to 661 nm (64 bins/decade); and the second part was directed to an aerodynamic particle sizer (TSI™ 3321), which measures the particle number concentration as a function of the aerodynamic diameter from 0.542 to 20 µm (32 bins per decade). The size distributions of the two samples of interest are reported in Fig. S1, assuming that the electric mobility diameter is equal to the geometric diameter (dg) and converting the aerodynamic diameter (da) measured by the aerodynamic particle sizer into dg using Eq. (1) (DeCarlo et al., 2004):
where dg and da are the geometric and aerodynamic diameters, respectively; χ is the dynamic shape factor (we assume χ ≈ 1); ρ0 is the standard density of water (1 g cm−3) and the mean density of Saharan particles, ρp = 2.7 g cm−3 (Schladitz et al., 2009). Then, each experimental size distribution was adjusted by a unimodal log-normal distribution whose number concentration, mean diameter, and geometric standard deviation are N= 8800 cm−3, µm, and σg=1.71 for the Lautaret sample and N=3680 cm−3, µm, and σg=1.77 for the Pic du Midi sample. These parameters are associated with the particle size distributions of dust travelling in the cell and not those of the bulk sample for which the coarse particles (typically >3µm; see Sect. 2.3) are not resuspended in our experiment or are quickly deposited following sedimentation.
After purging the whole setup with pure nitrogen, the extinction spectrum in the infrared domain, , was recorded, where and are the signals recorded with and without particles, respectively.
The mass extinction efficiency (MEE, in m2 g−1) at a given wavenumber, , is defined as the ratio of the particles' light extinction coefficient (bext, in m−1) to the mass concentration (c, in g m−3) of the particles as follows:
where bext was calculated as the ratio of the measured extinction spectrum Γsample to the optical path length (10 m in this study).
2.6 Radionuclide analyses
The filters with the highest dust load (ca. 0.1–0.3 g) were analysed using ultralow background germanium hyper-pure gamma spectrometry detectors installed in the underground facilities at University Paris-Saclay (Gif-sur-Yvette) and Modane (Underground Lab of Modane, France). To obtain sufficient counting statistics, filters were analysed for ca. 2 × 10⁵ s, approximately 2 d. The results obtained on the most heavily loaded filter (ALP-34-FE; 0.3 g of dust) and those obtained on a filter prepared with a similar quantity (0.3 g) of IAEA-444 soil-certified material were compared. All results were expressed in becquerels per kilogram, with activities decay-corrected to the sampling date. In addition to artificial 137Cs (detected at 662 keV), natural-fallout-radionuclide activities (i.e. 7Be at 477 keV and 210Pb at 46 keV) were also quantified; 210Pbbxs activities (representing the atmospheric fraction of 210Pb alone) were calculated by subtracting the supported activity (determined using two 226Ra daughters, 214Pb (average count number at 295.2 and 351.9 keV), and 214Bi, 609.3 keV) from the total 210Pb activity.
To obtain larger quantities of radionuclide fallout, we performed two specific samplings in regions with significant deposition levels in early March 2021 (i.e. in addition to the samples from the citizen science campaign, Table 1). The samples consist of dust from the two dust episodes that took place in February 2021. Initially, we sampled dust layers at the surface of the snow cover randomly, but this yielded too little material (< 1 g per 20 L of snow). Therefore, we specifically collected dust that accumulated in the hollows that formed at the surface of the snow cover as a result of meltwater runoff. To select suitable sampling locations, we closely investigated the surface of snow patches and excluded areas where autochthonous sediment (i.e. produced within the catchment from runoff, mass movements, etc.) was present as this would contaminate the allochthonous dust from the Sahara. This sampling was performed during the late snowmelt period (22–31 May 2021) at two snow patches (locations: 42.903119∘ N, 0.122031∘ E and 42.902679∘ N, 0.137037∘ E – Barèges, Pyrenees, France). Dust was collected using a shovel and stored in a fridge box for transportation. In the laboratory, the snow was melted in the spring sun, and clear water was poured off after the dust settled on the bottom of the refrigerator box. The remaining water was boiled until the dust was dry. We needed approximately 60 L of snow to collect 13 g of dust. This sample was prepared in a standard container for gamma spectrometry and analysed similarly for 137Cs, 7Be, and 210Pb, as for the abovementioned filters. As a sufficient quantity was available for this later sample, it was also analysed for plutonium contents and isotopic ratios (239Pu, 240Pu, 241Pu, and 242Pu) at CEA, Arpajon, France, after radiochemical preparation and MC-ICP-MS measurements following all the methods detailed in Evrard et al. (2014) to gain additional insights into the potential sources of these radionuclides given the public debate raised regarding the origin of 137Cs and potentially the other artificial radionuclides found in the dust (Berger, 2021).
2.7 Satellite data
A multispectral image was captured by Sentinel-2B on 6 February 2021 at 10:49 UTC over the Pyrenees, i.e. the morning just after the dust deposition. In this image, we selected the only clear-sky area of 1150 km2 spanning the snow-covered massifs of Tabe and Vicdessos. Then, we selected the same region in the Sentinel-2A image that was captured 5 d later on 11 February 2021 (Fig. 3). We chose this image because fresh snowfall occurred between the two dates. This allowed us to consider the 11 February image as a reference to remove the effect of the topography on the reflectance of the 6 February image (as done by Dumont et al., 2020). This terrain normalisation was performed using band 3 (green), and the dust content (dust concentration in ppm) was computed using band 8 (near infrared) following Eq. (1) in Dumont et al. (2020).
We performed this analysis with level-2A surface reflectance products processed with the MAJA (Maccs-Atcor Joint Algorithm) atmospheric-correction and cloud-screening software (Hagolle et al., 2015, 2017). We used the snow maps derived from the same Sentinel-2 images to exclude from the analysis the pixels that were not covered by snow in both images (data available from Gascoin et al., 2019). These snow maps were computed at a spatial resolution of 20 m and then resampled to 10 m with the nearest-neighbour method to match the resolutions of band 3 and 8.
We studied the spatial variability of the resulting satellite-derived dust content, grouping the pixel values by topographic aspect classes to compare it with the spatial distribution obtained from the in situ samples.
The dust concentration retrievals from Sentinel-2 were computed in terms of mass fraction (mass mixing ratio, Flanner et al., 2021), whereas the analysis of the samples provided the total dust mass per unit area. To compare the same physical quantity between satellite retrievals and in situ samples, the snow density and the vertical profile of dust concentration should be known. In the absence of field observations, the estimation of such parameters would require additional modelling work, which is outside the scope of this article. Therefore, we limited our analysis to the comparison of the spatial variability of the dust concentrations from Sentinel-2 with the dust mass from the in situ samples.
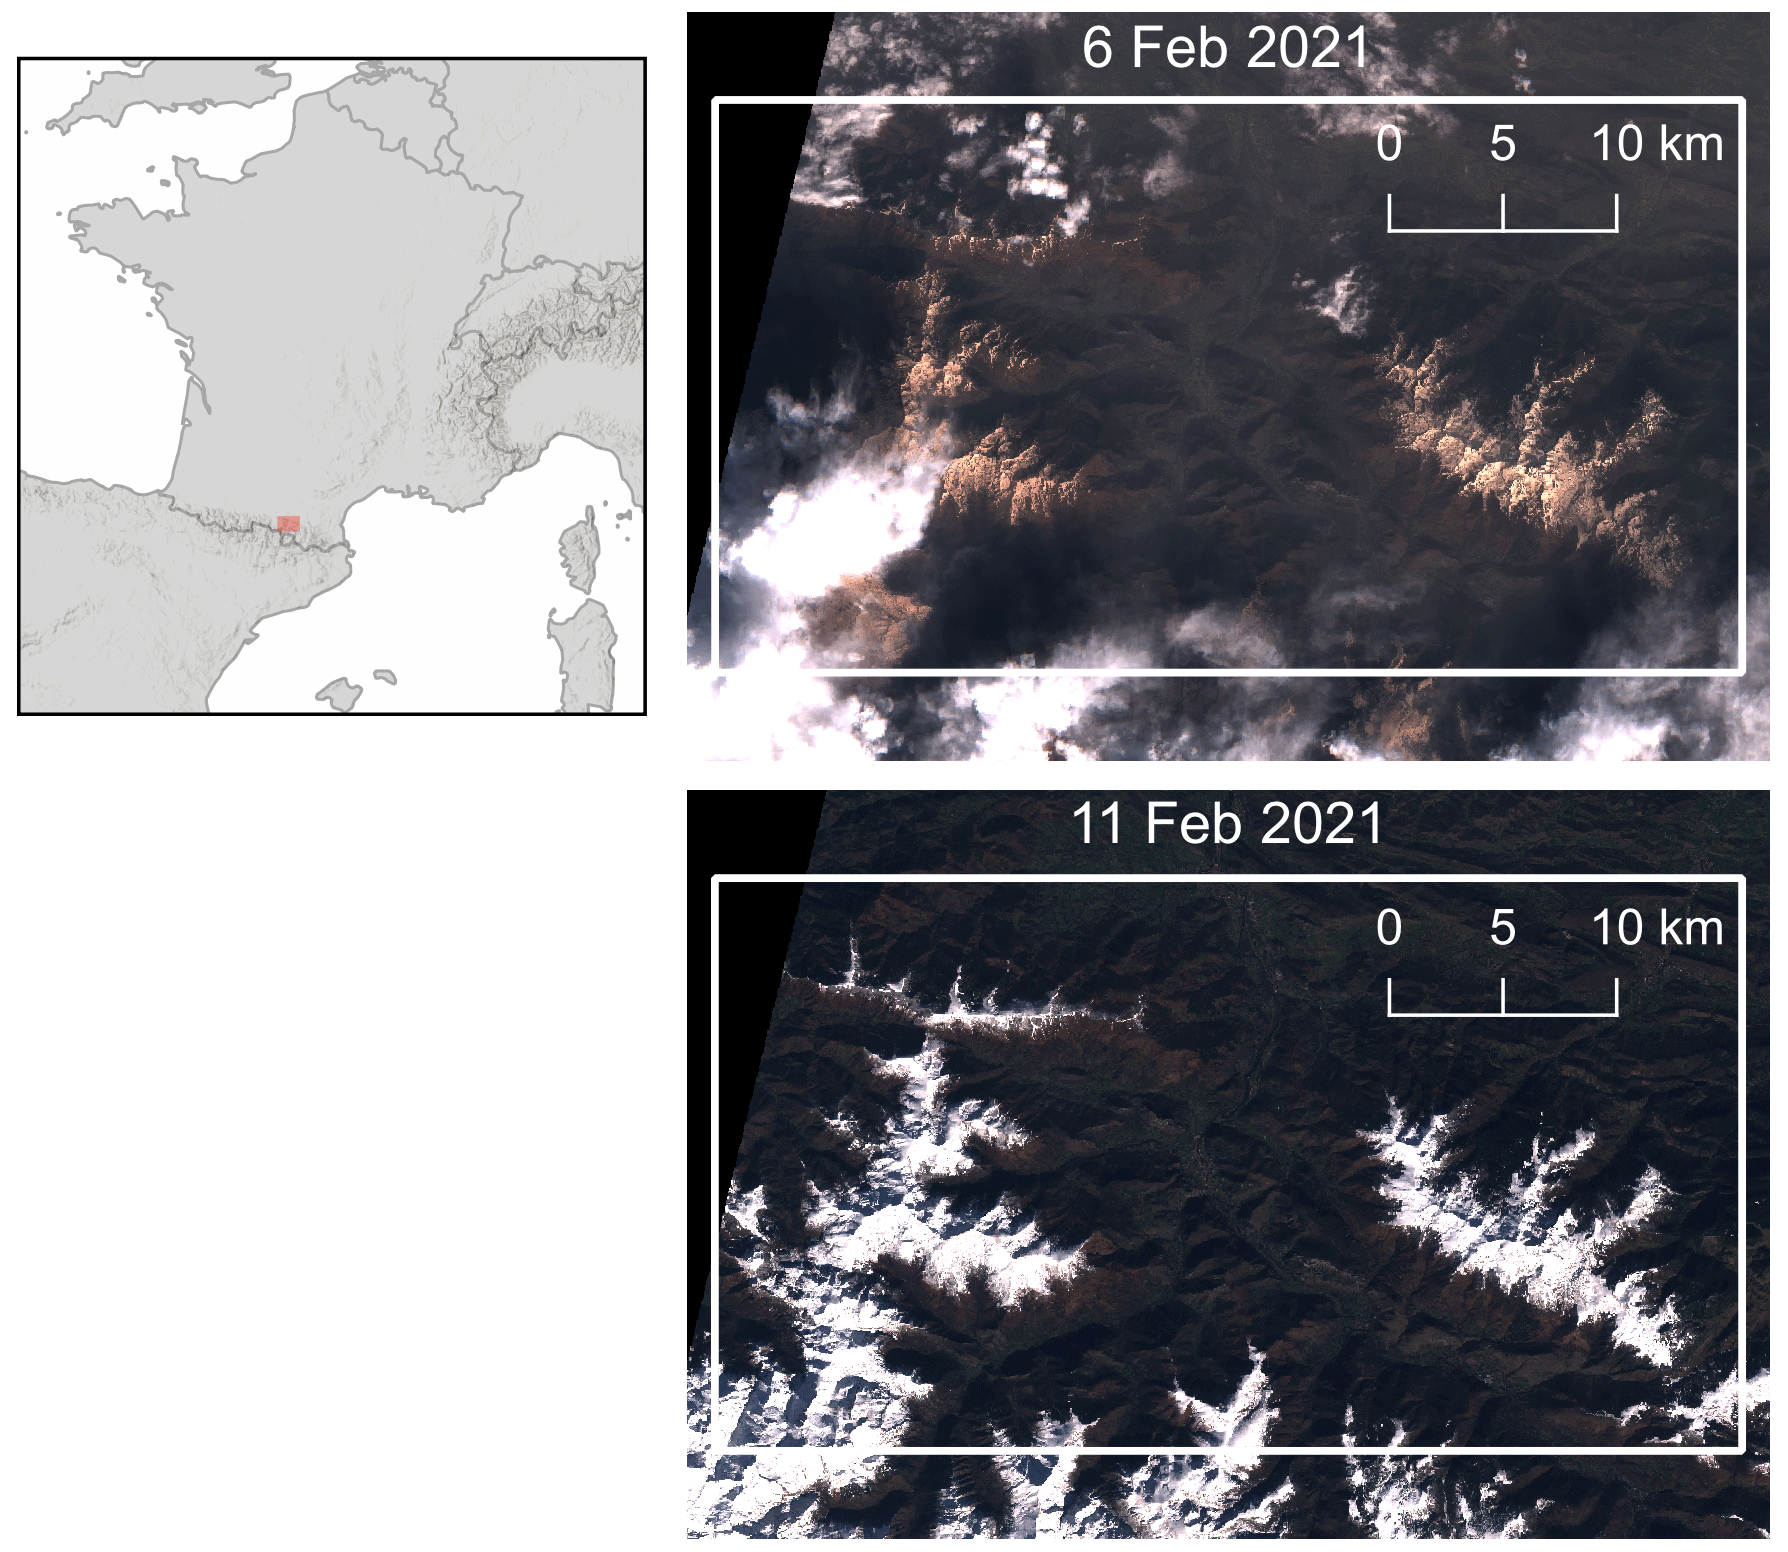
Figure 3True-colour composites of Sentinel-2 images captured on 6 and 11 February 2021. Both images were used to estimate the dust content on 6 February 2021 (the day after the dust deposition).
3.1 Citizen campaign
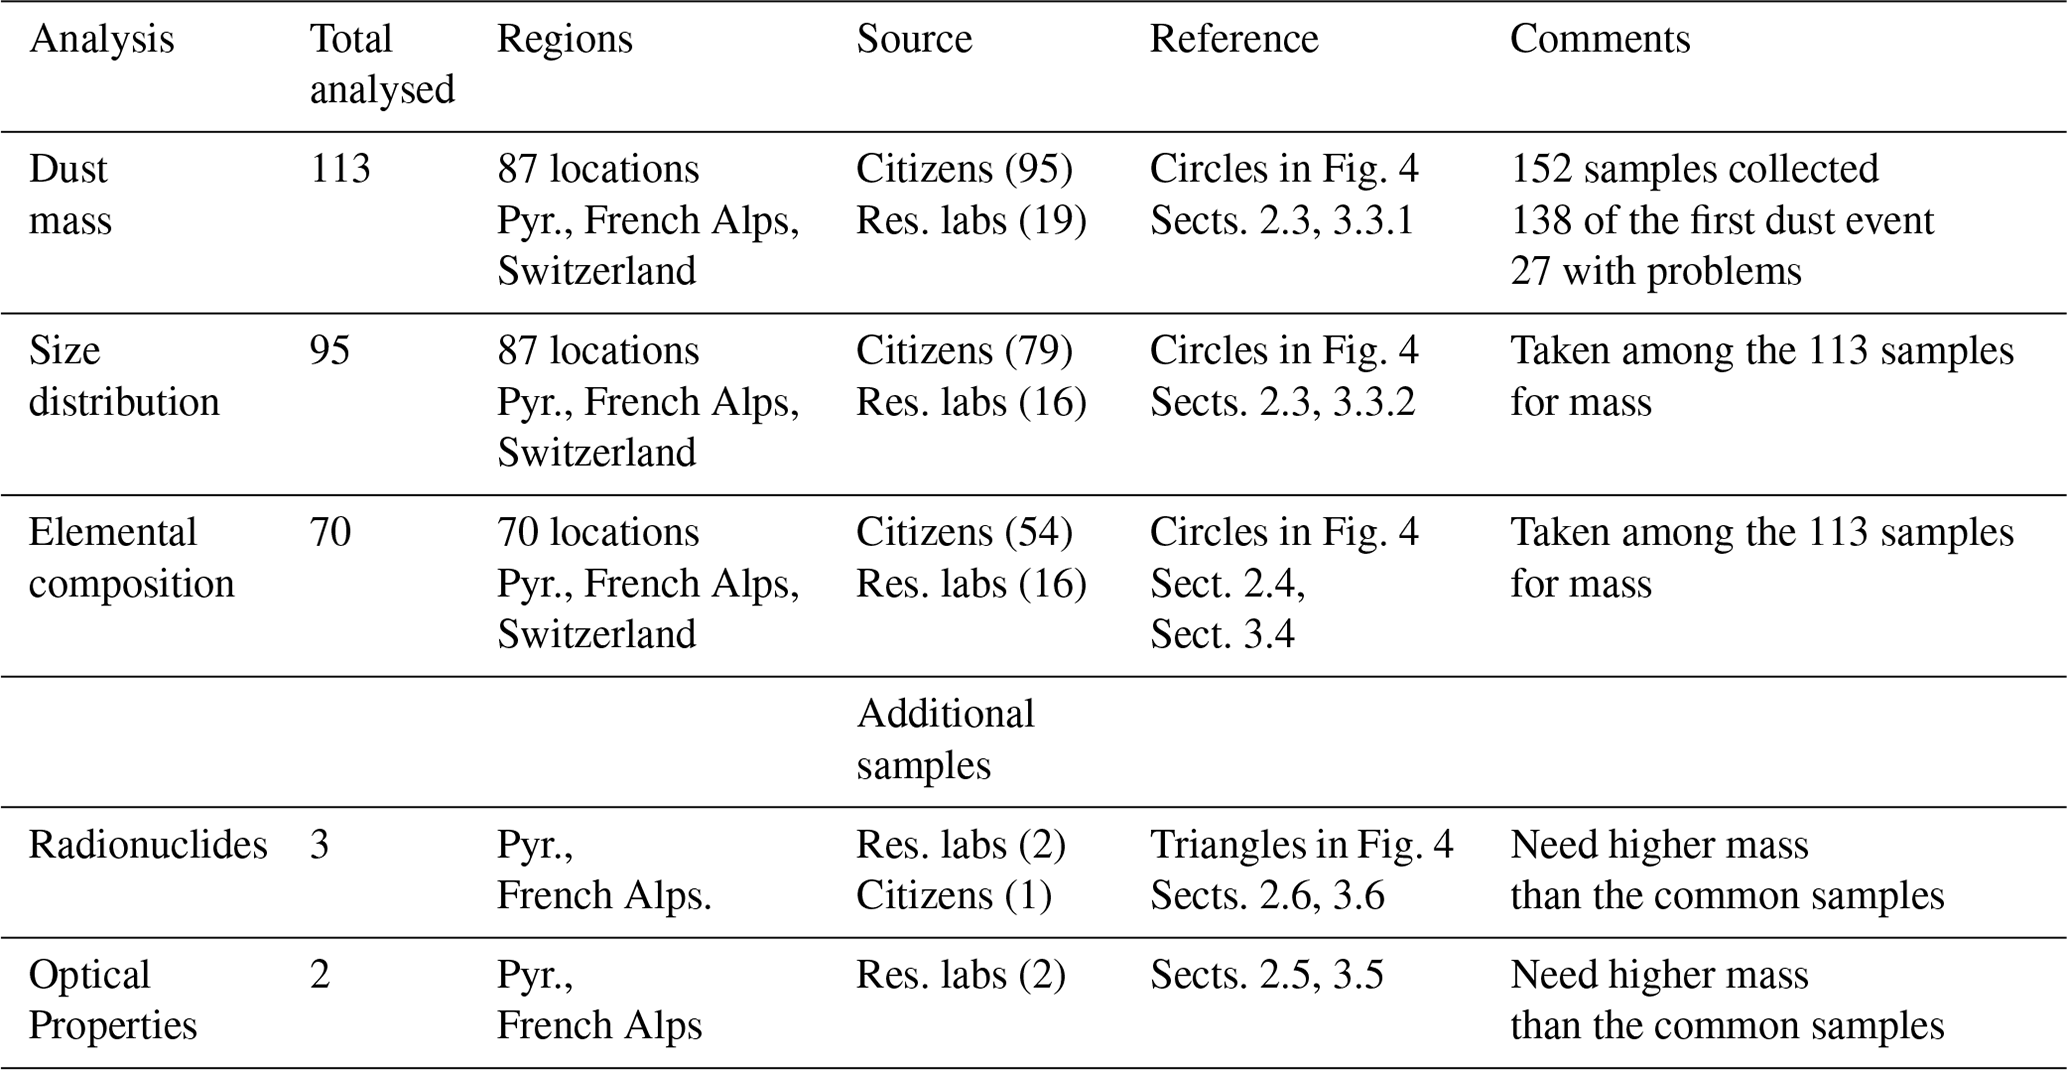
In total, in less than 4 weeks, 152 samples were collected: 84 in the French Alps, 9 in the Jura Mountains (France), 1 in the Massif Central (France), 26 in the French and Spanish Pyrenees, and 32 in the Swiss Alps (Fig. 4). Most of the samples were stored in the same container that was used for sampling, as shown Fig. 1, so that we could verify the sampling area ourselves. Some samples were provided in a container (e.g. a zipper bag) that was not originally used for sampling. In this case, we relied on the information provided by the person who collected the sample to determine the sampling area (e.g. the diameter of the jar). Among these 152 samples, 138 were taken within days after the first event in February, and 14 (2 in the French Alps and 12 in the Swiss Alps) were collected in March, thus combining the effect of two dust events. The 152 samples were collected by more than 85 individual participants. In the remainder of the text, the analysis was restricted to the 138 samples that contained only dust from the first event. Table 1 indicates the number of samples used for each type of analysis. Among the 136 samples, only 113 could be analysed due to problems with the remaining 25 (labelling problems, mass outliers, leaks, and information missing). For these 113 samples, 20 participants collected one sample, 24 participants two samples, and the rest of the participants collected 3 to 6 samples.
.
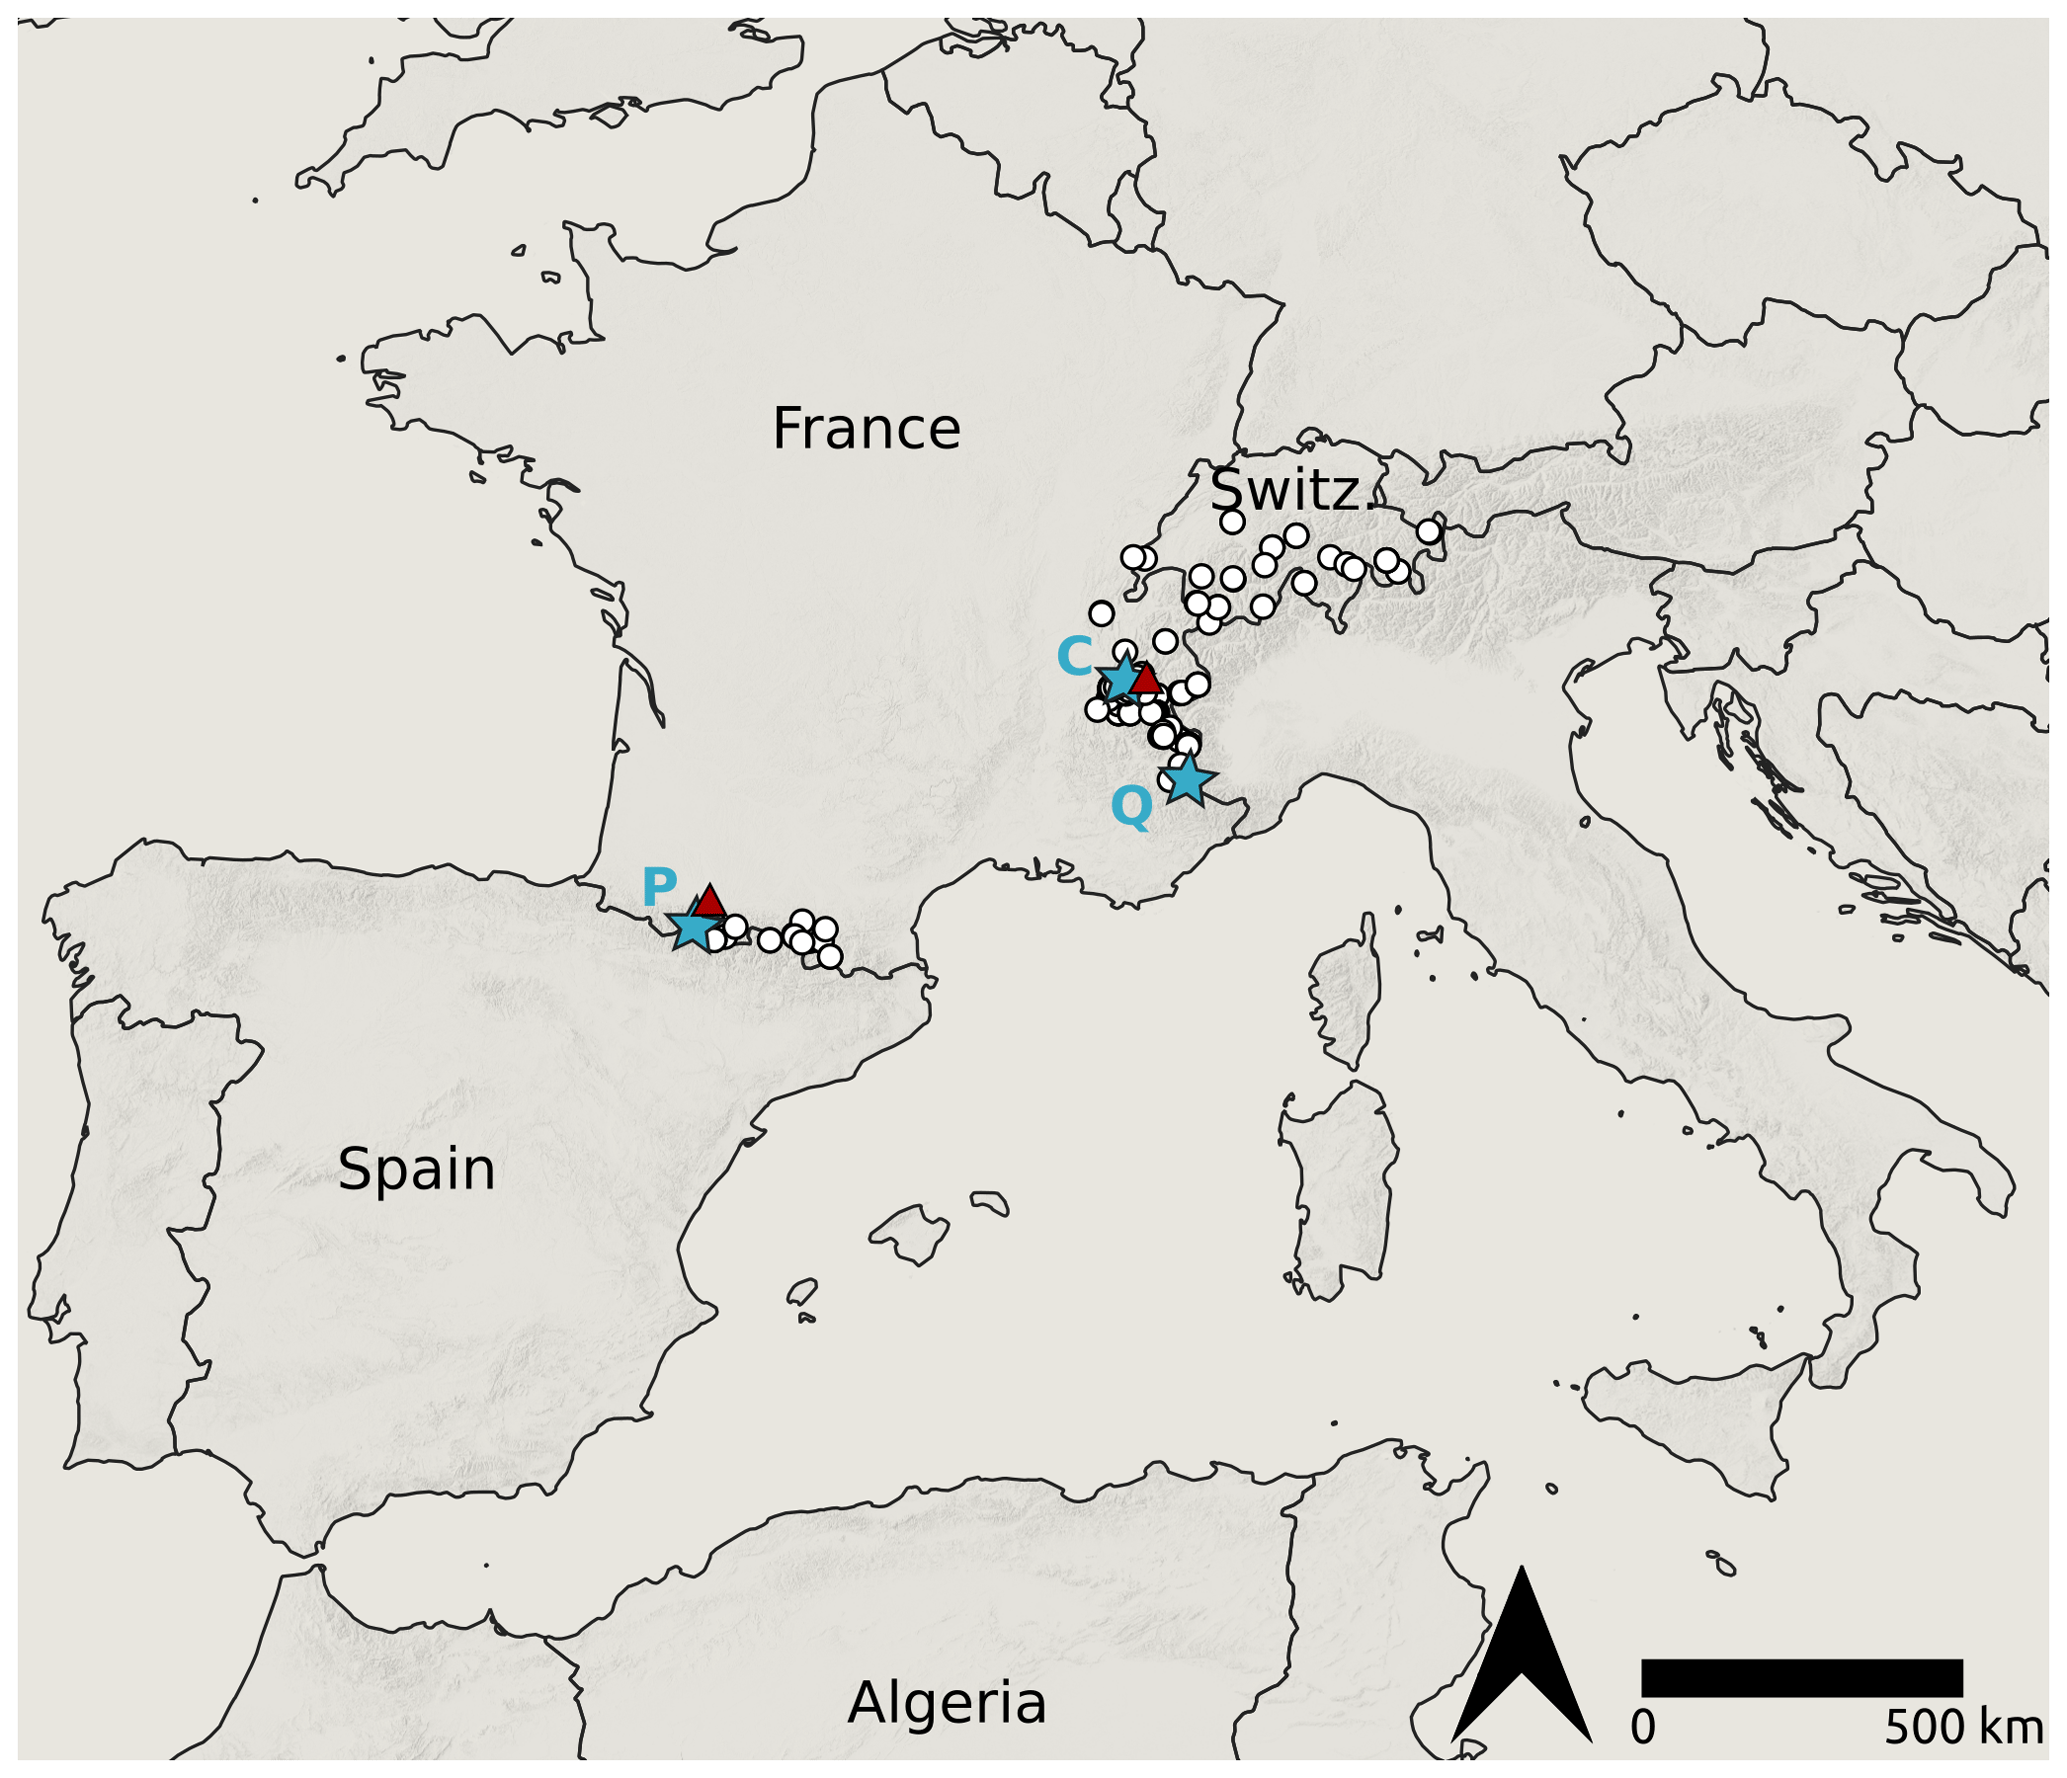
Figure 4Location of the sample collected during the citizen field campaign. Blue stars indicate the Chartreuse (C), Queyras (Q), and Pic du Midi (P) locations. The red triangle indicates the location of the two samples used for radionuclide analysis
Table 1Overview of all the dust samples analysed in this study.
3.2 Meteorological conditions
MOCAGE simulations show the hourly meteorological conditions and deposition rates during the dust outbreak that occurred between 4 and 8 February 2021 (see Fig. 5 for Pic du Midi and Figs. S2 and S3 in the Supplement for other sites). At the three selected sites, the snow cover was first affected by dry dust deposition, influenced by southerly winds. Then, during wet deposition, the wind changed to the southwest and west with a decreasing wind speed. According to the simulations for the Pyrenees and the southern Alps, most of the deposition was dry, with 85 % and 90 % of the total loads at the end of the dry deposition for the Pic du Midi and the Queyras, respectively (Figs. 5 and S2). In the northern Alps, the partitioning between wet and dry deposition was approximately half; for instance, 53 % of the total load was due to dry deposition at the Col de Porte (Fig. S3). However, some avalanche forecasters in the Pyrenees observed that, after 2–3 d of dust in suspension, dust was massively deposited as wet deposition (rain), followed by a graupel shower and then a short snowstorm the following night. Snowfall in the following days covered the dust layer in most parts of the Alps and Pyrenees. However, the dust layer remained easily identifiable in the snowpack below the clean snow layers by digging a snow pit.
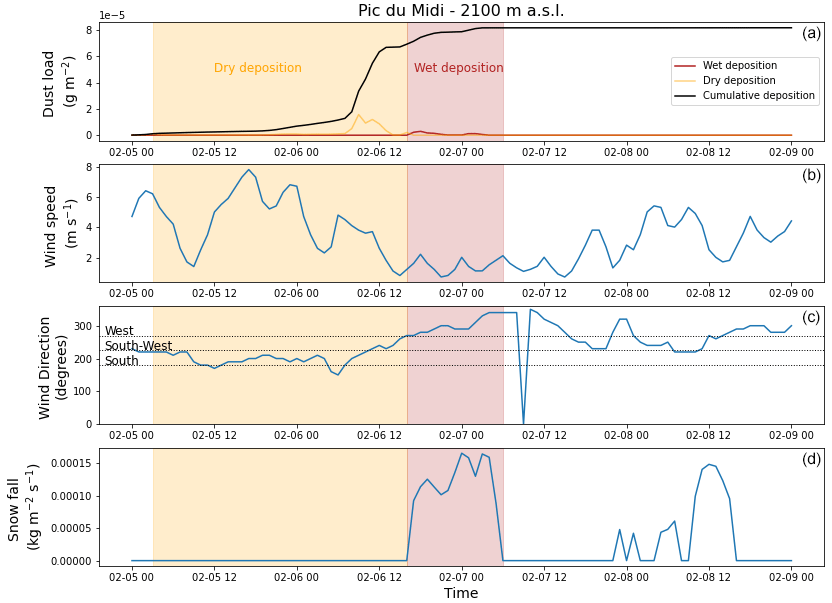
Figure 5(a) Temporal evolution of the hourly dry (yellow) and wet (red) dust loads during the event at Pic du Midi (2100 m a.s.l.). The total cumulative mass deposition is shown by the black line. Depositions were computed based on MOCAGE outputs and corrected according to the observations (i.e. the measured mass of the three closest samples of the site; see Sect. 3.3.1). The dry vs. wet deposition was determined based on SAFRAN precipitation data (see Sect. 2.2). Temporal evolution of the hourly wind speed (b) and direction (c) and the hourly precipitation (d) from SAFRAN reanalysis data. The yellow (red)-shaded area represents the dry (wet) deposition of the event according to SAFRAN precipitation.
3.3 Dust mass and size distribution
3.3.1 Dust mass
A total of 113 sample-derived masses were obtained over the Alps and the Pyrenees. The missing values (approximately 16 %) were due to leaks, which made the samples unusable. These 113 samples correspond to 70 different locations and were mostly sampled by citizens, except for the Swiss samples (Table 1). We believe that there is no systematic difference between the samples collected by citizens and the samples collected by research labs since the measurement protocol was new to both the public and the professional practitioners.
Figure 6 displays the spatial distribution of the dust mass per unit area obtained from in situ measurements. The dust mass per unit area ranges from 0.2 to 58.6 g m−2 depending on the location, highlighting strong spatial variability. The mean value is 9.4 g m−2 when considering all the samples. Higher dust depositions are observed in the Pyrenees (Fig. 7a), with a mean mass per unit area of 21.2 g m−2, compared to the French Alps (7.2 g m−2) and the Swiss Alps (4.5 g m−2). This suggests a decrease in the deposited mass along the plume trajectory with distance from the source in the Sahara (Fig. 7b).
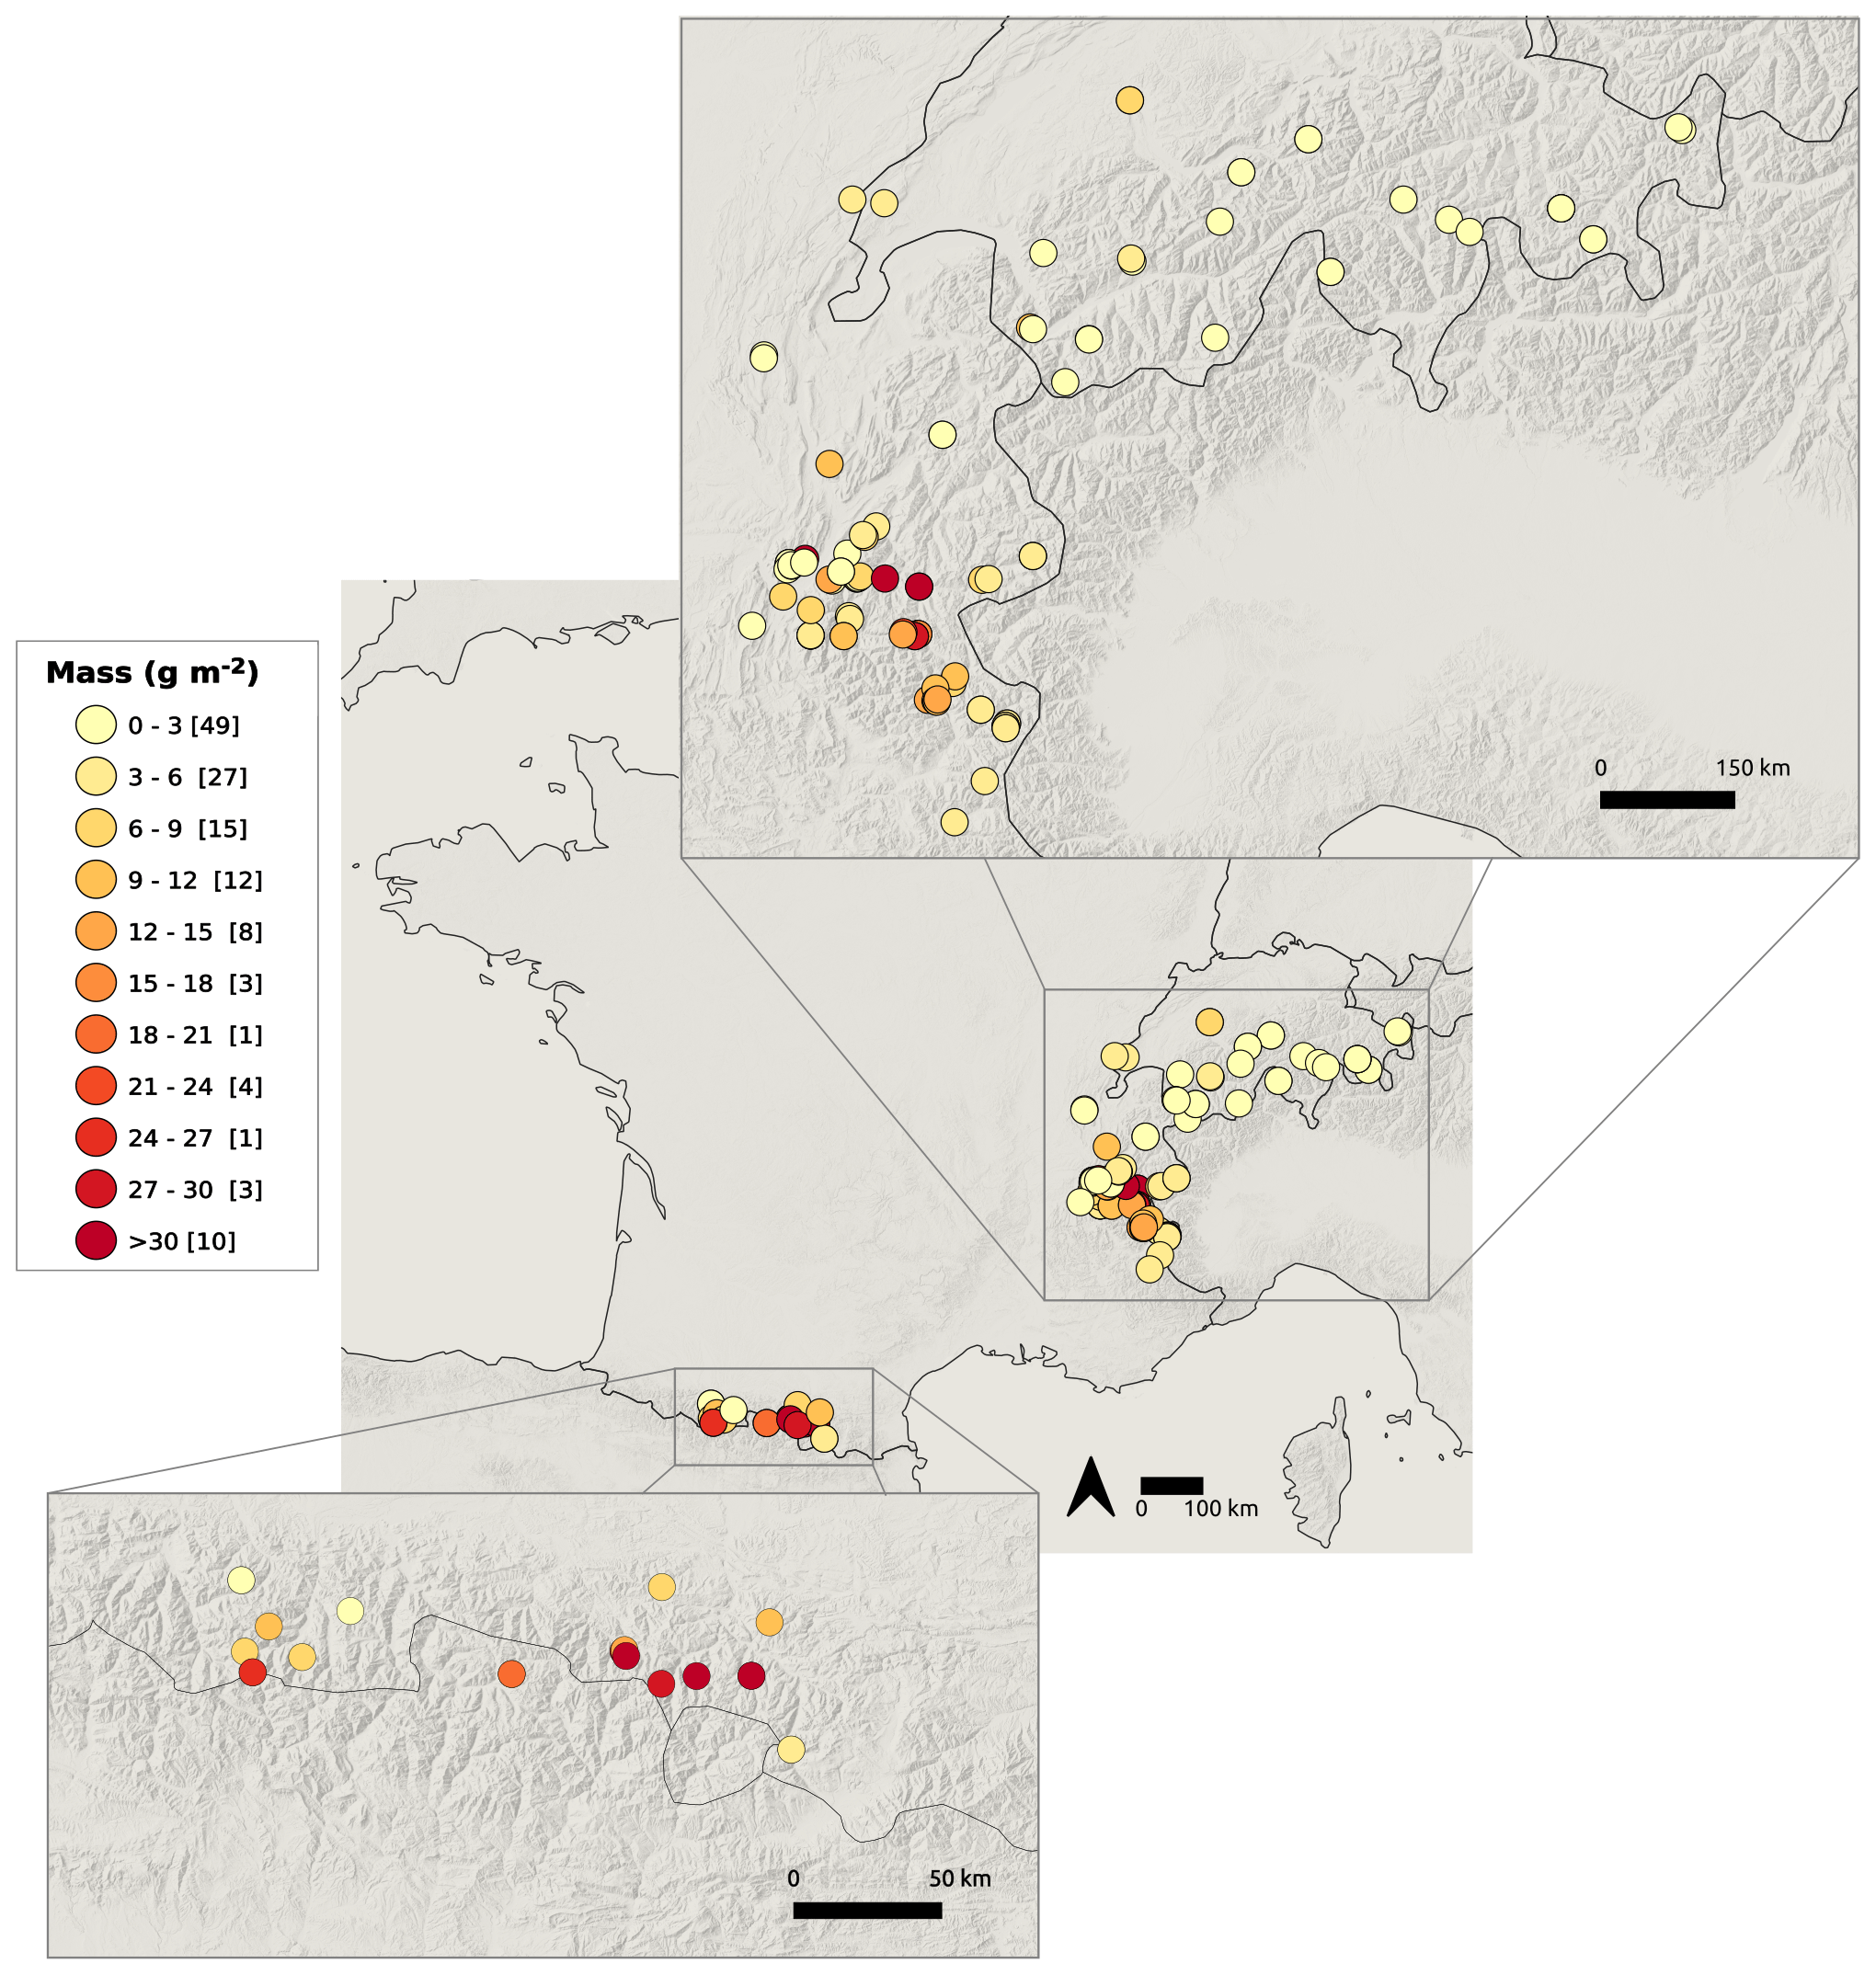
Figure 6Mass of deposited dust per unit area. The number in brackets in the legend indicates the number of samples.
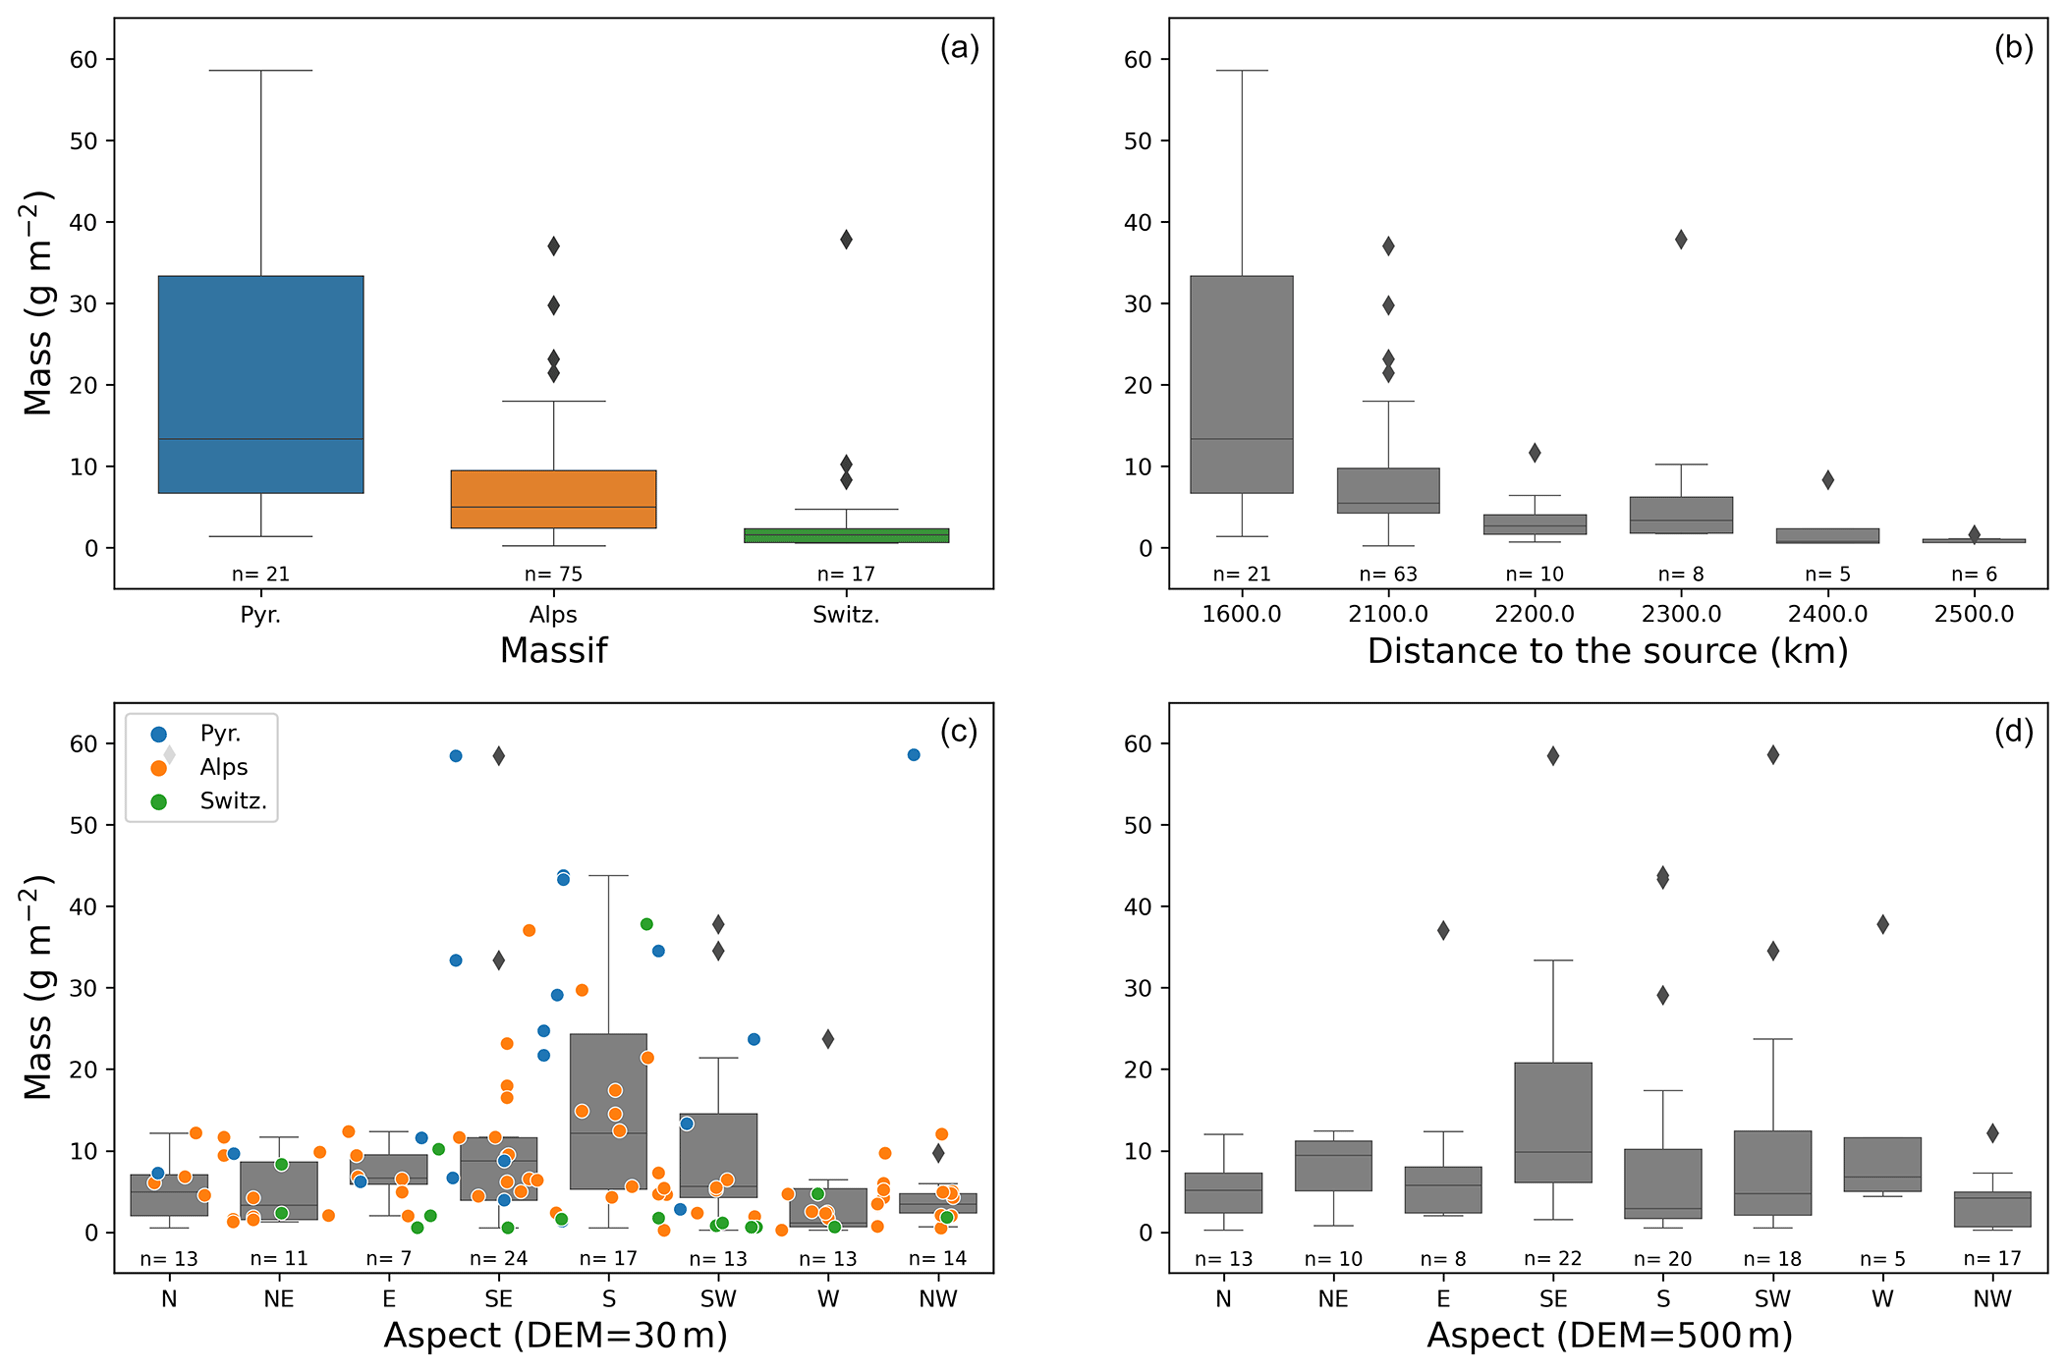
Figure 7Distribution of the deposited mass dust per unit area against the massif (a), the distance to the source (b), and the aspect computed with a 25 m resolution DEM (c) and a 500 m resolution DEM (d). The boxes show the quartiles of the distribution corresponding to the spatial variability. Minimum–maximum ranges are indicated by the whiskers, and outliers are represented by the black points. The distance to the source is estimated from the location 31.21∘ N, 0.37∘ E, estimated from MOCAGE data (video supplement).
These measurements allow us to estimate that the MOCAGE simulation underestimates the deposition fluxes. The modelled deposition fluxes are 0.31, 0.11, and 0.52 g m−2 while the masses measured from the three closest samples are 14.2, 5.6, and 2.1 g m−2 for the Pic du Midi site, Queyras site, and Chartreuse site respectively. This means that the MOCAGE simulation underestimates the deposition fluxes by a factor equal to 51.6 for the Pic du Midi site, 13.5 for the Queyras site, and 36.4 for the Chartreuse site (Sect. 3.2).
The distribution of dust mass per unit area with slope aspect indicates that a larger dust mass per unit area is generally observed for the south- and southwest-facing slopes in all three studied areas (Fig. 7c). This conclusion holds when slopes are computed from both a 25 m resolution digital elevation model (Fig. 7c) and from a 500 m resolution digital elevation model (DEM) (Fig. 7d). This indicates that dust deposition prevailed on slopes facing the dominant wind during the event (see video supplement and Figs. 5, S2, and S3).
The dust mass per unit area does not show a gradient with elevation (not shown). This result could be due to the sampling pattern, covering a restricted elevation range: 45 % of the samples were collected between 1500 and 2000 m a.s.l., and 26 % were collected between 2000 and 2500 m a.s.l. Only three samples were collected below 1000 m a.s.l., and one was collected above 2500 m a.s.l.
3.3.2 Dust size distribution
Most of the samples analysed for mass could be analysed for size distribution (Table 1). A total of 95 samples were analysed with the Coulter counter, providing 95 size distribution values over the Alps and Pyrenees (Fig. S4). The missing samples result from label mishandling, ambiguous labelling, or other laboratory mishaps. The distribution tails show the regular occurrence of particles larger than the cutoff diameter (35–70 µm; Fig. S4, central right panel), whereas the mean diameter of the well-measured fraction of the distribution is much lower, around 19 µm for the volume distribution and 12 µm for the surface distribution. The cutoff diameter varies with the mean volumic diameter (Fig. S4, right panel); detecting enough big particles to have a good counting statistic implies a larger mean volumic diameter and a higher cutoff diameter. The cutoff diameter should therefore be seen as an estimate of a potential measurement bias. Adding the distribution tail into the calculation of the average diameters influences the average volume diameter slightly.
The volume distribution can be converted into a mass estimation using a dust density of 2.5 g cm−3, which can be compared to the gravimetric measurement on the filters (Fig. S4, left panel). This comparison shows that the distribution tail, poorly measured with the Coulter counter, actually represents most of the dust mass. This underestimation is likely related to large particles (diameter larger than 50 µm), as shown in the second panel in Fig. S5.
The mean dust diameter measured with the Coulter counter spans a range of 8 to 38 µm when considering the samples over all the massifs. The maximum size may be underestimated due to the size cutoff (see Sect. 2.3). The dust size distribution depends on the location, with larger sizes generally observed closer to the source (Fig. 8b). In the Pyrenees samples, the size spans a range of 15.4–27 µm (with a volume average diameter of 21 µm) and varies between 9.8 and 38 µm (volume average diameter of 21 µm) and 8.2 and 19.6 µm (volume average diameter of 15 µm) for the French and Swiss Alps, respectively. Figure 8a shows the same gradient for the surface average diameter. Contrary to the mass distribution, there is no evidence that the dust size is related to the slope aspect (Fig. 8c, d), and we did not find a trend with elevation in the dust mass distribution either.
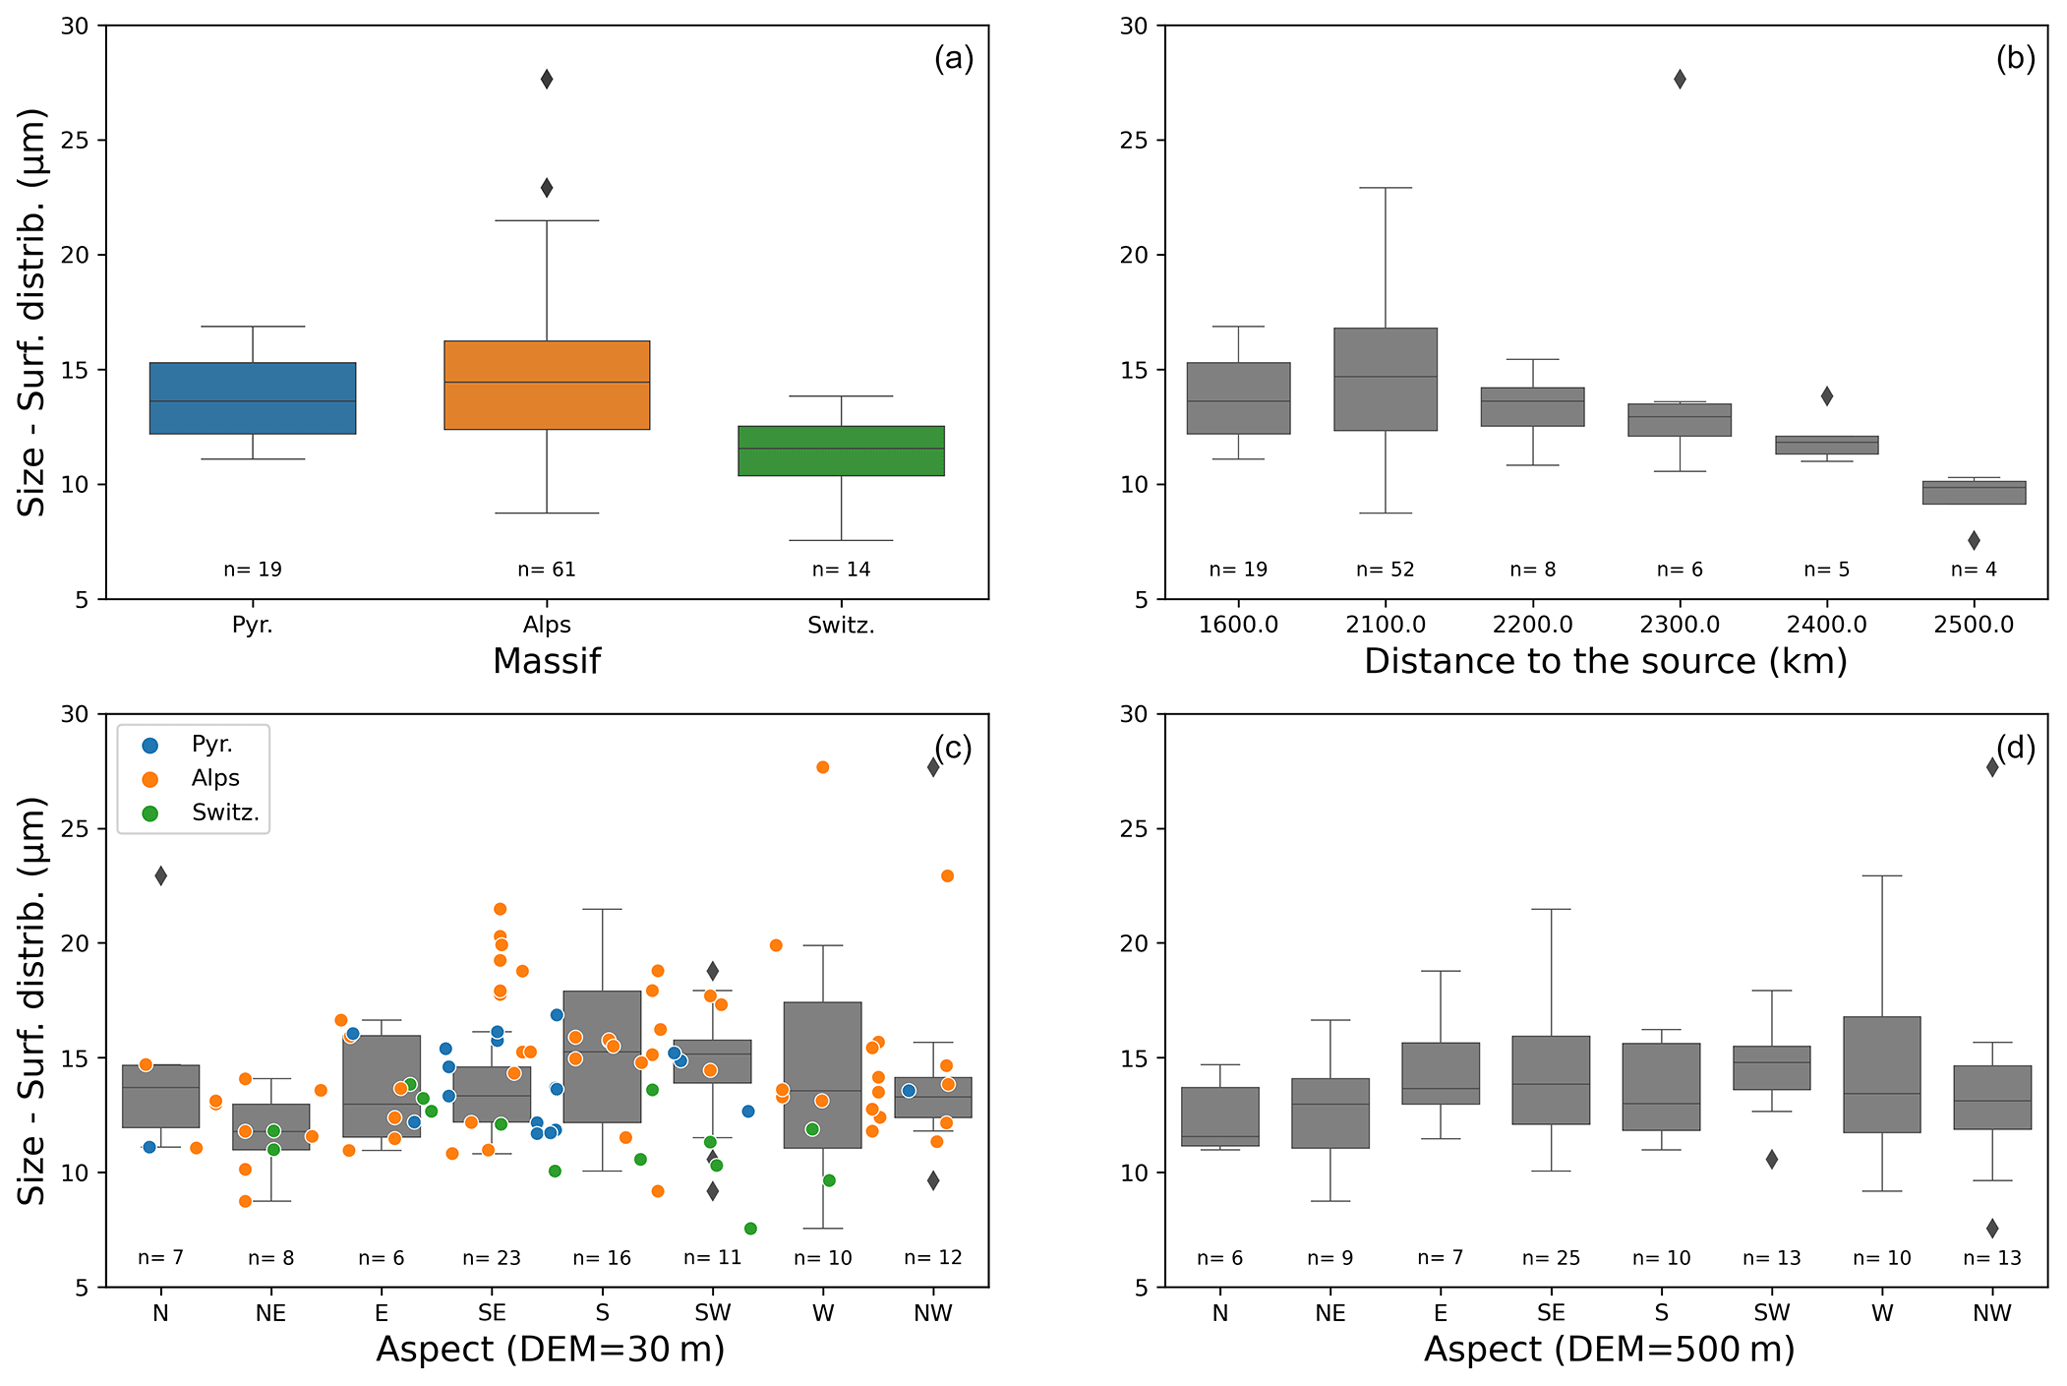
Figure 8Distribution of the surface average diameter (proxy of the particle size) of the dust deposition against the massif (a), the distance to the source (b), and the aspect computed with a 30 m resolution DEM (c) and a 500 m resolution DEM (d). The boxes show the quartiles of the distribution corresponding to the spatial variability. The number of values used is indicated under each box. Minimum–maximum ranges are indicated by the whiskers, and outliers are represented by the black points. The size for each massif, against the aspect, is shown in (c).
3.4 Elemental composition
From the 113 samples analysed for mass, 70 were analysed for the elemental composition since only the filters with a smooth surface could be used for this analysis (Table 1). No major contamination with trace metals could be detected in the filters. The concentration of contaminants such as Pb remains low for most of the filters, i.e. close to the natural value for the upper continental crust (17 µg kg−1). However, one sample (Alp-60) has a large concentration (> 100 µg kg−1). Clear spatial trends can be identified for elemental concentrations depending on the mountain range. Concentrations of Ca, Fe, Mn, and Ti decrease from the Pyrenees to the Swiss Alps, while an opposite trend is identified for Al, P, and Si, and no trend is observed for K (Figs. 9 and 10), showing concentration dispersion for each mountain range and against distance to the source. Since the mass deposition is much higher in the Pyrenees (Fig. 7a), the elemental deposition density is higher for all elements in the Pyrenees (Fig. 12).
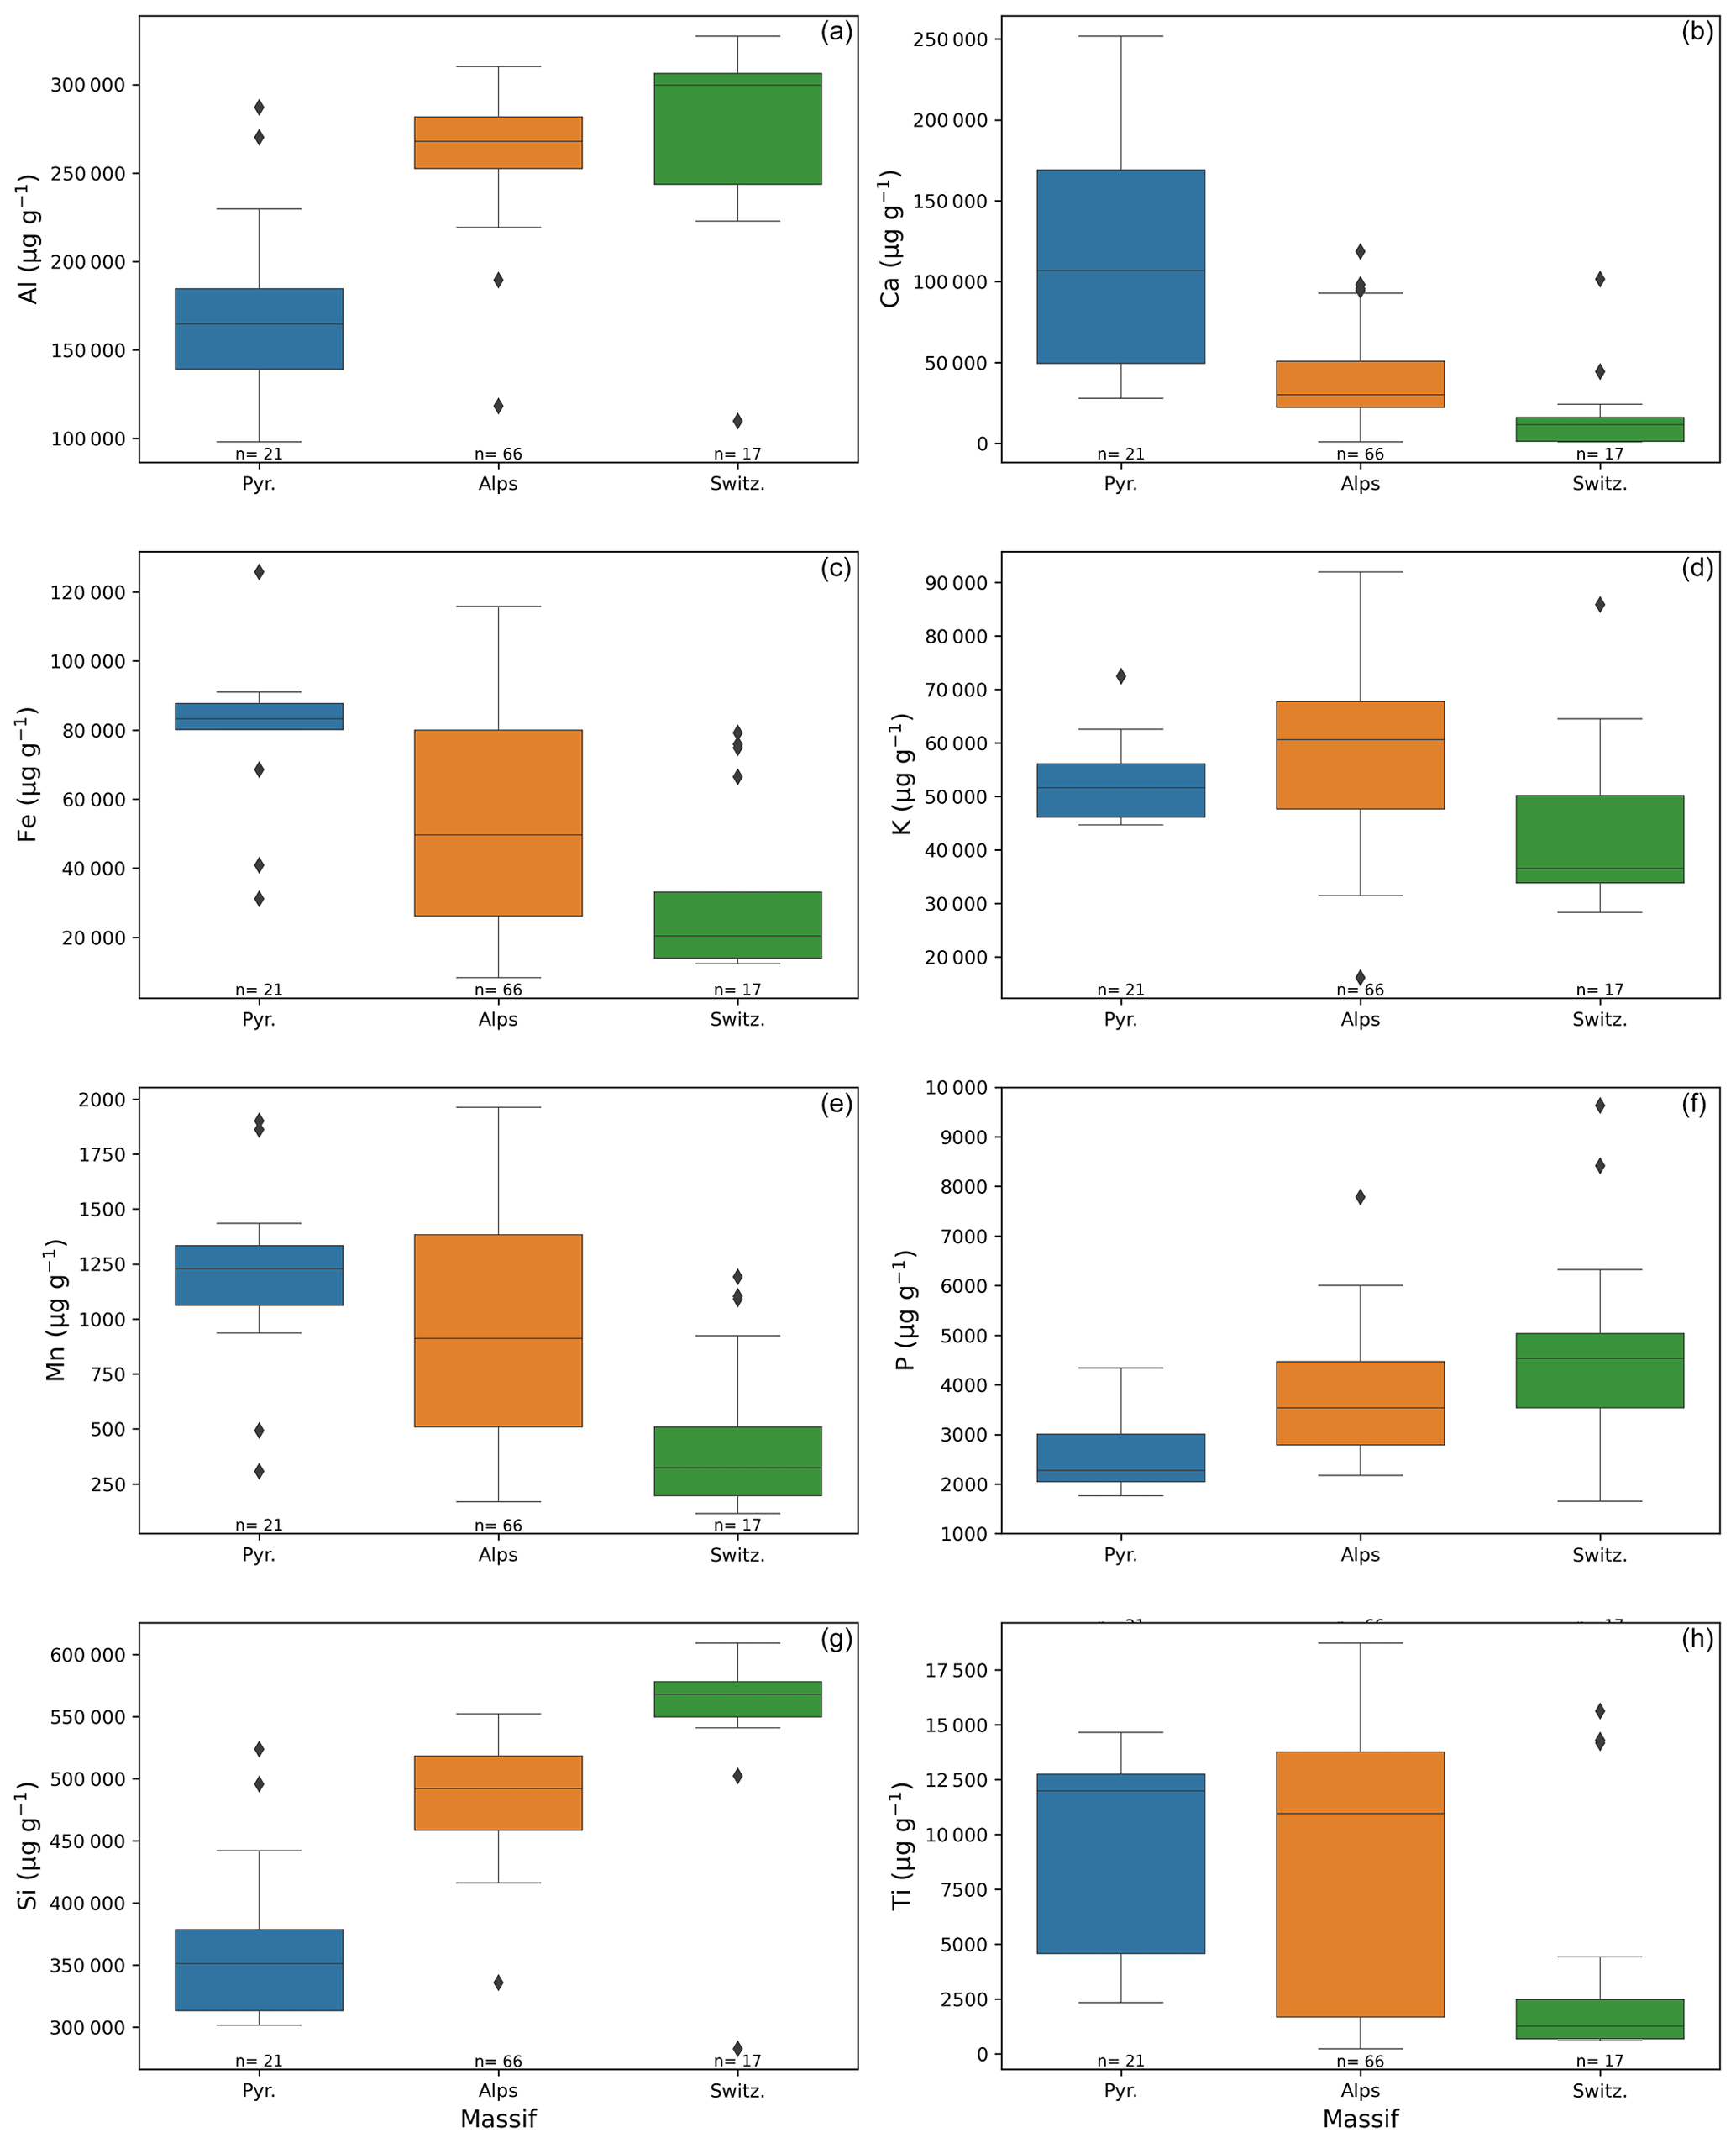
Figure 9Distribution of elemental concentrations against the massif. (a) Aluminium. (b) Calcium. (c) Iron. (d) Potassium. (e) Manganese. (f) Phosphorus. (g) Silicon. (h) Titanium. The boxes show the quartiles of the distribution corresponding to the spatial variability. The number of values used is indicated under each box. Minimum–maximum ranges are indicated by the whiskers, and outliers are represented by the black points.
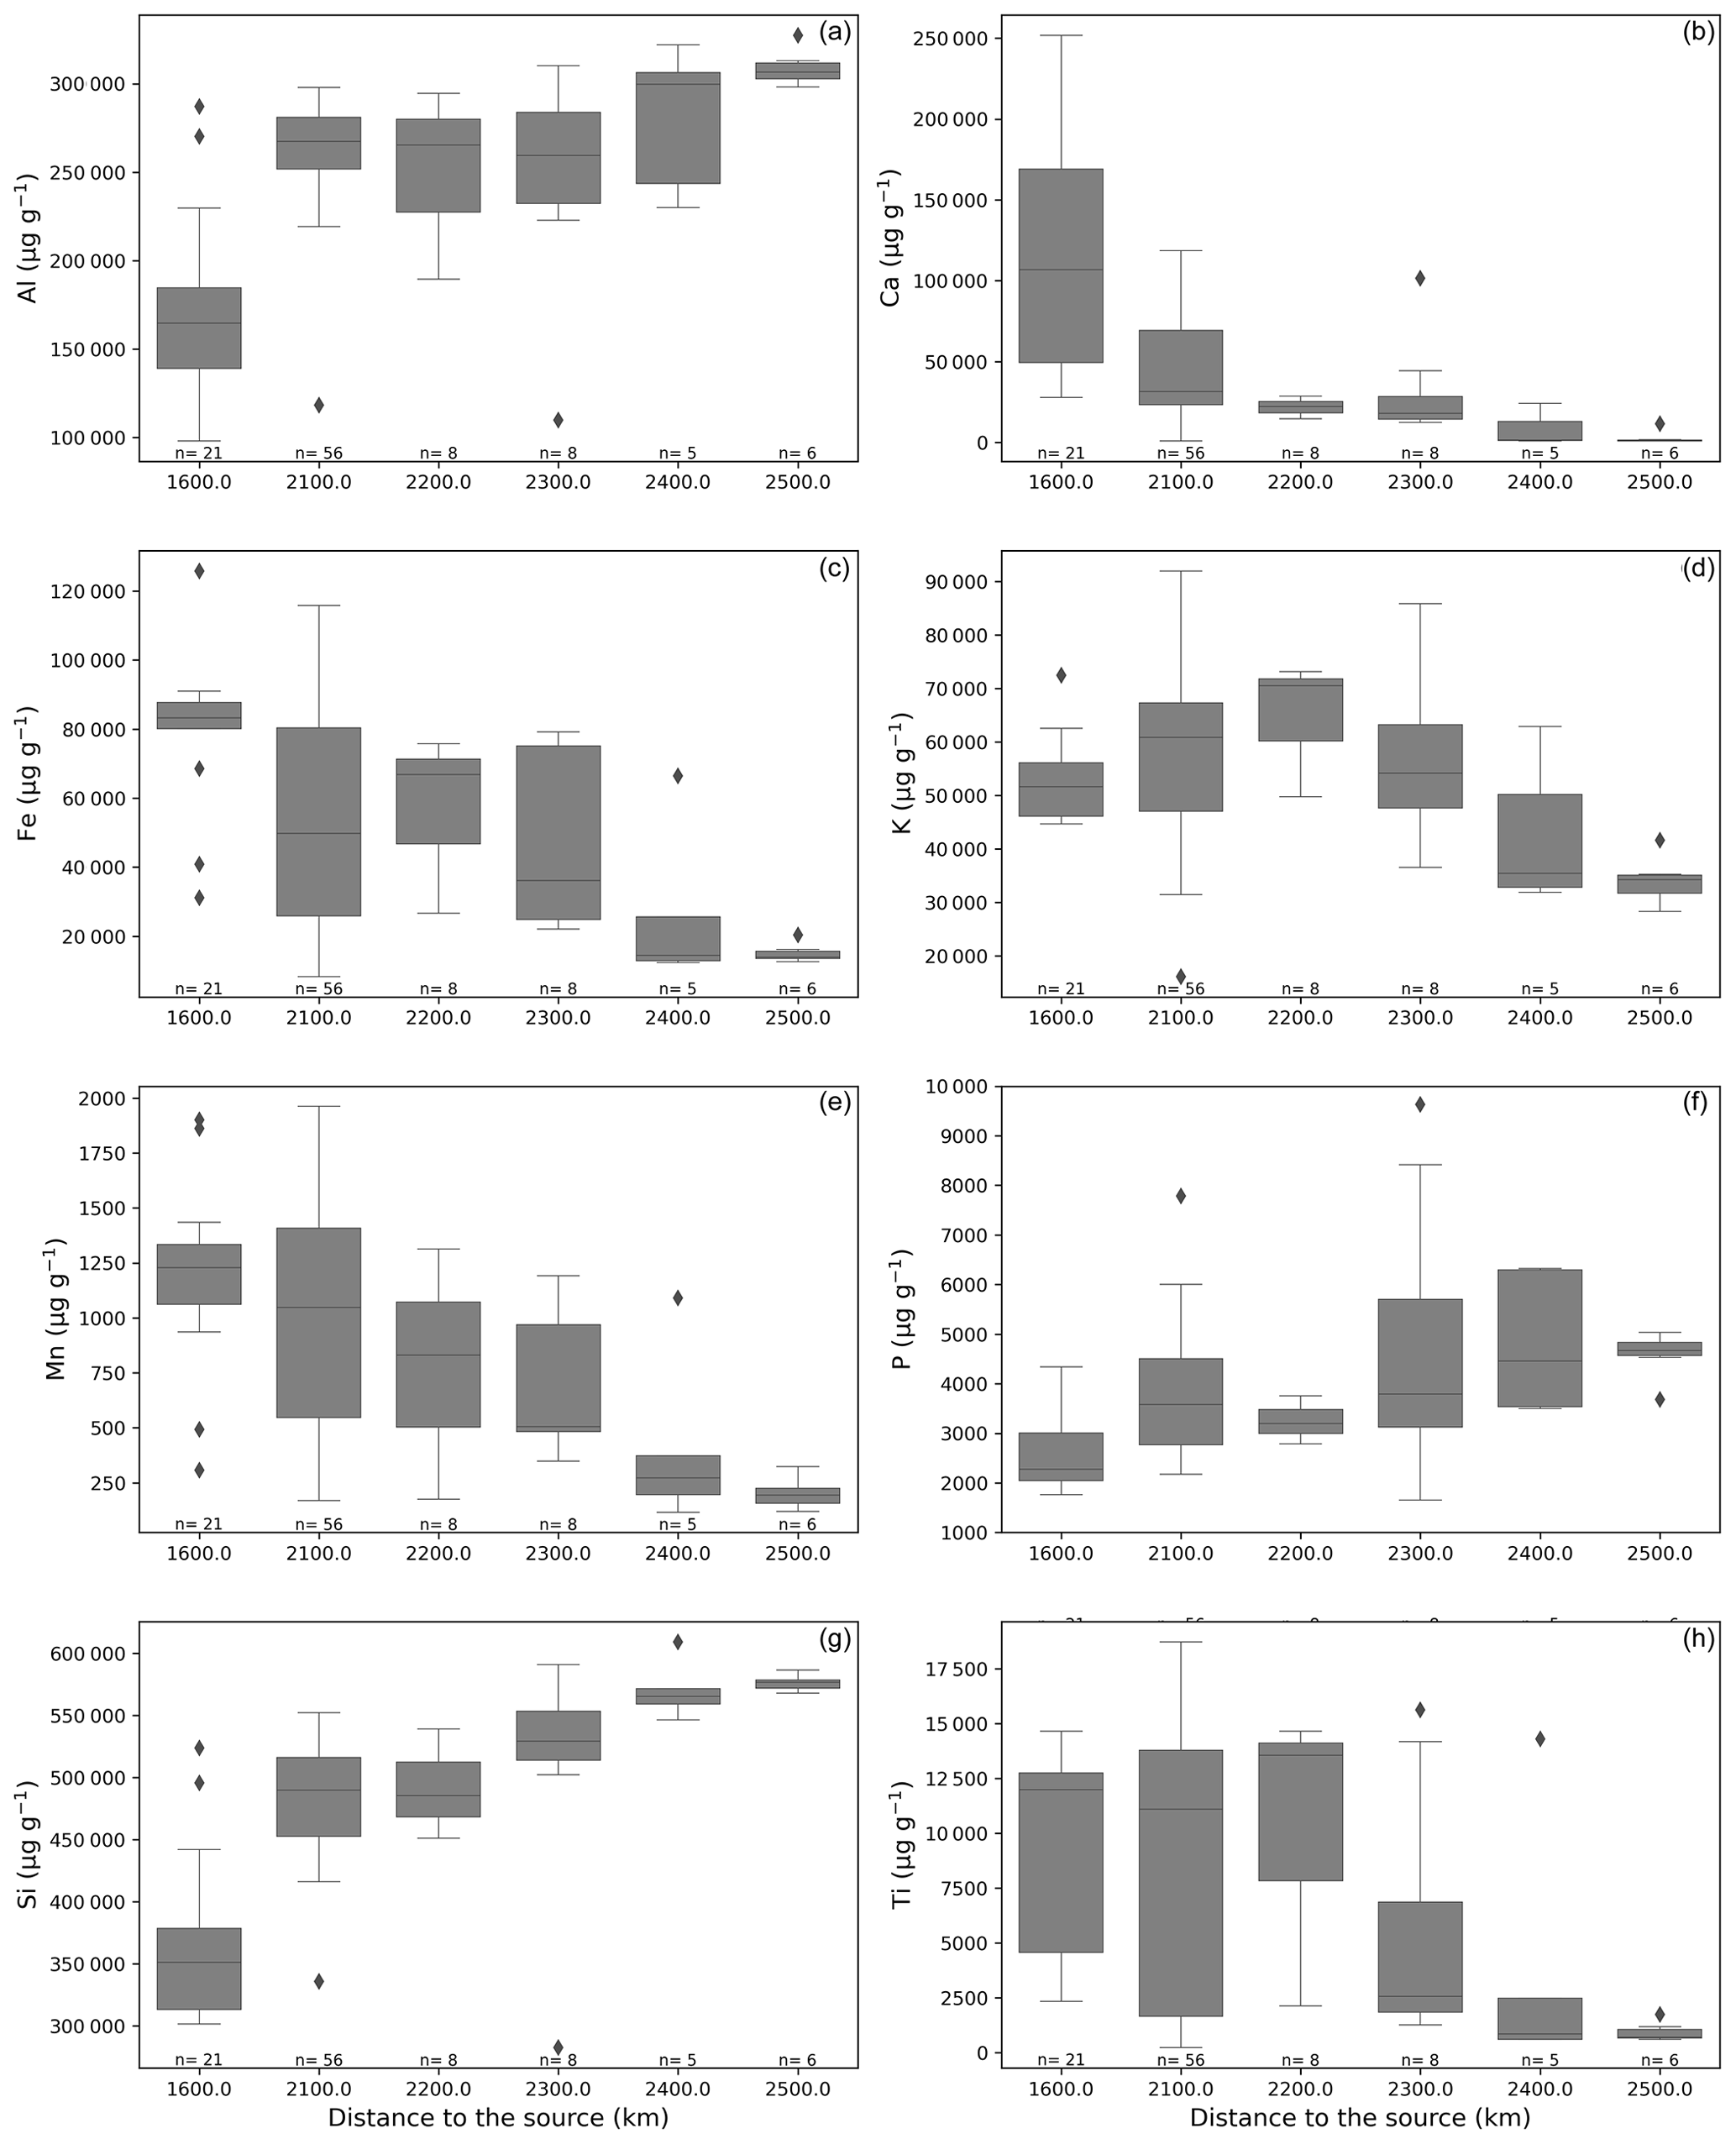
Figure 10Distribution of elemental concentrations against the distance to the source. (a) Aluminium. (b) Calcium. (c) Iron. (d) Potassium. (e) Manganese. (f) Phosphorus. (g) Silicon. (h) Titanium. The boxes show the quartiles of the distribution corresponding to the spatial variability. The number of values used is indicated under each box. Minimum–maximum ranges are indicated by the whiskers, and outliers are represented by the black points.
We also investigated the spatial variability of the ratio between elemental concentrations. Figure 11 shows the variability of the and ratios and that of the mass fraction of Fe. The values for vary between 1.7 and 2.8. The ratio between Fe and Ca varies between 1 and 2. The values for the Swiss samples are likely to be unreliable given their very low Ca concentrations (Fig. 12). The mass fraction of Fe varies from 2 % to almost 11 % from the Swiss mountains to the Pyrenees.
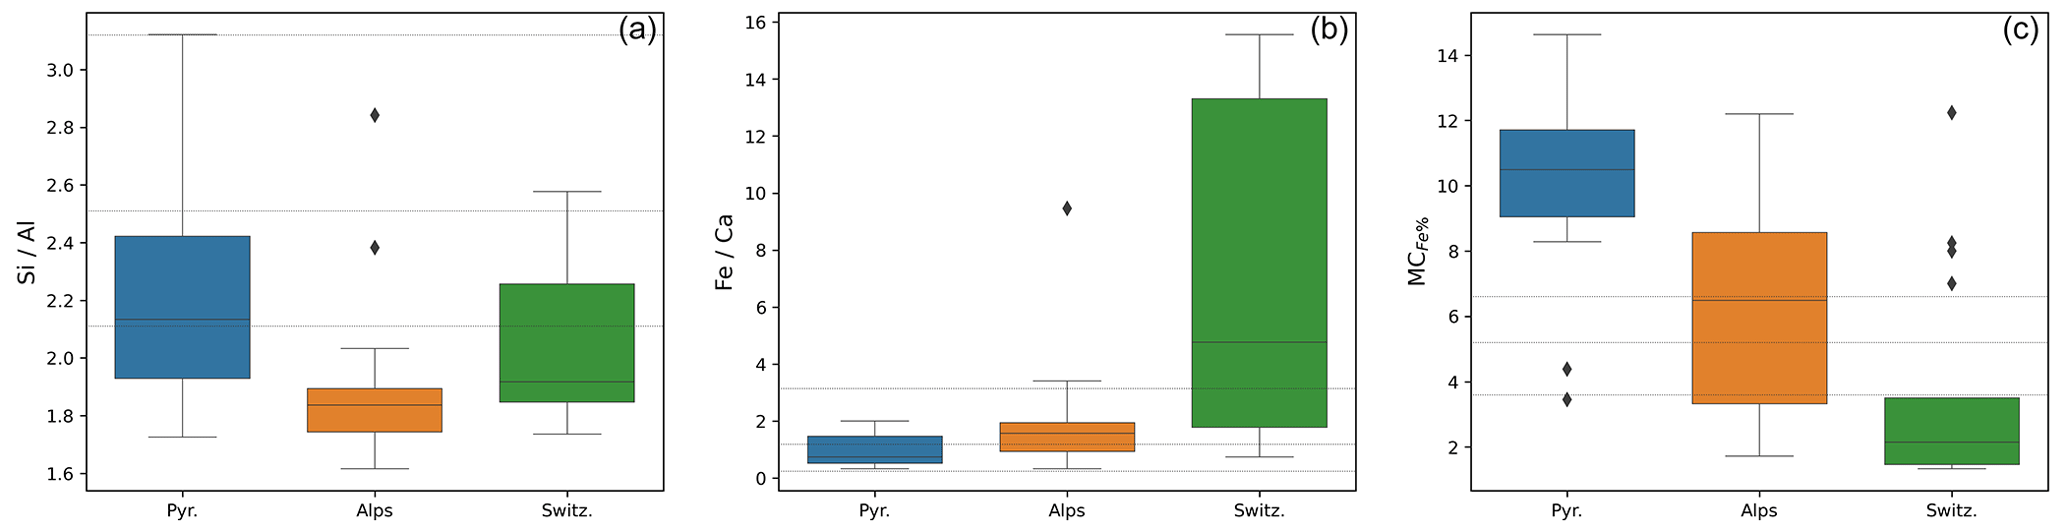
Figure 11Distribution of elemental ratio against the massif. (a) , (b) , and (c) mass fraction of Fe. The boxes show the quartiles of the distribution corresponding to the spatial variability. The number of values used is indicated under each box. Minimum–maximum ranges are indicated by the whiskers, and outliers are represented by the black points. The horizontal black line corresponds to the values provided in Table 3 of Caponi et al. (2017) for Saharan dust PM10.6.
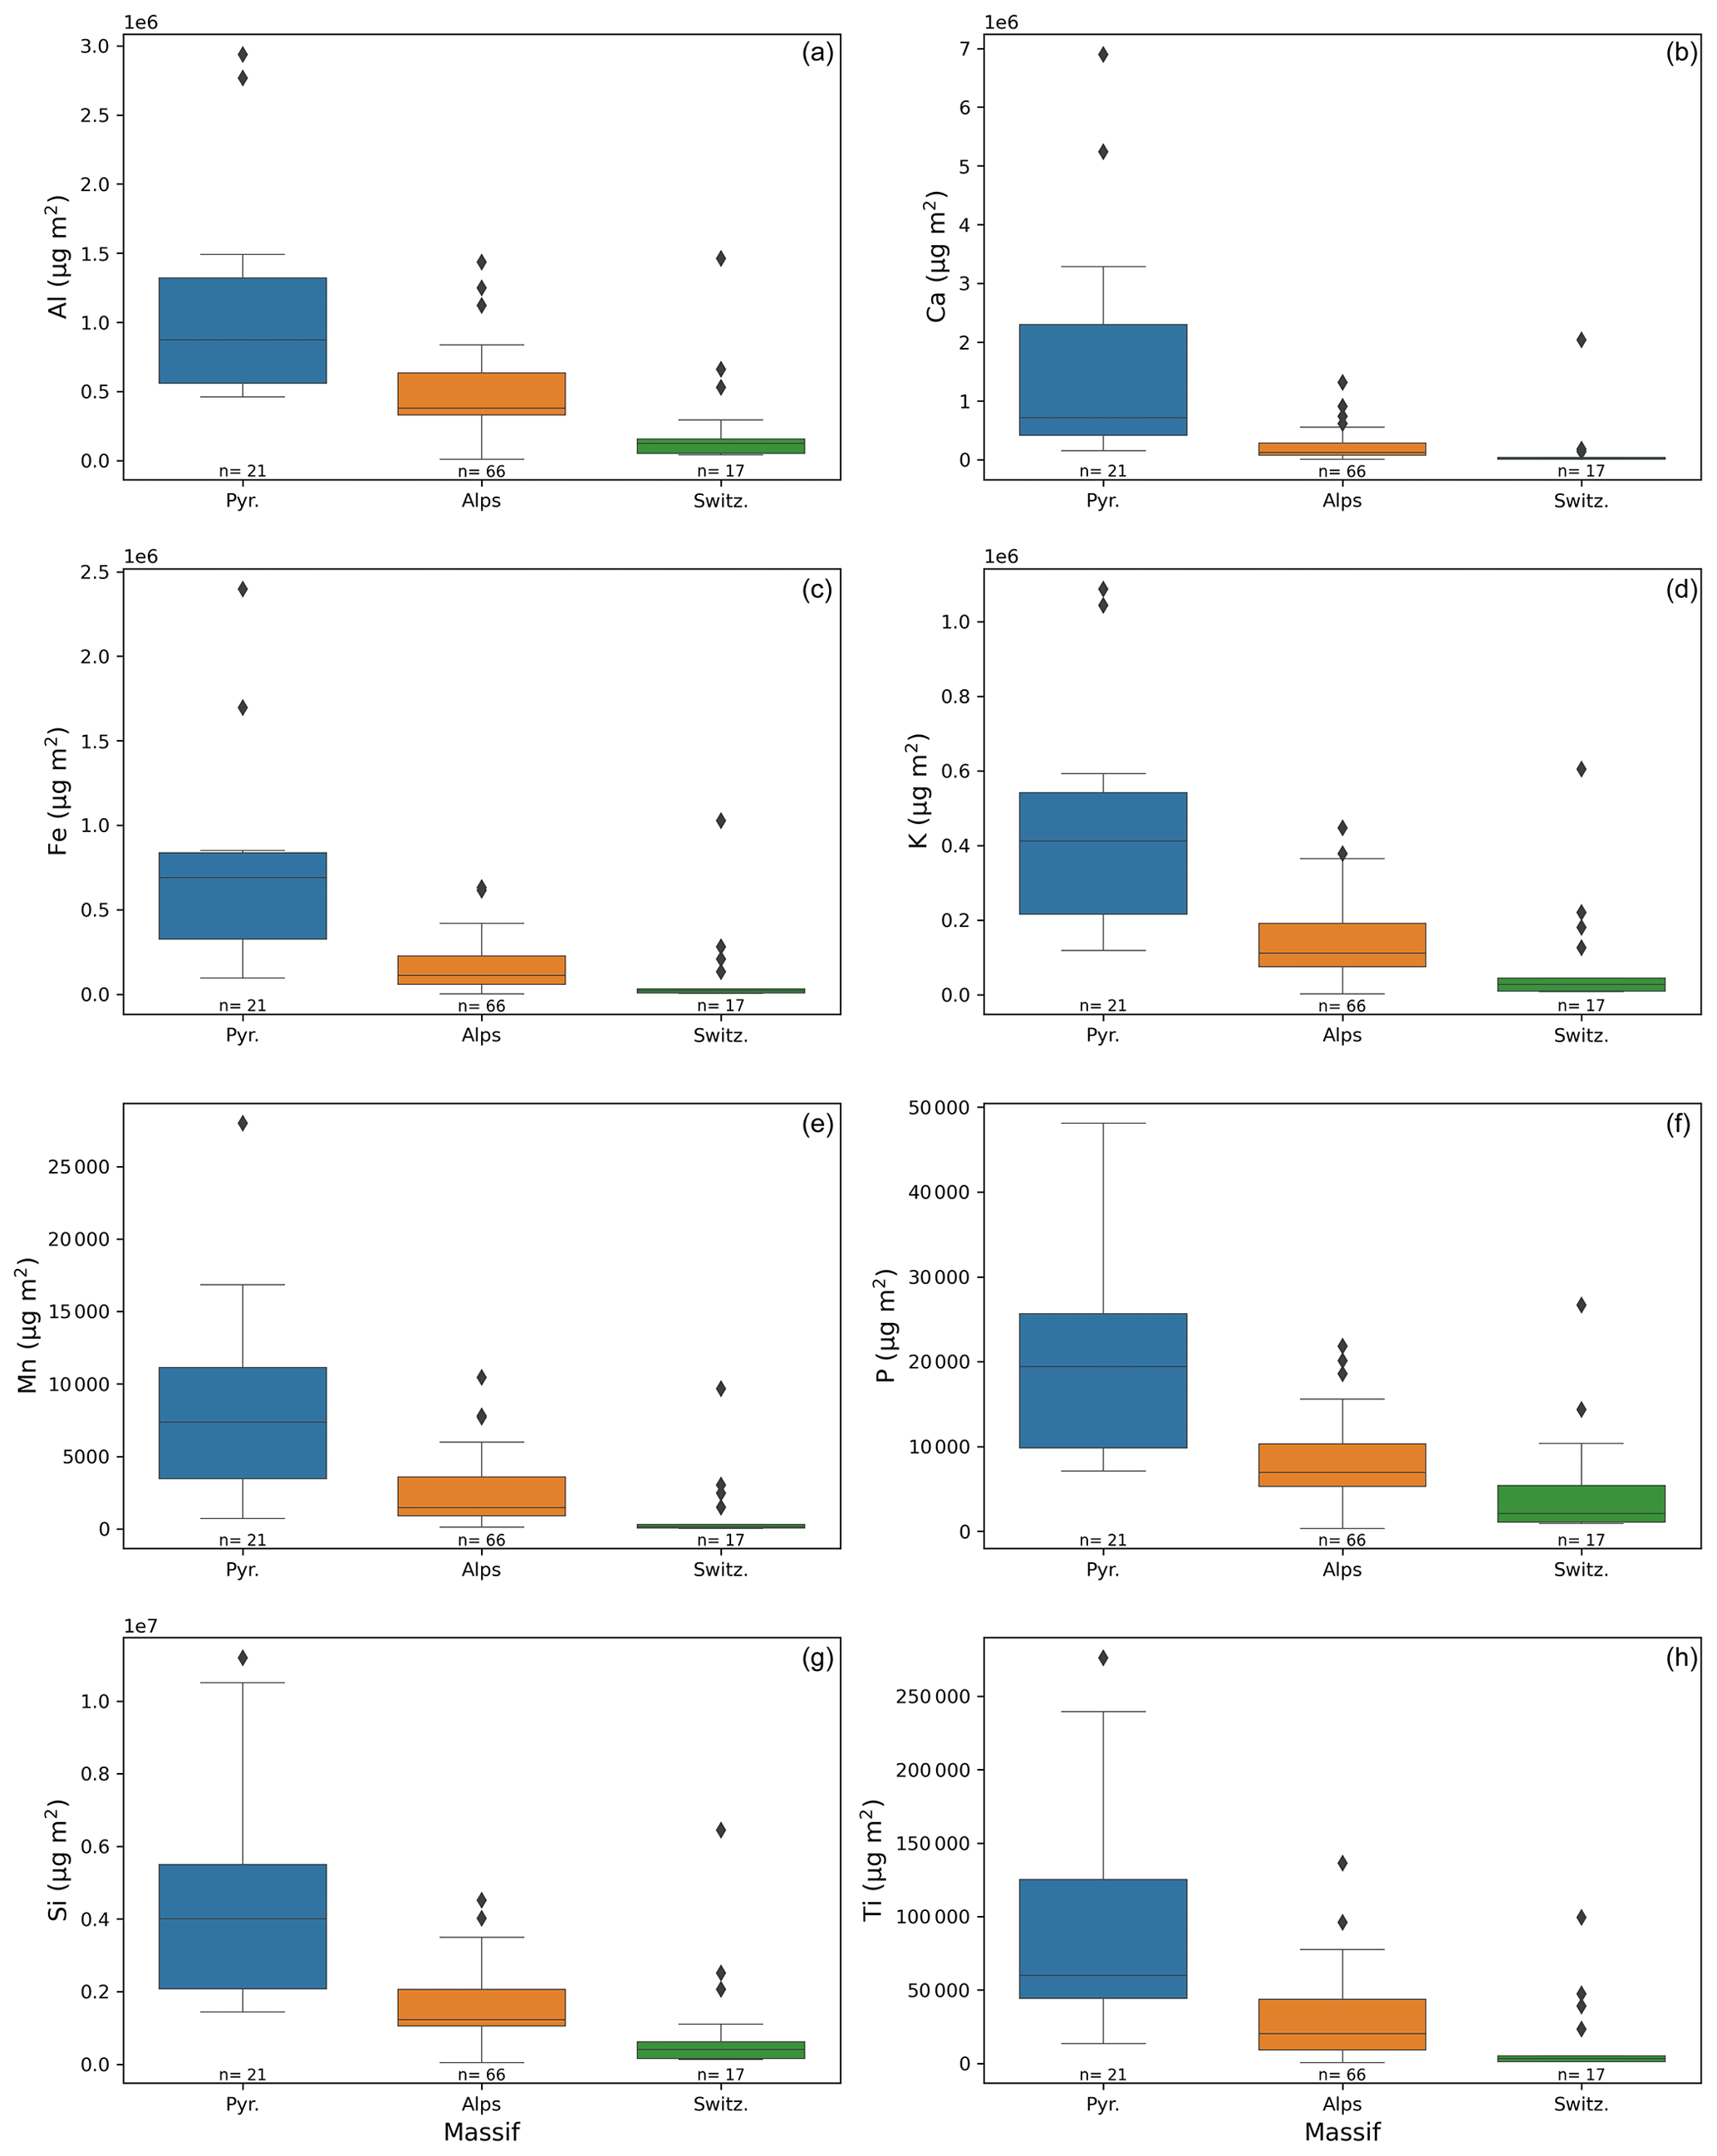
Figure 12Distribution of elemental mass against the massif. (a) Aluminium. (b) Calcium. (c) Iron. (d) Potassium. (e) Manganese. (f) Phosphorus. (g) Silicon. (h) Titanium. The boxes show the quartiles of the distribution corresponding to the spatial variability. The number of values used is indicated under each box. Minimum–maximum ranges are indicated by the whiskers, and outliers are represented by the black points.
Using a digital microscope, we found plastic fibres in a few samples. This means that local contamination may affect the results of some analyses. However, it has likely not influenced the elemental concentrations of the filters.
3.5 Optical properties
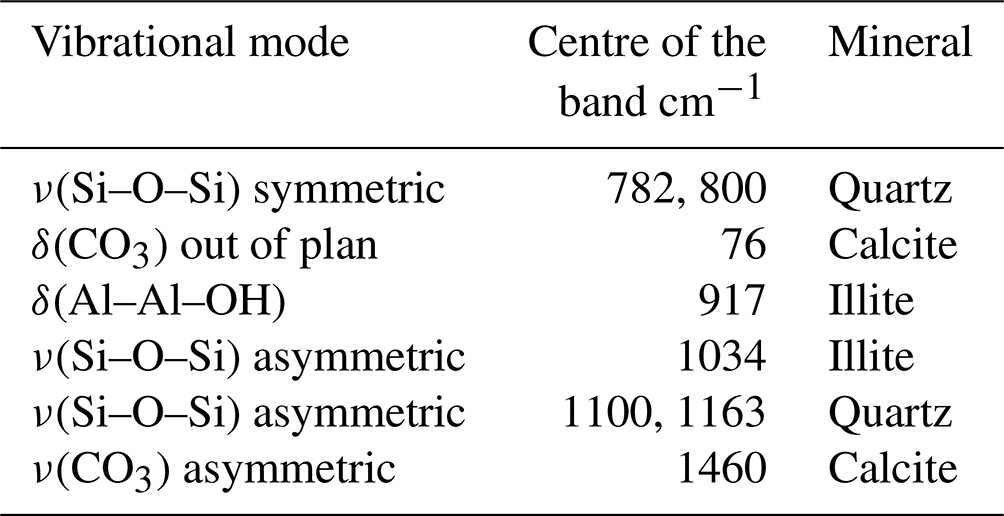
The infrared normalised extinction spectra obtained for the two samples are very similar (Fig. 13). The main feature at 1035 cm−1 can be assigned to the asymmetric stretching of the Si–O–Si bond of illite. From 1500 cm−1, the extinction gradually increases due to scattering with a steeper slope for the Pic du Midi sample compared to that of the Lautaret. This can be explained by the higher values of and σg for the Pic du Midi sample. These spectra have been smoothed by applying the Savitzky–Golay filter to identify other bands. A zoom (650–2000 cm−1) for each spectrum is shown in Fig. S6 with the assignment of all the characteristic bands of illite, quartz, and calcite (see also Table 2).
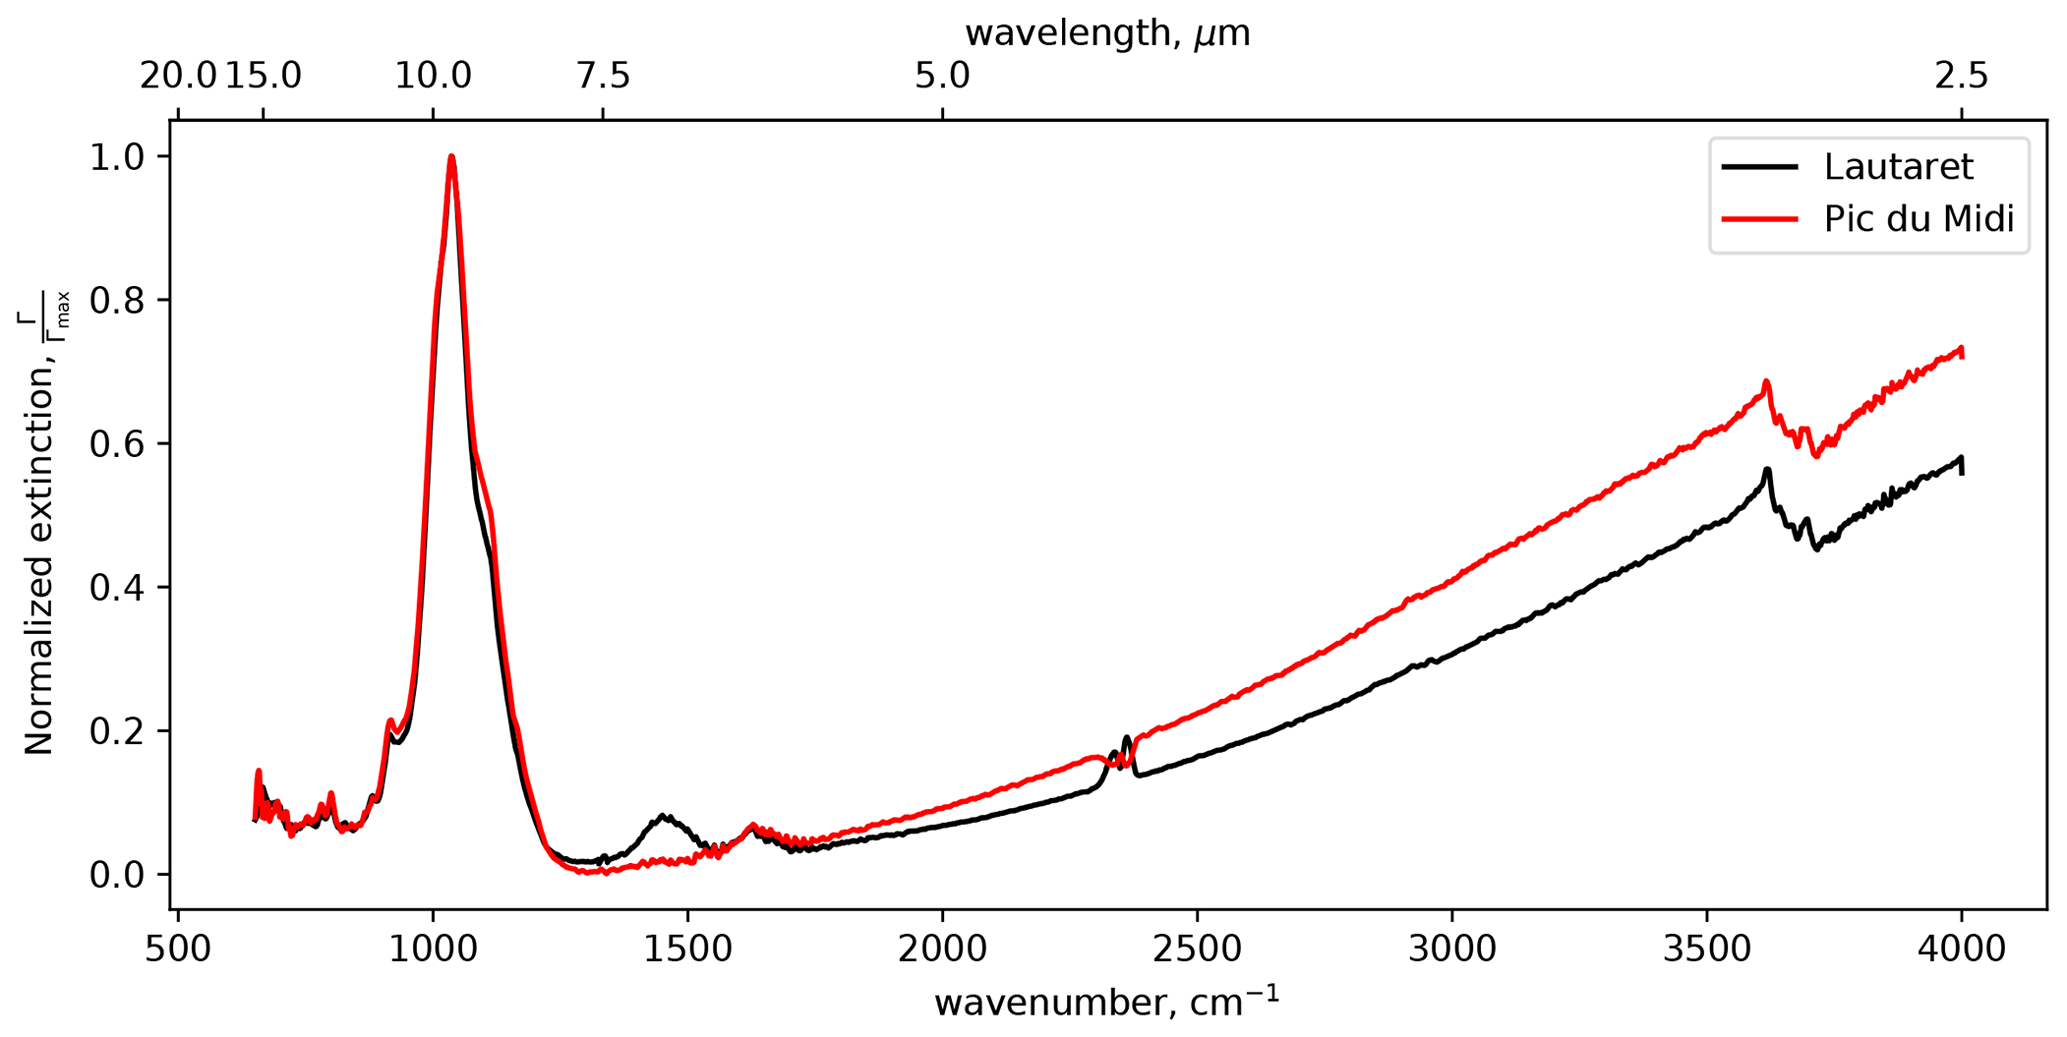
Figure 13Normalised extinction spectra for dust sampled at Lautaret and Pic du Midi. The bands observed at 2350 cm−1 are due to the absorption of residual CO2 in the cell.
Using Eq. (3) below, we simulate the extinction spectrum for the two samples by calculating a linear combination of the extinction spectra of the three minerals identified in Fig. S6:
where Γi is the extinction spectrum of the mineral; i and Ci are coefficients that are fitted by a least-squares fitting method, minimising the differences between the calculated extinction and the experimental extinction (i = q, il, and c for quartz, illite, and calcite). The calculation of the extinction spectrum for each mineral was performed using Mie optical theory (Herbin et al., 2017) by introducing the complex refractive indices (CRIs) recently determined by Deschutter (2022) as input data and a size distribution calculated using the fitted moments of the distribution listed in part 6.3.1. of Deschutter (2022).
The simulated spectra, as well as the differences, , are plotted in Fig. S6 for the two samples. The simulated extinction spectra fit very well with the experimental spectra, especially in the spectral window of 750–1550 cm−1 where the mean relative difference is less than 5 %. There are no direct relationships between the coefficients listed in the legend of Fig. S6 and the concentrations of the minerals in the two natural samples, but it gives trends for the relative proportion of each mineral. Both samples likely contain a large proportion of illite compared to quartz and calcite. The Pic du Midi sample does not contain calcite because Cc = 0 for this sample.
To estimate the mass extinction efficiency (MEE), the mass concentration is derived from the fitted size distribution assuming spherical particles with a mean density of ρp = 2.7 g cm−3. The values of the MEE are reported in Fig. S7 in the 650–4000 cm−1 spectral range. The maximum MEE is 0.39 m2 g−1 at 1035 cm−1 and 0.25 m2 g−1 at 1035 cm−1 for the Lautaret and Pic du Midi samples, respectively.
Table 2Assignment of the vibration modes (ν: stretching mode and δ: bending mode) with the corresponding mineral.
3.6 Radionuclide analyses
The combination of both the low quantity of dust material collected on the filters (= 0.3 g) and their relatively low activity in artificial radionuclides was insufficient to quantify the content in 137Cs (< 11.9 Bq kg−1) in the dust filter with the highest dust quantity (0.3 g). In a sample with a similar material quantity and that was prepared under the same conditions but that contains higher 137Cs activities (IAEA-444 soil material), this 137Cs activity could be quantified (72.9 ± 8.5 Bq kg−1) in good agreement with the certified value (68.5 ± 1.4 Bq kg−1).
With a higher quantity of dust material available (i.e. 13 g), the Barèges sample showed a 137Cs activity of 19.0 ± 0.5 Bq kg−1. This activity is higher than that typically observed in the upper layer of soils collected ca. 40∘ N (5 ± 2 Bq kg−1), which is likely explained by the very small particle size of dust deposited as clays are known to be enriched in fallout radionuclides (Evrard et al., 2020).
In addition to 137Cs detection, the activities in natural fallout radionuclides that were well detectable in both the ALP-34-FE filter and the much more abundant dust sample from Barèges demonstrated that both dust samples collected in 2021 were strongly tagged by short-lived radionuclides associated with rainfall (Pbxs ratios > 4), demonstrating their very recent deposition or their recent exposure to precipitation. These ratios are consistent with those analysed in other wet rainfall samples across Europe, as reviewed by Gourdin et al. (2014), and they remained on the same order of magnitude as those (> 4) analysed in fresh sediment collected from central France by Le Gall et al. (2017).
We found that the Pu isotopic signature of the Barèges dust sample was 0.173 ± 0.008.
3.7 Satellite data
Figure 14 shows the large spatial variability of the satellite-derived dust content, ranging from 0 to 8000 ppm. The dust concentration obtained from the satellite is retrieved as a mass fraction (mass of dust per unit of snow mass; see Sect. 2.7) and hence is not directly comparable to the dust mass obtained from the in situ samples (in kilograms per square metre, i.e. a mass per unit area). However, we observe a similar distribution of both quantities with the terrain aspect, with increased dust amount on south-facing slopes in both datasets (Fig. 7).
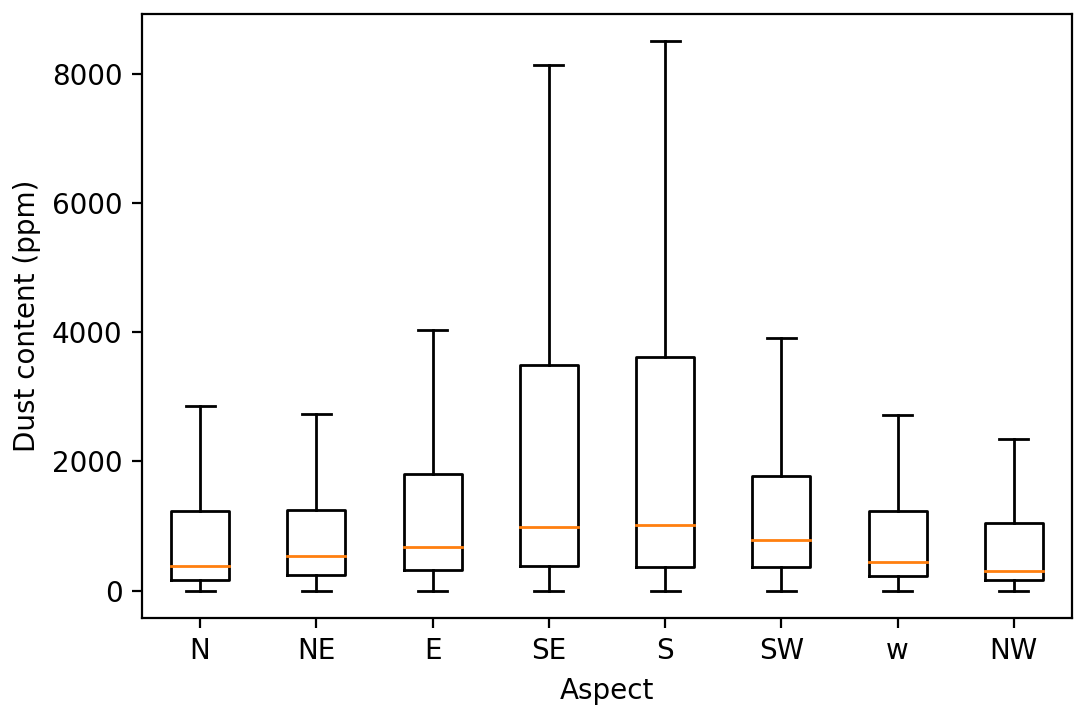
Figure 14Dust content on 6 February 2021 in the Tabe and Vicdessos massifs (Pyrenees) from Sentinel-2 data aggregated by aspect classes. The box extends from the lower- to upper-quartile values of the data, with a line at the median. Outliers were not plotted.
The analysis of the samples reveals the strong spatial variability of the deposition rates, with a higher mass found at the locations where the dust plume arrived first (Pyrenees, mean 21.2 g m−2) than at the locations where the dust was deposited the latest (Swiss mountain ranges, mean 4.5 g m−2). A similar spatial trend is found in the particle size with a decrease in mean diameter from 21 (Pyrenees) to 15 µm (Switzerland). For the mass only, this large-scale pattern is superimposed on a more local gradient as we find more dust mass on the south- and southeast-facing slopes at the massif scale. This gradient is evident from the snow samples but also from remote sensing data. This suggests that large-scale monitoring using satellite data should be possible, although further work is needed to establish a more direct comparison and therefore to evaluate the uncertainty of such retrievals. Because the wind was blowing from the south and southeast during the dry-deposition event, the higher accumulation on south-facing slopes is consistent with the orographic effect (Mott et al., 2018). Regarding the dust size distribution, the comparison between the mass measured on the filters and the mass estimated from the size distribution shows that a substantial part of the dust mass is likely related to large particles, with a diameter larger than 50 µm (mass fraction likely to be higher than 50 %). Other studies have reported long-range transport of giant dust particles (with a diameter larger than 100 µm) (Varga et al., 2021; Adebiyi et al., 2023).
The elemental composition of the samples also exhibits a large-scale gradient, except for potassium. and ratios are similar to other values found in the literature for Saharan dust (Caponi et al., 2017), while the mass fraction of iron decreases from 11 % in the Pyrenees to 2 % in the Swiss mountain ranges. This wide range of values was also reported in Di Biagio et al. (2019). In the latter study, it is also shown that the optical properties of the dust strongly vary with the elemental iron, suggesting that the optical properties of the dust in the UV–VIS–VNIR range vary along transport within this single dust deposition event.
For the radionuclide analyses, the results obtained from the 13 g Barèges sample show that this larger sample quantity greatly facilitates gamma spectrometry measurements, and collecting a sample quantity of at least ≈ 10 g of dust could therefore be an objective in the case of future occurrences of Saharan dust episodes in Europe should other participatory dust collection campaigns be initiated. In addition to 137Cs detection, obtaining such a larger quantity of material would allow a better multiproxy characterisation of the dust, not only in gamma-emitting radionuclides (e.g. 137Cs, 7Be, and 210Pb) that can be quantified using physical and nondestructive measurement techniques but also in alpha-emitting radionuclides (e.g. Pu isotopes), which require time-consuming and destructive analyses (the typical test catch is 5 g per sample for Pu analyses).
The plutonium analyses conducted on the Barèges dust sample showed that the Pu isotopic signature of this sample (0.173 ± 0.008) perfectly matches that of the global fallout in the Northern Hemisphere (0.176 ± 0.007), largely dominated by USA and USSR thermonuclear tests conducted in the late 1950s and the early 1960s (Kelley et al., 1999). This is also corroborated by the Cs value of 0.021 found for the Barèges sample, remaining in the global fallout range (0.018–0.030) (UNSCEAR, 2008). These results confirm those obtained from Saharan dust samples collected in southern France in 2004 (Masson et al., 2010). Although the Pu isotopic signature of the fallout associated with the few atmospheric French nuclear tests conducted in the Sahara has not yet been published in public, it is unlikely that this signature perfectly coincides with that of the so-called global fallout (given that different types of bomb engines and fuels were used by the different countries). Accordingly, the public assertion that the 137Cs borne by Saharan dust originates from the French nuclear tests conducted in the Sahara between 1960 and 1966 is likely to be wrong (Berger, 2021). It is more likely to correspond to 137Cs released by the much more numerous and powerful tests conducted by the USA and the USSR in the Northern Hemisphere between 1954 and 1963 (French tests corresponded to 0.017 % of the total power generated by the worldwide tests during this period according to data from UNSCEAR, 2008). Nevertheless, more work is needed to define the Pu isotopic signature of the French test fallout in the Sahara. Furthermore, more dust samples collected at different locations should be analysed to confirm the current results.
Saharan dust plays an important role in the biogeochemical cycles of nutrient-poor environments such as some oceanic areas, tropical forests, and high-altitude oligotrophic lakes. A Saharan deposition event could supply an important proportion of the minerals, especially phosphorus inputs in high-altitude areas (Okin et al., 2004). Gross et al. (2015) examined phosphorus concentrations for five dust events over Cape Verde. P concentrations were highly variable, ranging from 1500 µg g−1 to 5500 µg g−1. Our dataset shows that, for a single event, the concentration range increased with distance from the source: while P concentrations were homogeneous in the Pyrenees ( µg g−1), a larger dispersion was observed in the Swiss Alps ( µg g−1). Dam et al. (2021) showed that P speciation evolves while crossing the Atlantic Ocean. With larger distances from the source along the transport path, more P and fewer Ca P minerals are present in the dust in relation to particle sorting and weathering. The homogeneous sampling of a single event that we performed in the current research showed similar behaviour, with a relative enrichment in P and Al and a relative loss of Ca and Fe during transport.
Data presented in this study are available at https://doi.org/10.5281/zenodo.7969515 (Dumont et al., 2022a). The dataset contains the mass and size data for each sample, as well as the exact coordinates of each sample. It also contains the elemental composition of the samples, as well as the calibration function of XRF. A data file is also provided for the optical properties (MEE and extinction) and for the radionuclide analysis.
We presented data from 113 dust samples collected in snow after a major dust event in February 2021 in southwest Europe. The samples were spatially distributed from the Pyrenees to the French and Swiss Alps, covering a wide range of topographic features. We obtained the samples from a citizen science campaign, which required a simple sampling protocol. We analysed various physicochemical properties, including deposited mass per unit area, particle size, elemental composition, radionuclide concentrations, and optical extinction. To our knowledge, this is the first time that such a large number of dust samples from a single dust event in the Pyrenees and the European Alps was collected and analysed with multiple analytical tools. A second citizen campaign was launched for the second of the two dust events late February 2021 in Finland (Meinander et al., 2022). We provide the results of our analyses along with the geographic coordinates of every sampling site.
The dataset should be useful to evaluate the skills of atmospheric transport models (e.g. Baladima et al., 2022). The measured properties of the dust could also be used for impact studies, such as for quantifying the impact of the dust on snow cover duration in Europe (e.g. Réveillet et al., 2022).
The analysis of the dataset already revealed the following noteworthy results:
-
We find a gradient in the dust mass and the dust size distribution with distance along the dust plume. Larger masses and sizes are found at the locations where the dust plume arrived first (the Pyrenees in this case). This gradient is also found in the elemental composition. For instance, the total elemental iron mass is higher in samples from the Pyrenees than in those from the Swiss mountain ranges. This suggests that dust optical properties could vary along transport within a single event. An opposite trend is observed for P, with important implications for the biogeochemical functioning of ecosystems.
-
In addition to this large-scale spatial pattern, we find a higher dust mass on the south- and southeast-facing slopes, suggesting preferential dust deposition on windward slopes.
-
A plutonium analysis shows that the isotopic signature of the dust perfectly matches that of the global fallout in the Northern Hemisphere, contrary to what was announced by the media (i.e. origin associated with the French nuclear tests in the 1970s in the Sahara).
-
Sentinel-2 multispectral remote sensing imagery is promising for characterising this spatial variability, although further work is needed to evaluate the uncertainties of this method.
It is remarkable to find consistent spatial trends, which are compatible with physical processes despite the heterogeneity of the sample sources of this campaign. Although some participants are snow measurement experts, many others were not trained to collect environmental samples and data. Tools and containers to collect the samples were not standardised. The sampling method was as simple as possible to avoid discouraging nonexpert people. Therefore, we could obtain sufficient samples to compensate for errors and inaccuracies during the data collection process. However, the sampling protocol of future campaigns should be improved for optical property measurements and radionuclide analyses since more dust mass is needed for such measurements than what could be sampled. Several advantages contributed to the success of the citizen campaign; notably, snow is a relatively accessible substrate, mineral dust is almost stable once deposited in the snow, and the main laboratories involved in the citizen campaign are located close to the sampling areas.
The above results show that involving citizens in the data collection process can lead to scientific advances beyond the current knowledge, hereby shedding light on the spatial variability of Saharan dust properties deposited across European mountain ranges. This campaign was also a unique opportunity to generate informal exchanges between scientists and citizens. From our perspective as scientists, it was particularly stimulating to meet people curious about our work and supporting our research. We will continue to use this dataset to try to answer some of the key questions that we were asked by the participants. In particular, we aim to better characterise the impact of dust deposition on (i) snowmelt runoff, hydrological resources, and ski resort management (Dumont et al., 2020; Réveillet et al., 2022); (ii) glacier mass balance; (iii) avalanche hazard (Dick et al., 2023); and (iv) ecosystem productivity.
The video is available at https://doi.org/10.5281/zenodo.7457613 (Dumont et al., 2022b).
The supplement related to this article is available online at: https://doi.org/10.5194/essd-15-3075-2023-supplement.
MD, SG, DV, and SM designed the citizen campaign. AF collected a dust sample in Barèges. OE, IL, and AD conducted the radionuclide analyses. GLR, LG, and SH conducted elemental-composition analysis. FT and MR participated in the data analysis. AG and CV performed the mass and Coulter measurements. AD, DP, and HH performed the optical-property measurements. JT and MS coordinated the Swiss sampling. LA, MB, MBP, CC, LD, FF, AF, MF, IG, PH, BJ, QL, PS, LL, AR, ET, MV, and LVG participated in the sampling. BJ provided the MOCAGE data. MD, SG, and MR wrote the paper with contributions from all the co-authors.
The contact author has declared that none of the authors has any competing interests.
Publisher’s note: Copernicus Publications remains neutral with regard to jurisdictional claims in published maps and institutional affiliations.
The authors are thankful to Ghislain Picard for their help in designing the field campaign, Florence Besson and Marine Jeoffrion for their support with the MOCAGE data, and Chloé Lefebvre and Laurine Fouassier for their help with the XRF analysis. P-XRF instruments were generously loaned by the GEODE laboratory (Magali Philippe). We deeply thank the 87 citizens who collected the samples and made this study possible (J. L. Ottenio, M. Fructus, I. Lecot, C. Lauvernet, L. Lombard, M. Lhote, M. Fontanille, R. and J. Gottardi, G. Ballini, F. Estival, F. Mandel, M. Barral, A. Durain, J. Grisillon, M. Raveton, M. Chapuis, J. Puig, C. Ogier, L. Guy, C. Hubert, F. Gillet, D. Rouanoux, F. Pikorki, M. Fontanil, V. Barthes, B. Gombert, C. Wendel, M. Bacardit, L. Koechlin, E. Mougin, L. Zawadzki, L. Dufour, A. Barnoud, J. Saussede, A. Cluzet, M. Beguin, B. Malan, D. Menez, P. René, L. Voisin, H. Lilyane, S. Grenier, O. Antoire, F. Pikorki, R. Pilon, B. Luks, B. Frere, C. Mercier, J. Grisillon, F. Miller, J. B. Portier, V. Clouard, N. Robbe, H. Löwe, P. Schneiter, S. Jourdan, A. Putey, R. Tessier). We thank the observers at SLF for their spontaneous additional sampling efforts (H. Rhyner-Elmer, G. Darms, J.-P. Wagnières, R. Troillet, V. Bettler, P. Schneiter, A. Heim, R. Tomamichel, C. Egler, G. Valenti, P. Erne, B. Bournissen, J.-L. Lugon, and G. Kappenberger).
This research has been supported by the European Research Council, the H2020 European Research Council (grant no. 949516), and the Agence Nationale de la Recherche (grant nos. ANR-21-CE34-0001, ANR-16-CE01-0006, ANR-11-LABX-0005-01, and ANR-10-LABX-0056).
This paper was edited by David Carlson and reviewed by two anonymous referees.
Adebiyi, A., Kok, J. F., Murray, B. J., Ryder, C. L., Stuut, J.-B. W., Kahn, R. A., Knippertz, P., Formenti, P., Mahowald, N. M., Pérez García-Pando, C., Klose, M., Ansmann, A., Samset, B. H., Ito, A., Balkanski, Y., Di Biagio, C., Romanias, M. N., Huang, Y., and Meng, J.: A review of coarse mineral dust in the Earth system, Aeolian Res., 60, 100849, https://doi.org/10.1016/j.aeolia.2022.100849, 2023. a
Baladima, F., Thomas, J. L., Voisin, D., Dumont, M., Junquas, C., Kumar, R., Lavaysse, C., Marelle, L., Parrington, M., and Flemming, J.: Modeling an Extreme Dust Deposition Event to the French Alpine Seasonal Snowpack in April 2018: Meteorological Context and Predictions of Dust Deposition, J. Geophys. Res.-Atmos., 127, e2021JD035745, https://doi.org/10.1029/2021JD035745, 2022. a, b, c
Berger, A.: Cesium-137: les poussières radioactives retrouvées dans le sable du Sahara sont-elles dangereuses?, section: economie-et-politique, https://www.capital.fr/economie-politique/cesium-137-les-poussieres-radioactives-retrouvees-dans-les-poussieres-de-sable-du-sahara-sont-elles-dangereuses-1395362 (last access: 17 July 2023), 2021. a, b
Caponi, L., Formenti, P., Massabó, D., Di Biagio, C., Cazaunau, M., Pangui, E., Chevaillier, S., Landrot, G., Andreae, M. O., Kandler, K., Piketh, S., Saeed, T., Seibert, D., Williams, E., Balkanski, Y., Prati, P., and Doussin, J.-F.: Spectral- and size-resolved mass absorption efficiency of mineral dust aerosols in the shortwave spectrum: a simulation chamber study, Atmos. Chem. Phys., 17, 7175–7191, https://doi.org/10.5194/acp-17-7175-2017, 2017. a, b, c, d
Dam, T. T. N., Angert, A., Krom, M. D., Bigio, L., Hu, Y., Beyer, K. A., Mayol-Bracero, O. L., Santos-Figueroa, G., Pio, C., and Zhu, M.: X-ray Spectroscopic Quantification of Phosphorus Transformation in Saharan Dust during Trans-Atlantic Dust Transport, Environ. Sci. Technol., 55, 12694–12703, https://doi.org/10.1021/acs.est.1c01573, 2021. a
DeCarlo, P. F., Slowik, J. G., Worsnop, D. R., Davidovits, P., and Jimenez, J. L.: Particle Morphology and Density Characterization by Combined Mobility and Aerodynamic Diameter Measurements. Part 1: Theory, Aerosol Sci. Technol., 38, 1185–1205, https://doi.org/10.1080/027868290903907, 2004. a
Delmonte, B., Petit, J., Andersen, K. K., Basile-Doelsch, I., Maggi, V., and Ya Lipenkov, V.: Dust size evidence for opposite regional atmospheric circulation changes over east Antarctica during the last climatic transition, Clim. Dynam., 23, 427–438, https://doi.org/10.1007/s00382-004-0450-9, 2004. a
Deschutter, L.: Optical properties of Gobi dust and its pure compounds: experimental extinction spectra and complex refractive indices determination, Ph.D. thesis, University of Lille, 2022. a, b
Di Biagio, C., Formenti, P., Balkanski, Y., Caponi, L., Cazaunau, M., Pangui, E., Journet, E., Nowak, S., Andreae, M. O., Kandler, K., Saeed, T., Piketh, S., Seibert, D., Williams, E., and Doussin, J.-F.: Complex refractive indices and single-scattering albedo of global dust aerosols in the shortwave spectrum and relationship to size and iron content, Atmos. Chem. Phys., 19, 15503–15531, https://doi.org/10.5194/acp-19-15503-2019, 2019. a, b, c
Dick, O., Viallon-Galinier, L., Tuzet, F., Hagenmuller, P., Fructus, M., Reuter, B., Lafaysse, M., and Dumont, M.: Can Saharan dust deposition impact snowpack stability in the French Alps?, The Cryosphere, 17, 1755–1773, https://doi.org/10.5194/tc-17-1755-2023, 2023. a
Dumont, M., Tuzet, F., Gascoin, S., Picard, G., Kutuzov, S., Lafaysse, M., Cluzet, B., Nheili, R., and Painter, T. H.: Accelerated snow melt in the Russian Caucasus mountains after the Saharan dust outbreak in March 2018, J. Geophys. Res.-Earth, 125, e2020JF005641, https://doi.org/10.1029/2020JF005641, 2020. a, b, c, d, e
Dumont, M., Gascoin, S., Reveillet, M., Voisin, D., Evrard, O., Gandois, L., Herbin, H., Roux, G. L., and Lefevre, I.: Dataset related to the study “Spatial variability of Saharan dust deposition revealed through a citizen science campaign”, Zenodo [data set], https://doi.org/10.5281/zenodo.7969515, 2022a. a, b
Dumont, M., Josse, B., Gascoin, S., and Reveillet, M.: Video related to the study “Spatial variability of Saharan dust deposition revealed through a citizen science campaign”, Zenodo [video], https://doi.org/10.5281/zenodo.7457613, 2022.
Evrard, O., Pointurier, F., Onda, Y., Chartin, C., Hubert, A., Lepage, H., Pottin, A.-C., Lefèvre, I., Bonté, P., Laceby, J. P., and Ayrault, S.: Novel Insights into Fukushima Nuclear Accident from Isotopic Evidence of Plutonium Spread along Coastal Rivers, Environ. Sci. Technol., 48, 9334–9340, https://doi.org/10.1021/es501890n, 2014. a
Evrard, O., Chaboche, P.-A., Ramon, R., Foucher, A., and Laceby, J. P.: A global review of sediment source fingerprinting research incorporating fallout radiocesium (137Cs), Geomorphology, 362, 107103, https://doi.org/10.1016/j.geomorph.2020.107103, 2020. a
Flanner, M. G., Arnheim, J. B., Cook, J. M., Dang, C., He, C., Huang, X., Singh, D., Skiles, S. M., Whicker, C. A., and Zender, C. S.: SNICAR-ADv3: a community tool for modeling spectral snow albedo, Geosci. Model Dev., 14, 7673–7704, https://doi.org/10.5194/gmd-14-7673-2021, 2021. a
Francis, D., Fonseca, R., Nelli, N., Bozkurt, D., Picard, G., and Guan, B.: Atmospheric rivers drive exceptional Saharan dust transport towards Europe, Atmos. Res., 266, 105959, https://doi.org/10.1016/j.atmosres.2021.105959, 2022. a, b, c
Gascoin, S., Grizonnet, M., Bouchet, M., Salgues, G., and Hagolle, O.: Theia Snow collection: high-resolution operational snow cover maps from Sentinel-2 and Landsat-8 data, Earth Syst. Sci. Data, 11, 493–514, https://doi.org/10.5194/essd-11-493-2019, 2019. a
Ginoux, P.: Warming or cooling dust?, Nat. Geosci., 10, 246–248, https://doi.org/10.1038/ngeo2923, 2017. a
Gourdin, E., Evrard, O., Huon, S., Reyss, J.-L., Ribolzi, O., Bariac, T., Sengtaheuanghoung, O., and Ayrault, S.: Spatial and temporal variability of 7Be and 210Pb wet deposition during four successive monsoon storms in a catchment of northern Laos, J. Environ. Radioactiv., 136, 195–205, https://doi.org/10.1016/j.jenvrad.2014.06.008, 2014. a
Greilinger, M. and Kasper-Giebl, A.: Saharan Dust Records and Its Impact in the European Alps, Oxford University Press, https://doi.org/10.1093/acrefore/9780190228620.013.827, 2021. a
Gross, A., Goren, T., Pio, C., Cardoso, J., Tirosh, O., Todd, M. C., Rosenfeld, D., Weiner, T., Custódio, D., and Angert, A.: Variability in Sources and Concentrations of Saharan Dust Phosphorus over the Atlantic Ocean, Environ. Sci. Technol., 2, 31–37, https://doi.org/10.1021/ez500399z, 2015. a
Hagolle, O., Huc, M., Villa Pascual, D., and Dedieu, G.: A Multi-Temporal and Multi-Spectral Method to Estimate Aerosol Optical Thickness over Land, for the Atmospheric Correction of FormoSat-2, LandSat, VENµS and Sentinel-2 Images, Remote Sens., 7, 2668–2691, https://doi.org/10.3390/rs70302668, 2015. a
Hagolle, O., Huc, M., Desjardins, C., Auer, S., and Richter, R.: MAJA Algorithm Theoretical Basis Document, https://doi.org/10.5281/zenodo.1209633, 2017. a
He, C. and He, C.: Modelling light-absorbing particle–snow–radiation interactions and impacts on snow albedo: fundamentals, recent advances and future directions, Environ. Chem., 19, 296–311, https://doi.org/10.1071/EN22013, 2022. a, b
Herbin, H., Pujol, O., Hubert, P., and Petitprez, D.: New approach for the determination of aerosol refractive indices – Part I: Theoretical bases and numerical methodology, J. Quant. Spectrosc. Ra., 200, 311–319, https://doi.org/10.1016/j.jqsrt.2017.03.005, 2017. a
Hubert, P., Herbin, H., Visez, N., Pujol, O., and Petitprez, D.: New approach for the determination of aerosol refractive indices – Part II: Experimental set-up and application to amorphous silica particles, J. Quant. Spectrosc. Ra., 200, 320–327, https://doi.org/10.1016/j.jqsrt.2017.03.037, 2017. a
Josse, B., Simon, P., and Peuch, V.-H.: Radon global simulations with the multiscale chemistry and transport model MOCAGE, Tellus B, 56, 339–356, 2004. a
Kelley, J., Bond, L., and Beasley, T.: Global distribution of Pu isotopes and 237Np, Sci. Total Environ., 237-238, 483–500, https://doi.org/10.1016/S0048-9697(99)00160-6, 1999. a
Le Gall, M., Evrard, O., Foucher, A., Laceby, J. P., Salvador-Blanes, S., Manière, L., Lefèvre, I., Cerdan, O., and Ayrault, S.: Investigating the temporal dynamics of suspended sediment during flood events with 7Be and 210Pbxs measurements in a drained lowland catchment, Sci. Rep., 7, 42099, https://doi.org/10.1038/srep42099, 2017. a
Masson, O., Piga, D., Gurriaran, R., and Amico, D. D.: Impact of an exceptional Saharan dust outbreak in France: PM10 and artificial radionuclides concentrations in air and in dust deposit, Atmos. Environ., 44, 2478–2486, https://doi.org/10.1016/j.atmosenv.2010.03.004, 2010. a
Meinander, O., Alvarez Piedehierro, A., Kouznetsov, R., Rontu, L., Welti, A., Kaakinen, A., Heikkinen, E., and Laaksonen, A.: Saharan dust transported and deposited in Finland on 23 February 2021, in: EGU General Assembly Conference Abstracts, EGU22–4818, https://doi.org/10.5194/egusphere-egu22-4818, 2022. a
Mott, R., Vionnet, V., and Grünewald, T.: The seasonal snow cover dynamics: review on wind-driven coupling processes, Front. Earth Sci., 6, 197, https://doi.org/10.3389/feart.2018.00197, 2018. a
Mărmureanu, L., Marin, C. A., Andrei, S., Antonescu, B., Ene, D., Boldeanu, M., Vasilescu, J., Viţelaru, C., Cadar, O., and Levei, E.: Orange Snow — A Saharan Dust Intrusion over Romania During Winter Conditions, Remote Sens., 11, 2466, https://doi.org/10.3390/rs11212466, 2019. a
Nickovic, S., Cvetkovic, B., Petković, S., Amiridis, V., Pejanović, G., Solomos, S., Marinou, E., and Nikolic, J.: Cloud icing by mineral dust and impacts to aviation safety, Sci. Rep., 11, 1–9, https://doi.org/10.1038/s41598-021-85566-y, 2021. a
Okin, G. S., Mahowald, N., Chadwick, O. A., and Artaxo, P.: Impact of desert dust on the biogeochemistry of phosphorus in terrestrial ecosystems, Global Biogeochem. Cy., 18, GB2005, https://doi.org/10.1029/2003GB002145, 2004. a, b
Pey, J., Revuelto, J., Moreno, N., Alonso-González, E., Bartolomé, M., Reyes, J., Gascoin, S., and López-Moreno, J. I.: Snow Impurities in the Central Pyrenees: From Their Geochemical and Mineralogical Composition towards Their Impacts on Snow Albedo, Atmosphere, 11, 937, https://doi.org/10.3390/atmos11090937, 2020. a
Réveillet, M., Dumont, M., Gascoin, S., Lafaysse, M., Nabat, P., Ribes, A., Nheili, R., Tuzet, F., Ménégoz, M., Morin, S., Picard, G., and Ginoux, P.: Black carbon and dust alter the response of mountain snow cover under climate change, Nat. Commun., 13, 5279, https://doi.org/10.1038/s41467-022-32501-y, 2022. a, b, c, d
Rieger, D., Steiner, A., Bachmann, V., Gasch, P., Förstner, J., Deetz, K., Vogel, B., and Vogel, H.: Impact of the 4 April 2014 Saharan dust outbreak on the photovoltaic power generation in Germany, Atmos. Chem. Phys., 17, 13391–13415, https://doi.org/10.5194/acp-17-13391-2017, 2017. a
Schladitz, A., Müller, T., Kaaden, N., Massling, A., Kandler, K., Ebert, M., Weinbruch, S., Deutscher, C., and Wiedensohler, A.: In situ measurements of optical properties at Tinfou (Morocco) during the Saharan Mineral Dust Experiment SAMUM 2006, Tellus B, 61, 64–78, https://doi.org/10.1111/j.1600-0889.2008.00397.x, 2009. a
Skiles, S. M. and Painter, T. H.: Toward Understanding Direct Absorption and Grain Size Feedbacks by Dust Radiative Forcing in Snow With Coupled Snow Physical and Radiative Transfer Modeling, Water Resour. Res., 55, 7362–7378, https://doi.org/10.1029/2018WR024573, 2019. a
Skiles, S. M., Flanner, M., Cook, J. M., Dumont, M., and Painter, T. H.: Radiative forcing by light-absorbing particles in snow, Nat. Clim. Change, 8, 964–971, 2018. a, b
Tobías, A. and Stafoggia, M.: Modeling desert dust exposures in epidemiologic short-term health effects studies, Environ. Epidemiol., 31, 788–795, https://doi.org/10.1097/EDE.0000000000001255, 2020. a
Tuzet, F., Dumont, M., Arnaud, L., Voisin, D., Lamare, M., Larue, F., Revuelto, J., and Picard, G.: Influence of light-absorbing particles on snow spectral irradiance profiles, The Cryosphere, 13, 2169–2187, https://doi.org/10.5194/tc-13-2169-2019, 2019. a, b
UNSCEAR: Effects of Ionizing Radiation, United Nations Scientific Committee on the Effects of Atomic Radiation (UNSCEAR) 2006 Report, Volume I: Report to the General Assembly, Scientific Annexes A and B, United Nations, 2008. a, b
Varga, G.: Changing nature of Saharan dust deposition in the Carpathian Basin (Central Europe): 40 years of identified North African dust events (1979–2018), Environment International, 139, 105712, https://doi.org/10.1016/j.envint.2020.105712, 2020. a, b
Varga, G., Dagsson-Waldhauserová, P., Gresina, F., and Helgadottir, A.: Saharan dust and giant quartz particle transport towards Iceland, Sci. Rep., 11, 1–12, 2021. a
Vernay, M., Lafaysse, M., Monteiro, D., Hagenmuller, P., Nheili, R., Samacoïts, R., Verfaillie, D., and Morin, S.: The S2M meteorological and snow cover reanalysis over the French mountainous areas: description and evaluation (1958–2021), Earth Syst. Sci. Data, 14, 1707–1733, https://doi.org/10.5194/essd-14-1707-2022, 2022. a
Yu, H., Chin, M., Yuan, T., Bian, H., Remer, L. A., Prospero, J. M., Omar, A., Winker, D., Yang, Y., Zhang, Y., Zhang, Z., and Zhao, C.: The fertilizing role of African dust in the Amazon rainforest: A first multiyear assessment based on data from Cloud-Aerosol Lidar and Infrared Pathfinder Satellite Observations, Geophys. Res. Lett., 42, 1984–1991, https://doi.org/10.1002/2015GL063040, 2015. a