the Creative Commons Attribution 4.0 License.
the Creative Commons Attribution 4.0 License.
 | 29 Jun 2023
The Weisweiler passive seismological network: optimised for state-of-the-art location and imaging methods
Claudia Finger
Marco P. Roth
Marco Dietl
Aileen Gotowik
Nina Engels
Rebecca M. Harrington
Brigitte Knapmeyer-Endrun
Klaus Reicherter
Thomas Oswald
Thomas Reinsch
Erik H. Saenger
Passive seismic analyses are a key technology for the exploration and monitoring of subsurface reservoirs. Searching for alternative resources in the framework of the energy transition is creating a surge for identifying as many potential sites as possible suitable for geothermal exploitation. The Lower Rhine Embayment, at the western border of North Rhine-Westphalia in Germany, is an extensional system with a very high potential for geothermal exploitation. The area experiences moderate but continuous natural seismicity. Here, we report on a passive seismic dataset recorded with 48 seismic stations centred at and around Eschweiler–Weisweiler (https://doi.org/10.14470/MO7576467356, Finger et al., 2022). Background seismic noise levels are high at this site due to high levels of anthropogenic noise and thick unconsolidated sedimentary layers. The final station layout is a compromise between targeted network design and suitably quiet locations. We show that the network design allows for the application of state-of-the-art methods including waveform-based source location methods and ambient-noise velocity imaging methods.
- Article
(3574 KB) - Full-text XML
- BibTeX
- EndNote


Passive seismic datasets are a key technology for exploration and monitoring of subsurface reservoirs. Subsurface seismic velocity structures, changes in the reservoir, locations of (micro-)seismic events and focal mechanisms can be determined. Results can be interpreted in terms of fault stability, in situ stress conditions and seismic hazard. In contrast to active seismic surveys, passive seismic investigations are continuous and cost-efficient but less accurate. Therefore, passive seismic recordings are especially well suited to investigating spatio-temporal subsurface processes and can complement active seismic exploration.
The increased speed of the energy transition to renewable alternatives is creating a surge for identifying as many potential sites as possible suitable for geothermal exploitation. Economic thermal energy provision from geothermal resources requires proximity to consumers and pre-existing infrastructures. This increases environmental and societal concerns and can deteriorate the quality of passive seismic recordings through high levels of anthropogenic noise. Routinely applied methods (i.e. picking-based location schemes) are challenged and need to be supplemented or replaced by innovative methods capable of handling low signal-to-noise ratios Li et al. (2020).
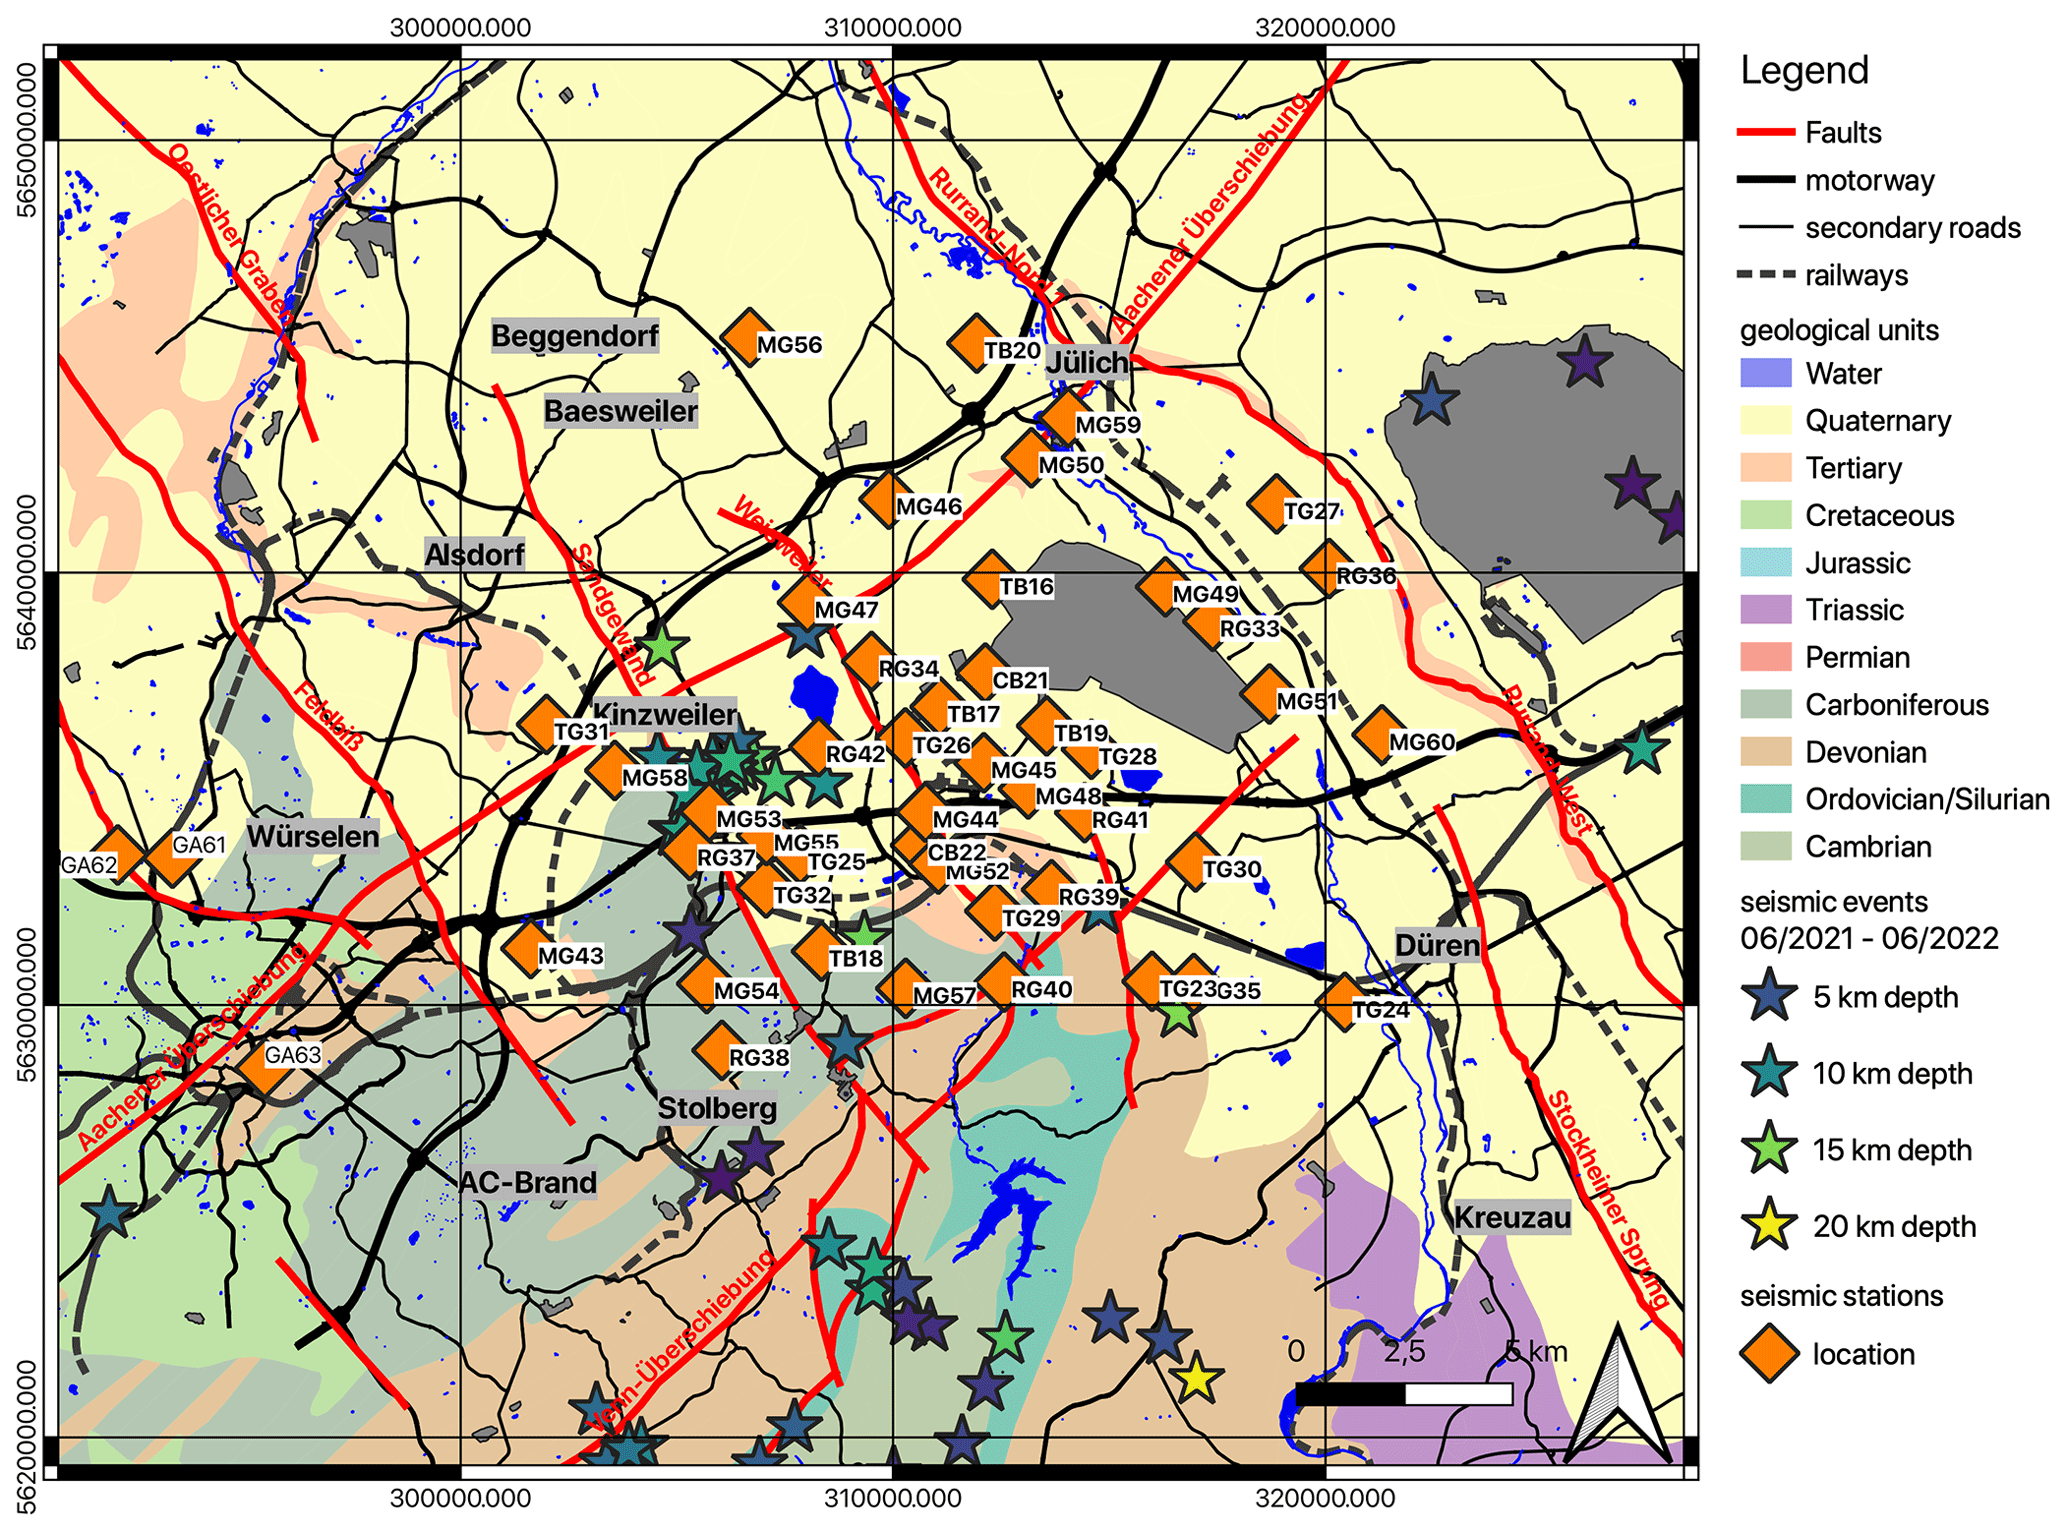
Figure 1Study area in western Germany with major faults, roads and railways overlain on a geological map (GD NRW, 2022) with seismic event locations as reported by Earthquake Observatory Bensberg University Cologne (2022) from June 2021 to June 2022 and station locations of the Weisweiler network marked with squares.
The Lower Rhine Embayment (LRE), at the western border of North Rhine-Westphalia in Germany, is an extensional system with a very high potential for geothermal exploitation (Fritschle et al., 2021) but also moderate but continuous natural seismicity (Hinzen et al., 2021) and elevated seismic hazard (Grünthal et al., 2018). With increasing interest of local municipalities to substitute their energy and heat production with renewable alternatives, the LRE has become a focal point for geothermal investigations (Fritschle et al., 2021). Projected active seismic exploration activities for the field laboratory planned in Eschweiler–Weisweiler are preceded by about a year of passive seismic recordings with 48 seismic stations (Fig. 1). The full waveform dataset presented here is available from Finger et al. (2022), with a few select stations embargoed until Dec 2025. Additional network metadata can be found on the GEOFON website, accessible through Finger et al. (2022).
The seismic station network design used to acquire the waveform dataset allows for the application of state-of-the-art methods including waveform-based source location methods (Li et al., 2020) and ambient-noise velocity imaging methods (Rost and Thomas, 2002). Waveform-based source location methods do not rely on the identification of individual events or phases in the seismograms and are, thus, more robust when noise levels are high. Most waveform-based location methods, such as time-reverse imaging (TRI) (e.g. Finger and Saenger, 2021), use wavefield migrations and need sufficient station coverage and adequate velocity models to produce precise locations. Ambient-noise methods can provide velocity models of reservoirs without the need for active or passive sources. They are ideally suited to sites with little to no natural seismicity and sites where dense population hinders active seismic surveys. Typically, surface waves are investigated using interferometric (e.g. Berg et al., 2018) or beamforming approaches (e.g. Löer et al., 2020). Adequate sampling in space is needed to enable robust application of ambient-noise methods without aliasing. Here, we estimate the network performance using reported quality control measures for time-reverse imaging (TRI) (Finger and Saenger, 2020) and three-component beamforming (3CB) (Löer et al., 2020) to demonstrate the applicability of the methods to our network design.
The LRE is an extensional system and represents the northwestern branch of the Rhine graben structure. Horst and graben structures with thick unconsolidated sediments form the dominant geological structure of the LRE. Most subsurface information is limited to the shallowest kilometre and stems from extensive lignite mining activities in the area (Vanneste et al., 2013). Major faults are oriented northwest–southeast intersected perpendicularly with overthrust faults (Fig. 1). The region is tectonically active with moderate but continuous seismic activity (Vanneste et al., 2013).
Numerous northwest–southeast striking faults with an average strike direction of N130∘ E are intersected perpendicular by larger overthrust faults (Vanneste et al., 2013). Fault dips are estimated to be 50–65∘ but cannot be assigned to individual faults due to a lack of deeper subsurface information (Vanneste et al., 2013). Mean slip rates on the normal faults generally do not exceed 0.07 mm yr−1 but vary from fault to fault (Vanneste et al., 2013). The stress state at the faults has been investigated with focal mechanisms, and the maximum stress is oriented towards N305∘ E (Hinzen, 2003), supporting the overall extensional stress regime. On a local scale, the stress regime changes with depth. The shallower part (above 12 km) has a normal faulting regime and the deeper part a strike-slip regime (Hinzen, 2003).
Seismicity in the LRE is moderate but constant with the largest instrumentally recorded seismic event recorded on 13 April 1992 near Roermond (the Netherlands) with a magnitude of Mb 6.0 (USGS, 2022). Static triggering was observed to propagate along the Roer Valley graben system, with aftershocks extending to Germany (Braunmiller et al., 1994). Dynamic triggering has been observed in our study area (Dietl, 2022). Based on the maximum fault rupture plane, the maximum possible magnitude is 7.1 (Vanneste et al., 2013), assuming complete failure of the fault at once. The estimated recurrence time for events with magnitudes larger than 5.5 is about 211 years (Leynaud et al., 2000). The seismogenic depth is estimated to be deeper than 25 km (Vanneste et al., 2013), with earthquakes regularly reported deeper than 5 km (Hinzen et al., 2021). Due to this ongoing seismic activity, the region is categorised in the highest seismic hazard category of Germany (Grünthal et al., 2018).
Permanent seismological monitoring is done by the Earthquake Observatory Bensberg, with an online bulletin published at http://www.seismo.uni-koeln.de/events/index.htm (last access: 25 August 2022). The Observatory Bensberg operates numerous seismic stations in western North Rhine-Westphalia and detected 88 seismic events in our study area during our investigation time frame from June 2021 to June 2022 (Fig. 1). Extensive seismic catalogues exist for the region (Hinzen et al., 2021) that we aim to refine and enhance with the dataset presented here.
Background seismic noise levels are expected to be high at this site due to the extensive lignite mining activities, wind turbines, industry complexes, and railroad and highway networks. Thick unconsolidated sediments further amplify seismic noise (Pilz et al., 2021). The massive lignite mines in the region additionally hinder the deployment of a truly dense network. Therefore, we aim for a trade-off between minimised anthropogenic noise and dense and regular inter-station spacings.
The passive seismic station network should serve three main objectives:
-
provide a high-quality passive seismic dataset for innovations in location and imaging methodology,
-
enable in-depth investigation of the seismo-tectonic processes in the deeper subsurface of a region with high levels of natural seismic hazard in central Europe,
-
enable estimation of geothermal potential and associated seismic hazard in the region.
The network is centred around the upcoming drill location for an exploration well in the context of wider geophysical exploration in the region (Fritschle et al., 2021). The inter-station spacing and total extent of the network are a compromise between dense station spacing and location and imaging capabilities in depths relevant to geothermal exploitation (2 to 4 km in this region; Fritschle et al., 2021). Major faults and known seismically active parts should be covered by the stations while avoiding the vicinity of strong anthropogenic noise sources.
We use two types of methods to illustrate the network design process (this section) and estimate the network performance (Sect. 4). The network should enable application of waveform-based source location schemes (Li et al., 2020) and frequency–wavenumber-based velocity imaging schemes (Rost and Thomas, 2002). The target depth to be analysed is slightly above and below the depth for geothermal exploitation and is, thus, 1 to 5 km. The horizontal extent of the network should enable the investigation of activity on major fault zones in the area to depths relevant to geothermal exploitation.
To design the seismic network, in a first step, the requirements of the methods are used to create an ideal network design. In a second step, the ideal locations are compared with local surroundings to exclude major anthropogenic influences. The final step consists of finding a compromise between the ideal station layout and secure locations offered by citizens and local industries.
Time-reverse imaging (TRI) is a waveform-based method for locating seismic events (Finger and Saenger, 2021). The recommended network design for TRI can be estimated roughly (Werner and Saenger, 2018) and then tested numerically (Finger and Saenger, 2020). The results are comparable to other waveform-based migration methods (e.g. Shi et al., 2022). Werner and Saenger (2018) report that the average station spacing should be smaller than the minimum target depth. The total aperture of the network should be at least twice the maximum target depth. Subsequently, we aimed for an inter-station spacing of 1 km and a total aperture of at least 10 km. Throughout the design, the station network performance was checked numerically using the workflow proposed by Finger and Saenger (2020). The final network performance for TRI is described in Sect. 4.2.
Three-component beamforming (Löer et al., 2020) is a frequency–wavenumber-based method using ambient noise for deriving wave types, wavenumbers and azimuths in small time windows and for discrete frequencies. The obtained dispersion characteristics can be used to infer shear velocity profiles. Using the general rules for wavenumber limits for beamforming applications (e.g. Löer et al., 2020) and assuming a minimal shear velocity of vs,min = 1500 m s−1 (in depths ⪆ 1 km) and a maximum shear velocity of vs,max = 5000 m s−1 (Ewald et al., 2006), the required inter-station spacings dmin and aperture dmax can be estimated for a frequency range of fmin = 0.05 Hz to fmax = 1 Hz as
Deviating inter-station spacings or apertures change the usable frequency limits. During the design of the network, the theoretical array response (ARF) (Löer et al., 2020) is continuously checked. Results from the final ARF can be seen in Sect. 4.1.
3.1 Station layout
The final station layout is a compromise between targeted network design and suitable locations offered by citizens and companies. The safety and prevention of theft of costly seismic stations are maximised by favouring locations in private gardens or fenced in industrial areas. Gaps are filled with remote locations on agricultural land, owned by the energy provider RWE, where stations can be hidden in bushes at the side of fields.
The final long-term network consists of a total of 48 stations (Fig. 1), with an average inter-station spacing of 1.7 km and a maximum aperture of 20.6 km (Fig. 1). While the final layout is more irregular than ideal, it still enables high-quality analyses (see Sect. 4). Additionally, a shorter small-scale measurement was done before deployment of the larger network to estimate the general noise level.
3.2 Instrumentation
The instrumentation available for this study consisted of 40 stations from the geophysical instrument pool Potsdam (GIPP) at the GFZ (German Research Centre for Geosciences) Potsdam (of which 38 were used in this study), 7 stations from the Ruhr University Bochum (RUB) and 8 stations from the Rheinisch-Westfälisch Technische Hochschule (RWTH Aachen). In total, 27 broadband seismic stations from Nanometrics were available. The rest of the stations were short-period stations. The available instrumentation is listed in Table 1. All stations recorded continuously with a sampling rate of 200 Hz.
Station locations are named as a combination of sensor type (first letter) and owner (second letter) (see Table 1 for station codes) followed by a two-digit sequential number. The GIPP and RWTH stations were equipped with batteries lasting about 2 months. Data were retrieved every time the battery was swapped. The RUB stations were equipped with solar panels (TB16, TB17, CB21) or connected directly to the power outlet of home owners (TB18–20, CB22). The RUB stations are telemetered and continuously synchronised to data servers.
3.3 Deployment and installation
At each identified station location, sensors were installed as far away as possible from roads, houses and other possible disturbances. However, due to the densely populated area and large industries, unwanted disturbances cannot be ruled out. Three stations (TB16, TB17, CB21) were deployed in the open-pit lignite mine Inden in areas currently not under operation.
All stations were installed in shallow holes to ensure coupling to the ground. Nanometrics sensors were buried about 30 cm deep, while short-period stations were buried about 15 cm deep. All stations were oriented towards north with a magnetic compass. Horizontal tilt was minimised using a bubble level. Holes were backfilled with dirt or sand. Recording equipment was stored in a weather proof box. A few days after installation, data quality was checked manually for unusual spikes or transients, and stations were moved if necessary.
3.4 Recording time period
A very small short-term measurement (10 d) was performed at the centre of the network in June 2021 with the seven RUB stations (TB01–TB05, CB06, CB07) and the eight RWTH stations (GA08–GA15). This short-term measurement served as a first investigation into the expected data quality and noise levels (Gotowik, 2022) and helped design the larger network. The recorded data from this initial deployment are also available as part of the dataset.
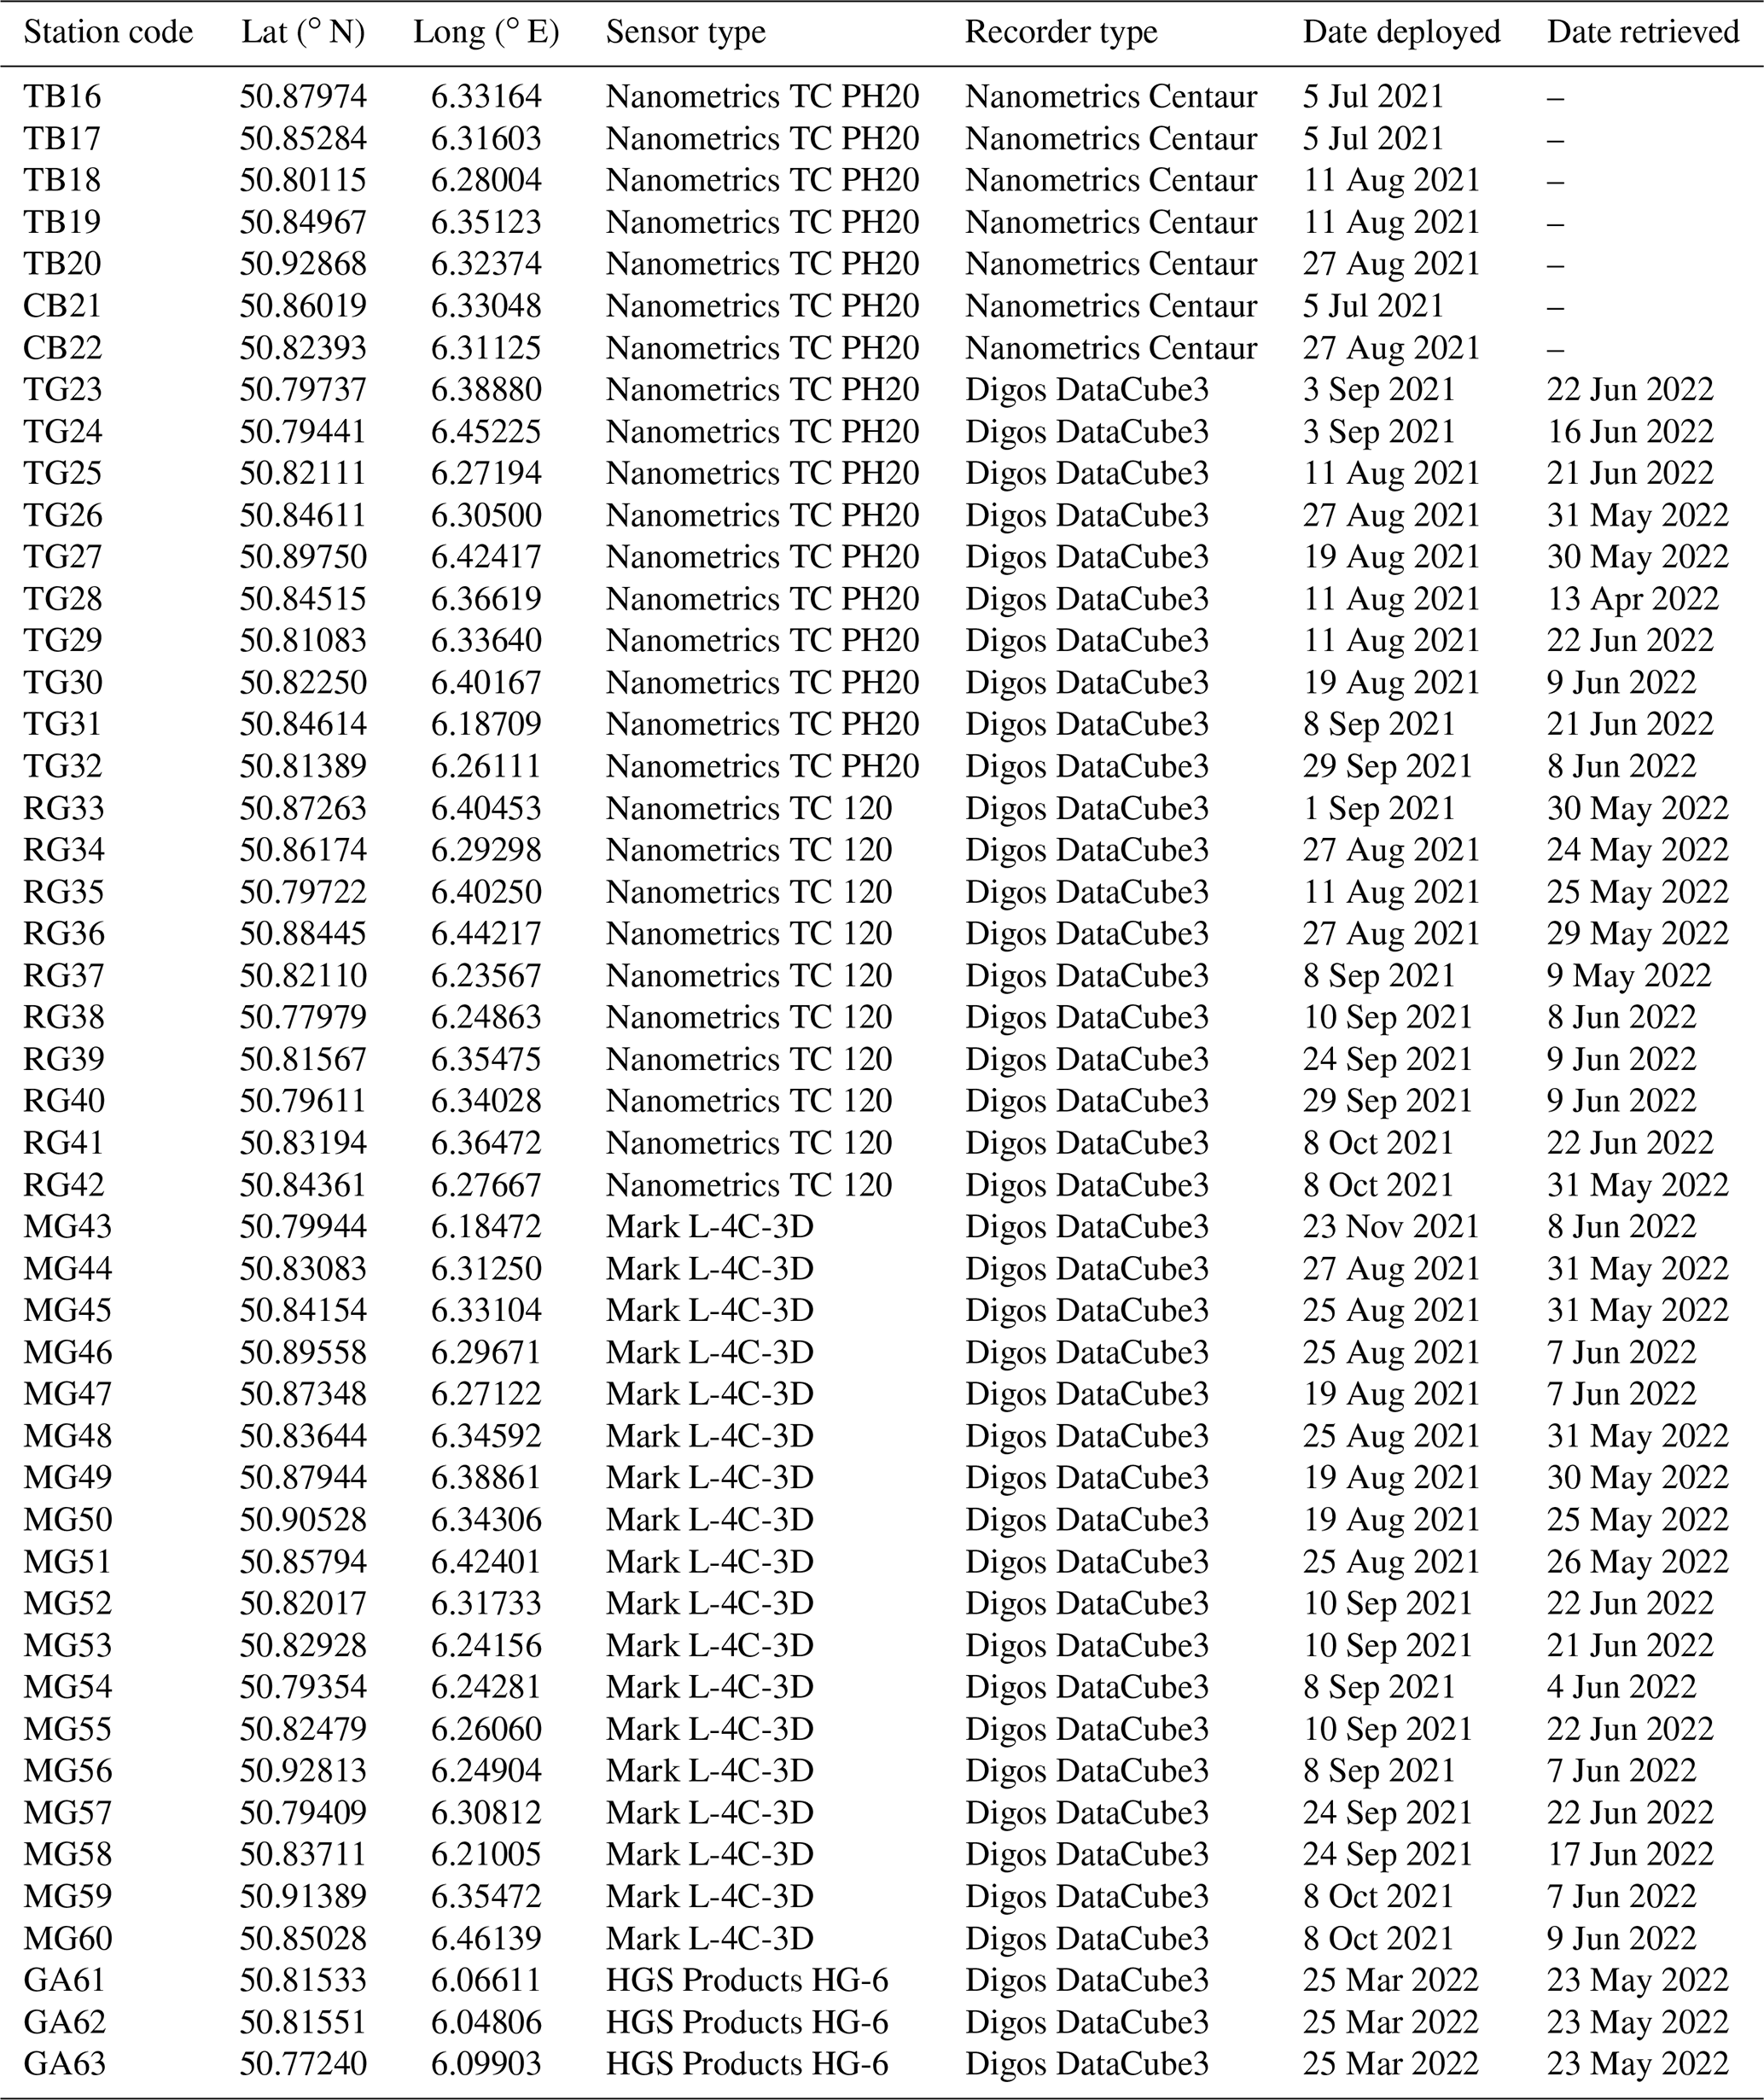
A total of 38 of the GIPP stations (10 TG, 10 RG, 18 MG) and the 7 RUB stations (5 TB, 2 CB) comprise the main body of data. They were deployed between July and October 2021. The GIPP stations were retrieved by June 2022, while the RUB stations were still recording as of August 2022. Data from the RUB stations will be embargoed until the end of 2025 to ensure exclusive use of these data in PhD theses at RUB. Towards the end of the investigation time period, three RWTH stations (GA61–GA63 in Fig. 1) were deployed for a limited amount of time (March–May 2022) in the west of the network to increase coverage across the Feldbiss fault (Fig. 1).
The availability of each station (excluding the small-scale array) can be seen in Fig. A1. Some GIPP stations are missing data due to recorder handling issues. Due to the 2-month maintenance interval, these were only noticed at the following scheduled maintenance. Details of each station can be found in the full station list in the Appendix (Tables A1 and A2).
3.5 Background noise levels
Strong anthropogenic noise and thick sedimentary layers (Vanneste et al., 2013) cause signal-to-noise ratios to be fairly low in frequency bands typically used for analysing local seismicity (Fig. 2). Noticeably, noise levels are significantly lower at the southwestern stations where sedimentary coverage is minimal (Fig. 3). This stresses the importance of applying advanced methods for obtaining enhanced and complete earthquake catalogues in this region. Apart from typical daily and weekly variations, the noise levels are stable in the region over multiple frequency bands (Fig. 4).
The influence of the thick sedimentary layers was identified with a horizontal-to-vertical spectral ratio study (Gotowik, 2022). Resonance frequencies were found to be in the range of 0.6 to 6 Hz. The large variability of resonance frequencies is caused by the inclined quaternary and tertiary layers (Fig. 1). An elevated seismic hazard can be expected in parts of the study with thicker sediments, causing severe site amplifications at frequencies relevant to the built environment (Pilz et al., 2021).
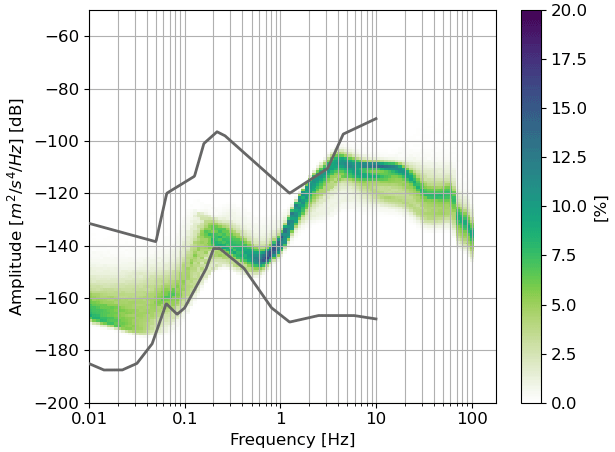
Figure 2Probabilistic power spectral density (PSD) created using ObsPy (Beyreuther et al., 2010) for the z component of station TG32 (northeast, thicker sediments) for all recorded data. Grey lines show the new low/high noise model (Peterson, 1993). This station has high noise levels.
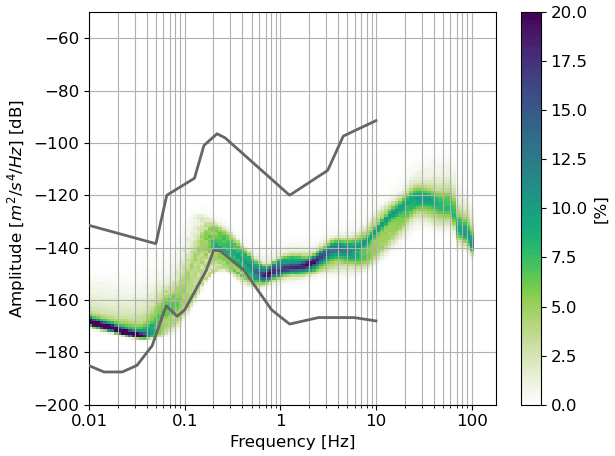
Figure 3Probabilistic power spectral density (PSD) created using ObsPy (Beyreuther et al., 2010) for the z component of station TG23 (southwest, thinner sediments) for all recorded data. Grey lines show the new low/high noise model (Peterson, 1993). This station has the lowest noise levels overall.
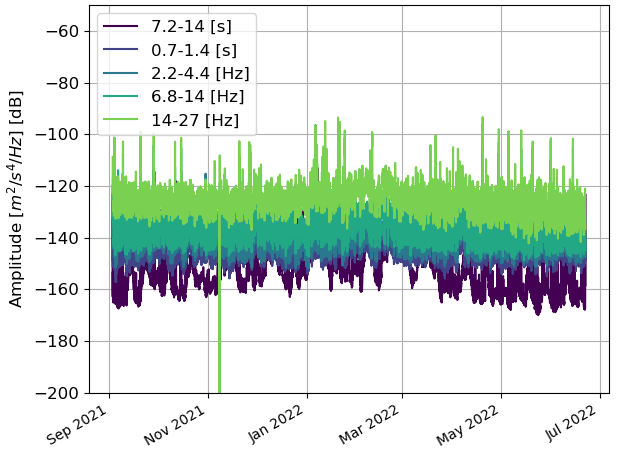
Figure 4Temporal trend of PSD for selected frequencies created using ObsPy (Beyreuther et al., 2010) for the z component of station TG23.
Although background noise levels are elevated, local events can be recorded with adequate signal-to-noise ratios (Fig. 5). A ML = 1.1 event has been detected and located by Earthquake Observatory Bensberg University Cologne (2022) close to station RG38 in May 2022. Waveforms show the heterogeneity of the network due to the complex geological structure and high noise levels.
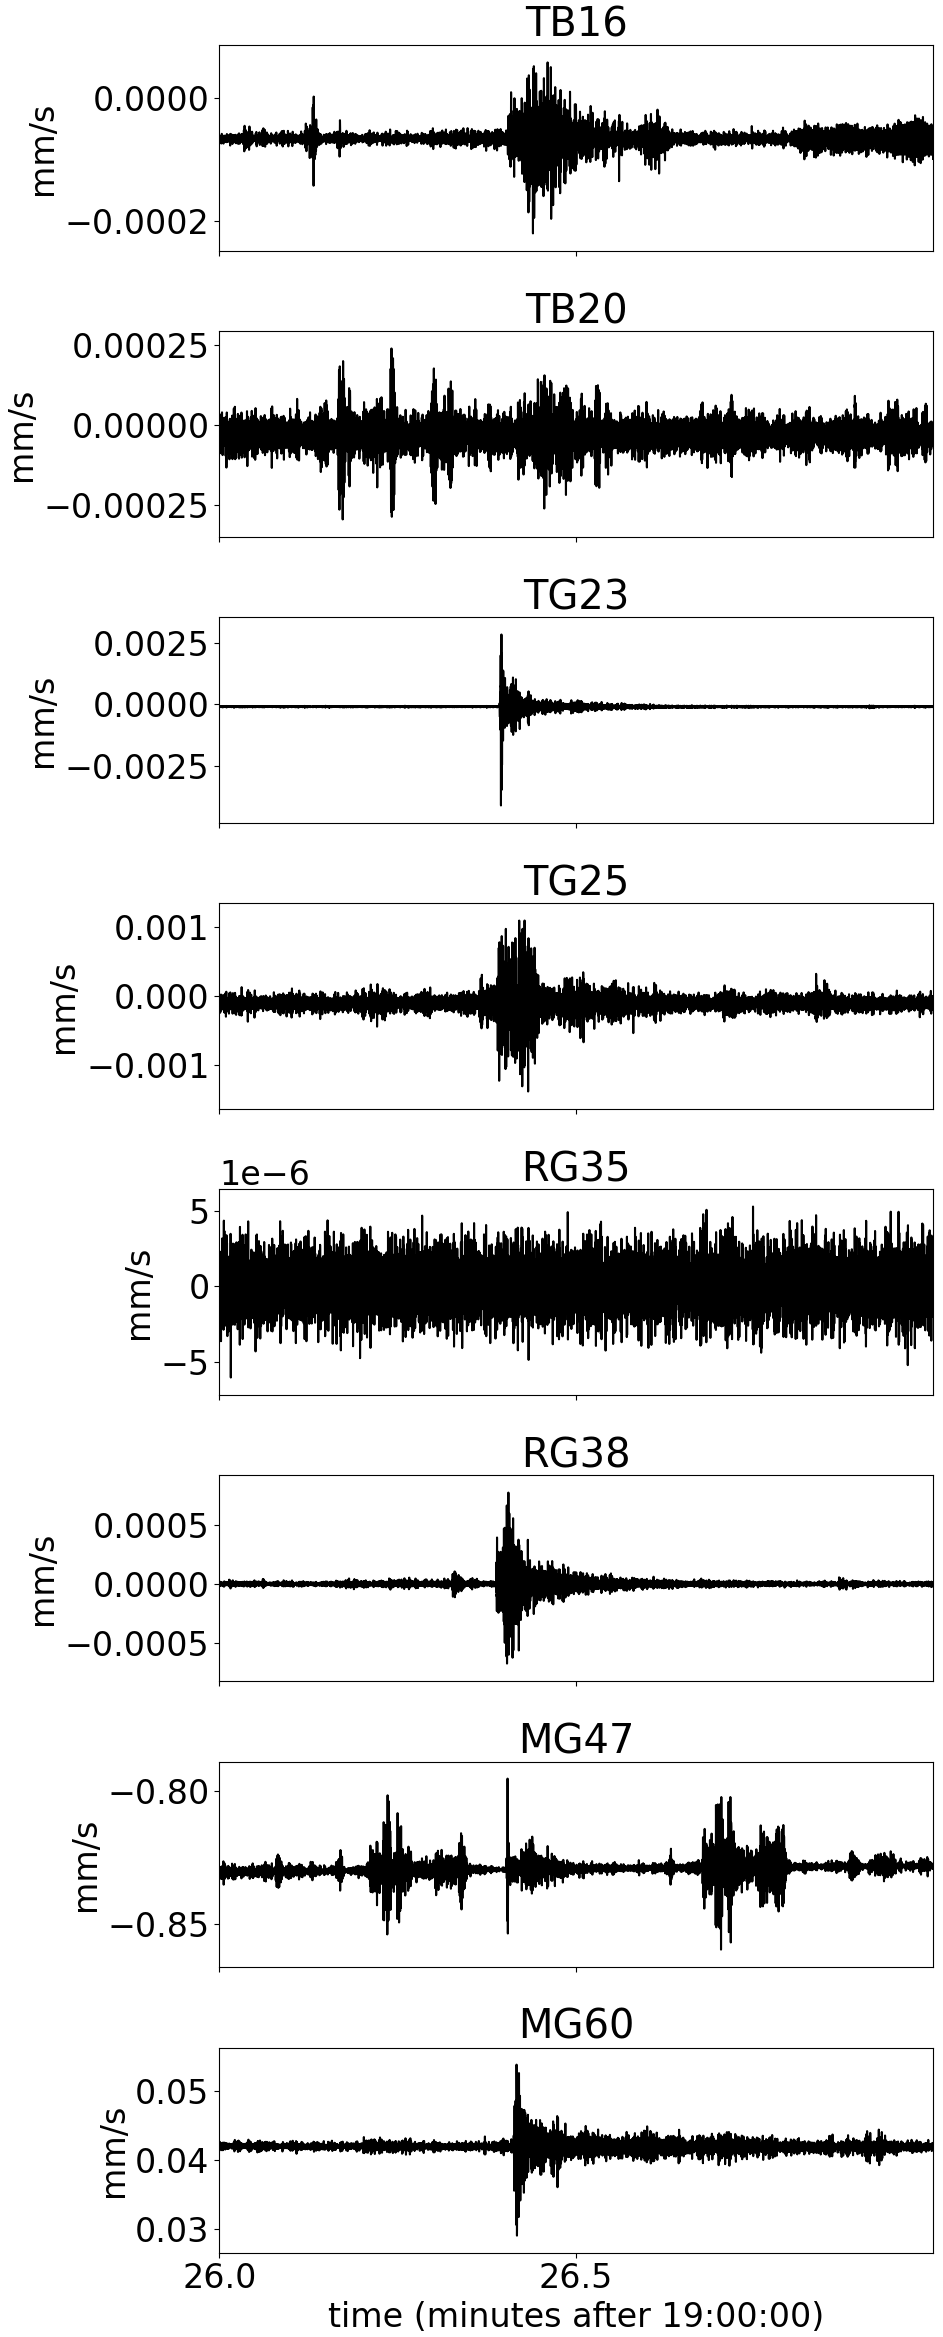
Figure 5Traces on network stations recording on 5 May 2022. Traces are filtered between 10 and 50 Hz around the time of detected and located event in Eschweiler (308 894 m easting, 5 629 087 m northing, close to station RG38) on 5 May 2022, 19:26:21.7 UTC with a magnitude of ML 1.1 (Earthquake Observatory Bensberg University Cologne, 2022).
4.1 Frequency–wavenumber methods
Array response functions (ARFs) are typically used to investigate the performance and suitability of a network for frequency–wavenumber-type studies (Rost and Thomas, 2002). Using the locations of seismic stations at the surface, the wavenumber response of the network to a wave impinging vertically from below with a specific frequency is calculated using (e.g. Löer et al., 2020)
with k being the wavenumber vector and rm being the coordinates of m stations. The final ARF for the station network (Fig. 6) validates the high suitability of applying frequency–wavenumber methods to this dataset.
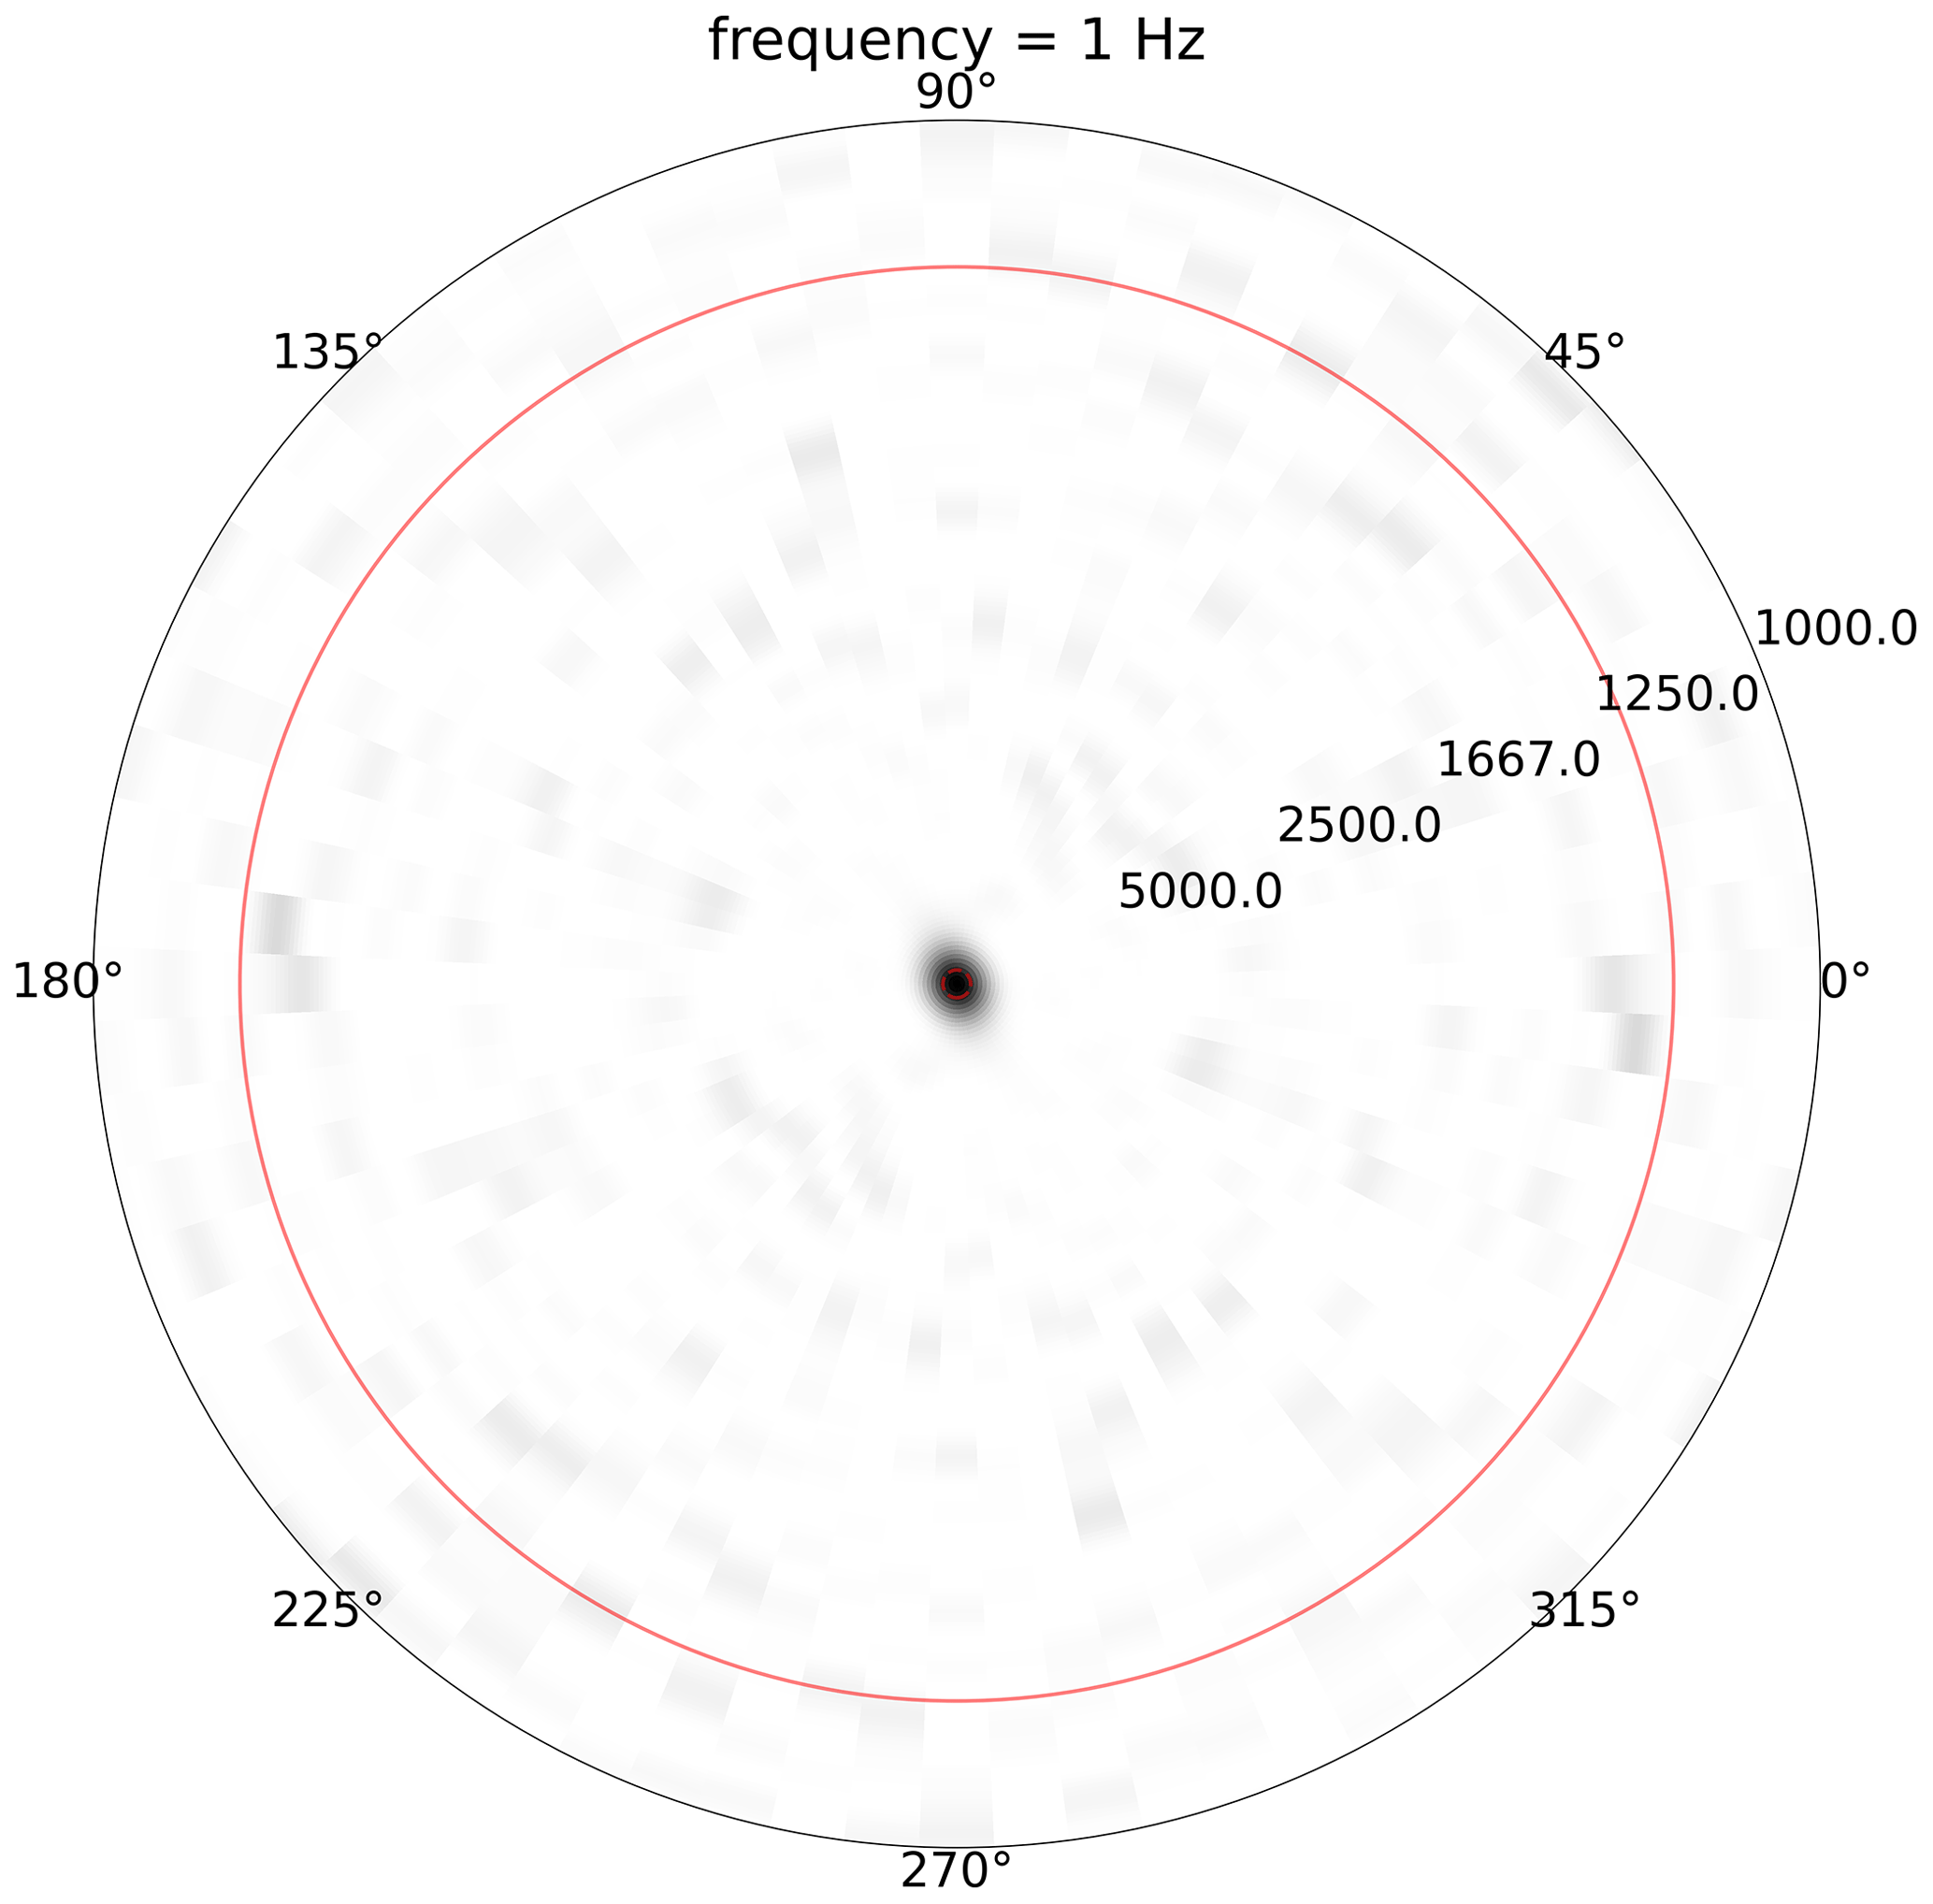
Rearranging Eqs. (1) and (2) and using the final station layout reveals a useable frequency range of 0.024 to 1.46 Hz and an estimated depth sensitivity of 1 to 10 km based on minimum and maximum resolvable wavelengths and average depth sensitivities of a fourth of the wavelength for Rayleigh waves.
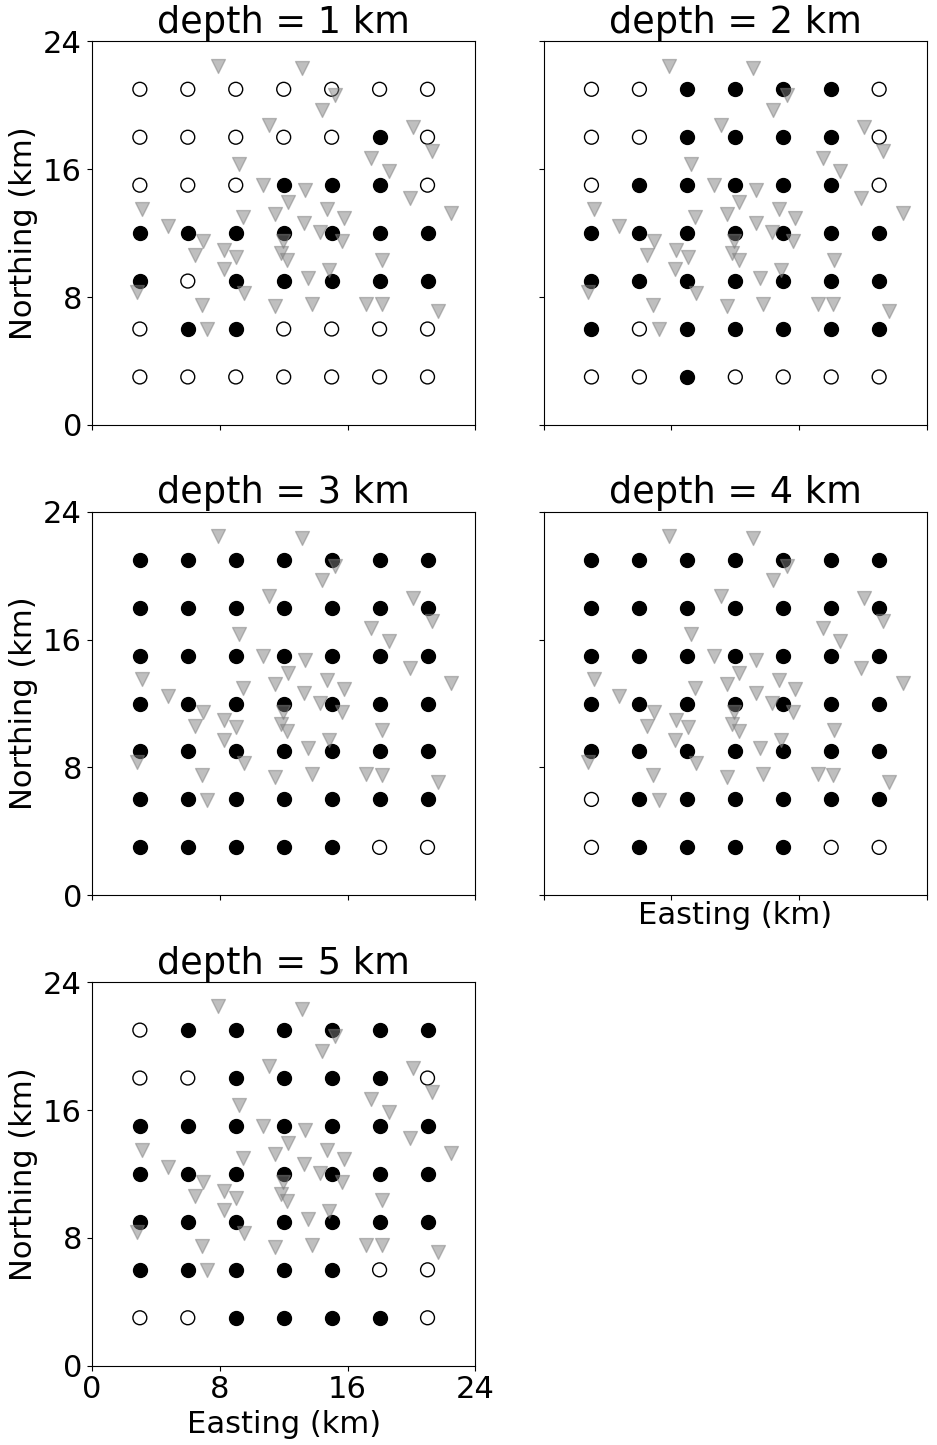
Figure 7Successful locations with TRI (filled circles) appear in the centre of the model and beneath the seismic stations (grey triangles). Unsuccessful locations (open circles) appear mainly at the borders and at shallow and deep depths.
4.2 Waveform-based source location methods
To demonstrate the applicability of waveform-based source location methods, we calculate sensitivity maps for TRI as proposed by Finger and Saenger (2020). Sensitivity maps generally estimate the impact of the station network and velocity structure on the quality of TRI results. Applied to the Weisweiler passive seismic network, sensitivity maps show the possibility for high-quality results with TRI (Fig. 7). To create the sensitivity maps, a total of 245 synthetic sources (circles in Fig. 7), with a 3 Hz Ricker source wavelet, were used in a homogeneous velocity model (vp = 4000 m s−1, ) to create synthetic seismic signals at the locations of the seismic stations. Synthetic sources are spaced regularly with 3 km spacing in horizontal direction and 1 km spacing in vertical direction. Only the xy component of the moment tensor is non-zero (strike-slip sources). A three-dimensional finite-difference wave simulator (Saenger et al., 2000) with absorbing boundaries at the sides and the bottom of the model and a free surface is used to simulate the wave propagation. The model size is 24 km in both horizontal directions and 6 km in depth. The grid spacing is 20 m and the time step is 0.004 s to ensure numerical stability.
The workflow of Finger and Saenger (2020) is adapted to use slight time shifts in source origin times to allow all 245 sources to be tested with one simulation. The recorded synthetic signals at the surface stations is time-reversed and normalised before backpropagation. An illumination map is created to remove the influence of geometrical spreading (Finger and Saenger, 2020). The total energy density imaging condition (Saenger, 2011) is used to obtain source locations. The workflow presented in Finger and Saenger (2021) is used to infer the origin time and the moment tensor of the source locations.
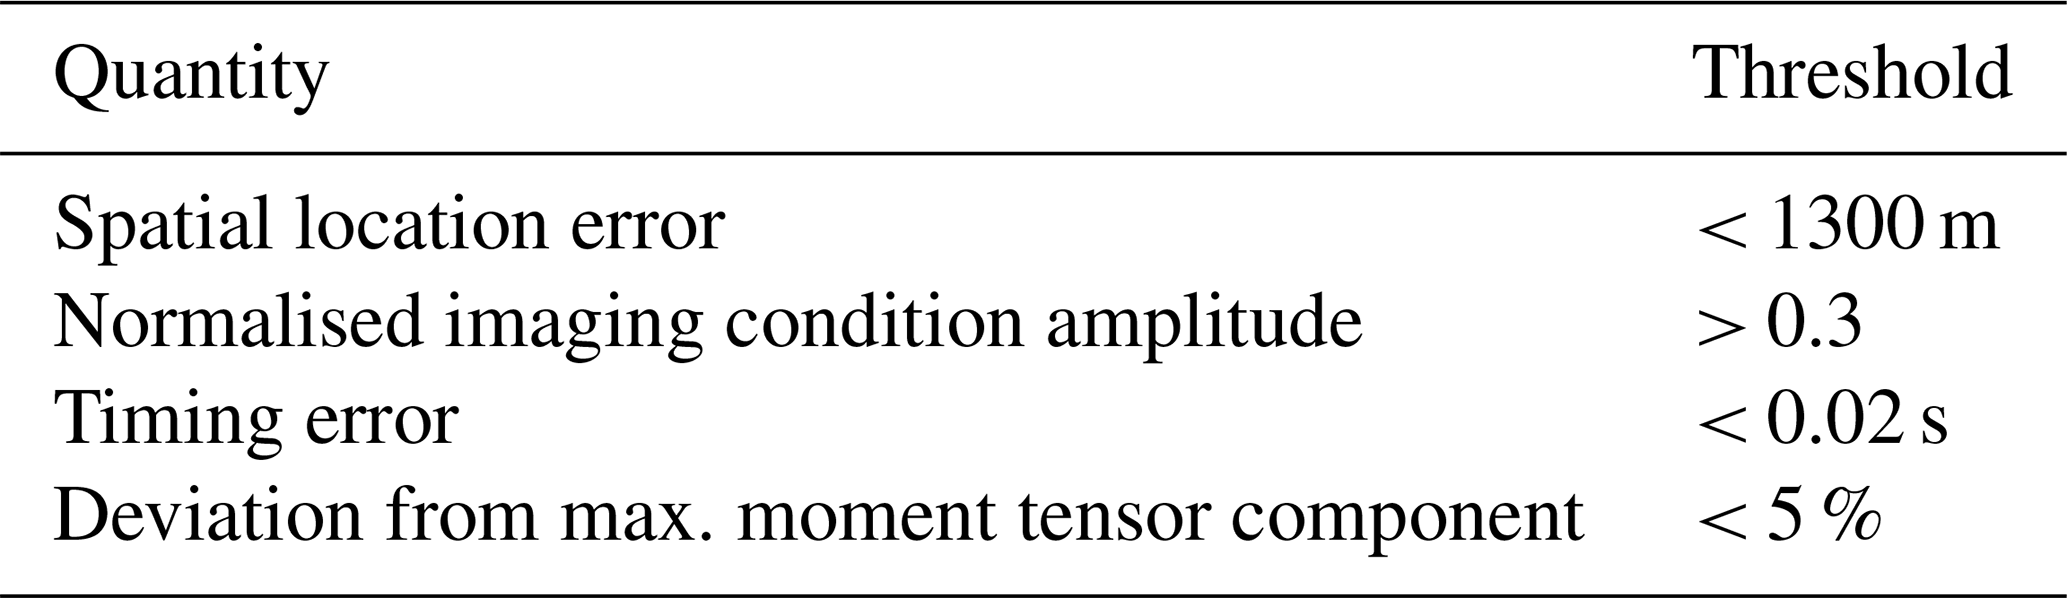
Successful source locations are defined following a set of threshold levels (Table 2). In addition to the spatial location accuracy, the retrieved origin time and moment tensor error are considered for the determination of successful locations. Only if a source location passes all thresholds (Table 2) is the location deemed successful.
Table 2Thresholds used to determine of location of synthetic sources was possible.
Five different depths were investigated using sensitivity maps (Fig. 7). In the centre of the model, all sources could be identified. For the shallowest and deepest depths, a larger number of sources at the borders of the model could not be located. Only a homogeneous velocity model is used in this investigation. As reported before (Werner and Saenger, 2018; Finger and Saenger, 2020), a heterogeneous velocity model can cause wavefield energy to disperse away from the source locations and thus decrease the accuracy. Nevertheless, this demonstrates the usefulness of the dataset for applications of time-reverse imaging methods in specific and waveform-based methods in general.
The Weisweiler passive seismic waveform dataset presented here is available for download at the GEOFON website and using the network code ZB (2021–2022) https://doi.org/10.14470/MO7576467356 (Finger et al., 2022). Waveform data are stored in miniSEED format with additional information in the header of the file, such as start and end times of traces and sampling rate. Additional metadata, such as station coordinates, are also available on the GEOFON website at https://doi.org/10.14470/MO7576467356 (Finger et al., 2022). The earthquake catalogue of the Earthquake Observatory Bensberg at the University Cologne is available at http://www.seismo.uni-koeln.de/catalog/index.htm (last access: 20 September 2022), and waveforms are available using the network code BQ (Department of Geosciences Bensberg Observatory University of Cologne, 2016).
Using state-of-the art knowledge about requirements of innovative location and imaging methods allowed us to design an optimised passive seismic station network. Although some compromises had to be made between the vicinity of seismic noise sources and favouring secure locations, the station network has great potential for solving a number of open research questions and, thus, serves as a demonstration of deploying a large passive seismic network in a densely populated area.
When planning for the application of innovative methods during the network design phase, the benefits of these methods can be reaped to overcome the challenges of the increased noise levels. Low signal-to-noise ratios are no challenge to TRI, but the method needs sufficient station coverage. A dense station network as presented here can be used to further advance TRI algorithms. Additionally, precise earthquake locations and focal mechanisms for the region would greatly benefit the regional seismic hazard assessment.
The robustness of ambient-seismic-noise methods across a wide range of frequencies can be evaluated with this dataset. Research to obtain accurate subsurface velocity models from ambient seismic noise in this geologically complex area with only small to moderate natural background seismic events is likely triggered.
All data presented here are available through the provided links. The dataset promises to be a valuable asset for the global seismological community and has the potential to advance numerous methodologies while simultaneously advancing the understanding of subsurface structure and processes in the Lower Rhine Embayment.
The complete list of stations is presented for the initial short-term deployment in Table A1 and for the long-term deployment in Table A2. Figure A1 gives an overview of available data recordings.
Table A1List of all stations of the short-term small-scale array including geographical location, deployment dates and retrieval dates.
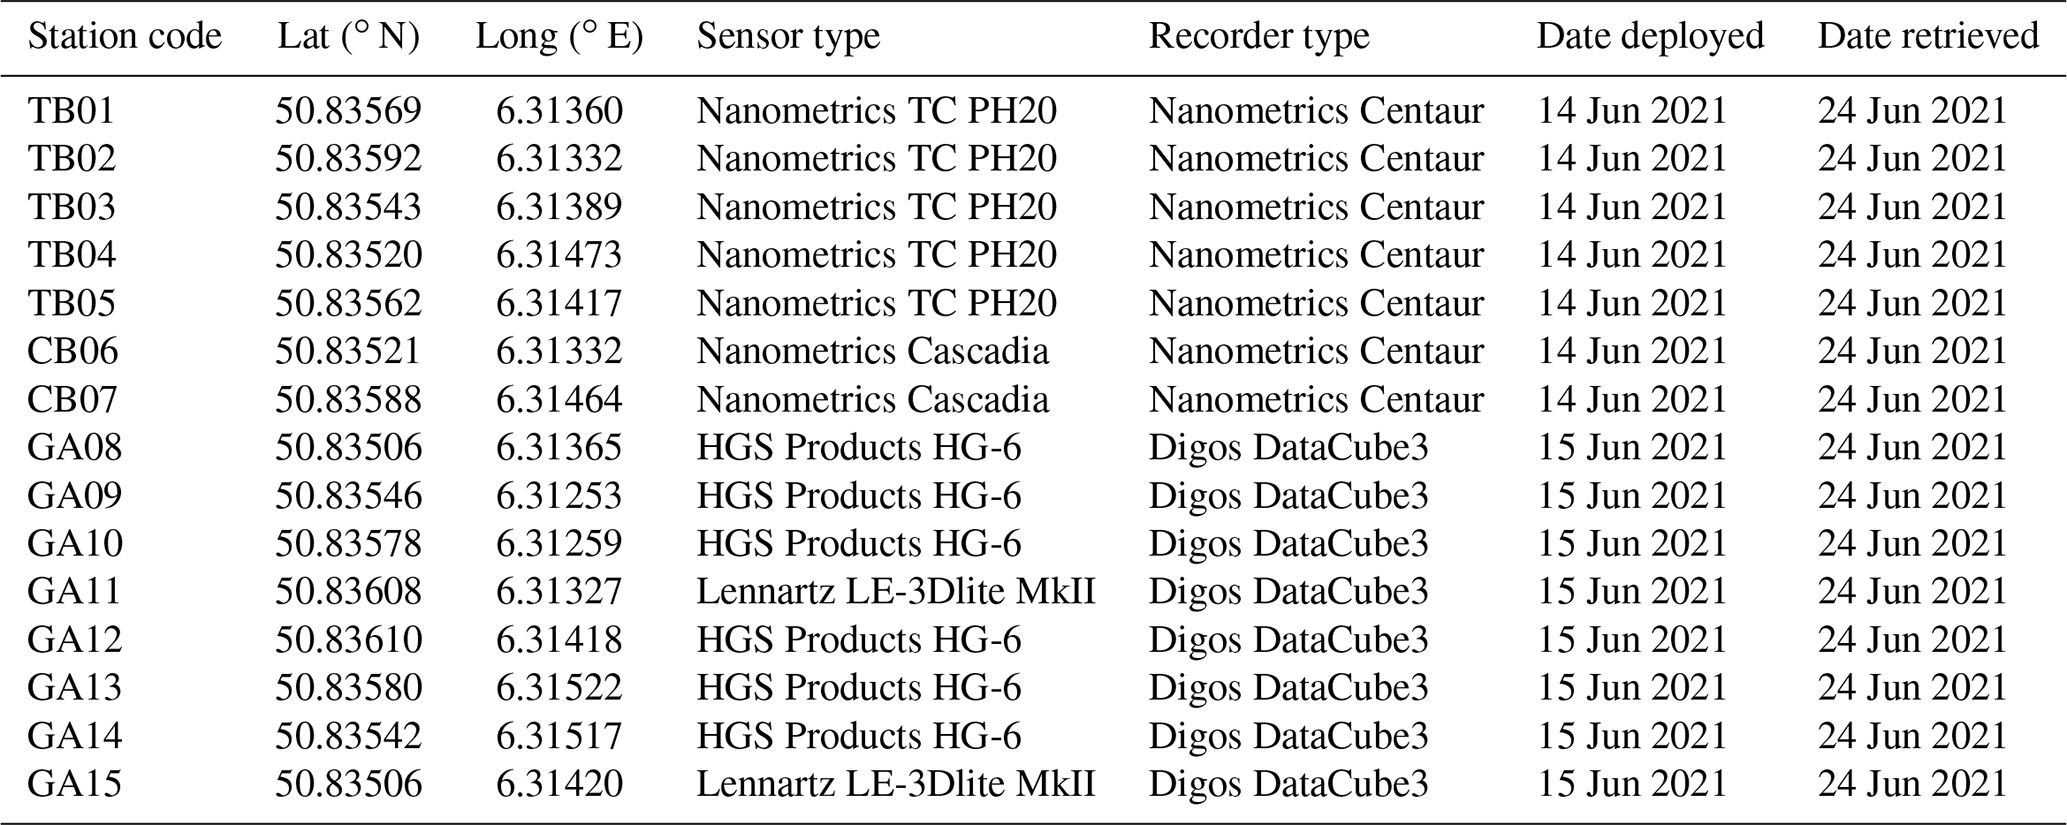
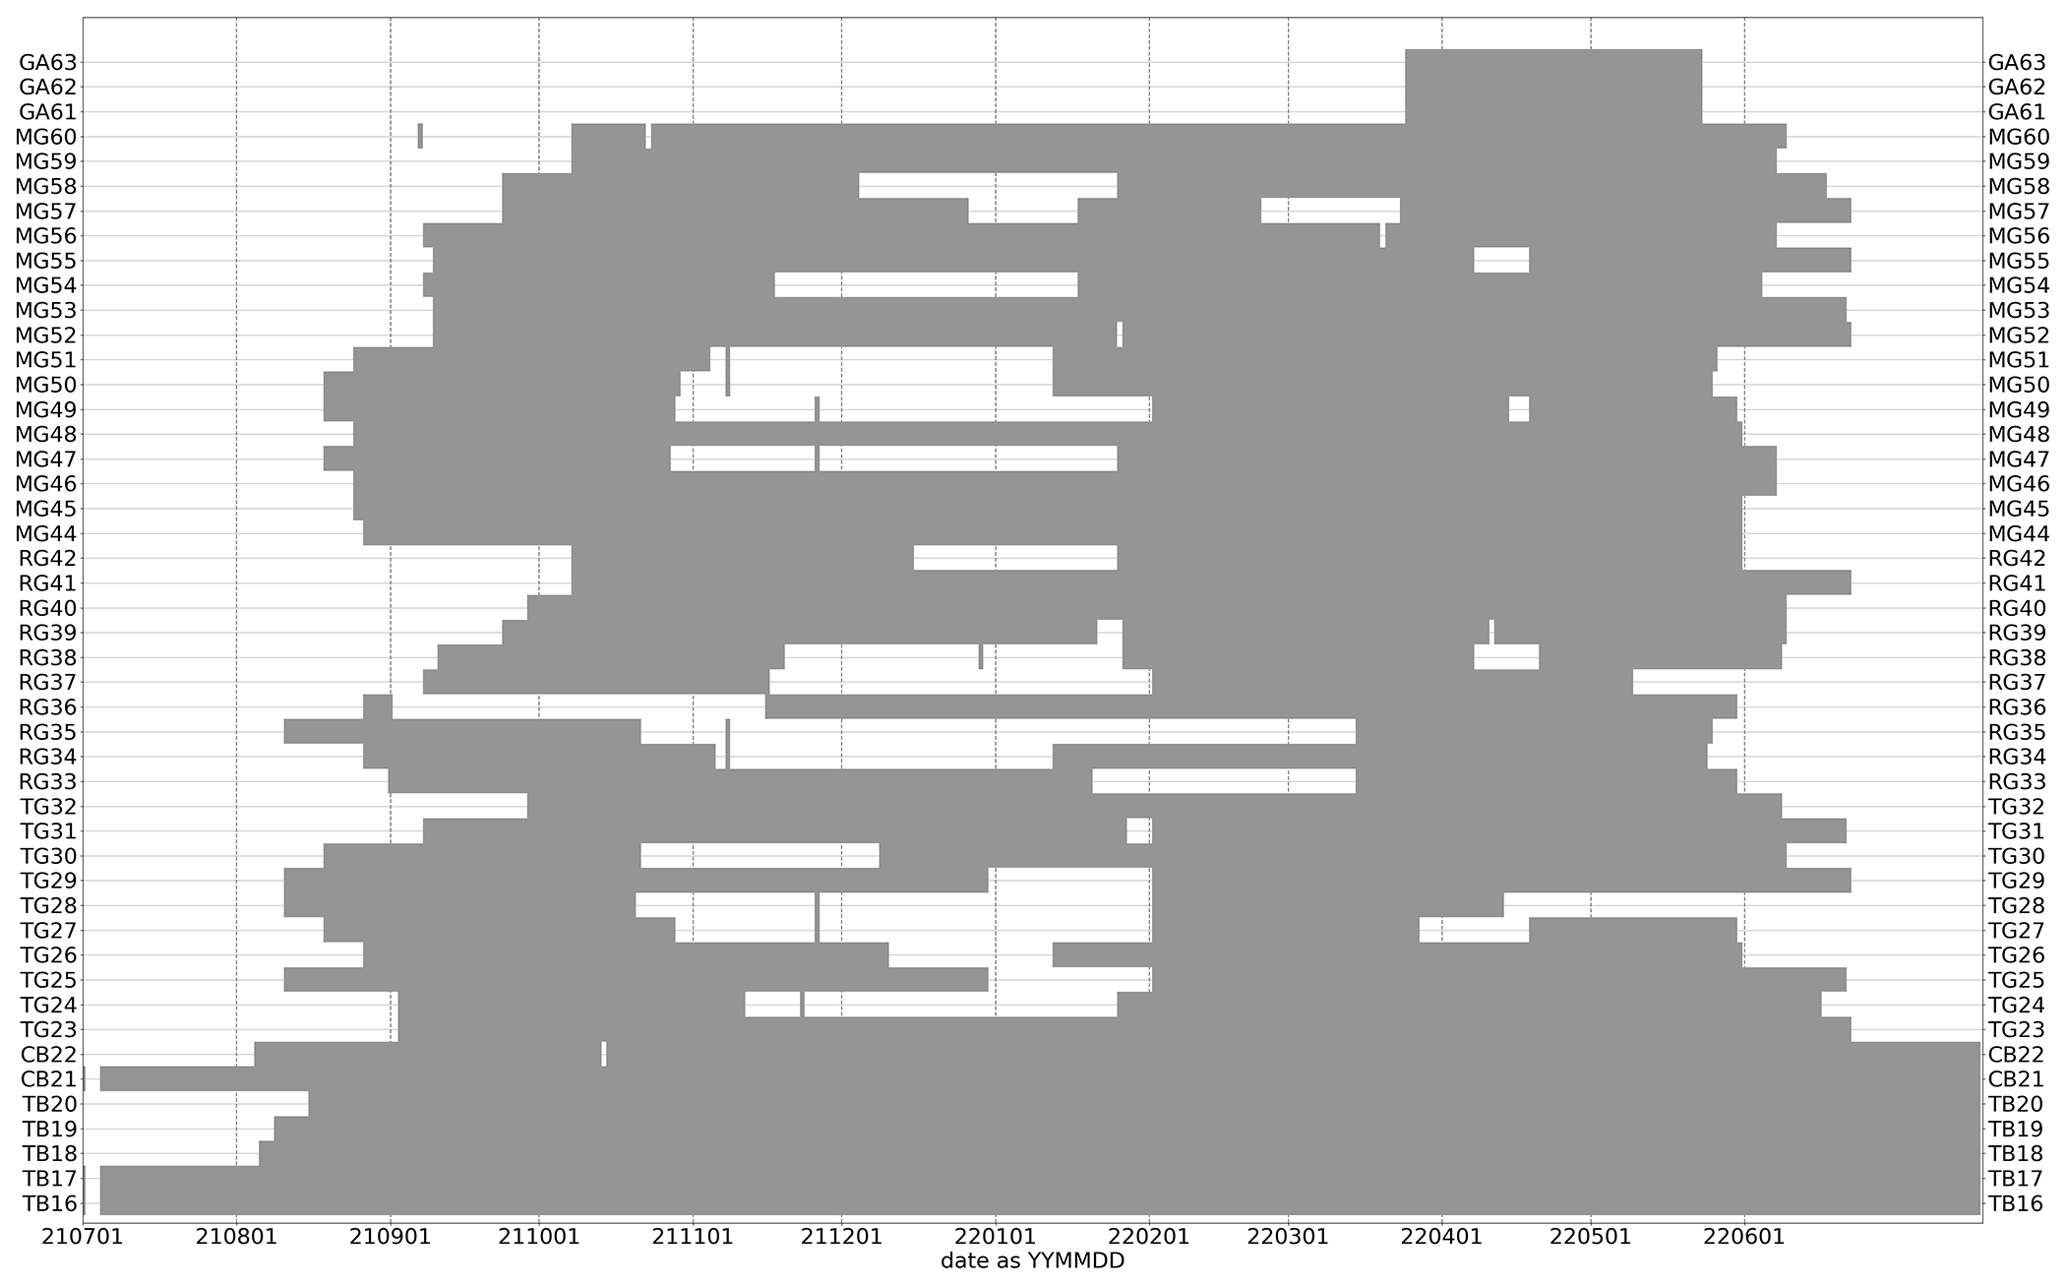
Table A2List of all stations including geographical location, deployment dates and retrieval dates.
CF drafted the manuscript, created figures and supervised the field deployments. CF, MPR, MD, AG, NE and RMH performed deployment of stations. CF, MPR, MD and AG did the analyses of data. CF, MPR, MD, AG, NE, RMH and BKE reviewed the manuscript. BKE, KR, TO, TR and EHS provided invaluable guidance. TR, RMH, KR and EHS procured funding.
The contact author has declared that none of the authors has any competing interests.
Publisher's note: Copernicus Publications remains neutral with regard to jurisdictional claims in published maps and institutional affiliations.
The authors gratefully acknowledge the support of each individual providing locations for the seismic stations. A total of 40 seismic stations were provided by the Geophysical Instrument Pool Potsdam (GIPP) under grant agreement GIPP202110. This project has been subsidized through the Cofund GEOTHERMICA, which is supported by the European Union's HORIZON 2020 programme for research, technological development and demonstration under grant agreement no. 731117. The authors gratefully acknowledge the Gauss Centre for Supercomputing e.V. (http://www.gauss-centre.eu, last access: 25 August 2022) for funding this project by providing computing time through the John von Neumann Institute for Computing (NIC) on the GCS Supercomputer JUWELS at Jülich Supercomputing Centre (JSC). This study was supported by the Interreg North-West Europe (Interreg NWE) Programme through the Roll-out of Deep Geothermal Energy in North-West Europe (DGE-ROLLOUT) project (https://vb.nweurope.eu/projects/project-search/dge-rollout-roll-out-of-deep-geothermal-energy-in-nwe/, last access: 25 August 2022), NWE 892. The Interreg NWE Programme is part of the European Cohesion Policy and is financed by the European Regional Development Fund (ERDF). Activities of Fraunhofer IEG were further supported by the Federal Ministry for Economic Affairs and Energy via the subproject “Roll-out of Deep Geothermal Energy in North-West Europe – German complementary project to Interreg North-West Europe”. Thanks go to Andrea Rovida and an anonymous reviewer for their very constructive review.
This research has been supported by the Interreg North-West Europe (grant no. NWE 892), the Gauss Centre for Supercomputing (grant no. 21087; seisgeotherm), the Helmholtz-Zentrum Potsdam – Deutsches GeoForschungsZentrum GFZ (grant no. GIPP202110) and COFUND GEOTHERMICA (Horizon 2020) (grant no. DEEP (731117)).
This paper was edited by Kirsten Elger and reviewed by Andrea Rovida and one anonymous referee.
Berg, E. M., Lin, F. C., Allam, A., Qiu, H., Shen, W., and Ben-Zion, Y.: Tomography of Southern California Via Bayesian Joint Inversion of Rayleigh Wave Ellipticity and Phase Velocity From Ambient Noise Cross-Correlations, J. Geophys. Res.-Sol. Ea., 123, 9933–9949, https://doi.org/10.1029/2018JB016269, 2018. a
Beyreuther, M., Barsch, R., Krischer, L., Megies, T., Behr, Y., and Wassermann, J.: ObsPy: A python toolbox for seismology, Seismol. Res. Lett., 81, 530–533, https://doi.org/10.1785/gssrl.81.3.530, 2010. a, b, c
Braunmiller, J., Dahm, T., and Bonjer, K.-P.: Source mechanism of the 1992 Roermond earthquake from surface-wave inversion of regional data, Geophys. J. Int., 116, 663–672, https://doi.org/10.1111/j.1365-246X.1994.tb03288.x, 1994. a
Department of Geosciences Bensberg Observatory University of Cologne: Bensberg Earthquake Network, University of Cologne, https://doi.org/10.7914/SN/BQ, 2016. a
Dietl, M.: Evaluating the stress state of crustal faults in the Lower Rhine Embayment by quantifying remote dynamic triggering propensity, Master thesis, Ruhr-Universität Bochum, 2022. a
Earthquake Observatory Bensberg University Cologne: Earthquake catalog, University of Cologne, http://www.seismo.uni-koeln.de/events/index.htm (last access: 26 January 2023), 2022. a, b, c
Ewald, M., Igel, H., Hinzen, K. G., and Scherbaum, F.: Basin-related effects on ground motion for earthquake scenarios in the Lower Rhine Embayment, Geophys. J. Int., 166, 197–212, https://doi.org/10.1111/j.1365-246X.2006.02909.x, 2006. a
Finger, C. and Saenger, E. H.: Sensitivity Maps for Time-Reverse Imaging: An Accuracy Study for the Los Humeros Geothermal Field (Mexico), Geophys. J. Int., 222, 231–246, https://doi.org/10.1093/gji/ggaa160, 2020. a, b, c, d, e, f, g
Finger, C. and Saenger, E. H.: Determination of the time-dependent moment tensor using time reverse imaging, Geophysics, 86, KS63–KS77, https://doi.org/10.1190/geo2020-0348.1, 2021. a, b, c
Finger, C., Harrington, R., and Reinsch, T.: The ZB Seismic Network, 2021–2022, GFZ Data Services, https://doi.org/10.14470/MO7576467356, 2022. a, b, c, d
Fritschle, T., Strozyk, F., Oswald, T., Stubbe, H., and Salamon, M.: Deep geothermal energy potential at weisweiler, germany: Exploring subsurface mid-palaeozoic carbonate reservoir rocks, Z. Dtsch. Ges. Geowiss., 172, 325–338, https://doi.org/10.1127/zdgg/2021/0292, 2021. a, b, c, d
GD NRW: Geological Map GK500 of Geological Survey NRW (Germany), https://www.gd.nrw.de/pr_kd_geologische-karte-500000.php (last access: 26 June 2023), 2022. a
Gotowik, A.: Investigating shear velocity profiles and their correlation to local geology in the Lower Rhine Embayment, Germany, Master thesis, Ruhr-Universität Bochum, 2022. a, b
Grünthal, G., Stromeyer, D., Bosse, C., Cotton, F., and Bindi, D.: The probabilistic seismic hazard assessment of Germany–version 2016, considering the range of epistemic uncertainties and aleatory variability, B. Earthq. Eng., 16, 4339–4395, https://doi.org/10.1007/s10518-018-0315-y, 2018. a, b
Hinzen, K. G.: Stress field in the Northern Rhine area, Central Europe, from earthquake fault plane solutions, Tectonophysics, 377, 325–356, https://doi.org/10.1016/j.tecto.2003.10.004, 2003. a, b
Hinzen, K. G., Reamer, S. K., and Fleischer, C.: Seismicity in the Northern Rhine Area (1995–2018), J. Seismol., 25, 351–367, https://doi.org/10.1007/s10950-020-09976-7, 2021. a, b, c
Leynaud, D., Jongmans, D., Teerlynck, H., and Camelbeeck, T.: Seismic Hazard Assessment in Belgium, Geologica Belgia, 3, 67 –86, 2000. a
Li, L., Tan, J., Schwarz, B., Staněk, F., Poiata, N., Shi, P., Diekmann, L., Eisner, L., and Gajewski, D.: Recent Advances and Challenges of Waveform-Based Seismic Location Methods at Multiple Scales, Rev. Geophys., 58, e2019RG000667, https://doi.org/10.1029/2019rg000667, 2020. a, b, c
Löer, K., Toledo, T., Norini, G., Zhang, X., Curtis, A., and Saenger, E. H.: Imaging the deep structures of the Los Humeros geothermal field, Mexico, using three-component ambient noise beamforming, Seismol. Res. Lett., 91, 3269–3277, https://doi.org/10.1785/0220200022, 2020. a, b, c, d, e, f
Peterson, J.: Observations and modeling of seismic background noise, US Geological Survey Reston, VA, USA, 93, https://doi.org/10.1785/gssrl.79.2.194, 1993. a, b
Pilz, M., Cotton, F., Razafindrakoto, H. N. T., Weatherill, G., and Spies, T.: Regional broad-band ground-shaking modelling over extended and thick sedimentary basins: an example from the Lower Rhine Embayment (Germany), B. Earthq. Eng., 19, 581–603, https://doi.org/10.1007/s10518-020-01004-w, 2021. a, b
Rost, S. and Thomas, C.: Array seismology: Methods and applications, Rev. Geophys., 40, 2–1–2–27, https://doi.org/10.1029/2000RG000100, 2002. a, b, c
Saenger, E. H.: Time reverse characterization of sources in heterogeneous media, NDT&E Int., 44, 751–759, https://doi.org/10.1016/j.ndteint.2011.07.011, 2011. a
Saenger, E. H., Gold, N., and Shapiro, S. A.: Modeling the propagation of elastic waves using a modified finite-difference grid, Wave Motion, 31, 77–92, https://doi.org/10.1016/S0165-2125(99)00023-2, 2000. a
Shi, P., Grigoli, F., Lanza, F., Beroza, G. C., Scarabello, L., and Wiemer, S.: MALMI: An Automated Earthquake Detection and Location Workflow Based on Machine Learning and Waveform Migration, Seismol. Res. Lett., 58, e2019RG000667, https://doi.org/10.1785/0220220071, 2022. a
USGS: Earthquake Catalog U.S. Geological Survey, 2022. a
Vanneste, K., Camelbeeck, T., and Verbeeck, K.: Model of composite seismic sources for the Lower Rhine Graben, northwest Europe, B. Seismol. Soc. Am., 103, 984–1007, https://doi.org/10.1785/0120120037, 2013. a, b, c, d, e, f, g, h
Werner, C. and Saenger, E. H.: Obtaining reliable source locations with time reverse imaging: limits to array design, velocity models and signal-to-noise ratios, Solid Earth, 9, 1487–1505, https://doi.org/10.5194/se-9-1487-2018, 2018. a, b, c