the Creative Commons Attribution 4.0 License.
the Creative Commons Attribution 4.0 License.
 | 20 Jun 2023
Ice core chemistry database: an Antarctic compilation of sodium and sulfate records spanning the past 2000 years
Diana O. Vladimirova
Dieter R. Tetzner
B. Daniel Emanuelsson
Nathan Chellman
Daniel A. Dixon
Hugues Goosse
Mackenzie M. Grieman
Amy C. F. King
Michael Sigl
Danielle G. Udy
Tessa R. Vance
Dominic A. Winski
V. Holly L. Winton
Nancy A. N. Bertler
Akira Hori
Chavarukonam M. Laluraj
Joseph R. McConnell
Yuko Motizuki
Kazuya Takahashi
Hideaki Motoyama
Yoichi Nakai
Franciéle Schwanck
Jefferson Cardia Simões
Filipe Gaudie Ley Lindau
Mirko Severi
Rita Traversi
Sarah Wauthy
Cunde Xiao
Jiao Yang
Ellen Mosely-Thompson
Tamara V. Khodzher
Ludmila P. Golobokova
Alexey A. Ekaykin
Changes in sea ice conditions and atmospheric circulation over the Southern Ocean play an important role in modulating Antarctic climate. However, observations of both sea ice and wind conditions are limited in Antarctica and the Southern Ocean, both temporally and spatially, prior to the satellite era (1970 onwards). Ice core chemistry data can be used to reconstruct changes over annual, decadal, and millennial timescales. To facilitate sea ice and wind reconstructions, the CLIVASH2k (CLimate Variability in Antarctica and the Southern Hemisphere over the past 2000 years) working group has compiled a database of two species, sodium [Na+] and sulfate , commonly measured ionic species. The database (https://doi.org/10.5285/9E0ED16E-F2AB-4372-8DF3-FDE7E388C9A7; Thomas et al., 2022) comprises records from 105 Antarctic ice cores, containing records with a maximum age duration of 2000 years. An initial filter has been applied, based on evaluation against sea ice concentration, geopotential height (500 hPa), and surface wind fields to identify sites suitable for reconstructing past sea ice conditions, wind strength, or atmospheric circulation.
- Article
(6619 KB) - Full-text XML
-
Supplement
(525 KB) - BibTeX
- EndNote


Changes in wind strength and atmospheric circulation, notably the positive phase of the Southern Annular Mode (SAM), have been related to increased Antarctic snowfall (Thomas et al., 2017, 2008; Medley and Thomas, 2019) and the widespread warming in the Antarctic Peninsula (Turner et al., 2016; Thomas et al., 2009) and West Antarctica during the 20th century. Contemporaneously, Antarctic sea ice is also undergoing significant change. Despite model predictions of a homogeneous decline (Roach et al., 2020), total Antarctic sea ice cover has increased since 1970 (Zwally et al., 2002; Turner et al., 2009). With more recent periods of abrupt decline in 2016 (Meehl et al., 2016) and 2022 (Turner et al., 2022).
Our understanding of winds, atmospheric circulation, and sea ice is hampered by both the lack of observations prior to the instrumental period (∼ 1970s onwards) and uneven spatial coverage of palaeoclimate records (Jones et al., 2016; Thomas et al., 2019). Data–model intercomparison and data synthesis studies have demonstrated the value of large datasets in reconstructing climate and sea ice variability over decadal to centennial timescales (Dalaiden et al., 2021; Fogt et al., 2022). To meet the need for Antarctic-wide, spatially dense, and inter-comparable atmospheric circulation and sea ice records, we propose the use of chemical species routinely measured in ice cores.
Sodium [Na+], from sea salt aerosol, has been proposed as a proxy for past sea ice extent (SIE; Severi et al., 2017; Wolff et al., 2006; Winski et al., 2021; WAIS Divide Project Members., 2013). The sea salt component of [Na+] arises from both sea ice and open water, and the relationship between [Na+] and sea ice varies between sites (Sneed et al., 2011). High winds mobilize [Na+] from the sea ice surface, either in frost flowers or brine-soaked snow (Huang and Jaeglé, 2017; Frey et al., 2020). The [Na+] reaching the ice core sites is dependent on both the distances from the source, either sea ice or open ocean, and the meteorological conditions (Minikin et al., 1994; Rhodes et al., 2018). [Na+] is therefore a valuable tracer for marine–air mass advection and changes in atmospheric circulation (Dixon et al., 2004; Mayewski et al., 2017).
Sulfate is formed in the atmosphere as secondary aerosol, following volcanic and anthropogenic sulfur dioxide [SO2] gas emissions. , together with methane sulfonic acid [MSA−], is the main atmospheric sulfur compound formed from ocean-derived dimethylsulfide (DMS; Gondwe et al., 2003). In the Southern Hemisphere, marine biogenic emissions dominate the total sulfur budget (Delmas et al., 1982; Legrand and Mayewski, 1997; Mccoy et al., 2015). Sulfur can significantly impact cloud albedo and new particle formation (Brean et al., 2021). The sea salt fraction of is largest at coastal and low-elevation sites (Dixon et al., 2004). The non-sea salt fraction, also referred to as excess (hereafter referred to as ), can be estimated based on the relationship with [Na+] (e.g. = − 0.25[Na+]; O'Brien et al., 1995). Excess has been shown to correlate with SIE at some ice core sites (Dixon et al., 2004; Sneed et al., 2011). The background source, from marine biogenic deposition, is superimposed by sporadic volcanic deposition of , providing an excellent reference horizon for dating Antarctic ice cores (Dixon et al., 2004; Sigl et al., 2014; Plummer et al., 2012). At low-elevation and coastal sites, where background biogenic sources are high, it is not always possible to identify volcanic peaks (Emanuelsson et al., 2022; Tetzner et al., 2021). In this study, provides a dual function, namely (1) as a potential proxy for SIE and (2) as a stratigraphic age marker to validate submitted age scales and subsequently align ice core chronologies onto a common chronology.
The CLIVASH2k chemistry database
CLIVASH2k (CLimate Variability in Antarctica and the Southern Hemisphere over the past 2000 years) is a project of the Past Global Changes (PAGES) 2k network. The CLIVASH2k database is the latest in a series of community-led palaeoclimate data synthesis efforts endorsed by PAGES (Kaufman et al., 2020; Mcgregor et al., 2015; Mckay and Kaufman, 2014; Tierney et al., 2015; Thomas et al., 2017; Stenni et al., 2017; Konecky et al., 2020). The aim of this study is to focus on two primary species, sodium and sulfate, as they are routinely measured in ice cores and have potential links with either sea ice or atmospheric circulation. The time window of the last 2000 years has been selected to cover both natural and anthropogenic changes.
Two main features distinguish the CLIVASH2k data compilation from previous PAGES synthesis, in that (1) the data included are not limited to previously published records and (2) the data comprise two distinct chemical species which do not have a well-established relationship with climate. This differs from previous compilations, where the data can be either directly, or indirectly, compared with a modelled or observed climate parameter (e.g. temperature; Stenni et al., 2017).
Calls for participation in CLIVASH2k activities were widely distributed, ensuring a cross section of scientists from various disciplines, geographic regions, and career stage. The targeted species to target and the selection criteria were decided at several open discussion stages, followed by updates to the CLIVASH2k mailing list, and distributed via the PAGES monthly updates.
2.1 Resolution and duration
The target time period for the database is the last 2000 years. Records of any duration could be submitted within this time period. These records could be from snow pits and firn cores, spanning just a few seasons to years. Data were requested at the highest resolution available and converted to annual averages (January–December).
2.2 Age scales
Most records within this time period have been annually dated, based on the seasonal deposition of distinct chemical species (including sodium, sulfate, and sulfur). The longer records, those spanning the last 500–2000 years, have been synchronized previously (Sigl et al., 2014) or within this project on the WD2014 age scale (Sigl et al., 2016) or have age scales that are broadly consistent with WD2014 (Plummer et al., 2012). This new chronology is constrained by the 774 CE cosmogenic (i.e. 10Be) anomaly and is consistent with dendrochronology (Büntgen et al., 2018) and ice core chronologies from Greenland (Sigl et al., 2015). The WD2014 age scale is recommended because it is consistent with the forcings applied in PMIP4/CMIP6 model simulations (Jungclaus et al., 2017). Age transfer functions can now be linked to other PAGES 2k reconstructions and individual ice cores. There are a few exceptions. Plateau Remote and DT401, both very low-accumulation sites in the interior of eastern Antarctica, have been dated using (Ren et al., 2010); however, the reference horizons differ from WD2014 age scale prior to 1000 BCE and cannot be confidently synchronized. Another exception is partly unpublished data from the Vostok vicinity, which were dated using the snow accumulation rate and volcanic age markers (this study and Ekaykin et al., 2014).
2.3 Peer review and publications
Unlike previous PAGES 2k compilations, the CLIVASH2k database was not constrained by the need for records to be published and peer-reviewed. This decision arose based on the limited number of published chemistry records available and the desire to maximize the records. Published records were submitted along with their original citation; unpublished records were listed as “This study”, with the data contributor included as a co-author.
2.4 Analytical methods
Both the ionic and elemental forms of sodium ([Na] and [Na+]) and sulfur ([S] and ), respectively, were accepted as part of the CLIVASH2k data call. Several analytical techniques are used to measure [Na+], [S], and in ice cores. Ionic [Na+] and are typically measured by ion chromatography (IC), while elemental Na and S are generally measured by inductively coupled plasma mass spectrometry (ICP-MS). Unlike IC, which measures the soluble fraction, ICP-MS techniques measure the total elemental concentration of both the dissolved and particulate fraction of the element. However, we note that there are different protocols for acidifying the samples prior to analysis, which may result in different absolute concentrations, including the choice of acid, the acid concentration, and the acidification time. While continuous ICP-MS measurements of certain species may require correction for under-recovery, Na and S are typically fully recovered during continuous measurements (Arienzo et al., 2019). Previous comparisons of analytical methods show excellent agreement of [Na] in ice cores measured using IC and ICP-MS methods(e.g. Grieman et al., 2022). This agreement suggests that the ionic and elemental forms reported in the database can be directly compared.
Biogenic atmospheric emissions of organic [S] species, mainly dimethyl sulfide (DMS), are a major contributor to the [S] in the Antarctic snow (Legrand and Mayewski, 1997). In the marine atmosphere, DMS is oxidized to [MSA−] and , which are eventually deposited on the polar ice sheets (Barnes et al., 2006). The ICP-MS technique measures total [S] in ice cores, which includes [S]-containing [MSA−]. In contrast, the IC technique solely quantifies [S]. If total [S] and [MSA−] are both analysed on the same ice core, then the [MSA−] contribution can be subtracted (Cole-Dai et al., 2021). However, continuous [MSA−] measurements are scarce over Antarctica (Thomas et al., 2019), and the long-term variability in both [MSA−] and is very small during the common era (Legrand et al., 1992; Saltzman et al., 2006). Thus, we applied a consistent transformation across all sites. We multiplied elemental [S] (32 g mol−1) from ICP-MS measurements with 3 to convert to the equivalent (96 g mol−1) without applying corrections for [MSA−] contributions. To aid the ease of comparison, all [S] has been converted to in the database and will be referred to only as in the data description.
2.5 Flux vs. concentration
[Na+] and in ice cores are generally reported as a concentration. Concentration can be converted to a deposition flux, provided that the snow accumulation rate is known. Flux (f; in ppb kg m−2, where ppb is parts per billion) is calculated according to Eqs. (1) and (2) for [Na+] and , respectively.
where [Na+] and are the concentration (in ppb), and a is the snow accumulation (in kg m−2).
Snow accumulation records were extracted from the Antarctic regional snow accumulation composites available at the UK Polar Data Centre (Thomas, 2017). The CLIVASH2k database includes both concentrations and fluxes, when available. Flux estimates from ice cores combine both wet and dry deposition, of which the contribution of these two depositional modes varies across Antarctica with elevation and distance from the source (Wolff, 2012).
2.6 Establishing the sea salt and non-sea salt component
There are various methods of calculating the sea salt (ss) and excess (xs) components of an ice core chemistry record. The most common method, as mentioned above, is to assume 100 % of the [Na+] comes from the ocean. Then [Na+] can be treated as a marine reference species, and the ss fraction of all other chemical species can be calculated based upon a mean ocean water elemental abundance reference value (e.g. Lide, 2005). If [Na+] is suspected of not being of marine origin, then alternative methods of calculating the ss chemical fraction may be employed. For example, one may apply a standard seawater ratio of 30.61 [Na+], 1.1 [K+], 3.69 [Mg2+], 1.16 [Ca2+], 55.04 [Cl−], and 7.68 to the ion concentrations in each sample (Holland, 1978). Several studies have shown that frost flowers are depleted in relative to [Na+]. This produces a value which is slightly higher than it should be for sites near the coast (Rankin et al., 2002, 2000). Unfortunately, not all studies accurately measure a wide suite of chemical species. Therefore, in this study we have assumed [Na+] to be the primary marine species and calculated according to Eq. (3) (O'Brien et al., 1995).
Other ratios may be more suitable for coastal sites (Dixon et al., 2004), but for consistency, we have applied the same ratio to all records reported in the database.
2.7 Data validation and recommendations
The two main uncertainties in the data presented arise from (1) chronological controls and (2) analytical errors. As discussed in Sect. 2.2, all records have been synchronized to a common age scale (WD2014). Thus, when using the entire database, we recommend using an error estimate of ± 2 years, for records younger than 500 years, increasing to a conservative error estimate of ± 5 years for records extending to 2000 years. This is the maximum uncertainty estimate for the WD2014 age scale at 2500 years (Sigl et al., 2015). However, we note that for individual records in this database, the published error estimates are as low as ± 1 year (e.g. Emanuelsson et al., 2022). When using individual records, we recommend using the published error estimate for that record.
Analytical precision varies between instruments and laboratories. We recommend applying 1 standard error (σ) to the data to account for analytical errors.
The [Na+] and data are an accurate representation of either concentration or flux at a certain site. However, how this relates to regional deposition is not well constrained. While we can account for the uncertainty in analytical precision and dating error, we cannot define the signal-to-noise ratio associated with a small-scale post-depositional process (e.g. wind redistribution or the impact of local orography). The regional climate and signal-to-local-noise ratio has been investigated for stable water isotopes in Antarctica (Münch and Laepple, 2018); however, a detailed investigation of [Na+] and is lacking. One of the main limitations, which this database will address, has been the lack of available data. We thus encourage database users to investigate the regional signal by averaging records to reduce the signal-to-noise ratio. In this case, we recommend using the standard error propagation procedure for averaging, for example the square root of the sum of variances of individual records divided by the number of the records.
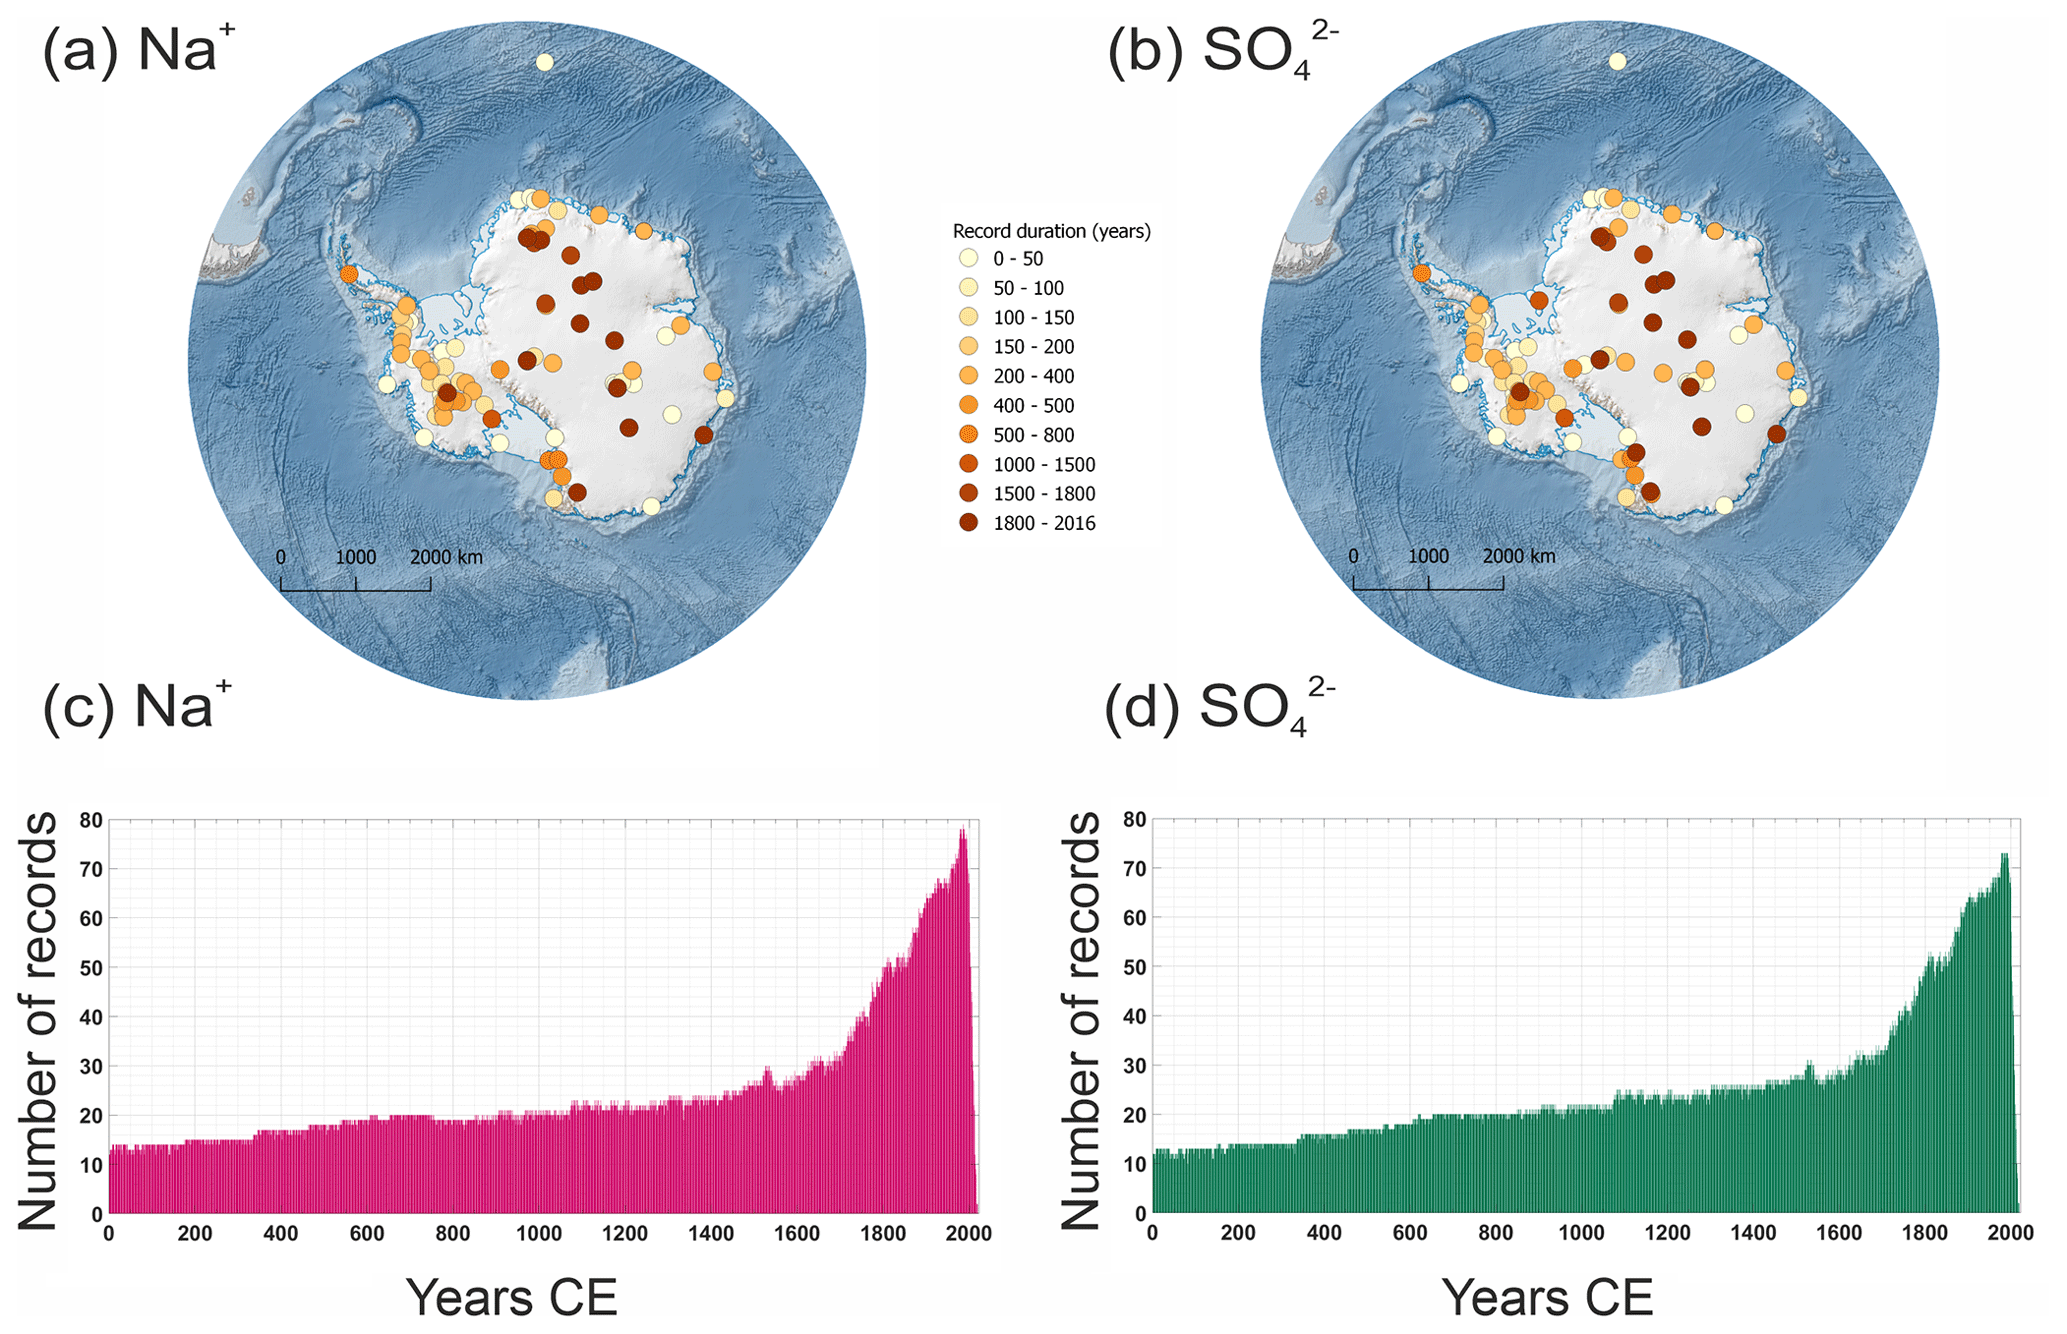
Figure 1Spatial and temporal coverage of records in the CLIVASH2k database. Map of ice core locations with (a) [Na+] and (b) records. Colour coded based on record duration (number of years). The number of (c) [Na+] and (d) records as a function of the years (CE) covered.
Ice cores provide the only record of [Na+] and deposition in Antarctica, and therefore, validation against reference datasets is also not possible. While progress has been made using chemical transport models to represent the deposition of sea salts in Greenland (Rhodes et al., 2018), the period examined is very short (annual to decadal) and has currently not been applied to Antarctica. This database will provide much-needed data for any future model validation. However, currently it means that there are no independent data products to validate our [Na+] and records against.
Table 1Summary of records submitted to the CLIVASH2k database. Combined records indicate sites which contain all three species ([Na+], , and ).
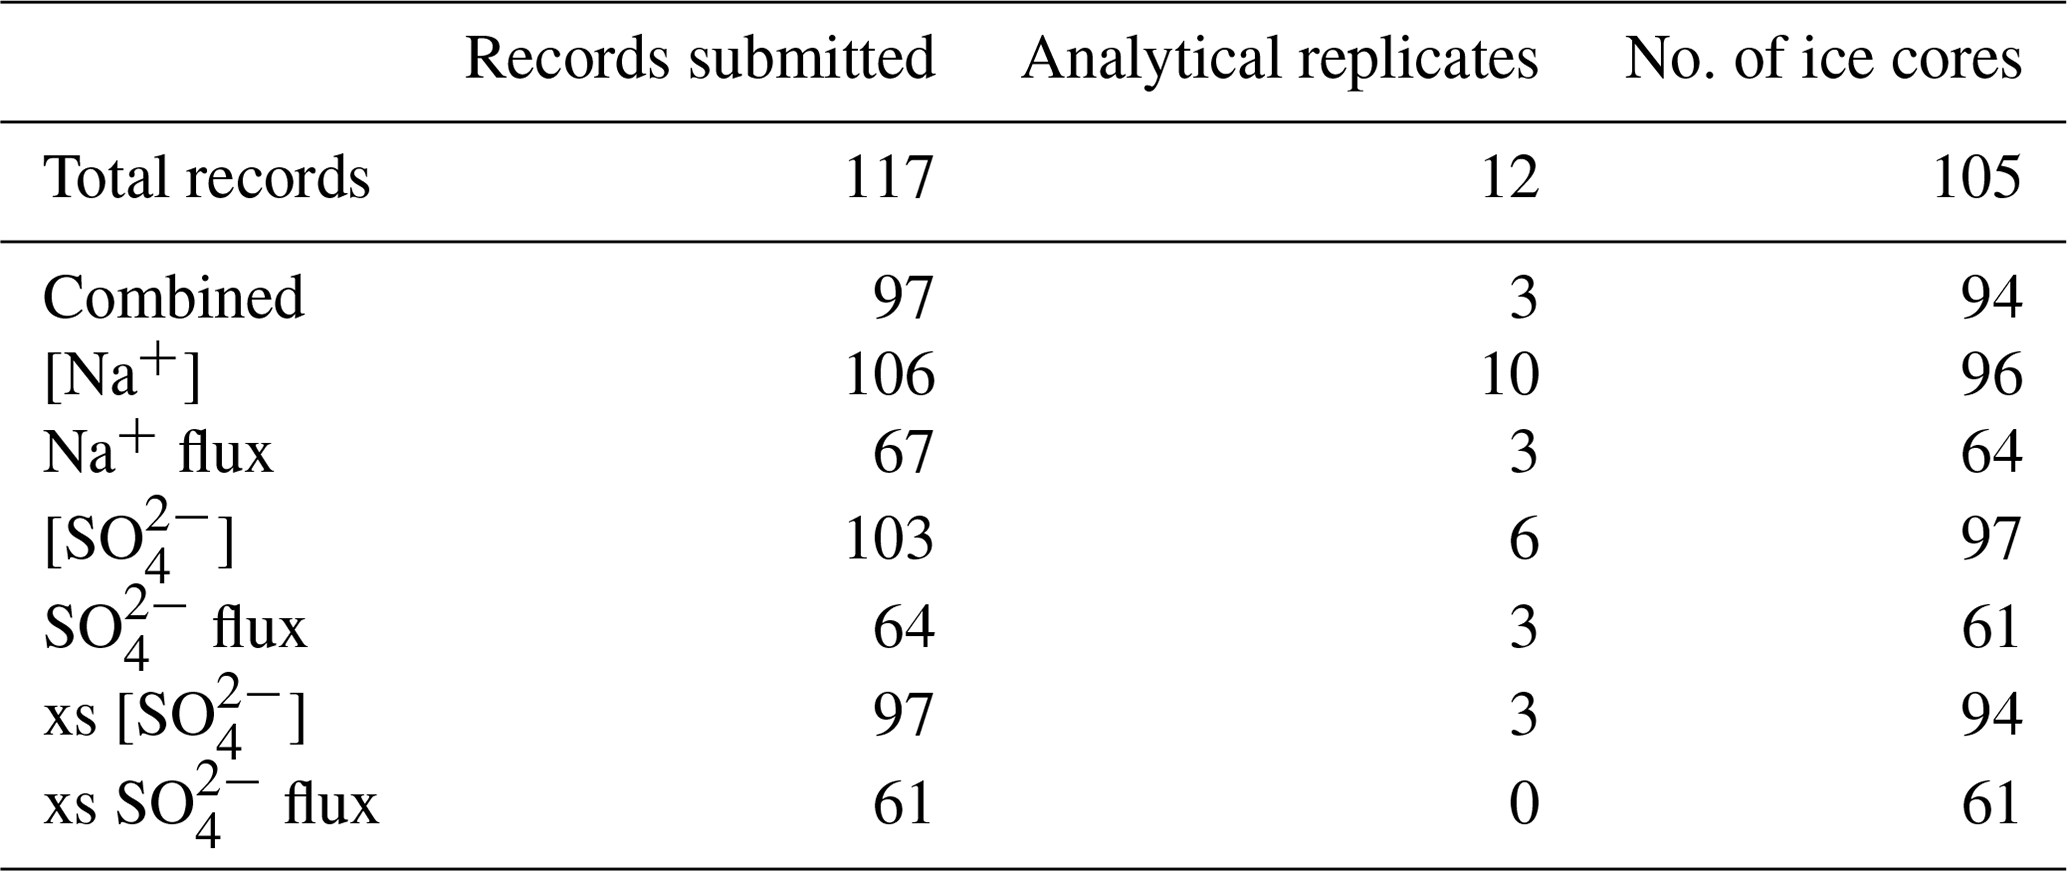
A total of 117 records were submitted, representing 105 individual ice core sites (Fig. 1). In some locations, duplicate analysis or updated versions were submitted (e.g. EPICA Dome C). This includes sites for which the analysis was undertaken at different laboratories, using different instrumentation (e.g. IC and ICP-MS) or different depth resolution. Some ice cores only provide data for a single species and not all records contain both flux and concentration. A total of 94 ice core sites which provide [Na+], and records are included in the database. All submitted records have been included in the database. The number of records submitted is summarized in Table 1. The full list of records, their location, elevation, duration, and reference are presented in Table S1 in the Supplement.
Geographical and temporal coverage
There is reasonable spatial coverage across Antarctica, with the largest density of records in West Antarctica (Fig. 1a and b). In East Antarctica, notable data voids include Coats Land, Enderby Land, Kemp Land, Wilkes Land, and Adélie Land. There is a notable absence of long records from the Antarctic Peninsula. Despite the high density of records in West Antarctica, high snow accumulation in this region results in most of these records only spanning the last few decades or centuries.
The longer-duration records (> 1000 years) are predominantly found on the central eastern Antarctic Plateau, while most higher snow accumulation coastal sites cover shorter timescales (Fig. 1a and b). The most recent year in the record peaks in the late 1990s, when the highest number of cores were drilled (Fig. 1c and d). Only 11 records span the full 2000 years.
Technical validation
To facilitate the scientific usability of this database, we have evaluated each record in terms of its relationship with key climate parameters during the observational period (1979–2019). Given their varying temporal ranges (Fig. 1), not all the records span the full satellite period. Thus, correlations are based on the largest number of years available within this period. Although the database includes short records, for the data interpretation step, we have only included records that have at least 10 years of overlap with the satellite and reanalysis climate data. Duplicate records (including updated versions and different analytical approaches) are included in the data interpretation step and interpreted as individual records.
The objective of this climatological comparison is to provide a first-level filter for the database. Based on the published literature (Sect. 1), the deposition of [Na+] and has been linked to changes in sea ice, winds, and atmospheric circulation. Thus, these parameters have been chosen for the initial evaluation step.
All of the records were also correlated using ERA5 meteorological parameters (Hersbach et al., 2020), the fifth generation European Centre for Medium-Range Weather Forecasts (ECMWF) atmospheric reanalysis data. These parameters include 500 hPa geopotential height (Z500) and meridional winds (v) and zonal winds (u), both at the 850 hPa level. The 850 hPa level was chosen to represent surface winds (relevant for sea ice reconstructions), while the 500 hPa was chosen to capture larger-scale circulation across both high- and low-elevation sites. All correlations were performed on detrended annual average data (January–December) to correspond with the annually resolved ice core records and corrected for autocorrelation. All of the records were correlated with SIC from the National Snow and Ice Data Center (NSIDC) Nimbus-7 SMMR and DMSP SSM/I-SSMIS Passive Microwave Data version 1 (Cavalieri et al., 1997).
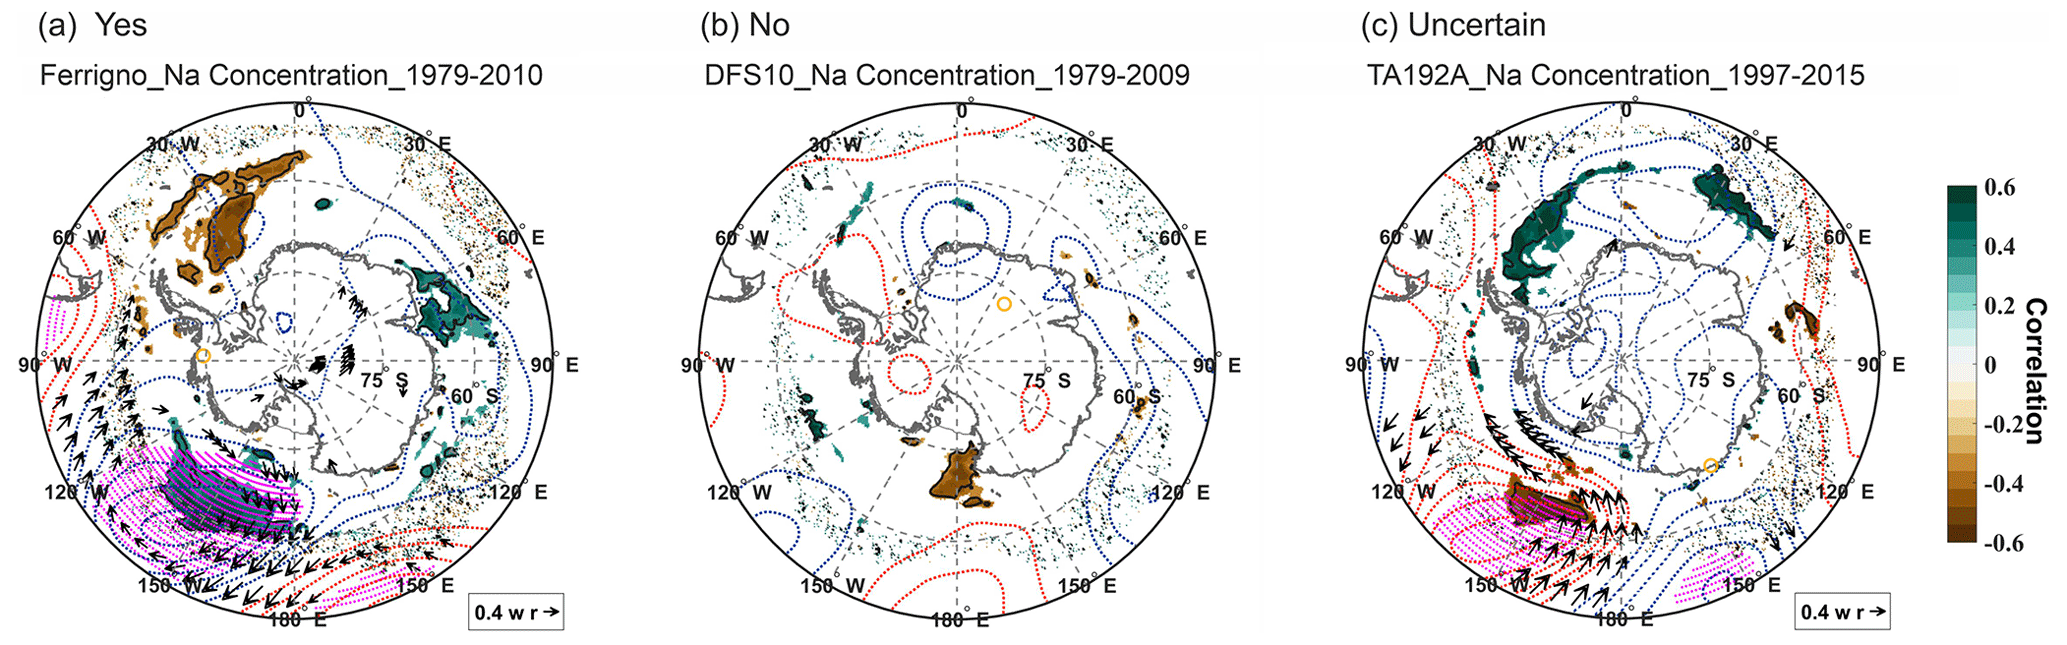
Figure 2Example correlation plots evaluated by the data interpretation team. (a) Yes example, with the correlation observed between all three parameters. (b) No example, with no significant correlation observed with any parameters. In this example, a significant correlation with SIC at a distant location is likely an autocorrelation artefact. (c) Uncertain example for which the transport mechanism could not be verified based on the parameters of this first pass filter. A yellow open circle indicates the ice core location. Coloured shading indicates positive (green) and negative (brown) correlations with SIC (data from NSIDC), and the solid black line indicates correlations significant at the 5 % level. Correlations with winds (arrows) composed of u850 and v850 (ERA 5) are shown. Dashed red and blue contours represent positive (red) and negative (blue) correlations with geopotential height at 500 hPa (ERA5); pink hatching is significant at the 5 % level. Plot titles are labelled as “Site name_species_years for correlation”.
4.1 Identifying sites that correlate with sea ice and atmospheric circulation
An example of the data interpretation output is presented in Fig. 2. For consistency, correlations were performed with climate variables across all longitudes in the Southern Hemisphere south of 50∘ S. This approach has the potential to generate spurious results or correlations in regions that are physically unrelated to the site (e.g. Fig. 2b). Indeed, studies have shown that climatic fields inherit patterns and correlations which can result in statistically significant correlations by chance (Livezey and Chen, 1983). In the following sections, we only refer to records that exhibited a correlation that is statistically significant at the 5 % level (p < 0.05; hereafter referred to as significant).
Sites identified as having a relationship with either SIC, atmospheric pressure (z500), or winds (u850 or v850) had to be supported by a plausible transport mechanism or source region. Therefore, each record was individually evaluated. Sites with a plausible connection were marked as “yes”, while sites which did not have a plausible mechanism were marked as “no”. In the case of the Ferrigno ice core (Fig. 2a), [Na+] that is significantly correlated with SIC is in the adjacent ocean (Amundsen–Ross Sea), with low-pressure anomalies and winds over the Ross Sea, which transport air masses in a clockwise direction from the source region to the ice core site. Thus, for Ferrigno, a plausible source region and transport mechanism has been identified. Conversely, Na at the DFS10 site is also correlated with SIC in the Ross Sea, despite the ice core being located on the opposite side of the continent (Fig. 2b). However, DSF10 [Na+] is not significant correlated with either atmospheric pressure or winds that could transport [Na+] from the Ross Sea to the ice core location. Thus, for DFS10, a plausible source region and transport mechanism has not been identified.
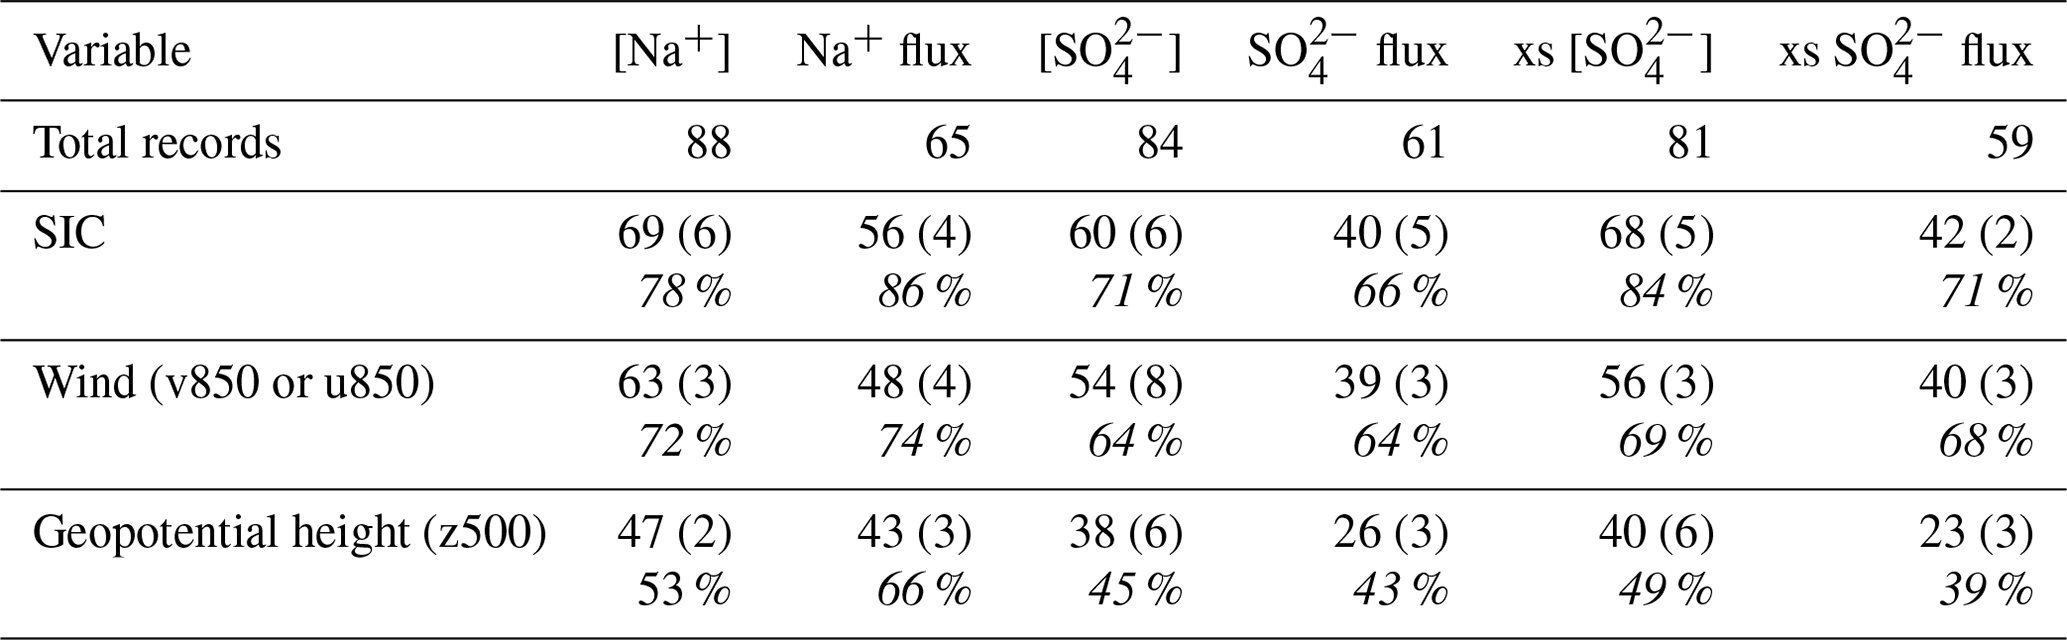
Table 2Summary of the number of records that display a significant correlation (5 % level) with SIC, wind fields (meridional, v850, and zonal, u850), and geopotential height (z500). The total records available for the data interpretation step are shown for each species. This includes all records with more than a 10-year overlap with the instrumental period (1979–2018) and includes duplicates. Parentheses indicate the number of sites marked as “uncertain”. The percentage of records is shown in italics underneath to account for the varying sample size.
We have not applied a uniform cutoff size for the area of correlation or specified a minimum or maximum distance from the source region, as these features will be site specific. For example, the typical air parcel origin height and residence time over the ice sheet is related to the site topography. As such, air parcels reaching low-elevation coastal sites will originate from low-elevation sources (e.g. < 2000 m) and have short residence times over the ice sheet (< 20 h; Suzuki et al., 2013). Some coastal sites (e.g. Sherman Island) may also be influenced by local orography (mountains), which blocks air mass transport and limits the geographical extent of the [Na+] or source region (e.g. Tetzner et al., 2022). Conversely, air parcels reaching central Antarctic sites (e.g. South Pole) may originate from elevations in excess of 4000 m and reside over the ice sheet for more than 120 h (Suzuki et al., 2013). Thus, higher-elevation sites might be influenced by long-range air-mass transport and capture changes in sea ice from relatively distant source regions (e.g. Winski et al. 2021).
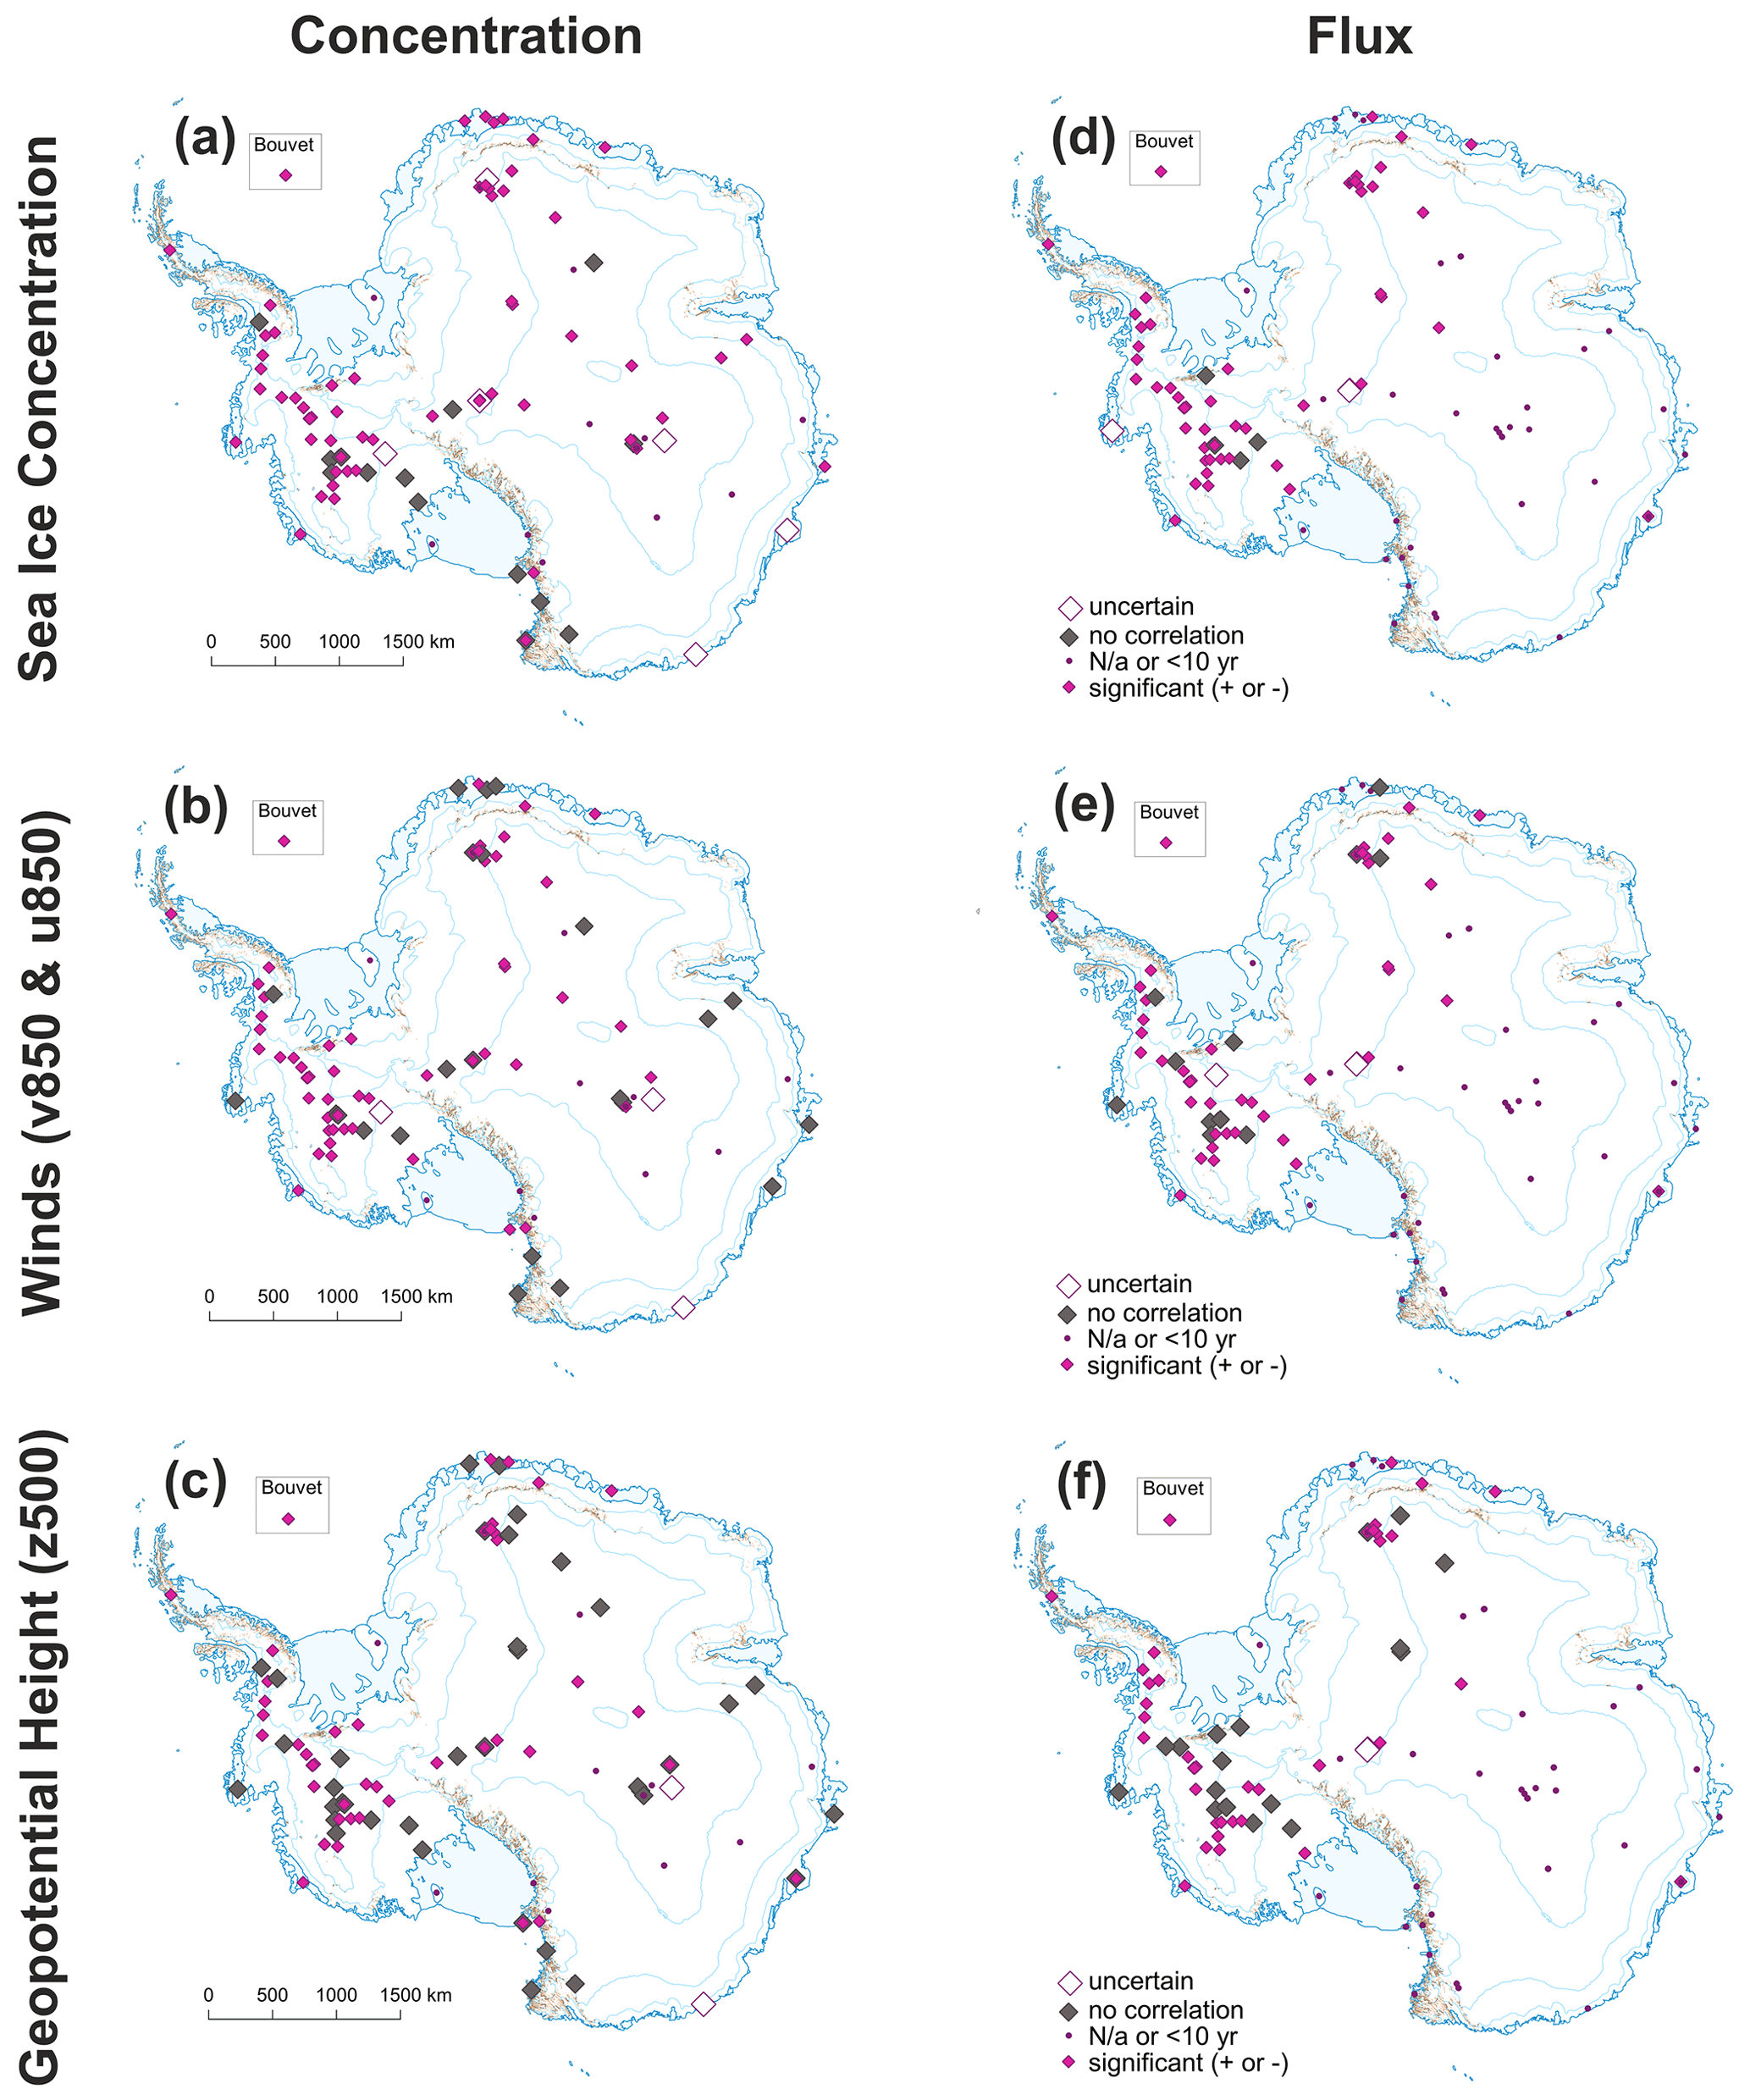
Figure 3Geographical distribution of [Na+] records (a–c) which exhibit a statistically significant (p > 0.05) correlation with (a) SIC, (b) winds (v850 and u850), and (c) geopotential height (z500). This is compared with the geographical distribution of the Na flux record (d–f), which exhibits a statistically significant (p > 0.05) correlation with (d) SIC, (e) winds (v850 and u850), and (f) geopotential height (z500). Pink diamonds are locations with a significant correlation (either positive or negative), grey diamonds are sites with no correlation, and open diamonds are uncertain. Dots indicate ice core locations that are in the database but are either less than 10 years in length (or overlap with the instrumental period) or sites which failed to generate any correlations with parameters tested.
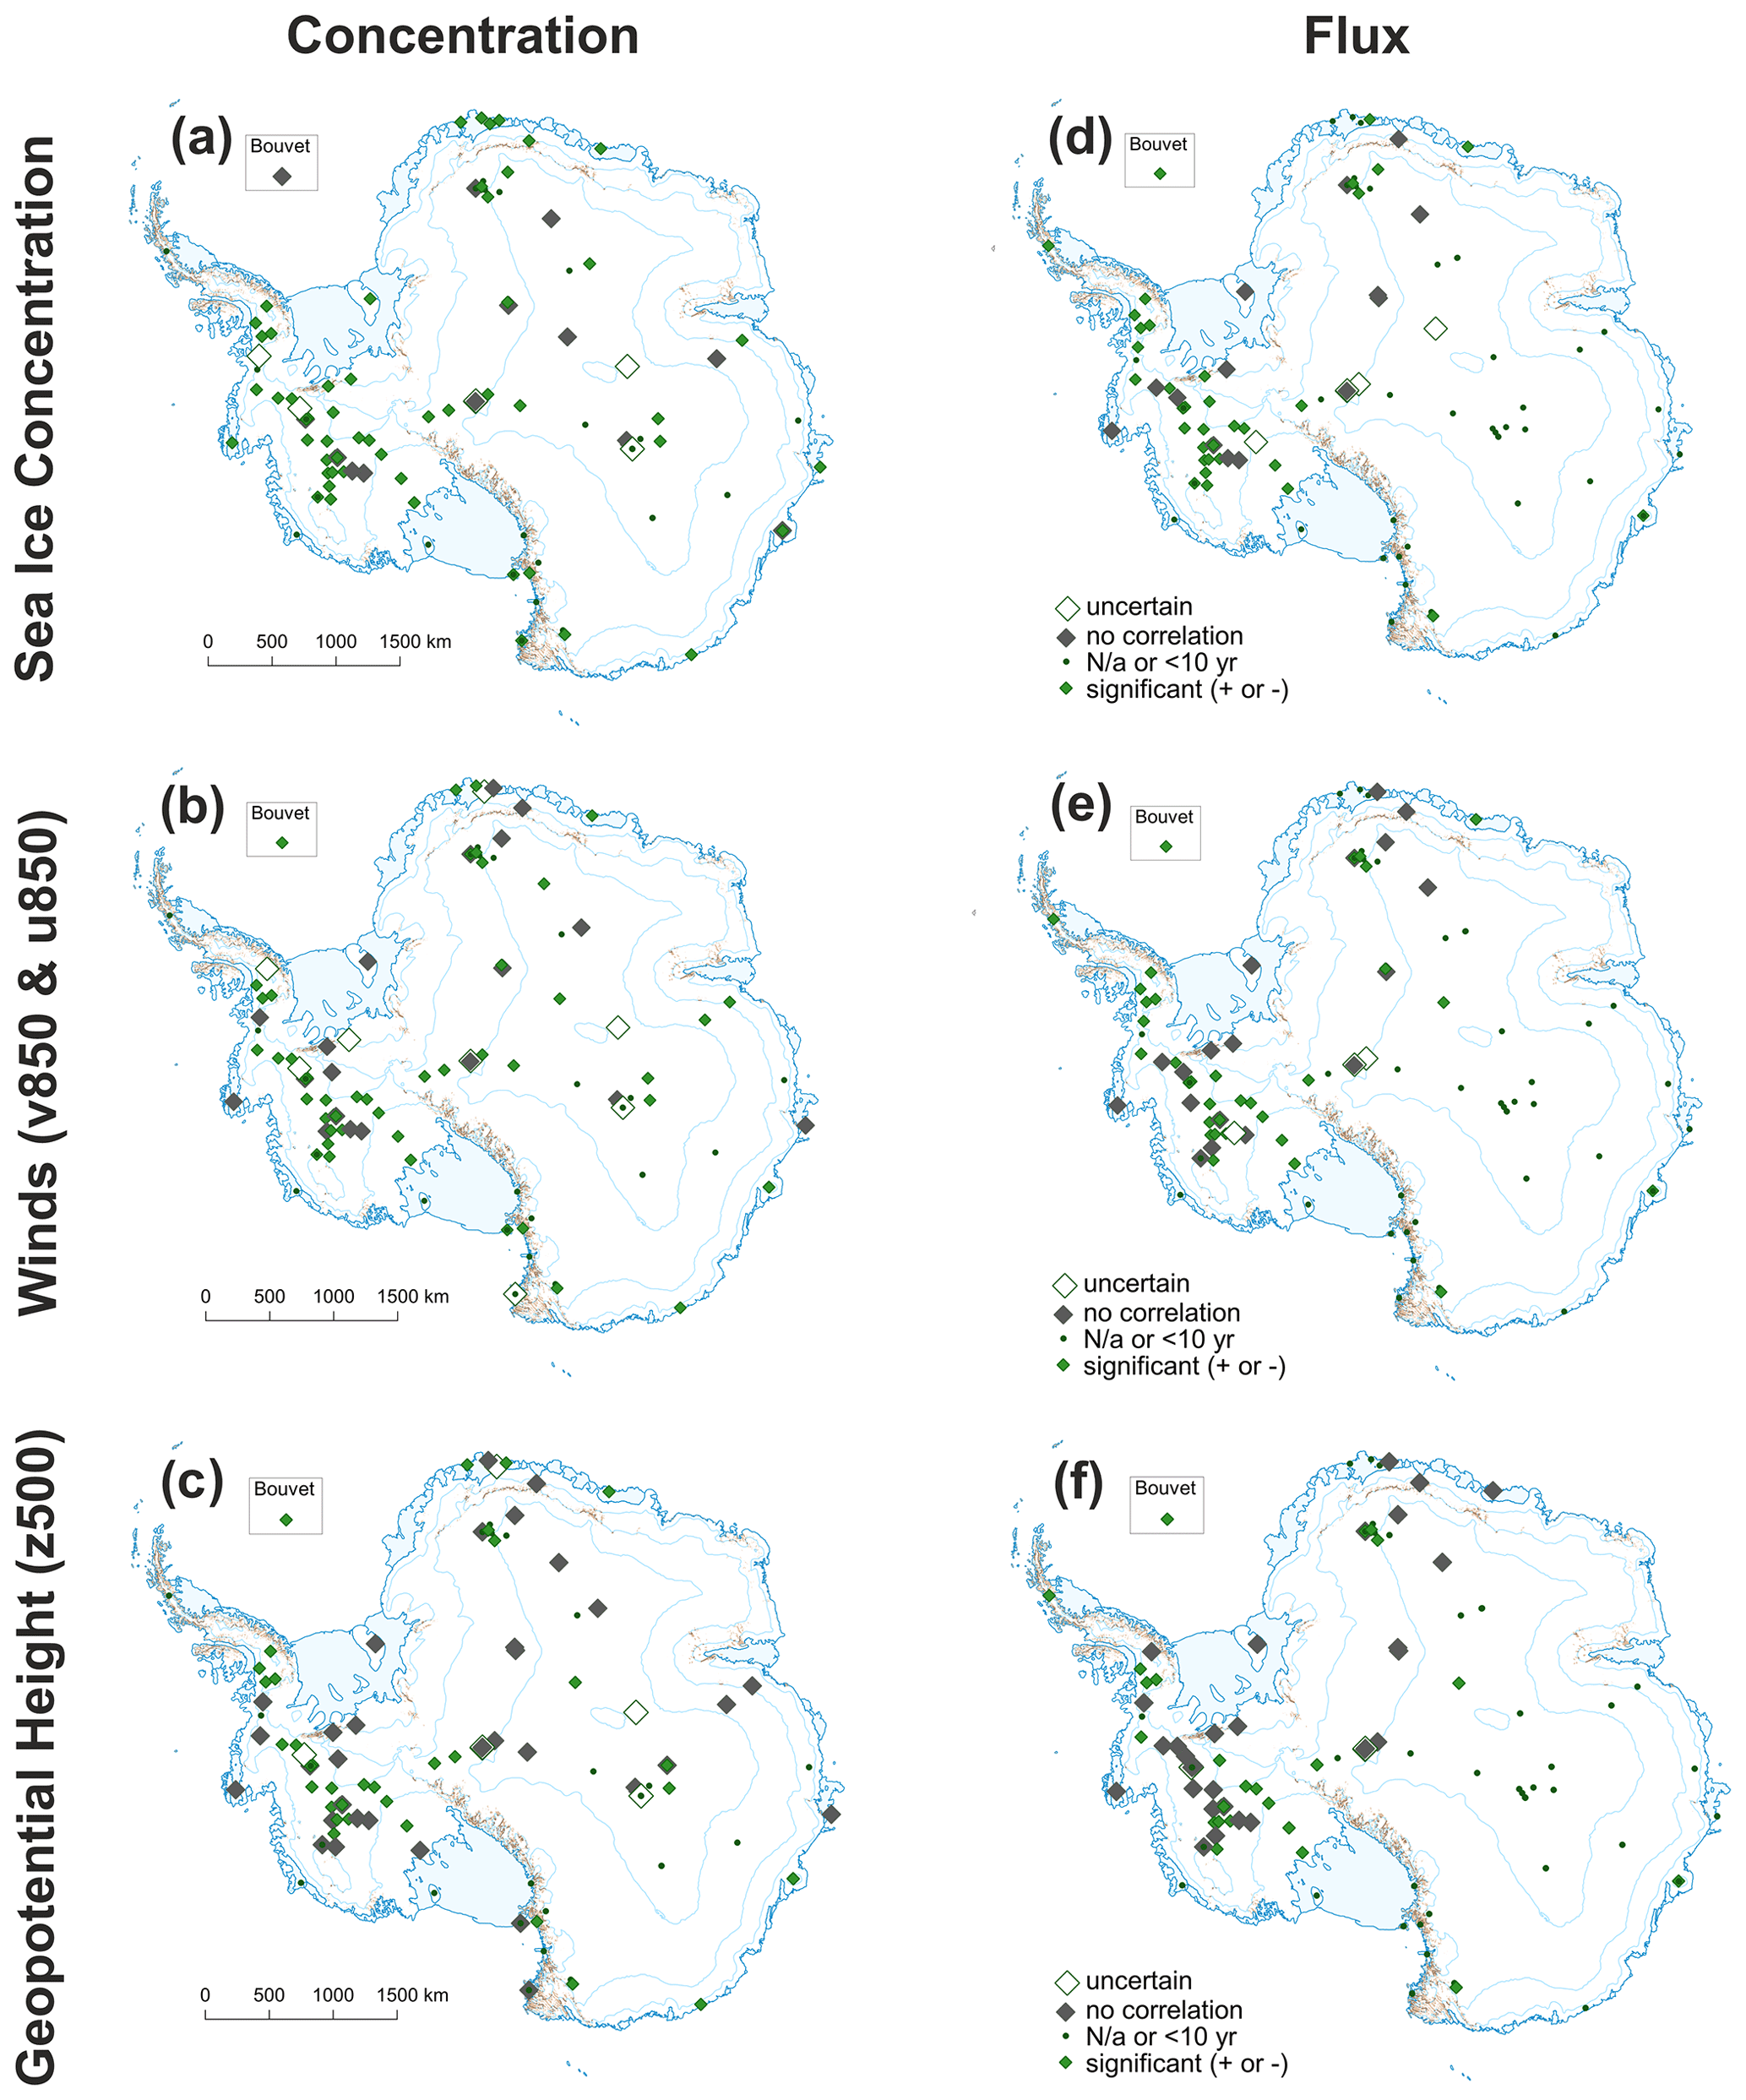
Figure 4Geographical distribution of records (a–c) which exhibit a statistically significant (p > 0.05) correlation with (a) SIC, (b) winds (v850 and u850), and (c) geopotential height (z500). This is compared with the geographical distribution of the flux record (d–f), which exhibits a statistically significant (p > 0.05) correlation with (d) SIC, (e) winds (v850 and u850), and (f) geopotential height (z500). Green diamonds are locations with a significant correlation (either positive or negative), grey diamonds are sites with no correlation, and open diamonds are uncertain. Dots indicate ice core locations that are in the database but are either less than 10 years in length (or overlap with the instrumental period) or sites which failed to generate any correlations with parameters tested.
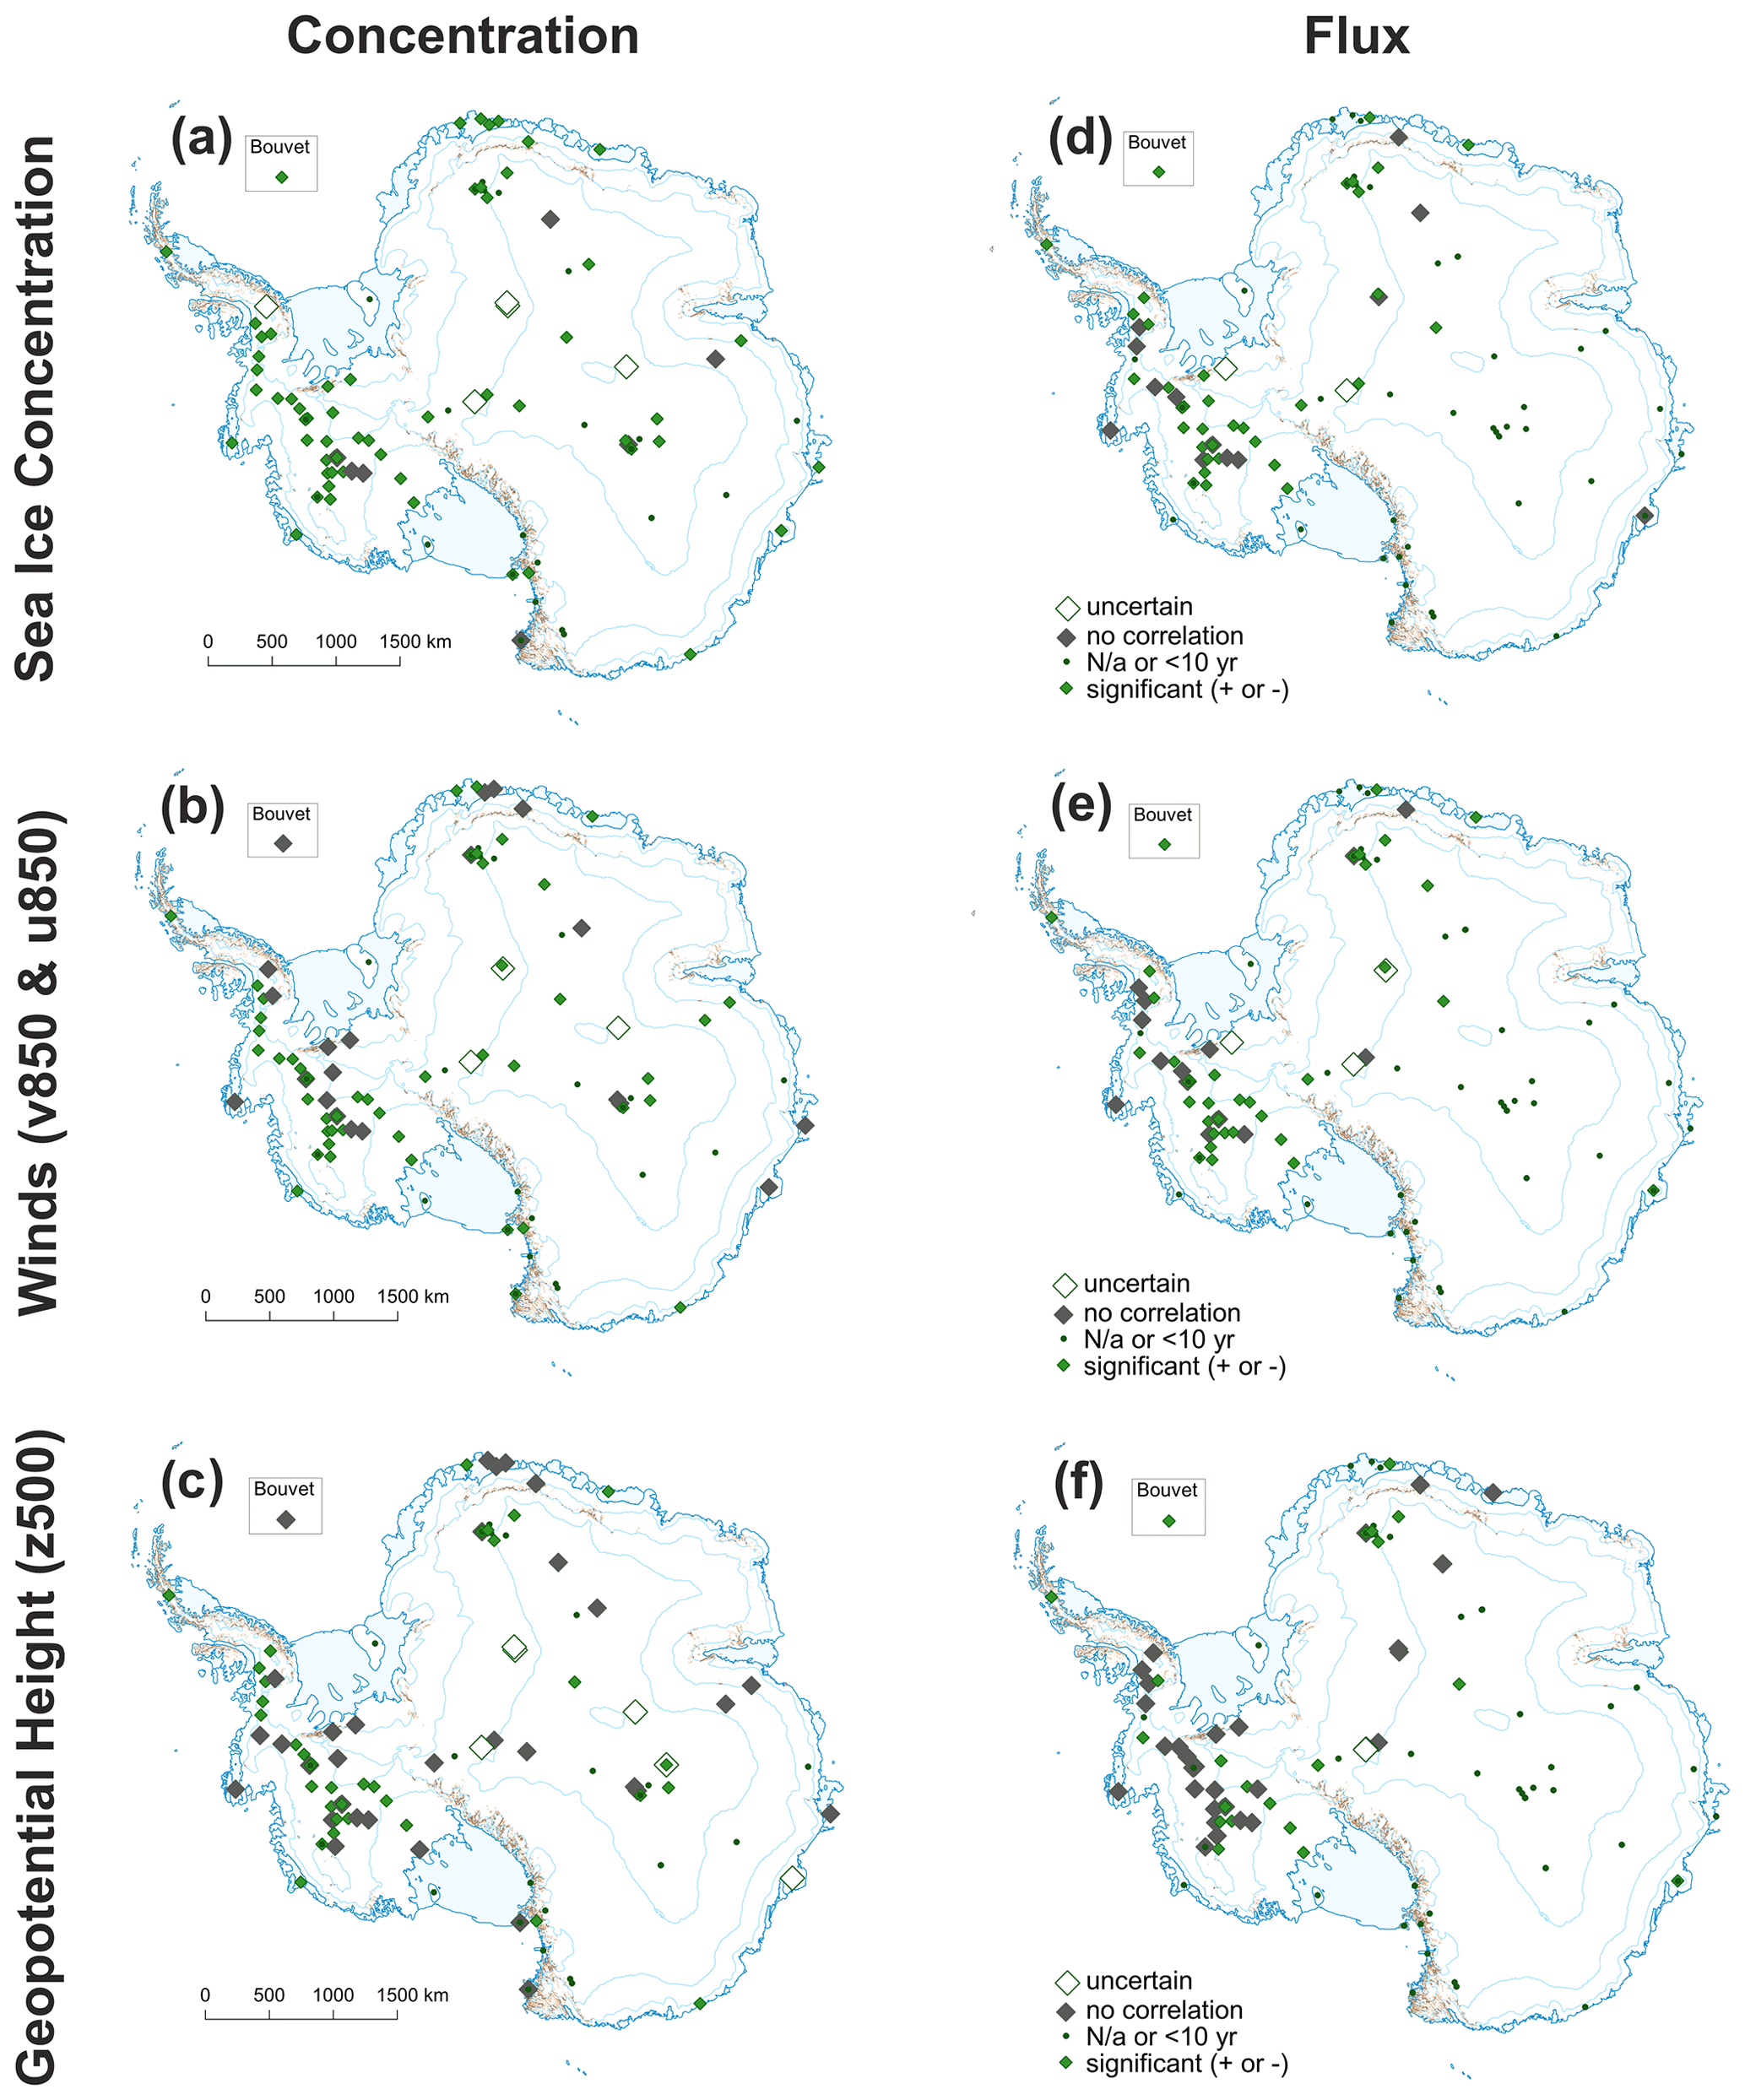
Figure 5Geographical distribution of records (a–c) which exhibit a statistically significant (p > 0.05) correlation with (a) SIC, (ba) winds (v850 and u850), and (c) geopotential height (z500). This is compared with the geographical distribution of the flux record (d–f), which exhibits a statistically significant (p > 0.05) correlation with (d) SIC, (e) winds (v850 and u850), and (f) geopotential height (z500). Green diamonds are locations with a significant correlation (either positive or negative), grey diamonds are sites with no correlation, and open diamonds are uncertain. Dots indicate ice core locations that are in the database but are either less than 10 years in length (or overlap with the instrumental period) or sites which failed to generate any correlations with parameters tested.
The database contains more concentration records than flux records. Thus, in the data interpretation, we presented both the total number of sites and the proportion of sites that exhibit a significant correlation with meteorological parameters. The total number of eligible records for each species is shown in Table 2. The spatial distribution of records is presented in Figs. 3–5.
4.2 Sodium (concentration and flux)
A total of 69 (out of 88) [Na+] sites exhibit a correlation with SIC, with an additional six records marked as uncertain (Table 2). Moreover, 56 (out of 65) records are correlated with SIC when using Na+ flux, with an additional four sites marked as uncertain. This reflects the smaller number of flux records submitted to the database. Proportionally, more records are correlated with SIC when using flux than when using concentration (86 % compared to 78 %).
A total of 63 (out of 88) [Na+] records exhibit a significant correlation with the wind fields (v850 and u850), while an additional 3 records were marked as uncertain. When using Na+ flux 48 (out of 65) records correlated with winds, there were 4 records marked as uncertain. A higher proportion of records (74 % compared with 72 %) correlated with winds when using flux.
A total of 47 (out of 88) [Na+] sites exhibit a significant correlation with geopotential height, while an additional 2 records are marked as uncertain. The number of correlations with geopotential height is 43 (out of 65) when using Na+ flux, with an additional 3 sites marked as uncertain. A higher proportion of records (66 % compared with 53 %) correlated with atmospheric circulation when using flux.
4.3 Sulfate (concentration and flux)
A total of 60 (out of 84) records display a correlation with SIC, with 6 additional records marked as uncertain (Table 2). When using flux, 40 (out of 61) records correlated with SIC, with an additional 5 records marked as uncertain. A slightly higher proportion of records (71 % compared with 66 %) correlated with SIC when using flux.
Moreover, 54 records (out of 84) are correlated with winds (v850 and u850), with 8 additional records marked as uncertain. This is compared to 39 records (out of 61) and 3 additional records marked as uncertain that are correlated with winds when using flux. The proportion of records correlated with winds (64 %) is the same when using either flux or concentration.
A total of 38 (out of 84) records are correlated with geopotential height, with 6 additional records marked as uncertain. This is compared with 26 records (out of 61) when using flux, with 3 marked as uncertain. A slightly higher proportion of records (45 % compared with 43 %) is correlated with atmospheric circulation when using flux.
4.4 Excess sulfate (concentration and flux)
A total of 68 (out of 81) records are correlated with SIC, with 5 additional records marked as uncertain when using concentration (Table 2). This number drops to 42 (out of 59) when using the flux, with 2 additional records marked as uncertain. A smaller proportion of records (71 % compared with 84 %) correlated with SIC when using flux.
A total of 56 (out of 81) records are correlated winds (v850 and u850), with 3 additional records marked as uncertain. The number drops to 40 (out of 59) records when using the flux, with 3 additional records marked as uncertain. A higher proportion of records (69 % compared with 68 %) correlated with winds when using flux.
A total of 40 (out of 81) concentration records are correlated with geopotential height, with an additional 6 records marked as uncertain. The number drops to 23 (out of 59) records when using the flux, with 3 additional records marked as uncertain. A smaller proportion of records (39 % compared with 49 %) correlated with atmospheric circulation when using flux.
5.1 Which records are suitable for reconstructing SIC, winds, and atmospheric circulation?
Our findings reveal that [Na+] provides the highest number (69) of records that exhibit a significant correlation with SIC, and it is only fractionally higher than the number of (68) and SO4 (60) records. This suggests that all three records have the potential to capture changes in sea ice conditions. The full list of which sites exhibit positive correlations with each parameter is shown in Fig. S2 in the Supplement.
[Na+] also provides the highest number of correlations with geopotential height (47) and wind (63). However, proportionally, Na flux has the highest number of correlations with geopotential height and winds. While less than 49 % of the and data exhibit relationships with geopotential height, a much higher percentage (64 %–69 %) displays correlations with winds. This suggests that there is greater potential for using and for reconstructing winds and SIC than geopotential heights. Removing the sea salt component of to produce improves the relationship with SIC, geopotential height, and winds.
Most of the records from West Antarctica and the Antarctic Peninsula (both [Na+] and ) exhibit correlations with SIC, geopotential height, and winds. This reflects the dominance of marine air mass incursions in this region (Suzuki et al., 2013), transporting sea salt aerosols from the sea ice zone to the ice core sites. In contrast, in East Antarctica, the high elevation of the ice sheet (> 3000 m) acts as a barrier to marine air mass transport. However, this study corroborates previous studies (e.g. Winski et al., 2021), suggesting that [Na+] and concentrations from ice cores in the eastern Antarctic Plateau are significantly correlated with SIC and atmospheric circulation.
Converting the records to flux drastically reduces the geographical coverage. In most cases, this is due to the lack of available snow accumulation records from central Antarctica needed to calculate the flux. However, our study demonstrates that converting [Na+] to flux increases the relative proportion of records that exhibit a significant correlation with SIC, geopotential height, and winds. The opposite is true for and , which results in a lower proportion of records correlating with SIC after converting to flux. This may suggest a dominance of the wet deposition of [Na+] and dry deposition of . However, a detailed evaluation of the relationships between the ion concentration and snow accumulation is needed to address this fully.
Overall, the records of [Na+] exhibit the highest number of correlations with the climatic variables considered (179 out of 264), followed by (164 out of 243) and (152 out of 252).
5.2 Potential limitations
There are limitations to this assessment, which is intended as a first-level filter to highlight the potential future use of the data. In particular, the numbers only relate to records that span or have at least 10 years of data that overlap with the instrumental period. This is defined as the period from 1979–2019 and accounts for 88 % of the records (438 out of 499 records submitted). Thus, relationships may exist for shorter records or records drilled prior to 1979; however, it is not possible to verify this under the criteria defined here. Another caveat is that correlations have only been conducted with a single sea ice (NSIDC) and reanalysis (ERA-5) product, and results may vary with different datasets. Results may also be impacted by the different time spans used. For example, it was not possible to select the same reference period to run all correlations because record lengths and top ages (date the core was drilled) vary considerably. Thus, the assumed stationarity in the source and transport routes may not be appropriate.
We also note that almost 8 % of the records have been classified as uncertain. In some cases, significant correlations were evident in the plots, but they were difficult to explain (Fig. 2c). For example, Law Dome generates several regions of significant correlations across multiple sectors; however, this is not in the ocean adjacent to the site. This may indicate long-term transport or the influence of large-scale atmospheric circulation (e.g. SAM, Indian Ocean Dipole, and Atlantic Multidecadal Oscillation). However, in this first-level filter, we only included sites for which a clear mechanism was evident.
This data descriptor presents version 1.0.0 of the CLIVASH2k Antarctic ice core chemistry database PAGES CLIVASH2k database (Thomas et al., 2022; https://doi.org/10.5285/9E0ED16E-F2AB-4372-8DF3-FDE7E388C9A7). The database can be accessed via the UK Polar Data Centre.
The CLIVASH2k database is the first compilation of an Antarctic continental-scale database of chemical records in ice cores spanning the past 2000 years. This study is the first phase of the project, the goal of which was to compile and publish the records. We have provided all available [Na+] and records submitted by the community. The records are all available as annual averages, included as both concentration and flux (where available). An additional parameter, has also been calculated (where possible).
To facilitate future data interpretation, we have run spatial correlations for all the records. The aim of this analysis is to identify sites which exhibit a statistically significant relationship with the sea ice concentration (SIC) and atmospheric circulation (500 hPa geopotential height) or winds (v850 and u850). This is intended as a first filter to identify potential records that could be used in future proxy reconstructions.
This first-level filter demonstrates that, when considering the species separately, 335 individual records exhibit statistically significant correlations with SIC that have been verified by a team of experts. A recent compilation of available ice-core-derived sea ice reconstructions, based on a range of proxy data, identified only 17 individual sites which have been used to reconstruct sea ice (Thomas et al., 2019). Thus, this data compilation represents a significant improvement on existing published or available data.
For researchers interested in reconstructing winds or atmospheric circulation, the CLIVASH2k database contains a total of 300 records that are significantly correlated with the wind fields (v850 and u850) and 217 records that are significantly correlated with geopotential height (500 hPa). The Na+ flux exhibits the greatest proportion of records that correlate with sea ice, atmospheric circulation, and winds. Therefore, among the ice core chemical species considered in our analysis, we propose Na+ flux as the best candidate for reconstructing all three climatic components.
Future work will focus on using this database with respect to the following:
-
Investigating the deposition of [Na+] and over decadal to centennial timescales.
-
Providing a reconstruction of sea ice distribution or atmospheric circulation spanning the past 2000 years.
-
Evaluating the skill of chemical transport models to capture observed deposition of [Na+] and .
-
Combining the information in this new database with the database of snow accumulation (Thomas et al., 2017) and isotopic content (Stenni et al., 2017) to obtain a comprehensive view of Antarctic climate variations over the past 2000 years.
This is not an exhaustive list, and we encourage the community to engage with the CLIVASH2k working group and make use of the database.
The supplement related to this article is available online at: https://doi.org/10.5194/essd-15-2517-2023-supplement.
ERT and HG conceived the idea. ERT and DOV initiated the data call and coordinated the project. ERT wrote the paper, with contributions from the core writing group. The core writing group (DOV, ACFK, BDE, HG, DAW, VHLW, DAD, DGU, and TRV) contributed to the paper writing and discussions. The data interpretation team (ERT, DOV, ACFK, DAW, VHLW, DAD, NC, DGU, TRV, DT, MMG, and MSi) quality-checked the data, evaluated the age scales, and interpreted the spatial correlation plots. NANB, AH, CML, JRMC, YM, KT, HM, YN, FS, JCS, MSe, RT, SW, CX, JY, TVK, AAE, LPG, and EMT all provided unpublished data. BDE wrote the code for the data interpretation plots. DOV and ERT compiled the figures. All authors read and commented on the paper.
The contact author has declared that none of the authors has any competing interests.
Publisher's note: Copernicus Publications remains neutral with regard to jurisdictional claims in published maps and institutional affiliations.
CLIVASH2k is a contribution of Phase 3 of the PAGES 2k Network. Dieter Tetzner has been funded as part of the PAGES Data Stewardship scholarship awarded to Elizabeth R. Thomas. This financial support comes from the Chinese Academy of Sciences (CAS) and the Swiss Academy of Sciences (SCNAT). We thank the PAGES office for their support and the temporary data storage during the compilation of this database. We thank editor Petra Heil and two anonymous reviewers for their constructive review and recommendations. The following researchers contributed published data to this database: Yoshiyuki Fujii, Lenneke Jong, Elisabeth Isaksson, Filipe G. L. Lindau, Andrew Moy, and Rachael Rhodes. We thank the many other researchers who have already made their data available on public data repositories.
This research has been supported by PAGES (PAGES2k), the Chinese Academy of Sciences (CAS), and the Swiss Academy of Sciences (SCNAT).
This paper was edited by Petra Heil and reviewed by two anonymous referees.
Arienzo, M. M., McConnell, J. R., Chellman, N., and Kipfstuhl, S.: Method for Correcting Continuous Ice-Core Elemental Measurements for Under-Recovery, Environ. Sci. Technol., 53, 5887–5894, https://doi.org/10.1021/acs.est.9b00199, 2019.
Barnes, I., Hjorth, J., and Mihalopoulos, N.: Dimethyl Sulfide and Dimethyl Sulfoxide and Their Oxidation in the Atmosphere, Chem. Rev., 106, 940–975, https://doi.org/10.1021/cr020529+, 2006.
Brean, J., Dall'Osto, M., Simó, R., Shi, Z., Beddows, D. C. S., and Harrison, R. M.: Open ocean and coastal new particle formation from sulfuric acid and amines around the Antarctic Peninsula, Nat. Geosci., 14, 383–388, https://doi.org/10.1038/s41561-021-00751-y, 2021.
Büntgen, U., Wacker, L., Galván, J. D., Arnold, S., Arseneault, D., Baillie, M., Beer, J., Bernabei, M., Bleicher, N., Boswijk, G., Bräuning, A., Carrer, M., Ljungqvist, F. C., Cherubini, P., Christl, M., Christie, D. A., Clark, P. W., Cook, E. R., D'Arrigo, R., Davi, N., Eggertsson, Ó., Esper, J., Fowler, A. M., Gedalof, Z. e., Gennaretti, F., Grießinger, J., Grissino-Mayer, H., Grudd, H., Gunnarson, B. E., Hantemirov, R., Herzig, F., Hessl, A., Heussner, K.-U., Jull, A. J. T., Kukarskih, V., Kirdyanov, A., Kolář, T., Krusic, P. J., Kyncl, T., Lara, A., LeQuesne, C., Linderholm, H. W., Loader, N. J., Luckman, B., Miyake, F., Myglan, V. S., Nicolussi, K., Oppenheimer, C., Palmer, J., Panyushkina, I., Pederson, N., Rybníček, M., Schweingruber, F. H., Seim, A., Sigl, M., Churakova, O., Speer, J. H., Synal, H.-A., Tegel, W., Treydte, K., Villalba, R., Wiles, G., Wilson, R., Winship, L. J., Wunder, J., Yang, B., and Young, G. H. F.: Tree rings reveal globally coherent signature of cosmogenic radiocarbon events in 774 and 993 CE, Nat. Communi., 9, 3605, https://doi.org/10.1038/s41467-018-06036-0, 2018.
Cavalieri, D. J., Gloersen, P., Parkinson, C. L., Comiso, J. C., and Zwally, H. J.: Observed hemispheric asymmetry in global sea ice changes, Science, 278, 1104–1106, 1997.
Cole-Dai, J., Ferris, D. G., Kennedy, J. A., Sigl, M., McConnell, J. R., Fudge, T. J., Geng, L., Maselli, O. J., Taylor, K. C., and Souney, J. M.: Comprehensive Record of Volcanic Eruptions in the Holocene (11,000 years) From the WAIS Divide, Antarctica Ice Core, J. Geophys. Res.-Atmos., 126, e2020JD032855, https://doi.org/10.1029/2020JD032855, 2021.
Dalaiden, Q., Goosse, H., Rezsöhazy, J., and Thomas, E. R.: Reconstructing atmospheric circulation and sea-ice extent in the West Antarctic over the past 200 years using data assimilation, Clim. Dynam., 57, 3479–3503, https://doi.org/10.1007/s00382-021-05879-6, 2021.
Delmas, R., Briat, M., and Legrand, M.: Chemistry of south polar snow, J. Geophys. Res.-Oceans, 87, 4314–4318, https://doi.org/10.1029/JC087iC06p04314, 1982.
Dixon, D., Mayewski, P. A., Kaspari, S., Sneed, S., and Handley, M.: A 200 year sub-annual record of sulfate in West Antarctica, from 16 ice cores, Ann. Glaciol., 39, 545–556, https://doi.org/10.3189/172756404781814113, 2004.
Ekaykin, A. A., Kozachek, A. V., Lipenkov, V. Y., and Shibaev, Y. A.: Multiple climate shifts in the Southern Hemisphere over the past three centuries based on central Antarctic snow pits and core studies, Ann. Glaciol., 55, 259–266, https://doi.org/10.3189/2014AoG66A189, 2014.
Emanuelsson, B. D., Thomas, E. R., Tetzner, D. R., Humby, J. D., and Vladimirova, D. O.: Ice Core Chronologies from the Antarctic Peninsula: The Palmer, Jurassic, and Rendezvous Age-Scales, Geosciences, 12, 87, https://doi.org/10.3390/geosciences12020087, 2022.
Fogt, R. L., Sleinkofer, A. M., Raphael, M. N., and Handcock, M. S.: A regime shift in seasonal total Antarctic sea ice extent in the twentieth century, Nat. Clim. Change, 12, 54–62, https://doi.org/10.1038/s41558-021-01254-9, 2022.
Frey, M. M., Norris, S. J., Brooks, I. M., Anderson, P. S., Nishimura, K., Yang, X., Jones, A. E., Nerentorp Mastromonaco, M. G., Jones, D. H., and Wolff, E. W.: First direct observation of sea salt aerosol production from blowing snow above sea ice, Atmos. Chem. Phys., 20, 2549–2578, https://doi.org/10.5194/acp-20-2549-2020, 2020.
Gondwe, M., Krol, M., Gieskes, W., Klaassen, W., and de Baar, H.: The contribution of ocean-leaving DMS to the global atmospheric burdens of DMS, MSA, SO2, and NSS , Global Biogeochem. Cy., 17, 1056, https://doi.org/10.1029/2002GB001937, 2003.
Grieman, M. M., Hoffmann, H. M., Humby, J. D., Mulvaney, R., Nehrbass-Ahles, C., Rix, J., Thomas, E. R., Tuckwell, R., and Wolff, E. W.: Continuous flow analysis methods for sodium, magnesium and calcium detection in the Skytrain ice core, J. Glaciol., 68, 90–100, https://doi.org/10.1017/jog.2021.75, 2022.
Hersbach, H., Bell, B., Berrisford, P., Hirahara, S., Horányi, A., Muñoz-Sabater, J., Nicolas, J., Peubey, C., Radu, R., and Schepers, D.: The ERA5 global reanalysis, Q. J. Roy. Meteorol. Soc., 146, 1999–2049, 2020.
Holland, H. D.: The chemistry of the atmosphere and oceans, Wiley-Interscience, New York, 351 pp., ISBN 9780471035091, 1978.
Huang, J. and Jaeglé, L.: Wintertime enhancements of sea salt aerosol in polar regions consistent with a sea ice source from blowing snow, Atmos. Chem. Phys., 17, 3699–3712, https://doi.org/10.5194/acp-17-3699-2017, 2017.
Jones, J. M., Gille, S. T., Goosse, H., Abram, N. J., Canziani, P. O., Charman, D. J., Clem, K. R., Crosta, X., de Lavergne, C., Eisenman, I., England, M. H., Fogt, R. L., Frankcombe, L. M., Marshall, G. J., Masson-Delmotte, V., Morrison, A. K., Orsi, A. J., Raphael, M. N., Renwick, J. A., Schneider, D. P., Simpkins, G. R., Steig, E. J., Stenni, B., Swingedouw, D., and Vance, T. R.: Assessing recent trends in high-latitude Southern Hemisphere surface climate, Nat. Clim. Change, 6, 917–926, https://doi.org/10.1038/nclimate3103, 2016.
Jungclaus, J. H., Bard, E., Baroni, M., Braconnot, P., Cao, J., Chini, L. P., Egorova, T., Evans, M., González-Rouco, J. F., Goosse, H., Hurtt, G. C., Joos, F., Kaplan, J. O., Khodri, M., Klein Goldewijk, K., Krivova, N., LeGrande, A. N., Lorenz, S. J., Luterbacher, J., Man, W., Maycock, A. C., Meinshausen, M., Moberg, A., Muscheler, R., Nehrbass-Ahles, C., Otto-Bliesner, B. I., Phipps, S. J., Pongratz, J., Rozanov, E., Schmidt, G. A., Schmidt, H., Schmutz, W., Schurer, A., Shapiro, A. I., Sigl, M., Smerdon, J. E., Solanki, S. K., Timmreck, C., Toohey, M., Usoskin, I. G., Wagner, S., Wu, C.-J., Yeo, K. L., Zanchettin, D., Zhang, Q., and Zorita, E.: The PMIP4 contribution to CMIP6 – Part 3: The last millennium, scientific objective, and experimental design for the PMIP4 past1000 simulations, Geosci. Model Dev., 10, 4005–4033, https://doi.org/10.5194/gmd-10-4005-2017, 2017.
Kaufman, D., McKay, N., Routson, C., Erb, M., Dätwyler, C., Sommer, P. S., Heiri, O., and Davis, B.: Holocene global mean surface temperature, a multi-method reconstruction approach, Sci. Data, 7, 201, https://doi.org/10.1038/s41597-020-0530-7, 2020.
Konecky, B. L., McKay, N. P., Churakova (Sidorova), O. V., Comas-Bru, L., Dassié, E. P., DeLong, K. L., Falster, G. M., Fischer, M. J., Jones, M. D., Jonkers, L., Kaufman, D. S., Leduc, G., Managave, S. R., Martrat, B., Opel, T., Orsi, A. J., Partin, J. W., Sayani, H. R., Thomas, E. K., Thompson, D. M., Tyler, J. J., Abram, N. J., Atwood, A. R., Cartapanis, O., Conroy, J. L., Curran, M. A., Dee, S. G., Deininger, M., Divine, D. V., Kern, Z., Porter, T. J., Stevenson, S. L., von Gunten, L., and Iso2k Project Members: The Iso2k database: a global compilation of paleo-δ18O and δ2H records to aid understanding of Common Era climate, Earth Syst. Sci. Data, 12, 2261–2288, https://doi.org/10.5194/essd-12-2261-2020, 2020.
Legrand, M. and Mayewski, P.: Glaciochemistry of polar ice cores: A review, Rev. Geophys., 35, 219–243, https://doi.org/10.1029/96RG03527, 1997.
Legrand, M., Feniet-Saigne, C., Saltzman, E. S., and Germain, C.: Spatial and temporal variations of methanesulfonic acid and non sea salt sulfate in Antarctic ice, J. Atmos. Chem., 14, 245–260, https://doi.org/10.1007/BF00115237, 1992.
Lide, D.: CRC Handbook of Chemistry and Physic, Taylor & Francis, 85th edn., https://www.google.co.uk/books/edition/_/WDll8hA006AC?hl=en&gbpv=0 (last access: October 2022), 2005.
Livezey, R. E. and Chen, W.: Statistical field significance and its determination by Monte Carlo techniques, Mon. Weather Rev, 111, 46–59, 1983.
Mayewski, P. A., Carleton, A. M., Birkel, S. D., Dixon, D., Kurbatov, A. V., Korotkikh, E., McConnell, J., Curran, M., Cole-Dai, J., Jiang, S., Plummer, C., Vance, T., Maasch, K. A., Sneed, S. B., and Handley, M.: Ice core and climate reanalysis analogs to predict Antarctic and Southern Hemisphere climate changes, Quaternary Sci. Rev., 155, 50–66, https://doi.org/10.1016/j.quascirev.2016.11.017, 2017.
McCoy, D. T., Burrows, S. M., Wood, R., Grosvenor, D. P., Elliott, S. M., Ma, P.-L., Rasch, P. J., and Hartmann, D. L.: Natural aerosols explain seasonal and spatial patterns of Southern Ocean cloud albedo, Science Advances, 1, e1500157, https://doi.org/10.1126/sciadv.1500157, 2015.
McGregor, H. V., Evans, M. N., Goosse, H., Leduc, G., Martrat, B., Addison, J. A., Mortyn, P. G., Oppo, D. W., Seidenkrantz, M.-S., Sicre, M.-A., Phipps, S. J., Selvaraj, K., Thirumalai, K., Filipsson, H. L., and Ersek, V.: Robust global ocean cooling trend for the pre-industrial Common Era, Nat. Geosci., 8, 671–677, https://doi.org/10.1038/ngeo2510, 2015.
McKay, N. P. and Kaufman, D. S.: An extended Arctic proxy temperature database for the past 2,000 years, Sci. Data, 1, 140026, https://doi.org/10.1038/sdata.2014.26, 2014.
Medley, B. and Thomas, E. R.: Increased snowfall over the Antarctic Ice Sheet mitigated twentieth-century sea-level rise, Nat. Clim. Change, 9, 34–39, https://doi.org/10.1038/s41558-018-0356-x, 2019.
Meehl, G. A., Arblaster, J. M., Bitz, C. M., Chung, C. T. Y., and Teng, H.: Antarctic sea-ice expansion between 2000 and 2014 driven by tropical Pacific decadal climate variability, Nat. Geosci., 9, 590–595, https://doi.org/10.1038/ngeo2751, 2016.
Minikin, A., Wagenbach, D., Graf, W., and Kipfstuhl, J.: Spatial and seasonal variations of the snow chemistry at the central Filchner-Ronne Ice Shelf, Antarctica, Ann. Glaciol., 20, 283–290, 1994.
Münch, T. and Laepple, T.: What climate signal is contained in decadal- to centennial-scale isotope variations from Antarctic ice cores?, Clim. Past, 14, 2053–2070, https://doi.org/10.5194/cp-14-2053-2018, 2018.
O'Brien, S. R., Mayewski, P. A., Meeker, L. D., Meese, D. A., Twickler, M. S., and Whitlow, S. I.: Complexity of Holocene Climate as Reconstructed from a Greenland Ice Core, Science, 270, 1962–1964, https://doi.org/10.1126/science.270.5244.1962, 1995.
Plummer, C. T., Curran, M. A. J., van Ommen, T. D., Rasmussen, S. O., Moy, A. D., Vance, T. R., Clausen, H. B., Vinther, B. M., and Mayewski, P. A.: An independently dated 2000-yr volcanic record from Law Dome, East Antarctica, including a new perspective on the dating of the 1450s CE eruption of Kuwae, Vanuatu, Clim. Past, 8, 1929–1940, https://doi.org/10.5194/cp-8-1929-2012, 2012.
Rankin, A. M., Auld, V., and Wolff, E. W.: Frost flowers as a source of fractionated sea salt aerosol in the polar regions, Geophys. Res. Lett., 27, 3469–3472, https://doi.org/10.1029/2000gl011771, 2000.
Rankin, A. M., Wolff, E. W., and Martin, S.: Frost flowers: Implications for tropospheric chemistry and ice core interpretation, J. Geophys. Res.-Atmos., 107, AAC 4-1–AAC 4-15, https://doi.org/10.1029/2002jd002492, 2002.
Ren, J., Li, C., Hou, S., Xiao, C., Qin, D., Li, Y., and Ding, M.: A 2680 year volcanic record from the DT-401 East Antarctic ice core, J. Geophys. Res.-Atmos., 115, D11301, https://doi.org/10.1029/2009JD012892, 2010.
Rhodes, R. H., Yang, X., and Wolff, E. W.: Sea Ice Versus Storms: What Controls Sea Salt in Arctic Ice Cores?, Geophys. Res. Lett., 45, 5572–5580, https://doi.org/10.1029/2018gl077403, 2018.
Roach, L. A., Dörr, J., Holmes, C. R., Massonnet, F., Blockley, E. W., Notz, D., Rackow, T., Raphael, M. N., O'Farrell, S. P., Bailey, D. A., and Bitz, C. M.: Antarctic Sea Ice Area in CMIP6, Geophys. Res. Lett., 47, e2019GL086729, https://doi.org/10.1029/2019GL086729, 2020.
Saltzman, E. S., Dioumaeva, I., and Finley, B. D.: Glacial/interglacial variations in methanesulfonate (MSA) in the Siple Dome ice core, West Antarctica, Geophys. Res. Lett., 33, L11811, https://doi.org/10.1029/2005GL025629, 2006.
Severi, M., Becagli, S., Caiazzo, L., Ciardini, V., Colizza, E., Giardi, F., Mezgec, K., Scarchilli, C., Stenni, B., Thomas, E. R., Traversi, R., and Udisti, R.: Sea salt sodium record from Talos Dome (East Antarctica) as a potential proxy of the Antarctic past sea ice extent, Chemosphere, 177, 266–274, https://doi.org/10.1016/j.chemosphere.2017.03.025, 2017.
Sigl, M., McConnell, J. R., Toohey, M., Curran, M., Das, S. B., Edwards, R., Isaksson, E., Kawamura, K., Kipfstuhl, S., Krüger, K., Layman, L., Maselli, O. J., Motizuki, Y., Motoyama, H., Pasteris, D. R., and Severi, M.: Insights from Antarctica on volcanic forcing during the Common Era, Nat. Clim. Change, 4, 693–697, https://doi.org/10.1038/nclimate2293, 2014.
Sigl, M., Winstrup, M., McConnell, J. R., Welten, K. C., Plunkett, G., Ludlow, F., Büntgen, U., Caffee, M., Chellman, N., Dahl-Jensen, D., Fischer, H., Kipfstuhl, S., Kostick, C., Maselli, O. J., Mekhaldi, F., Mulvaney, R., Muscheler, R., Pasteris, D. R., Pilcher, J. R., Salzer, M., Schüpbach, S., Steffensen, J. P., Vinther, B. M., and Woodruff, T. E.: Timing and climate forcing of volcanic eruptions for the past 2,500 years, Nature, 523, 543–549, https://doi.org/10.1038/nature14565, 2015.
Sigl, M., Fudge, T. J., Winstrup, M., Cole-Dai, J., Ferris, D., McConnell, J. R., Taylor, K. C., Welten, K. C., Woodruff, T. E., Adolphi, F., Bisiaux, M., Brook, E. J., Buizert, C., Caffee, M. W., Dunbar, N. W., Edwards, R., Geng, L., Iverson, N., Koffman, B., Layman, L., Maselli, O. J., McGwire, K., Muscheler, R., Nishiizumi, K., Pasteris, D. R., Rhodes, R. H., and Sowers, T. A.: The WAIS Divide deep ice core WD2014 chronology – Part 2: Annual-layer counting (0–31 ka BP), Clim. Past, 12, 769–786, https://doi.org/10.5194/cp-12-769-2016, 2016.
Sneed, S. B., Mayewski, P. A., and Dixon, D. A.: An emerging technique: multi-ice-core multi-parameter correlations with Antarctic sea-ice extent, Ann. Glaciol., 52, 347–354, https://doi.org/10.3189/172756411795931822, 2011.
Stenni, B., Curran, M. A. J., Abram, N. J., Orsi, A., Goursaud, S., Masson-Delmotte, V., Neukom, R., Goosse, H., Divine, D., van Ommen, T., Steig, E. J., Dixon, D. A., Thomas, E. R., Bertler, N. A. N., Isaksson, E., Ekaykin, A., Werner, M., and Frezzotti, M.: Antarctic climate variability on regional and continental scales over the last 2000 years, Clim. Past, 13, 1609–1634, https://doi.org/10.5194/cp-13-1609-2017, 2017.
Suzuki, K., Yamanouchi, T., Kawamura, K., and Motoyama, H.: The spatial and seasonal distributions of air-transport origins to the Antarctic based on 5-day backward trajectory analysis, Polar Sci., 7, 205–213, https://doi.org/10.1016/j.polar.2013.08.001, 2013.
Tetzner, D. R., Thomas, E. R., Allen, C. S., and Piermattei, A.: Evidence of Recent Active Volcanism in the Balleny Islands (Antarctica) From Ice Core Records, J. Geophys. Res.-Atmos., 126, e2021JD035095, https://doi.org/10.1029/2021JD035095, 2021.
Tetzner, D. R., Allen, C. S., and Thomas, E. R.: Regional variability of diatoms in ice cores from the Antarctic Peninsula and Ellsworth Land, Antarctica, The Cryosphere, 16, 779–798, https://doi.org/10.5194/tc-16-779-2022, 2022.
Thomas, E. R.: Antarctic regional snow accumulation composites over the past 1000 years – version 2, UK Polar Data Center [dataset], https://doi.org/10.5285/cc1d42de-dfe6-40aa-a1a6-d45cb2fc8293, 2017.
Thomas, E. R., Marshall, G. J., and McConnell, J. R.: A doubling in snow accumulation in the western Antarctic Peninsula since 1850, Geophys. Res. Lett., 35, L01706, https://doi.org/10.1029/2007GL032529, 2008.
Thomas, E. R., Dennis, P. F., Bracegirdle, T. J., and Franzke, C.: Ice core evidence for significant 100-year regional warming on the Antarctic Peninsula, Geophys. Res. Lett., 36, L20704, https://doi.org/10.1029/2009GL040104, 2009.
Thomas, E. R., van Wessem, J. M., Roberts, J., Isaksson, E., Schlosser, E., Fudge, T. J., Vallelonga, P., Medley, B., Lenaerts, J., Bertler, N., van den Broeke, M. R., Dixon, D. A., Frezzotti, M., Stenni, B., Curran, M., and Ekaykin, A. A.: Regional Antarctic snow accumulation over the past 1000 years, Clim. Past, 13, 1491–1513, https://doi.org/10.5194/cp-13-1491-2017, 2017.
Thomas, E. R., Allen, C. S., Etourneau, J., King, A. C. F., Severi, M., Winton, V. H. L., Mueller, J., Crosta, X., and Peck, V. L.: Antarctic Sea Ice Proxies from Marine and Ice Core Archives Suitable for Reconstructing Sea Ice over the Past 2000 Years, Geosciences, 9, 506, https://doi.org/10.3390/geosciences9120506, 2019.
Thomas, E. R., Vladimirova, D., and Tetzner, D. R.: CLIVASH2k Antarctic ice core chemistry database (Version 1.0), UK Polar Data Center [dataset], https://doi.org/10.5285/9E0ED16E-F2AB-4372-8DF3-FDE7E388C9A7, 2022.
Tierney, J. E., Abram, N. J., Anchukaitis, K. J., Evans, M. N., Giry, C., Kilbourne, K. H., Saenger, C. P., Wu, H. C., and Zinke, J.: Tropical sea surface temperatures for the past four centuries reconstructed from coral archives, Paleoceanography, 30, 226–252, https://doi.org/10.1002/2014PA002717, 2015.
Turner, J., Comiso, J. C., Marshall, G. J., Lachlan-Cope, T. A., Bracegirdle, T., Maksym, T., Meredith, M. P., Wang, Z., and Orr, A.: Non-annular atmospheric circulation change induced by stratospheric ozone depletion and its role in the recent increase of Antarctic sea ice extent, Geophys. Res. Lett., 36, L08502, https://doi.org/10.1029/2009gl037524, 2009.
Turner, J., Lu, H., White, I., King, J. C., Phillips, T., Hosking, J. S., Bracegirdle, T. J., Marshall, G. J., Mulvaney, R., and Deb, P.: Absence of 21st century warming on Antarctic Peninsula consistent with natural variability, Nature, 535, 411–415, https://doi.org/10.1038/nature18645, 2016.
Turner, J., Holmes, C., Caton Harrison, T., Phillips, T., Jena, B., Reeves-Francois, T., Fogt, R., Thomas, E. R., and Bajish, C. C.: Record Low Antarctic Sea Ice Cover in February 2022, Geophys. Res. Lett., 49, e2022GL098904, https://doi.org/10.1029/2022GL098904, 2022.
WAIS_Divide_Project_Members.: Onset of deglacial warming in West Antarctica driven by local orbital forcing, Nature, 500, 440–444, https://doi.org/10.1038/nature12376, 2013.
Winski, D. A., Osterberg, E. C., Kreutz, K. J., Ferris, D. G., Cole-Dai, J., Thundercloud, Z., Huang, J., Alexander, B., Jaeglé, L., Kennedy, J. A., Larrick, C., Kahle, E. C., Steig, E. J., and Jones, T. R.: Seasonally Resolved Holocene Sea Ice Variability Inferred From South Pole Ice Core Chemistry, Geophys. Res. Lett., 48, e2020GL091602, https://doi.org/10.1029/2020GL091602, 2021.
Wolff, E. W.: Chemical signals of past climate and environment from polar ice cores and firn air, Chem. Soc. Rev., 41, 6247–6258, https://doi.org/10.1039/C2CS35227C, 2012.
Wolff, E. W., Fischer, H., Fundel, F., Ruth, U., Twarloh, B., Littot, G. C., Mulvaney, R., Rothlisberger, R., de Angelis, M., Boutron, C. F., Hansson, M., Jonsell, U., Hutterli, M. A., Lambert, F., Kaufmann, P., Stauffer, B., Stocker, T. F., Steffensen, J. P., Bigler, M., Siggaard-Andersen, M. L., Udisti, R., Becagli, S., Castellano, E., Severi, M., Wagenbach, D., Barbante, C., Gabrielli, P., and Gaspari, V.: Southern Ocean sea-ice extent, productivity and iron flux over the past eight glacial cycles, Nature, 440, 491–496, 2006.
Zwally, H. J., Comiso, J. C., Parkinson, C. L., Cavalieri, D. J., and Gloersen, P.: Variability of Antarctic sea ice 1979–1998, J. Geophys. Res.-Oceans, 107, 9-1–9-19, https://doi.org/10.1029/2000jc000733, 2002.