the Creative Commons Attribution 4.0 License.
the Creative Commons Attribution 4.0 License.
 | 08 Jun 2023
An extensive database of airborne trace gas and meteorological observations from the Alpha Jet Atmospheric eXperiment (AJAX)
Emma L. Yates
Susan S. Kulawik
Ju-Mee Ryoo
Josette E. Marrero
Caroline L. Parworth
Jason M. St. Clair
Thomas F. Hanisco
Thao Paul V. Bui
Cecilia S. Chang
Jonathan M. Dean-Day
The Alpha Jet Atmospheric eXperiment (AJAX) flew scientific flights between 2011 and 2018 providing measurements of trace gas species and meteorological parameters over California and Nevada, USA. This paper describes the observations made by the AJAX program over 229 flights and approximately 450 h of flying. AJAX was a multi-year, multi-objective, multi-instrument program with a variety of sampling strategies resulting in an extensive dataset of interest to a wide variety of users. Some of the more common flight objectives include satellite calibration/validation (GOSAT, OCO-2, TROPOMI) at Railroad Valley and other locations and long-term observations of free-tropospheric and boundary layer ozone allowing for studies of stratosphere-to-troposphere transport and long-range transport to the western United States. AJAX also performed topical studies such as sampling wildfire emissions, urban outflow and atmospheric rivers. Airborne measurements of carbon dioxide, methane, ozone, formaldehyde, water vapor, temperature, pressure and 3-D winds made by the AJAX program have been published at NASA's Airborne Science Data Center (https://asdc.larc.nasa.gov/project/AJAXTS9 (last access: 1 November 2022), https://doi.org/10.5067/ASDC/SUBORBITAL/AJAX/DATA001, Iraci et al., 2021a).
- Article
(6490 KB) - Full-text XML
- BibTeX
- EndNote


The Alpha Jet Atmospheric eXperiment (AJAX) was a flight measurement program designed to provide year-round observations to support satellite data validation and document the atmospheric composition of a coastal region in close proximity to urban and agricultural areas. The ongoing nature of the program was ideal for studies of changes in both the atmosphere and the remote sensing instruments in service during the period 2011 to 2018. The AJAX program was the result of a public–private partnership between NASA Ames Research Center (NASA ARC) and H211 LLC, which owns the Alpha Jet, a tactical military aircraft modified for scientific observations (see Fig. 1, left). This partnership provided the opportunity to acquire measurements of trace gas species and meteorological parameters over California and Nevada, USA, producing a unique multi-year, multi-objective, multi-instrument airborne dataset, with 229 flights and ∼ 450 flight hours. The distribution of AJAX flights by common flight sampling locations and by year and season is shown in Fig. 1b and c.
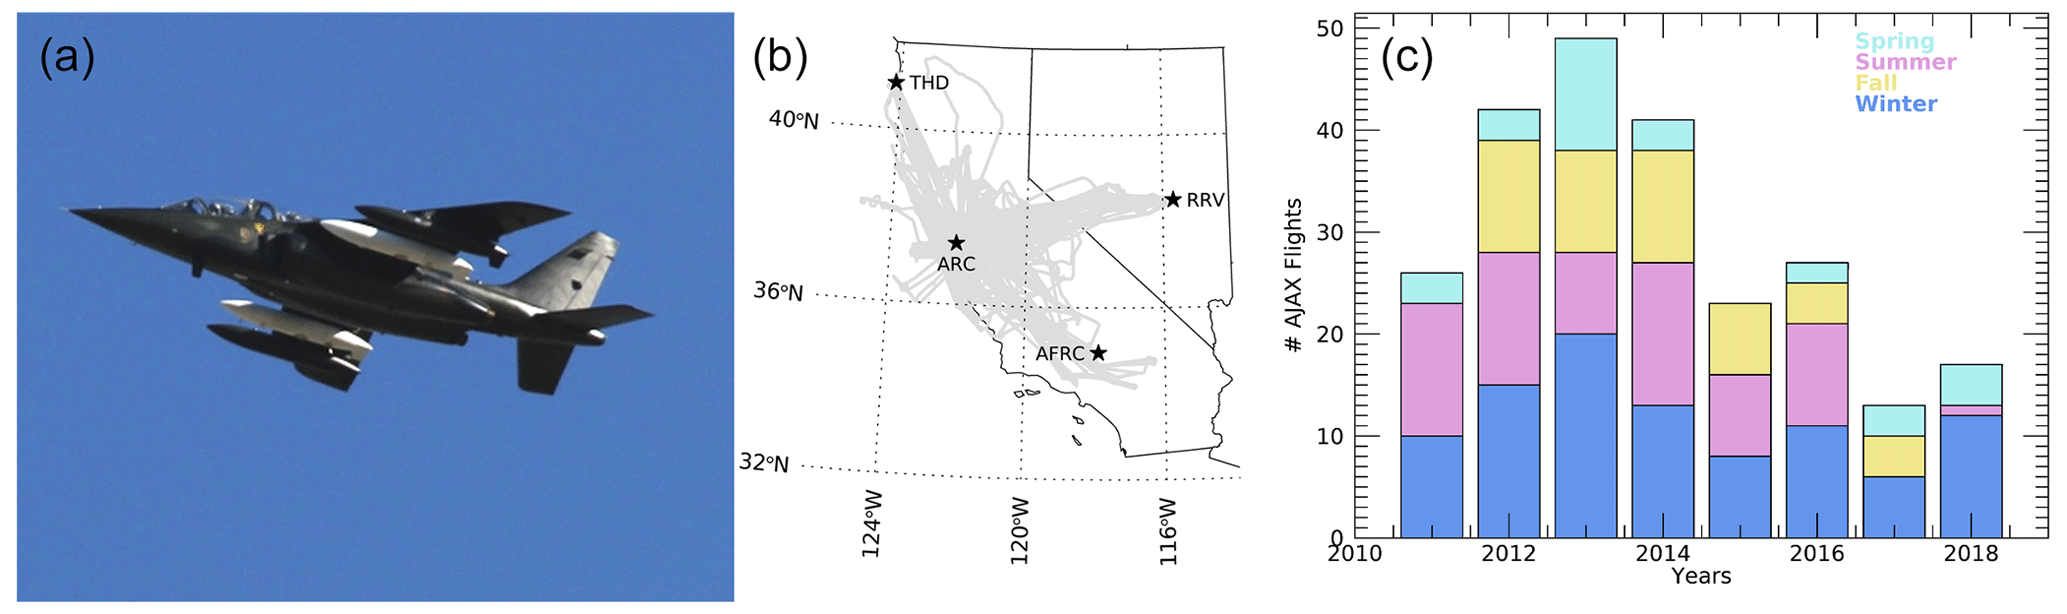
Figure 1AJAX in flight, before landing at Ames Research Center (ARC), located at Moffett Field, CA (a), map of AJAX flight tracks (b), and AJAX flights by year and season (c) (AFRC is Armstrong Flight Research Center, RRV is Railroad Valley, and THD is Trinidad Head).
The AJAX program flew on average two to three science flights a month, as determined by aircraft availability and weather conditions. Flight opportunities were typically arranged the week prior to a science flight, in which consideration of synoptic conditions, time of year and science objectives determined desired flight objectives and target locations. This flexibility and rapid turnaround meant that the AJAX program could respond to short-lived regional scientific opportunities, such as sampling emissions from wildfires or atmospheric rivers. This flexibility also allowed for the participation in, and collaboration with, more traditional field campaigns (e.g., CABOTS, Faloona et al., 2020; LVOS, Langford et al., 2015; DISCOVER-AQ-CA, Johnson et al., 2014; SEAC4RS, Toon et al., 2016). Table 1 lists some of the more common AJAX flight objectives, definitions and number of flights associated with each objective; note that many AJAX flights accomplished multiple objectives in a single flight.
Table 1Definition and description of common AJAX flight objectives and count of flights that contain each objective. Note that many AJAX flights accomplished multiple objectives in a single flight.
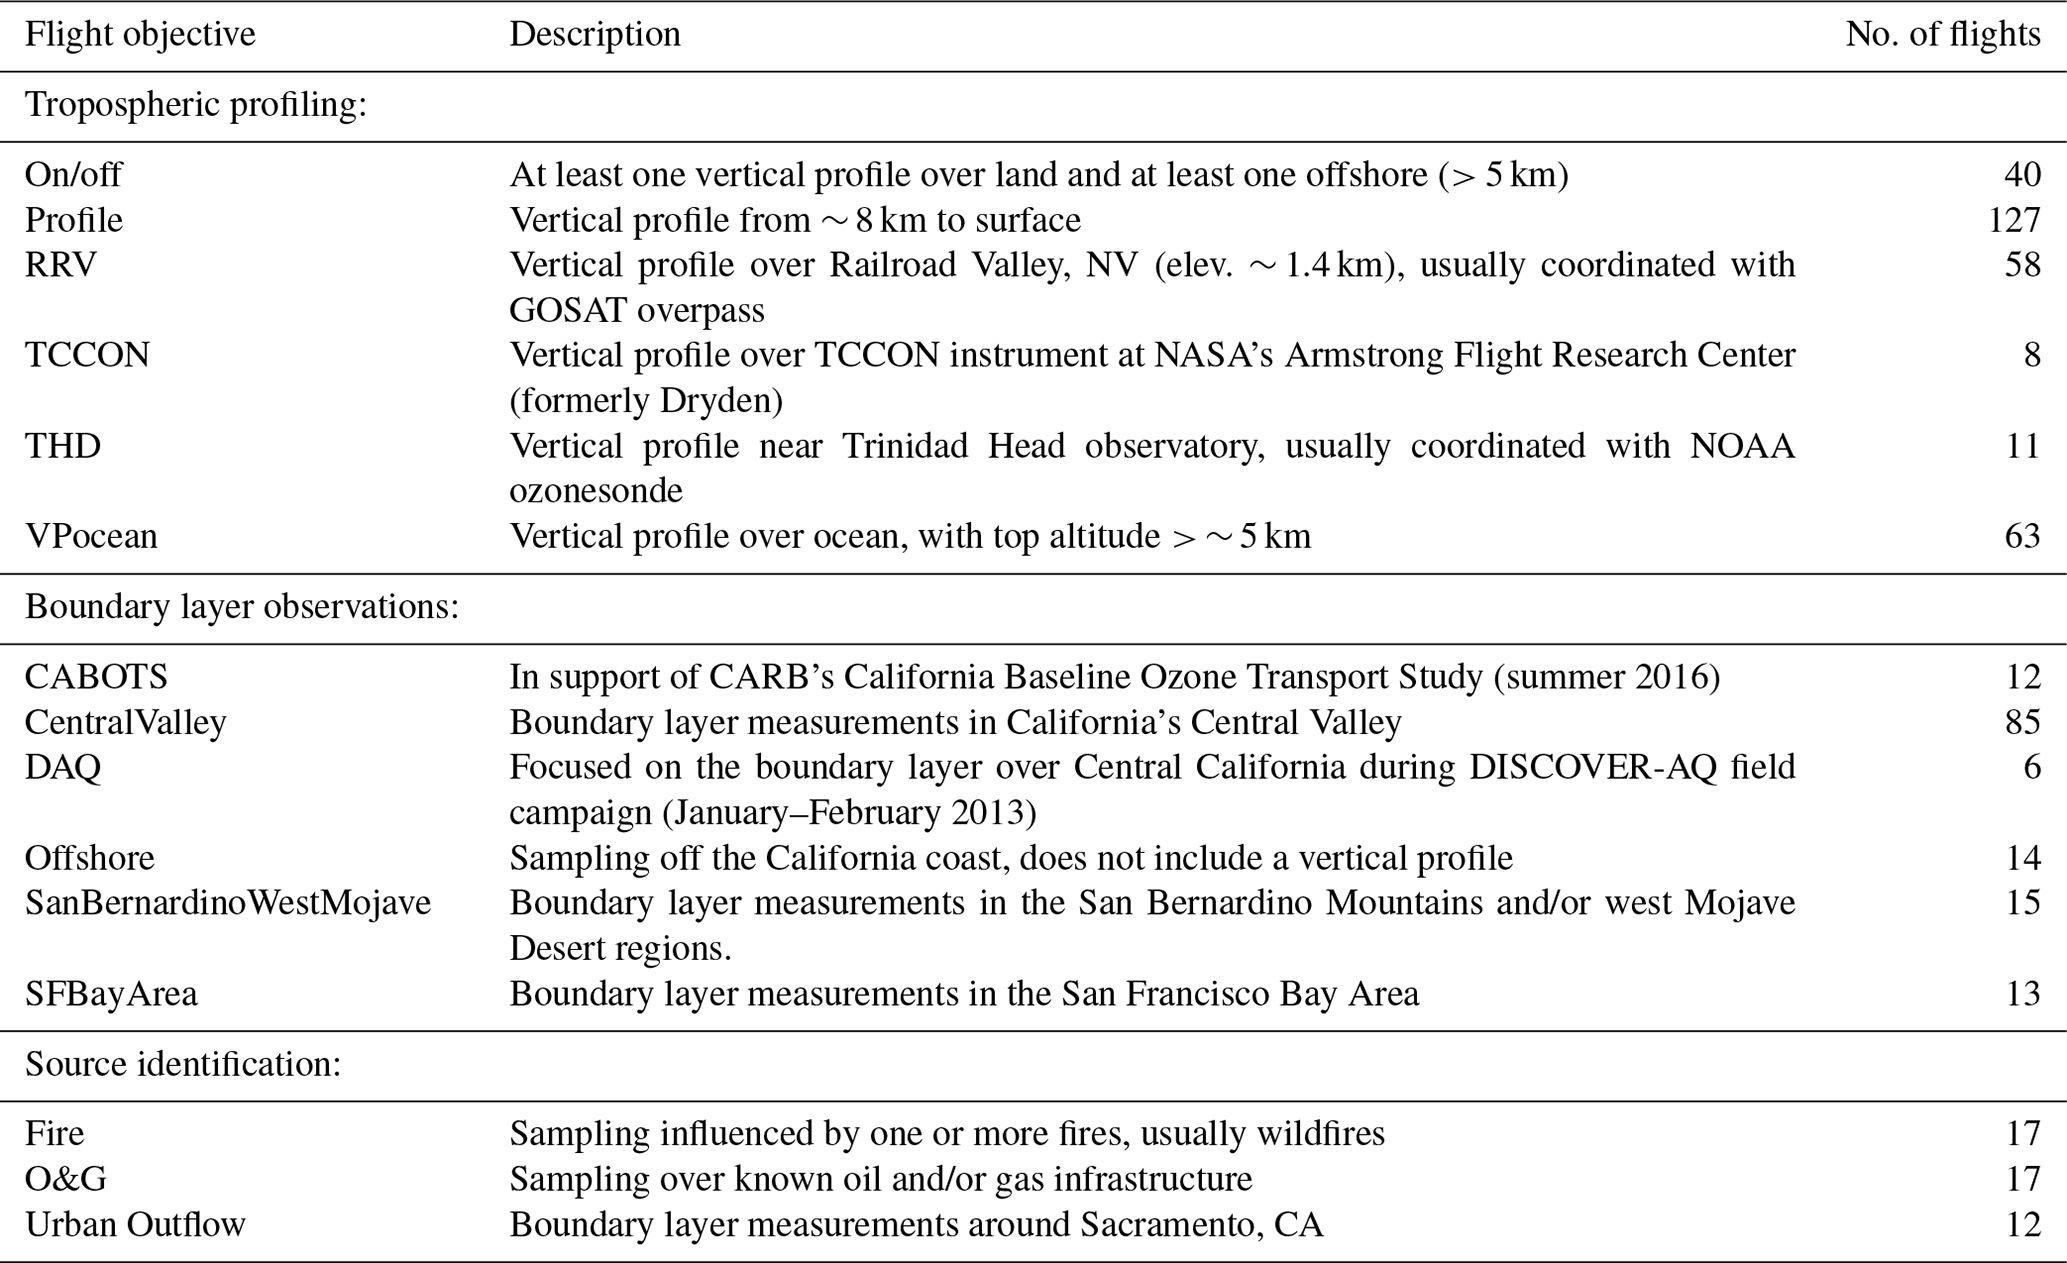
Given the wide variety of flight objectives shown in Table 1, AJAX data have been used to investigate a variety of science questions including the following.
- i.
Satellite validation. AJAX regularly sampled vertical profiles of the atmosphere from ∼ 8 km to the lowest safe altitude within the boundary layer (1000 ft (∼ 300 m) in congested (urban) areas and 500 ft (∼ 150 m) over sparsely populated regions; FAR, 2023). For example, the regularly used satellite validation site, Railroad Valley (RRV), NV, is a common AJAX flight target location. The AJAX program has a long record of vertical profile observations of CO2 and CH4 in conjunction with satellite overpasses and has been used as comparison data for GOSAT (Tanaka et al., 2016), GOSAT-2 and OCO-2 (Kulawik et al., 2017). In addition, AJAX flights also performed vertical profiles of ozone and formaldehyde under TROPOMI, and these data are still to be fully analyzed (Parworth et al., 2018).
- ii.
Free-tropospheric ozone. Free-tropospheric ozone trends over the western US have been an active area of research for many years. Data provided by flights from the AJAX program have proved to be a useful asset in assessing ozone trends and identifying extreme events, such as stratosphere-to-troposphere transport and long-range transport of pollution (e.g., Faloona et al., 2020; Fine et al., 2015; Langford et al., 2018; Ryoo et al., 2017; Yates et al., 2013). The long-term, sustained observational approach adopted by the AJAX program is of value in assessing changes in free-tropospheric ozone trends (Chang et al., 2023; Lin et al., 2015).
- iii.
Fires. AJAX has sampled a total of 14 wildfires over 17 different flights, with some fires sampled more than once (Iraci et al., 2021b). Iraci et al. (2022) provide an overview of wildfire emissions sampled by AJAX. In addition, there have been focused analyses of emissions from California's Rim wildfire during 2013 and Soberanes fire during 2016 as reported by Baker et al. (2018), Yates et al. (2016), and Langford et al. (2020).
- iv.
Urban and point source emissions. The Alpha Jet's fast cruising speeds can be useful in reducing uncertainties due to the evolution of the boundary layer during flight sampling. AJAX can essentially take a “snapshot” of the boundary layer and has been used to assess outflow of CO2 and CH4 emissions from urban centers (Ryoo et al., 2019) and emission point sources (Hamill et al., 2016; Leifer et al., 2018; Tadić et al., 2017), as well as the transport of emissions (Leifer et al., 2020).
- v.
Atmospheric rivers. The flexibility of the AJAX program was an advantage to provide a rapid response to measure the early phase of atmospheric river events as demonstrated by Ryoo et al. (2020). AJAX examined terrain-trapped airflows during an atmospheric river event which impacted northern California in March 2016, providing spatially resolved 3-D wind observations along a portion of the coastline where wind profiler data did not exist.
- vi.
Central Valley. AJAX collaborated with NASA's DISCOVER-AQ-CA field campaign in 2013 to sample the boundary layer in California's San Joaquin Valley, a region with some of the most severe ozone and PM2.5 pollution in the U.S. AJAX ozone, CO2 and CH4 data have been used for observational and model studies of air quality and greenhouse gas emissions in this region (e.g., Faloona et al., 2020; Cui et al., 2019; Johnson et al., 2014, 2016; Yates et al., 2015), as well as the impacts on surrounding, rural areas (Yates et al., 2020).
This paper provides a detailed overview of the AJAX program and its data products. We present a summary of the range of flight objectives, sampling strategies, airborne instrumentation and data processing to produce AJAX trace gas and meteorological data products. An overview of the AJAX dataset is presented, including discussions on long-term trends and greenhouse gas correlations and a case study highlighting the use of AJAX data in support of satellite validation of the lowermost-tropospheric products from OCO-2 and GOSAT.
The Alpha Jet has four external wing pods; the two outboard pods on each wing contain fuel, and the two-inboard pods (painted white in Fig. 1) are redesigned fuel tanks which can house scientific instruments, as shown in Fig. 5. The instrument wing pods can each carry a payload of 245 kg within 0.15 m3 of available space, and modifications in the rear cockpit allow for electrical (on/off) control of the instrument payload. A NASA Airworthiness Statement was issued following thorough Airworthiness and Flight Safety Reviews of the scientific instrumentation and planned operations. During all science flights the Alpha Jet operated as a public-use aircraft under a flight release issued by NASA Ames Research Center.
The AJAX payload was developed incrementally. AJAX flew its first science flight in January 2011 with an ozone (O3) monitor. In June 2011 a greenhouse gas monitor was added, measuring carbon dioxide (CO2), methane (CH4) and water vapor (H2O). In June 2013, the Meteorological Measurement System (MMS) was added to measure 3-D winds, temperature and pressure, and lastly the addition of the COmpact Formaldehyde FluorescencE Experiment (COFFEE) was completed in December 2015.
The Alpha Jet flies at speeds between 75–230 m s−1 with a ceiling height of 12 km; however, science flights were typically flown at speeds of ∼ 140 m s−1 (∼ 500 km h−1) up to an altitude of 8 km (limited by the decreasing performance of the greenhouse gas instrument at higher altitudes).
2.1 Ozone monitor
AJAX observes O3 mixing ratios using a commercial, UV-absorption-based O3 monitor (2B Technologies Inc., model 205, S/N 734), modified for flight worthiness and improved performance. Details of the instrument have been reported by Yates et al. (2013). Modifications of the O3 monitor include an upgrade of the pressure sensor and pump to allow measurements at high altitudes (low pressures); the inclusion of a lamp heater to improve the stability of the UV source; and the addition of heaters, temperature controllers and vibration isolators to control the monitor's physical environment. The air intake is through Teflon tubing (perfluoroalkoxy polymer, PFA) with a backward-facing inlet positioned on the underside of the instrument wing pod. Air is delivered through a 5 µm PTFE (polytetrafluoroethylene) membrane filter to remove fine particles prior to analysis.
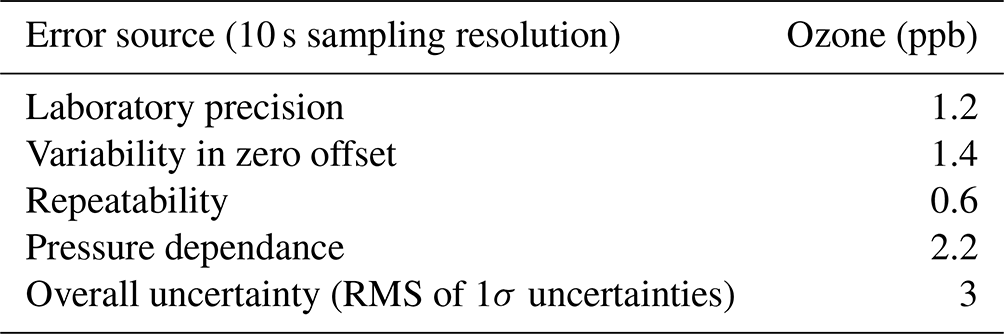
The O3 monitor has undergone thorough instrument testing in the laboratory and in a pressure- and temperature-controlled environment to determine the precision, linearity and overall uncertainty. Eight-point calibration tests (ranging from 0–300 ppbv) were performed before and/or after most AJAX flights using an O3 calibration source (2B Technologies, model 306, S/N 045, referenced to the World Meteorological Organization (WMO) scale). The uncertainty of AJAX O3 measurements is estimated from the sum in quadrature of the laboratory precision (1σ over 3 min at 10 s sampling resolution), variability in laboratory calibrations (the differences observed in the calculated zero offset when sampling the ozone source set to 0 ppb), repeatability (maximum difference in ozone observed from three calibrations on the same day) and pressure dependance (the change in ozone observed with pressure changes while sampling 50 ppb ozone in environmental chamber tests). The overall uncertainty of the airborne AJAX O3 data is estimated to be ∼ 3.0 ppbv, based on laboratory and chamber testing; a breakdown of the uncertainty terms is shown in Table 2.
AJAX performed regular flights to Trinidad Head (THD) in conjunction with ozonesonde launches for comparison and validation of AJAX O3 data and to the Table Mountain Facility (TMF) for comparison with the TMF tropospheric ozone lidar (TMTOL) and TMF ozonesonde. Figure 6 shows an example of coincident ozone profiles taken over TMF on 24 May 2013 by AJAX, TMTOL and TMF ozonesonde. Comparisons show very good agreement between the airborne, TMTOL and TMF ozonesonde measurements, well within measurement uncertainties, despite spatial and temporal differences in data sampling.
To provide quality-controlled O3 data, we applied standard processing to the raw data as follows:
-
removal of data points outside of a predefined operational limit: if the reported flow rate through the sample cell fell below 1 L min−1, those data points were removed from the dataset;
-
removal of outliers in the data due to instrument instability: if is greater than the 1σ standard deviation of the entire O3 data, those data points (O3(i) and O3(i+1)) were removed from the dataset;
-
calibration based on the linearity and zero-offset factors calculated from the closest calibration to the flight (typically ±1 d);
-
averaging of O3 data from 2 s resolution to report at 10 s resolution, improving precision and the overall quality of the finalized dataset.
2.2 Greenhouse gas sensor
AJAX provides in situ measurements of CO2 and CH4 using a commercial, cavity ring-down spectroscopy (CRDS) sensor (Picarro Inc. G2301-m, S/N 634-CFDDS2120) which has been modified for flight. Details of the sensor have been reported elsewhere (Tadíc et al., 2014; Tanaka et al., 2016). Briefly, the AJAX GHG (greenhouse gas) sensor has been re-packaged into two separate enclosures (analyzer and electronics) to fit within the wing pod. Additional modifications to the original sensor for flight readiness included fans for thermal management, an additional filter on the inlet and vibration isolators. The GHG sensor is powered on ∼ 1 h prior to flight take-off in a pre-flight routine that ensures the laser temperature reaches its operational temperature of 45 ∘C and commences measurements early into each science flight.
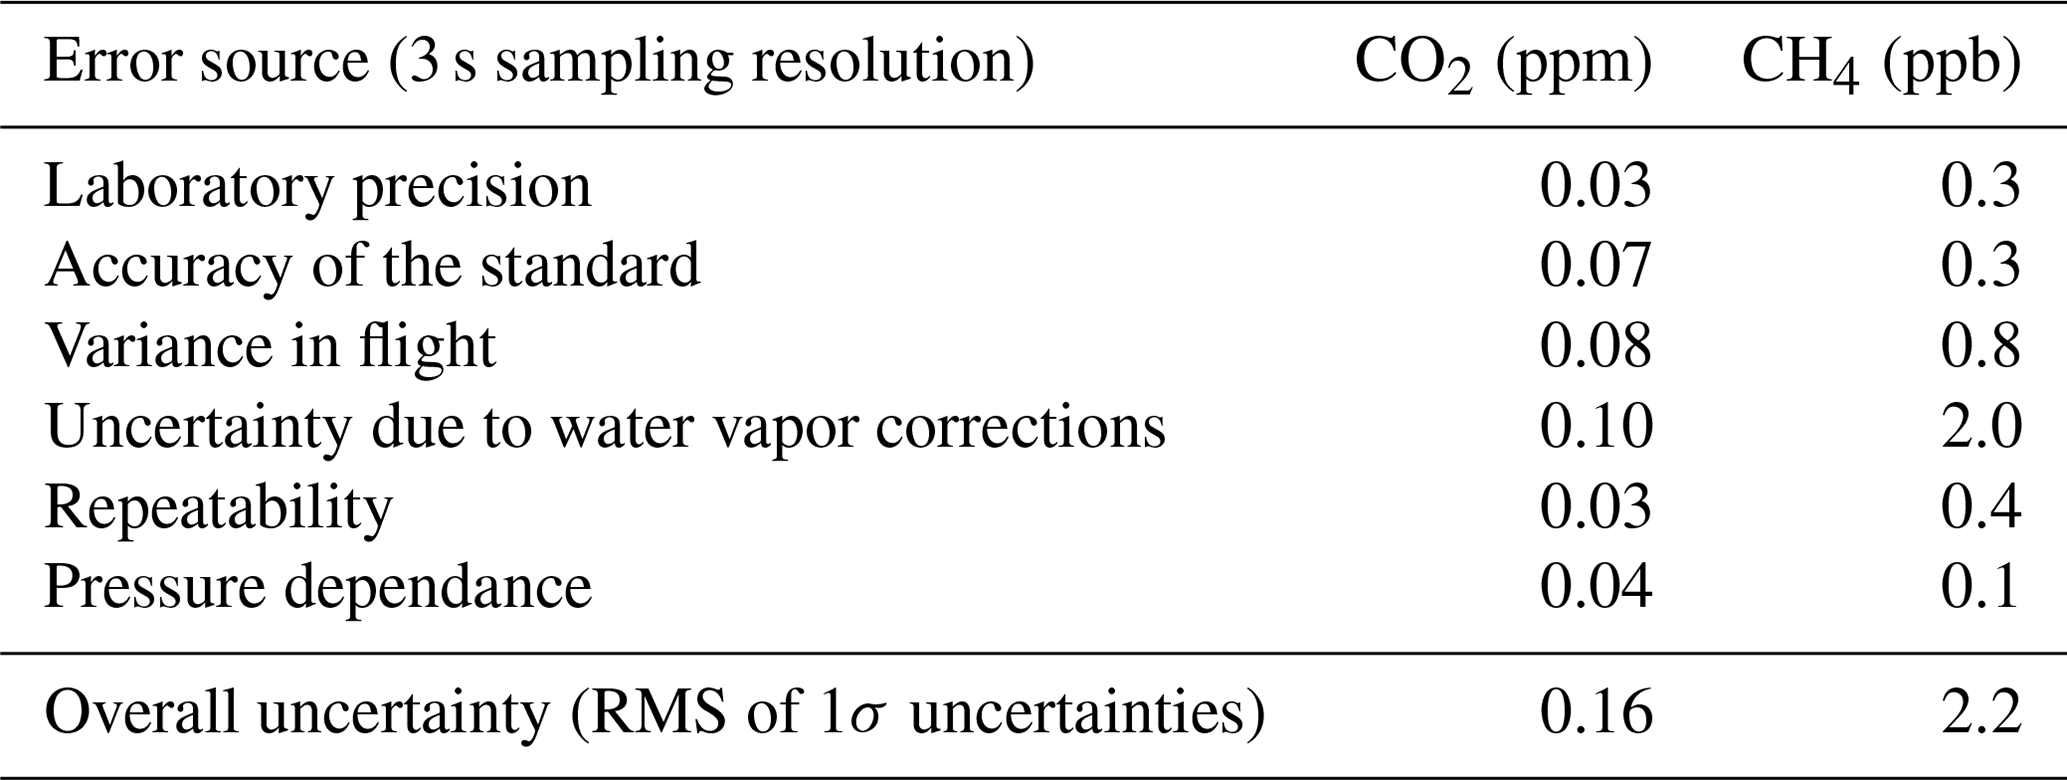
The GHG sensor has undergone thorough laboratory and environmental chamber testing to evaluate its precision, linearity and overall accuracy under a variety of operating conditions. Calibrations are performed before and/or after most AJAX flights using NOAA Earth System Research Laboratories (ERSL) whole-air standards certified by the WMO Central Calibration Laboratory for CO2 and CH4. The overall uncertainty of aircraft measurements was estimated considering the precision (1σ), repeatability of calibrations, in-flight variance due to cavity pressure fluctuations, uncertainty in water vapor corrections and pressure dependence of measurements based on environmental chamber studies.
AJAX CO2 and CH4 measurements were subjected to the following quality control procedures to generate the finalized GHG dataset:
-
removal of instrument lag time (5 s), calculated given the length of the inlet tubing and measured flow rate;
-
removal of outliers in the data due to in-flight instability of the optical cavity pressure: data points where the cavity pressure deviated by more than 0.2 % were removed from the dataset;
-
removal of data points outside of operational temperature limits: data points were removed when the cavity temperature was > 45.15 ∘C or < 44.95 ∘C;
-
water vapor corrections: AJAX applies the water vapor corrections described by Chen et al. (2010) using simultaneous water observations;
-
application of calibration based on the closest calibration to the flight (typically ±1 d);
-
averaging of GHG data from 3 Hz resolution to report at 3 s resolution, improving precision and the overall quality of the reported, finalized dataset.
Typical overall uncertainties for AJAX CO2 and CH4 are 0.16 ppmv and 2.2 ppbv respectively as shown in Table 3 and reported by Tanaka et al. (2016).
2.3 Formaldehyde instrument: COmpact Formaldehyde FluorescencE Experiment
AJAX collected in situ observations of formaldehyde (HCHO) using a custom-built instrument called COmpact Formaldehyde FluorescencE Experiment (COFFEE), which was designed specifically to join the AJAX payload. A detailed overview of COFFEE is presented by St. Clair et al. (2017), with updates to the optical design in St. Clair et al. (2019). Briefly, COFFEE utilizes non-resonant laser-induced fluorescence (NR-LIF) to measure formaldehyde, with 300 mW of 40 kHz 355 nm laser output exciting multiple formaldehyde absorption features and the resulting fluorescence measured by two photomultiplier tube detection axes. Fluorescence signal is collected for 500 ns, with 5 ns resolution, at each laser pulse and then averaged to 1 s. The 1 Hz fluorescence signal shape is processed post-flight to calculate formaldehyde mixing ratios.
Data collected prior to April 2018 (prior to the optical changes described in St. Clair et al., 2019) have a water dependence term in the measurement uncertainty that is not present in data collected afterward. Overall measurement uncertainty is ± (20 % of HCHO + 200 pptv + 230⋅ [H2O % by volume]) before April 2018 and ±(20 % of HCHO + 200 pptv) in April 2018 and after.
All final HCHO data pass multiple quality control steps, including the following:
-
All instrument engineering parameters (temperatures, pressures, etc.) are nominal.
-
Laser is fully warmed up, as indicated by the power monitor photodiode.
-
Final laboratory calibrations are applied.
2.4 Meteorological Measurement System (MMS)
AJAX reports calibrated, science-quality static pressure, static temperature and 3-D winds using the NASA-Ames-developed Meteorological Measurement System (MMS). MMS consists of three major systems: an air motion sensing system, an inertial navigation system and a data acquisition system. MMS has been deployed on multiple NASA aircraft and has been involved in numerous NASA field campaigns. A detailed overview of MMS instrumentation and basic concepts has been described by Scott et al. (1990).
The accuracy of MMS pressure, temperature and wind data was achieved through a combination of laboratory sensor calibrations and analysis of dedicated in-flight maneuvers. Lab calibrations include determination of inertial navigation system time delays by means of executing a series of fixed-axis rotations on a dedicated pendulum test platform. The custom-designed apparatus allows recording angular position in addition to attitude, position, velocity and acceleration data from the inertial navigation unit (INU). This information was combined with in-flight maneuvers that included a series of pitches, yaws and a box pattern featuring a roll/unroll sequence after every 90∘ of heading angle rotation. Adjustments were made to attack and yaw angle measurements to account for rotation of the radome orifices with respect to the aircraft reference frame, which would shift slightly as the wing pod (where MMS instrumentation was integrated) was removed and reinstalled for maintenance purposes. Local calibration constants were determined by eliminating aircraft motion artifacts from pressure, temperature and wind measurements. However, since the Alpha Jet operated within a broad regime of aerodynamic conditions (e.g., Mach number and angle of attack), further statistical analysis was applied to individual calibration results to generate a map of sensor corrections applicable to the entire flight envelope. Calibrations were updated on a periodic basis as time allowed for dedicated MMS maneuver flights, which were intentionally flown in relatively calm air to avoid contamination by atmospheric motions (i.e., waves and turbulence). During these flights, a series of MMS maneuvers was often repeated at a series of altitudes and aircraft velocities, permitting efficient reanalysis and update of MMS calibration statistics.
The primary products of MMS are pressure (precision of ±0.3 hPa with accuracy of 0.5 %), temperature (±0.3 K, 0.2 %), horizontal wind (±1 m s−1, ∼ 3.3 %) and vertical wind (±0.3 m s−1). The derived parameters are potential temperature, true air speed, turbulence dissipation rate and Reynolds number. MMS reporting parameters are GPS positions, velocities, accelerations, pitch, roll, yaw, heading, angle of attack, angle of sideslip, dynamic total pressure and total temperature.
AJAX flights were typically 2 h in duration, starting and ending at Moffett Field, CA (37.415∘ N, 122.050∘ W); take-off times were generally between 10:00 and 12:00 local time. Horizontally the measurements covered an area of 32 to 42∘ N and −125 to −115∘ W (Fig. 1b). Flight patterns varied considerably depending on the flight objective (see Table 1), which was determined ∼ 1 week prior to the flight date, based on weather, science and aircraft availability. Some of the more common AJAX flight patterns are discussed below.
3.1 Tropospheric profiling
AJAX has a long-term record of designing and executing science flights to perform tropospheric profiling, often coincident with satellite overpasses, a Total Carbon Column Observing Network (TCCON) site or ozonesonde launches from Trinidad Head, CA (THD). The sustained, long-term approach by AJAX allows for validation of remotely sensed data products during the evolution of the instrument and/or mission lifetime, providing a unique dataset and a powerful asset for continued data evaluation. In total, vertical profiles of trace gases (≥ 8 km to boundary layer) have been recorded 127 times in the AJAX data record, including 58 flights over RRV with the primary purpose of collecting CO2 and CH4 measurements for validation of GOSAT, GOSAT-2 and OCO-2 satellite data products (Tadić et al., 2014; Tanaka et al., 2016). In addition, AJAX flights targeting offshore vertical profiles coincident with OCO-2 provided data aiding the development of a lowermost-tropospheric CO2 partial column satellite product (Kulawik et al., 2017). AJAX has also collected trace gas vertical measurements coincident with TROPOMI and a TCCON site based at NASA Armstrong Flight Research Center (NASA AFRC), formerly known as Dryden Flight Research Center.
The sampling strategy for a tropospheric profiling flight generally followed this pattern: ascent from Moffett Field reaching a cruise altitude of ∼ 8 km shortly after take-off for transit to a desired location, followed by a descending, spiraling profile with a descent rate of 10 m s−1 and horizontal diameter of < 9 km. The bottom of the profile can be at or below 50 m above ground level in accordance with Federal Aviation Regulation in sparsely populated areas (FAR, 2023). After completion of the vertical profile, AJAX typically ascended and returned to Moffett Field with the return transit leg at a lower altitude (e.g., 5 km) than the outbound transit leg. AJAX observations of CO2 and CH4 over RRV measured during descending profiles are presented in Fig. 2. Annual increases in CO2 and CH4 are observed over this long-term record, as discussed further in Sect. 4.
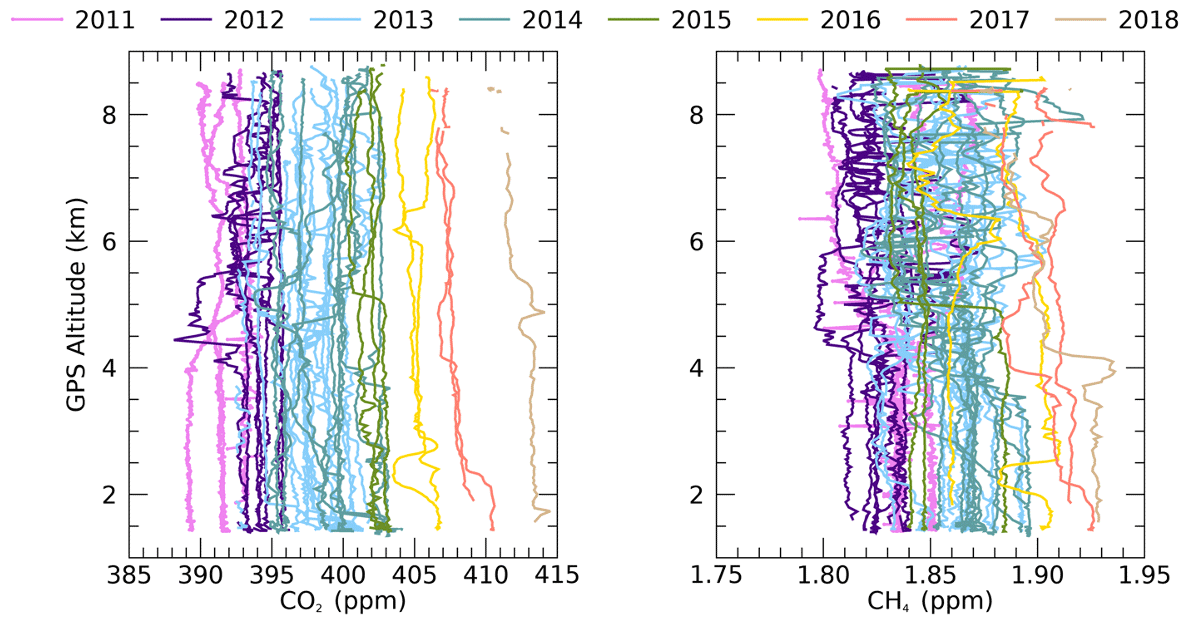
Figure 2AJAX observations of CO2 and CH4 over Railroad Valley, NV (surface elevation = 1437 m a.s.l.), colored by year of observation.
3.2 Boundary layer observations
AJAX has a record of regular, low-altitude flights observing the San Francisco Bay Area (SFBA), California's Central Valley (CCV) and offshore boundary layers. AJAX take-off and landing data provide a long-term record of the SFBA boundary layer, which has currently been underused. AJAX executed regular flights with the main objective to measure within the SFBA (13 flights), CCV (85 flights) and offshore (14 flights) boundary layers to better understand emission sources and transport.
The sampling strategy of boundary layer flights was typically the following: take-off from Moffett Field and transit towards the first desired location at an altitude left to pilots' discretion. On arrival at the first sampling location AJAX would descend to ≤ 300 m and from there would sample at altitudes ≤ 300 m through several designated locations within the study region before transiting and returning to Moffett Field, providing ∼ 1.5 h of boundary layer observations within a 2 h flight. An example AJAX flight focusing on boundary observations is shown in Fig. 3, which displays O3, CH4 and CO2 collected on 1 d of a mini-intensive coordinated campaign during a seasonal deployment of multiple EM27/SUN ground-based spectrometers across the San Francisco Bay Area of California (Klappenbach et al., 2021). The flight plan was devised to provide in situ greenhouse gas measurements near and above multiple column observations on sequential days in fall 2016.
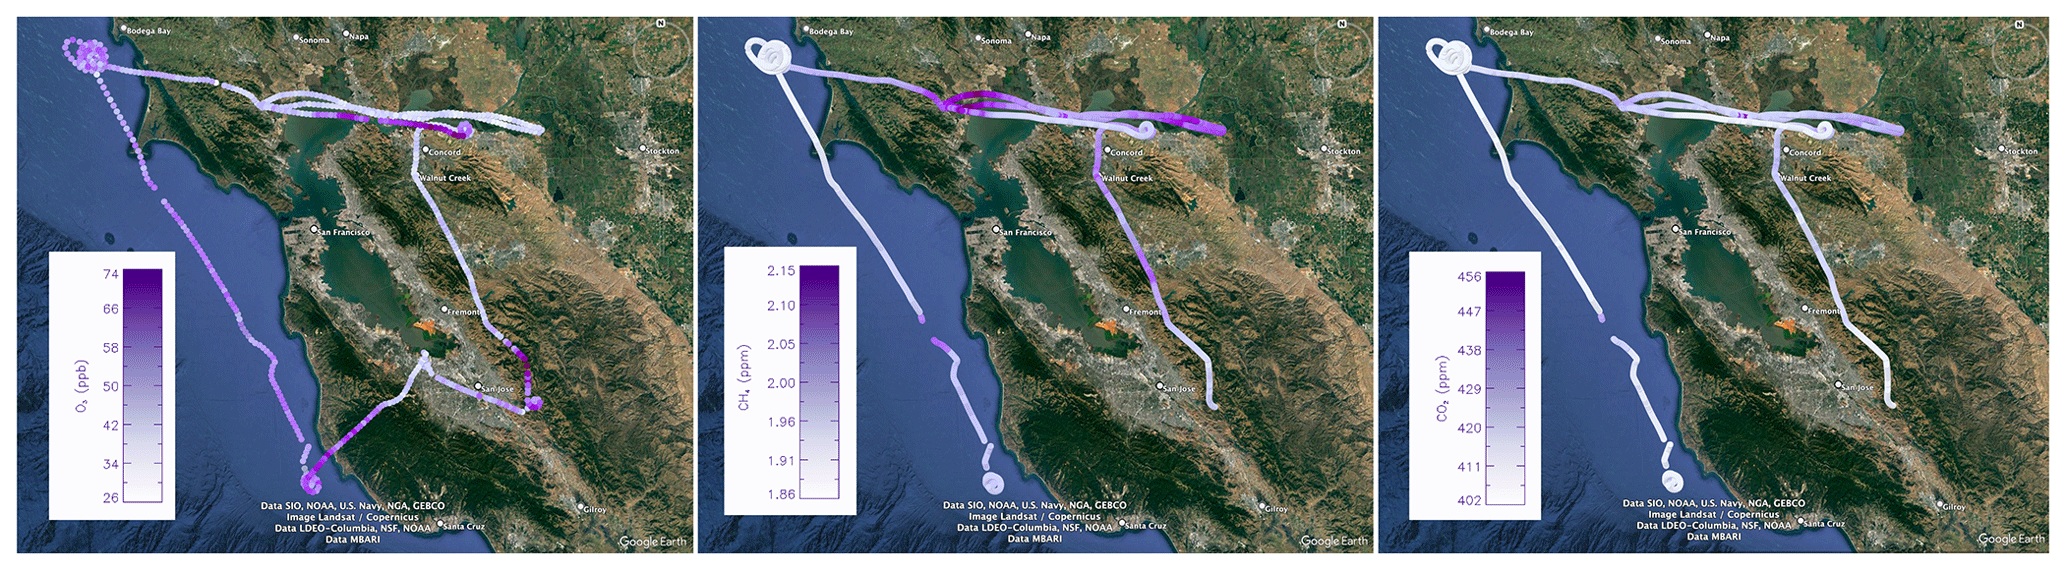
Figure 3AJAX flight no. 202 on 2 November 2016: observations offshore and over the San Francisco Bay Area of ozone (left), methane (middle) and CO2 (right) shown in the © Google™ Earth map. Note that warm-up and shut down of the GHG instrument causes a loss of data on take-off (for most flights) and landing (for some flights; the post-flight procedures were modified in 2017 to retain landing data in most flights after this date).
3.3 Source identification
AJAX had several flight objectives to sample and help quantify emissions sources, including wildfires (17 flights), emissions from urban centers (14 flights), and oil and gas infrastructure (17 flights). These flights required a sampling approach that firstly aims to obtain an upwind, clean-air sample before targeting observations from the emission source itself. A typical sampling strategy would be as follows: take-off from Moffett Field, ascend to a transit altitude (pilot discretion), and perform a vertical profile descending from ≤ ∼ 8 km to within the boundary layer that is upwind as close to the emission source as feasible. AJAX would then perform several circles or passes around the emission source within the boundary layer. Often several altitudes were flown, allowing for two to three circles around the source before ascending for the return transit (altitude at pilot's discretion) and landing at Moffett Field. An example source identification AJAX flight is shown in Fig. 4 from a flight over the Aliso Canyon, CA, natural gas leak in December 2015 (34.315∘ N, 118.564∘ W). The observed, uncorrelated CO2 and methane are due to differences in emission sources. High CO2 was observed downwind of Aliso Canyon and is associated with the transport of pollution from the LA basin, whereas extremely high methane values are observed in the vicinity of Aliso Canyon.
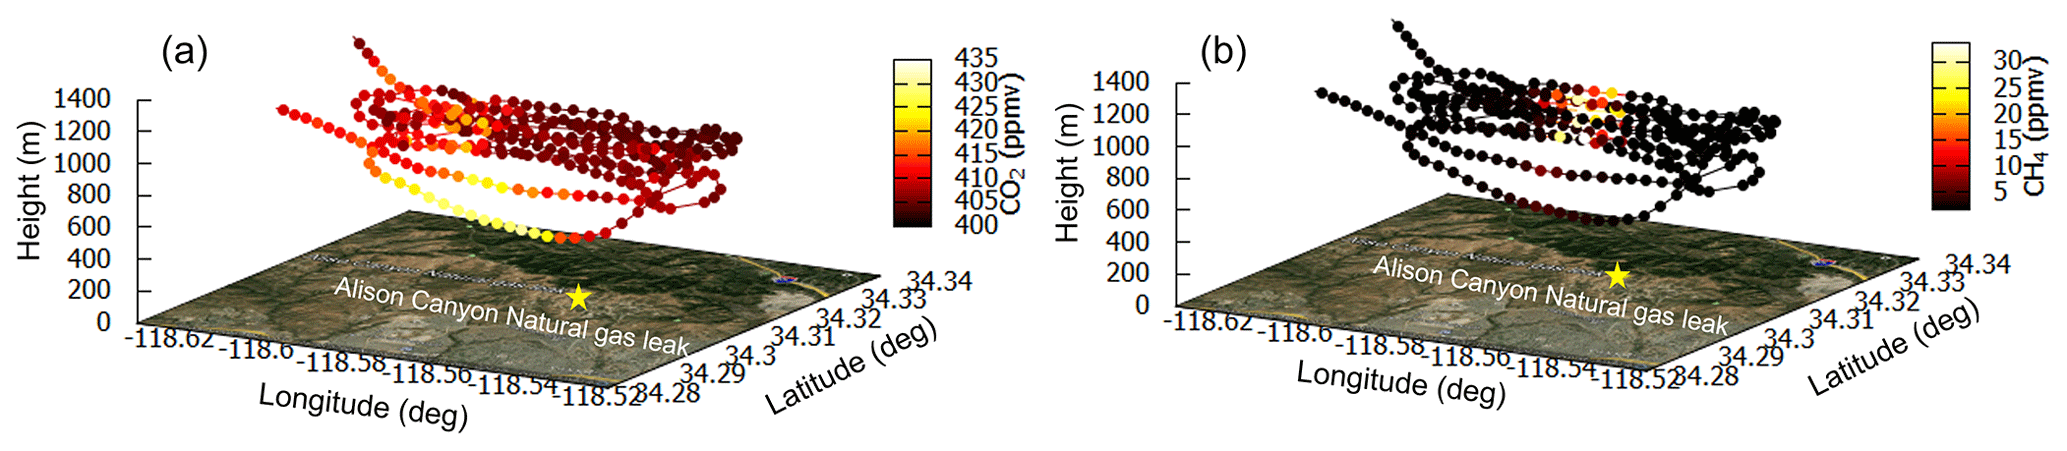
Figure 4AJAX flight no. 175 on 4 December 2015 sampling emissions from the Aliso Canyon gas leak shown in the © Google™ Earth map. Maps show carbon dioxide (CO2, a) and methane (CH4, b) over the emission source.
Given the wide variety of information contained in the AJAX dataset, here we present an overview of the dataset designed to highlight the data applications. This includes long-term trends observed by AJAX, an example of the changing boundary layer trace gas concentrations relevant to air quality studies and a case study highlighting the use of AJAX data in support of satellite validation of lowermost-tropospheric products from OCO-2 and GOSAT.
4.1 Long-term observations and trends
The multi-season, multi-year, multi-objective sampling approach adopted by the AJAX program allows for detailed analysis of a range of questions related to climate and air quality, as well as atmospheric trends. For example, Fig. 2 shows the increasing mixing ratios of CO2 and CH4 between 2011 and 2018 as observed at RRV, NV.
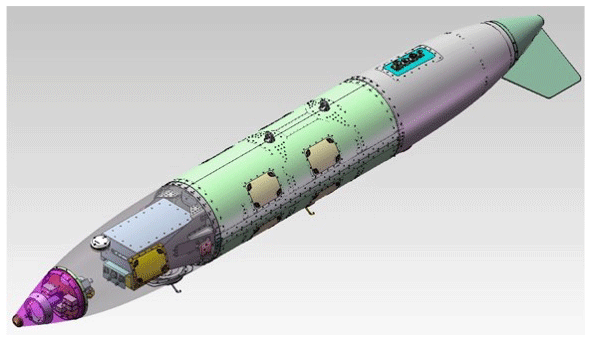
Figure 5CAD drawing of an AJAX wing pod showing the location of the ozone sensor and MMS in the nose-cone section of the wing pod. The greenhouse gas sensor is located in the middle (green) section, and its inlet can be seen below the pod. Signal and electrical connections to the aircraft are made at the top, aft panel (cyan).
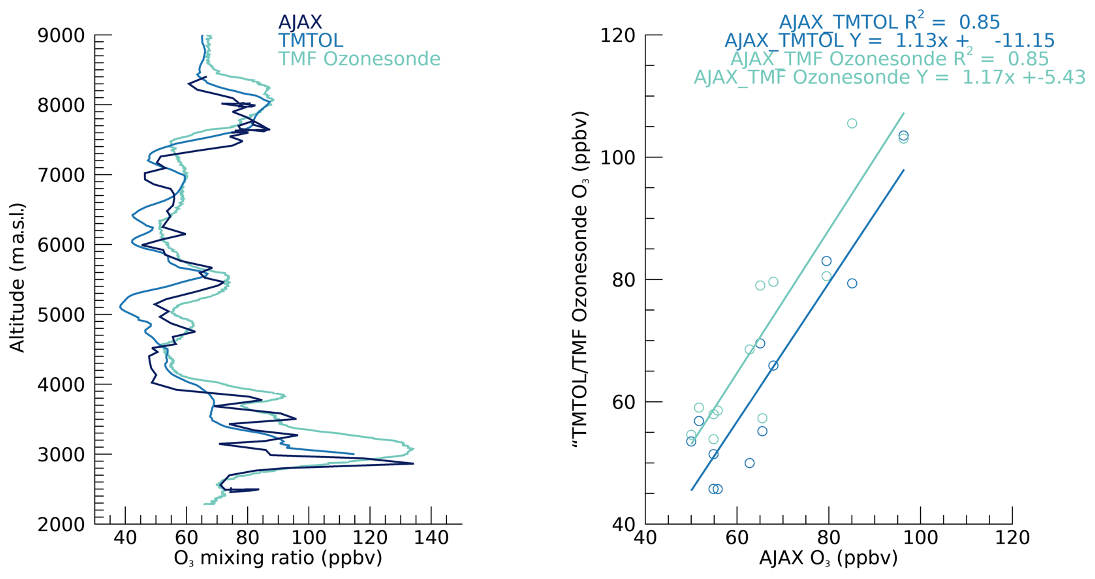
Figure 6Ozone profiles taken on 24 May 2013 measured by AJAX, Table Mountain Facility tropospheric ozone lidar (TMTOL) and the Table Mountain Facility (TMF) ozonesonde. Correlations of AJAX observations with TMF ozonesonde and TMTOL measurements are shown in the right panel, based on the mean ozone within 500 m vertical resolution window.
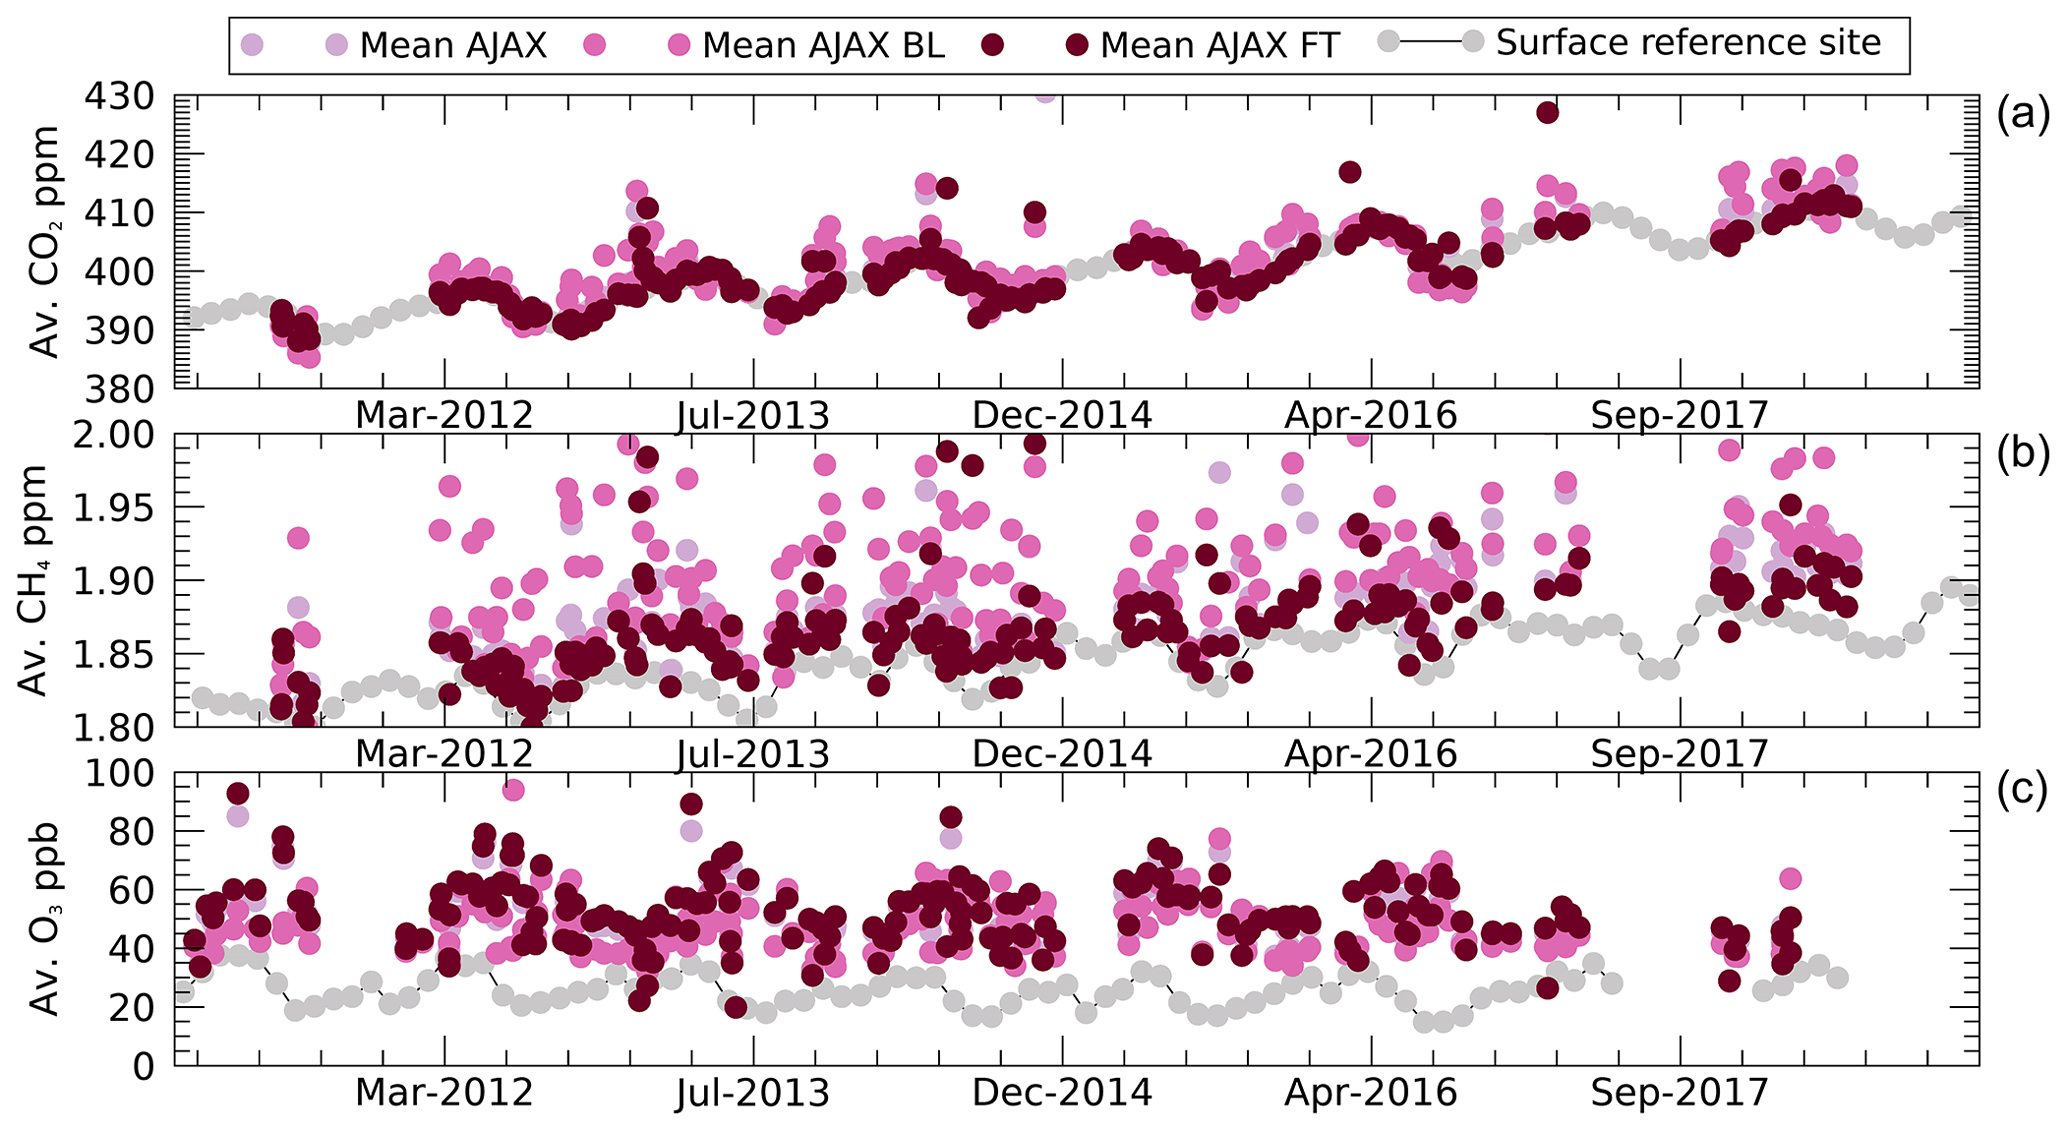
Figure 7Average CO2 (a), CH4 (b) and O3 (c) over the entirety of each individual AJAX flight, the average of data collected below 2 km from each individual flight and above 2 km. Monthly mean values from a surface reference site are shown for comparison: Mauna Loa for CO2 and CH4 and Trinidad Head for O3.
Figure 7 shows the average trace gas mixing ratios for CO2, CH4 and O3 over the entirety of each AJAX flight. The average of measurements within the boundary layer (BL, defined as < 2 km) and averages within the free troposphere (FT, defined as > 2 km) are also shown for each AJAX flight. Presented in gray are the monthly average mixing ratios from atmospheric baseline stations (Mauna Loa (MLO) for CO2 and CH4 (NOAA, 2022a) and Trinidad Head (THD) for O3 (NOAA, 2022b)). The mean AJAX observations of CO2 (Fig. 7a) are in such good agreement with the surface trends at MLO; they lie directly underneath the other plotted data making them difficult to observe in Fig. 7. AJAX FT CO2 agrees slightly better than AJAX BL CO2, which is influenced by local source emissions.
AJAX free-tropospheric observations of CH4 (Fig. 7b) track the general trends in the MLO data but are offset slightly (typically less than 50 ppb). The boundary layer observations of CH4 show the impact of emissions, with most flights observing large CH4 AJAX BL values relative to the FT.
O3, as a secondary pollutant, is impacted by a range of processing conditions (UV, temperature, etc.) and emissions sources. Thus, most AJAX BL O3 observations show larger and more variable values relative to those observed within the marine boundary layer at the THD surface site, likely indicating that AJAX BL observations are more representative of continental air masses. Detailed comparisons of AJAX to other vertically resolved ozone observations (ozonesondes and lidar) are presented in Langford et al. (2019) and Yates et al. (2017).
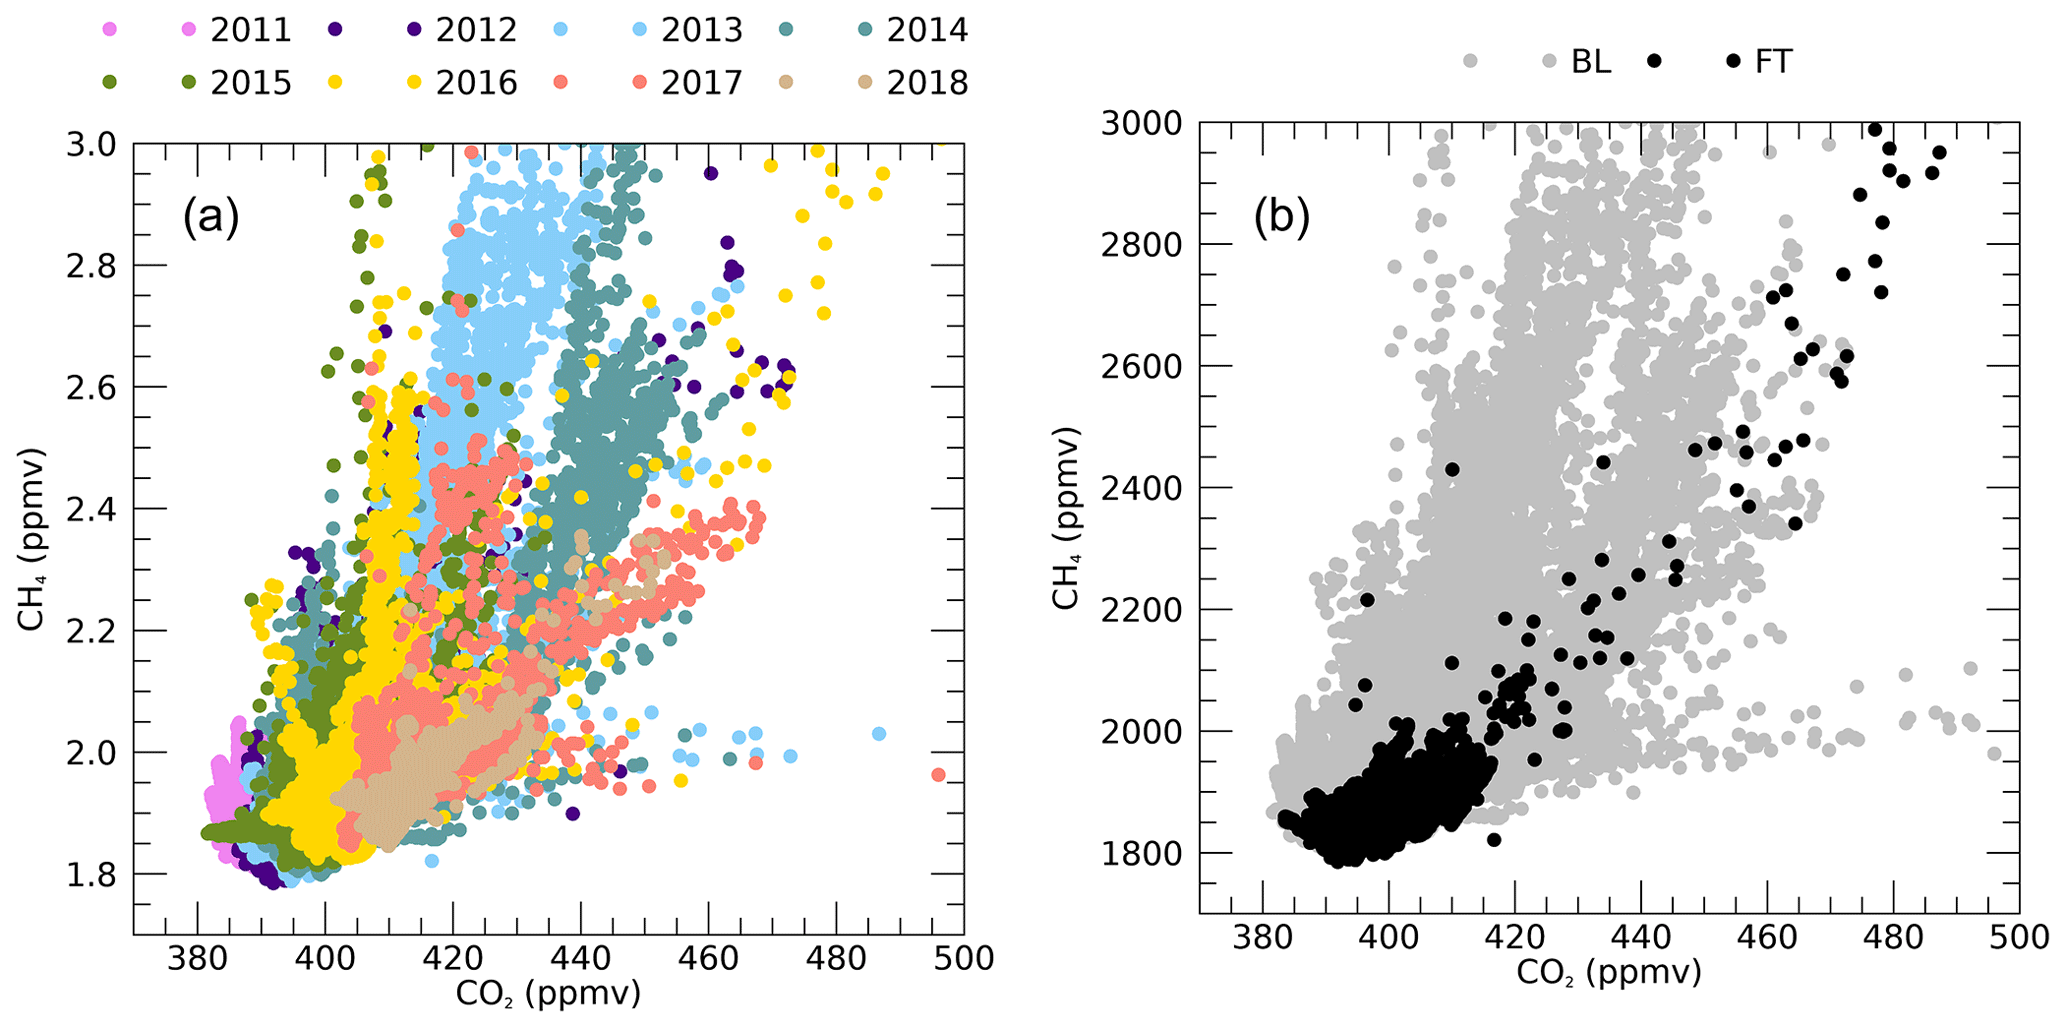
Figure 8Relationship between CH4 and CO2 measured by AJAX separated by year (a) and by free-tropospheric and/or boundary layer (FT > 3 km < BL) measurements (b).
Figure 8b shows the relationship between CH4 and CO2 measured by AJAX categorized by altitude, showing that observations in the FT (representative of the well-mixed atmosphere) are more closely correlated, while the relationship between CH4 and CO2 in the boundary layer is complex, with a wide variety of sources resulting in a large spread of correlations. But when these data are categorized by year (Fig. 8a), patterns can be seen, including the annual increase in CO2 and CH4. In 2011, CO2 was observed between a minimum of 382 ppmv and a maximum of 397 ppmv, and by 2018 this range was 401–453 ppmv. The average increase in the annual mean CO2 observed by AJAX was ∼ 3.0 ppm yr−1 between 2011 and 2018. This estimate is in line with global growth rates of CO2 reported by NOAA from observations at marine surface sites which averaged at 2.43 ppm yr−1 and varied between 1.90 and 3.03 ppm yr−1 over the same period (NOAA, 2022a). Likewise, the increase in CH4 between 2011 and 2018 corresponds to an increase in the mean annual CH4 of ∼ 10 ppbv yr−1, which also compares well with the annual global increase in CH4 reported by NOAA, which averaged at 7.69 ppb yr−1 and varied between 4.85 and 12.73 ppb yr−1 over the same period (NOAA, 2022b).
4.2 Observations of formaldehyde and ozone in a changing boundary layer
During the California Baseline Ozone Transport Study (CABOTS) campaign in spring and summer 2016 (Faloona et al., 2020), AJAX performed 12 flights (Iraci et al., 2020), several with multiple vertical profiles along a west-to-east transect as shown in Fig. 9. This flight track provided an opportunity to assess the changes in the photochemical state of the boundary layer over a relatively short spatial distance (∼ 250 km) between the western-most offshore profile and the eastern-most profile over Visalia (36.319∘ N, 119.393∘ W), in California's San Joaquin Valley (SJV). This helped to address one of the main aims of CABOTS, to observe the changes in O3 along the coast (upwind of California) and within California's Central Valley (Faloona et al., 2020). The SJV is the lowermost part of California's Central Valley and is an area that continues to exceed health-based air quality standards for hazardous air pollutants, including O3, PM2.5 and PM10. The ability of AJAX to observe multiple trace gas species complemented the additional CABOTS measurement suite, including ozonesondes and ozone lidar. For example, HCHO is the third-most abundant oxygenated volatile organic compound in the SJV (Liu et al., 2022), and it undergoes complex photochemical reactions resulting in the production of O3.
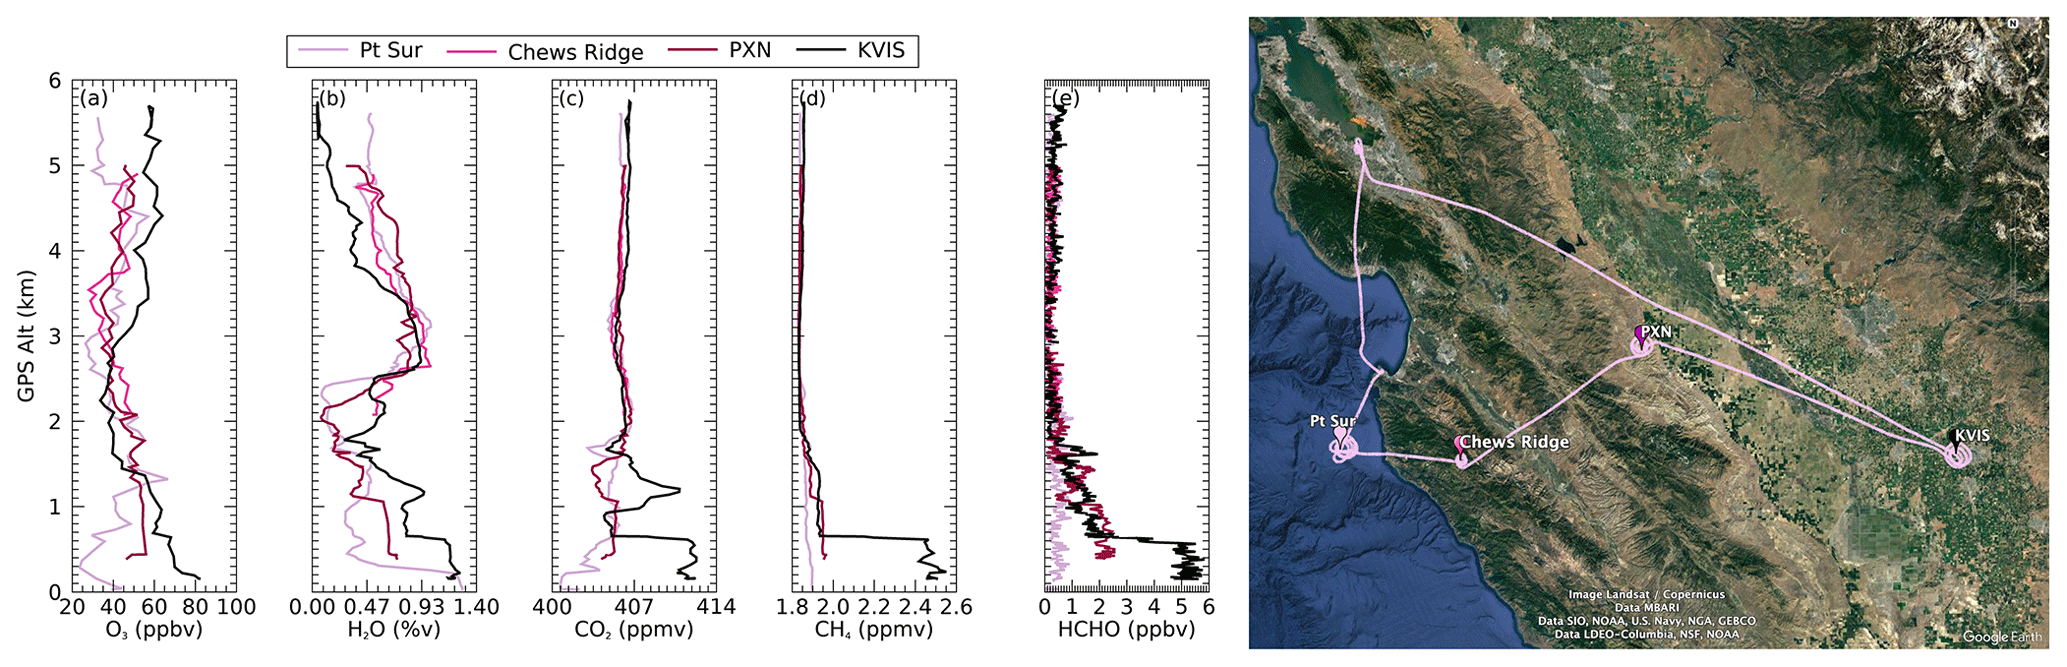
Figure 9Vertical profiles of O3 (a), H2O (b), CO2 (c), CH4 (d) and HCHO (e) over Pt Sur (offshore, gray), Chews Ridge (elevation = 1521 m a.s.l., pink), Panoche (PXN, elevation = 634 m a.s.l., purple) and Visalia (KVIS, black). AJAX flight track and profile locations are shown in the © Google™ Earth map on the right. Data are taken from AJAX flight no. 192 on 21 July 2016.
Figure 9 compares the west-to-east profiles for each trace gas species measured by AJAX. Each species shows a good degree of correlation at all locations in the free troposphere (> ∼ 2 km). However, in the lower troposphere each species shows significant differences at the varied locations. For O3, HCHO and CH4 there is a trend to increasing values from west to east, with the smallest mixing ratios for O3, HCHO, CO2 and CH4 observed offshore at Pt Sur and the largest mixing ratios over Visalia (KVIS) in line with the SJV's typical spring and summer conditions (high UV, temperature) favoring photochemical processing and O3 formation in the lowermost troposphere. For H2O, the profile over Visalia has a similar water vapor content within the boundary layer as the offshore profile due to the presence of rivers, crop irrigation and transpiration (Cooper et al., 2011).
4.3 Satellite validation case study: AJAX data for validation of lowermost-tropospheric (LMT) products from OCO-2 and GOSAT
AJAX observations of CO2 can be used to validate the OCO-2 lowermost-troposphere (LMT; approximately surface to 2.5 km, or surface to 750 hPa) and the GOSAT lower-troposphere (LT; defined by the retrieved surface pressure (Psurf) as 0.6–1 Psurf or approximately surface – 510 hPa) estimates of CO2, and they can, to a lesser extent, validate the OCO-2 upper column (U; approximately above 2.5 km, or 750 hPa) and GOSAT upper troposphere (UT; 0.2–0.6 Psurf) of CO2.
To compare the satellite observations to the aircraft's, we calculate an estimate of how the satellite would observe the AJAX extended profile, given the satellite's sensitivity (averaging kernel), which is different for OCO-2 and GOSAT partial column quantities, as shown in Fig. 10a. The satellite to aircraft comparison is accomplished using Eq. (1), where z is the partial column, x is the profile, ak is the averaging kernel, and the “a” subscript represents the a priori information. ztrue,ak represents the expected satellite observation of the AJAX extended profile (Rodgers, 2000; Connor et al., 2008; Kulawik et al., 2017).
Since AJAX observations extend from near-surface to ∼ 8–9 km, the AJAX profile needs to be extended both upward and downward to compare to a satellite column data product. Aircraft measurements are extended down to the surface using the lowest measured value. Between the top aircraft observation and 100 hPa, we extended the AJAX profile using the CarbonTracker 2019B model (Jacobson et al., 2020) with a constant offset to match to the topmost AJAX observation. Above 100 hPa, the CarbonTracker 2019B model without offset is used. A detailed overview of the LMT and U partial column products is described by Kulawik et al. (2017) and LT and UT by Kuze et al. (2022).
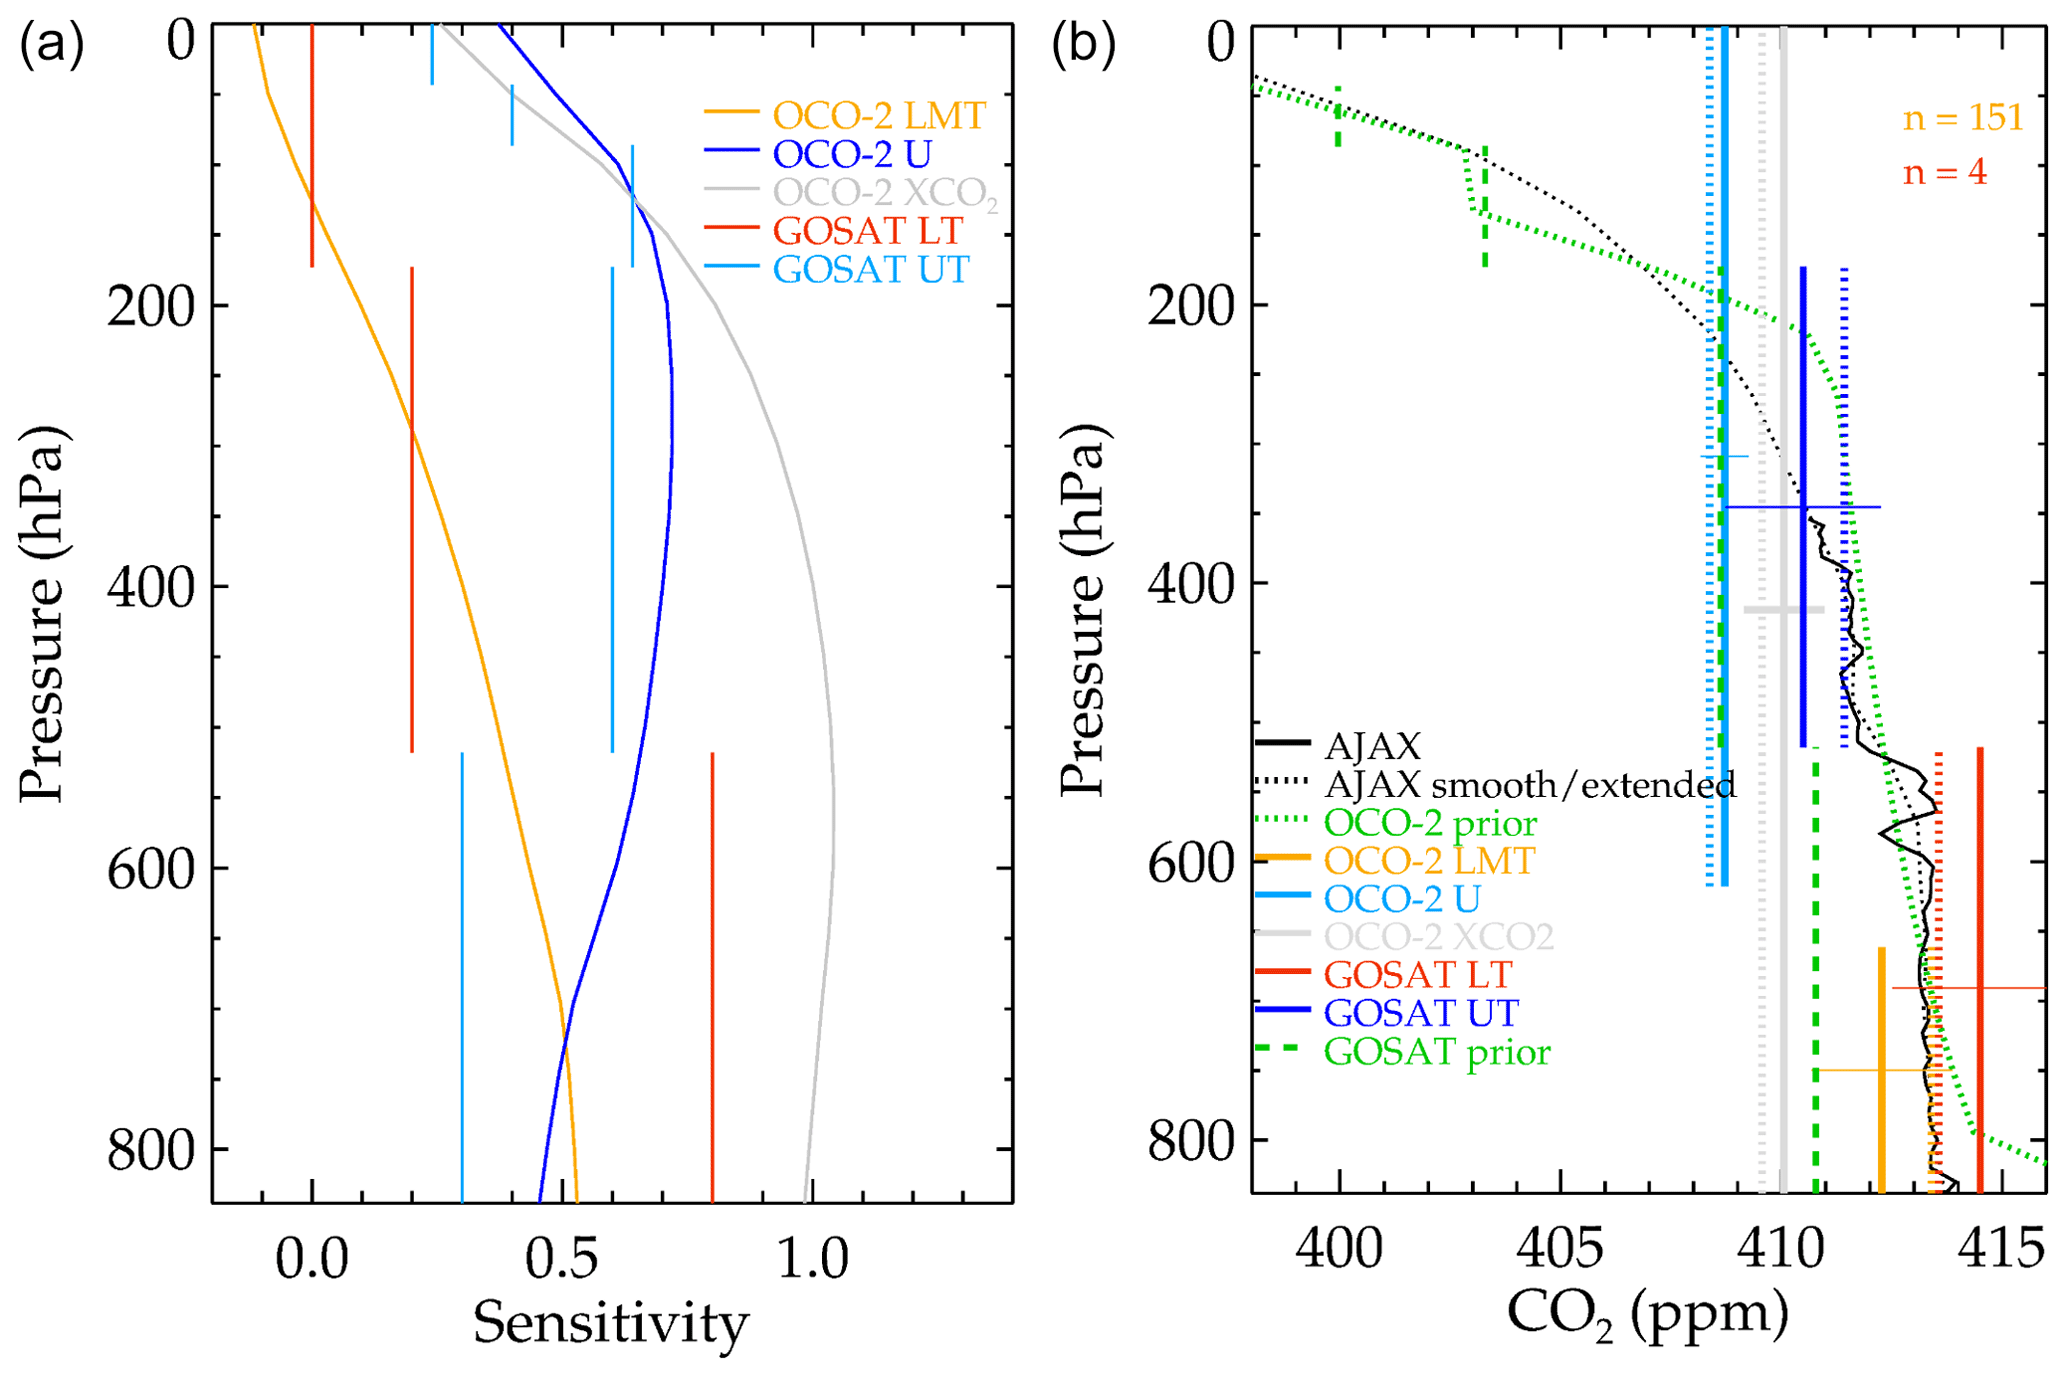
Figure 10(a) Comparison of averaging kernel (sensitivities) of the different products, where 0 corresponds to no sensitivity and 1 corresponds to perfect sensitivity for OCO-2 LMT (orange), OCO-2 U (dark blue), OCO-2 XCO2 (gray), GOSAT LT (red) and GOSAT UT (light blue). Note that the GOSAT averaging kernel is on 5 layers, whereas the OCO-2 averaging kernel is on 20 levels. (b) Comparison of each of the quantities from (a) to AJAX (black), where AJAX data with the corresponding averaging kernel applied (using Eq. 1) are dotted lines, and priors are dashed and dotted green lines. Note that AJAX data with OCO-2 LMT (orange, dotted lines) and AJAX data with GOSAT LT (red, dotted lines) are nearly the same value and are overlaid. The n values are the corresponding number of satellite observations that are with the coincidence criteria and are averaged together, where the error bars shown correspond to the standard deviation of the satellite values
Figure 10b shows an example of a CO2 profile measured by AJAX (black): the OCO-2 and GOSAT priors (green), the total column CO2 (XCO2) measured by OCO-2 (gray) and partial column products. These data were collected on 13 April 2018 during regular nadir overpasses (looking straight down) of both satellites. The satellite observations are plotted as solid lines, with horizontal bars showing the standard deviation of all nearby satellite observations. The GOSAT upper troposphere (UT, dark blue) shows a value slightly larger than XCO2, and the OCO-2 upper partial column (U, light blue) has a lower value than XCO2. OCO-2 and GOSAT both show an enhancement in the lower troposphere (solid orange and red lines, respectively) as compared to XCO2 (solid gray line).
AJAX data with the respective averaging kernels (using Eq. 1) are shown with dotted lines of colors matching the individual satellite partial products. The calculated LMT (dotted orange) and LT (dotted red) partial column averages are very similar to each other and to the direct observations (black). Thus, the AJAX data validate the vertical gradient observed by both GOSAT and OCO-2, with all matches within the satellite errors (estimated by the variability in all satellite matches). Validation of these exciting new GOSAT and OCO-2 vertically resolved products using AJAX in situ data shows the unique usefulness of aircraft profiles and the AJAX dataset of co-located vertical profiles in particular. A future paper will broaden this validation using a complete set of AJAX coincident observations over the period 2015–2018.
The AJAX data described in this paper are freely available at NASA's Atmospheric Science Data Center (https://doi.org/10.5067/ASDC/SUBORBITAL/AJAX/ DATA001, Iraci et al. 2021a). The data are provided in ICARTT format, which is described at https://www.earthdata.nasa.gov/esdis/esco/standards-and-practices/icartt-file-format (last access: 6 June 2023; NASA Earth data, 2021). OCO-2 lite product is available through NASA Goddard Earth Sciences Data and Information Services Center (GES DISC) (Gunson and Eldering, 2020; https://doi.org/10.5067/E4E140XDMPO2).
For each AJAX flight, four individual instrument datasets are available for download following the ICARTT file format V2.0. The CO2 and CH4 dataset (3 s resolution) and O3 dataset (10 s resolution) each include time and aircraft position. The HCHO dataset is available at 1 s and includes a time stamp; GPS data can be inferred from either the MMS or greenhouse gas datasets. The MMS dataset includes meteorological parameters and aircraft position archived at 1 s. All AJAX Level 2 datasets (https://doi.org/10.5067/ASDC/SUBORBITAL/AJAX/ DATA001, Iraci et al., 2021a) are readily available from NASA's Atmospheric Science Data Center (NASA ASDC, https://asdc.larc.nasa.gov/project/AJAX, last access: 1 November 2022).
GOSAT data used for this paper are available through Japan Aerospace Exploration Agency's (JAXA) GOSAT and GOSAT-2 EROC daily partial column GHG website available at https://www.eorc.jaxa.jp/GOSAT/CO2_monitor/index.html (GOSAT, 2023).
Measurements collected by the AJAX program provide an extensive dataset of trace gas and meteorological observations that will be of interest to a wide variety of data users. The multi-year, multi-objective, multi-instrument approach provided by the AJAX program was unique from a NASA airborne science perspective and produced a long-term record of vertical profile (up to 8–9 km) and level leg measurements over California and Nevada. The regular sampling approach and ability to vary flight objectives based on season and synoptic and atmospheric conditions allowed for opportunistic flights and flexibility to address several science questions. The AJAX dataset is of interest to those researching areas related to (but not limited to) (1) tropospheric profiling, including satellite validation; (2) boundary layer observations in California, with an emphasis on the San Francisco Bay Area and California's Central Valley; and (3) source identification, including wildfires, urban outflow, and emissions from oil and gas and agriculture.
This paper provides a detailed overview of the AJAX program and its dataset, including a summary of flight objectives, sampling strategies, airborne instrumentation, data processing, and a presentation of the overall datasets and their availability. AJAX observations can be used to validate lowermost-troposphere satellite data products as shown in the case study presented in Sect. 4.3.
Funding acquisition, project administration and supervision were carried out by LTI. JEM, JMR, CLP and ELY worked on data curation, formal analysis and visualization. SSK worked on validation of OCO-2 products using AJAX data. JMSC, TFH, TPB, CSC and JMDD provided resources and performed investigations. ELY prepared the manuscript with contributions from all co-authors.
The contact author has declared that none of the authors has any competing interests.
Publisher's note: Copernicus Publications remains neutral with regard to jurisdictional claims in published maps and institutional affiliations.
The NASA AJAX program recognizes support from Ames Research Center Director's funds, the NASA Postdoctoral Program (Josette E. Marrero, Ju-Mee Ryoo, Caroline L. Parworth, Jovan Tadić, Tomoaki Tanaka, Emma L. Yates, the OCO-2 Science Team, the Rapid Response and Novel research in the Earth Sciences (RRNES) program element, and the California Air Resources Board (contract no. 17RD004), as well as by NASA's Atmospheric Composition Program through the Internal Scientist Funding Model and the Campaign Data Analysis and Modeling (20-ACCDAM20-0083) program. Laura T. Iraci acknowledges support from the NASA Earth Science Research and Analysis Program during data collection and analysis. Thomas F. Hanisco and Jason M. St. Clair acknowledge support from the Goddard Internal Research and Development (IRAD) program. Technical contributions from Christopher Camacho, Warren Gore, Patrick Hamill, Emmett Quigley, Matthew Roby, Jovan Tadić, Tomoaki Tanaka, Tony Trias and Zion Young made this program possible. The authors gratefully recognize the support and partnership of H211 LLC, with particular thanks to Ken Ambrose, Todd Cardoza, Russ Fisher, Tom Grundherr, John Kerr, Jamie Lee, Brian Quiambao, Lawrence Sharma, Donald Simmons and Rob Simone. Data discovery, accessibility and archiving were made possible through the efforts of the Atmospheric Science Data Center staff: Kasey Phillips, Megan Buzanowicz, Nathan Jester, Nitin Arora, and Susan Haberer. The OCO-2 lowermost-tropospheric analysis was funded from the ROSES 17-OCO2-17-0013 project, “Reducing the impact of model transport error on flux estimates using CO2 profile information from OCO2 in concert with an online bias correction.” JAXA-GOSAT partial column density products were funded by the JAXA GOSAT program. The authors gratefully acknowledge Akihiko Kuza and Hiroshi Suto of JAXA for consultation regarding the GOSAT partial column products. The TMF data used in this publication were obtained from Thierry Leblanc as part of the Network for the Detection of Atmospheric Composition Change (NDACC) and are available through the NDACC website http://www.ndacc.org (last access: 1 November 2022).
This research has been supported by the Ames Research Center (Director's funds), the California Air Resources Board (grant no. 17RD004) and the Earth Sciences Division (OCO-2 Science Team, Rapid Response and Novel research in the Earth Sciences (RRNES), NASA Postdoctoral Program, and Campaign Data Analysis and Modeling (20-ACCDAM20-0083) program).
This paper was edited by Luis Millan and reviewed by two anonymous referees.
Baker, K. R., Woody, M. C., Valin, L., Szykman, J., Yates, E. L., Iraci, L. T., Choi, H. D., Soja, A. J., Koplitz, S. N., Campuzano-Jost, P., Jimenez, J. L., and Hair, J. W.: Photochemical model evaluation of 2013 California wild fire air quality impacts using surface, aircraft and satellite data, Sci. Total Environ., 637–638, 1137–1149, https://doi.org/10.1016/j.scitotenv.2018.05.048, 2018.
Chang, K.-L., Cooper, O. R., Rodriguez, G., Iraci, L. T., Yates, E. L., Johnson, M. S., Gaudel, A., Jaffe, D. A., Bernays, N., Clark, H., Effertz, P., Leblanc, T., Petropavlovskikh, I., Sauvage, B., and Tarasick, D. W.: Diverging ozone trends above western North America: Boundary layer decreases versus free tropospheric increases, J. Geophys. Res., 128, e2022JD038090, https://doi.org/10.1029/2022JD038090, 2023.
Chen, H., Winderlich, J., Gerbig, C., Hoefer, A., Rella, C. W., Crosson, E. R., Van Pelt, A. D., Steinbach, J., Kolle, O., Beck, V., Daube, B. C., Gottlieb, E. W., Chow, V. Y., Santoni, G. W., and Wofsy, S. C.: High-accuracy continuous airborne measurements of greenhouse gases (CO2 and CH4) using the cavity ring-down spectroscopy (CRDS) technique, Atmos. Meas. Tech., 3, 375–386, https://doi.org/10.5194/amt-3-375-2010, 2010.
Connor, B. J., Boesch, H., Toon, G., Sen, B., Miller, C., and Crisp, D.: Orbiting Carbon Observatory: Inverse method and prospective error analysis, J. Geophys. Res., 113, D05305, https://doi.org/10.1029/2006JD008336, 2008.
Cooper, O. R., Oltmans, S. J., Johnson, B. J., Brioude, J., Angevine, W., Trainer, M., Parrish, D. D., Ryerson, T. R., Pollack, I., Cullis, P. D., Ives, M. A., Tarasick, D. W., Al-Saadi, J., and Stajner, I.: Measurement of western U.S. baseline ozone from the surface to the tropopause and assessment of downwind impact regions, J. Geophys. Res., 116, D00V03, https://doi.org/10.1029/2011JD016095, 2011.
Cui, Y. Y., Vijayan, A., Falk, M., Hsu, Y.-K., Yin, D., Chen, X. M., Zhao, Z., Avise, J., Chen, Y., Verhulst, K., Duren, R., Yadav, V., Miller, C., Weiss, R., Keeling, R., Kim, J., Iraci, L. T., Tanaka, T., Johnson, M. S., Kort, E. A., Bianco, L., Fischer, M. L., Stroud, K., Herner, J., and Croes, B.: A Multiplatform Inversion Estimation of Statewide and Regional Methane Emissions in California during 2014–2016, Environ. Sci. Technol., 53, 9636–9645, https://doi.org/10.1021/acs.est.9b01769, 2019.
Faloona, I. C., Chiao, S., Eiserloh, A. J., Alvarez, R. J., Kirgis, G., Langford, A. O., Senff, C. J., Caputi, D., Hu, A., Iraci, L.T., Yates, E. L., Marrero, J. E., Ryoo, J-M., Conley, S., Tanrikulu, S., Xu, J., and Kuwayama, T.: The California Baseline Ozone Transport Study (CABOTS), B. Am. Meterol. Soc., 101, 385–388, https://doi.org/10.1175/BAMS-D-18-0302.A, 2020.
Federal Aviation Regulation (FAR): 91.119 Minimum safe altitudes: https://www.faa.gov/about/office_org/field_offices/fsdo/lgb/local_more/media/FAA_Guide_to_Low-Flying_Aircraft.pdf last access: 3 January 2023.
Fine, R., Miller, M. B., Yates, E. L., Iraci, L. T., and Sexauer Gustin, M.: Investigating the influence of long-range transport on surface O3 in Nevada, using observations from multiple measurement platforms, Sci. Total Environ., 530–531, 493–504, https://doi.org/10.1016/j.scitotenv.2015.03.125, 2015.
GOSAT: EORC Daily Partial Column GHGs, https://www.eorc.jaxa.jp/GOSAT/GPCG/index_GOSAT.html, last access: 3 January 2023.
Gunson, M. and Eldering, A.: OCO-2 Level 2 bias-corrected XCO2 and other select fields from the full-physics retrieval aggregated as daily files, Retrospective processing V10r, Greenbelt, MD, USA, Goddard Earth Sciences Data and Information Services Center (GES DISC) [data set], https://doi.org/10.5067/E4E140XDMPO2 (last access: 1 November 2022), 2020.
Hamill, P., Iraci, L. T., Yates, E. L., Gore, W., Bui, T. P., and Tanaka, T.: A new instrumented airborne platform for atmospheric research, B. Am. Meteorol. Soc., 97, 397–404, https://doi.org/10.1175/bams-d-14-00241.1, 2016.
Iraci, L. T., Ryoo, J.-M., and Yates, E. L.: Spatial Variation of Vertical Ozone Distribution over California, Final Project Report for Contract No. 17RD004, California Air Resources Board, submitted, 2020.
Iraci, L. T., Yates, E. L., Marrero, J. E., Parworth, C. L., Ryoo, J.-M., Tanaka, T., Bui, T. P., Dean-Day, J., Chang, C., Hanisco, T., and St. Clair, J.: Airborne Trace Gas Measurements Collected by the Alpha Jet Atmospheric eXperiment (AJAX) Project: 2011–2018, Atmospheric Science Data Center [data set], https://doi.org/10.5067/ASDC/SUBORBITAL/AJAX/DATA001 (last access: 1 November 2022), 2021a.
Iraci, L. T., Yates, E. L., Marrero, J. E., Parworth, C. L., Ryoo, J.-M., and Tanaka, T.: Compendium of Airborne Trace Gas Measurements Collected in and around California Fire Plumes by the AJAX Project, Atmospheric Science Data Center [data set], https://doi.org/10.5067/ASDC/AJAX/wildfire, 2021b.
Iraci, L. T., Parworth, C. P., Yates, E. L., Marrero, J. E., and Ryoo, J.-M.: A collection of airborne measurements and analyses of trace gases emitted from multiple fires in California, Earth Space Sci., 9, EA002116, https://doi.org/10.1029/2021EA002116, 2022.
Jacobson, A. R., Schuldt, K. N., Miller, J. B., Oda, T., Tans, P., Mund, J., Ott, L., Collatz, G. J., Aalto, T., Afshar, S., Aikin, K., Aoki, S., Apadula, F., Baier, B., Bergamaschi, P., Beyersdorf, A., Biraud, S. C., Bollenbacher, A., Bowling, D., Brailsford, G., Abshire, J. B., and Chen, G.: CarbonTracker CT2019B, Model published 2020 via NOAA Global Monitoring Laboratory, 2020.
Johnson, M. S., Yates, E. L., Iraci, L. T., Loewenstein, M., Tadić, J. M., Wecht, K. J., Jeong, S., and Fischer, M. L.: Analyzing source apportioned methane in northern California during Discover-AQ-CA using airborne measurements and model simulations, Atmos. Environ., 99, 248–256, https://doi.org/10.1016/j.atmosenv.2014.09.068, 2014.
Johnson, M. S., Xi, X., Jeong, S., Yates, E. L., Iraci, L. T., Tanaka. T., Loewenstein, M., Tadíc, J. M., and Fischer, M. L.: Investigating seasonal methane emissions in Northern California using airborne measurements and inverse modelling, J. Geophys. Res., 22, 13753–13767, https://doi.org/10.1002/2016JD025157, 2016.
Klappenbach, F., Chen, J., Wenzel, A., Forstmaier, A., Dietrich, F., Zhao, X., Jones, T., Franklin, J., Wofsy, S., Frey, M., Hase, F., Hedelius, J., Wennberg, P., Cohen, R., and Fischer, M.: Methane emission estimate using ground based remote sensing in complex terrain, EGU General Assembly 2021, online, 19–30 Apr 2021, EGU21-15406, https://doi.org/10.5194/egusphere-egu21-15406, 2021.
Kulawik, S. S., O'Dell, C., Payne, V. H., Kuai, L., Worden, H. M., Biraud, S. C., Sweeney, C., Stephens, B., Iraci, L. T., Yates, E. L., and Tanaka, T.: Lower-tropospheric CO2 from near-infrared ACOS-GOSAT observations, Atmos. Chem. Phys., 17, 5407–5438, https://doi.org/10.5194/acp-17-5407-2017, 2017.
Kuze,A., Nakamura,Y., Oda,T., Yoshida,Y., Kikuchi,N., Kataoka, F., Suto, H., and Shiomi, K.: Examining partial-column density retrieval of lower-tropospheric CO2 from GOSAT target observations over global megacities, Remote Sens. Environ., 273, 112966, https://doi.org/10.1016/j.rse.2022.112966, 2022.
Langford, A. O., Senff, C., Alvarez II, R. J., Brioude, J., Cooper, O. R., Holloway, J. S., Lin, M. Y., Marchbanks, R. D., Pierce, R. B., Sandberg, S. P., Weickmann, A. M., and Williams, E. J.: An overview of the 2013 Las Vegas Ozone Study (LVOS): Impact of stratospheric intrusions and long-range transport on surface air quality, Atmos. Environ., 109, 305–322, https://doi.org/10.1016/j.atmosenv.2014.08.040, 2015.
Langford, A. O., Alvarez II, R. J., Brioude, J., Evan, S., Iraci, L. T., Kirgis, G., Kuang, S., LeBlanc, T., Newchurch, M. J., Pierce, R. B., Senff, C., and Yates, E. L.: Coordinated profile of stratospheric intrusions and transported pollution by the Tropospheric Ozone Lidar Network (TOLNet) and NASA Alpha Jet eXperiment (AJAX): Observations and comparison to HYSPLIT, RAQMS and FLEXPART, Atmos. Environ., 174, 1–14, https://doi.org/10.1016/j.atmosenv.2017.11.031, 2018.
Langford, A. O., Alvarez II, R. J., Kirgis, G., Senff, C. J., Caputi, D., Conley, S. A., Faloona, I. C., Iraci, L. T., Marrero, J. E., McNamara, M. E., Ryoo, J.-M., and Yates, E. L.: Intercomparison of lidar, aircraft, and surface ozone measurements in the San Joaquin Valley during the California Baseline Ozone Transport Study (CABOTS), Atmos. Meas. Tech., 12, 1889–1904, https://doi.org/10.5194/amt-12-1889-2019, 2019.
Langford, A. O., Alvarez, R. J., Brioude, J., Caputi, D., Conley, S. A., Evan, S., Faloona, I. C., Iraci, L. T., Kirgis, G., Marrero, J. E., Ryoo, J.-M., Senff, C., and Yates, E. L.: Ozone production in the Soberanes smoke haze: Implications for air quality in the San Joaquin Valley during California Baseline Ozone Transport Study, J. Geophys. Res., 125, e2019JD031777, https://doi.org/10.1029/2019JD031777, 2020.
Leifer, I., Melton, C., Fischer, M. L., Fladeland, M., Frash, J., Gore, W., Iraci, L. T., Marrero, J. E., Ryoo, J.-M., Tanaka, T., and Yates, E. L.: Atmospheric characterization through fused mobile airborne and surface in situ surveys: methane emissions quantification from a producing oil field, Atmos. Meas. Tech., 11, 1689–1705, https://doi.org/10.5194/amt-11-1689-2018, 2018.
Leifer, I., Melton, C., Chatfield, R., Cui, X., Fischer, M. L., Fladeland, M., Gore, W., Hlavka, D. L., Iraci, T. L., Marrero, J. E., Ryoo, J-M., Tanaka, T., Yates, E. L., and Yorks, J. E.: Air pollution inputs to the Mojave Desert by fusing surface mobile and airborne in situ and airborne and satellite remote sensing: A case study of interbasin transport with numerical model validation, Atmos. Environ., 224, 117184, https://doi.org/10.1016/j.atmosenv.2019.117184, 2020.
Lin, M., Horowitz, L. W., Cooper, O. R., Tarasick, D., Conley, S. C., Iraci, L. T., Johnson, B., LeBlanc, T., Petropavlovskikh, I., and Yates, E. L.: Revisiting the evidence of increasing springtime ozone mixing ratios in the free troposphere over western North America, Geophys. Res. Lett., 42, 8719–8728, https://doi.org/10.1002/2015GL065311, 2015.
Liu, S., Barletta, B., Hornbrook, R. S., Fried, A., Peischl, J., Meinardi, S., Coggon, M., Lamplugh, A., Gilman, J. B., Gkatzelis, G. I., Warneke, C., Apel, E. C., Hills, A. J., Bourgeois, I., Walega, J., Weibring, P., Richter, D., Kuwayama, T., FitzGibbon, M., and Blake, D.: Composition and reactivity of volatile organic compounds in the South Coast Air Basin and San Joaquin Valley of California, Atmos. Chem. Phys., 22, 10937–10954, https://doi.org/10.5194/acp-22-10937-2022, 2022.
NASA Earth data: ICARTT File Format Standards V2.0, NASA Earth data [data set], https://www.earthdata.nasa.gov/esdis/esco/standards-and-practices/icartt-file-format (last access: 6 June 2023), last update: 20 May 2021.
NOAA: Trends in CO2, https://gml.noaa.gov/ccgg/trends/data.html (last access: 5 June 2023), 2022a.
NOAA: Trinidad Head observation site, https://gml.noaa.gov/dv/site/THD.html (last access: 5 June 2023), 2022b.
Parworth, C. L., Marrero, J. M., Yates, E. L., Ryoo, J.-M., and Iraci, L. T.: Proposed trace gas measurements over the western United States for TROPOMI validation, EGU General Assembly, Vienna, Austria, 4–13 April, p. 5672, EGU2018-5672-1, 2018.
Rodgers, C. D.: Inverse methods for atmospheric sounding: theory and practice, London, WorldScientific, ISBN 981-02-2740-X, 2000.
Ryoo, J.-M., Johnson, M. S., Iraci, L. T., Yates, E. L., and Gore, W.: Investigation sources of ozone over California using AJAX airborne measurements and models: Assessing the contribution from long-range transport, Atmos. Environ., 155, 53–67, https://doi.org/10.1016/j.atmosenv.2017.02.008, 2017.
Ryoo, J.-M., Iraci, L. T., Tanaka, T., Marrero, J. E., Yates, E. L., Fung, I., Michalak, A. M., Tadić, J., Gore, W., Bui, T. P., Dean-Day, J. M., and Chang, C. S.: Quantification of CO2 and CH4 emissions over Sacramento, California, based on divergence theorem using aircraft measurements, Atmos. Meas. Tech., 12, 2949–2966, https://doi.org/10.5194/amt-12-2949-2019, 2019.
Ryoo, J.-M., Chiao, S., Spackman, J. R., Iraci, L. T., Ralph, F. M., Martin, A., Dole, R. M., Marrero, J. E., Yates, E. L., Bui, T. P., Dean-Day, J. M., and Chang, S. C.: Terrain Trapped Airflows and Precipitation Variability during an Atmospheric River Event, J. Hydrometeorol., 21, 355–375, https://doi.org/10.1175/JHM-D-19-0040.1, 2020.
Scott, S. G., Bui, T. P., Chan, K. R., and Bowen, S. R.: The meteorological measurement system on the NASA ER-2 aircraft, J. Atmos. Ocean. Tech., 7, 525–540, https://doi.org/10.1175/1520-0426(1990)007<0525:TMMSOT>2.0.CO;2, 1990.
St. Clair, J. M., Swanson, A. K., Bailey, S. A., Wolfe, G. M., Marrero, J. E., Iraci, L. T., Hagopian, J. G., and Hanisco, T. F.: A new non-resonant laser-induced fluorescence instrument for the airborne in situ measurement of formaldehyde, Atmos. Meas. Tech., 10, 4833–4844, https://doi.org/10.5194/amt-10-4833-2017, 2017.
St. Clair, J. M., Swanson, A. K., Bailey, S. A., and Hanisco, T. F.: CAFE: a new, improved nonresonant laser-induced fluorescence instrument for airborne in situ measurement of formaldehyde, Atmos. Meas. Tech., 12, 4581–4590, https://doi.org/10.5194/amt-12-4581-2019, 2019.
Tadíc, J. M., Loewenstein, M., Frankenberg, C., Butz, A., Roby, M., Iraci, L. T., Yates, E. L., Gore, W., and Kuze, A.: A comparison of in situ aircraft measurements of carbon dioxide and methane to GOSAT data measured over Railroad Valley playa, Nevada, USA, IEEE T. Geosci. Remote, 52, 7764–7774, https://doi.org/10.1109/TGRS.2014.2318201, 2014.
Tadíc, J. M., Michalak, A. M., Iraci, L. T., Llic, S. C., Biraud, S. C., Feldman, D. R., Bui, T. P., Johnson, M. S., Loewenstein, M., Jeong, S., Fischer, M. L., Yates, E. L., and Ryoo, J.-M.: Elliptic cylinder airborne sampling and geostatistical mass balance approach for quantifying local greenhouse gas emissions, Environ. Sci. Technol., 51, 10012–10021, https://doi.org/10.1021/acs.est.7b03100, 2017.
Tanaka, T., Yates, E. L., Iraci, L. T., Johnson, M. S., Gore, W., Tadic, J. M., Loewenstein, M., Kuze, A., Frankenberg, C., Butz, A., and Yoshida, Y.: Two-year comparison of airborne measurements of CO2 and CH4 with GOSAT at Railroad Valley, Nevada, IEEE T. Geosci. Remote, 54, 4367–4375, https://doi.org/10.1109/TGRS.2016.2539973, 2016.
Toon, O. B., Maring, H., Dibb, J., Ferrare, R., Jacob, D. J., Jensen, E. J., Luo, Z. J., Mace, G. G., Pan, L. L., Pfister, L., Rosenlof, K. H., Redemann, J., Reid, J. S., Singh, H. B., Thompson, A. M., Yokelson, R., Minnis, P., Chen, G., Jucks, K. W., and Pszenny, A.: Planning, implantation, and scientific goals of the Studies and Emissions and Atmospheric Composition, Clouds and Climate Coupling by Regional Surveys (SEAC4RS) field mission, J. Geophys. Res., 121, 4967–5009, https://doi.org/10.1002/2015JD024297, 2016.
Yates, E. L., Iraci, L. T., Roby, M. C., Pierce, R. B., Johnson, M. S., Reddy, P. J., Tadić, J. M., Loewenstein, M., and Gore, W.: Airborne observations and modeling of springtime stratosphere-to-troposphere transport over California, Atmos. Chem. Phys., 13, 12481–12494, https://doi.org/10.5194/acp-13-12481-2013, 2013.
Yates, E. L., Iraci, L. T., Austerberry, D., Pierce, R. B., Roby, M. C., Tadić, J. M., Loewenstein, M., and Gore, W.: Characterizing the impacts of vertical transport and photochemical ozone production on an exceedance area, Atmos. Environ., 109, 342–350, https://doi.org/10.1016/j.atmosenv.2014.09.002, 2015.
Yates, E. L., Iraci, L. T., Singh, H., Tanaka, T., Roby, M. C., Hamill, P., Clements, C. B., Lareu, N., Contezac, J., Blake, D. R., Simpson, I. J., Wisthaler, A., Mikoviny, T., Diskin, G. S., Beyersdorf, A. J., Choi, Y., Reyerson, T. B., Jimenez, J. L., Campuzano-Jost, P., Loewenstein, M., and Gore, W.: Airborne measurements and emission estimates of greenhouse gases and other trace constituents from the 2013 California Yosemite Rim wildfire, Atmos. Environ., 127, 293–302, https://doi.org/10.1016/j.atmosenv.2015.12.038, 2016.
Yates, E. L., Johnson, M. S., Iraci, L. T., Ryoo, J. -M., Pierce, R. B., Cullis, P. D., Gore, W., Ives, M. A., Johnson, B. J., Leblanc, T., Marrero, J. E., Sterling, C. W., and Tanaka, T.: An assessment of ground-level and free-tropospheric ozone over California and Nevada, J. Geophys. Res., 122, 10089–10102, https://doi.org/10.1002/2016JD026266, 2017.
Yates, E. L., Iraci, L. T., Tarnay, L. W., Burley, J. D., Parworth, C., and Ryoo, J.-M.: The effect of an upwind non-attainment area on ozone in California's Sierra Nevada Mountains, Atmos. Environ., 230, 117426, https://doi.org/10.1016/j.atmosenv.2020.117426, 2020.