the Creative Commons Attribution 4.0 License.
the Creative Commons Attribution 4.0 License.
 | 06 Jun 2023
East Asia Reanalysis System (EARS)
Jinfang Yin
Xudong Liang
Yanxin Xie
Feng Li
Kaixi Hu
Lijuan Cao
Feng Chen
Haibo Zou
Feng Zhu
Xin Sun
Jianjun Xu
Geli Wang
Ying Zhao
Juanjuan Liu
Reanalysis data play a vital role in weather and climate study as well as meteorological resource development and application. In this work, the East Asia Reanalysis System (EARS) was developed using the Weather Research and Forecasting (WRF) model and the Gridpoint Statistical Interpolations (GSI) data assimilation system. The regional reanalysis system is forced by the European Centre for Medium-Range Weather Forecasts (ECMWF) global reanalysis ERA-Interim data at 6 h intervals. Hourly surface observations are assimilated by the Four-Dimension Data Assimilation (FDDA) scheme during the WRF model integration; upper observations are assimilated in three-dimensional variational data assimilation (3D-VAR) mode at the analysis moment. It should be highlighted that many of the assimilated observations have not been used in other reanalysis systems. The reanalysis runs from 1980 to 2018, producing a regional reanalysis dataset covering East Asia and surrounding areas at 12 km horizontal resolution, 74 sigma levels, and 3 h intervals. Finally, an evaluation of EARS has been performed with respect to the root mean square error (RMSE), based on the 10-year (2008–2017) observational data. Compared to the global reanalysis data of ERA-Interim, the regional reanalysis data of EARS are closer to the observations in terms of RMSE in both surface and upper-level fields. The present study provides evidence for substantial improvements seen in EARS compared to the ERA-Interim reanalysis fields over East Asia. The study also demonstrates the potential use of the EARS data for applications over East Asia and proposes further plans to provide the latest reanalysis in real-time operation mode. Simple data and updated information are available on Zenodo at https://doi.org/10.5281/zenodo.7404918 (Yin et al., 2022), and the full datasets are publicly accessible on the Data-as-a-Service platform of the China Meteorological Administration (CMA) at http://data.cma.cn (last access: 19 May 2023).
- Article
(13412 KB) - Full-text XML
- BibTeX
- EndNote


The East Asia Reanalysis System (EARS) project was launched by the China Meteorological Administration (CMA) in late 2014. It aimed to build a regional reanalysis system that can assimilate as much as possible multi-source observational datasets and to establish a long-term high-resolution regional atmospheric reanalysis, which is high quality for mesoscale weather, regional climate, environment studies, and other applications. This paper reports on the progress of the project, including the used numerical model, data assimilation, observations, and preliminary achievements. Thus, the major objectives of the present study are to (i) introduce the work we have already done, (ii) help understand and use the EARS reanalysis products, and (iii) provide guidance for repeating and extending the work in the future.
Atmospheric reanalysis data, which may serve as alternative data to actual observations, play an important role in weather and climate studies, including numerical model validation. In the past several decades, a series of atmospheric reanalysis products was produced with different goals (Wright et al., 2019); some have been widely used in theoretical studies and applied to weather and climate research to improve prediction skills and reduce hazard risks. With the ongoing development of atmospheric sciences, high-resolution atmospheric reanalysis data are much needed. In view of this demand, a large number of high-resolution regional reanalysis products have been produced for various parts of the world (e.g., Mesinger et al., 2006; Jakob et al., 2017; Vidal et al., 2010; Usui et al., 2017; Yang et al., 2022). However, little attention has been paid to East Asia, although China's first generation of global atmospheric reanalysis (CRA40) was released recently, with a horizontal resolution of approximately 34 km and a temporal resolution of 6 h. Only low-resolution global reanalysis products have been used for the region, including the National Centers for Environmental Prediction-Department of Energy Reanalysis version 2 (NCEP2) (Kanamitsu et al., 2002), the European Centre for Medium-Range Weather Forecasts (ECMWF) Reanalysis-Interim (ERA-Interim) (Dee et al., 2011), the Japanese 55-year Reanalysis (JRA55) (Kobayashi et al., 2015), and the Modern-Era Retrospective Analysis for Research and Applications version 2 (MERRA2) (Gelaro et al., 2017). More recently, the ECMWF released the fifth generation of its atmospheric reanalysis (ERA5) (Hersbach et al., 2020), replacing ERA-Interim; it is a global atmospheric reanalysis with a horizontal resolution of 0.25∘. Although these global reanalysis systems have achieved great progress, their products were developed for global coverage. They have limited regional usage due to low spatial and temporal resolution (Chen et al., 2014). Most importantly, multiple observations over East Asia were not included in these global reanalysis products. Consequently, the global reanalysis products are inadequate for studying characteristics of local weather and climate in East Asia, such as strong rainfall in the warm sector in southern China during the period from April to June (the so-called pre-summer rainy season) (Chen et al., 2014). In view of the abovementioned inherent issues, it is highly imperative to develop a high-spatiotemporal-resolution reanalysis product for East Asia.
Several regional atmospheric reanalysis datasets have been produced in the past two decades, such as the North American Regional Reanalysis (NARR) (Mesinger et al., 2006), the High-resolution Regional Reanalysis for the European Coordinated Regional Downscaling Experiment (CORDEX) (Bollmeyer et al., 2015; Bach et al., 2016), the Arctic System Reanalysis (ASR) (Bromwich et al., 2017), the Bureau of Meteorology Atmospheric high-resolution Regional Reanalysis for Australia (BARRA-R) (Jakob et al., 2017), the high-resolution regional reanalysis of Japan (NHM-LETKF) (Fukui et al., 2018), and the regional reanalysis of Indian Monsoon Data Assimilation and Analysis (IMDAA) (Mahmood et al., 2018). These data have been widely used for regional weather and climate studies. Recently, Yang et al. (2022) developed a 10-year (2010–2019) regional reanalysis dataset, focusing on the Korean Peninsula and its surrounding areas only. With the same objective, the CMA planned a project, intending to produce high-resolution regional atmospheric reanalysis data with high quality for mesoscale weather study and regional climate analysis over East Asia. For this purpose, EARS was launched in late 2014, and a 39-year (1980–2018) reanalysis dataset is now available to the public.
This is our first open documentation of the project, on the basis of several progress reports (e.g., Liang et al., 2020; Yin et al., 2019), which briefly describes EARS and documents its performance. It includes the numerical model set, data assimilation method, assimilated observational datasets, and preliminary results. In Sect. 2, we describe the EARS system and the data used. In Sect. 3, we present the preliminary results of a 10-year (2008–2017) reanalysis dataset with validation. Finally, a summary and discussion are provided in Sect. 4, along with future activities and plans.
2.1 System setup
EARS is established based on the Advance Research Weather Research and Forecasting (WRF version 3.9.1) model (Skamarock et al., 2008) and the Gridpoint Statistical Interpolations (GSI) data assimilation system (Hu et al., 2018). To improve the model performance in East Asia, a series of experiments was launched for dynamic and physical options. At present, GSI runs in three-dimensional variational data assimilation (3D-VAR) mode, and much attention has been paid to the effect of assimilating each category of observations. To date, EARS works continuously in a 39-year run, with a cold start at an interval of 6 h.
In EARS (Fig. 1), the WRF-ARW model grid spacing is 12 km, which covers a large domain of an area of 10 800 km×9120 km (with 900×760 grid points), and it is centered at (100∘ E, 38∘ N). A total of 74 sigma levels is used in the vertical, with the model top fixed at 10 hPa. The model terrain is interpolated from the 30 arcsec USGS GMTED2010, and the land use fields are interpolated from 21-class MODIS datasets. The model physics schemes used include the following: (i) the Kain (2004) cumulus parameterization scheme, (ii) the new Thompson microphysics scheme (Thompson et al., 2008), (iii) the rapid radiative transfer model (Iacono et al., 2008) for both shortwave and longwave radiative flux calculations, (iv) the Yonsei University (YSU) Planetary Boundary Layer (PBL) scheme (Hong et al., 2006), (v) the revised MM5 Monin–Obukhov similarity scheme for the surface layer (Janjić, 1994), and (vi) the Noah-MP land surface scheme (Niu et al., 2011). It should be emphasized that the model set was optimized via a series of experiments covering various weather phenomena and continuous simulations (e.g., Zhang et al., 2016; Li et al., 2018; Yin et al., 2014, 2020).
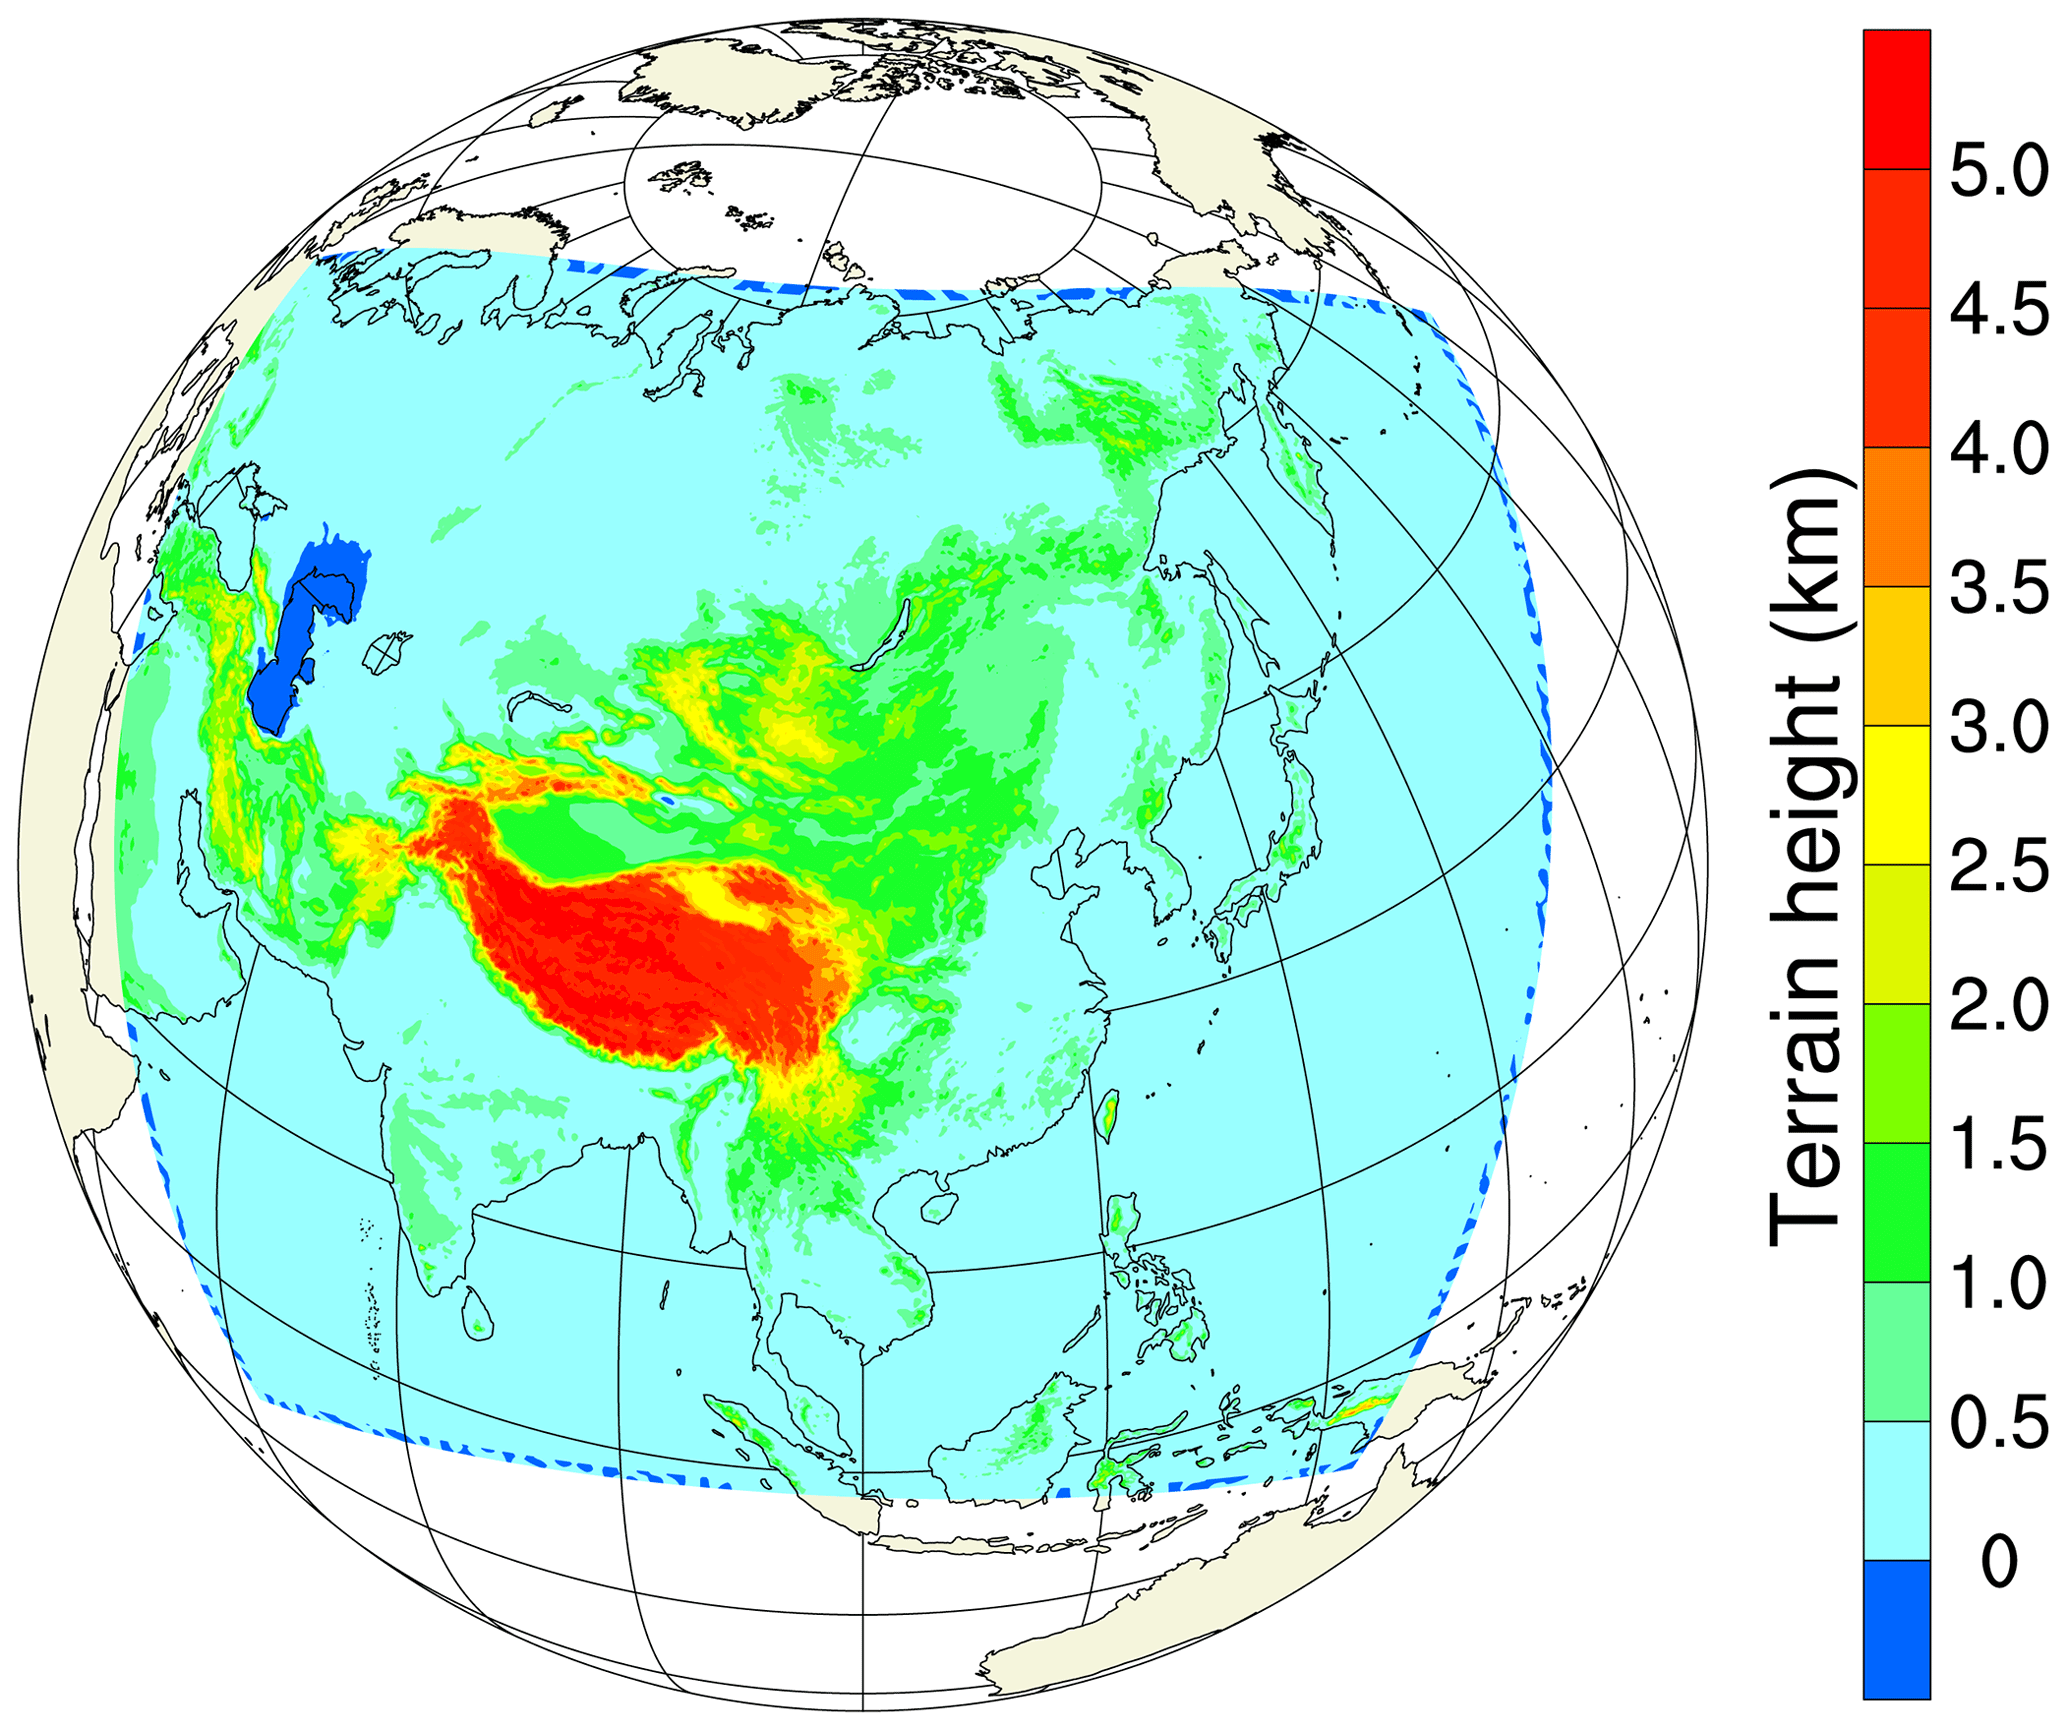
Figure 1The East Asia Reanalysis System (EARS) domain in the WRF model and its 12 km topography. Shadings indicate the height of the terrain in the model.
A schematic illustrating the flow of analysis steps of EARS is shown in Fig. 2. The WRF model integrates for 12 h in every cold start, starting at 00:00, 06:00, 12:00, and 18:00 UTC, with hourly outputs. The ERA-Interim 0.79∘ reanalysis data at 6 h intervals are utilized as initial and boundary conditions for the cold run. Please refer to Dee et al. (2011) for detailed information on the ERA-Interim reanalysis data. At the model's initial time, the upper-level (sounding and aircraft) observations are assimilated with the GSI system in 3D-VAR mode. During the model integration, the Four-Dimension Data Assimilation (FDDA) functions are activated by performing surface observation nudging (Reen, 2016). The required analysis data for the FDDA are obtained through the WRF's preprocessing OBSGRID module (Wang et al., 2017) using the hourly surface observations after performing data quality control, which includes temperature, relative humidity, and horizontal winds. More specifically, observation nudging is a type of FDDA wherein artificial tendency terms are introduced during the model integration (Reen, 2016). Since it is applied at every time step, nudging is a continuous form of data assimilation. Therefore, observations in the model integration time window can be well ingested. Generally speaking, the differences between the WRF model and observation are utilized to create innovations. Then, the innovations are multiplied by various factors and added to model tendency equations. It should be noted that observation nudging is affected by the uncertainty of the observations. Therefore, surface observations are strictly quality-controlled by the OBSGRID module (Wang et al., 2017).
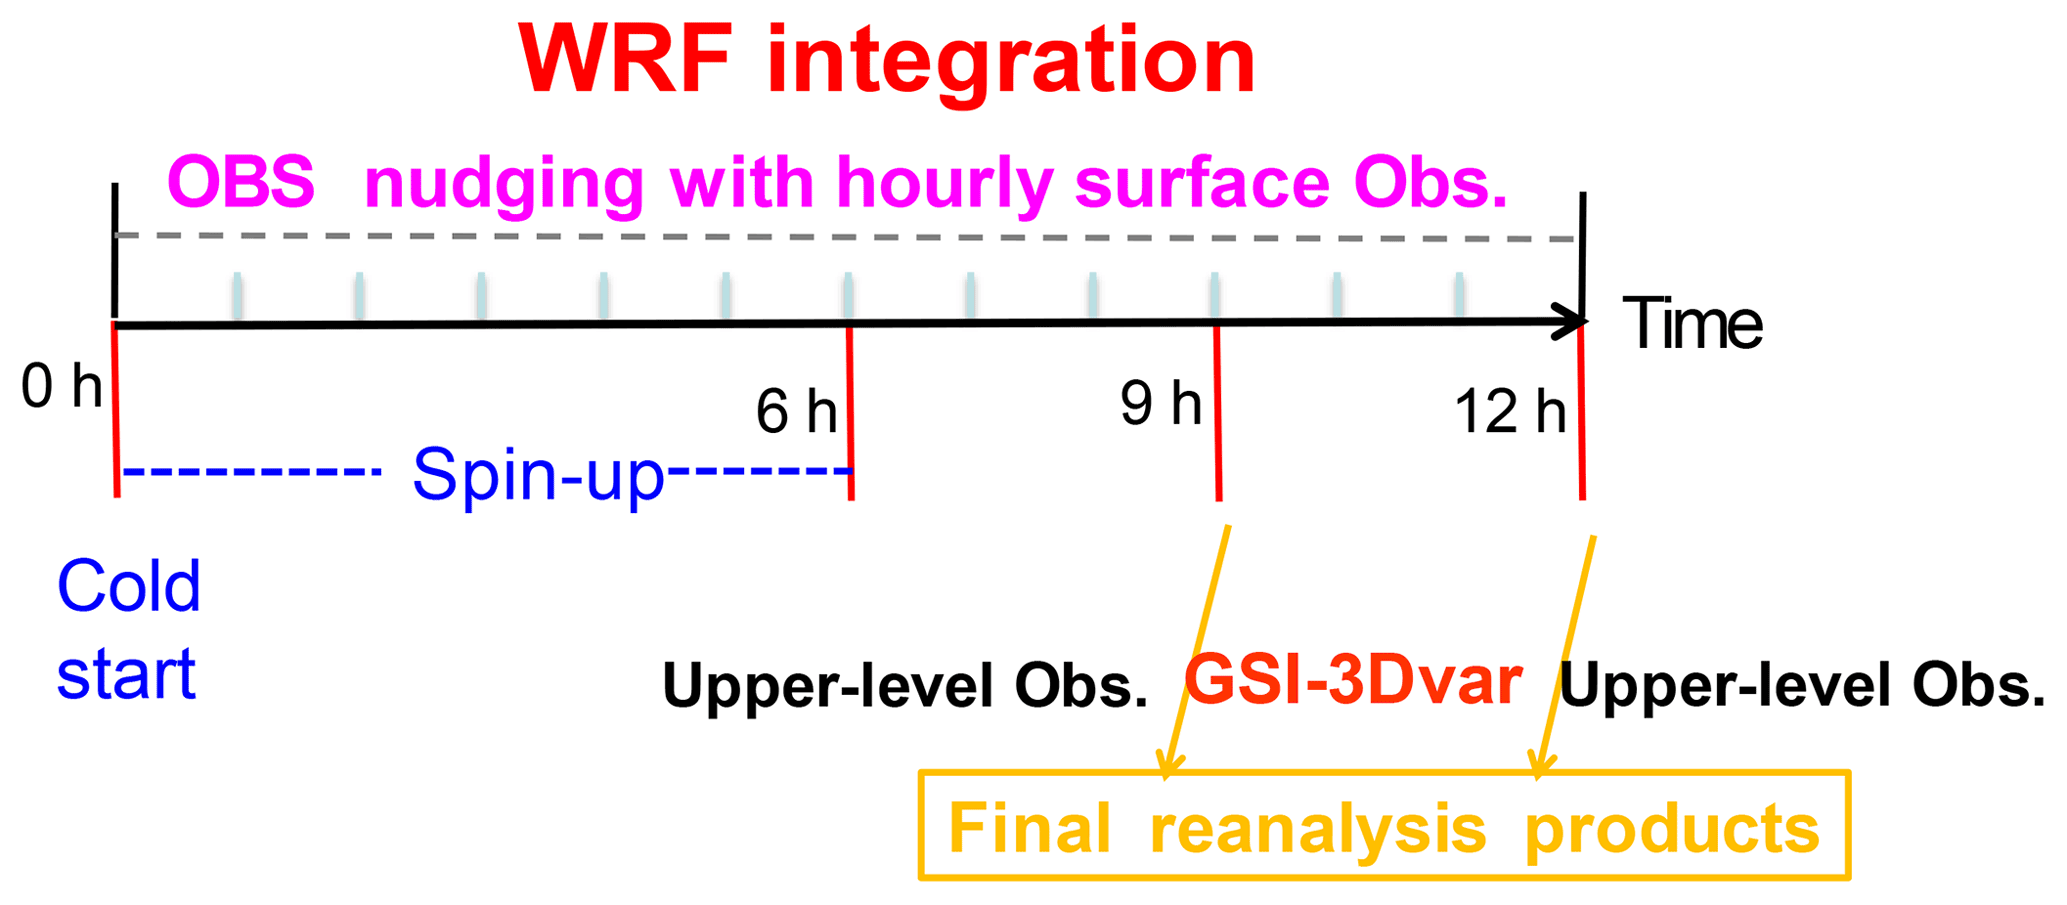
Figure 2Schematic illustrating the flow chart of analysis steps of EARS. See the text for details.
The model outputs in the first 6 h are considered the spin-up process and thus are not used for research. The model outputs at the ninth and twelfth hours are used as the first guess of GSI, and the upper-level observations are assimilated in 3D-VAR mode. The upper-level observations include sounding, aircraft observation, and cloud-derived wind vectors. The composited radar reflectivity is ingested by way of cloud analysis to produce the final reanalysis data. Note that model hourly outputs are also available. Unlike a continuously operating global reanalysis system, EARS conducts a cold start every 6 h, and the WRF model integrates 12 h for each run. Accordingly, the model outputs from the sixth to twelfth hours are used to produce hourly precipitation during the WRF model integration. Before generating long-term reanalysis, EARS was validated by continuous simulations of the year 2014. The results indicated that EARS performed better in terms of atmospheric variables and provided more mesoscale details than the large-scale ERA-Interim reanalysis (used as background in EARS), and its outputs can be used for developing a long-term reanalysis product.
2.2 Assimilated data
Various categories of observational data used in EARS are listed in Table 1. The National Meteorological Information Center (NMIC) of the CMA archives all observational datasets after performing strict data quality control. Generally speaking, several steps were used to prepare the input observations. Firstly, the duplicate (in time and location) data reports were merged. Secondly, all the ground-based observations were checked by climatic cut-off values and variation ranges. In addition, internal consistency between meteorological elements and temporal consistency were carried out. Moreover, soundings were examined based on hydrostatic assumption, temperature lapse rate, and horizontal wind shear. The observational data are publicly accessible at http://data.cma.cn/ (last access: 8 January 2023). In particular, the traditional observational datasets have been greatly improved by merging multiple data sources, which are officially released by the NMIC. Note that many of the datasets were not shared publicly before. Figure 3 shows spatial distributions of radiosonde and radar observations, surface observations over land, and surface observations over the ocean. Note that the aircraft and satellite (cloud-derived wind vector) observations are not presented due to irregular moving trajectories depending on time and space.
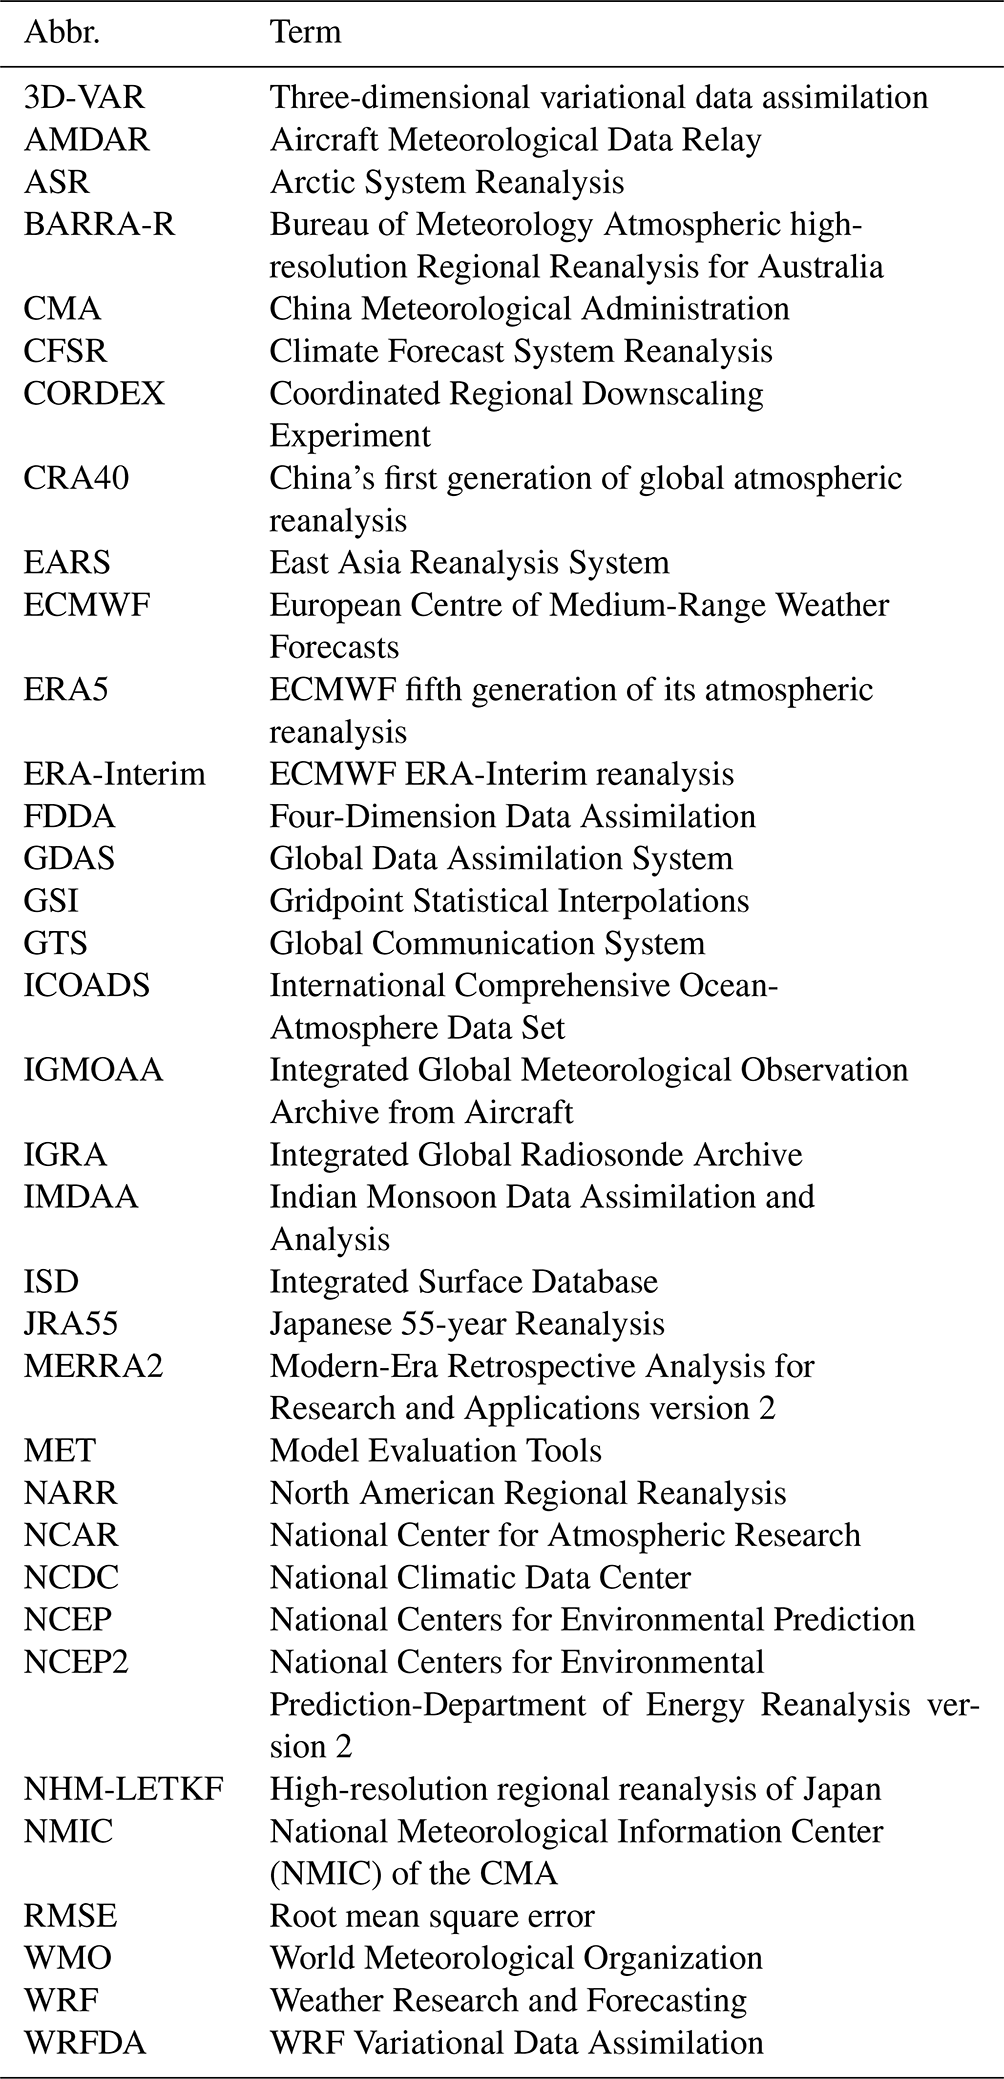
Table 1Observational data used in EARS. Those data are publicly accessible at http://data.cma.cn/ (last access: 8 January 2023).
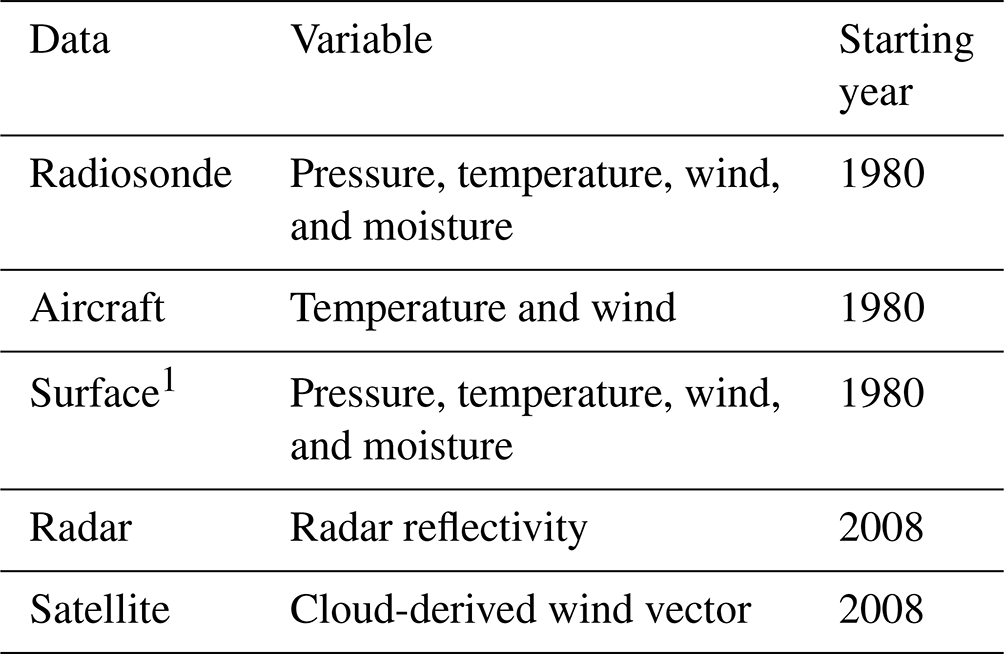
1 Including the surface observations over ocean.
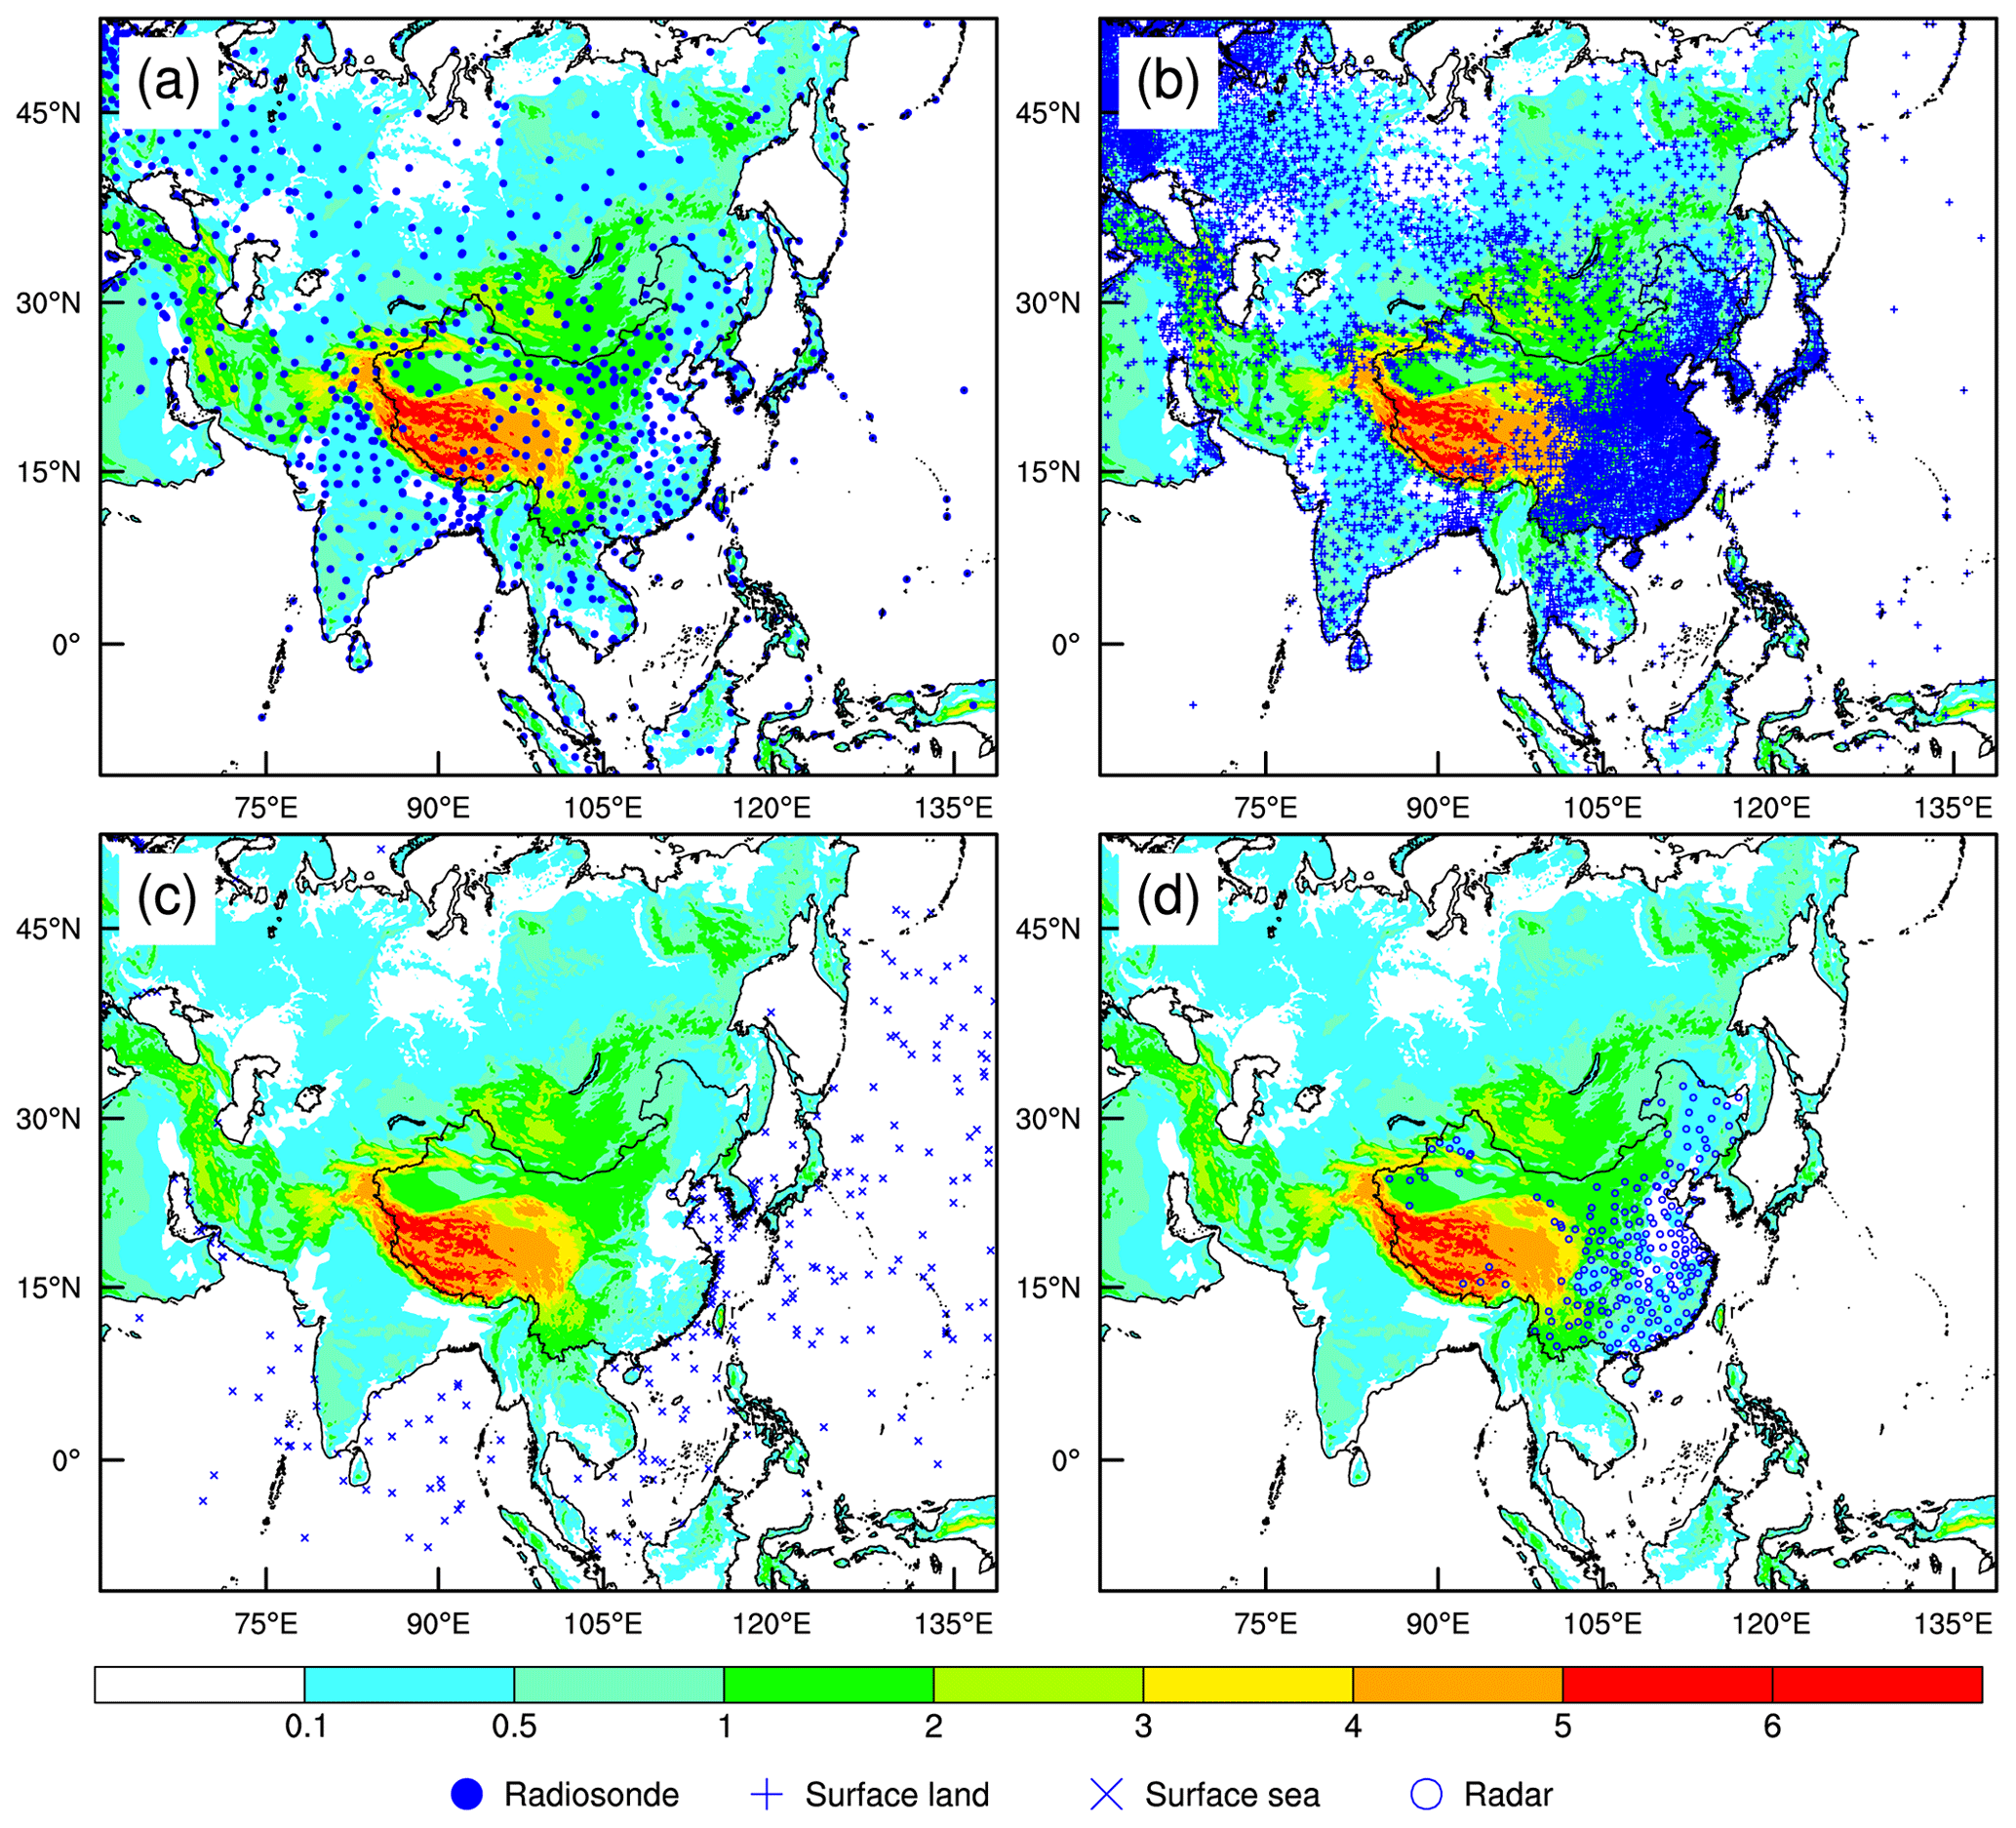
Figure 3Spatial distributions of (a) radiosonde, (b) land, (c) sea, and (d) radar observations for EARS. Shadings denote the height of the terrain in the model.
Previous studies (e.g., Kawai et al., 2017; Benjamin et al., 2010; Lee et al., 2019; Rabier et al., 2009; Ingleby et al., 2016) have confirmed that numerical model performances were enhanced by assimilating radiosonde observations globally. Figure 4 shows the radiosonde observations assimilated in EARS, which has been greatly improved by combining datasets from various databases and employing more observational data sources from China. It can be seen that the counts of radiosonde observations show slight variations from 1980 to 2000 and then increase obviously, almost doubling by 2018. In addition to conventional observations shared in the Global Communication System (GTS) of the World Meteorological Organization (WMO), another 33 radiosonde stations in China are incorporated. Most importantly, more vertical-level observations are included by merging logs of old records. Taking the radiosonde observations of the Beijing station at 00:00 UTC on 1 July 2016 as an example (Fig. 5), the merged radiosonde observations show more detailed vertical structures compared to those in the Integrated Global Radiosonde Archive (IGRA) version 2, which is used in the National Center for Atmospheric Research (NCAR) global reanalysis of the Climate Forecast System Reanalysis (CFSR). In addition, radiosonde observations at both 06:00 and 18:00 UTC are used (Fig. 4a and c), although the observations are discontinuous and much fewer than those at 00:00 and 12:00 UTC (Fig. 4b and d). Moreover, radiosonde observations from field experiments are used, including those from the Third Tibetan Plateau Atmospheric Scientific Experiment (TIPEX-III) (P. Zhao et al., 2018) and the Southern China Monsoon Rainfall Experiment (SCMREX) (Luo et al., 2017). Note that these supplementary radiosonde observations were not utilized in any global reanalysis system outside of China. Overall, the number of radiosonde observations assimilated in EARS has increased significantly after combining several sources, especially from 2000 to 2018.
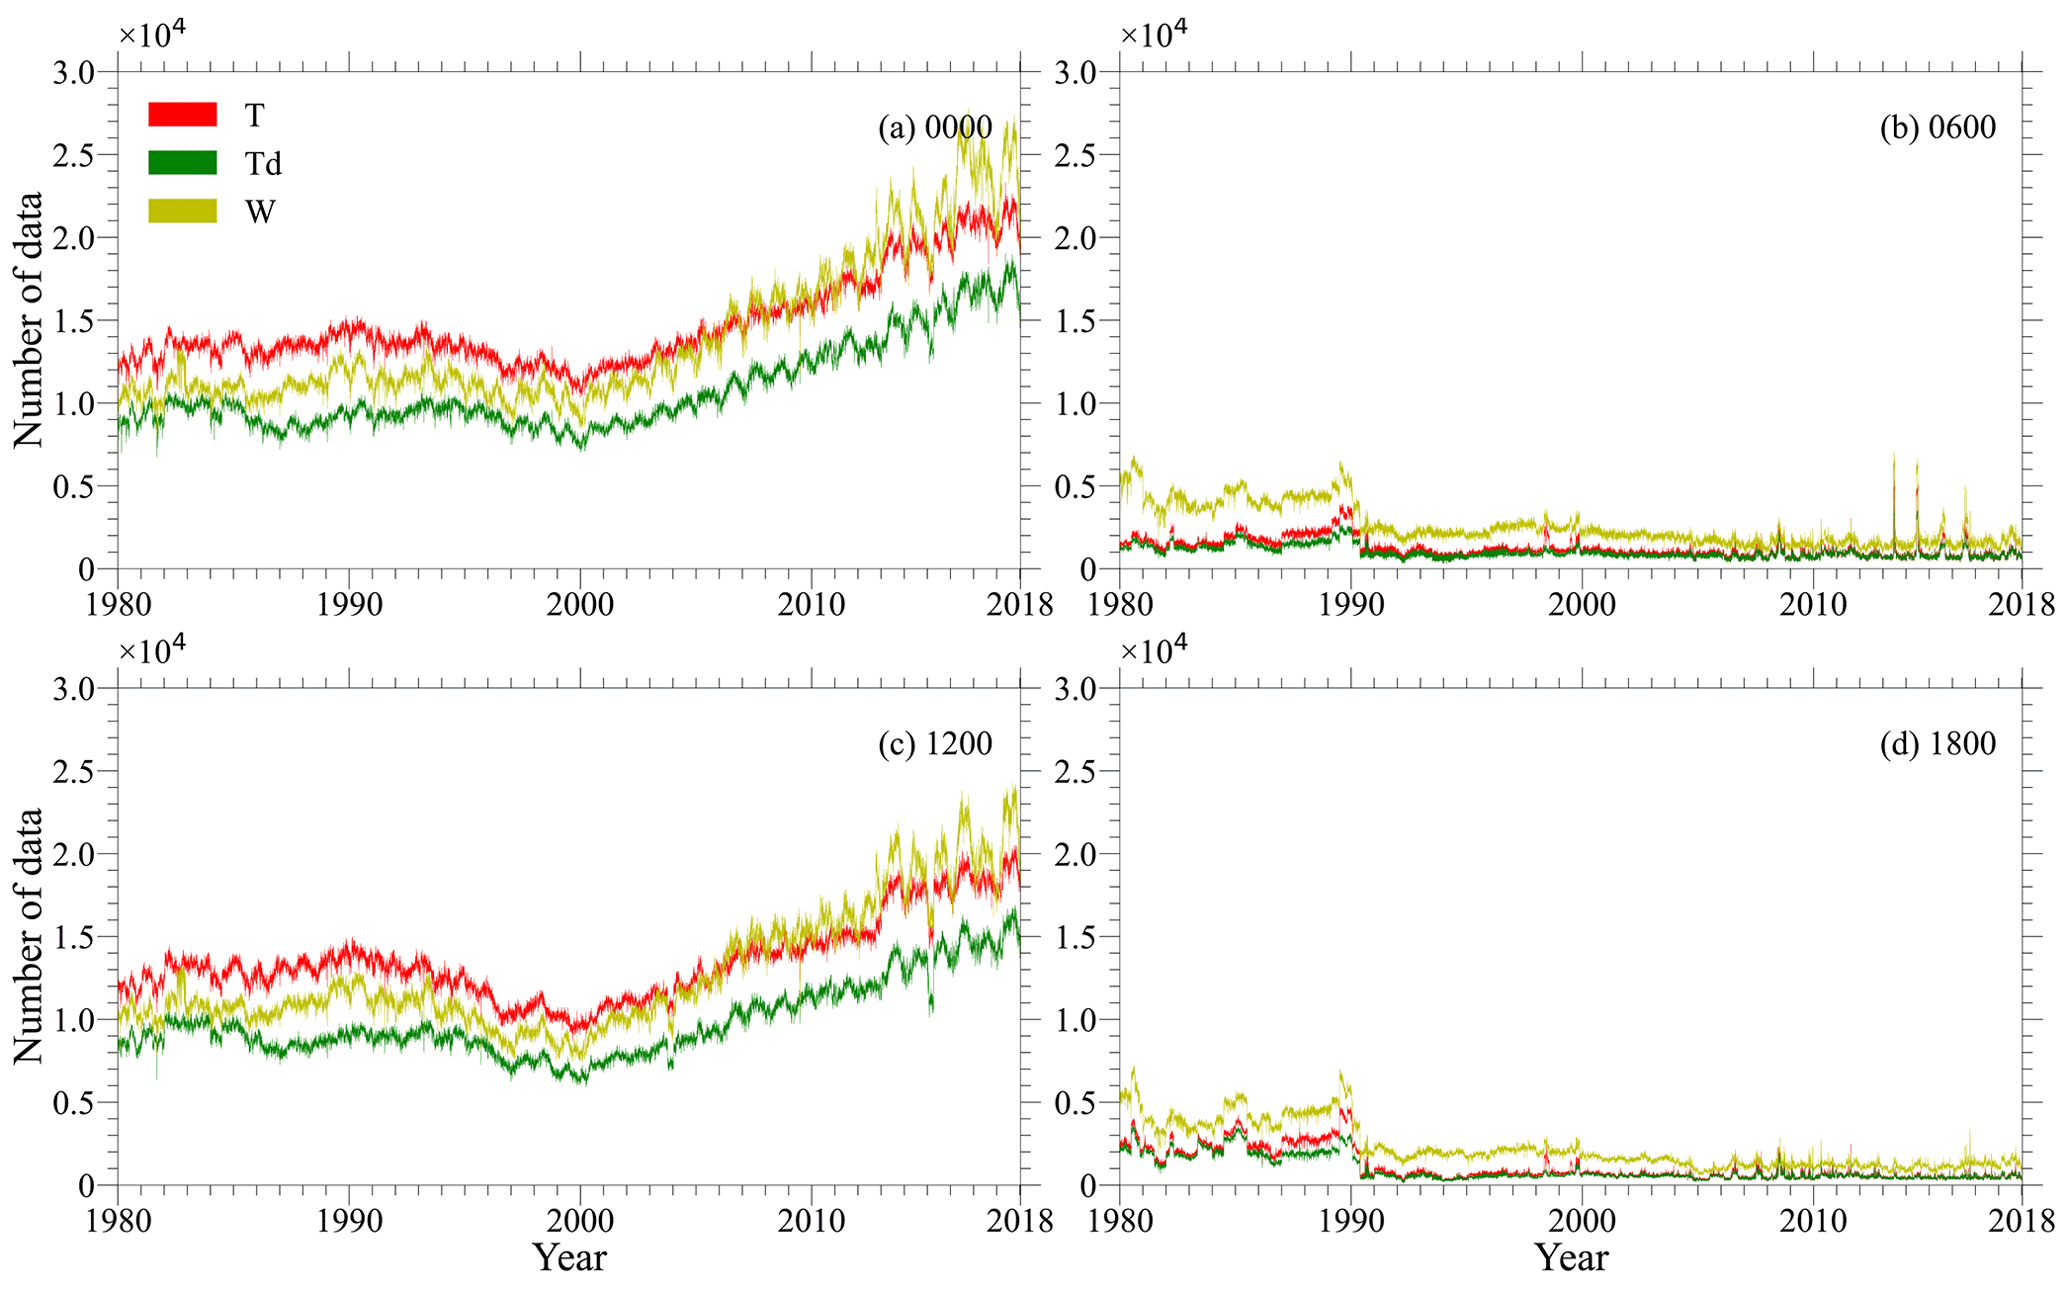
Figure 4Counts of radiosonde observations assimilated in EARS at (a) 00:00, (b) 06:00, (c) 12:00, and (d) 18:00 UTC. T, Td, and W denote temperature, dew temperature, and horizontal wind, respectively.
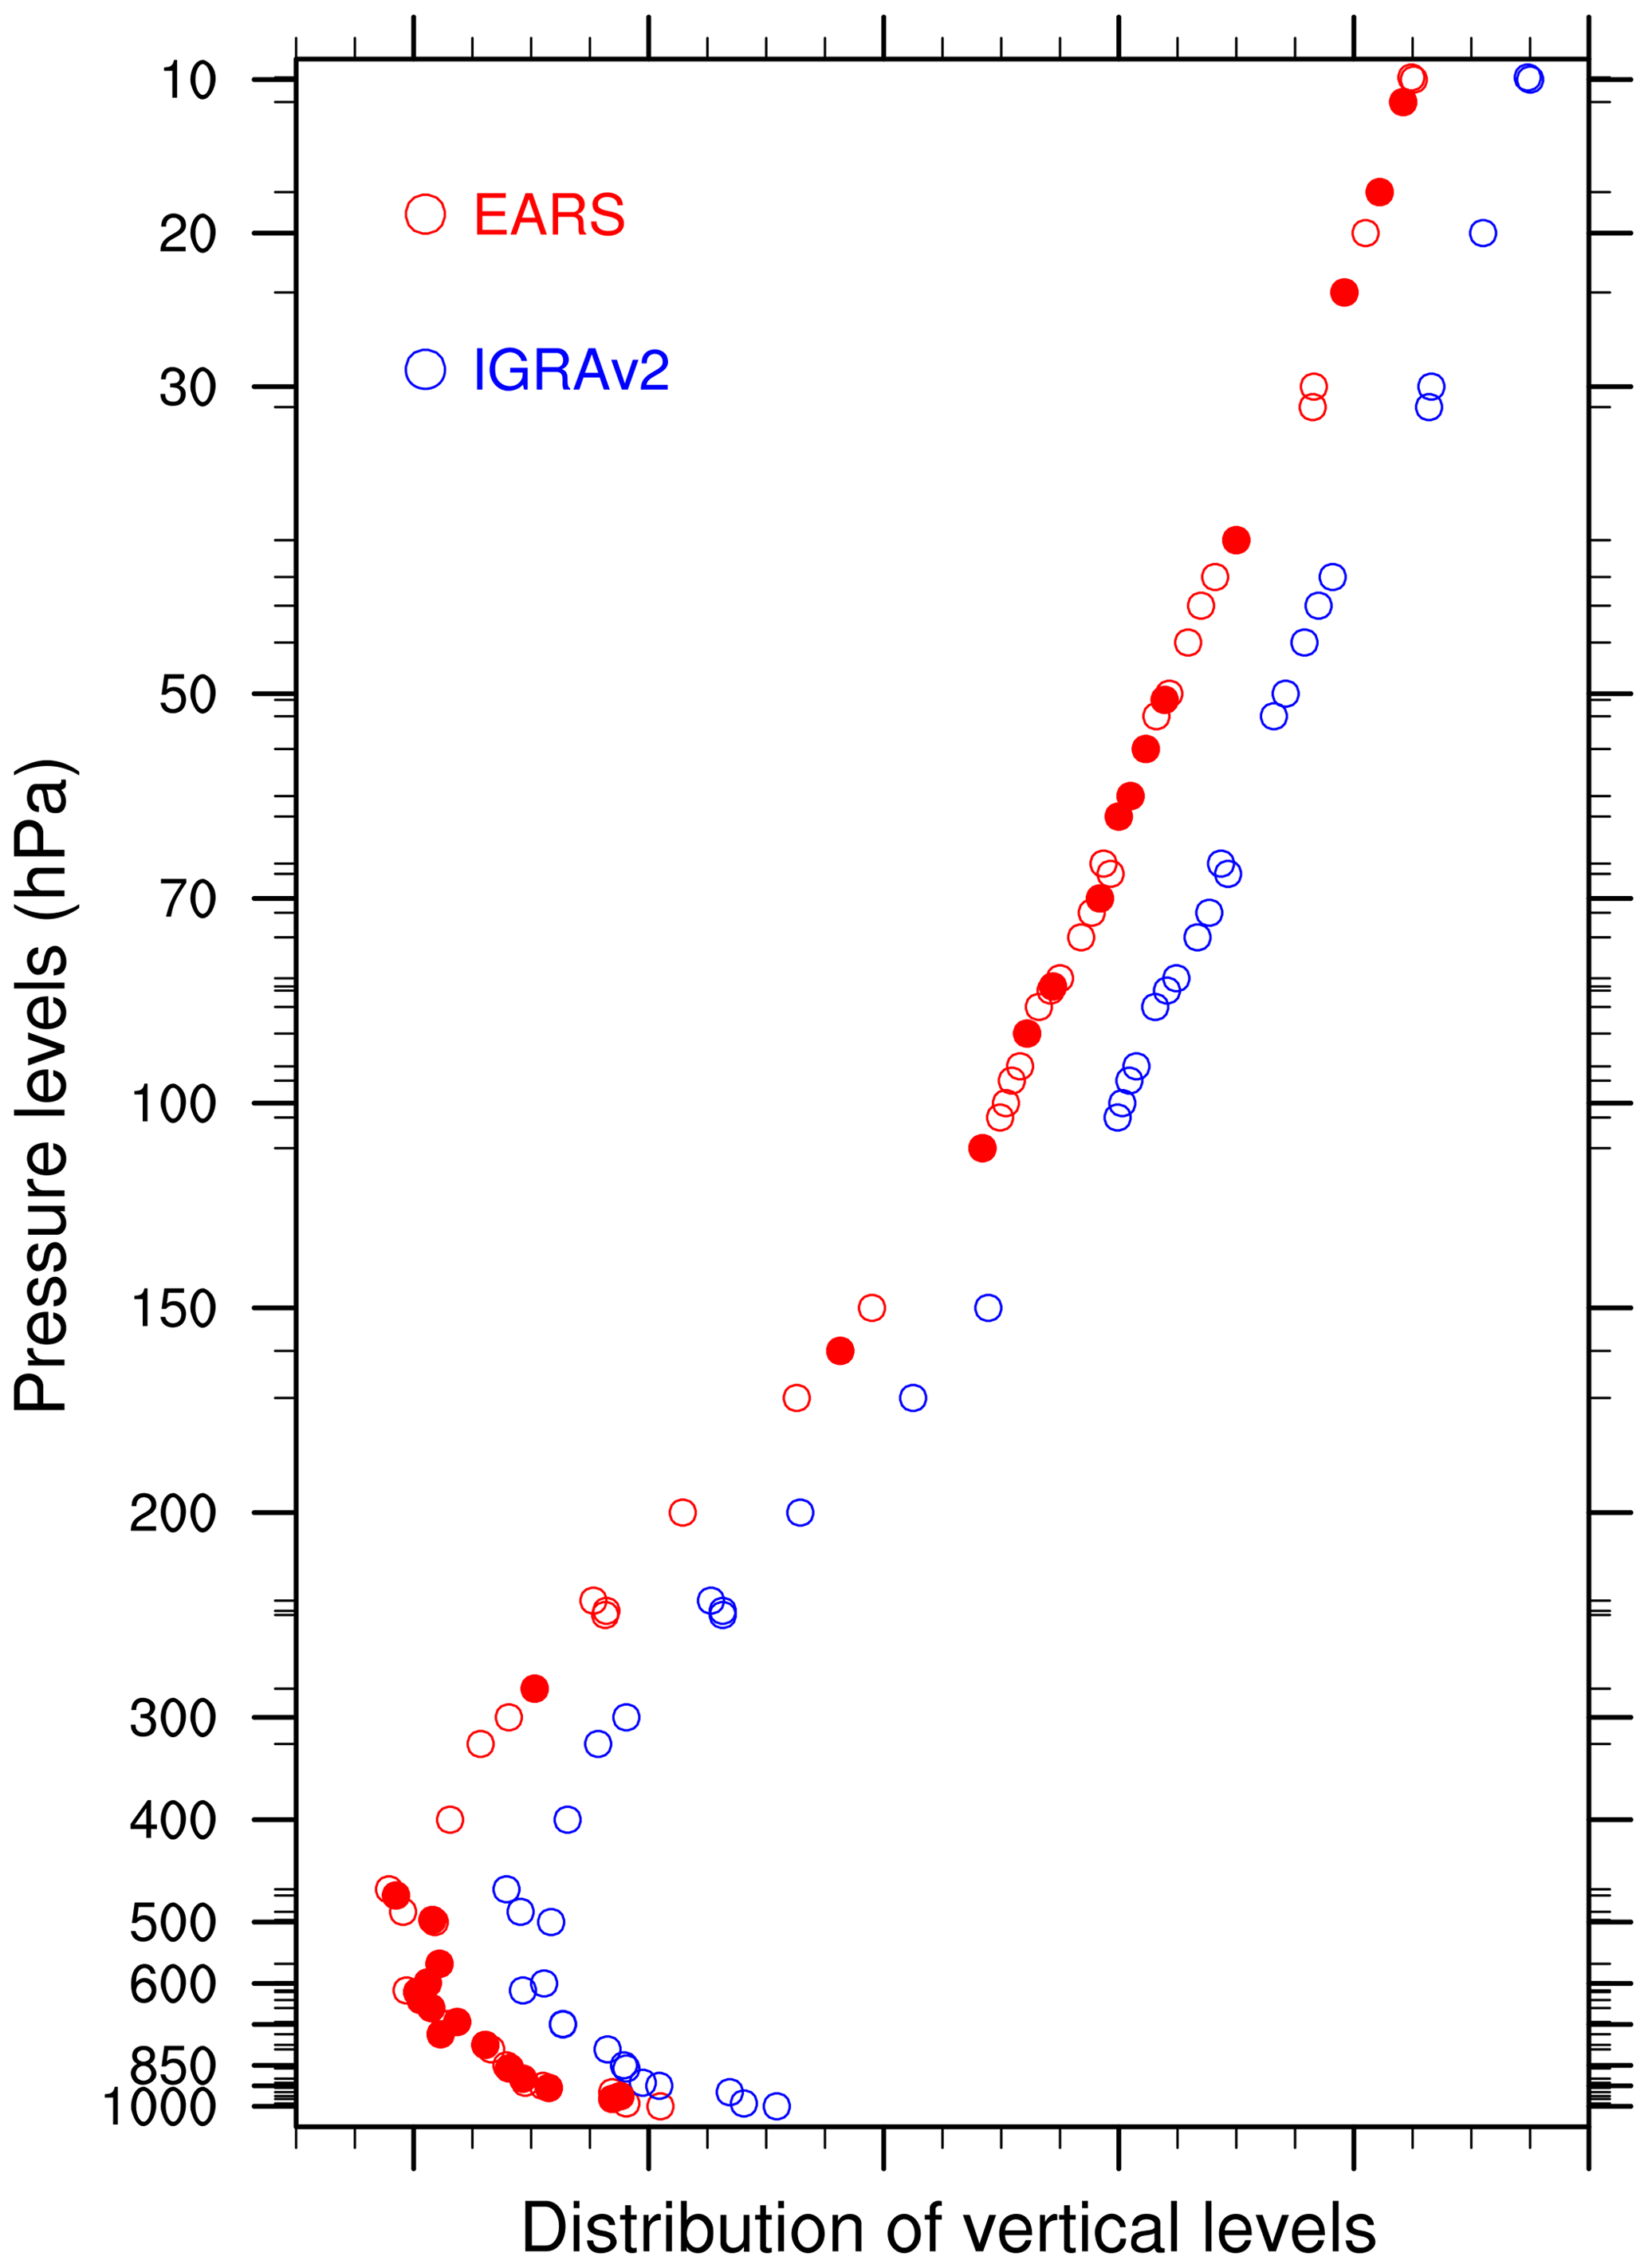
Figure 5Comparison of the merged radiosonde (red) used in EARS and the Integrated Global Radiosonde Archive version 2 (IGRAv2, blue) at Beijing station (54 511) at 00:00 UTC on 1 July 2016. The red dots represent the newly merged paper-based records that have never been used in any atmospheric reanalysis system outside of China. Note that the IGRAv2 profile was shifted to the left to avoid overlaying the two datasets. The two profiles are perfectly overlapped except for newly added observation points.
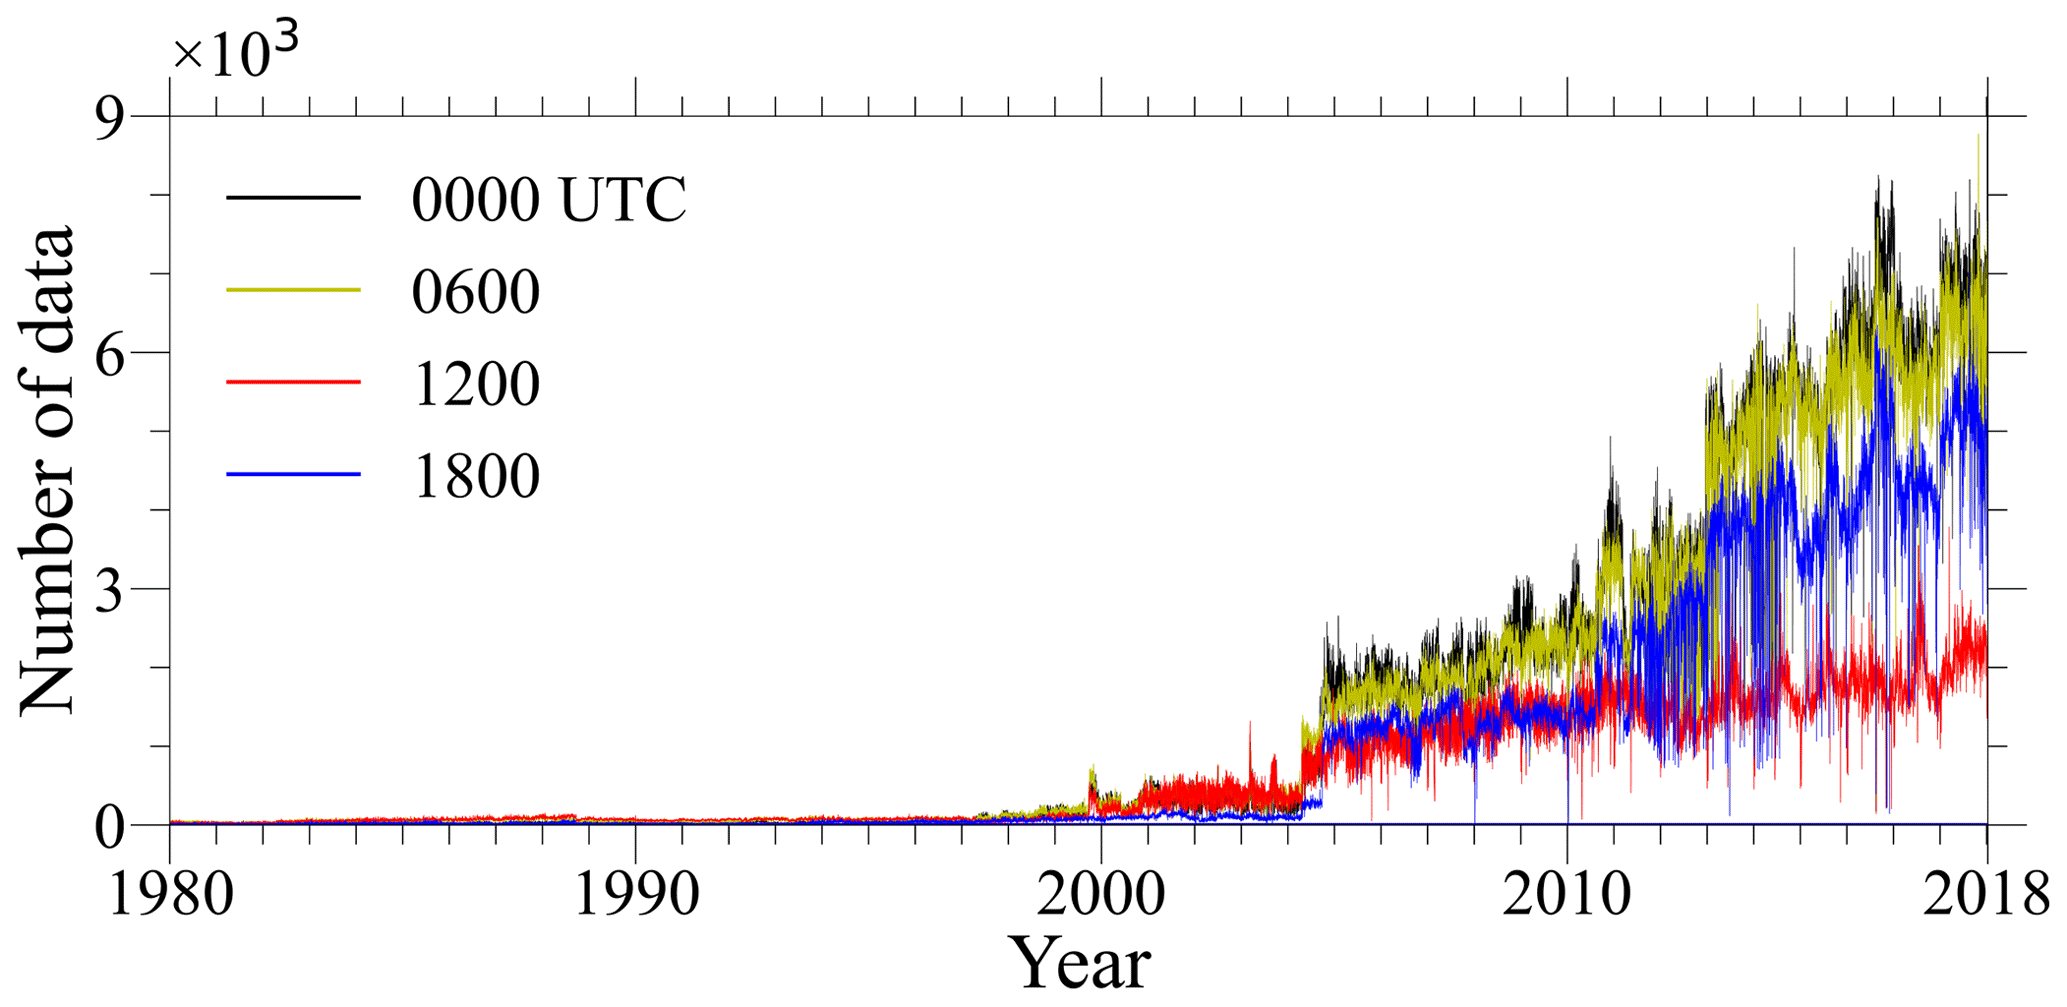
Previous studies (e.g., Mirza et al., 2016; James et al., 2020) indicated that assimilating aircraft observations was beneficial for numerical modeling. The aircraft observations used in EARS are provided by the NMIC after quality control (Liao et al., 2021), which is a new product by integrating nine different data sources into the Integrated Global Meteorological Observation Archive from Aircraft (IGMOAA). Adding the datasets from the Chinese Aircraft Meteorological Data Relay (AMDAR), the observation count has increased significantly compared to that of the IGMOAA. The integrated data were officially released by the NMIC and are updated in real time on the Data-as-a-Service platform (http://data.cma.cn/). Generally speaking, aircraft observations were rare in the early days, and these observations increased greatly from 2×10³ in 2005 to 7×10³ in 2018 (Fig. 6). Although the aircraft observations are hourly, there are large differences at different moments of the day. One can see that the count of aircraft observations in the daytime is much larger than that in the nighttime, though the count of aircraft observations in the nighttime has slightly increased since 2005.
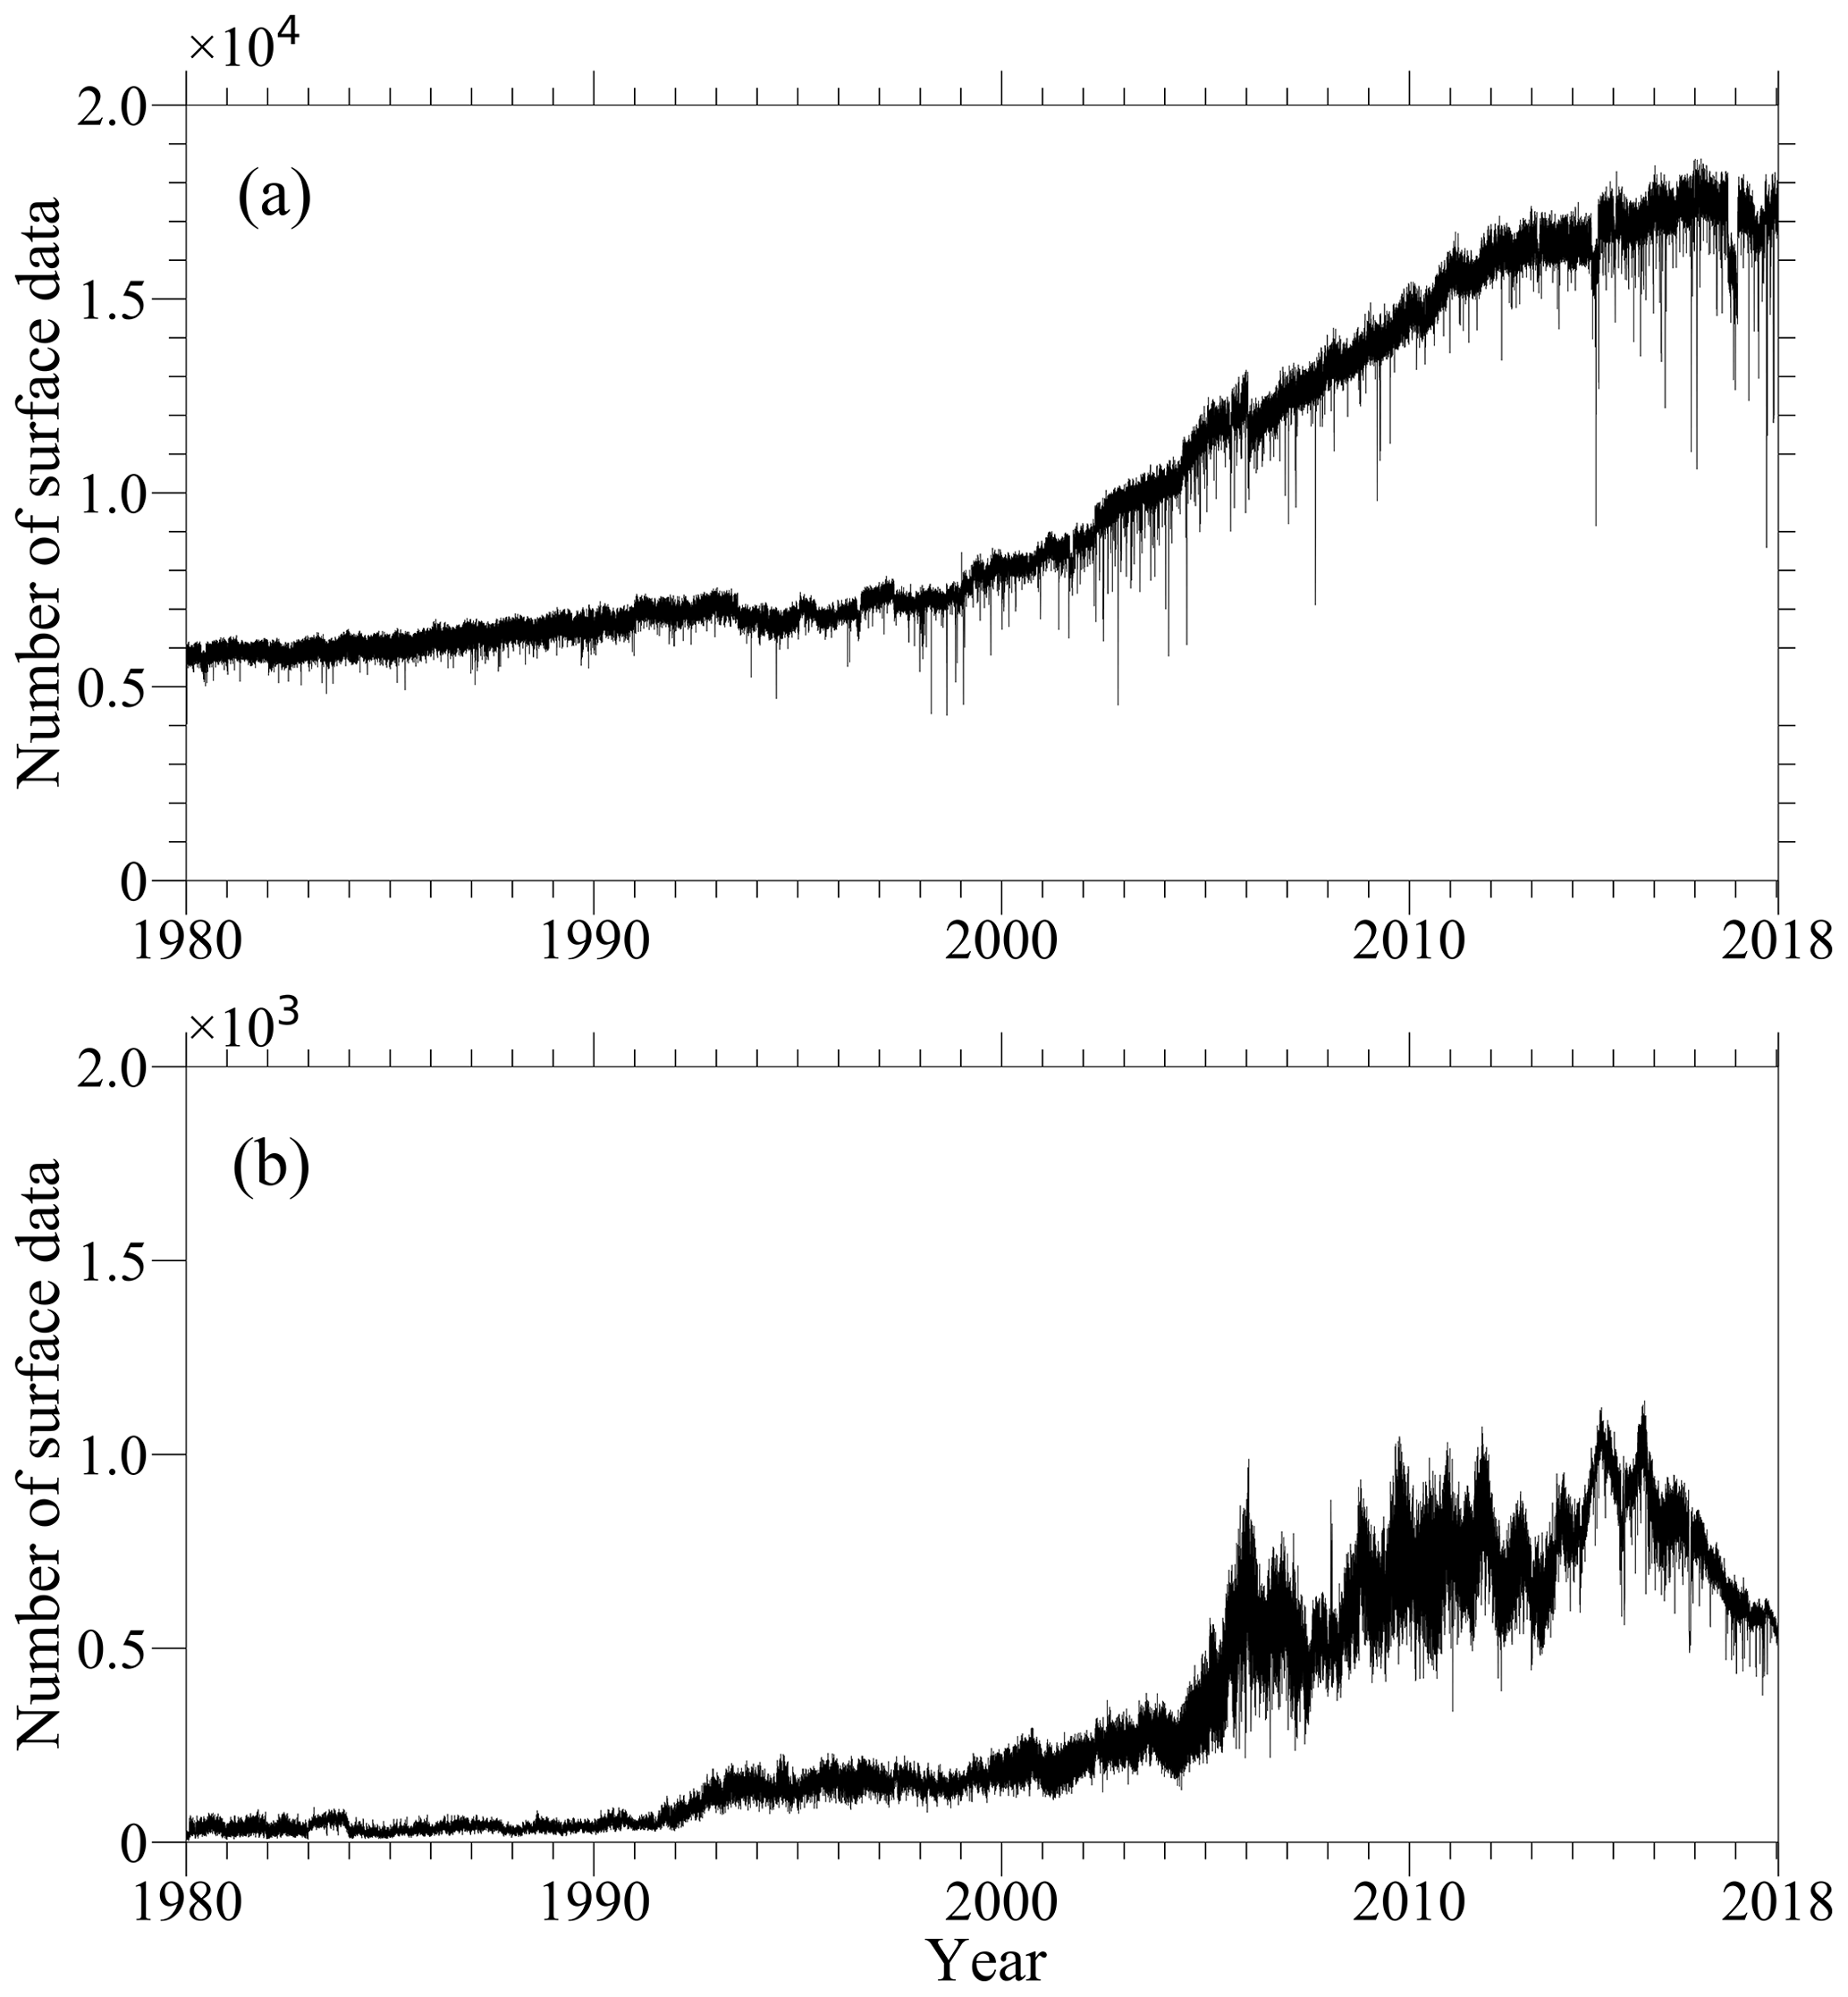
For surface observations over land (Figs. 3b and 7a), in addition to those from the National Centers for Environmental Prediction (NCEP) Global Data Assimilation System (GDAS) and the National Climatic Data Center (NCDC) Integrated Surface Database (ISD), more than 2440 surface observations from the CMA are added. Detailed processing of the datasets can be found in Jiang et al. (2021). Note that only a small portion (less than 300 stations in the early days and nearly 400 stations at present) of the surface observations is shared in the GTS. The observations over the sea surface are combined with the International Comprehensive Ocean-Atmosphere Data Set (ICOADS) (Fig. 3c). After the combination, the ocean-based observation count used in EARS increases by approximately 32 % in total compared to the ICOADS. As shown in Fig. 7b, surface observations have increased significantly, especially since 2000. All the hourly surface observations (over land and ocean) are further quality-controlled by using the OBSGRID module provided by the WRF Variational Data Assimilation (WRFDA), and the outputs in ASCII format are used for observation nudging during the WRF model integration. We pointed the readers to Skamarock et al. (2008) for more details. Similarly, all the upper-level traditional observational datasets are quality-controlled by using the OBSPROC module and are then written in prepBUFR format for GSI assimilation in 3D-VAR mode.
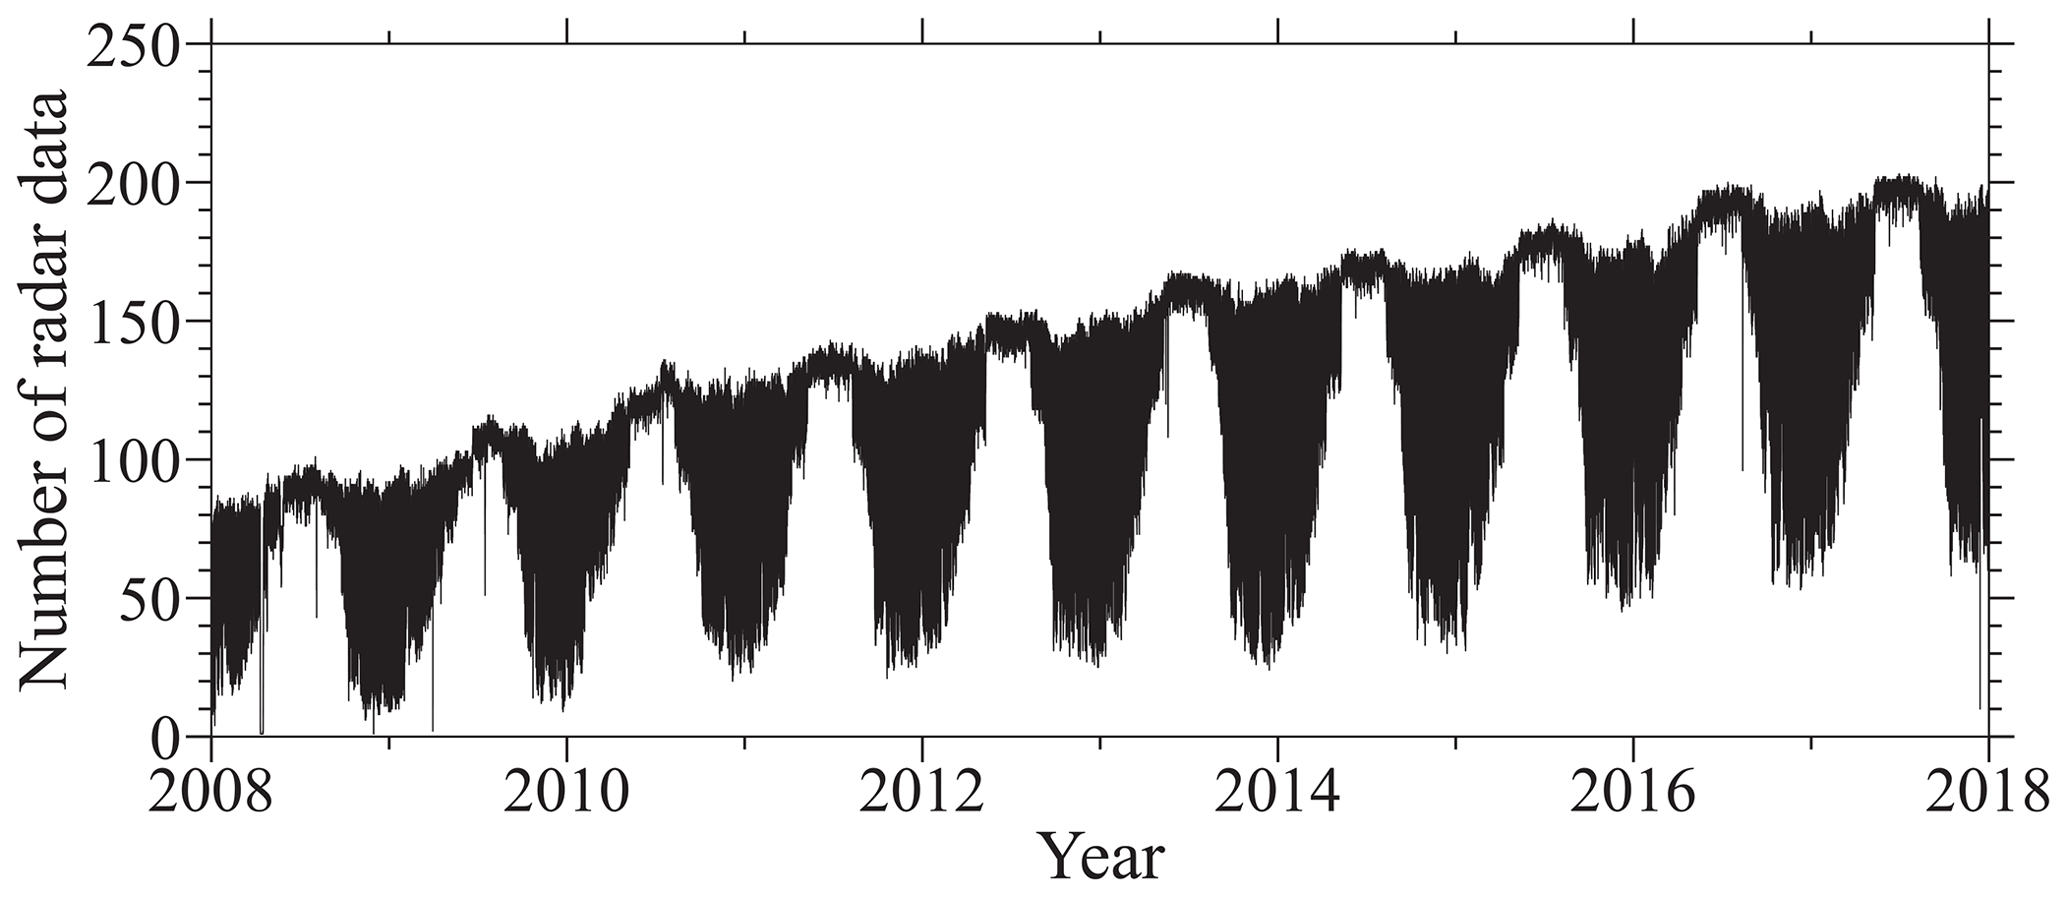
One of the main features of EARS is its emphasis on radar data assimilation. All weather radar observations over China are used in EARS (Fig. 3d). Radar observations have increased rapidly from 80 stations in 2008 to over 190 stations in 2018 (Fig. 8). Note that the radar observations show obvious seasonal variations because some radars were switched off in cold seasons due to the absence of weather processes. To obtain high quality-controlled radar observational data, much attention has been paid to the preprocessing of raw radar data. A major issue of the radar observations is the non-meteorological echo, which has direct influences on the cloud hydrometeors in the GSI cloud analysis processes. In view of this issue, much effort has been devoted to removing isolated non-meteorological echoes and ground clutters from the radar data (Zou et al., 2018), which makes quality-controlled radar data more accurate (Wu et al., 2018). After quality control, all radar observations at the same time are utilized to generate mosaic products in BUFR format, which can be inserted into the GSI cloud reanalysis module. Detailed information about radar data processing and remapping can be found in Zou et al. (2014). The cloud analysis module in GSI came from the Advanced Regional Prediction System (ARPS) (Hu and Xue, 2007) and can be further traced to the Local Analysis and Prediction System (LAPS) (Albers et al., 1996). In fact, quality-controlled radar observations are also an important part of the reanalysis data, which can be used for weather and climate studies as well as numerical model validation. Despite considerable effort expended in processing radial wind, the radial wind has not been assimilated at present, as more work is required.
Another feature is the application of the cloud-derived wind vector datasets from Fengyun-2 geostationary meteorological satellites. The cloud-derived wind vector appears with a count of nearly 6.0×10⁴ (Fig. 9). Note that the data have been strictly quality-controlled and widely applied in daily operational numerical weather prediction in China; thus, these datasets can be applied directly in EARS.
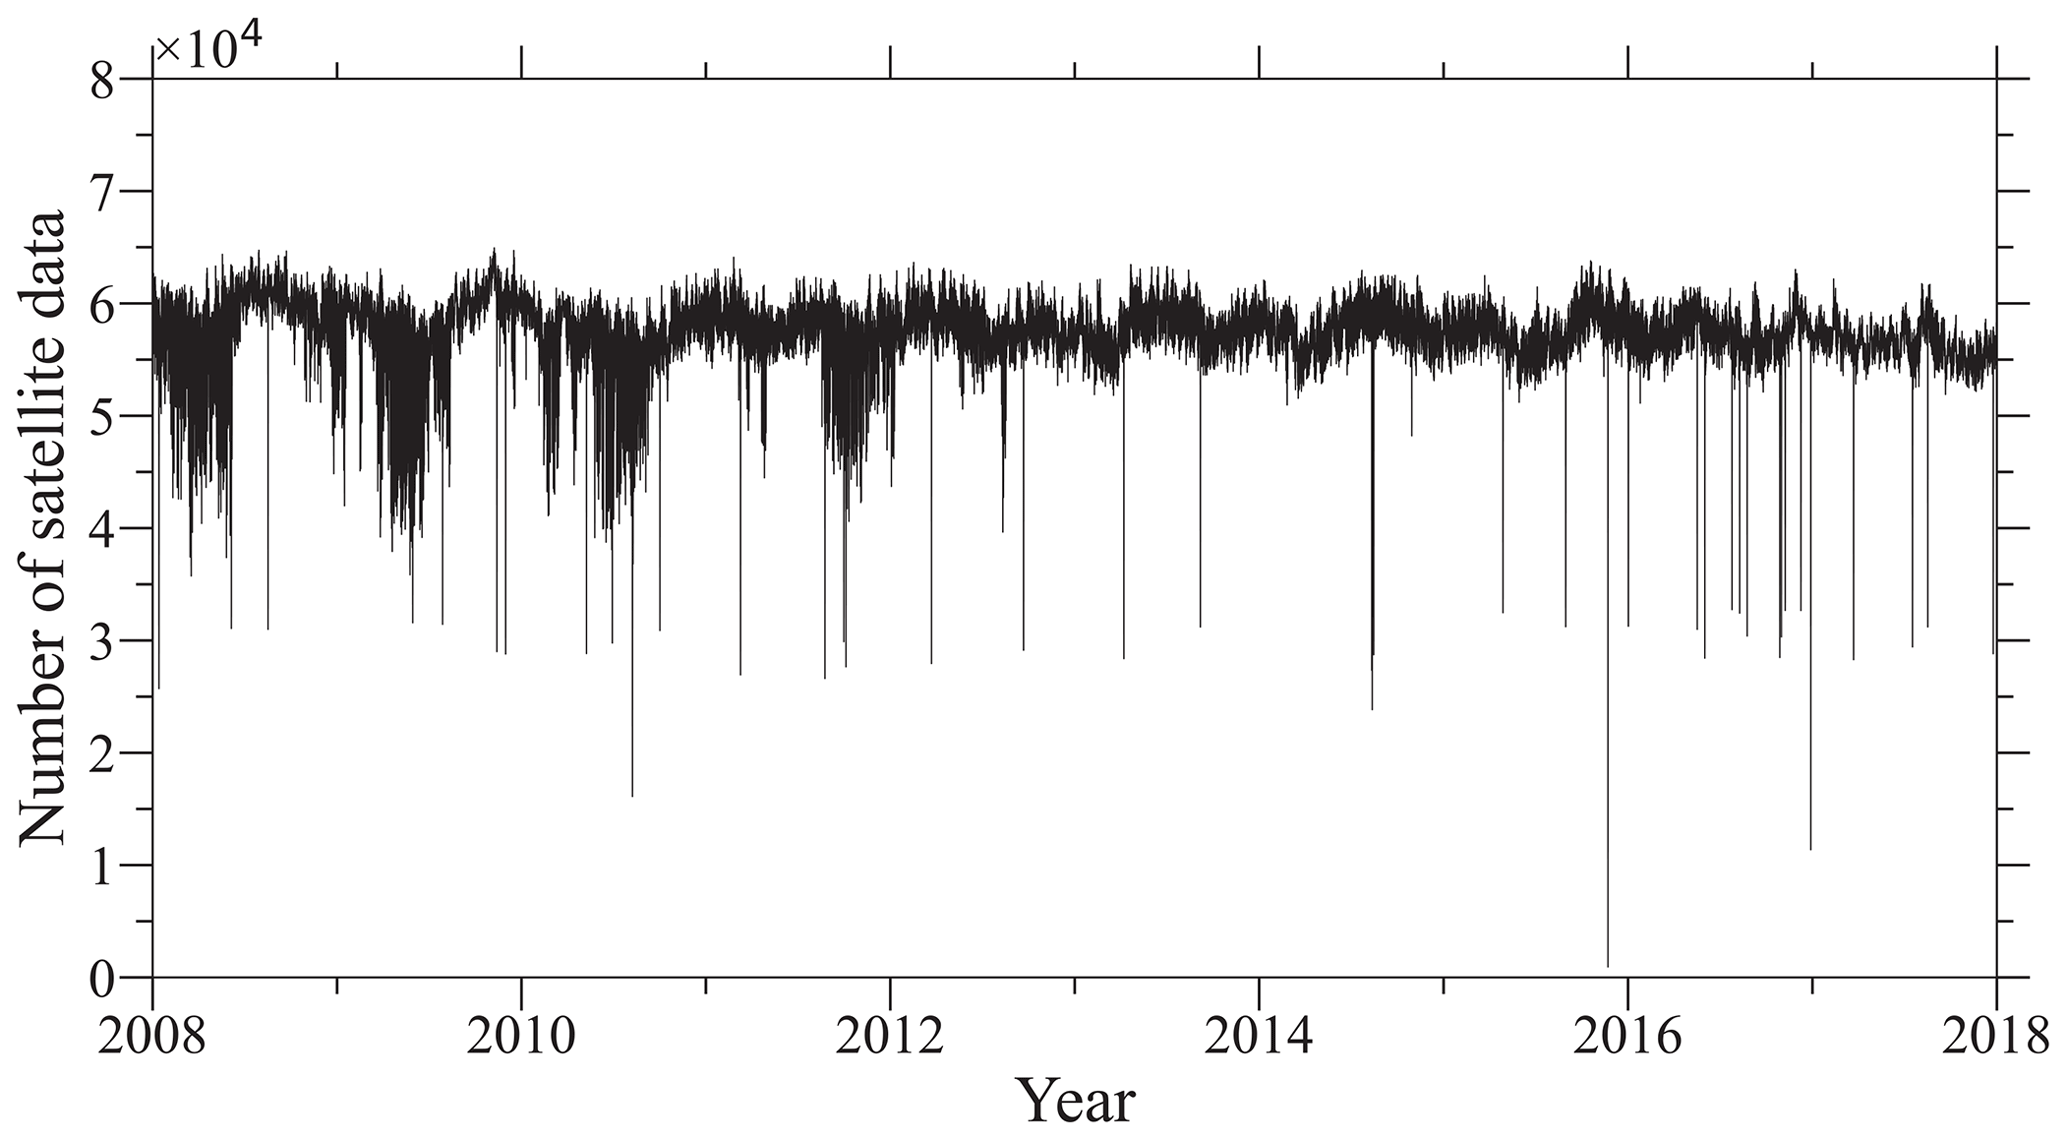
Figure 9Counts of cloud-derived wind vectors from the Fengyun-2 (FY-2) geostationary meteorological satellite observations, which are used in EARS.
2.3 Validation data and method
The performance of EARS is assessed by comparing it with observations and with the large-scale forcing of the ERA-Interim reanalysis (used as the background of EARS). A 10-year good-quality and stable number of observations is selected for the assessment. For comparison with station observations, results from EARS and ERA-Interim are interpolated onto the stations using the nearest-neighbor interpolation via the Model Evaluation Tools (MET), which is developed by the Developmental Testbed Center (DTC) of the United States (Newman et al., 2022). Following the operational model evaluations of the CMA, we use a total of 2423 surface observational stations as the reference for the reanalysis data validation. The observations over the Qinghai–Tibet Plateau and its surrounding areas are much sparser compared to those over the other regions (Fig. 10a). Similarly, a total of 120 radiosonde data over China are used to evaluate high-level variables (Fig. 10b). As has been stated above, the radiosonde observations are mainly obtained at 00:00 and 12:00 UTC, and the measurements include temperature, (relative) humidity (or dew temperature), air pressure, horizontal wind speed, and direction. It should be noted that the present validation is based on the observations from the CMA. Although EARS covers a large area, only limited observations out of China were obtained by the GTS. Comparatively speaking, the density of observations is much higher in China than that outside of China. In addition, the performance of observations in China is at a comparable level because of the same (at least equivalent) observational instruments and methods. Moreover, the observations in China were quality-controlled using the same methods. Therefore, the observations in China were used in the validation. We welcome more validation from others with observations outside of China as much as possible.
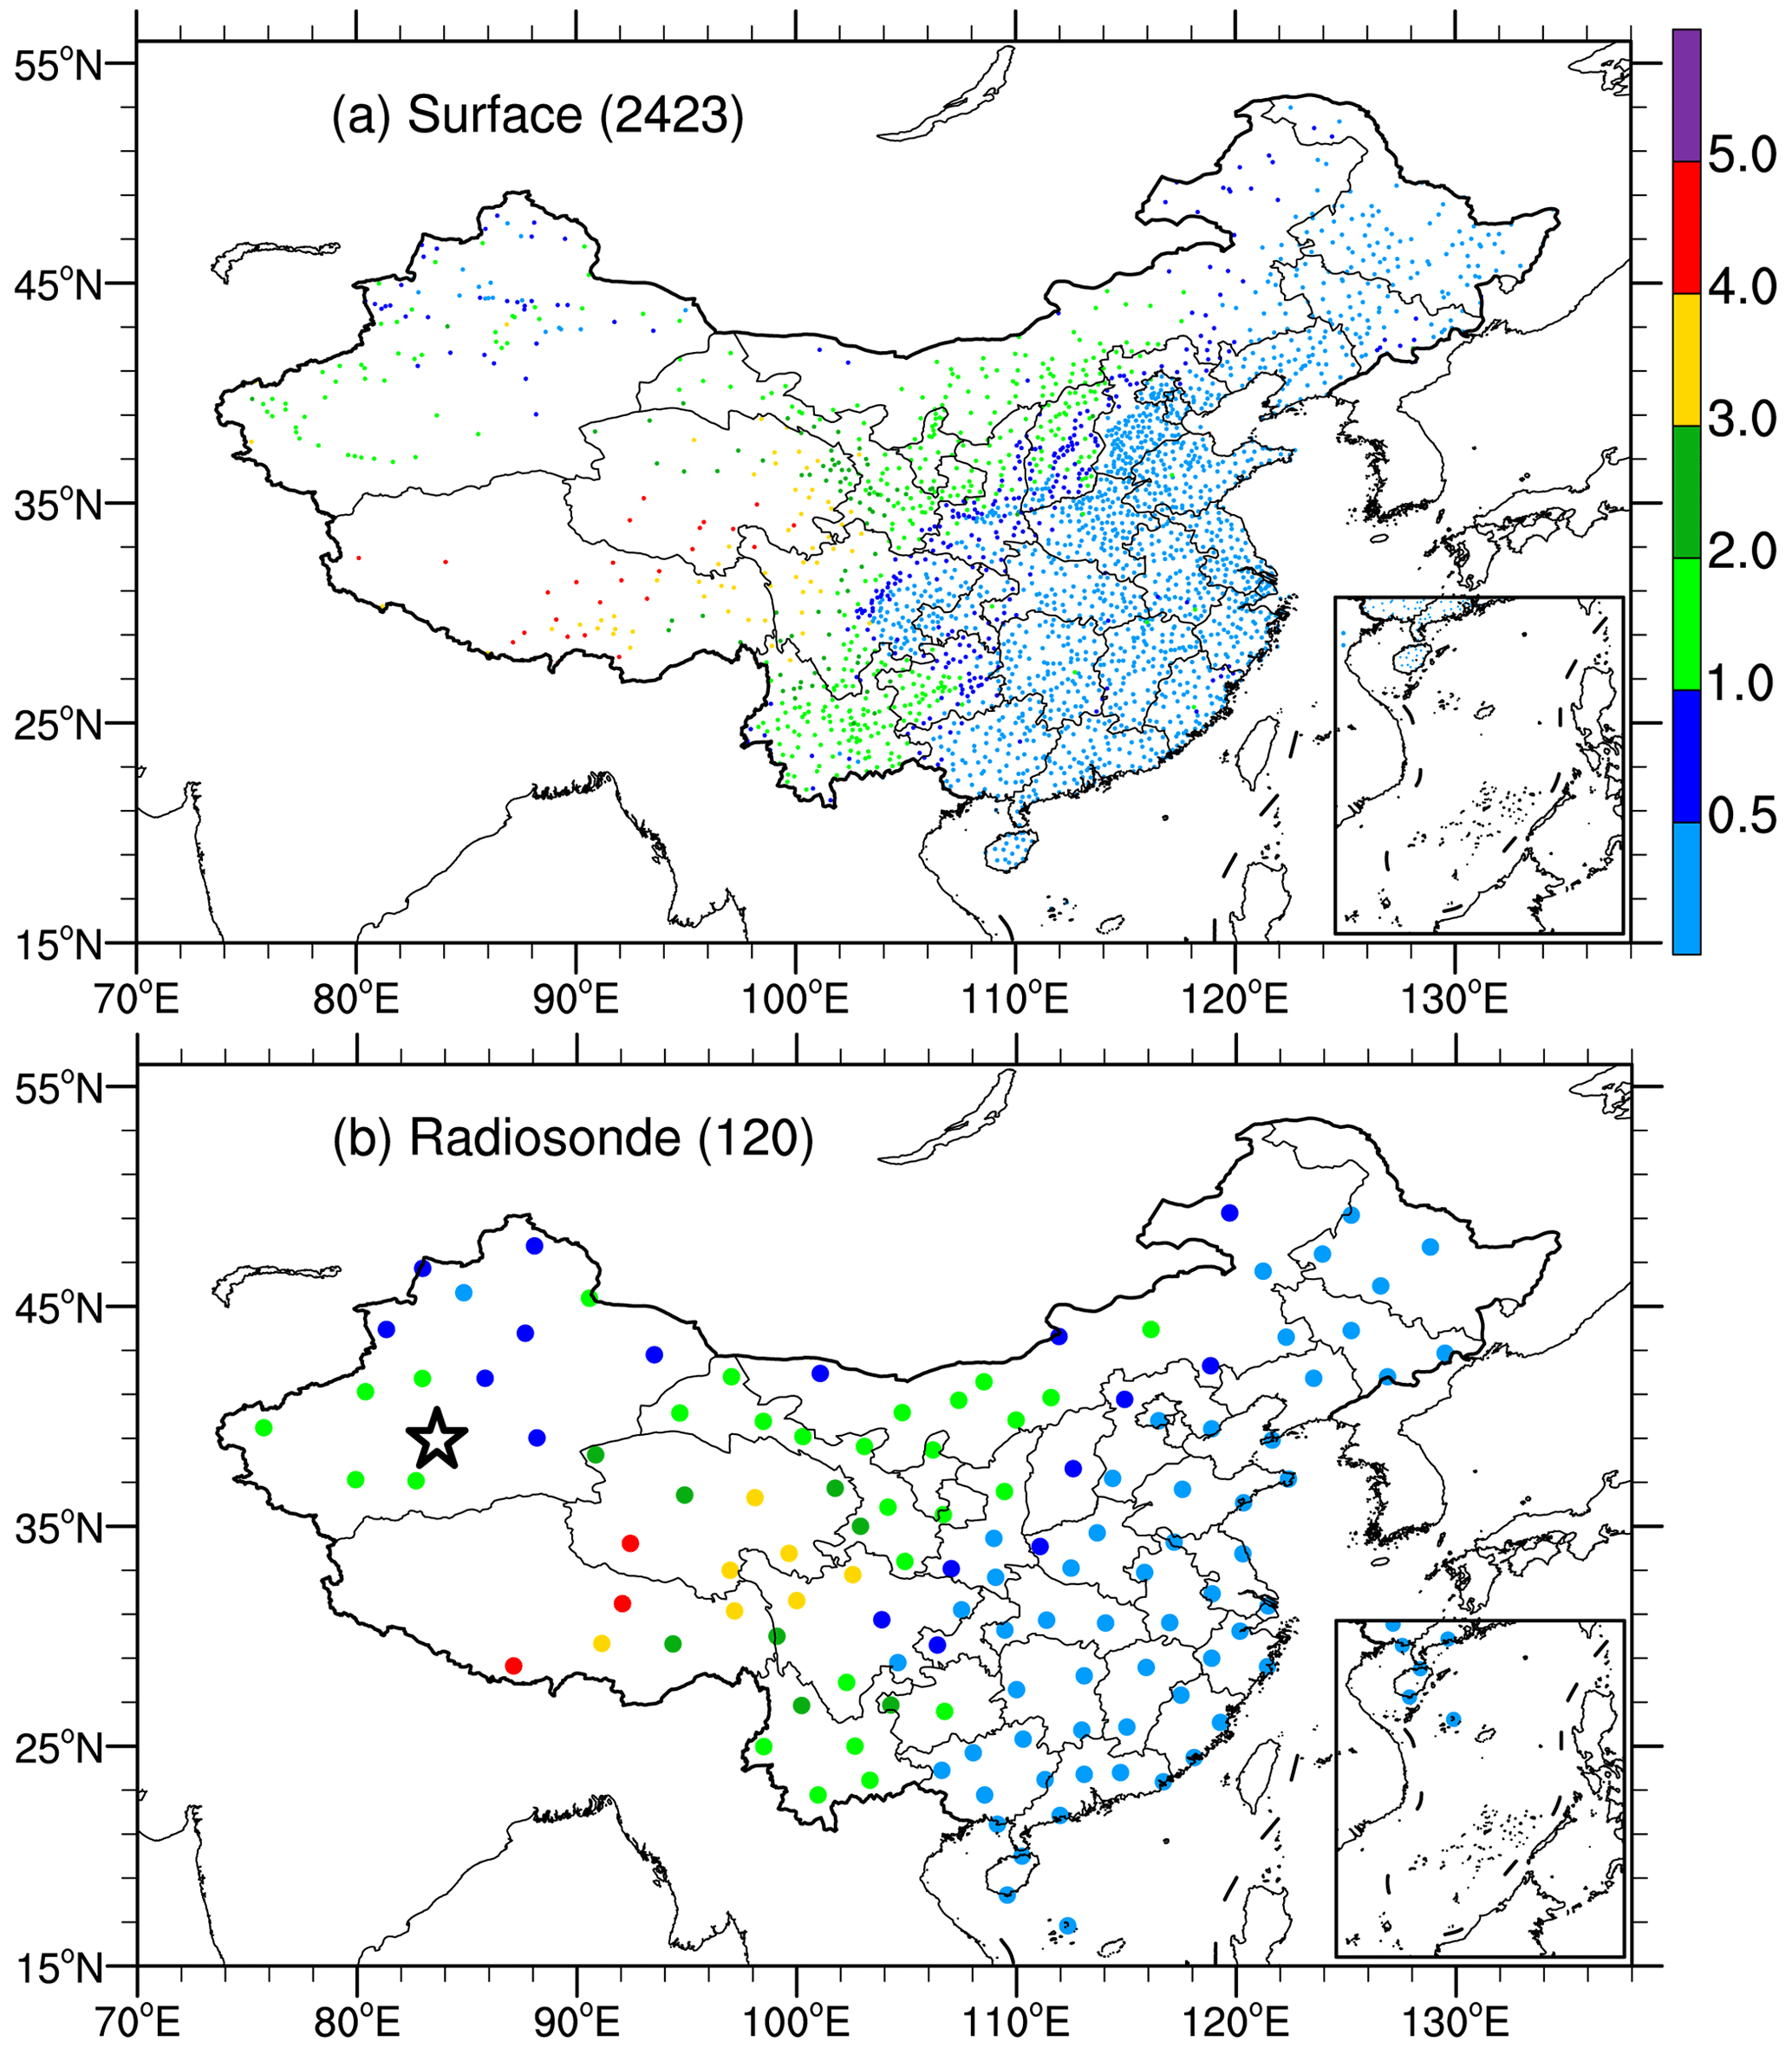
Figure 10Spatial distributions of selected (a) surface and (b) radiosonde stations for verification. The number in parentheses is the observational count. The color of the dot indicates terrain (km). In panel (b), the star denotes the location of a radiosonde observational field experiment in the central Taklimakan Desert, China.
The quality of the regional reanalysis is also compared to 1-month (July 2016) continuous radiosonde observational data, which were obtained from a field experiment in the central Taklimakan Desert, Xinjiang Uygur Autonomous Region, China. The central Taklimakan Desert is far from other observation sites, where the assimilated observations have little influence on the reanalysis data. Note that these data have not been applied to any weather forecasting or reanalysis systems (including global and regional systems), which should be an excellent source of independent observations (Huang et al., 2021). The radiosonde observational station (marked with a black star in Fig. 10b) is located at (83.63∘ E, 39.04∘ N), 1099.3 m a.s.l. (above sea level). The radiosonde observational data were collected four times at 00:00, 06:00, 12:00, and 18:00 local standard time (LST, ) a day in July 2016 using the Global Positioning System (GPS)-based radiosonde. One of the advantages of the radiosonde observation is its high vertical resolution, which is achieved by high-frequency (at intervals of 1 s) data acquisition during balloon ascent.
To assess the new EARS data, we compare them with surface and radiosonde observations in terms of root mean square error (RMSE), given by
where N is the total number of all observations, and Fi and Oi denote reanalysis data and observation, respectively.
We use RMSE(EARS) and RMSE(ERA-I) to represent the RMSEs for the regional EARS and global ERA-Interim, respectively. The fractional percentage improvement (I) of the RMSE can be defined as follows:
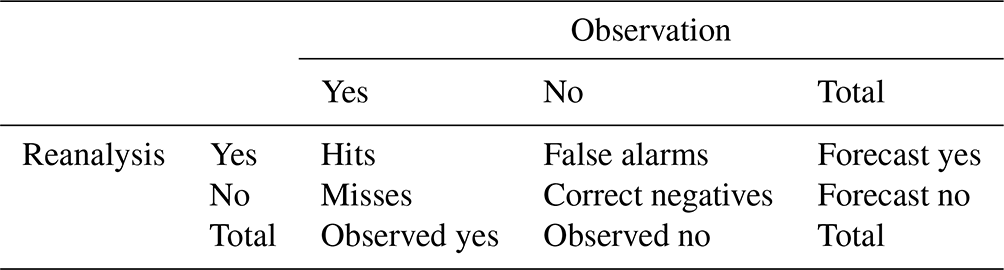
Accuracy is perhaps the most widely used objective validation method for quantitative precipitation forecasts. Following the MET verification measures for categorical (dichotomous) variables, we employ a table of 2×2 contingency (Table 2). The accuracy of precipitation forecast is defined by
The accuracy ranges from 0 to 1, and a perfect forecast would have an accuracy of 1.
Table 2Contingency table for categorical (dichotomous) variables.
3.1 Performance of the surface field
Figure 11 compares 10-year-averaged RMSEs of surface variables from EARS and ERA-Interim using box-percentile plots. For EARS, the averaged RMSEs of surface pressure (P), temperature (T), specific humidity (Q), zonal wind (U), meridional wind (V), and wind speed (WS) are 14.11 (± 19.22) hPa, 2.05 (± 1.43) ∘C, 1.18 (± 0.28) g kg−1, 1.76 (± 0.69) m s−1, 1.95 (± 0.63) m s−1, and 2.06 (± 0.58) m s−1, respectively. ERA-Interim has larger averaged RMSEs of P, T, Q, U, V, and WS, which are 24.34 (± 27.17) hPa, 2.25 (± 1.43) ∘C, 1.33 (± 0.35) g kg−1, 1.98 (± 0.58) m s−1, 2.35 (± 0.70) m s−1, and 2.42 (± 0.51) m s−1, respectively. In terms of the RMSE, EARS performs much better, with respective improvement percentages of 42.01 %, 8.82 %, 11.28 %, 11.37 %, 16.96 %, and 14.75 % for P, T, Q, U, V, and WS, respectively. Generally speaking, P has the largest improvement, followed by V, U, and Q, and T has the smallest improvement. Similarly, the 25th, 50th, and 75th percentiles show obvious improvements.
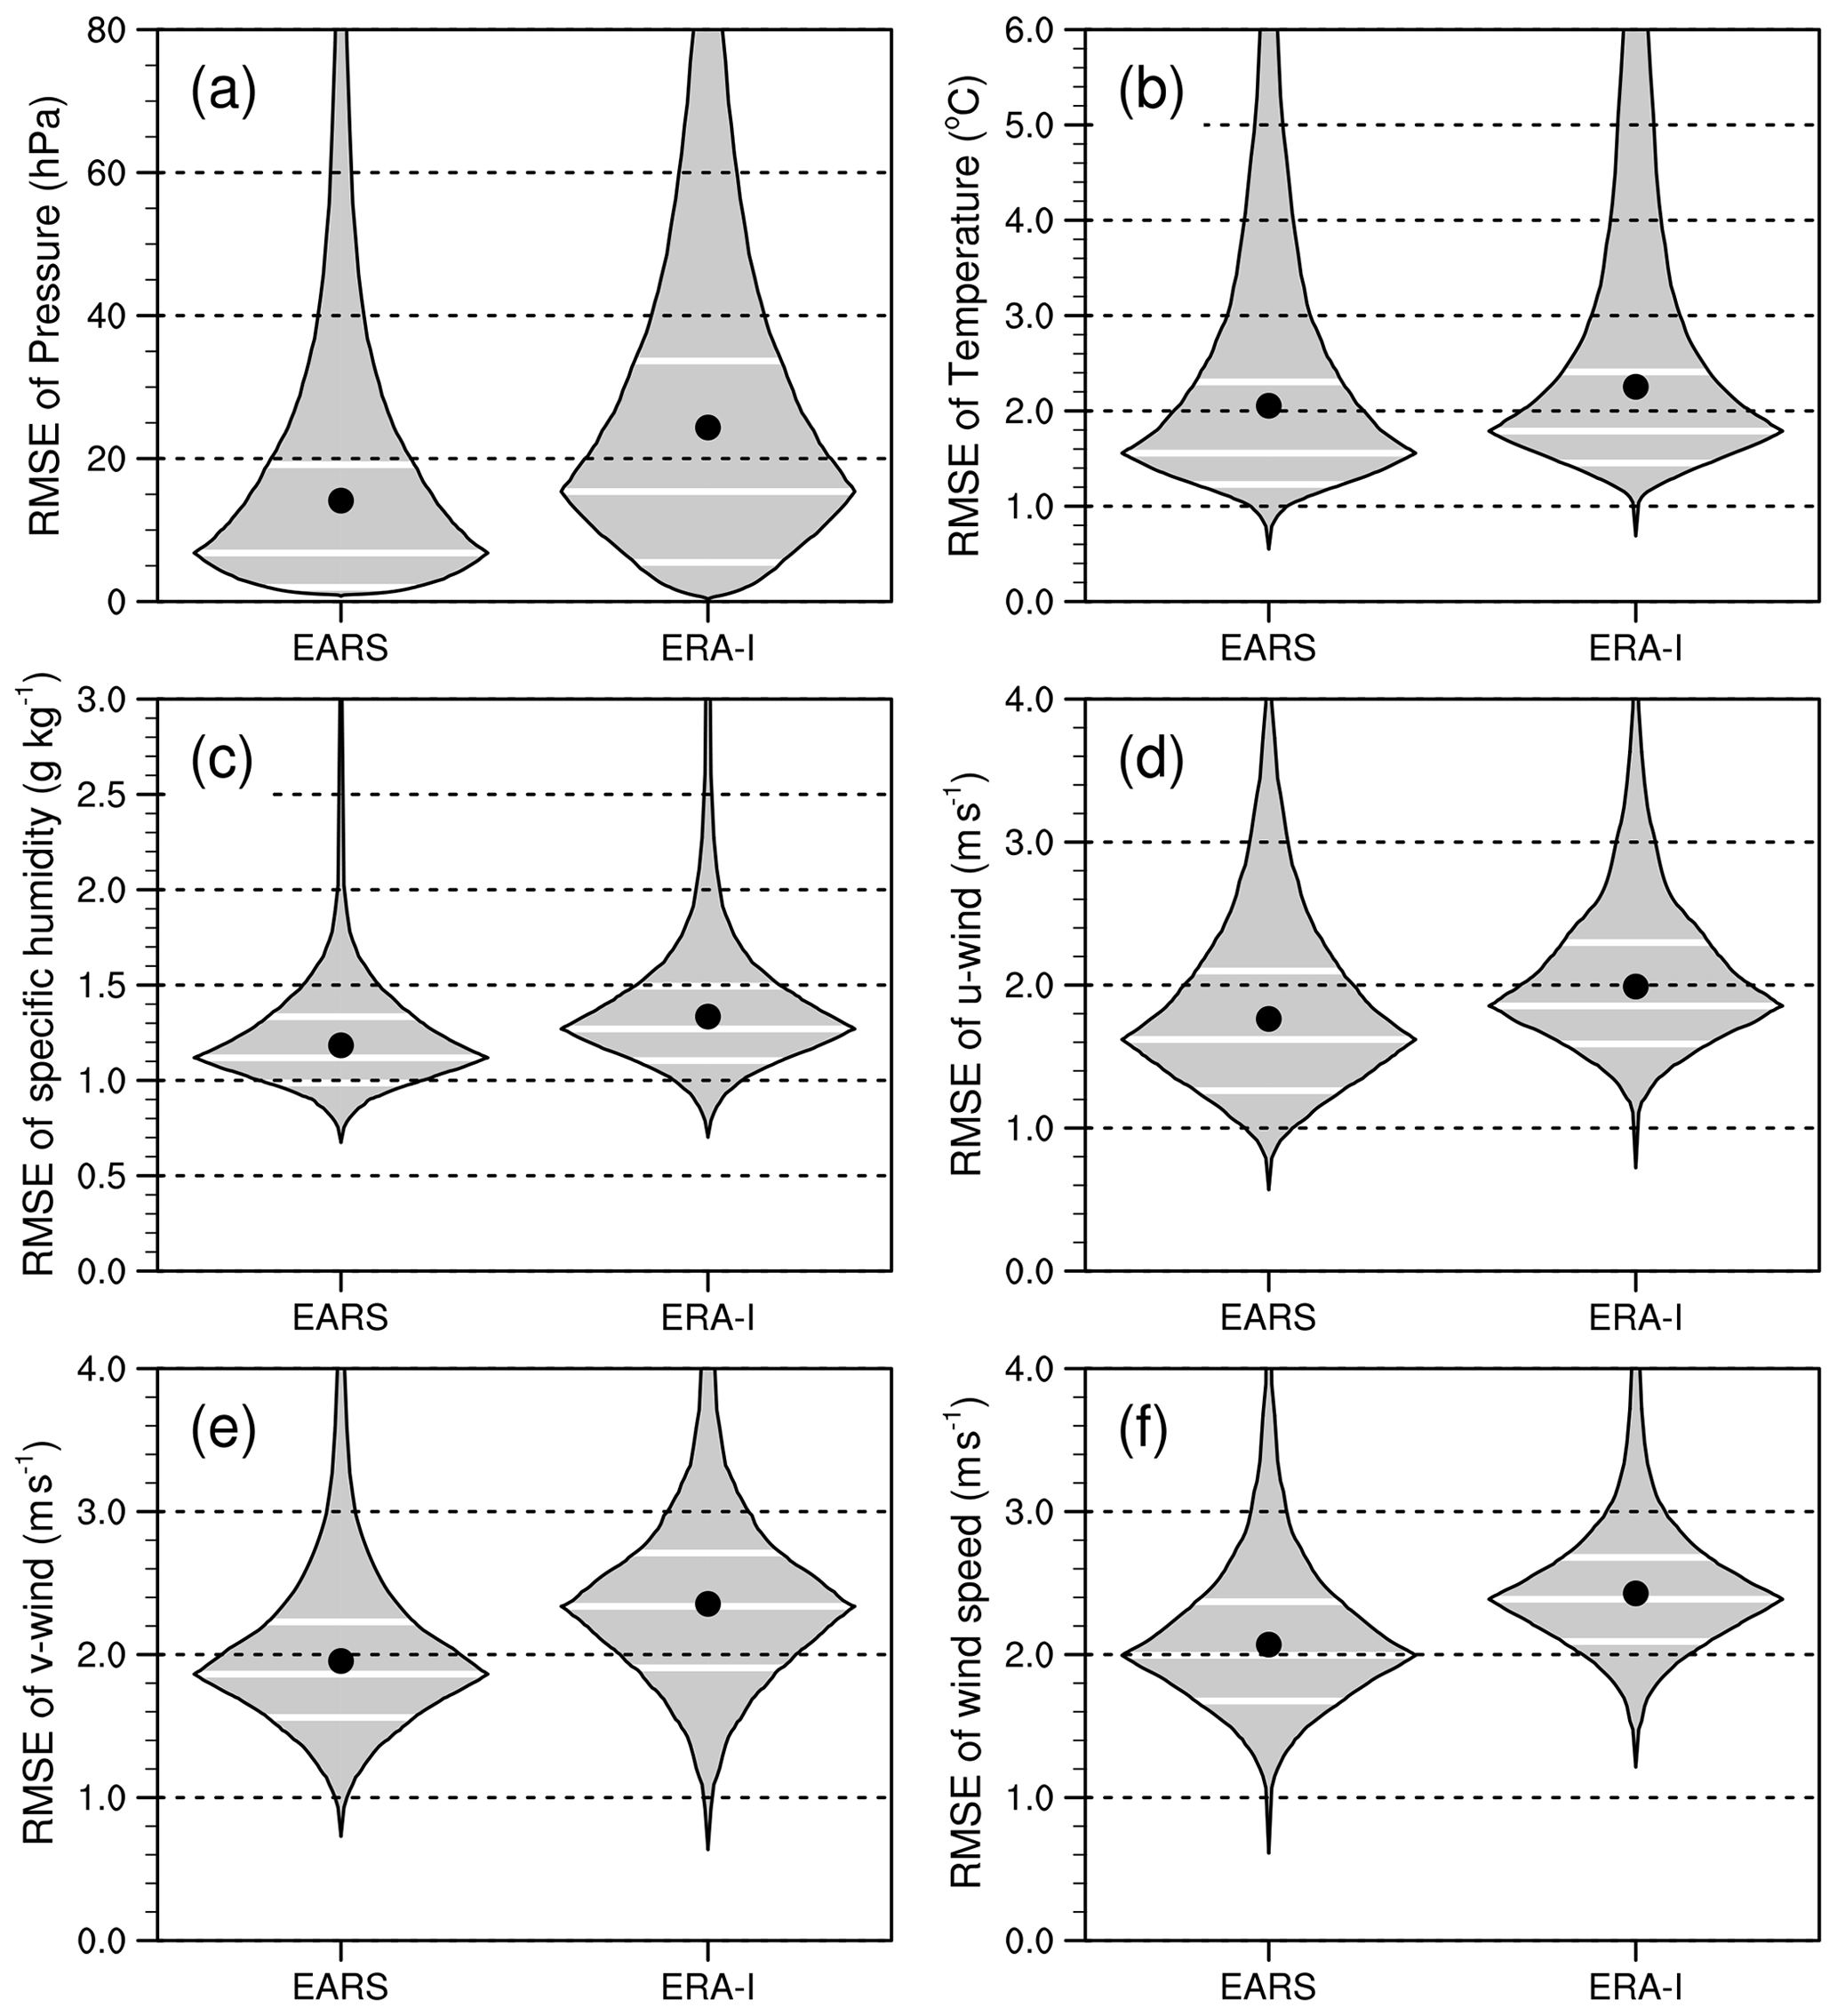
Figure 11Comparison of the averaged root mean square error (RMSE) between EARS and ERA-Interim in terms of surface meteorological variables: (a) pressure (P; hPa), (b) temperature (T; ∘C), (c) specific humidity (Q; g kg−1), (d) zonal wind (U; m s−1), (e) meridional wind (V; m s−1), and (f) wind speed (WS; m s−1). The black dot denotes the averaged value of each category, and the horizontal white lines indicate the 25th, 50th (median), and 75th percentiles. See the text for details.
In terms of the RMSE, we have noted that EARS shows an obvious improvement in the surface meteorological fields over East Asia compared to ERA-Interim (Fig. 11). According to the statistical results, P has the largest improvement percentage of the RMSE, followed by V, and T has the smallest improvement. The smaller RMSE is mainly attributable to the data assimilation of a large number of observations. Note that the optimized WRF model, focusing on East Asia with a high horizontal resolution of 12 km and 74 sigma levels in the vertical, is also beneficial to the smaller RMSE. As has been stated above, the WRF model was tested and verified in various aspects by paying attention to dynamic and physical options and to the observation nudging parameters (Yin et al., 2018). According to our previous tests with the optimized WRF model, the downscaling results performed better than ERA-Interim, which provides good background conditions for the GSI data assimilation and the subsequent reanalysis data. Previous studies (e.g., Andrys et al., 2015; Gao et al., 2022; Qiu et al., 2017) also indicated that significant performances have been gained in WRF downscaling at a high resolution.
Figure 12 shows spatial distributions of the averaged RMSEs of P for EARS and ERA-Interim and for their differences. Clearly, the spatial distribution for EARS is similar to that of ERA-Interim. Given the spatial distribution, there is a smaller RMSE over eastern China, which is beneficial from the ingestion of dense surface observations. Note that the higher resolution of the complex terrain over western China has positive contributions to the model results, except for limited observations over this region. More specifically, both EARS and ERA-Interim show large RMSEs over western China, especially along the eastern side of the Qinghai–Tibet Plateau. The spatial distributions for other surface variables are also generated, although these are not presented here. In general, EARS has similar improvements to P in T. Concerning Q, both EARS and ERA-Interim have obvious RMSEs over southern China, which may be related to a large amount of available water vapor in this region. EARS shows a similar spatial distribution of the RMSE of U to that of ERA-Interim, while obvious differences can be found in the RMSE of V. A large RMSE belt of U is in the northeast toward the Tibetan Plateau. EARS reduces RMSE in V significantly, indicating that the quality of V is improved considerably. EARS alleviates the RMSE over values 2.5 m s−1 at most stations. Note that EARS has larger RMSEs in the wind field (both U and V) over western China than ERA-Interim. This may be related to complicated dynamics associated with the Tibetan Plateau, land processes, and/or poor quality of observations over this region, and attention is required to understand the shortcoming. For WS, the improvement shows a similar pattern to that in V. In terms of RMSE, EARS performs better than ERA-Interim at most stations, although EARS has poor quality at some stations.
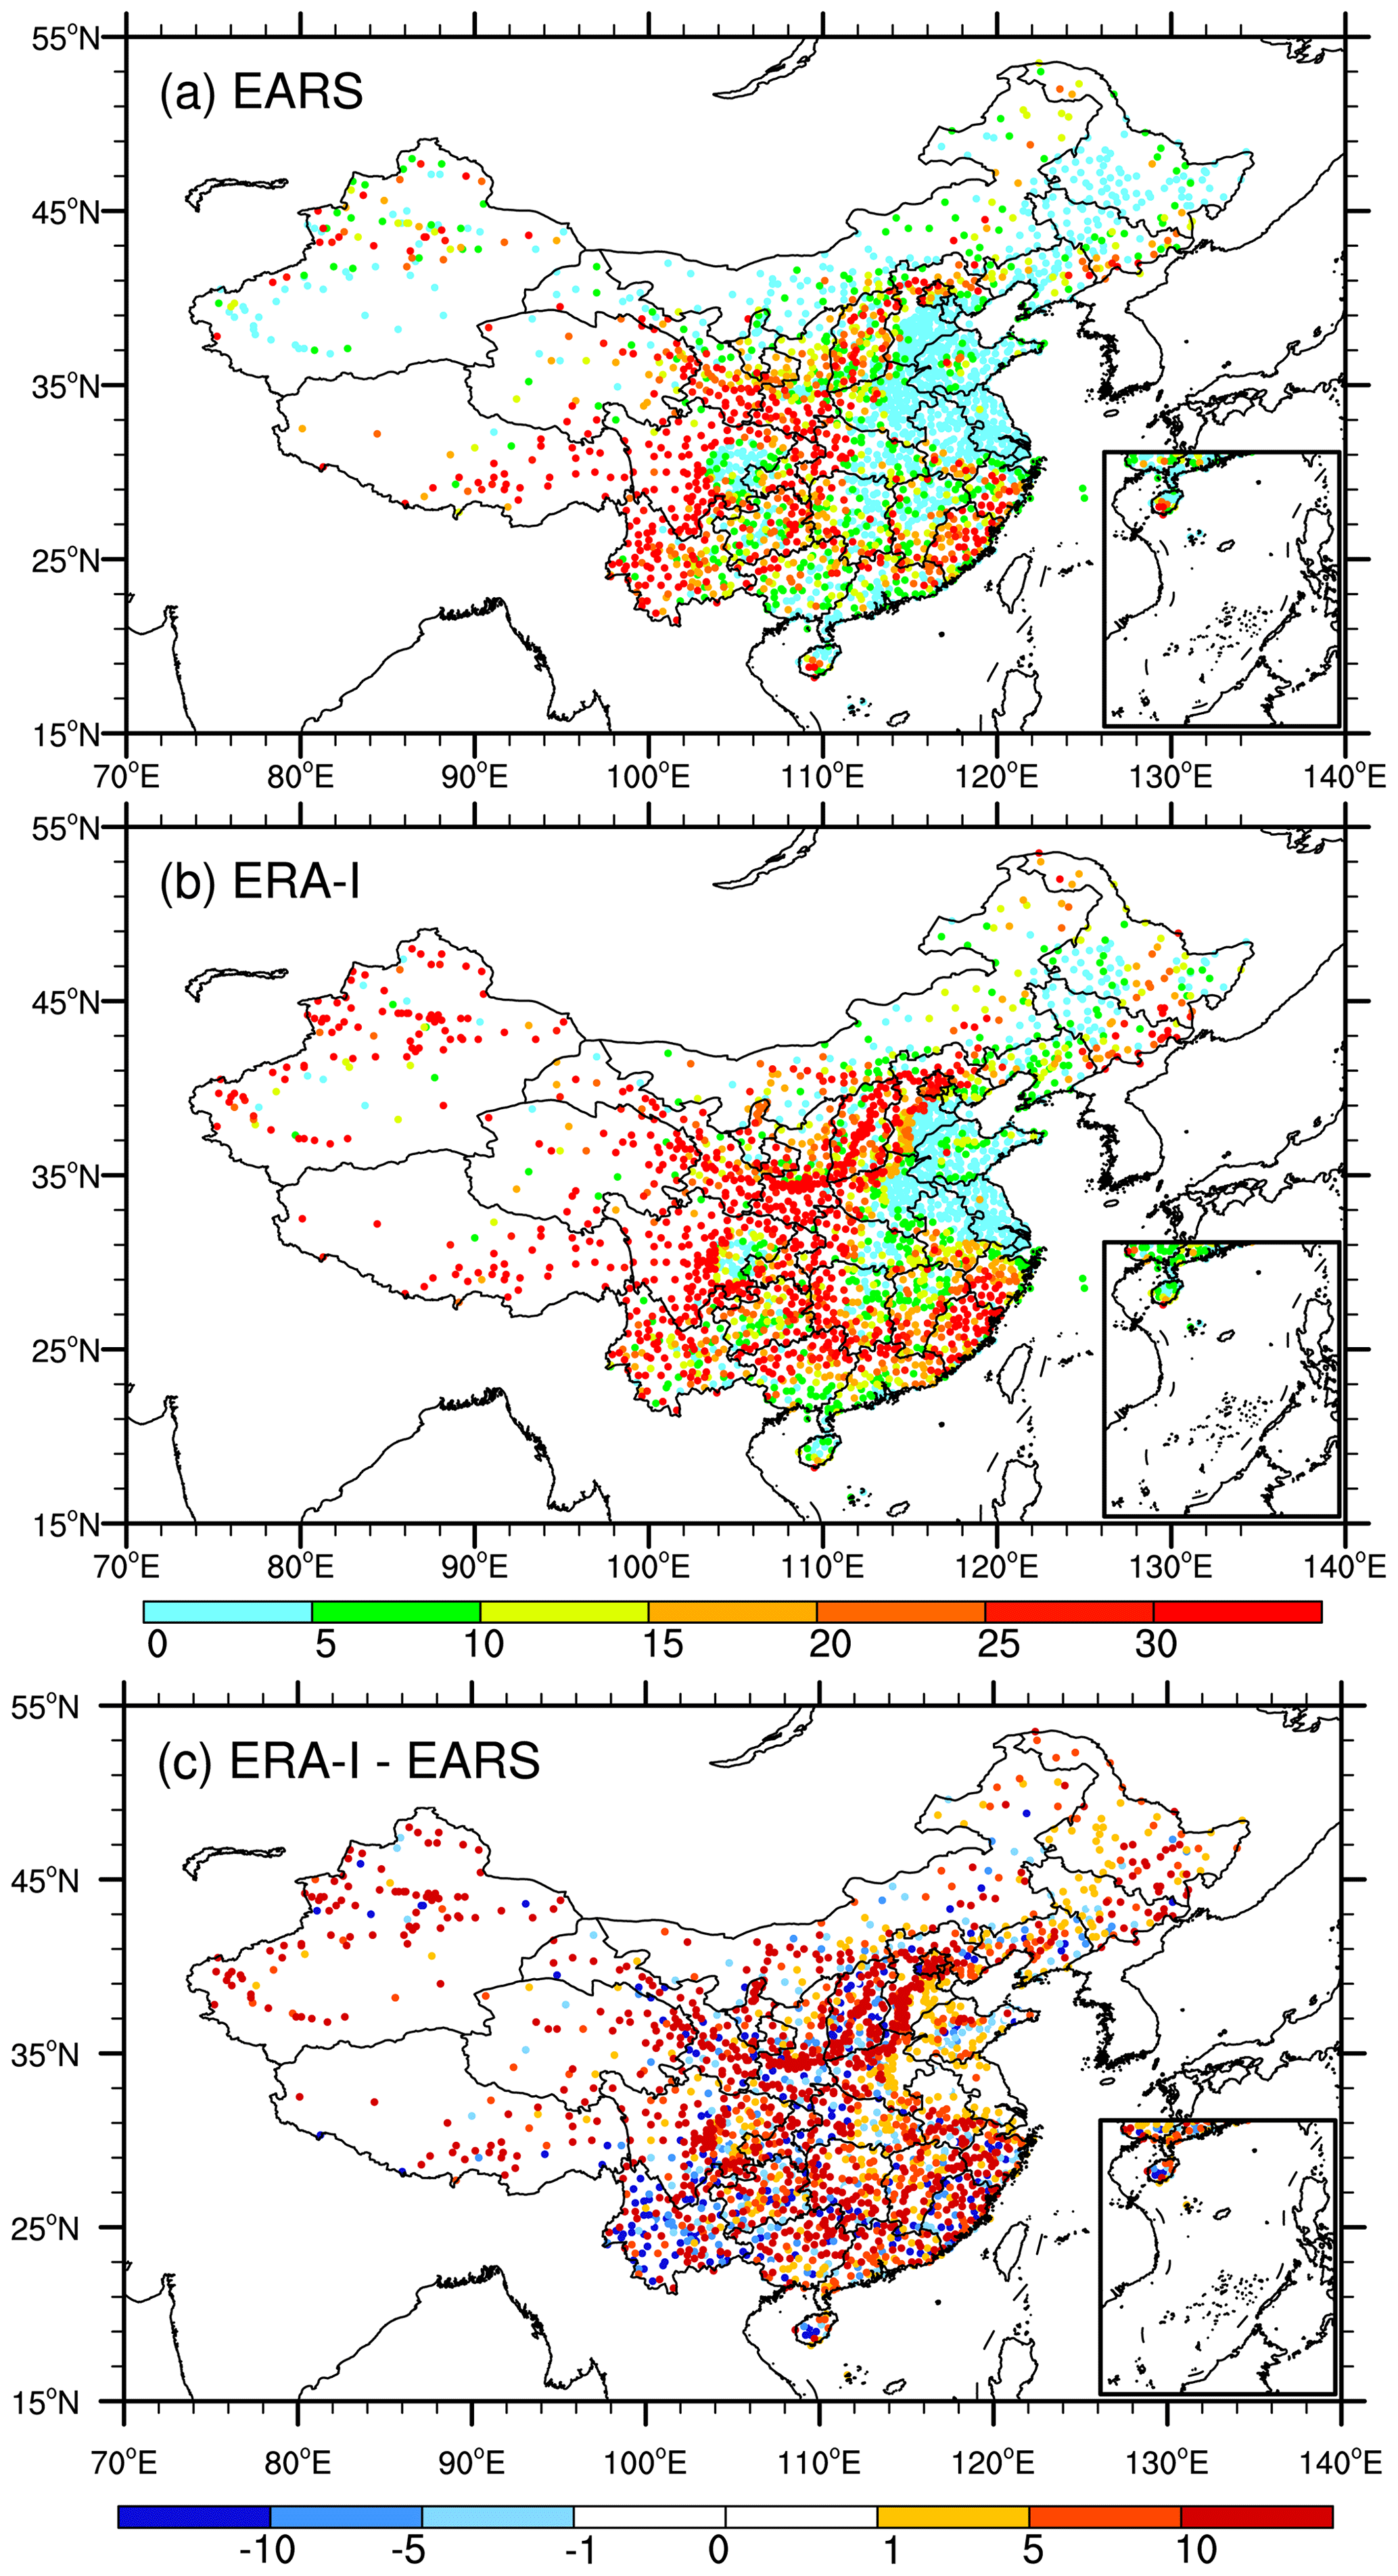
Figure 12Spatial distributions of the averaged RMSEs of surface pressure (P; hPa) from (a) EARS and (b) ERA-Interim and (c) their differences (ERA-Interim minus EARS).
3.2 Upper-level fields
Figure 13 shows the mean RMSEs of vertical profiles of U, V, T, and Q, verified against 120 radiosonde observations over China during 2008–2017 (Fig. 10b). Generally speaking, EARS shows much smaller RMSEs than ERA-Interim at all levels, although both show similar vertical distributions. The RMSEs for ERA-Interim are nearly twice as large as those of EARS, except for the RMSEs of Q at the upper levels. More specifically, the RMSEs of U and V for EARS are nearly 1 m s−1 throughout the vertical column, while those of ERA-Interim are mostly larger than 2 m s−1. Also, the RMSEs of U and V for EARS show slight variation in the vertical, while the RMSEs of ERA-Interim are large at the lower and upper levels and small at the middle levels. As for the RMSEs of T, the RMSEs of EARS are within 0.9 ∘C, and the RMSEs of ERA-Interim are less than 1.5 ∘C. Both reanalysis products show large RMSEs at the lower level near the ground, and the RMSEs for T decrease first with increasing height, bottoming out near 400 hPa. The second-largest RMSEs for T occur at the higher level of 100 hPa. The large RMSEs for T at the upper levels mainly result from limited radiosonde observations. In addition, the interactions between the troposphere and stratosphere may have some impact on the accuracy of the reanalysis products. The RMSEs for Q decrease rapidly with increasing height and approach zero near 200 hPa. It should be pointed out that the small RMSEs at the upper levels mainly result from a very low value of Q rather than from having a good performance at these levels. In view of the vertical profiles of EARS verifying against radiosonde observations given in Fig. 13, EARS is considerably better than ERA-Interim. The RMSEs for EARS are almost half as small as that of ERA-Interim. The RMSEs of U, V, and T for EARS are considerably smaller than those of ERA-Interim. At upper levels above 500 hPa, the RMSEs of Q for both EARS and ERA-Interim are similar in magnitude, while the former shows a smaller value than the latter. As stated in Mesinger et al. (2006), the reanalysis data are influenced by both the estimate of the background and observation error covariances.
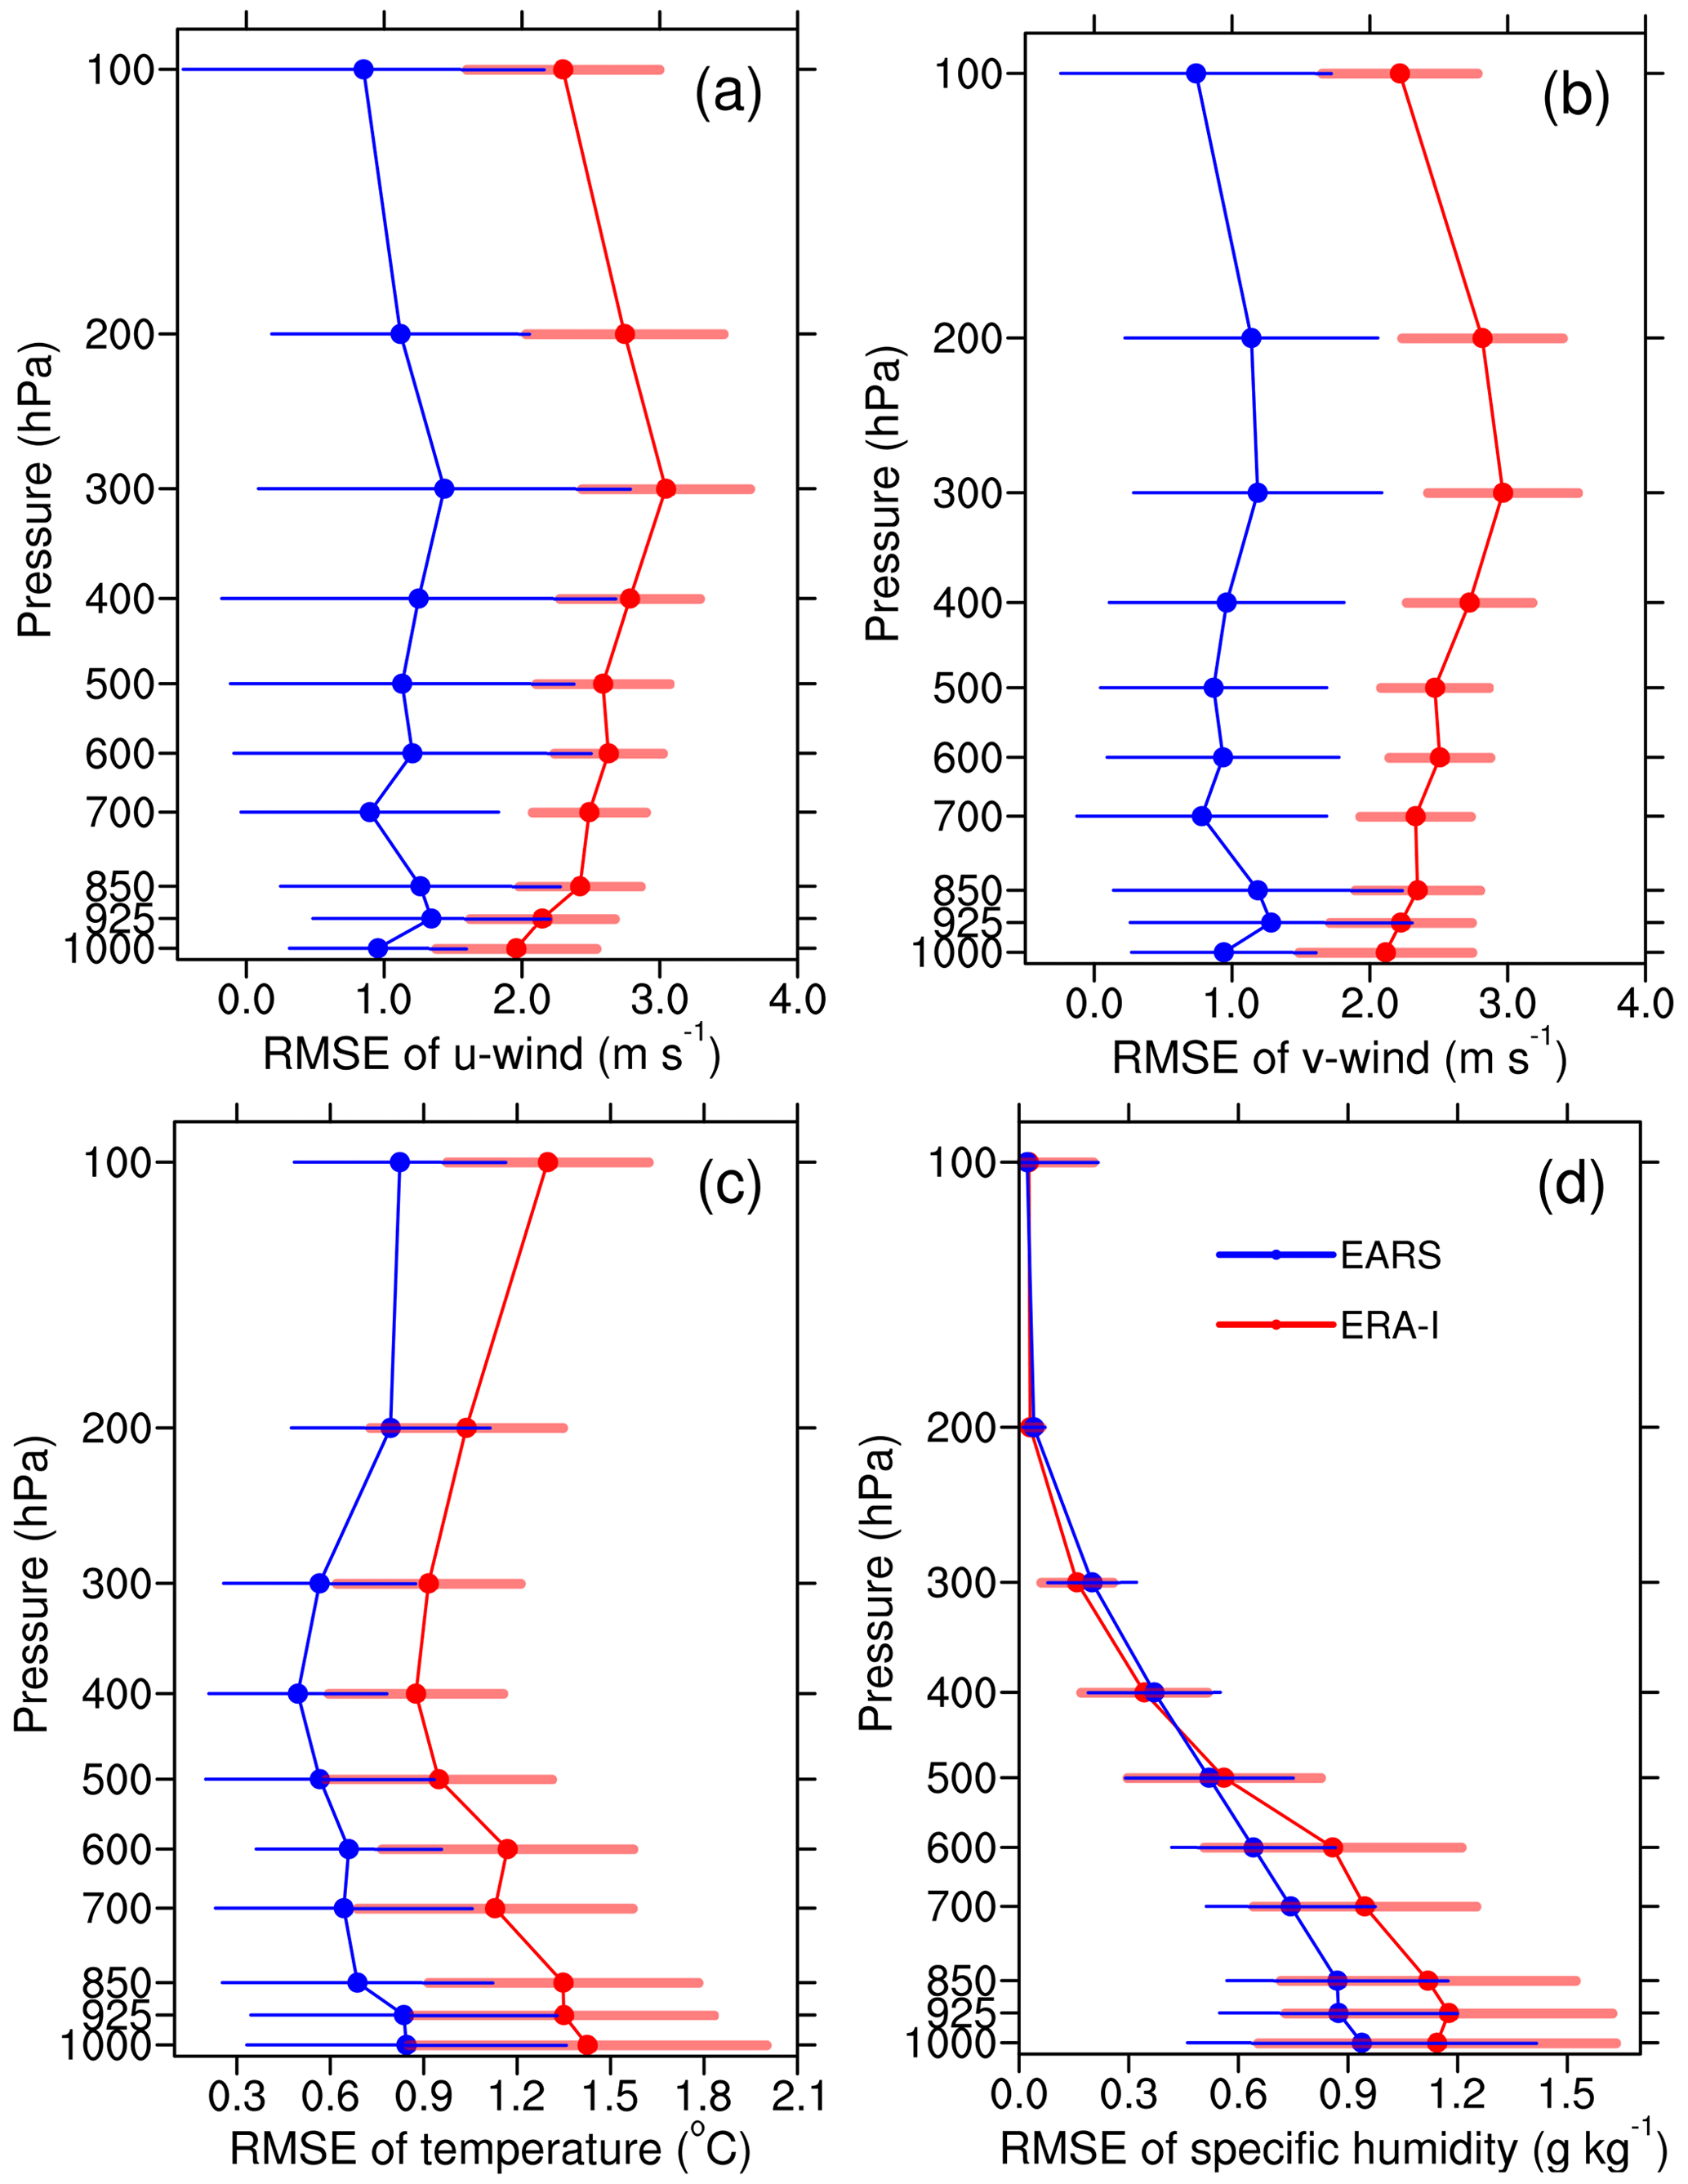
Figure 13Comparison of the averaged RMSEs of EARS (blue) and ERA-Interim (red) at different levels for (a) u wind (U; m s−1), (b) v wind (V; m s−1), (c) temperature (T; ∘C), and (d) specific humidity (Q; g kg−1). The standard deviation of the RMSE at each level is marked by a horizontal line.
3.3 Rainfall
Despite several objective verification methods for modeling quantitative rainfall amounts, systematic assessment of simulated rainfall performance remains difficult. Consequently, a simple comparison between EARS and ERA-Interim is given here in terms of the accuracy of 3 h accumulated rainfall. Please refer to Yang et al. (2023) for detailed analyses of the simulated rainfall properties of EARS. Figure 14 shows the accuracy of 3 h rainfall for both EARS and ERA-Interim. Although the accuracy shows slight diurnal variation, both EARS and ERA-Interim have high averaged accuracies of over 0.5 and show good performances from early morning (21:00 UTC) to midday on the next day (03:00 UTC). EARS has higher rainfall accuracy than ERA-Interim at all times. For an overview (i.e., mean), EARS provides a higher total mean accuracy of 0.61, with 0.56 for ERA-Interim. Note that the improvements vary from 4.53 % to 16.18 %, with the averaged improvement percentage of the accuracy being 8.99 %. We also calculated the equitable threat score for 3 h accumulated rainfall (not shown). For rainfall above 20.0 mm, EARS is much better than ERA-Interim, indicating that EARS has a better capability to reproduce heavy rainfall over East Asia, especially for 3 h accumulated rainfall that is over 50 mm. Note that ERA-Interim cannot capture 3 h accumulated rainfall that is over 70 mm, which may be caused by the global model's low resolution of nearly 79 km.
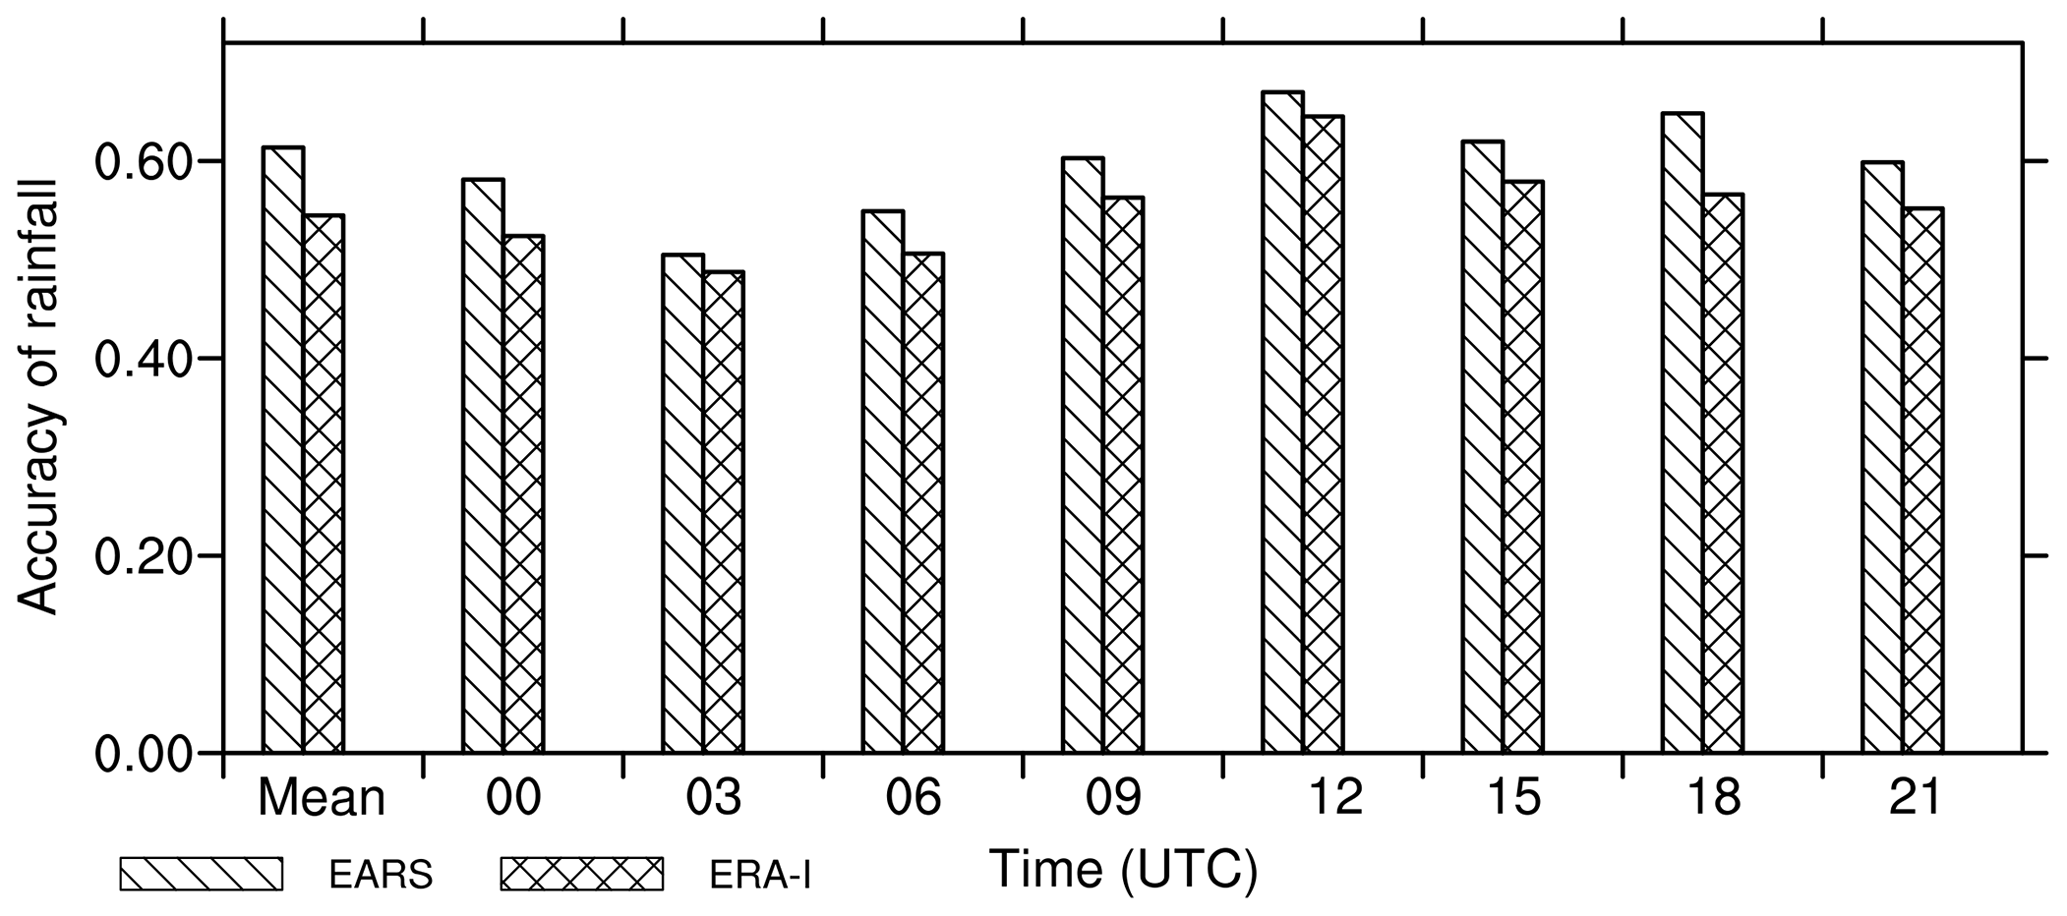
Figure 14Comparison of the accuracy of 3 h accumulated rainfall between EARS and ERA-Interim in different episodes. Mean denotes the averaged value for all times.
Figure 15 shows the spatial distribution of averaged 3 h accumulated rainfall accuracy for EARS and ERA-Interim in 2008–2017. Clearly, both EARS and ERA-Interim have high forecast capability for precipitation over central China, with a rainfall accuracy of over 0.6, followed by southern and eastern China (Figs. 15a and b). The low accuracy (less than 0.4) mainly appears in western China, especially over the Qinghai–Tibet Plateau. The results are consistent with previous studies and with operational predictions (e.g., Mao et al., 2010; Zhang et al., 2021; Zhao et al., 2018). In general, EARS has better performance on the 3 h scale at most stations than ERA-Interim (Fig. 15c), although EARS has less accuracy at some stations. EARS with more local observations is probably the main reason for its better performance, and the benefit of the optimized WRF model with a high resolution of 12 km may be another reason. The results indicate that EARS would be more suitable for investigating precipitation over East Asia.
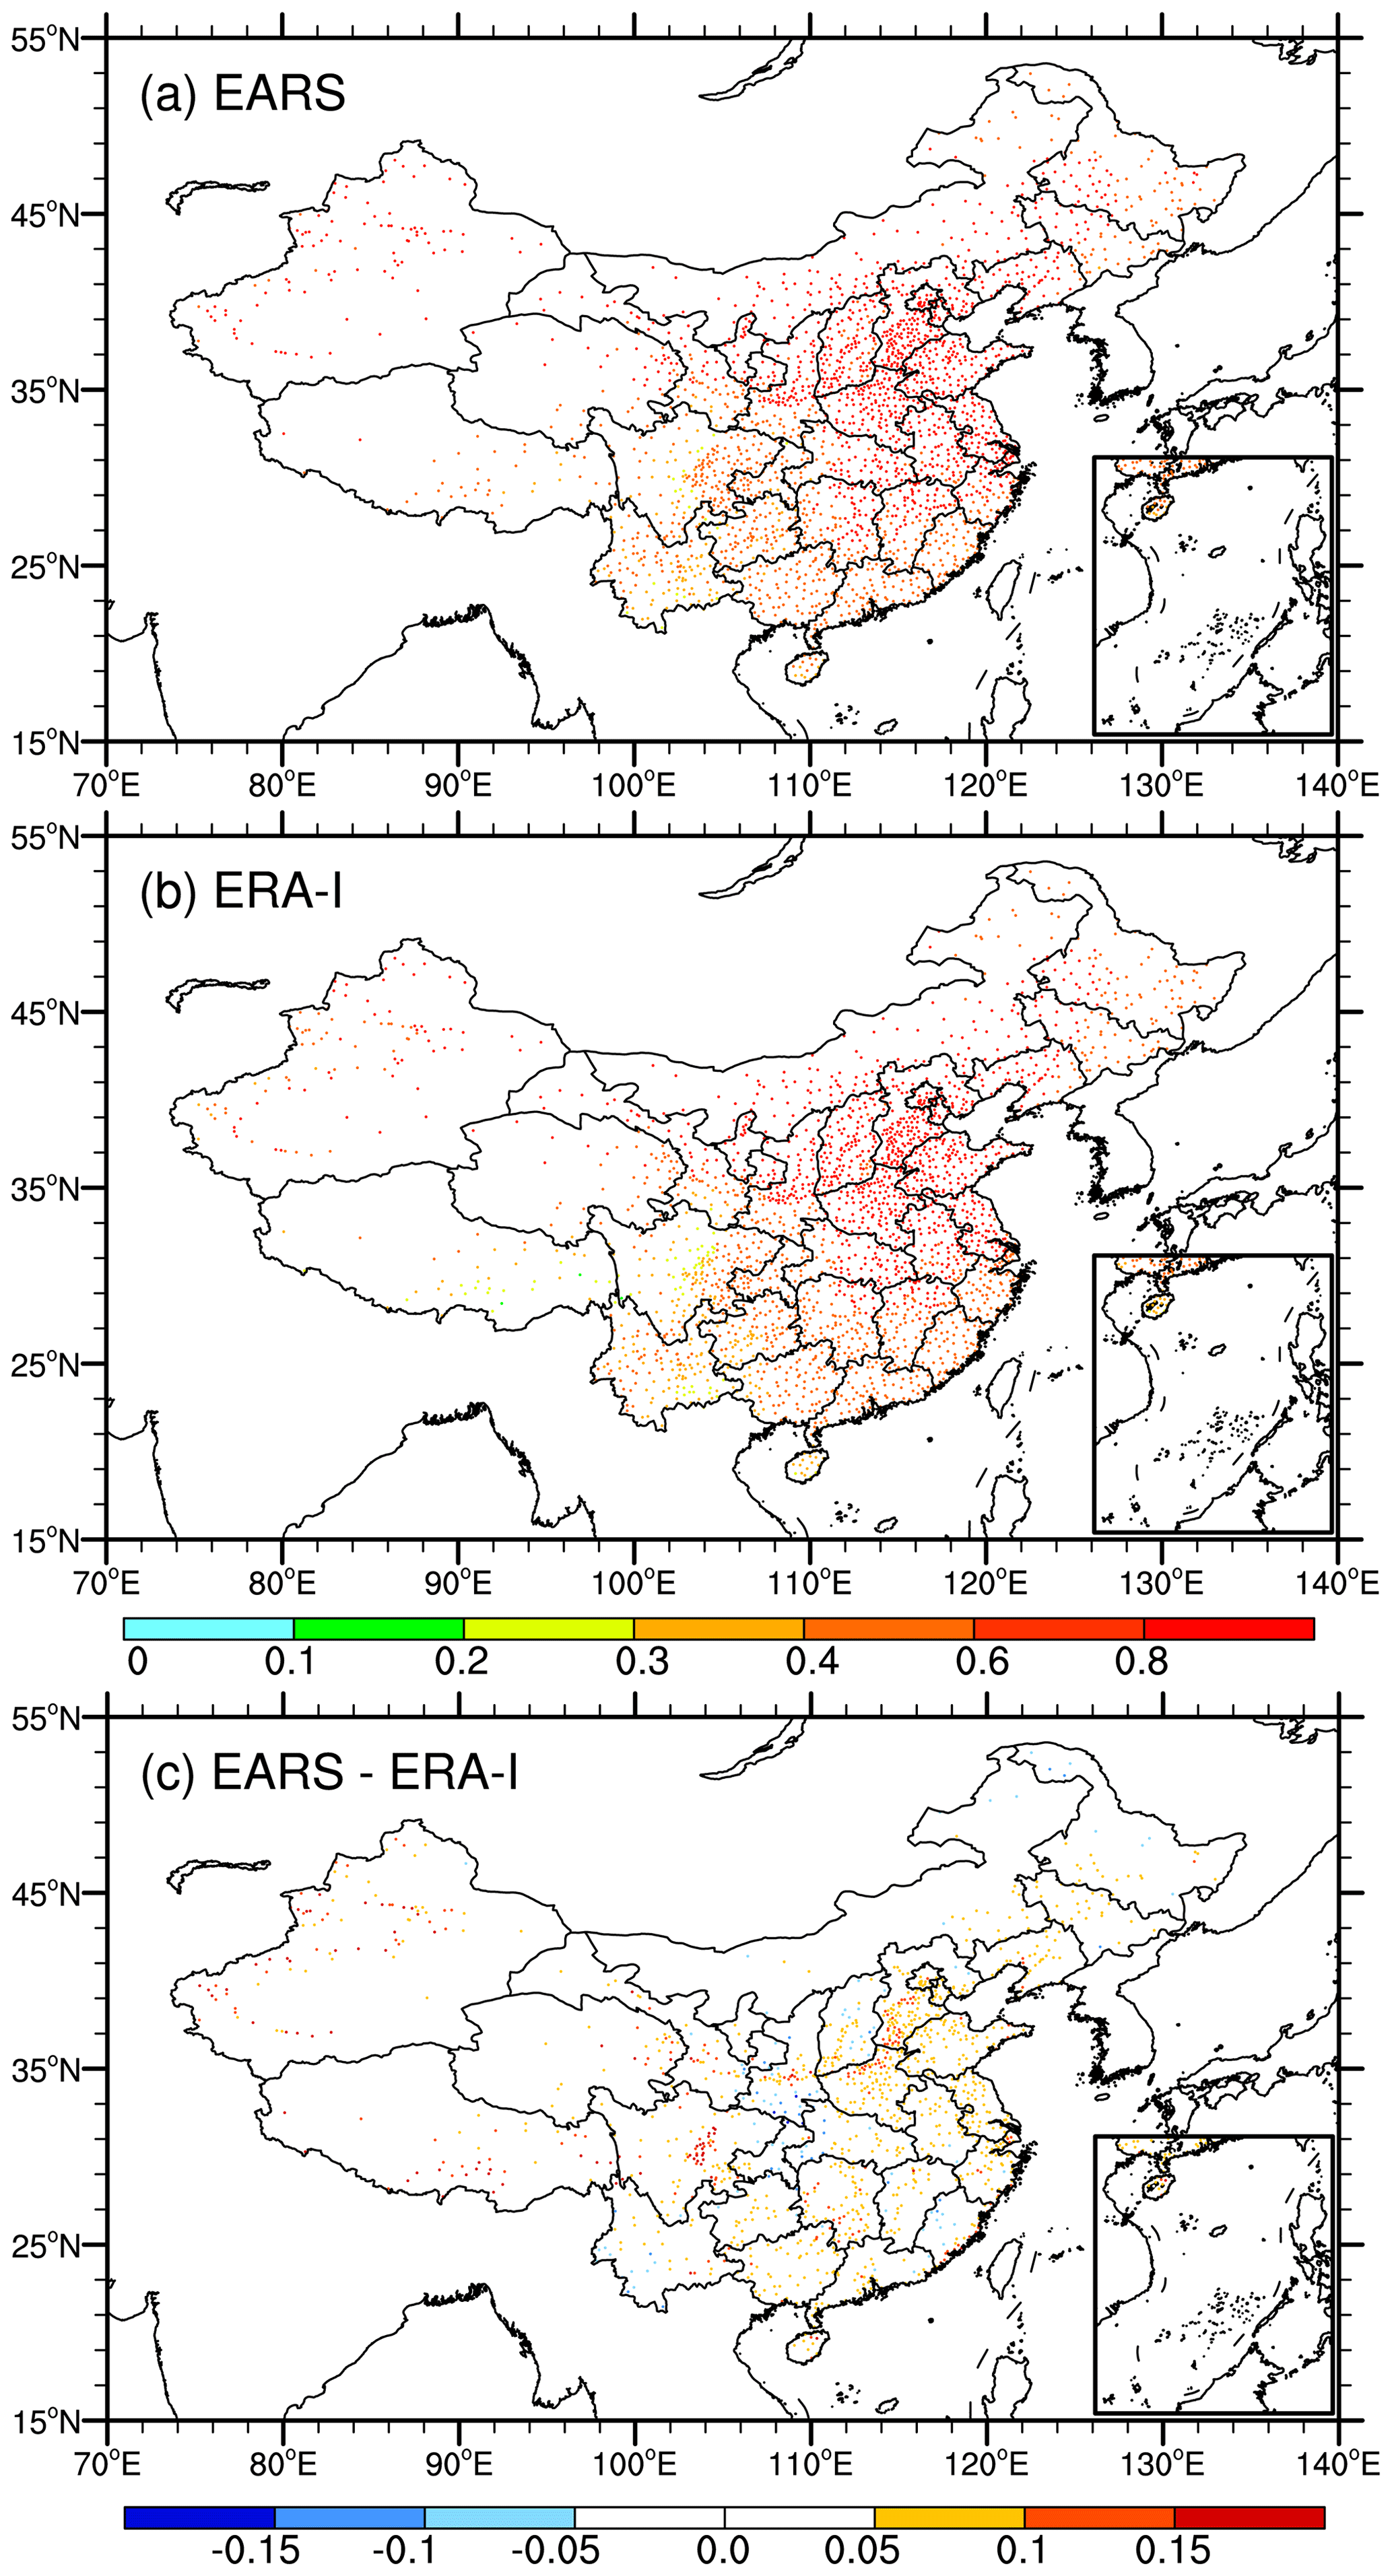
Figure 15Spatial distributions of the averaged rainfall accuracy of (a) EARS, (b) ERA-Interim, and (c) their difference (EARS minus ERA-Interim).
3.4 Features at lower levels over the central Taklimakan Desert
Figure 16 shows the diurnal variation of observed and simulated vertical thermal structures at the lower levels (0.6 km above the ground). From the observations, obvious transitions exist in the thermal structure. More specifically, there is an inversion layer near the surface in the nighttime, while a sub-adiabatic or superadiabatic layer occurs in the daytime. The transition, from stable to convective and back to stable conditions, is consistent with the diurnal variation of solar radiation (Yin et al., 2021). In general, both EARS and ERA-Interim are able to reproduce similar diurnal transitions to the observations. Although there are some differences between the reanalysis products and observations, the transitions, from stable to convective and back to stable conditions, are consistent with the observations. Specifically, EARS is closer to the observations compared to ERA-Interim. For instance, EARS captures the obvious inversion at 06:00 LST, while ERA-Interim underestimates the inversion.
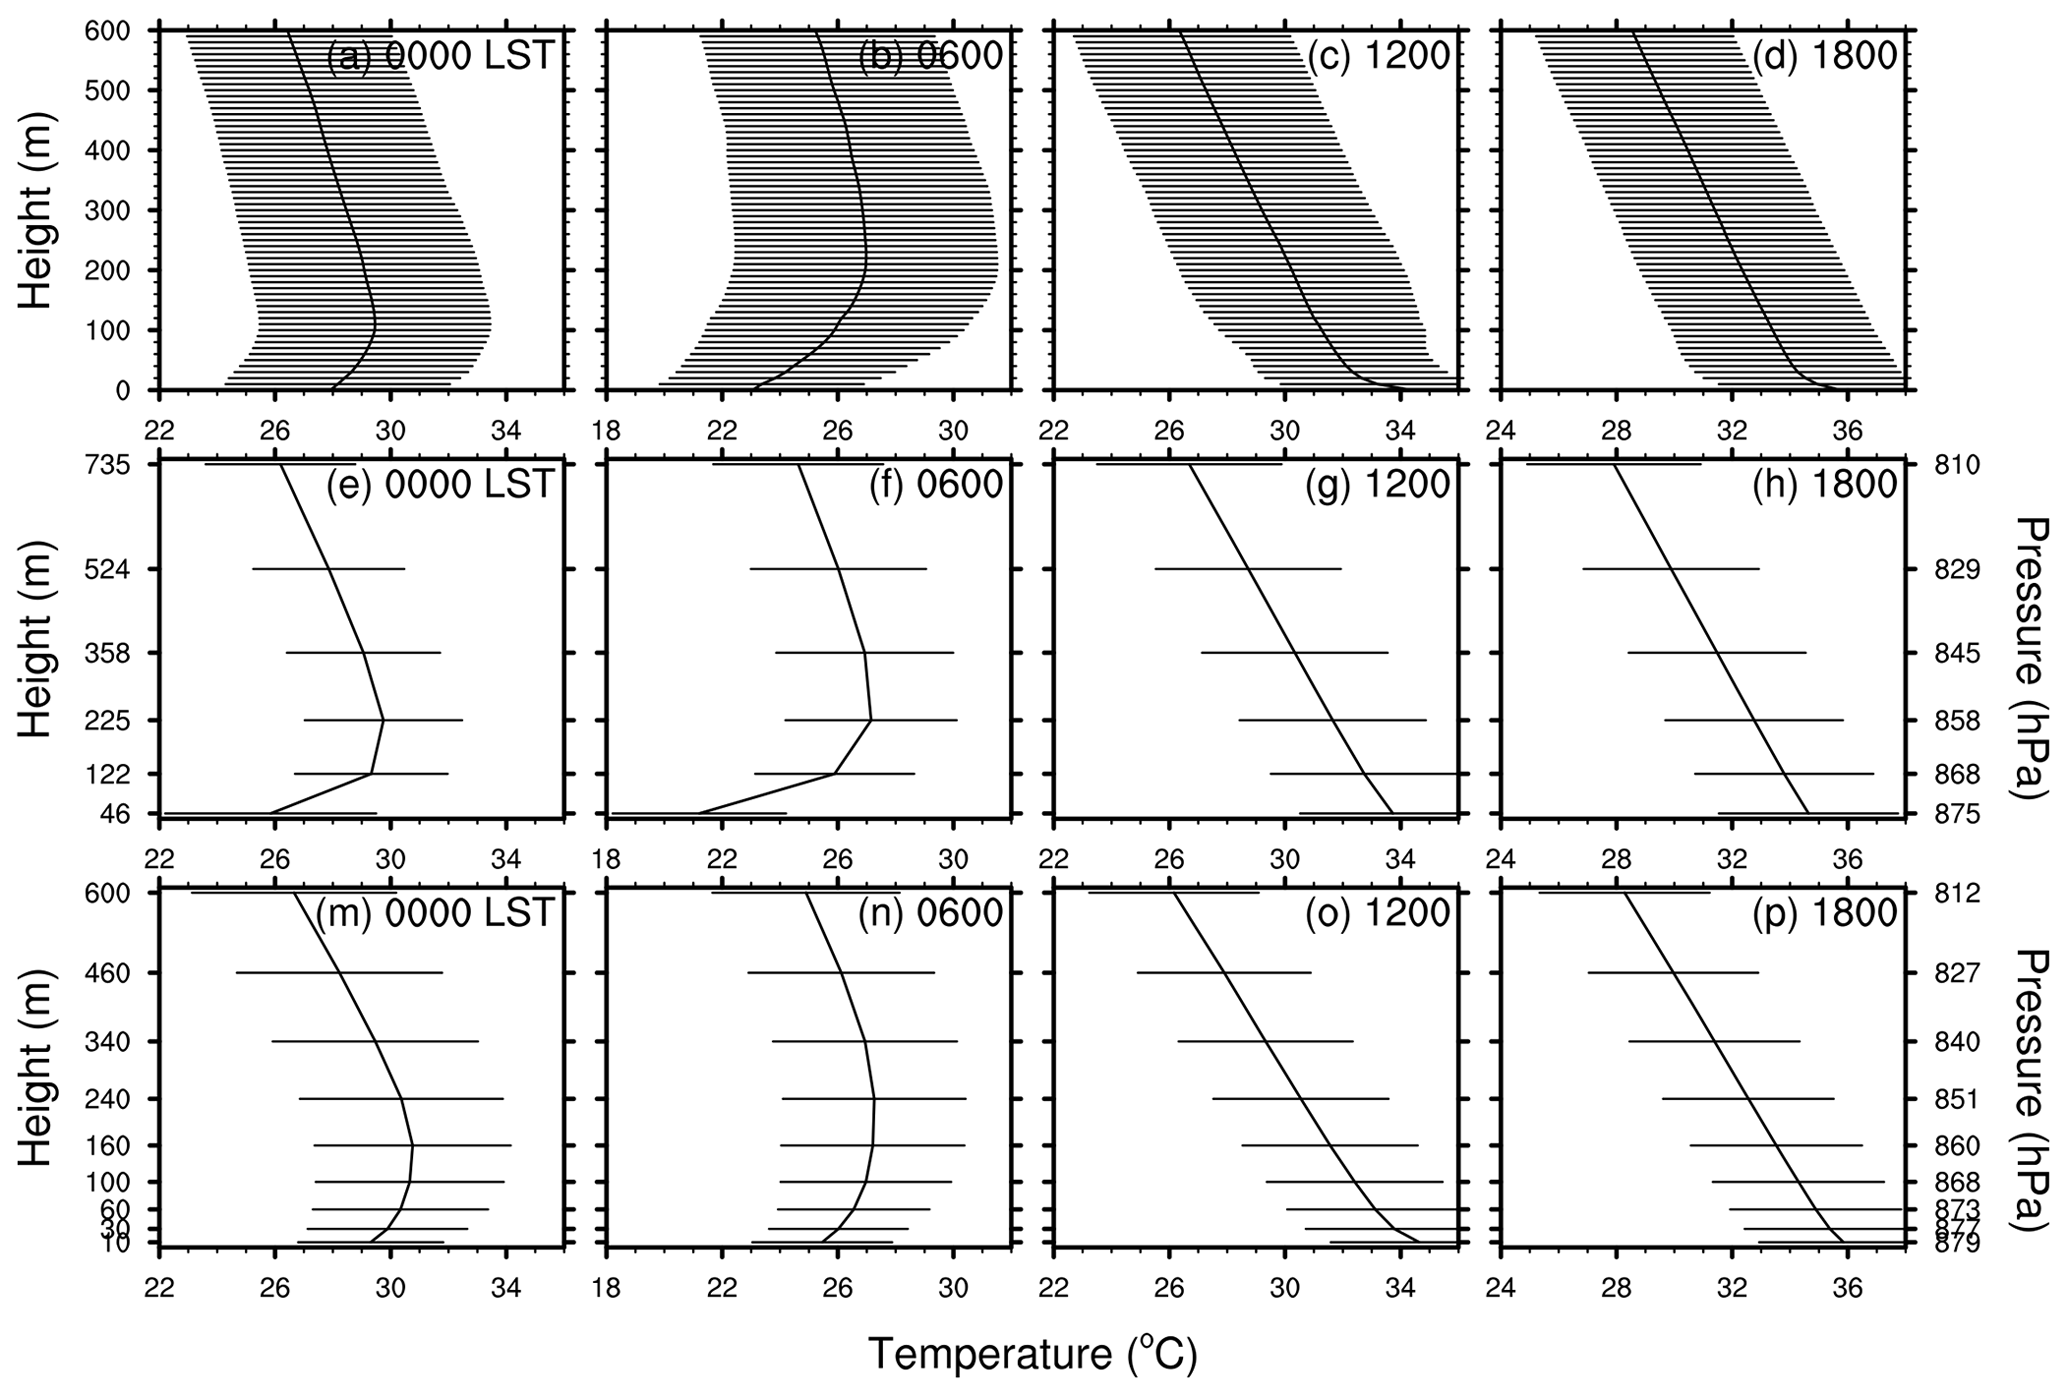
Figure 16Diurnal transitions of the averaged temperature (∘C) at lower levels from 00:00 to 18:00 local standard time (LST, = UTC+6) in July 2016: (a) observations (Obs), (b) EARS, and (c) ERA-Interim. The standard deviation at each level is marked by a horizontal line.
Figure 17 compares the averaged profiles of observed horizontal wind and those of the reanalysis products. An obvious directional shift from northeasterly to westerly appears nearly 2.6 km above the ground on average. In fact, the altitude of the wind directional shift exhibits noticeable diurnal fluctuation, bottoming out at 06:00 LST and peaking at 18:00 LST with altitudes near 2.0 and 3.4 km, respectively. Note that the horizontal wind speed decreases and then increases with increasing height due to vertical wind shear. Compared to the observations, both EARS and ERA-Interim capture the principal vertical wind profile patterns over the central Taklimakan Desert. However, the diurnal variation of wind profiles is slightly underestimated by EARS, while ERA-Interim completely misses the diurnal fluctuation. In addition, ERA-Interim underestimates wind speed near the surface; it seems that the ERA-Interim reanalysis system cannot describe the near-surface thermodynamic processes well.
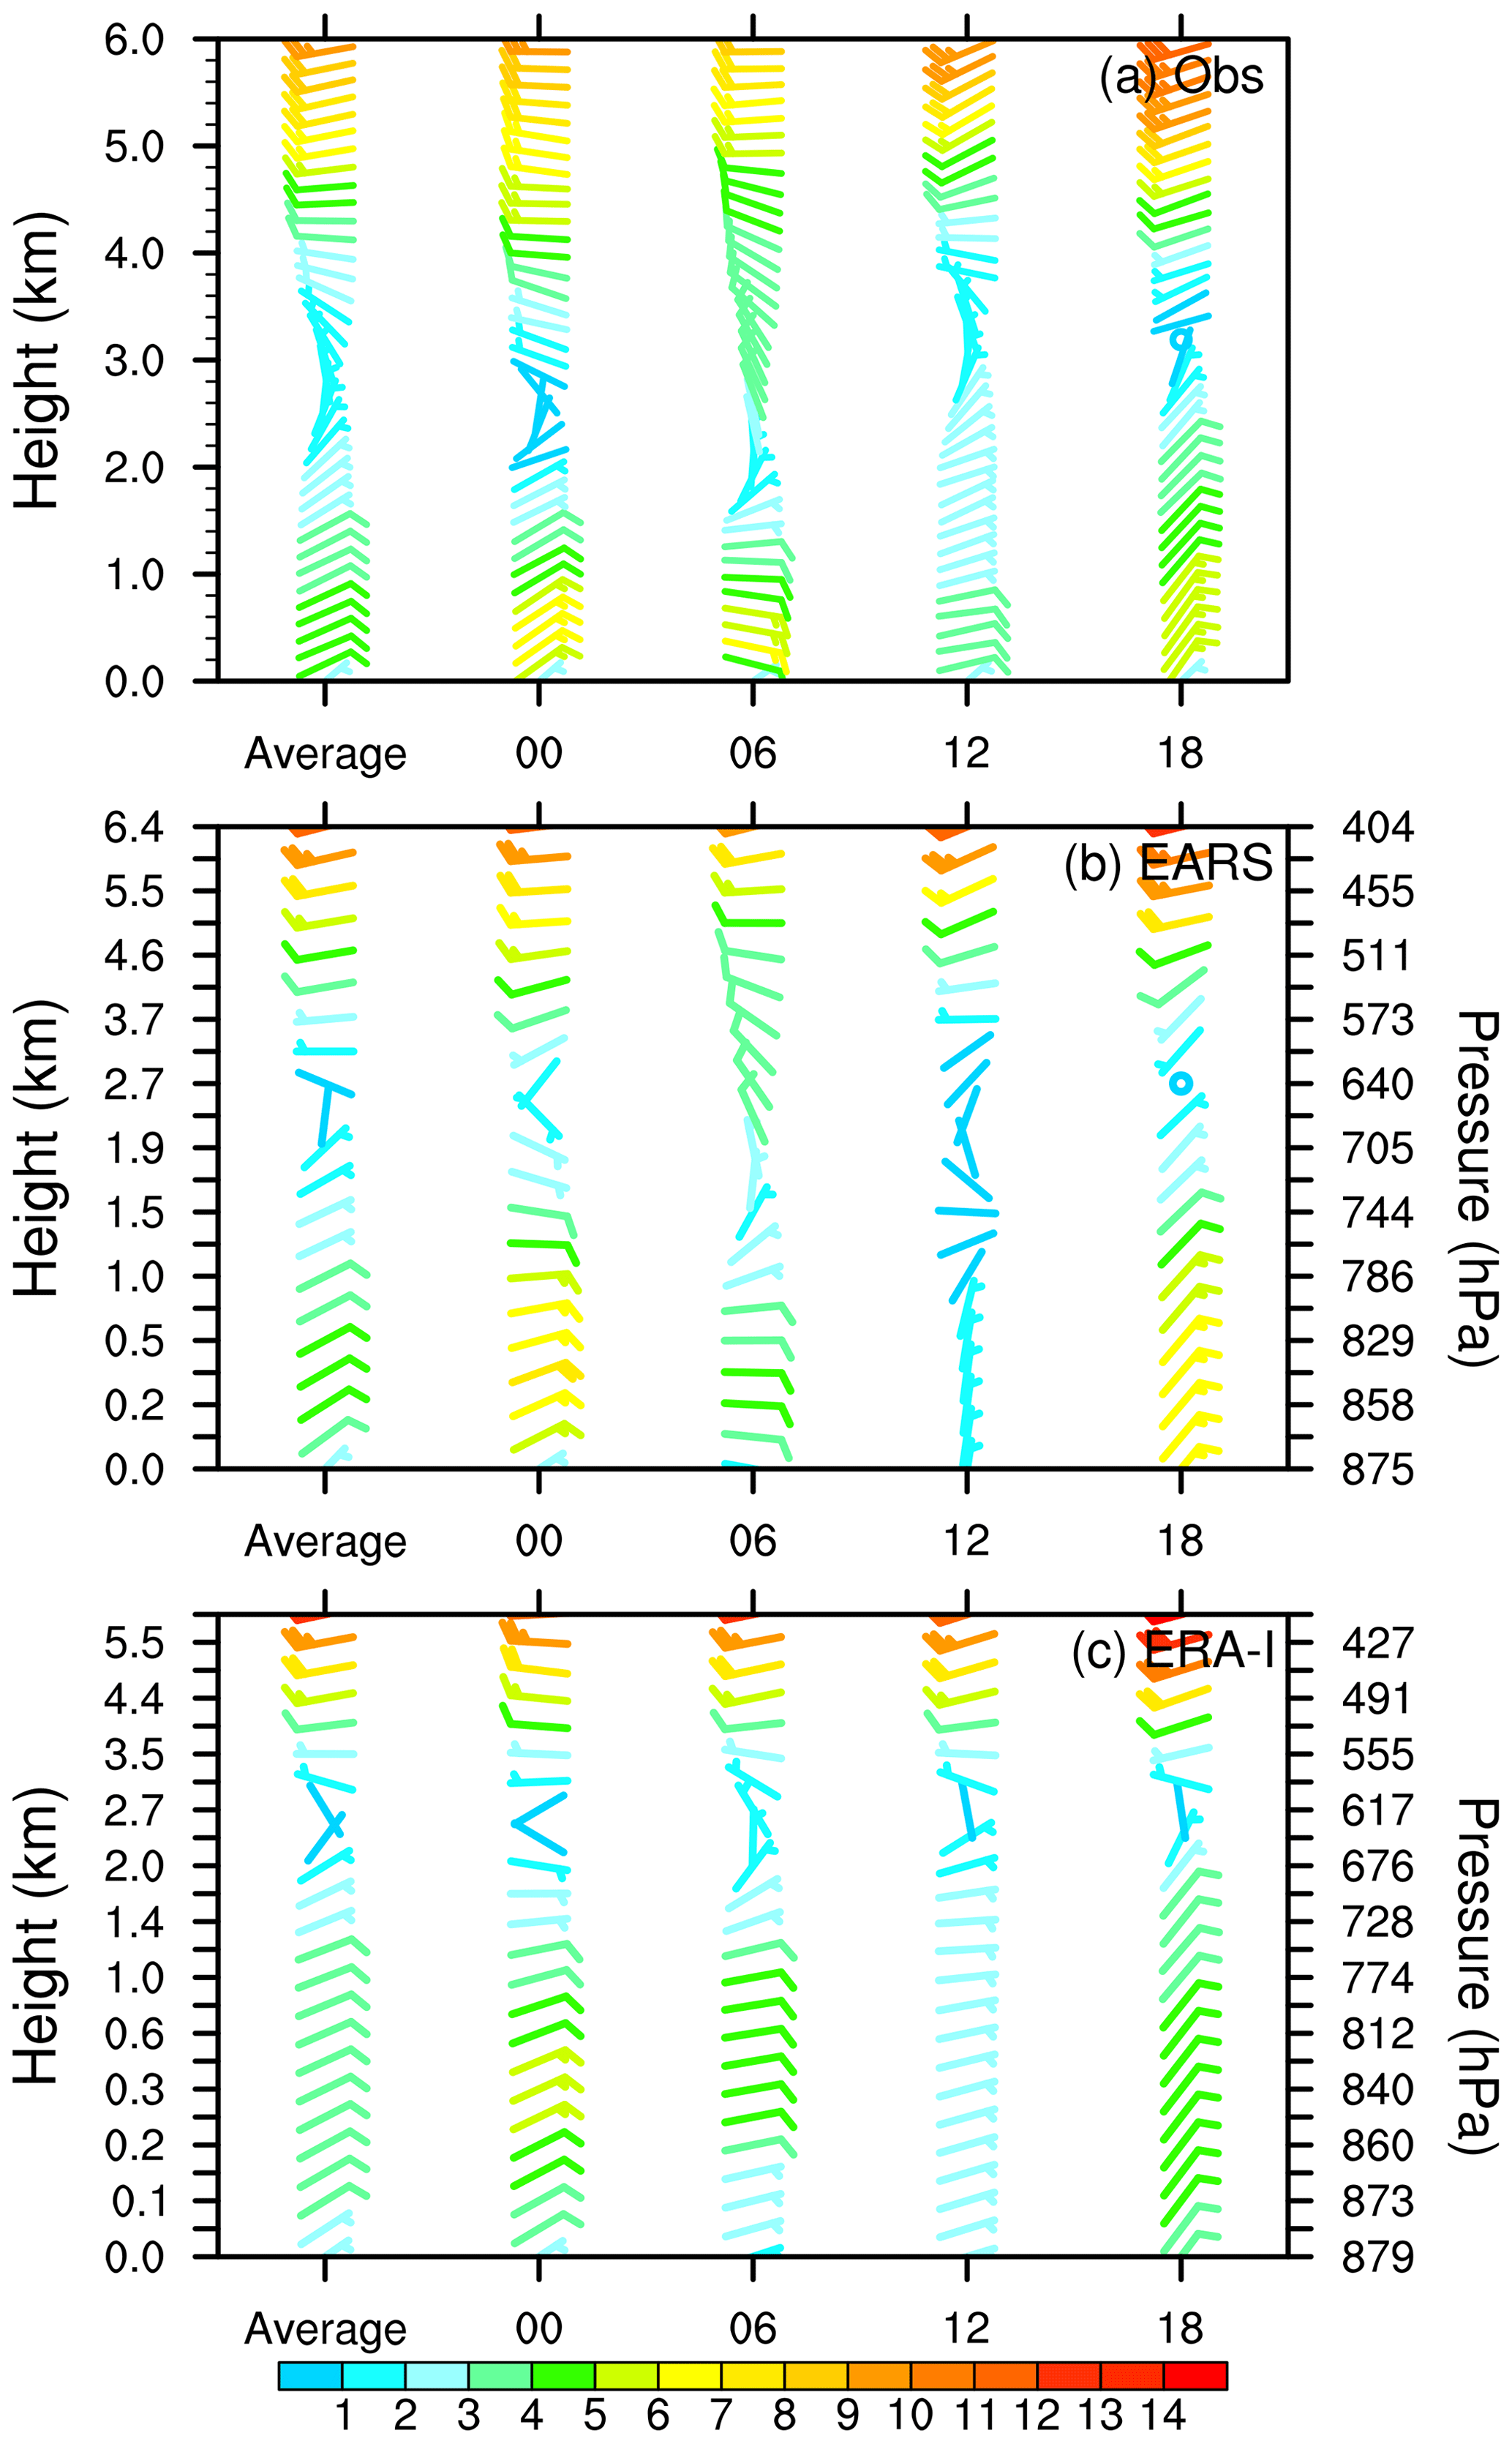
Figure 17Profiles of monthly averaged horizontal wind barbs in July 2016: (a) Obs, (b) EARS, and (c) ERA-Interim. A full wind barb denotes 4 m s−1, and the shading indicates horizontal wind speed (m s−1). Average denotes the total average of all the times. Each column corresponds to the average profiles at 00:00, 06:00, 12:00, and 18:00 LST.
A unique digital object identifier (DOI: https://doi.org/10.5281/zenodo.7404918, Yin et al., 2022) is available for the EARS reanalysis data, which provide comprehensive and up-to-date information about EARS and sample data. The 39-year EARS data reported in this work are available at 3 h intervals, starting at 00:00 UTC from 1980 to 2018. The database format is GRIB version 1, and the total volume of the data files is 54.6 TB. The GRIB files are hosted on the CMA Data-as-a-Service platform (http://data.cma.cn/, last access: 19 May 2023) as their total volume exceeds the volume that could be provided by Zenodo (Yin et al., 2022). Simple data and updated information are available on Zenodo at https://doi.org/10.5281/zenodo.7404918 (Yin et al., 2022), and the full datasets are publicly accessible on the Data-as-a-Service platform of the CMA at http://data.cma.cn. In general, users can obtain comprehensive and up-to-date information about EARS and sample data on Zenodo, and all data can be downloaded from the CMA Data-as-a-Service platform (http://data.cma.cn/). The data can be obtained in the form of a hard disk copy by contacting the authors at present and will be accessed freely at this location soon. The EARS 3 h data on pressure levels and hourly precipitation data are available in GRIB format, which can be used as model (e.g., WRF) forcings. Owning to the large amounts of data, more variables and datasets on the 74 model (sigma) levels can also be obtained by contacting the authors.
We present a detailed report about EARS, including 39-year (1980–2018) high-resolution regional reanalysis datasets over East Asia that show major improvements over the global reanalysis in both spatial resolution and accuracy. The qualities of the reanalysis dataset were verified based on surface observations and radiosonde observations from 2008 to 2017 and radiosonde observations from field experiments in July 2016. Regarding resolution, the 12 km grid is much higher than those of global models. For accuracy, both near-surface and upper-level fields are closer to the observations than the global reanalysis ERA-Interim.
EARS is established based on the WRF-ARW model and the GSI data assimilation system. To improve the EARS performance in East Asia, a series of experiments has been conducted for selecting dynamic and physical options. For GSI, much attention was paid to the improvements of assimilating each category of observations. EARS started cold runs every day, starting at 00:00, 06:00, 12:00, and 18:00 UTC with the ERA-Interim 0.79∘ analysis data at 6 h intervals as initial and boundary conditions. The WRF model was integrated for 12 h each time with hourly outputs, and hourly surface observations were ingested by performing surface observation nudging. The model outputs at the ninth and twelfth hours are used as the first guess of GSI; the upper-level observations were assimilated in 3D-VAR mode, and mosaic radar reflectivities were ingested by cloud analysis.
An important feature of EARS is the use of a large number of observations from the CMA. Compared with IGRA version 2, more than 33 operational radiosonde observations over China were used. In addition, more radiosonde vertical-level observations were included by merging logs of old records. Moreover, radiosonde observations from field experiments over China were also employed. A large number of aircraft observations and surface (over land and sea) hourly observations over China were utilized. Note that only a small portion of the observations has been shared in the GTS. Another characteristic is the application of over 200 Doppler radar observations and the cloud-derived wind vector datasets from Fengyun-2 geostationary meteorological satellites.
To the present, 39-year (1980–2018) reanalysis data have been achieved. To assess the EARS data, 10-year (2008–2017) data were compared with surface and radiosonde observations in terms of RMSE. The results show substantial improvements in EARS compared to the ERA-Interim reanalysis over East Asia. The better performance of EARS is mainly attributable to the data assimilation of a large number of observations. In addition, the optimized WRF model, focusing on East Asia with a high resolution of 12 km and 74 sigma levels, is also beneficial to the high quality of EARS. It should be noted that the present validation is based on the observations from the CMA. Although EARS covers a large area, only limited observations were obtained by the Global Communication System (GTS). We welcome more validation from others with observations outside of China as much as possible.
To date, we have been fully occupied with EARS development and data generation. The EARS data were verified against both surface and sounding observations. The results were also compared with its parent – ERA-Interim. At present, comparisons with other global reanalyses have not been undertaken. As far as we know, the assessment of reanalysis data is a complex and systematic task. Therefore, we expect more scholars to evaluate EARS data from different aspects, such as the performance in reproducing weather systems (e.g., Gong et al., 2022), daily variation in precipitation (e.g., Li et al., 2017), and others, as well as comparisons among different reanalyses (e.g., Yang et al., 2023). In the future, we will further inspect the regional high-resolution data against the observations from the Second Tibetan Plateau Scientific Expedition and Research (STEP) program, in particular using it in high-resolution studies over the East Asian monsoon region. In addition, radar retrieval horizontal wind, which is retrieved by an improved version of the integrating velocity-azimuth process (IVAP) method (Liang et al., 2019), will be ingested by performing upper-level observation nudging. Most importantly, from 2019 onward, we will shift to using the ERA5 products as initial and boundary conditions for the WRF model. In addition, the intensive surface observations (exceeding 80 000) over China after strict quality control will be introduced in the surface observation nudging. EARS will run in real-time operation mode to provide the latest reanalysis data with approximately a 5 d lag (depending on the availability of the ERA5 data).
XL proposed the main scientific ideas and contributed to radar data processing. JY contributed supplementary ideas and produced the 39-year regional reanalysis and validation. FC and JY developed the reanalysis system. JY, XL, and YX analyzed the simulations and wrote the manuscript. KH, LC, and FL contributed to the preparation of observational datasets and reanalysis management. HZ completed the composite radar reflectivity for complex cloud analysis. GW and YZ launched the simulations for WRF model optimization. JL and JX conducted data assimilation experiments. FZ and XS prepared the programs for validation.
The contact author has declared that none of the authors has any competing interests.
Publisher's note: Copernicus Publications remains neutral with regard to jurisdictional claims in published maps and institutional affiliations.
This work was conducted by using the PI-Dawning supercomputer system provided by the China Meteorological Administration (CMA). The authors are grateful to the European Centre for Medium-Range Weather Forecasts (ECMWF) for providing the global reanalysis ERA-Interim data (https://apps.ecmwf.int/datasets, last access: 18 May 2023). We thank Zhiquan Liu at the National Center for Atmospheric Research (NCAR) and Zijiang Zhou at the National Meteorological Information Center (NMIC) of the CMA for their helpful discussions. All the figures are generated by NCAR Command Language (NCL), which is available at https://doi.org/10.5065/D6WD3XH5 (NCAR, 2019).
This study is jointly supported by the National Key Research and Development Program of China (2017YFC1501800), the Second Tibetan Plateau Scientific Expedition and Research (STEP) Program (2019QZKK010402), the National Natural Science Foundation of China (42075083), and the S&T Development Fund of the Chinese Academy of Meteorological Sciences (2023KJ047).
This paper was edited by David Carlson and reviewed by two anonymous referees.
Albers, S. C., McGinley, J. A., Birkenheuer, D. L., and Smart, J. R.: The Local Analysis and Prediction System (LAPS): Analyses of Clouds, Precipitation, and Temperature, Weather Forecast., 11, 273–287, https://doi.org/10.1175/1520-0434(1996)011<0273:TLAAPS>2.0.CO;2, 1996.
Andrys, J., Lyons, T. J., and Kala, J.: Multidecadal Evaluation of WRF Downscaling Capabilities over Western Australia in Simulating Rainfall and Temperature Extremes, J. Appl. Meteorol. Clim., 54, 370–394, https://doi.org/10.1175/JAMC-D-14-0212.1, 2015.
Bach, L., Schraff, C., Keller, J., and Hense, A.: Towards a probabilistic regional reanalysis system for Europe: Evaluation of precipitation from experiments, Tellus A, 68, 32209, https://doi.org/10.3402/tellusa.v68.32209, 2016.
Benjamin, S. G., Jamison, B. D., Moninger, W. R., Sahm, S. R., Schwartz, B. E., and Schlatter, T. W.: Relative Short-Range Forecast Impact from Aircraft, Profiler, Radiosonde, VAD, GPS-PW, METAR, and Mesonet Observations via the RUC Hourly Assimilation Cycle, Mon. Weather Rev., 138, 1319–1343, https://doi.org/10.1175/2009MWR3097.1, 2010.
Bollmeyer, C., Keller, J. D., Ohlwein, C., Wahl, S., Crewell, S., Friederichs, P., Hense, A., Keune, J., Kneifel, S., Pscheidt, I., Redl, S., and Steinke, S.: Towards a high-resolution regional reanalysis for the European CORDEX domain, Q. J. Roy. Meteor. Soc., 141, 1–15, https://doi.org/10.1002/qj.2486, 2015.
Bromwich, D. H., Wilson, A. B., Bai, L., Liu, Z., Barlage, M., Shih, C. F., Maldonado, S., Hines, K. M., Wang, S. H., Woollen, J., Kuo, B., Lin, H. C., Wee, T. K., Serreze, M. C., and Walsh, J. E.: The Arctic System Reanalysis, Version 2, B. Am. Meteorol. Soc., 99, 805–828, https://doi.org/10.1175/BAMS-D-16-0215.1, 2017.
Chen, G., Iwasaki, T., Qin, H., and Sha, W.: Evaluation of the Warm-Season Diurnal Variability over East Asia in Recent Reanalyses JRA-55, ERA-Interim, NCEP CFSR, and NASA MERRA, J. Climate, 27, 5517–5537, https://doi.org/10.1175/JCLI-D-14-00005.1, 2014.
Dee, D. P., Uppala, S. M., Simmons, A. J., Berrisford, P., Poli, P., Kobayashi, S., Andrae, U., Balmaseda, M. A., Balsamo, G., Bauer, P., Bechtold, P., Beljaars, A. C. M., van de Berg, L., Bidlot, J., Bormann, N., Delsol, C., Dragani, R., Fuentes, M., Geer, A. J., Haimberger, L., Healy, S. B., Hersbach, H., Hólm, E. V., Isaksen, L., Kållberg, P., Köhler, M., Matricardi, M., McNally, A. P., Monge-Sanz, B. M., Morcrette, J. J., Park, B. K., Peubey, C., de Rosnay, P., Tavolato, C., Thépaut, J. N., and Vitart, F.: The ERA-Interim reanalysis: configuration and performance of the data assimilation system, Q. J. Roy. Meteor. Soc., 137, 553–597, https://doi.org/10.1002/qj.828, 2011.
Fukui, S., Iwasaki, T., Saito, K., Seko, H., and Kunii, M.: A Feasibility Study on the High-Resolution Regional Reanalysis over Japan Assimilating Only Conventional Observations as an Alternative to the Dynamical Downscaling, J. Meteorol. Soc. Jpn. Ser. II, 96, 565–585, https://doi.org/10.2151/jmsj.2018-056, 2018.
Gao, S., Huang, D., Du, N., Ren, C., and Yu, H.: WRF ensemble dynamical downscaling of precipitation over China using different cumulus convective schemes, Atmos. Res., 271, 106116, https://doi.org/10.1016/j.atmosres.2022.106116, 2022.
Gelaro, R., McCarty, W., Suárez, M. J., Todling, R., Molod, A., Takacs, L., Randles, C. A., Darmenov, A., Bosilovich, M. G., Reichle, R., Wargan, K., Coy, L., Cullather, R., Draper, C., Akella, S., Buchard, V., Conaty, A., da Silva, A. M., Gu, W., Kim, G.-K., Koster, R., Lucchesi, R., Merkova, D., Nielsen, J. E., Partyka, G., Pawson, S., Putman, W., Rienecker, M., Schubert, S. D., Sienkiewicz, M., and Zhao, B.: The Modern-Era Retrospective Analysis for Research and Applications, Version 2 (MERRA-2), J. Climate, 30, 5419–5454, https://doi.org/10.1175/JCLI-D-16-0758.1, 2017.
Gong, Y., Yang, S., Yin, J., Wang, S., Pan, X., Li, D., and Yi, X.: Validation of the Reproducibility of Warm-Season Northeast China Cold Vortices for ERA5 and MERRA-2 Reanalysis, J. Appl. Meteorol. Clim., 61, 1349–1366, https://doi.org/10.1175/JAMC-D-22-0052.1, 2022.
Hersbach, H., Bell, B., Berrisford, P., Hirahara, S., Horányi, A., Muñoz-Sabater, J., Nicolas, J., Peubey, C., Radu, R., Schepers, D., Simmons, A., Soci, C., Abdalla, S., Abellan, X., Balsamo, G., Bechtold, P., Biavati, G., Bidlot, J., Bonavita, M., De Chiara, G., Dahlgren, P., Dee, D., Diamantakis, M., Dragani, R., Flemming, J., Forbes, R., Fuentes, M., Geer, A., Haimberger, L., Healy, S., Hogan, R. J., Hólm, E., Janisková, M., Keeley, S., Laloyaux, P., Lopez, P., Lupu, C., Radnoti, G., de Rosnay, P., Rozum, I., Vamborg, F., Villaume, S., and Thépaut, J.-N.: The ERA5 global reanalysis, Q. J. Roy. Meteor. Soc., 146, 1999–2049, https://doi.org/10.1002/qj.3803, 2020.
Hong, S.-Y., Noh, Y., and Dudhia, J.: A new vertical diffusion package with an explicit treatment of entrainment processes, Mon. Weather Rev., 134, 2318–2341, https://doi.org/10.1175/MWR3199.1, 2006.
Hu, M. and Xue, M.: Implementation and evaluation of cloud analysis with WSR-88D reflectivity data for GSI and WRF-ARW, Geophys. Res. Lett., 34, L07808, https://doi.org/10.1029/2006GL028847, 2007.
Hu, M., Ge, G., Zhou, C., Stark, D., Shao, H., Newman, K., Beck, J., and Zhang, X.: Grid-point Statistical Interpolation (GSI) User's Guide Version 3.7, Developmental Testbed Center, https://dtcenter.org/community-code/gridpoint-statistical-interpolation-gsi/documentation (last access: 10 January 2023), 149 pp., 2018.
Huang, J., Yin, J., Wang, M., He, Q., Guo, J., Zhang, J., Liang, X., and Xie, Y.: Evaluation of Five Reanalysis Products With Radiosonde Observations Over the Central Taklimakan Desert During Summer, Earth and Space Science, 8, e2021EA001707, https://doi.org/10.1029/2021EA001707, 2021.
Iacono, M. J., Delamere, J. S., Mlawer, E. J., Shephard, M. W., Clough, S. A., and Collins, W. D.: Radiative forcing by long-lived greenhouse gases: Calculations with the AER radiative transfer models, J. Geophys. Res.-Atmos., 113, D13103, https://doi.org/10.1029/2008JD009944, 2008.
Ingleby, B., Pauley, P., Kats, A., Ator, J., Keyser, D., Doerenbecher, A., Fucile, E., Hasegawa, J., Toyoda, E., Kleinert, T., Qu, W., St. James, J., Tennant, W., and Weedon, R.: Progress toward High-Resolution, Real-Time Radiosonde Reports, B. Am. Meteorol. Soc., 97, 2149–2161, https://doi.org/10.1175/BAMS-D-15-00169.1, 2016.
Jakob, D., Su, C.-H., Eizenberg, N., Kociuba, G., Steinle, P., Fox-Hughes, P., and Bettio, L.: An atmospheric high-resolution regional reanalysis for Australia, The Bulletin of the Australian Meteorological and Oceanographic Society, 30, 16–23, 2017.
James, E. P., Benjamin, S. G., and Jamison, B. D.: Commercial-Aircraft-Based Observations for NWP: Global Coverage, Data Impacts, and COVID-19, J. Appl. Meteorol. Clim., 59, 1809–1825, https://doi.org/10.1175/JAMC-D-20-0010.1, 2020.
Janjić, Z. I.: The step-mountain eta coordinate model: further developments of the convection, viscous sublayer, and turbulence closure schemes, Mon. Weather Rev., 122, 927–945, https://doi.org/10.1175/1520-0493(1994)122<0927:TSMECM>2.0.CO;2, 1994.
Jiang, H., Xu, W., Yang, S., Zhu, Y., Zhou, Z., and Liao, J.: Development of an Integrated Global Land Surface Dataset from 1901 to 2018, J. Meteorol. Res.-PRC, 35, 789–798, https://doi.org/10.1007/s13351-021-1058-2, 2021.
Kain, J. S.: The Kain–Fritsch Convective Parameterization: An Update, J. Appl. Meteorol., 43, 170–181, https://doi.org/10.1175/1520-0450(2004)043<0170:TKCPAU>2.0.CO;2, 2004.
Kanamitsu, M., Ebisuzaki, W., Woollen, J., Yang, S.-K., Hnilo, J. J., Fiorino, M., and Potter, G. L.: NCEP–DOE AMIP-II Reanalysis (R-2), B. Am. Meteorol. Soc., 83, 1631–1644, https://doi.org/10.1175/BAMS-83-11-1631, 2002.
Kawai, Y., Moteki, Q., Kuwano-Yoshida, A., Enomoto, T., Manda, A., and Nakamura, H.: Impact Propagation of Radiosonde Data Assimilation over the Kuroshio and Kuroshio Extension: Case Study on the Early Summer (Baiu) in 2012, J. Meteorol. Soc. Jpn. Ser. II, 95, 71–90, https://doi.org/10.2151/jmsj.2017-004, 2017.
Kobayashi, S., Ota, Y., Harada, Y., Ebita, A., Moriya, M., Onoda, H., Onogi, K., Kamahori, H., Kobayashi, C., Endo, H., Miyaoka, K., and Takahashi, K.: The JRA-55 Reanalysis: General Specifications and Basic Characteristics, J. Meteorol. Soc. Jpn. Ser. II, 93, 5–48, https://doi.org/10.2151/jmsj.2015-001, 2015.
Lee, M.-H., Kim, J.-H., Song, H.-J., Inoue, J., Sato, K., and Yamazaki, A.: Potential benefit of extra radiosonde observations around the Chukchi Sea for the Alaskan short-range weather forecast, Polar Sci., 21, 124–135, https://doi.org/10.1016/j.polar.2018.12.005, 2019.
Li, J., Chen, T., and Li, N.: Diurnal Variation of Summer Precipitation across the Central Tian Shan Mountains, J. Appl. Meteorol. Clim., 56, 1537–1550, https://doi.org/10.1175/JAMC-D-16-0265.1, 2017.
Li, Y., Wang, D., and Yin, J.: Evaluations of different boundary layer schemes on low-level wind prediction in western Inner Mongolia, Acta Scientiarum Naturalium Universitatis Sunyatseni, 57, 17–29, https://doi.org/10.13471/j.cnki.acta.snus.2018.04.003, 2018.
Liang, X., Xie, Y., Yin, J., Luo, Y., Yao, D., and Li, F.: An IVAP-based dealiasing method for radar velocity data quality control, J. Atmos. Ocean. Tech., 36, 2069–2085, https://doi.org/10.1175/JTECH-D-18-0216.1, 2019.
Liang, X., Yin, J., Xie, Y., and Li, F.: East Asia Reanalysis System of CMA, EGU General Assembly 2020, Online, 4–8 May 2020, EGU2020-1914, https://doi.org/10.5194/egusphere-egu2020-1914, 2020.
Liao, J., Wang, H., Zhou, Z., Liu, Z., Jiang, L., and Yuan, F.: Integration, Quality Assurance, and Usage of Global Aircraft Observations in CRA, J. Meteorol. Res.-PRC, 35, 1–16, https://doi.org/10.1007/s13351-021-0093-3, 2021.
Luo, Y., Zhang, R., Wan, Q., Wang, B., Wong, W. K., Hu, Z., Jou, B. J.-D., Lin, Y., Johnson, R. H., Chang, C.-P., Zhu, Y., Zhang, X., Wang, H., Xia, R., Ma, J., Zhang, D.-L., Gao, M., Zhang, Y., Liu, X., Chen, Y., Huang, H., Bao, X., Ruan, Z., Cui, Z., Meng, Z., Sun, J., Wu, M., Wang, H., Peng, X., Qian, W., Zhao, K., and Xiao, Y.: The Southern China Monsoon Rainfall Experiment (SCMREX), B. Am. Meteorol. Soc., 98, 999–1013, https://doi.org/10.1175/BAMS-D-15-00235.1, 2017.
Mahmood, S., Davie, J., Jermey, P., Renshaw, R., George, J. P., Rajagopal, E. N., and Rani, S. I.: Indian monsoon data assimilation and analysis regional reanalysis: Configuration and performance, Atmos. Sci. Lett., 19, e808, https://doi.org/10.1002/asl.808, 2018.
Mao, J., Shi, X., Ma, L., Kaiser, D. P., Li, Q., and Thornton, P. E.: Assessment of Reanalysis Daily Extreme Temperatures with China's Homogenized Historical Dataset during 1979–2001 Using Probability Density Functions, J. Climate, 23, 6605–6623, https://doi.org/10.1175/2010JCLI3581.1, 2010.
Mesinger, F., DiMego, G., Kalnay, E., Mitchell, K., Shafran, P. C., Ebisuzaki, W., Jović, D., Woollen, J., Rogers, E., Berbery, E. H., Ek, M. B., Fan, Y., Grumbine, R., Higgins, W., Li, H., Lin, Y., Manikin, G., Parrish, D., and Shi, W.: North American Regional Reanalysis, B. Am. Meteorol. Soc., 87, 343–360, https://doi.org/10.1175/BAMS-87-3-343, 2006.
Mirza, A. K., Ballard, S. P., Dance, S. L., Maisey, P., Rooney, G. G., and Stone, E. K.: Comparison of aircraft-derived observations with in situ research aircraft measurements, Q. J. Roy. Meteor. Soc., 142, 2949–2967, https://doi.org/10.1002/qj.2864, 2016.
NCAR: The NCAR Command Language (Version 6.6.2), UCAR/NCAR/CISL/TDD [software], https://doi.org/10.5065/D6WD3XH5, 2019.
Newman, K., Opatz, J., Jensen, T., Prestopnik, J., Soh, H., Goodrich, L., Brown, B., Bullock, R., and Gotway, J. H.: The MET Version 10.1.2 User's Guide, Developmental Testbed Center, https://github.com/dtcenter/MET/releases, last access: 2 October 2022.
Niu, G.-Y., Yang, Z.-L., Mitchell, K. E., Chen, F., Ek, M. B., Barlage, M., Kumar, A., Manning, K., Niyogi, D., Rosero, E., Tewari, M., and Xia, Y.: The community Noah land surface model with multiparameterization options (Noah-MP): 1. Model description and evaluation with local-scale measurements, J. Geophys. Res.-Atmos., 116, D12109, https://doi.org/10.1029/2010JD015139, 2011.
Qiu, Y., Hu, Q., and Zhang, C.: WRF simulation and downscaling of local climate in Central Asia, Int. J. Climatol., 37, 513–528, https://doi.org/10.1002/joc.5018, 2017.
Rabier, F., Faccani, C., Fourrié, N., Agusti-Panareda, A., Karbou, F., Moll, P., Lafore, J. P., Nuret, M., Hdidou, F., and Bock, O.: The Impacts of AMMA Radiosonde Data on the French Global Assimilation and Forecast System, Weather Forecast., 24, 1268–1286, https://doi.org/10.1175/2009WAF2222237.1, 2009.
Reen, B.: A brief guide to observation nudging in WRF, https://www2.mmm.ucar.edu/wrf/users/docs/ObsNudgingGuide.pdf (last access: 19 May 2023), 2016.
Skamarock, W., Klemp, J., Dudhia, J., Gill, D., Barker, D., Duda, M., Huang, X.-Y., Wang, W., and Powers, J.: A Description of the Advanced Research WRF Version 3, NCAR Tech. Note NCAR/TN-475+STR, https://doi.org/10.13140/RG.2.1.2310.6645, 2008.
Thompson, G., Field, P. R., Rasmussen, R. M., and Hall, W. D.: Explicit forecasts of winter precipitation using an improved bulk microphysics scheme. Part II: Implementation of a new snow parameterization, Mon. Weather Rev., 136, 5095–5115, https://doi.org/10.1175/2008MWR2387.1, 2008.
Usui, N., Wakamatsu, T., Tanaka, Y., Hirose, N., Toyoda, T., Nishikawa, S., Fujii, Y., Takatsuki, Y., Igarashi, H., Nishikawa, H., Ishikawa, Y., Kuragano, T., and Kamachi, M.: Four-dimensional variational ocean reanalysis: a 30 year high-resolution dataset in the western North Pacific (FORA-WNP30), J. Oceanogr., 73, 205–233, https://doi.org/10.1007/s10872-016-0398-5, 2017.
Vidal, J.-P., Martin, E., Franchistéguy, L., Baillon, M., and Soubeyroux, J.-M.: A 50 year high-resolution atmospheric reanalysis over France with the Safran system, Int. J. Climatol., 30, 1627–1644, https://doi.org/10.1002/joc.2003, 2010.
Wang, W., Bruyère, C., Duda, M., and Dudhia, J.: User's Guides for the Advanced Research WRF (ARW) Modeling System, http://www2.mmm.ucar.edu/wrf/users/docs/user_guide_V3/contents.html (last access: 19 May 2023), 2017.
Wright, J. S., Fujiwara, M., and Long, C.: Description of the Reanalysis Systems, in: The SPARC Reanalysis Intercomparison Project (S-RIP), edited by: Fujiwara, M., Manney, G., and Wright, J., 138 pp., https://jonathonwright.github.io/ (last access: 19 May 2023), 2019.
Wu, W., Zou, H., Shan, J., and Wu, S.: A Dynamical Z-R Relationship for Precipitation Estimation Based on Radar Echo-Top Height Classification, Adv. Meteorol., 2018, 11, https://doi.org/10.1155/2018/8202031, 2018.
Yang, E.-G., Kim, H. M., and Kim, D.-H.: Development of East Asia Regional Reanalysis based on advanced hybrid gain data assimilation method and evaluation with E3DVAR, ERA-5, and ERA-Interim reanalysis, Earth Syst. Sci. Data, 14, 2109–2127, https://doi.org/10.5194/essd-14-2109-2022, 2022.
Yang, L., Liang, X., Yin, J., Xie, Y., and Fan, H.: Evaluation of the Precipitation of the East Asia regional reanalysis system mainly over mainland China, Int. J. Climatol., 43, 1676–1692, https://doi.org/10.1002/joc.7940, 2023.
Yin, J., Wang, D., and Zhai, G.: A study of characteristics of the cloud microphysical parameterization schemes in mesoscale models and its applicability to China, Advances in Earth Science, 29, 238–249, 2014.
Yin, J., Liang, X., Chen, F., Liu, Y., He, H., Liang, Z., Zou, H., Xu, J., Hao, S., and Xie, Y.: Development of atmospheric data assimilation techniques and regional reanalysis datasets in the East Asia, Advances in Meteorological Science and Technology, 8, 79–84, 2018.
Yin, J., Liang, X., Xie, Y., and Chen, F.: Development of East Asia Reanalysis System (EARS), American Geophysical Union, Fall Meeting 2019, San Francisco, USA, 9–13 December 2019, abstract #A24I-08, 2019.
Yin, J., Zhang, D.-L., Luo, Y., and Ma, R.: On the Extreme Rainfall Event of 7 May 2017 Over the Coastal City of Guangzhou. Part I: Impacts of Urbanization and Orography, Mon. Weather Rev., 148, 955–979, https://doi.org/10.1175/MWR-D-19-0212.1, 2020.
Yin, J., Gu, H., Huang, J., and Wang, M.: An investigation into the vertical structures of low-altitude atmosphere over the Central Taklimakan Desert in summer, Atmos. Sci. Lett., 22, e01042, https://doi.org/10.1002/asl.1042, 2021.
Yin, J., Liang, X., Xie, Y., Li, F., Hu, K., Cao, L., Chen, F., Zou, H., Zhu, F., Sun, X., Xu, J., Wang, G., Zhao, Y., and Liu, J.: East Asia Reanalysis System (EARS), Zenodo [data set], https://doi.org/10.5281/zenodo.7404918, 2022.
Zhang, G., Xue, H., Xu, J., Chen, J., and He, H.: The WRF performance comparison based on Noah and Noah-MP land surface processes on East Asia, Meteorological Monthly, 42, 1058–1068, https://doi.org/10.7519/j.issn.1000-0526.2016.09.003, 2016.
Zhang, J., Zhao, T., Li, Z., Li, C., Li, Z., Ying, K., Shi, C., Jiang, L., and Zhang, W.: Evaluation of Surface Relative Humidity in China from the CRA-40 and Current Reanalyses, Adv. Atmos. Sci., 38, 1958–1976, https://doi.org/10.1007/s00376-021-0333-6, 2021.
Zhao, P., Xu, X., Chen, F., Guo, X., Zheng, X., Liu, L., Hong, Y., Li, Y., La, Z., Peng, H., Zhong, L., Ma, Y., Tang, S., Liu, Y., Liu, H., Li, Y., Zhang, Q., Hu, Z., Sun, J., Zhang, S., Dong, L., Zhang, H., Zhao, Y., Yan, X., Xiao, A., Wan, W., Liu, Y., Chen, J., Liu, G., Zhaxi, Y., and Zhou, X.: The Third Atmospheric Scientific Experiment for Understanding the Earth–Atmosphere Coupled System over the Tibetan Plateau and Its Effects, B. Am. Meteorol. Soc., 99, 757–776, https://doi.org/10.1175/BAMS-D-16-0050.1, 2018.
Zhao, S., He, W., and Jiang, Y.: Evaluation of NCEP-2 and CFSR reanalysis seasonal temperature data in China using detrended fluctuation analysis, Int. J. Climatol., 38, 252–263, https://doi.org/10.1002/joc.5173, 2018.
Zou, H., Shan, J., and Deng, S.: Study of the doppler radar data gridding, Meteorology and Disaster Reduction Research, 37, 23–30, 2014.
Zou, H., Zhang, S., Liang, X., and Yi, X.: Improved algorithms for removing isolated non-meteorological echoes and ground clutters in CINRAD, J. Meteorol. Res.-PRC, 32, 584–597, https://doi.org/10.1007/s13351-018-7176-9, 2018.