the Creative Commons Attribution 4.0 License.
the Creative Commons Attribution 4.0 License.
 | 06 Jun 2023
Emission trends of air pollutants and CO2 in China from 2005 to 2021
Shengyue Li
Qingru Wu
Yanning Zhang
Daiwei Ouyang
Haotian Zheng
Licong Han
Xionghui Qiu
Yifan Wen
Min Liu
Yueqi Jiang
Dejia Yin
Kaiyun Liu
Shaojun Zhang
Ye Wu
Jiming Hao
China is facing the challenge of synergistic reduction of air pollutants and CO2 emissions. However, the studies on its historical progress and future priorities are insufficient. This study compiled China's emission inventory of air pollutants and CO2 from 2005 to 2021 (ABaCAS-EI v2.0 dataset) based on a unified emission-source framework by considering the influences of activity level, technology evolution, and emission control policies. The characteristics of air pollutants and CO2 emissions were comprehensively analyzed from multiple dimensions such as time, space, sector, and synergies between air pollutants and CO2 emissions. Mitigation policies have decoupled the emissions of air pollutants and CO2 with economic development in China since 2013. In the context of growing activity levels, energy structure adjustment and energy and material saving reduced the average annual increase rate of CO2 emissions by 7 % after 2011. Based on this, end-of-pipe control contributed 51 %–98 % of air pollutant emission reductions after 2013. Industrial boilers and residential fossil fuel combustion sectors in seven provinces (Beijing, Tianjin, Shanghai, Jilin, Henan, Sichuan, and Qinghai) achieved emission reductions in both air pollutants and CO2 during 2013–2021. The declining trends in both the sectoral and regional emission ratios of air pollutants to CO2 indicated that the potential for synergistic emission reduction in China declined from 2013 to 2021. The emission ratios in 2021 showed that residential fossil fuel combustion, iron and steel industry, and transportation exhibited relatively higher co-benefits of SO2, PM2.5, NOx, and VOC emission reductions when CO2 emissions were reduced. Most cities with a higher potential to synergistically reduce NOx, VOC, and CO2 emissions were within the Yangtze River Economic Belt, while those with a higher potential to co-control SO2 and CO2, and PM2.5 and CO2 were in southern and northeast China, respectively. Further deconstruction of the sectoral emissions in 2021 suggested future reduction measures: for example, controlling coal consumption in the energy field; promoting innovative technologies with low air pollutant emission intensities and coal-saving measures in the iron and steel industry; combining coal and carbonate replacement technologies with separated particle control measures in the cement industry; and controlling light-duty passenger vehicles, heavy-duty trucks, agricultural machinery, and inland water transport in the transportation sector. Our dataset and findings provide insights into the co-control of air pollutants and CO2 emissions in the future in China and other countries with the same demand. Our ABaCAS-EI v2.0 dataset can be accessed from https://doi.org/10.6084/m9.figshare.21777005.v1 (S. Li et al., 2022) by species, sector, and province.
- Article
(2668 KB) - Full-text XML
-
Supplement
(677 KB) - BibTeX
- EndNote


Presently, China faces two strategic tasks – improving air quality, and achieving carbon peak and carbon neutrality. In June 2022, the “Implementation Plan for Synergistic Effectiveness in Reducing Pollution and Carbon” was issued by the Ministry of Ecology and Environment (MEE) and six other departments, which proposed the synergistic reduction of pollution and carbon to promote the overall green transformation of economic and social development (MEE et al., 2022). Promoting the co-control of air pollutants and CO2 has become inevitable for China's comprehensive green transformation in the new development stage. Therefore, to support the co-control of air pollutants and CO2 emissions, establishing an updated emission inventory of air pollutants and CO2 is vital.
Since the past decade, China has implemented several emission control policies to mitigate air pollutants and CO2 emissions. To control CO2 emissions, China issued its first comprehensive policy document on climate change in 2007, the National Climate Change Program (CPGPRC, 2007), which clarified key fields and corresponding reduction measures to address climate change by 2010. Since 2011, reducing CO2 emission intensity has been included as a blinding target in the Five-Year Plan (CPGPRC, 2008). During these years, CO2 emission reduction measures have been increasingly emphasized and widely implemented, and by the end of 2020, China's CO2 emissions per unit of gross domestic product (GDP) reduced by 48.4 % compared to that in 2005 (CPGPRC, 2021). Among air pollutants, SO2 and particle emissions have been preferentially controlled since the 1990s, followed by NOx emissions based on the 12th Five-Year Plan (2011–2015) (CPGPRC, 2011). In 2013, the Action Plan for the Prevention and Control of Air Pollutants was issued (CPGPRC, 2013), in which key control sectors and air pollution mitigation measures were comprehensively refined. Since then, emissions of multiple air pollutants have rapidly decreased (Zheng et al., 2018; Wang et al., 2022; Lu et al., 2020), and the annual average PM2.5 concentration in China has declined by 58.3 % from 72 µg m−3 in 2013 to 30 µg m−3 in 2021 (MEE, 2021).
Previous studies have separately analysed the emission changes and their drivers of air pollutants and CO2 (Zheng et al., 2020; Geng et al., 2021; C. Li et al., 2022). With the increasing demand for the synergistic reduction of air pollutants and CO2 emissions, researchers have focused on the emission characteristics of air pollutants and CO2 in key sectors (e.g., residential combustion, cement industry, and airport) (You et al., 2022; Liu et al., 2021; Tao et al., 2021; Tang et al., 2022) and key regions (e.g., Yangtze River Delta and Pearl River Delta) (Huang et al., 2021; J. Zheng et al., 2021). For example, Huang et al. (2021), B. Zheng et al. (2021), and Gao et al. (2022) analyzed the spatial and sectoral distribution of air pollutants and CO2 emission characteristics for a given year. Zheng et al. (2018) analyzed the interannual national emission changing trends from 2010 to 2017 and preliminarily explored the contributions of pollution control and activity changes to six macro-emission-source categories; namely, power, industry, residential, transportation, solvent use, and agriculture. However, the changes in air pollutants and CO2 emissions during 2005–2021 and their drivers still need to be explored. More importantly, few studies have examined the sector or region that has achieved emission reductions for both air pollutants and CO2 or the sector or region that has a larger synergetic reduction potential.
Accordingly, to bridge this gap, we compiled a coupled emission dataset of air pollutants and CO2 in mainland China from 2005 to 2021; that is, the Air Benefit and Cost and Attainment Assessment System-Emission Inventory version 2.0 (ABaCAS-EI v2.0), which is an updated version of the ABaCAS-EI (ABaCAS-EI, 2022). The dataset covers CO2 and nine types of air pollutants, including 11 major source categories and more than 280 subsectors. Historical changes in air pollutants and CO2 emissions and their relationships were also explored from the perspectives of control policies, source contributions, and spatial–temporal characteristics. Additionally, the emission status and potential reduction directions have also been discussed for key fields that are expected to reduce air pollutants and CO2 emissions synergistically during the 14th 5-year period in China. The emission dataset and analysis results of this study can provide a foundation for the future synergistic reduction of air pollutants and CO2.
2.1 Emission-source categories
A unified emission-source framework was established for the coupled emission inventory based on the emission-source framework of air pollutants in ABaCAS-EI and the guidelines for the emission inventory of greenhouse gases (NDRC, 2011; Goodwin et al., 2019). The 11 major source categories were power plant, industrial boiler, residential combustion, transportation, open burning, industrial process, solvent usage, oil storage and transportation, waste treatment, agriculture, and other residential sources. Each source had four levels of information: source name (e.g., power plant), subsector name (e.g., coal-fired power), fuels/products/materials (e.g., coal), and technology (e.g., pulverized coal boiler). The air pollutants covered in this emission inventory were SO2, NOx, PM10, PM2.5, BC, OC, VOCs, NH3, and CO. The emission-source framework is presented in Table S1.
For each subsector and species, emissions related to both energy consumption (energy-related emissions) and non-energy consumption processes (process-related emissions) were considered. For example, air pollutants and CO2 emissions from coal combustion and raw material decomposition during the cement clinker production process were all considered in our emission inventory. The energy consumption process generally refers to the fuel combustion and flaring processes, where fuel types, including coal, oil, gas, biomass (or biofuel), and waste, are consumed. Additionally, processes that use energy, such as coking, were also identified as energy-related processes. Other activity processes, such as material treatment and product usage, were identified as non-energy processes.
2.2 Coupled emission inventory
A coupled emission inventory of air pollutants and CO2 was established based on the emission factor method, as shown in Eq. (1):
Here, i represents the province, including 31 provinces in China (excluding Hongkong, Macao, and Taiwan); j represents the emission source, including 285 emission accounting units; p represents emission species, including nine types of air pollutants and CO2; k represents end-of-pipe control measures, such as electrostatic precipitator and fabric filter to control particle emissions; E stands for emission; A is the activity data, such as fuel consumption, product, and material consumption; EF is the emission factor without end-of-pipe pollution control; η is the measure-specific pollution removal efficiency; and R is the measure-specific application ratio.
To simultaneously calculate air pollutants and CO2 emissions, the uniform activity dataset was collected and organized considering the estimated demand for both air pollutants and CO2 emissions under the unified emission-source framework. Most activity data were shared for CO2 and air pollutants concerning fuel consumption and output of industrial products, while some data were separated for CO2 or air pollutant emission estimations, such as calcium carbide production for CO2 and solvent use for VOCs. The activity data were mostly collected from official sources with quality assurance. Details of each emission source are presented comprehensively in Table S2. The emission factors of air pollutants were obtained from localized experiments or integrated from related literature, and those of CO2 were obtained by referring to the guidelines for the emission inventory of greenhouse gases in China (NDRC, 2011) and the guidelines issued by the Intergovernmental Panel on Climate Change (IPCC) (Eggleston et al., 2006; Goodwin et al., 2019). The measure-specific removal efficiencies and their application ratios for air pollutants are collected from official reports, national environmental statistics, industrial investigations, and previous studies (Liu et al., 2018, 2019; Wang et al., 2019; Zheng et al., 2019; Liu et al., 2021; B. Zheng et al., 2021). Data on emission factor, measure removal efficiency, and application ratio have been introduced in detail in our previous peer-reviewed research (Table S3). Regarding CO2 removal, current carbon capture, utilization, and storage (CCUS) technologies are still in the scientific research or demonstration stage, and the annual carbon capture capacity (3 Mt yr−1) is only 0.02 % of the actual emissions in 2021 (Cai et al., 2021). Annual CO2 removal of each province or point source was calculated based on the commissioning time and carbon removal capacity of each demonstration project.
2.3 Uncertainty analysis of the emission inventory
Uncertainties in emission inventories are mainly due to a lack of comprehensive or local information on activity data, emission factors, and pollutant removal conditions. In this study, a Monte Carlo simulation was performed to quantify the uncertainty in emission estimates. Parametric distributions linked to the reliability and accuracy of some data were introduced in our previous studies (Table S3) or collected from the literature (Lang et al., 2014, 2018; Li et al., 2020; Zhou et al., 2022), and CO2-related data were collected from the IPCC guidelines (Goodwin et al., 2019; Eggleston et al., 2006) and literature (Choulga et al., 2021). The Monte Carlo simulation was then repeated 10 000 times to estimate the emissions with a 95 % confidence interval. The uncertainty of the total emissions per species was obtained by combining the values obtained by subsector by province.
3.1 Trends of air pollutants and CO2 emissions
According to the ABaCAS-EI v2.0 dataset, SO2, PM2.5, NOx, VOC, NH3, and CO2 emissions in China were 5.5 (3.9–6.6) Mt, 6.6 (2.8–10.5) Mt, 15.8 (11.2–20.8) Mt, 23.1 (10.7–46.6) Mt, 9.7 (4.6–14.9) Mt, and 12.9 (12.4–13.8) Gt in 2021, respectively. We compared our results with other published datasets, such as the Multi-resolution Emission Inventory model for Climate and air pollution research (MEIC; Zheng et al., 2018), China High Resolution Emission Gridded Data (CHRED; Gao et al., 2022), Community Emissions Data System (CEDS; O'Rourke et al., 2021), Emissions Database for Global Atmospheric Research (EDGAR; Crippa et al., 2020), and International Energy Agency dataset (IEA, 2022) (Fig. S1). The emission trends of air pollutants and CO2 were generally consistent across the different emission datasets. Owing to the differences in the emission-source frameworks (considering CO2 emission sources, for example, in Table S4), some differences were observed among the absolute emissions of the various datasets.
Figure 1 shows the trends in air pollutants and CO2 emissions in China from 2005 to 2021. All air pollutant emissions have declined since 2013. The CO2 emissions showed an increasing trend but at a slower growth rate. During 2005–2011, CO2 emissions had increased by 68 %, which is roughly comparable to the growth rate of the GDP (87 %). However, from 2011 to 2021, China's CO2 emissions only increased by 20 % when GDP growth was up to 91 %. It can be concluded that China's CO2 emissions have relatively decoupled with GDP after 2011 as defined by Organisation for Economic Co-operation and Development (OECD, 2002). The different trends in the emissions of air pollutants and CO2 in China were closely related to reduction policies. As discussed above, the annual growth rate of CO2 emissions significantly reduced since 2011, when the carbon emission intensity was included in the national Five-Year Plan (CPGPRC, 2008). SO2 and PM2.5 emissions continuously decreased since 2005 owing to the requirements of total emission control of SO2 and particles according to the 11th Five-Year Plan. After 2013, almost all air pollutant emissions started decreasing after the “Action Plan for the Prevention and Control of Air Pollutants” was issued (CPGPRC, 2013).
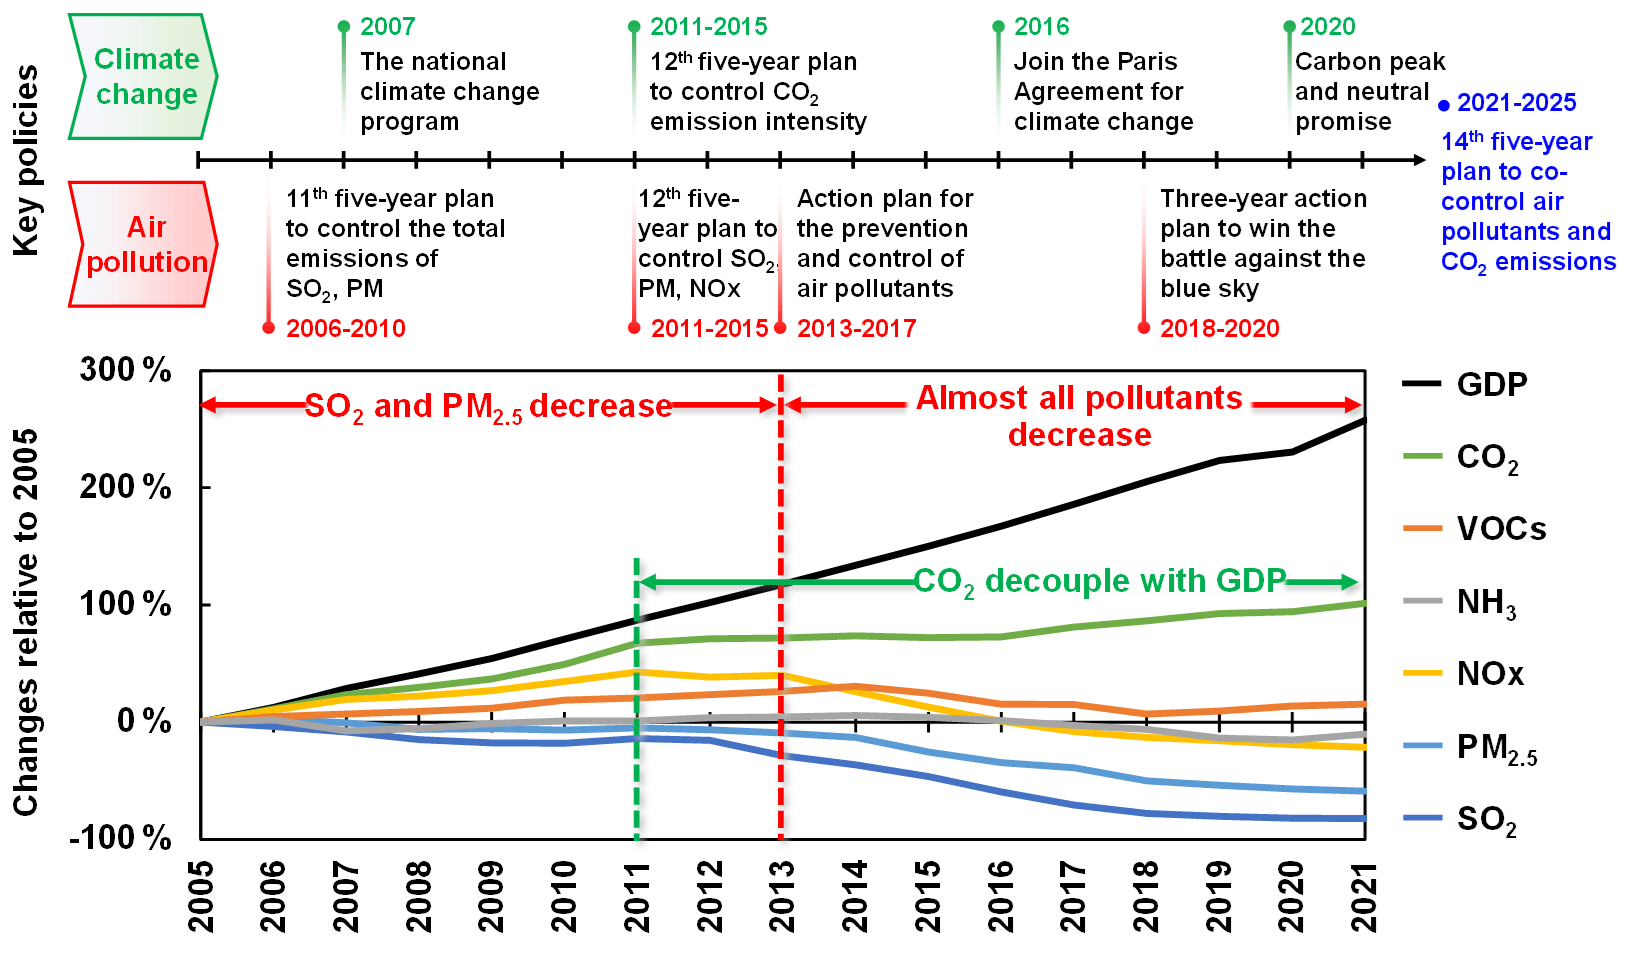
Figure 1Interannual variations of GDP, and emissions of air pollutants and CO2 relative to 2005 in China.
3.2 Sectoral contributions to the emissions of air pollutants and CO2
3.2.1 Sectoral emission changes
To identify key emission reduction sectors in the past, we further comprehensively analyzed emission changes in a total of 15 subsectors (Fig. 2). Before 2013, SO2 emissions were mainly reduced from power plants, whereas PM2.5 and VOC emissions were mainly reduced from the cement industry and on-road vehicles, respectively, which is closely related to the sector-specific emission standards implemented around 2005 (MEE, 2003a, b, 2004). Additionally, with increasing socio-economic development, the spontaneous phase-out of residential biofuel also contributed to emission reductions of PM2.5 and VOCs.
After 2013, air pollutant emissions of almost all sectors started declining with the implementation of the Action Plan for the Prevention and Control of Air Pollutants (CPGPRC, 2013) and the Three-Year Action Plan to Win the Battle against the Blue Sky (CPGPRC, 2018). For SO2, power plants, industrial boilers, and residential fossil fuel combustion were the major reduction contributors, which accounted for more than 75 % of SO2 emission reductions during 2013–2021 in China. End-of-pipe control played a significant role in the first two sectors. Further, the proportion of coal-fired generator units completing ultra-low emission retrofitting increased from 36 % in 2013 to 93 % in 2021. By the end of 2017, the end-of-pipe control level for coal-fired industrial boilers had approached that of coal-fired generator units. Contrastingly, considerable SO2 emission decline in the residential sector was likely due to the energy structure adjustment measures, especially “coal to electricity” and “coal to gas” in northern China, which sharply cut sectoral coal consumption from 173 million tonnes of standard coal (Mtce) in 2013 to 98 Mtce in 2021. Power plants and industrial boilers also contributed the largest (almost 70 %) NOx reductions during 2013–2021 in China because of their ultra-low emission retrofit. Moreover, the cement industry and on-road vehicles contributed an additional 17 % to NOx emission reductions. In the cement industry, some provinces in China took the lead in implementing ultra-low emission standards without national mandatory requirements in recent years, and the proportion of production lines equipped with high-efficiency removal facilities (e.g., a combination of low NOx combustion technology and selective non-catalytic reduction technology) has increased from less than 1 % in 2013 to approximately 25 % in 2021. Further, the proportion of on-road vehicles under China IV–VI standards increased by 50 % from 2013 (16 %) to 2021 (65 %), with NOx emission factors after exhaust gas treatment being 82 %–96 % lower than China II vehicles and 44 %–87 % lower than China III vehicles (Wen et al., 2021). For PM2.5, the iron and steel industry, open burning, and the cement industry were the major reduction contributors, accounting for 29 %, 20 %, and 12 % of PM2.5 emission reductions, respectively, during 2013–2021 in China. These reductions were likely attributed to end-of-pipe control measures. After the related policy was issued (MEE et al., 2019), the proportion of steel production capacity having completed or conducting ultra-low emission retrofitting sharply increased to approximately 60 % nationally within 3 years. Owing to the “no open burning” policy, the average proportion of open burning of straw in China reduced from approximately 25 % in 2013 to 10 % in 2021. Moreover, the no open burning policy also contributed to 1.8 Mt VOC emission reductions during 2013–2021, although its contribution was offset by the increased use of solvents having high VOC content. Regarding NH3, the fertilizer sector dominated the emission changes with 1.1 Mt NH3 emission reductions during 2013–2021, likely due to the policy of total fertilizer application control in recent years. End-of-pipe control measures can be attributed to the air pollutant emission reductions during 2013–2021 in China. A preliminary assessment based on the control variate method (Zhang et al., 2019) showed that end-of-pipe control measures contributed approximately 74 % (51 %–98 %) of the total emission reductions.
Furthermore, power plants were the dominant contributor to the increase in CO2 emissions, accounting for 47 %–77 % of the total CO2 incremental emissions from 2005 to 2021. This was likely because of the continuous increase in fossil fuel consumption, with the share of coal consumption being above 90 % in the power plant sector. Notably, if the energy structure and efficiency were kept at the levels in the year 2005, the CO2 emissions from power plants would increase by a factor of 2.4, the same increase fold as in total power generation (including fossil fuel and non-fossil energy generation) from 2005 to 2021. However, the actual sectoral CO2 emissions showed only a 1.0-fold increase. By inference, the energy mix transformation and energy efficiency improvement offset half of the CO2 emission increase. In terms of the energy structure, the proportion from non-fossil fuel generation increased by 16 % during 2005–2021 (NBS, 2021), especially after 2013 (a 10 % increase from 2013 to 2021). In terms of energy efficiency, the energy consumption rate for electricity supply declined from 370 gce kW h−1 (grams of coal equivalent per kilowatt hour) in 2005 to 303 gce kW h−1 in 2021 (EBCEPY, 2021). Simultaneously, similar measures were also implemented in other sectors, which resulted in a shrink of CO2 emissions growth after 2013 (Fig. 2). For example, energy structure adjustment measures, such as replacing coal and promoting clean energy, have been vigorously promoted in the industrial boiler and residential sectors, which decreased sectoral coal consumption by 23 % and 44 % from 2013 to 2021, respectively. Further, energy efficiency during 2013–2021 in the industrial boiler industry, the iron and steel industry, the cement industry, and on-road vehicle sectors increased by 12 %, 10 %, 10 %, and 22 %, respectively.
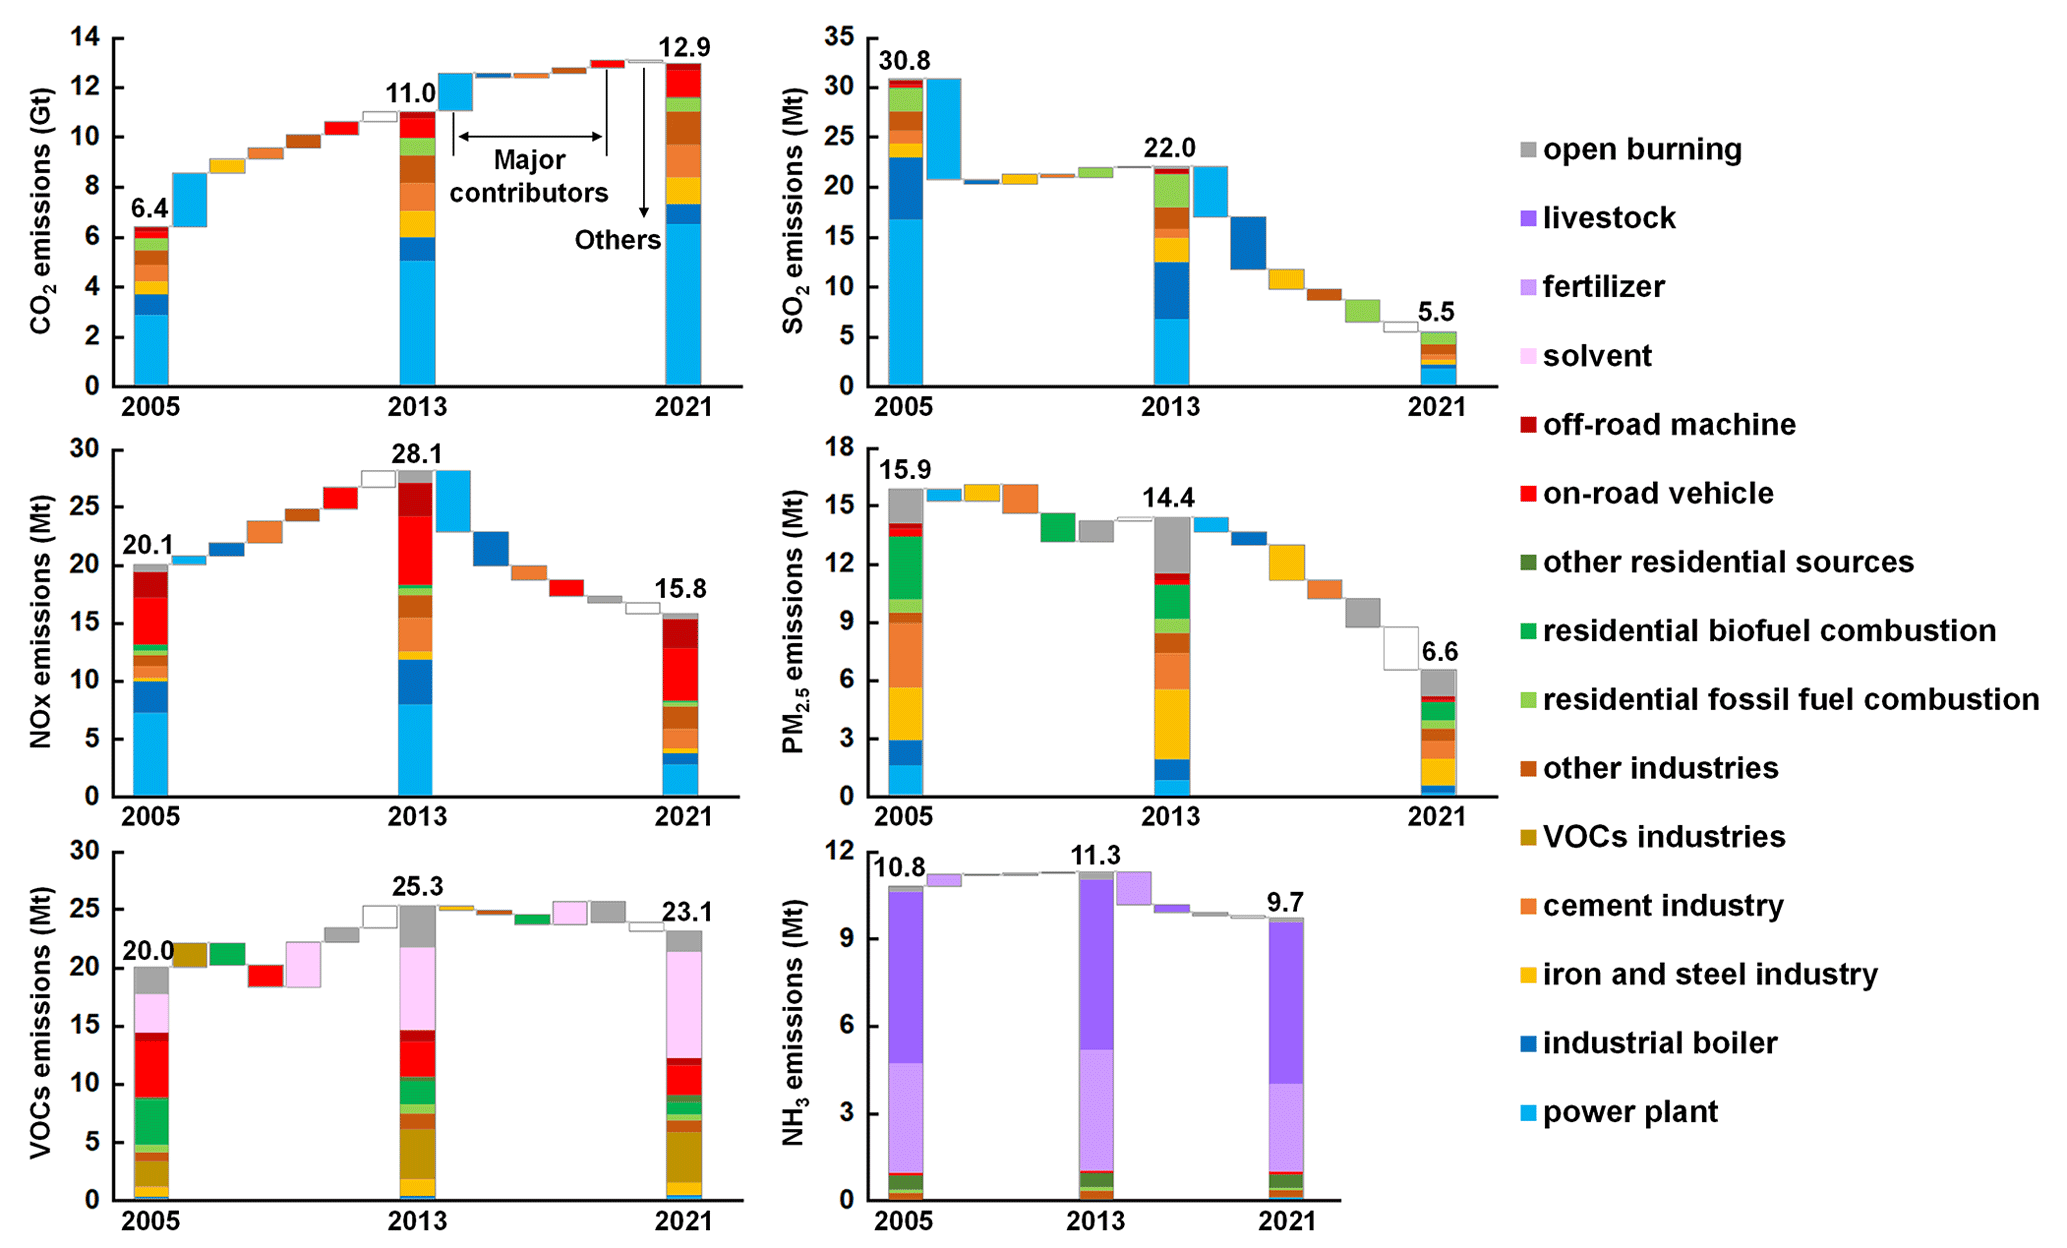
Figure 2Sectoral contributions on the emission changes of air pollutants and CO2 from 2005 to 2021 in China.
3.2.2 Sector-specific synergy of air pollutants and CO2 emissions
The sector-specific changes in air pollutants (excluding NH3) and CO2 emissions are shown in Fig. 3. The seven sectors shown in the figure account for 89 % of CO2 emissions and 22 %–84 % of air pollutant emissions in 2021 (Fig. S2). We found that industrial boilers and residential fossil fuel combustion first achieved simultaneous reductions of air pollutants and CO2 emissions from 2013 to 2021, which was attributed to the energy structure adjustment in these two sectors, as discussed above. However, CO2 emissions did not change significantly from the iron and steel industry and off-road machines during 2013–2021, whereas air pollutant emissions gradually decreased. This was primarily because of a combination of energy and material saving and end-of-pipe control measures. On the one hand, the decrease in energy and material consumption rates offset the effects of increased activity on the sectoral emissions of air pollutants and CO2. For instance, the coal and coke consumption rates in blast furnaces decreased from 148 and 553 kg t−1 in 2013 to 145 and 461 kg t−1 in 2021, respectively, thereby largely curbing coal consumption in the iron and steel industry. The oil consumption rates for agriculture machinery, construction machinery, railway transport, and inland waterway transport declined by 2 %, 3 %, 17 %, and 19 %, respectively. On the other hand, end-of-pipe control measures, such as ultra-low emission retrofitting in the iron and steel industry and emission standard upgrades for off-road machines, resulted in additional air pollutant emission reductions in these two sectors. However, CO2 emissions from the power plant industry, cement industry, and on-road vehicle sectors are still increasing, indicating significant carbon reduction challenges in the coming decades.
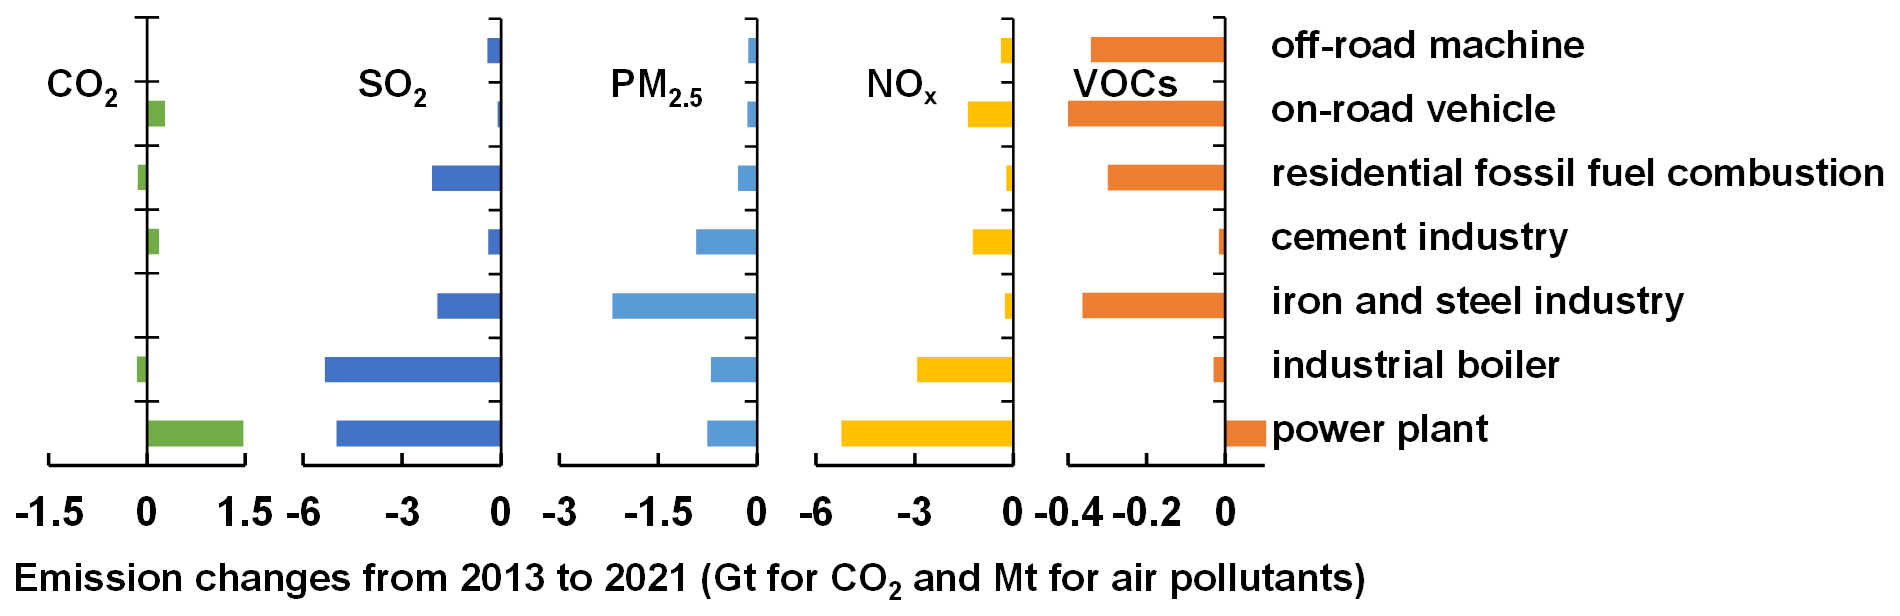
Figure 3Sectoral contributions to the emission changes of air pollutants and CO2 in China during 2013–2021.
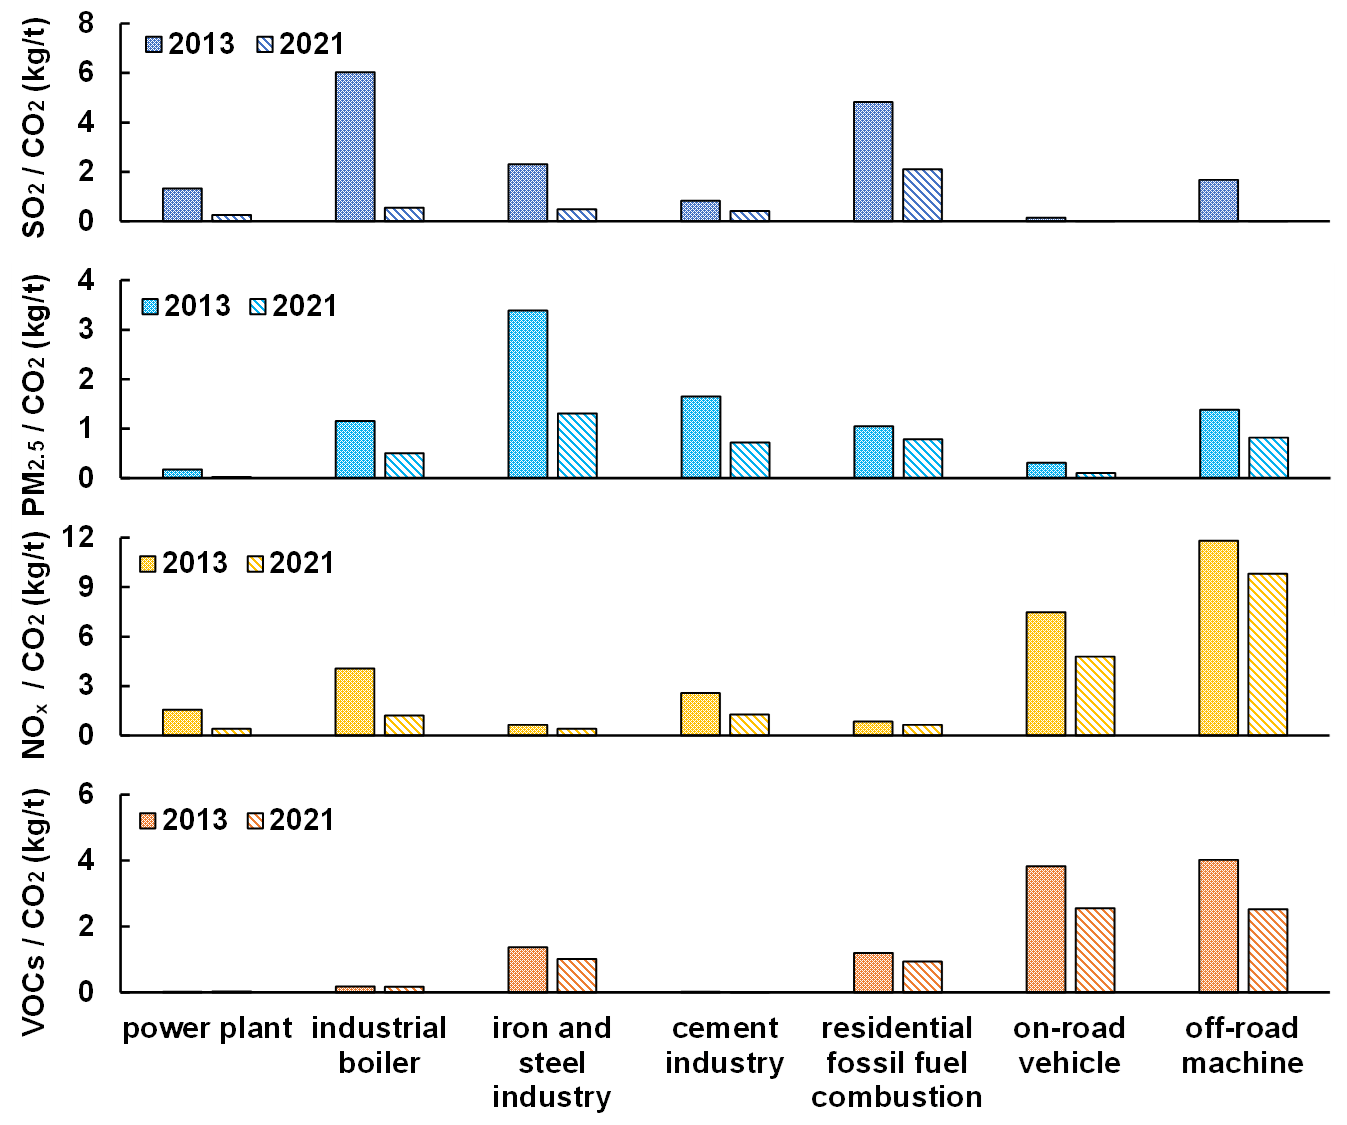
Several studies have indicated that with the exhaustion of end-of-pipe control reduction effects in the future, more ambitious carbon reduction measures would be needed to collaboratively mitigate air pollutant emissions to achieve the World Health Organisation air quality guidelines (Cheng et al., 2021; Xing et al., 2020). In this study, to identify sectors with large air pollutant reduction potential per unit CO2 emission reduction, ratios of air pollutant emissions to CO2 emissions were calculated for each sector. The larger the ratio, the greater the potential for the synergistic reduction of air pollutant emissions under the same CO2 reduction level.
In China during 2013–2021, all ratios of air pollutants to CO2 for key sectors decreased to varying degrees (Fig. 4). Specifically, sectoral , PM2.5 CO2, , and VOCs CO2 ratios declined 49.9 %–99.6 %, 25.0 %–89.2 %, 17.0 %–74.1 %, and 69.0 %–81.1 %, respectively. This probably resulted from the relatively faster emission reduction rates of air pollutants than those of CO2, thus revealing the faster mitigation progress of air pollutants than that of carbon in China in recent years. The greater the proportion of air pollutants that are reduced, the lesser the air pollutant emissions remain to be synergistically reduced with CO2 emissions; that is, the synergistic reduction potential of all sectors weakened. Therefore, identifying sectors with greater potential for synergistic emission reductions is even more important to support effective policymaking in the future.
In 2013, the value of ratio was the highest (6.0) in the industrial boiler sector, followed by the residential fossil fuel combustion sector (4.8). However, in 2021, the highest ratio sector was residential fossil fuel combustion (2.1), with its value being more than 4 times larger than those of other sectors, indicating the potential priority of this sector to synergistically reduce SO2 and CO2 emissions in the future. Energy consumption, particularly from coal combustion, is a major source of SO2 and CO2 emissions. As an energy consumption (especially coal) sector with almost no end-of-pipe control, it is reasonable and predictable that the residential sector had the greatest potential for synergistic SO2 and CO2 reduction in the future when the reduction potential for end-of-pipe control measures was gradually exhausted. For the and VOCs CO2 ratios, transportation sectors, including on-road vehicles and off-road machines, were primarily focused upon, with more than 2 times higher values than those of other sectors. Further, although the iron and steel industry sector had the highest PM2.5 CO2 ratio in both 2013 (3.4) and 2021 (1.3), the ratio value gradually decreased. Particularly, the PM2.5 CO2 ratio for the iron and steel industry sector was more than twice that for the other sectors in 2013, while this value reduced to 1.6 in 2021. Other sectors with comparable ratio levels in 2021, such as residential fossil fuel combustion (0.8), off-road machine (0.8), and the cement industry (0.7), are also suggested for consideration in future synergistic reductions of PM and CO2.
Although the emission ratio results in this study indicated a general direction for synergistic reduction, the ratio only represented the potential of synergistic reduction rather than the real ability, and this gap requires additional attention and further research. This difference may be due to different mechanisms of air pollutants and CO2 production in different sectors. For example, emissions of both PM2.5 and CO2 from the off-road machine sector were directly related to the oil combustion process, which indicated a high potential and ability of this sector to achieve synergistic emission reduction. In the cement industry, PM2.5 emissions mostly originated from material treatment processes (such as cement grinding), and CO2 emissions mainly resulted from coal combustion and raw material calcination. The independent emission generation processes of PM2.5 and CO2 suggest that although the cement industry sector had a relatively high ratio of PM2.5 CO2, its actual synergistic reduction ability was likely poor. Thus, based on the results of this study and the emission mechanisms, further in-depth analysis, such as that from the perspective of reduction measures, is still needed in the future.
3.3 Regional contributions to air pollutants and CO2 emissions
3.3.1 Provincial emission changes
Figure 5 shows the provincial emission changes in air pollutants and CO2 from 2005 to 2013 and 2013 to 2021. Before 2013, only Beijing achieved reductions in both air pollutants and CO2 emissions. Nearly two-thirds of the provinces achieved reductions in SO2 and PM2.5 emissions, while CO2, NOx, and VOC emissions increased in over 90 % of the provinces. Guangdong, Zhejiang, Jiangsu, and Shandong, which were the major contributors in reducing national SO2 and PM2.5 emissions, were all located in regions with heavy air pollution (Jiang et al., 2022), such as the Pearl River Delta (PRD; including some cities located in Guangdong), the Yangtze River Delta (YRD; including Shanghai, Jiangsu, Zhejiang, and Anhui), and the Beijing–Tianjin–Hebei region and its surrounding provinces (BTHs; including Beijing, Tianjin, Hebei, Shanxi, Shandong, and Henan). Inner Mongolia had the largest CO2 emission increase (450 Mt) in China during 2005–2013 due to its high coal consumption (top three in 2013) and the largest increase in coal consumption (210 Mt) during 2005–2013 among the Chinese provinces.
After 2013, seven provinces, namely Beijing, Tianjin, Shanghai, Jilin, Henan, Sichuan, and Qinghai, achieved co-control of the air pollutants and CO2 emissions. However, most provinces are still experiencing a decline in air pollutant emissions and an increase in CO2 emissions. Among the provinces, Hebei, Shandong, and Henan contributed the most to national air pollutant emission reductions, all of which were located in the BTHs region, which has comprehensive and stringent reduction measures (CPGPRC, 2013, 2018). Further, inner Mongolia, Xinjiang, and Shandong accounted for the largest increases in CO2 emissions in recent years and were the top thermal power generators with a faster increase in thermal power generation and coal consumption in China during 2013–2021. Notably, one-third of the provinces, particularly Liaoning, Jiangsu, and Fujian, were still under pressure to reduce both CO2 and VOC emissions.
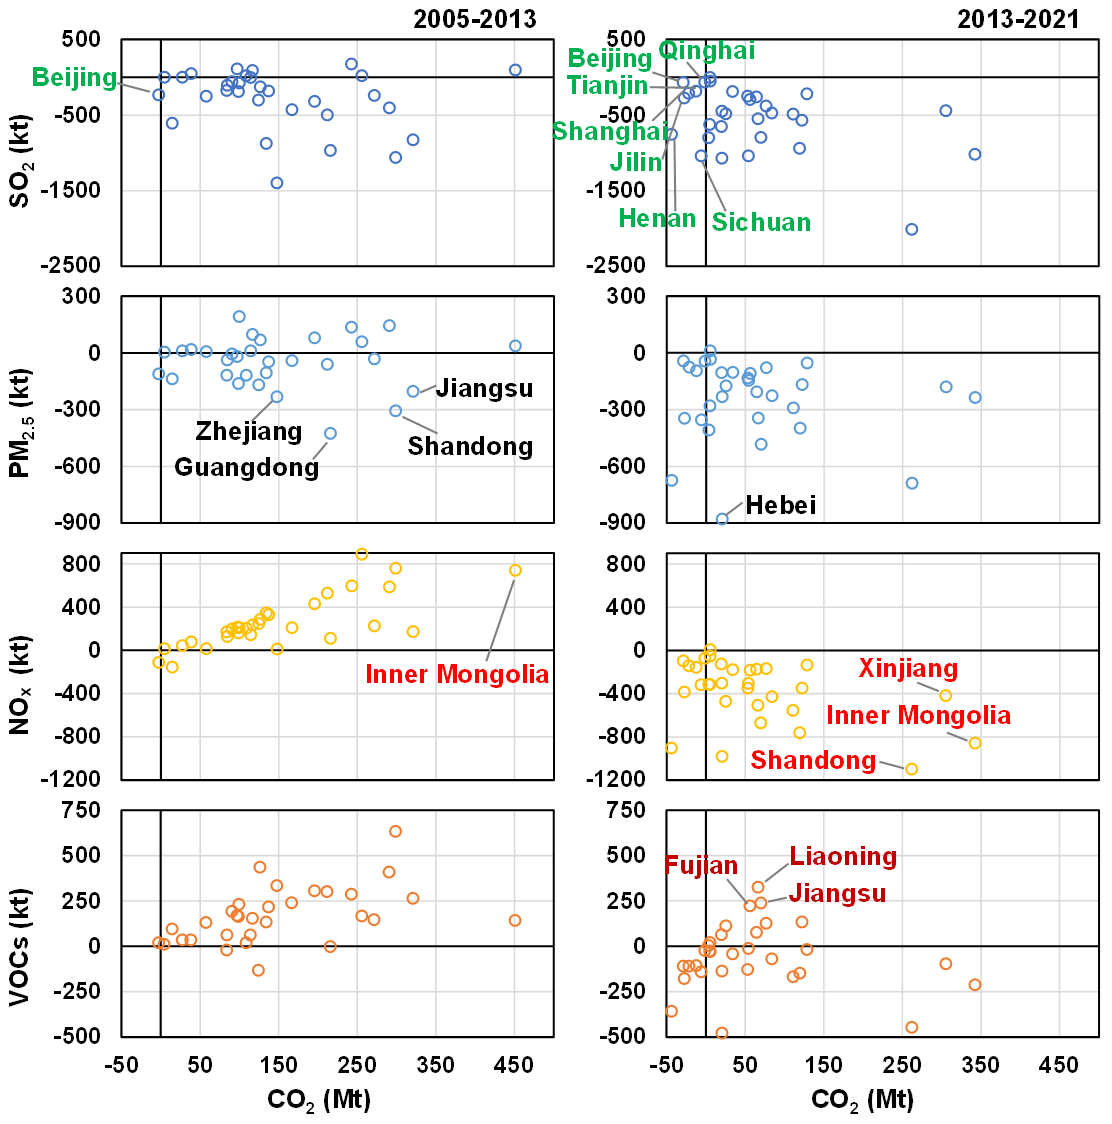
Figure 5Provincial emission changes of air pollutants and CO2 during 2005–2013 and 2013–2021.
3.3.2 Performance of cities on the co-control of air pollutants and CO2
Air pollutants and CO2 emissions were concentrated in the central and eastern parts of China owing to the dense populations and more developed economies in these regions (Fig. S3). To identify hotspots with a greater potential for the synergistic reduction of air pollutants and CO2, cities with higher CO2 emissions were selected to calculate the ratios of air pollutants to CO2 emissions. Finally, 160 cities in 29 provinces (except for Hainan and Xizang provinces) were selected in this study, which accounted for 80 % of the national CO2 emissions. Their air pollutant to CO2 emission ratios in 2013 and 2021 were also calculated (Fig. 6). Generally, a nationwide decline in this ratio was observed. Ratios of showed the largest decrease of 78 % on average, followed by PM2.5 CO2 (61 %), and (51 %). This result was consistent with the analysis results from the perspective of emission sectors, implying that the potential for cities to reduce these three air pollutants and CO2 synergistically may have reduced by more than half on average. However, the VOCs CO2 ratio decreased only by 21 % on average; moreover, the ratios increased by 1 %–24 % in 32 cities. Considering that the current level of VOCs control in China is still weak, a large potential exists for the co-control of VOC and CO2 emissions in the future, especially in the transportation sector, as discussed in Sect. 3.2.2.
We further explored the relationship between the ratio decline and the city's gross regional product (GRP). For and PM2.5 CO2, their decline proportions generally increased as the city GRP increased; in other words, the relatively developed cities, such as Beijing and Shanghai, had the fastest decline in the synergistic reduction potential for SO2, PM2.5, and CO2 emissions. These cities were mostly located in the key regions of China's air pollution mitigation in the past decade (such as BTHs, YRD, PRD, and the Sichuan–Chongqing region), whose reduction intensity (i.e., the application ratio of emission reduction measures) was much greater than that in other cities. At the same time, emission reductions of SO2 and PM2.5 were mainly contributed by end-of-pipe control measures in power plants and industrial sectors (as discussed in Sect. 3.2.1) that do not have synergistic emission reduction effects. These factors ultimately led to a significant decrease in the potential for synergistic reductions in relatively developed cities. While for and VOCs CO2, their decline proportion decreased as the city GRP increased; the more developed cities maintained a higher emission ratio, especially when their GRP was larger than CNY 1000 billion. Unlike SO2 and PM2.5, the decline of synergistic reduction potential in NOx and VOCs with CO2 is much smaller in more developed cities. Considering the considerable contributions from the transportation sector to NOx and VOC emissions (Fig. S2), the promotion of new energy vehicles in recent years was probably the main reason, which was recognized as a measure with a high synergistic reduction ability. By the end of 2021, the new energy vehicle population in Shanghai, Beijing, and Shenzhen increased to 635 000, 507 000, and 544 000, respectively, where the proportions of new energy buses were up to more than 50 %. Although industrial end-of-pipe control measures also contributed to NOx and VOC emission reductions nationwide, new energy vehicles were more widely promoted in relatively developed cities, which had more vehicles and stronger financial strength than less developed cities. This measure finally avoided a greater decrease in the synergistic reduction potential of NOx and VOCs with CO2 in more developed cities as in the case of SO2 and PM2.5.
The average ratio of in cities was 2.0 in 2013, while cities with a ratio >2.0 were rarely observed by 2021; further, high values in 2021 were found in five cities (Guiyang City, Liupanshui City, Zunyi City, Bijie City, and Qiannan Zhou) in northwest Guizhou Province and three cities (Kunming City, Qujing City, and Honghe Zhou) in northern Yunnan Province. In 2013, the average ratio of PM2.5 CO2 in cities was 1.3, with 70 cities above the average; however, the number of cities decreased to just four in 2021, which were Harbin City and Qiqihar City in Heilongjiang Province, Songyuan City in Jilin Province, and Guilin City in Guangxi Province. More than 95 % of the cities had a ratio of >2.0 in 2013, while in 2021, only six cities were observed. These cities were all within the Yangtze River Economic Belt, including Chongqing City, Chengdu City, and Deyang City in Sichuan Province; Wuhan City and Huangang City in Hubei Province; and Anqing City in Anhui Province. Regarding the VOCs CO2 ratio, some separate hotspots located in Yunnan, Xinjiang, and the BTHs region gradually disappeared from 2013 to 2021, while the ratios of some cities in Liaoning Province and eastern coastal areas increased slightly. In 2021, only 12 cities within the Yangtze River Economic Belt showed a VOCs CO2 ratio of >3.0, including two cities (Chengdu City and Deyang City) in Sichuan Province, four cities (Huanggang City, Jingzhou City, Xiangyang City, and Yichang City) in Hubei Province, and six cities (Taizhou City, Zhoushan City, Jinhua City, Shaoxing City, Ningbo City, and Hangzhou City) in Zhejiang Province.
Summing up the target cities with a higher emission ratio of air pollutants to CO2, it can be inferred that city clusters within the Yangtze River Economic Belt have a relatively high potential to conduct synergistic reductions of NOx, VOC, and CO2 emissions, especially in Chengdu, Chongqing, and Huanggang cities. Moreover, cities with a higher potential to co-control SO2 and CO2, and PM2.5 and CO2 were separately located in southern and northeastern China.
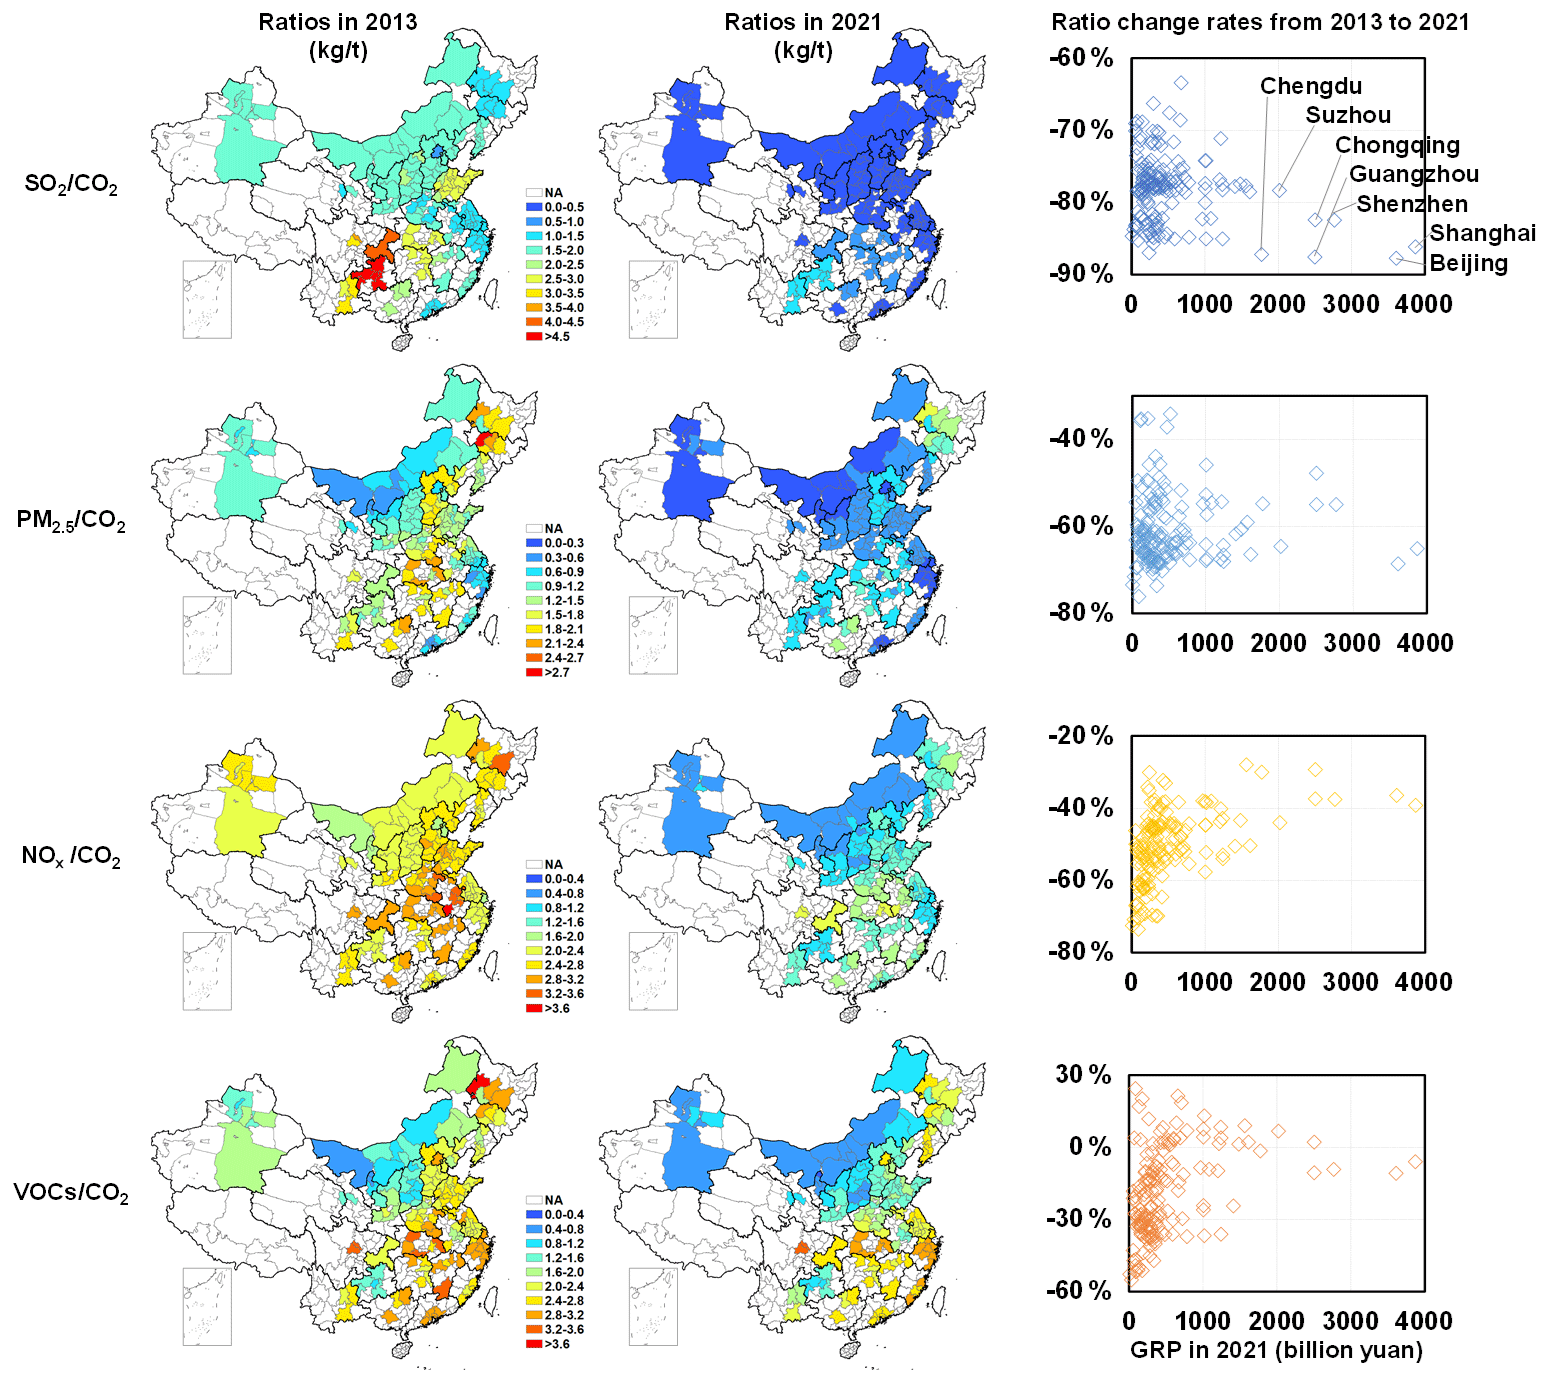
Figure 6The city's ratios and their change rates of air pollutant emission to CO2 emission during 2013—-2021 in China (NA: data not analyzed, GRP: gross regional product).
3.4 Implication for air pollutants and CO2 emission reduction in the future
According to policies for future emission mitigation (MEE et al., 2022), the structural adjustments of energy, industry, and transportation are key measures to promote the synergistic reduction of air pollutants and CO2. Therefore, we comprehensively analyzed these sectors to explore future synergistic emission reduction measures.
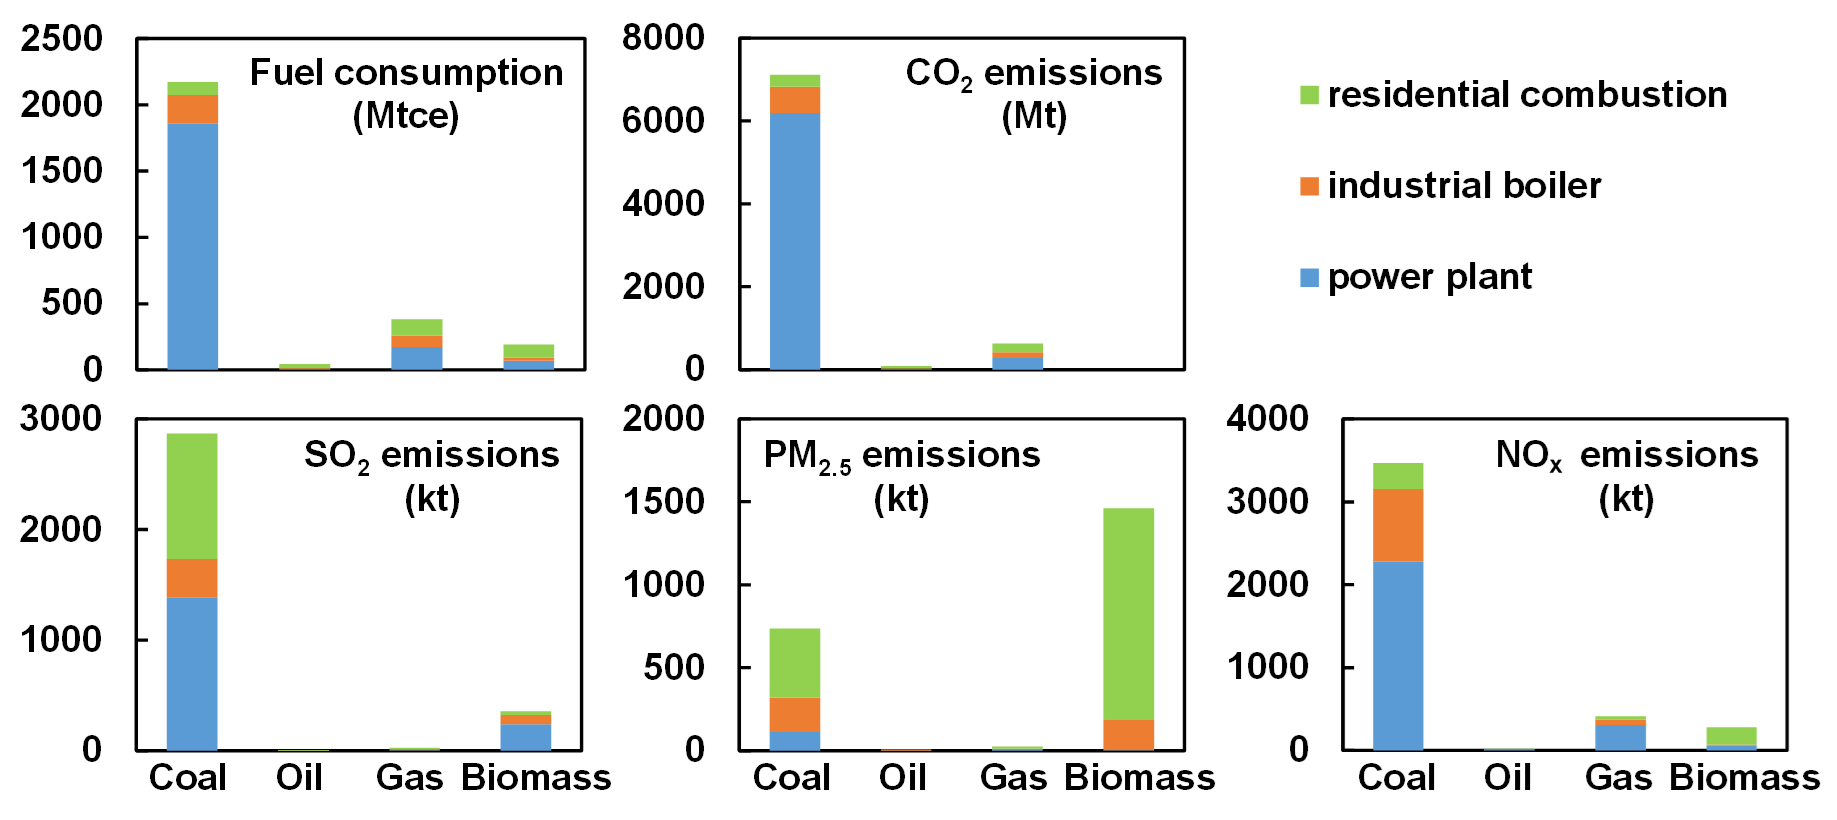
Power plants, residential combustion, and industrial boilers were the major energy combustion sectors, which consumed 64 % of total fuel consumption in 2021. Figure 7 shows that coal was still the dominant fuel in 2021 in China, which accounted for 78 % of the total fuel consumption of energy sectors and contributed 91 %, 88 %, 33 %, and 83 % of CO2, SO2, PM2.5, and NOx emissions from energy sectors, respectively. Moreover, power plants were still the major coal-fired sector with 86 % of energy consumption. Thus, limiting total coal consumption in the future remains a key control policy for the energy sectors. Notably, although biomass only accounted for 7 % of the total fuel consumption of the energy sectors, it contributed 66 % of PM2.5 emissions, because almost no particularly efficient control measures (especially end-of-pipe measures) were employed for residential combustion. Given the difficulty of using de-dusting equipment for residential biomass combustion, biomass fuels are suggested to be concentrated in power plants or industrial sectors as a “zero-carbon” energy that can install end-of-pipe measures.
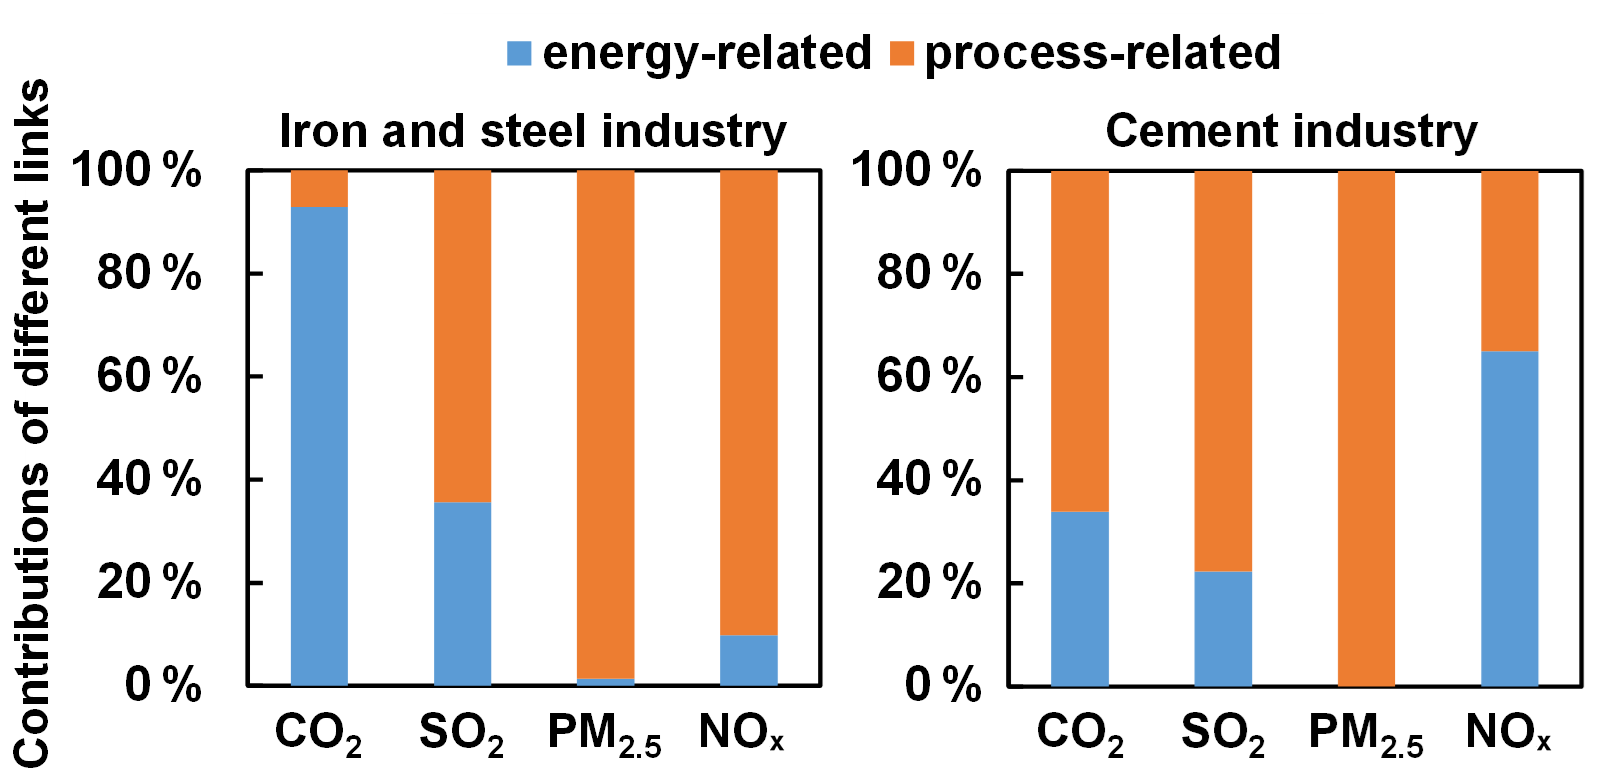
The iron and steel and cement industries were the major industrial sectors contributing 51 %–79 % of industrial CO2 and most air pollutant emissions in 2021 in China. To achieve a synergistic reduction in these two sectors, clean energy promotion and technological reform are ideal control measures for implementation in the future (Wei et al., 2022). Therefore, this study further analyzed the sectoral emissions of energy- and process-related components for control measure implementation (Fig. 8).
In the iron and steel industry, coal is the dominant fuel used in the processes, such as coking, sintering, and blast furnace iron-making. Emissions related to coal consumption are recognized as energy-related emissions; moreover, emissions produced from other processes, such as iron ore treatment, steel-making, casting, and steel-rolling, are process-related emissions. The emission proportions of each process were either calculated based on our emission inventory or were collected from the literature (Ning and Qin, 2006; Zhang et al., 2012; Wang et al., 2014). Interestingly, in 2021, more than 90 % of CO2 was related to energy consumption, but more than 60 % of air pollutant emissions were related to production technology and process. This contradiction poses a significant challenge for the iron and steel industry conducting synergistic emission reductions of air pollutants and CO2. This indicated that replacing coal with clean energy (e.g., natural gas and biofuel) is not sufficient to effectively mitigate sectoral air pollutant emissions; instead, promoting innovative technologies (e.g., H2-based direct reduced iron technology), which have low air pollutant emission intensity and the co-benefit to reduce or avoid coal consumption, is recommended.
Coal is also the major fuel used in cement clinker calcination in the cement industry. Process-related emissions are released during processes, such as raw material processing, material grinding, and cement grinding. The emission proportions of each process were either calculated based on our emission inventory or were collected from the literature (Bai et al., 2019). Coal consumption contributes 34 %, 22 %, and 65 % of CO2, SO2, and NOx emissions, respectively, in 2021, indicating that promoting clean energy has considerable potential and value to achieve synergistic reduction. Regarding process-related emissions, CO2 was mainly released from the use of limestone, SO2 was mainly released from the use of raw materials containing sulfate, and PM2.5 was closely related to the grinding process. This indicated that improving the material structure or quality has the potential to co-control CO2 and SO2 emissions, whereas specific control measures are needed to reduce sectoral PM2.5 emissions with limited synergistic reduction potential.
The transportation sector includes nine types of on-road vehicles and four types of off-road machines (Fig. 9). Considering that oil combustion is the main source of sectoral emissions, promoting new energy and improving fuel efficiency are two possible measures to synergistically reduce air pollutants and CO2 emissions (Wu et al., 2017). In the on-road vehicle subsector in 2021, light-duty passenger vehicles contributed 43 % of CO2 and 49 % of VOC emissions, while heavy-duty trucks contributed 33 % of CO2 and 65 % of NOx emissions. This suggested that emission reduction measures should be prioritized for light-duty passenger vehicles and heavy-duty trucks. For the off-road machine subsector, agricultural machinery and inland water transport contributed 32 %–58 % and 31 %–58 % of air pollutants and CO2 emissions, respectively, indicating their considerable potential for synergistic reduction.
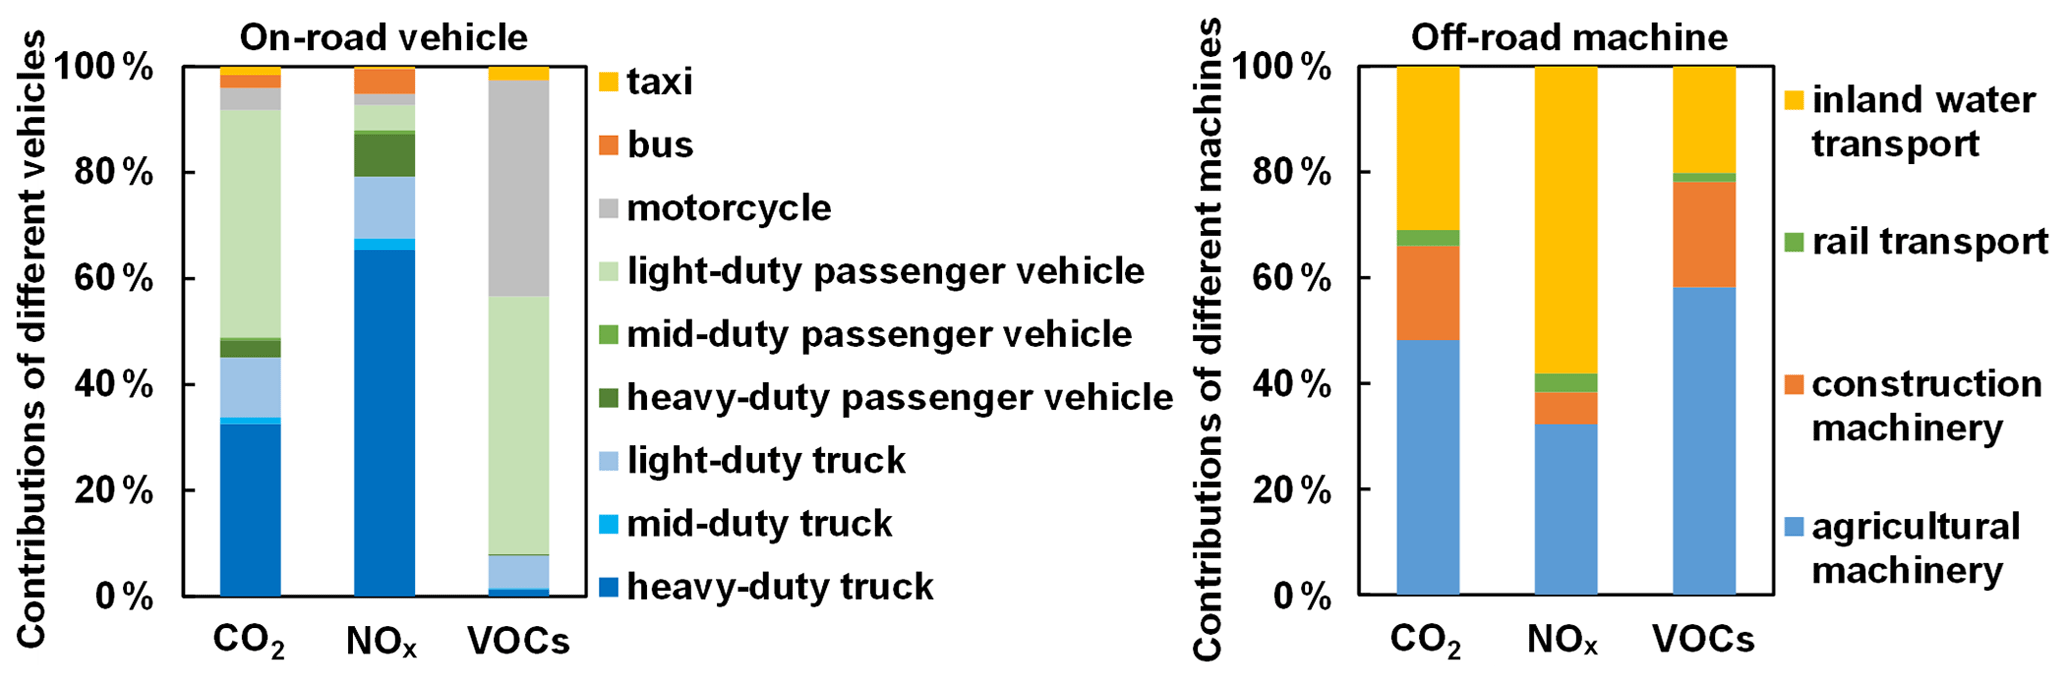
Figure 9Emission contributions from different types of transport facilities in 2021 in China.
3.5 Emission uncertainty analysis
Based on the Monte Carlo simulation, the uncertainties in the emission estimation for SO2, PM2.5, NOx, VOCs, NH3, and CO2 were within [−30 %, 19 %], [−58 %, 60 %], [−29 %, 32 %], [−54 %, 102 %], [−53 %, 53 %], and [−4 %, 6 %]. Uncertainties in emission inventories were mainly due to a lack of comprehensive or local information on activity data, emission factors, and pollutant removal conditions. The highest uncertainty was observed for VOC emissions. One important reason for this is that the complexity of VOC-related emission sources likely introduced great uncertainty in acquiring activity data and testing emission factors. For example, the solvent sector accounts for nearly half of VOC emissions in China. Although this study has considered nearly 30 types of solvents used in several fields (such as industry, transportation, agriculture, and residential) (Table S1), in real life, each type of solvent includes multiple products with different features (such as being solvent based, water based, and powder based) and compositions from various manufacturers. Further, owing to sectoral complexity, there are still no public or official statistics on the consumption of different types of solvents for different applications, and localized testing of emission factors for different types of solvents is also limited. In recent years, several teams have attempted to test solvent-related VOC emission factors (Sun et al., 2020; Gao et al., 2021). Future studies could combine these works to further reduce emission uncertainties. Additionally, PM2.5 emissions also have a relatively high level of uncertainty, which is related to the difficulty in accessing pollutant removal conditions in industrial sectors. In recent years, as emission standards continue to be stringent, end-of-pipe equipment (such as desulfurisation, denitrification, and dust removal facilities) has been widely used and rapidly updated in various industrial sectors (Wang et al., 2020; Bo et al., 2021). However, as such data are still subject to a high level of confidentiality and a certain release lag, the emission inventory may not be able to accurately and promptly capture the application and efficiency of the equipment, thus, creating uncertainties in emission estimates. Future inventory updates will require the revision of such data based on new pollution censuses or environmental statistics.
The ABaCAS-EI v2.0 dataset can be accessed from https://doi.org/10.6084/m9.figshare.21777005.v1 (S. Li et al., 2022).
To support the co-control of air pollutants and CO2 emissions in China in the future, we introduced the ABaCAS-EI v2.0 dataset, which is a coupled emission inventory of air pollutants and CO2 based on a unified emission-source framework. An analysis of interannual emission trends from 2005 to 2021 revealed that China's air pollutants and CO2 emissions decoupled from economic development. The implementation of reduction measures has been the major driver affecting emission changes in the past decade in China. Further, on exploring the changes in sectoral emissions, we found that air pollutant emissions were mitigated faster than CO2 emissions in China. Generally, the implementation of structural adjustment measures and energy and material saving measures has significantly slowed the rate of increase in CO2 emissions; moreover, end-of-pipe control measures have dominantly contributed to the emission reductions of air pollutants for most sectors. During 2013–2021, the power plant industry, the cement industry, and the on-road vehicle sectors were still in the phase of decreasing air pollutant emissions but showed an increase in CO2 emissions. Analysis of regional emission changes revealed that the number of provinces achieving emission reduction in both air pollutants and CO2 increased from one (Beijing) during 2005–2013 to seven (Beijing, Tianjin, Shanghai, Jilin, Henan, Sichuan, and Qinghai) during 2013–2021. However, more than three-quarters of the provinces are still experiencing reduced air pollutant emissions and increased CO2 emissions. Based on the emission status and ratio method of air pollutants to CO2, we preliminarily explored future emission reduction directions in China. The discussion is based on policy preference for reducing air pollutants per unit of CO2 emission reduction. Among these sectors, residential fossil fuel combustion had the greatest potential for synergistic emission reduction of SO2 and CO2, corresponding to the effects of the iron and steel industry on PM2.5 and CO2 and those of the transportation sectors on NOx, VOCs, and CO2. Among cities, city clusters with relatively higher potential to synergistically reduce NOx, VOC, and CO2 emissions were mostly in the Yangtze River Economic Belt, while those with higher potential to co-control SO2 and CO2, and PM2.5 and CO2 were separately located in southern and northeastern China. Considering measure implementation, the mitigation potential of measures to optimize the field structure and save energy and materials should be further promoted to achieve synergistic emission reductions of air pollutants and CO2. For example, controlling the total coal combustion and promoting new energy will remain the focus of future synergistic emission reductions in the energy sector, with attention paid to the need for biomass fuels accompanied by air pollutant control equipment. Innovative process technologies with coal substitution can bring more effective synergistic emission reduction profits to the iron and steel industry. Further, for the cement industry, new energy and pollutant-specific emission reduction technologies should be promoted. Light-duty passenger vehicles, heavy-duty trucks, agricultural machinery, and inland waterways are the focus of synergistic emission reduction in the transportation sector.
However, this emission inventory dataset has certain shortcomings. In terms of species, only conventional pollutants and CO2 were included in this dataset. However, as research on pollution causes, climate change, and health risks progresses (Cui et al., 2022; Liu et al., 2023; Zheng et al., 2023), the importance and emission estimation needs are gradually increasing for non-conventional pollutants (e.g., semi-volatile and intermediate volatile organic compounds and heavy metals) and non-CO2 greenhouse gases (e.g., CH4 and N2O). An integrated and coupled dataset containing multiple pollutants and greenhouse gases has yet to be established. In terms of sources, the emission estimation method was relatively simplified and rough for non-industrial sectors such as cooking, livestock farming, and fertilizer application in our dataset. However, the impact of these sectors on air quality and climate change may gradually increase with the standardization and improvement of industrial sector controls (Xu et al., 2022). The methodology for accounting for non-industrial emissions requires further refinement and improvement.
The ABaCAS-EI v2.0 dataset in this study can provide data support for future synergistic emission control of air pollutants and CO2 in China. Analysis of the historical emission reduction process and deconstruction of the current emission status can provide insights for future planning and formulation of synergistic emission reduction policies and paths. Simultaneous reduction of sectoral air pollutants and CO2 emissions is possible from different measures, but this does not imply that the emission sector has truly achieved synergistic reduction. Moreover, reductions are not synergetic when one measure has an opposite effect on air pollutants and CO2 emissions (Zhang et al., 2019; Shi et al., 2022). Thus, future studies on emission reduction measures and their synergistic reduction effects and potential should be further conducted.
The supplement related to this article is available online at: https://doi.org/10.5194/essd-15-2279-2023-supplement.
SL, SW, QW, and JH designed the study. SL developed the emission inventory. YZ, DO, HZ, LH, KL, XQ, YW, and ML helped to improve the emission inventory. YJ and DY did the spatial distribution of the emission inventory. SL wrote the original draft; all the co-authors revised the paper.
The contact author has declared that none of the authors has any competing interests.
Publisher's note: Copernicus Publications remains neutral with regard to jurisdictional claims in published maps and institutional affiliations.
This study has been jointly funded by the National Key Research and Development Program (grant no. 2022YFC3702900), the National Natural Science Foundation of China (grant no. 22188102), and the Tsinghua–Toyota Joint Research Center.
This paper was edited by Jing Wei and reviewed by three anonymous referees.
Air Benefit and Cost and Attainment Assessment System-Emission Inventory (ABaCAS-EI), http://www.abacas-dss.com/abacas/Software.aspx, last access: 14 December 2022.
Bai, D., Mei, J., Li, H., and Xu, Y.: Calculation and analysis of influencing factors of SO2 emission in cement plant, Chin. Cem., 11, 78–80, 2019.
Bo, X., Jia, M., Xue, X., Tang, L., Mi, Z., Wang, S., Cui, W., Chang, X., Ruan, J., Dong, G., Zhou, B., and Davis, S. J.: Effect of strengthened standards on Chinese ironmaking and steelmaking emissions, Nat. Sustain., 4, 811–820, https://doi.org/10.1038/s41893-021-00736-0, 2021.
Cai, B., Li, Q., and Zhang, X.: China Carbon Dioxide Capture, Use and Storage (CCUS) Annual Report (2021)-China CCUS Pathway Study, Institute of Environmental Planning of Ministry of Ecology and Environment, Institute of Rock and Soil Mechanics of Chinese Academy of Sciences, The Administrative Center for China's Agenda 21, 2021.
Cheng, J., Tong, D., Zhang, Q., Liu, Y., Lei, Y., Yan, G., Yan, L., Yu, S., Cui, R. Y., Clarke, L., Geng, G., Zheng, B., Zhang, X., Davis, S. J., and He, K.: Pathways of China's PM2.5 air quality 2015–2060 in the context of carbon neutrality, Natl. Sci. Rev., 8, 1–11, https://doi.org/10.1093/nsr/nwab078, 2021.
Choulga, M., Janssens-Maenhout, G., Super, I., Solazzo, E., Agusti-Panareda, A., Balsamo, G., Bousserez, N., Crippa, M., Denier van der Gon, H., Engelen, R., Guizzardi, D., Kuenen, J., McNorton, J., Oreggioni, G., and Visschedijk, A.: Global anthropogenic CO2 emissions and uncertainties as a prior for Earth system modelling and data assimilation, Earth Syst. Sci. Data, 13, 5311–5335, https://doi.org/10.5194/essd-13-5311-2021, 2021.
CPGPRC (The Central People's Government of the People's Republic of China): National Climate Change Program, http://www.gov.cn/zwgk/2013-09/12/content_2486773.htm (last access: 14 December 2022), 2007.
CPGPRC (The Central People's Government of the People's Republic of China): The CPC Central Committee's proposal on the formulation of the Eleventh Five-Year Plan, http://www.gov.cn/test/2008-08/20/content_1075373.htm (last access: 14 December 2022), 2008.
CPGPRC (The Central People's Government of the People's Republic of China): Outline of the Twelfth Five-Year Plan for National Economic and Social Development, http://www.gov.cn/zhuanti/2011-03/16/content_2623428_2.htm (last access: 14 December 2022), 2011.
CPGPRC (The Central People's Government of the People's Republic of China): Action plan for the prevention and control of air pollutants, http://www.gov.cn/zwgk/2013-09/12/content_2486773.htm (last access: 14 December 2022), 2013.
CPGPRC (The Central People's Government of the People's Republic of China): Three-year action plan to win the battle against the blue sky, http://www.gov.cn/zhengce/content/2018-07/03/content_5303158.htm (last access: 14 December 2022), 2018.
CPGPRC (The Central People's Government of the People's Republic of China): China's policies and actions on climate change, http://www.gov.cn/zhengce/2021-10/27/content_5646697.htm (last access: 14 December 2022), 2021.
Crippa, M., Solazzo, E., Huang, G., Guizzardi, D., Koffi, E. N., Muntean, M., Schieberle, C., Friedrich, R., and Janssens-Maenhout, G.: Towards time varying emissions: development of high resolution temporal profiles in the Emissions Database for Global Atmospheric Research, Nat. Sci. Data, https://doi.org/10.6084/m9.figshare.12052887, 2020.
Cui, Y., Wu, Q., Liu, K., Wang, S., Wang, X., Jiang, T., Meng, B., Wu, Y., and Guo, J.: Source apportionment of speciated mercury in Chinese rice grain using a high-resolution model, ACS Environmental Au., 2, 324–335, https://doi.org/10.1021/acsenvironau.1c00061, 2022.
EBCEPY (Editorial board of China Electric Power Yearbook): China Electric Power Yearbook, China electric power press, edited by: Yu, C., Beijing, ISBN 9787519864477, 2021.
Eggleston, H. S., Buendia, L., Miwa, K., Ngara, T., and Tanabe, K.: 2006 IPCC Guidelines for National Greenhouse Gas Inventories, Institute for Global Environmental Strategies, Japan, 2006.
Gao, M., Liu, W., Wang, H., Shao, X., Shi, A., An, X., Li, G., and Nie, L.: Emission factors and characteristics of volatile organic compounds (VOCs) from adhesive application in indoor decoration in China, Sci. Total Environ., 779, 145169, https://doi.org/10.1016/j.scitotenv.2021.145169, 2021.
Gao, Y., Zhang, L., Huang, A., Kou, W., Bo, X., Cai, B., and Qu, J.: Unveiling the spatial and sectoral characteristics of a high-resolution emission inventory of CO2 and air pollutants in China, Sci. Total Environ., 847, 157623, https://doi.org/10.1016/j.scitotenv.2022.157623, 2022.
Geng, G., Zheng, Y., Zhang, Q., Xue, T., Zhao, H., Tong, D., Zheng, B., Li, M., Liu, F., Hong, C., He, K., and Davis, S. J.: Drivers of PM2.5 air pollution deaths in China 2002–2017, Nat. Geosci., 14, 645–650, https://doi.org/10.1038/s41561-021-00792-3, 2021.
Goodwin, J., Gillenwater, M., Romano, D., and Radunsky, K.: 2019 Refinement to the 2006 IPCC Guidelines for National Greenhouse Gas Inventories, Intergovernmental Panel on Climate Change, Switzerland, edited by: Calvo Buendia, E., Tanabe, K., Kranjc, A., Baasansuren, J., Fukuda, M., Ngarize S., Osako, A., Pyrozhenko, Y., Shermanau, P., and Federici, S., IPCC, Switzerland, ISBN 978-4-88788-232-4, 2019.
Huang, C., An, J., Wang, H., Liu, Q., Tian, J., Wang, Q., Hu, Q., Yan, R., Shen, Y., Duan, Y., Fu, Q., Shen, J., Ye, H., Wang, M., Wei, C., Cheng, Y., and Su, H.: Highly resolved dynamic emissions of air pollutants and greenhouse gas CO2 during COVID-19 Pandemic in east China, Environ. Sci. Technol. Lett., 8, 853–860, https://doi.org/10.1021/acs.estlett.1c00600, 2021.
IEA: Global Energy Review: CO2 Emissions in 2021, IEA, Paris, https://www.iea.org/reports/global-energy-review-co2-emissions-in-2021-2 (last access: 14 December 2022), 2022.
Jiang, Y., Wang, S., Xing, J., Zhao, B., Li, S., Chang, X., Zhang, S., and Dong, Z.: Ambient fine particulate matter and ozone pollution in China: synergy in anthropogenic emissions and atmospheric processes, Environ. Res. Lett., 17, 123001, https://doi.org/10.1088/1748-9326/aca16a, 2022.
Lang, J., Cheng, S., Zhou, Y., Zhang, Y., and Wang, G.: Air pollutant emissions from on-road vehicles in China, 1999–2011, Sci. Total Environ., 496, 1–10, https://doi.org/10.1016/j.scitotenv.2014.07.021, 2014.
Lang, J., Tian, J., Zhou, Y., Li, K., Chen, D., Huang, Q., Xing, X., Zhang, Y., and Cheng, S.: A high temporal-spatial resolution air pollutant emission inventory for agricultural machinery in China, J. Clean. Prod., 183, 1110–1121, https://doi.org/10.1016/j.jclepro.2018.02.120, 2018.
Li, C., Hammer, M. S., Zheng, B., and Cohen, R. C.: Accelerated reduction of air pollutants in China, 2017–2020, Sci. Total Environ., 803, 150011, https://doi.org/10.1016/j.scitotenv.2021.150011, 2022.
Li, S., Wang, S., Wu, Q., Zhang, Y., Ouyang, D., Zheng, H., Han, L., Qiu, X., Wen, Y., Liu, M., Jiang, Y., Yin, D., Liu, K., Zhao, B., Zhang, S., Wu, Y., and Hao, J.: Emission trends of air pollutants and CO2 in China from 2005 to 2021, figshare [data set], https://doi.org/10.6084/m9.figshare.21777005.v1, 2022.
Li, S. Y., Lang, J. L., Zhou, Y., Liang, X., Chen, D., and Wei, P.: Trends in ammonia emissions from light-duty gasoline vehicles in China, 1999–2017, Sci. Total Environ., 700, 1–9, https://doi.org/10.1016/j.scitotenv.2019.134359, 2020.
Liu, J., Tong, D., Zheng, Y., Cheng, J., Qin, X., Shi, Q., Yan, L., Lei, Y., and Zhang, Q.: Carbon and air pollutant emissions from China's cement industry 1990–2015: trends, evolution of technologies, and drivers, Atmos. Chem. Phys., 21, 1627–1647, https://doi.org/10.5194/acp-21-1627-2021, 2021.
Liu, K., Wang, S., Wu, Q., Wang, L., Ma, Q., Zhang, L., Li, G., Tian, H., Duan, L., and Hao, J.: A highly resolved mercury emission inventory of Chinese coal-fired power plants, Environ. Sci. Technol., 52, 2400–2408, https://doi.org/10.1021/acs.est.7b06209, 2018.
Liu, K., Wu, Q., Wang, L., Wang, S., Liu, T., Ding, D., Tang, Y., Li, G., Tian, H., Duan, L., Wang, X., Fu, X., Feng, X., and Hao, J.: Measure-specific effectiveness of air pollution control on China's atmospheric mercury concentration and deposition during 2013–2017, Environ. Sci. Technol., 53, 8938–8946, https://doi.org/10.1021/acs.est.9b02428, 2019.
Liu, S., Liu, K., Wang, K., Chen, X., and Wu, K.: Fossil-fuel and food systems equally dominate anthropogenic methane emissions in China, Environ. Sci. Technol., 57, 2495–2505, https://doi.org/10.1021/acs.est.2c07933, 2023.
Lu, X., Zhang, S., Xing, J., Wang, Y., Chen, W., Ding, D., Wu, Y., Wang, S., Duan, L., and Hao, J.: Progress of Air Pollution Control in China and Its Challenges and Opportunities in the Ecological Civilization Era, Engineering, 6, 1423–1431, https://doi.org/10.1016/j.eng.2020.03.014, 2020.
MEE (Ministry of Ecological Environment): Emission standard of air pollutants for thermal power plants (GB 13223-2003), Ministry of Ecological Environment, China Environmental Science Press, ISBN 978-5123-4422-8, 2003a.
MEE (Ministry of Ecological Environment): Announcement on the implementation of the national emission standards for motor vehicles in the second stage, https://www.mee.gov.cn/gkml/zj/wj/200910/t20091022_172223.htm (last access: 3 June 2023), 2003b.
MEE (Ministry of Ecological Environment): Emission standard of air pollutants for cement industry (GB 4915-2004), Ministry of Ecological Environment, China Environmental Science Press, ISSN 1671-8321, 2004.
MEE (Ministry of Ecological Environment), National Development and Reform Commission, Ministry of Industry and Information Technology, Ministry of Finance, Ministry of Transport: Opinions on promoting the implementation of ultra-low emissions in the iron and steel industry, https://www.gov.cn/zhengce/zhengceku/2019-10/10/content_5438149.htm (last access: 3 June 2023), 2019.
MEE (Ministry of Ecological Environment): Bulletin on China’s Ecological Environment 2013–2021, https://www.mee.gov.cn/hjzl/sthjzk/zghjzkgb/ (last access: 3 June 2023), 2021.
MEE (Ministry of Ecological Environment), National Development and Reform Commission, Ministry of Industry and Information Technology, Ministry of Housing and Urban-Rural Development, Ministry of Transport, Ministry of Agriculture and Rural Affairs, China National Energy Administration: mplementation Plan for Synergistic Effectiveness in Reducing Pollution and Carbon, https://www.gov.cn/zhengce/zhengceku/2022-06/17/content_5696364.htm (last access: 3 June 2023), 2022.
National Bureau of Statistics (NBS): China Energy Statistical Yearbook 2021, edited by: Hu, H., China Statistics Press, Beijing, ISBN 978-7-5230-0106-6, 2021.
NDRC (National Development and Reform Commission): Guidelines for compiling provincial greenhouse gas inventories (Trial), http://www.cbcsd.org.cn/sjk/nengyuan/standard/home/20140113/download/shengjiwenshiqiti.pdf (last access: 3 June 2023), 2011.
Ning, L. and Qin, J.: Analysis of nitrogen oxide emission from pulverized coal injection in blast furnace ironmaking, Metall. Environ. Prot., 6, 44–46, 2006.
OECD: Sustainable development: indicators to measure decoupling of environmental pressure from economic growth, OECD Secretariat, OECD, Paris, SG/SD(2022)1/FINAL, 2002, 2002.
O'Rourke, P. R, Smith, S. J., Mott, A., Ahsan, H., McDuffie, E. E., Crippa, M., Klimont, S., McDonald, B., Z., Wang, Nicholson, M. B, Feng, L., and Hoesly, R. M.: CEDS v-2021-02-05 Emission Data 1975–2019, Zenodo [data set], https://doi.org/10.5281/zenodo.4509372, 2021.
Shi, Q., Zheng, B., Zheng, Y., Tong, D., Liu, Y., Ma, H., Hong, C., Geng, G., Guan, D., He, K., and Zhang, Q.: Co-benefits of CO2 emission reduction from China's clean air actions between 2013-2020, Nat. Commun., 13, 5061, https://doi.org/10.1038/s41467-022-32656-8, 2022.
Sun, C., Shi, A., Bai, H., Chen, X., Zhai, Y., and Li, G.: Emission characteristics of the catering industry in Beijing, Environ. Sci., 41, 2596–2601, 2020.
Tang, L., Ruan, J., Bo, X., Mi, Z., Wang, S., Dong, G., and Davis, S. J.: Plant-level real-time monitoring data reveal substantial abatement potential of air pollution and CO2 in China's cement sector, One Earth, 5, 892–906, https://doi.org/10.1016/j.oneear.2022.07.003, 2022.
Tao, S., Shen, G., Cheng, H., and Ma, J.: Toward clean residential energy: Challenges and priorities in research, Environ. Sci. Technol., 55, 13602–13613, https://doi.org/10.1021/acs.est.1c02283, 2021.
Wang, G., Deng, J., Zhang, Y., Zhang, Q., Duan, L., Hao, J., and Jiang, J.: Air pollutant emissions from coal-fired power plants in China over the past two decades, Sci. Total Environ., 741, 140326, https://doi.org/10.1016/j.scitotenv.2020.140326, 2020.
Wang, X., Yan, L., and Lei, Y.: Discussion on particulate matter emission and control in China's iron and steel industry, Environ. Sust. Dev., 39, 21–25, https://doi.org/10.19758/j.cnki.issn1673-288x.2014.05.006, 2014.
Wang, X., Lei, Y., Yan, L., Liu, T., Zhang, Q., and He, K.: A unit-based emission inventory of SO2, NOx and PM for the Chinese iron and steel industry from 2010 to 2015, Sci. Total Environ., 676, 18–30, https://doi.org/10.1016/j.scitotenv.2019.04.241, 2019.
Wang, Z., Hu, B., Zhang, C., Atkinson, P. M., Wang, Z., Xu, K., Chang, J., Fang, X., Jiang, Y., and Shi, Z.: How the Air Clean Plan and carbon mitigation measures co-benefited China in PM2.5 reduction and health from 2014 to 2020, Environ. Int., 169, 107510, https://doi.org/10.1016/j.envint.2022.107510, 2022.
Wei, Y., Yu, B., Tang, B., Liu, L., Liao, H., Chen, J., Sun, F., An, R., Wu, X., and Tan, J.: Study on the schedule and roadmap of carbon peaking carbon neutralization in China, J. Beijing Inst. Technol., 24, 14, https://doi.org/10.15918/j.jbitss1009-3370.2022.1165, 2022.
Wen, Y., Zhang, S., He, L., Yang, S., Wu, X., and Wu, Y.: Characterizing start emissions of gasoline vehicles and the seasonal, diurnal and spatial variabilities in China, Atmos. Environ., 245, 118040, https://doi.org/10.1016/j.atmosenv.2020.118040, 2021.
Wu, Y., Zhang, S., Hao, J., Liu, H., Wu, X., Hu, J., Walsh, M. P., Wallington, T. J., Zhang, K. M., and Stevanovic, S.: On-road vehicle emissions and their control in China: A review and outlook, Sci. Total Environ., 574, 332–349, https://doi.org/10.1016/j.scitotenv.2016.09.040, 2017.
Xing, J., Lu, X., Wang, S., Wang, T., Ding, D., Yu, S., Shindell, D., Ou, Y., Morawska, L., Li, S., Ren, L., Zhang, Y., Loughlin, D., Zheng, H., Zhao, B., Liu, S., Smith, K. R., and Hao, J.: The quest for improved air quality may push China to continue its CO2 reduction beyond the Paris Commitment, P. Natl. Acad. Sci. USA, 117, 29535–29542, https://doi.org/10.1073/pnas.2013297117, 2020.
Xu, W., Zhao, Y., Wen, Z., Chang, Y., Pan, Y., Sun, Y., Ma, X., Sha, Z., Li, Z., Kang, J., Liu, L., Tang, A., Wang, K., Zhang, Y., Guo, Y., Zhang, L., Sheng, L., Zhang, X., Gu, B., Song, Y., Van Damme, M., Clarisse, L., Coheur, P. F., Collett, J. L., Jr., Goulding, K., Zhang, F., He, K., and Liu, X.: Increasing importance of ammonia emission abatement in PM2.5 pollution control, Sci. Bull. (Beijing), 67, 1745–1749, https://doi.org/10.1016/j.scib.2022.07.021, 2022.
You, Q., Li, H., Bo, X., Zheng, Y., and Chen, S.: Study on air pollution and CO2 emission inventory of Chinese civil aviation airport, Chin. Environ. Sci., 42, 4517–4524, https://doi.org/10.19674/j.cnki.issn1000-6923.20220706.001, 2022.
Zhang, Q., Zheng, Y., Tong, D., Shao, M., Wang, S., Zhang, Y., Xu, X., Wang, J., He, H., Liu, W., Ding, Y., Lei, Y., Li, J., Wang, Z., Zhang, X., Wang, Y., Cheng, J., Liu, Y., Shi, Q., Yan, L., Geng, G., Hong, C., Li, M., Liu, F., Zheng, B., Cao, J., Ding, A., Gao, J., Fu, Q., Huo, J., Liu, B., Liu, Z., Yang, F., He, K., and Hao, J.: Drivers of improved PM2.5 air quality in China from 2013 to 2017, P. Natl. Acad. Sci. USA, 116, 24463–24469, https://doi.org/10.1073/pnas.1907956116, 2019.
Zhang, X., Wu, G., Wu, S., and Xiang, X.: Determination of carbon dioxide emission factors in typical processes for large iron-steel companies, Acta Scientiae Circumstantiae, 32, 2024–2027, https://doi.org/10.13671/j.hjkxxb.2012.08.009, 2012.
Zheng, B., Cheng, J., Geng, G., Wang, X., Li, M., Shi, Q., Qi, J., Lei, Y., Zhang, Q., and He, K.: Mapping anthropogenic emissions in China at 1 km spatial resolution and its application in air quality modeling, Sci. Bull., 66, 612–620, https://doi.org/10.1016/j.scib.2020.12.008, 2021.
Zheng, B., Tong, D., Li, M., Liu, F., Hong, C., Geng, G., Li, H., Li, X., Peng, L., Qi, J., Yan, L., Zhang, Y., Zhao, H., Zheng, Y., He, K., and Zhang, Q.: Trends in China's anthropogenic emissions since 2010 as the consequence of clean air actions, Atmos. Chem. Phys., 18, 14095–14111, https://doi.org/10.5194/acp-18-14095-2018, 2018.
Zheng, H., Cai, S., Wang, S., Zhao, B., Chang, X., and Hao, J.: Development of a unit-based industrial emission inventory in the Beijing–Tianjin–Hebei region and resulting improvement in air quality modeling, Atmos. Chem. Phys., 19, 3447–3462, https://doi.org/10.5194/acp-19-3447-2019, 2019.
Zheng, H., Chang, X., Wang, S., Li, S., Yin, D., Zhao, B., Huang, G., Huang, L., Jiang, Y., Dong, Z., He, Y., Huang, C., and Xing, J.: Trends of full-volatility organic emissions in China from 2005 to 2019 and their organic aerosol formation potentials, Environ. Sci. Technol. Lett., 10, 137–144, https://doi.org/10.1021/acs.estlett.2c00944, 2023.
Zheng, J., Sha, Q., Bi, L., Chen, C., Chen, Z., Cui, X., Hu, J., Hu, M., HUang, Z., Li, Z., Liu, H., Lu, M., Ming, G., Rao, S., Tang, M., Junchi, W., Wang, Y., Wang, Y., Wu, L., Xu, Y., Zhang, L., Zhang, X., Zhang, X., and Zhong, Z.: Emission inventory products of air pollutants, greenhouse gases and heavy metals from the same sources in Guangdong Province in 2019 v1.0, Jinan University institute for environmental and climate research, Guangdong, 2021.
Zheng, X., Lu, Y., Yuan, J., Baninla, Y., Zhang, S., Stenseth, N. C., Hessen, D. O., Tian, H., Obersteiner, M., and Chen, D.: Drivers of change in China's energy-related CO2 emissions, P. Natl. Acad. Sci. USA, 117, 29–36, https://doi.org/10.1073/pnas.1908513117, 2020.
Zhou, Y., Xia, X., Lang, J., Zhao, B., Chen, D., Mao, S., Zhang, Y., Liu, J., and Li, J.: A coupled framework for estimating pollutant emissions from open burning of specific crop residue: A case study for wheat, Sci. Total Environ., 844, 156731, https://doi.org/10.1016/j.scitotenv.2022.156731, 2022.