the Creative Commons Attribution 4.0 License.
the Creative Commons Attribution 4.0 License.
 | 02 Jun 2023
LegacyClimate 1.0: a dataset of pollen-based climate reconstructions from 2594 Northern Hemisphere sites covering the last 30 kyr and beyond
Ulrike Herzschuh
Thomas Böhmer
Chenzhi Li
Manuel Chevalier
Raphaël Hébert
Anne Dallmeyer
Xianyong Cao
Nancy H. Bigelow
Larisa Nazarova
Elena Y. Novenko
Jungjae Park
Odile Peyron
Natalia A. Rudaya
Frank Schlütz
Lyudmila S. Shumilovskikh
Pavel E. Tarasov
Yongbo Wang
Ruilin Wen
Qinghai Xu
Zhuo Zheng
Here we describe LegacyClimate 1.0, a dataset of the reconstruction of the mean July temperature (TJuly), mean annual temperature (Tann), and annual precipitation (Pann) from 2594 fossil pollen records from the Northern Hemisphere, spanning the entire Holocene, with some records reaching back to the Last Glacial Period. Two reconstruction methods, the modern analog technique (MAT) and weighted averaging partial least squares regression (WA-PLS), reveal similar results regarding spatial and temporal patterns. To reduce the impact of precipitation on temperature reconstruction, and vice versa, we also provide reconstructions using tailored modern pollen data, limiting the range of the corresponding other climate variables. We assess the reliability of the reconstructions, using information from the spatial distributions of the root mean squared error in the prediction and reconstruction significance tests. The dataset is beneficial for synthesis studies of proxy-based reconstructions and to evaluate the output of climate models and thus help to improve the models themselves. We provide our compilation of reconstructed TJuly, Tann, and Pann as open-access datasets at PANGAEA (https://doi.org/10.1594/PANGAEA.930512; Herzschuh et al., 2023a). The R code for the reconstructions is provided at Zenodo (https://doi.org/10.5281/zenodo.7887565; Herzschuh et al., 2023b), including the harmonized open-access modern and fossil datasets used for the reconstructions, so that customized reconstructions can be easily established.
- Article
(13387 KB) - Full-text XML
- BibTeX
- EndNote


The comparison of climate model outputs with climate data is essential for model improvements (Eyring et al., 2019). The extratropical Northern Hemisphere is of particular interest because it is known for complex spatial and temporal temperature and precipitation patterns. However, the period for which instrumental observations are available is only of limited use to validate simulations, in particular when assessing the climate response to natural climate drivers, because it is too short and because it is impacted by human-induced greenhouse gas forcing. Climate proxy data derived from natural archives are therefore of great value.
Previous proxy-based climate inferences have contributed to major debates about Holocene climate change. For example, while simulations indicate gradual warming of the Holocene, temperature proxy data syntheses rather support a mid-Holocene optimum, which resulted in the “Holocene conundrum” debate (Liu et al., 2014). While the debate has progressed since, new proxy-based syntheses can help us to understand regional differences and contribute further to the debate. Qualitative proxy-based inferences indicate that the mid-Holocene in the Northern Hemisphere midlatitudes was rather dry and warm when compared with the present day, which is in agreement with modeling outputs (Routson et al., 2019). Also, quantitative precipitation reconstructions from eastern and central Asia unveiled the complex monsoon–westerlies interactions (Chen et al., 2019; Herzschuh et al., 2019). However, evaluating modeling outputs using proxy-based reconstructions is a complex task and strongly depends on the purpose of the proxy data–model comparison study (e.g., the purpose of an evaluation could either target the mean or site-specific changes or it could target relative changes or absolute values, or the purpose could be to infer spatial or temporal climate variability at specific scales). All these types of evaluations require a specific handling of the proxy data and have to be considered for proxy–model comparisons.
Fossil pollen records are well established in their use as a paleoecological and paleoclimatological proxy and are of great value as indicators of past environmental and climatic change over many decades. Considerable efforts have been made to establish regional, continental, and even global data repositories like the North American Pollen Database (NAPD; https://www.ncei.noaa.gov/products/paleoclimatology, last access: 1 July 2020), the European Pollen Database (EPD; http://www.europeanpollendatabase.net/index.php, last access: 1 July 2020), and the Neotoma Paleoecology Database (https://www.neotomadb.org/, last access: 1 April 2021; Williams et al., 2018). Pollen data from archives across multiple environmental settings, such as lakes, wetlands, or marine sediments, have been widely used to quantitatively reconstruct past vegetation and climate variables (Birks, 2019; Chevalier et al., 2020). Among land-derived proxy data, pollen is particularly suitable for a temporarily and spatially high-resolution evaluation of climate model simulations of the late Quaternary period. A number of methods have been proposed for making pollen-based climate reconstructions (Chevalier et al., 2020). Among them, classification approaches like the modern analog technique (MAT) or regression approaches like the weighted averaging partial least squares regression (WA-PLS) are most commonly used. MAT and WA-PLS rely on extensive collections of modern spectra. Hence, designing a robust calibration dataset from modern pollen assemblages is a crucial part of the reconstruction process. A suitable calibration dataset should cover a wide range of climatic and environmental gradients in order to represent an empirical relationship between pollen assemblages and climate (Birks et al., 2010; Chevalier et al., 2020). As with fossil pollen records, data syntheses and repositories also exist for modern surface pollen data, e.g., for North America (Whitmore et al., 2005), Eurasia (Davis et al., 2013, 2020), and China (Cao et al., 2013; Herzschuh et al., 2019).
For temperature reconstruction time series, several broad-scale syntheses exist; however, they either originate from different proxies (Kaufman et al., 2020a, b) or are restricted to certain continents or regions and/or are poorly documented (Mauri et al., 2015; Marsicek et al., 2018; Routson et al., 2019). Temperature reconstructions from extratropical Asia are mostly lacking. Precipitation syntheses are available from Europe (Mauri et al., 2015), North America (Gajewski et al., 2000), and China and Mongolia (Herzschuh et al., 2019), but hitherto, no global or hemispheric syntheses of quantitative precipitation changes are available for the Holocene.
In a recent effort, we synthesized and taxonomically harmonized pollen records available in the Neotoma Paleoecology Database (Williams et al., 2018) and additional records from China and Siberia (Cao et al., 2013, 2020) into a global late Quaternary fossil pollen dataset (LegacyPollen 1.0; Herzschuh et al., 2022b) and revised all chronologies of those records using a Bayesian approach that allows for the inference of temporal uncertainties (LegacyAge 1.0; Li et al., 2022). Here, in the third part of a series of interconnected studies, we present the pollen-based reconstruction of the mean July temperature (TJuly), mean annual temperature (Tann), and annual precipitation (Pann), including the reconstruction and temporal uncertainties in addition to quality measures from 2594 records from the Northern Hemisphere, using WA-PLS and MAT (LegacyClimate 1.0; this study).
2.1 Input data
The objective of this study is to create a dataset of quantitative reconstructions of TJuly, Tann, and Pann, spanning the last 30 kyr and beyond from fossil pollen records. These variables (or variables highly correlated to them) were shown to explain most variance in the modern pollen data (TJuly; Pann) or are typically used in syntheses and proxy–model comparison studies (Tann). Accordingly, we selected these three variables. We used the fossil dataset compiled in LegacyPollen 1.0 (stored on the PANGAEA open-data repository and presented in Herzschuh et al., 2022b) that integrates pollen records archived in the Neotoma Paleoecology Database, a dataset from eastern and central Asia (Cao et al., 2013; Herzschuh et al., 2019), and a dataset from northern Asia (Cao et al., 2020). Ages were taken from the Bacon (Blaauw and Christen, 2011) age–depth models presented in Li et al. (2022; LegacyAge 1.0), and for each record, we provide an ensemble of 1000 realizations of the age–depth model in our data product so that it can be used to account for chronological uncertainty in the reconstructions. As the chronological and reconstruction errors are independent, they can be added in quadrature to obtain the combined error. With this information, users can easily produce curves with all relevant uncertainties (as shown in Appendix Fig. 1).
We compiled the fossil data into four subcontinental datasets for eastern North America (<104∘ W; Williams et al., 2000), western North America, Europe (<43∘ E), and Asia (>43∘ E). We restricted the analyses to the 70 most common taxa on each continent to reduce computational power, after making sure that a higher taxa number would not substantially improve model statistics in climate reconstructions. The number of taxa is limited by the modern training dataset from North America, which contains 70 taxa after applying our taxa harmonization routine (see details in Herzschuh et al., 2022b). We therefore restricted the number of taxa in all fossil datasets to keep the taxa comparable for the reconstructions. To identify the most common taxa, we used Hill's N2 diversity index (i.e., the effective number of occurrences of a species in the dataset; Hill, 1973). For all analyses, square root percentages were used, if not indicated otherwise.
A modern pollen training dataset comprised of 15 379 sites includes datasets from Eurasia (EMPD1, Davis et al., 2013; EMPD2, Davis et al., 2020; Herzschuh et al., 2019; Tarasov et al., 2011) and North America (Whitmore et al., 2005). The modern pollen datasets were taxonomically harmonized in accordance with the fossil pollen dataset.
The site-specific Tann, TJuly, and Pann were derived from WorldClim 2 version 2.1 (spatial resolution of 30 s; ∼1 km2; https://www.worldclim.org, last access: 22 November 2021; Fick and Hijmans, 2017), by extracting the climate data at the location of the modern sample sites using the raster package in R (version 3.5-11, Hijmans et al., 2021; R Core Team, 2020). The WorldClim 2 dataset provides spatially interpolated gridded climate data aggregated from weather stations as temporal averages between 1970–2000 (Fick and Hijmans, 2017). We used monthly average temperature data to extract the mean TJuly and the bioclimatic variables of bio1 (Tann) and bio12 (Pann).
2.2 Reconstruction methods
Our reconstruction approach included MAT (Overpeck et al., 1985) and WA-PLS (ter Braak and Juggins, 1993), by applying the MAT and WA-PLS functions from the rioja package (version 0.9-21, Juggins, 2019) for R (R Core Team, 2020) on our northern hemispheric fossil pollen synthesis. For each fossil location, we calculated the geographic distance between each modern sampling site and the fossil pollen record using the rdist.earth function from the fields R package (version 10.3, Nychka et al., 2020) and selected a unique calibration set from modern sites within a 2000 km radius. We fixed the radius to 2000 km instead of 1500 km, as suggested in a study in eastern Asia by Cao et al. (2017), because the modern dataset density is rather low in northern Asia. For the reconstruction with MAT, we used the original pollen percentages of the selected fossil pollen taxa, looking for seven analogs between the pollen data and the selected calibration dataset. The dissimilarity between the fossil samples and the modern pollen assemblages was determined by the squared-chord distance of the percentage data (Simpson, 2012; Cao et al., 2014).
In addition to the classic WA-PLS reconstruction, we also propose WA-PLS_tailored. This approach addresses the problem that covariation in climate variables today in space is transferred to the reconstruction, even if the past temporal relationship among the climate variables differs mechanistically. In fact, this approach aims to make use of the full climate space covered by the modern pollen samples, avoiding those samples in the calibration set that cause spatial covariation. This approach is based on the assumption that several climate variables can be reflected in one and the same pollen assemblage because different plant taxa have different optima in temperature and precipitation ranges and might therefore occur with different co-occurrences and abundance patterns. To reconstruct TJuly, we identified the Pann range reconstructed by WA-PLS and extended it by 25 % to both ends of the modern Pann range in order to reduce the influence of Pann on the Tann and TJuly reconstruction due to covariation. We applied the same method to the reconstruction of Pann. Tann and TJuly were tailored by Pann; Pann was tailored by TJuly and, additionally, by Tann (illustrated, for an example, in Appendix Fig. 2). Reconstruction uncertainties are provided as root mean square errors (RMSEs) derived from the output in the MAT and WA-PLS functions. Model errors in WA-PLS and MAT are reported as root mean square errors in the prediction (RMSEP) that are derived from the leave-one-out cross-validation.
We provide site- or sample-specific measures of quality, in addition to the error estimates and model statistics, to allow the user to assess the quality of the climate reconstruction dataset. First, we applied a canonical correlation analysis (CCA) to the modern training dataset in order to explore the modern relationship between the pollen spectra and the climate variables and to infer the explained variance in the modern pollen dataset by the target climate variables (ter Braak, 1988) by using the cca function in the vegan R package (version 2.5-7, Oksanen et al., 2020). The ratio between the constrained (λ1) and unconstrained (λ2) explained variance was determined for all modern training datasets used for climate reconstructions. High values of λ1 vs. λ2 (≧1) are commonly considered to be an indicator to measure how well the target environmental variable relates to the variation in the modern pollen dataset (e.g., Juggins, 2013). However, most training datasets encompass multiple environmental variables that are often correlated, and additional requirements for such variables would be necessary to explain a significant and independent portion of the variation in the training dataset. While a careful design of the training dataset can help reduce the effect of correlated environmental gradients, it can never eliminate them completely (Juggins, 2013). To infer the analog quality as an indicator of non-analog situations, we calculated the minimum dissimilarity (squared-chord distance) between modern pollen assemblages and fossil pollen assemblages with probability thresholds of 1 % (indicating very good analogs), 2.5 % (good analogs), and 5 % (poor analogs), using the minDC function from the analogue R package (version 0.17-6; Simpson et al., 2021).
A statistical significance test (Telford and Birks, 2011) was applied using the randomTF function in the palaeoSig R package (version 2.0-3; Telford, 2019). In this test, the proportion of variance in the fossil pollen data explained by the reconstructed environmental variable is estimated from redundancy analysis (RDA) and tested against a null distribution generated by replacing the modern training dataset with randomly generated surrogate fields. The surrogate fields were simulated to have realistic spatial autocorrelation by fitting variograms to the WorldClim 2 temperature and precipitation data; 1000-member ensembles were simulated for each variable. A reconstruction is considered statistically significant if the reconstructed variable explains more of the variance than 95 % of the random reconstructions (Telford and Birks, 2011). The reconstructed climate variables were tested as introducing the environmental variable as a single variable in a run, in addition to partialling out the explained variance in the pollen data by the respective other variables.
We used Plantaginaceae (mostly representing the Plantago lanceolata type in Europe) and Rumex type to assess human influence as an indicator of intense herding (Behre, 1988). In addition, we calculated the correlation between the WA-PLS reconstruction of TJuly, Tann, and Pann and the pollen percentages of Plantaginaceae and Rumex for 9000, 3000 and 1000 cal years BP to assess potential biases in the dataset.
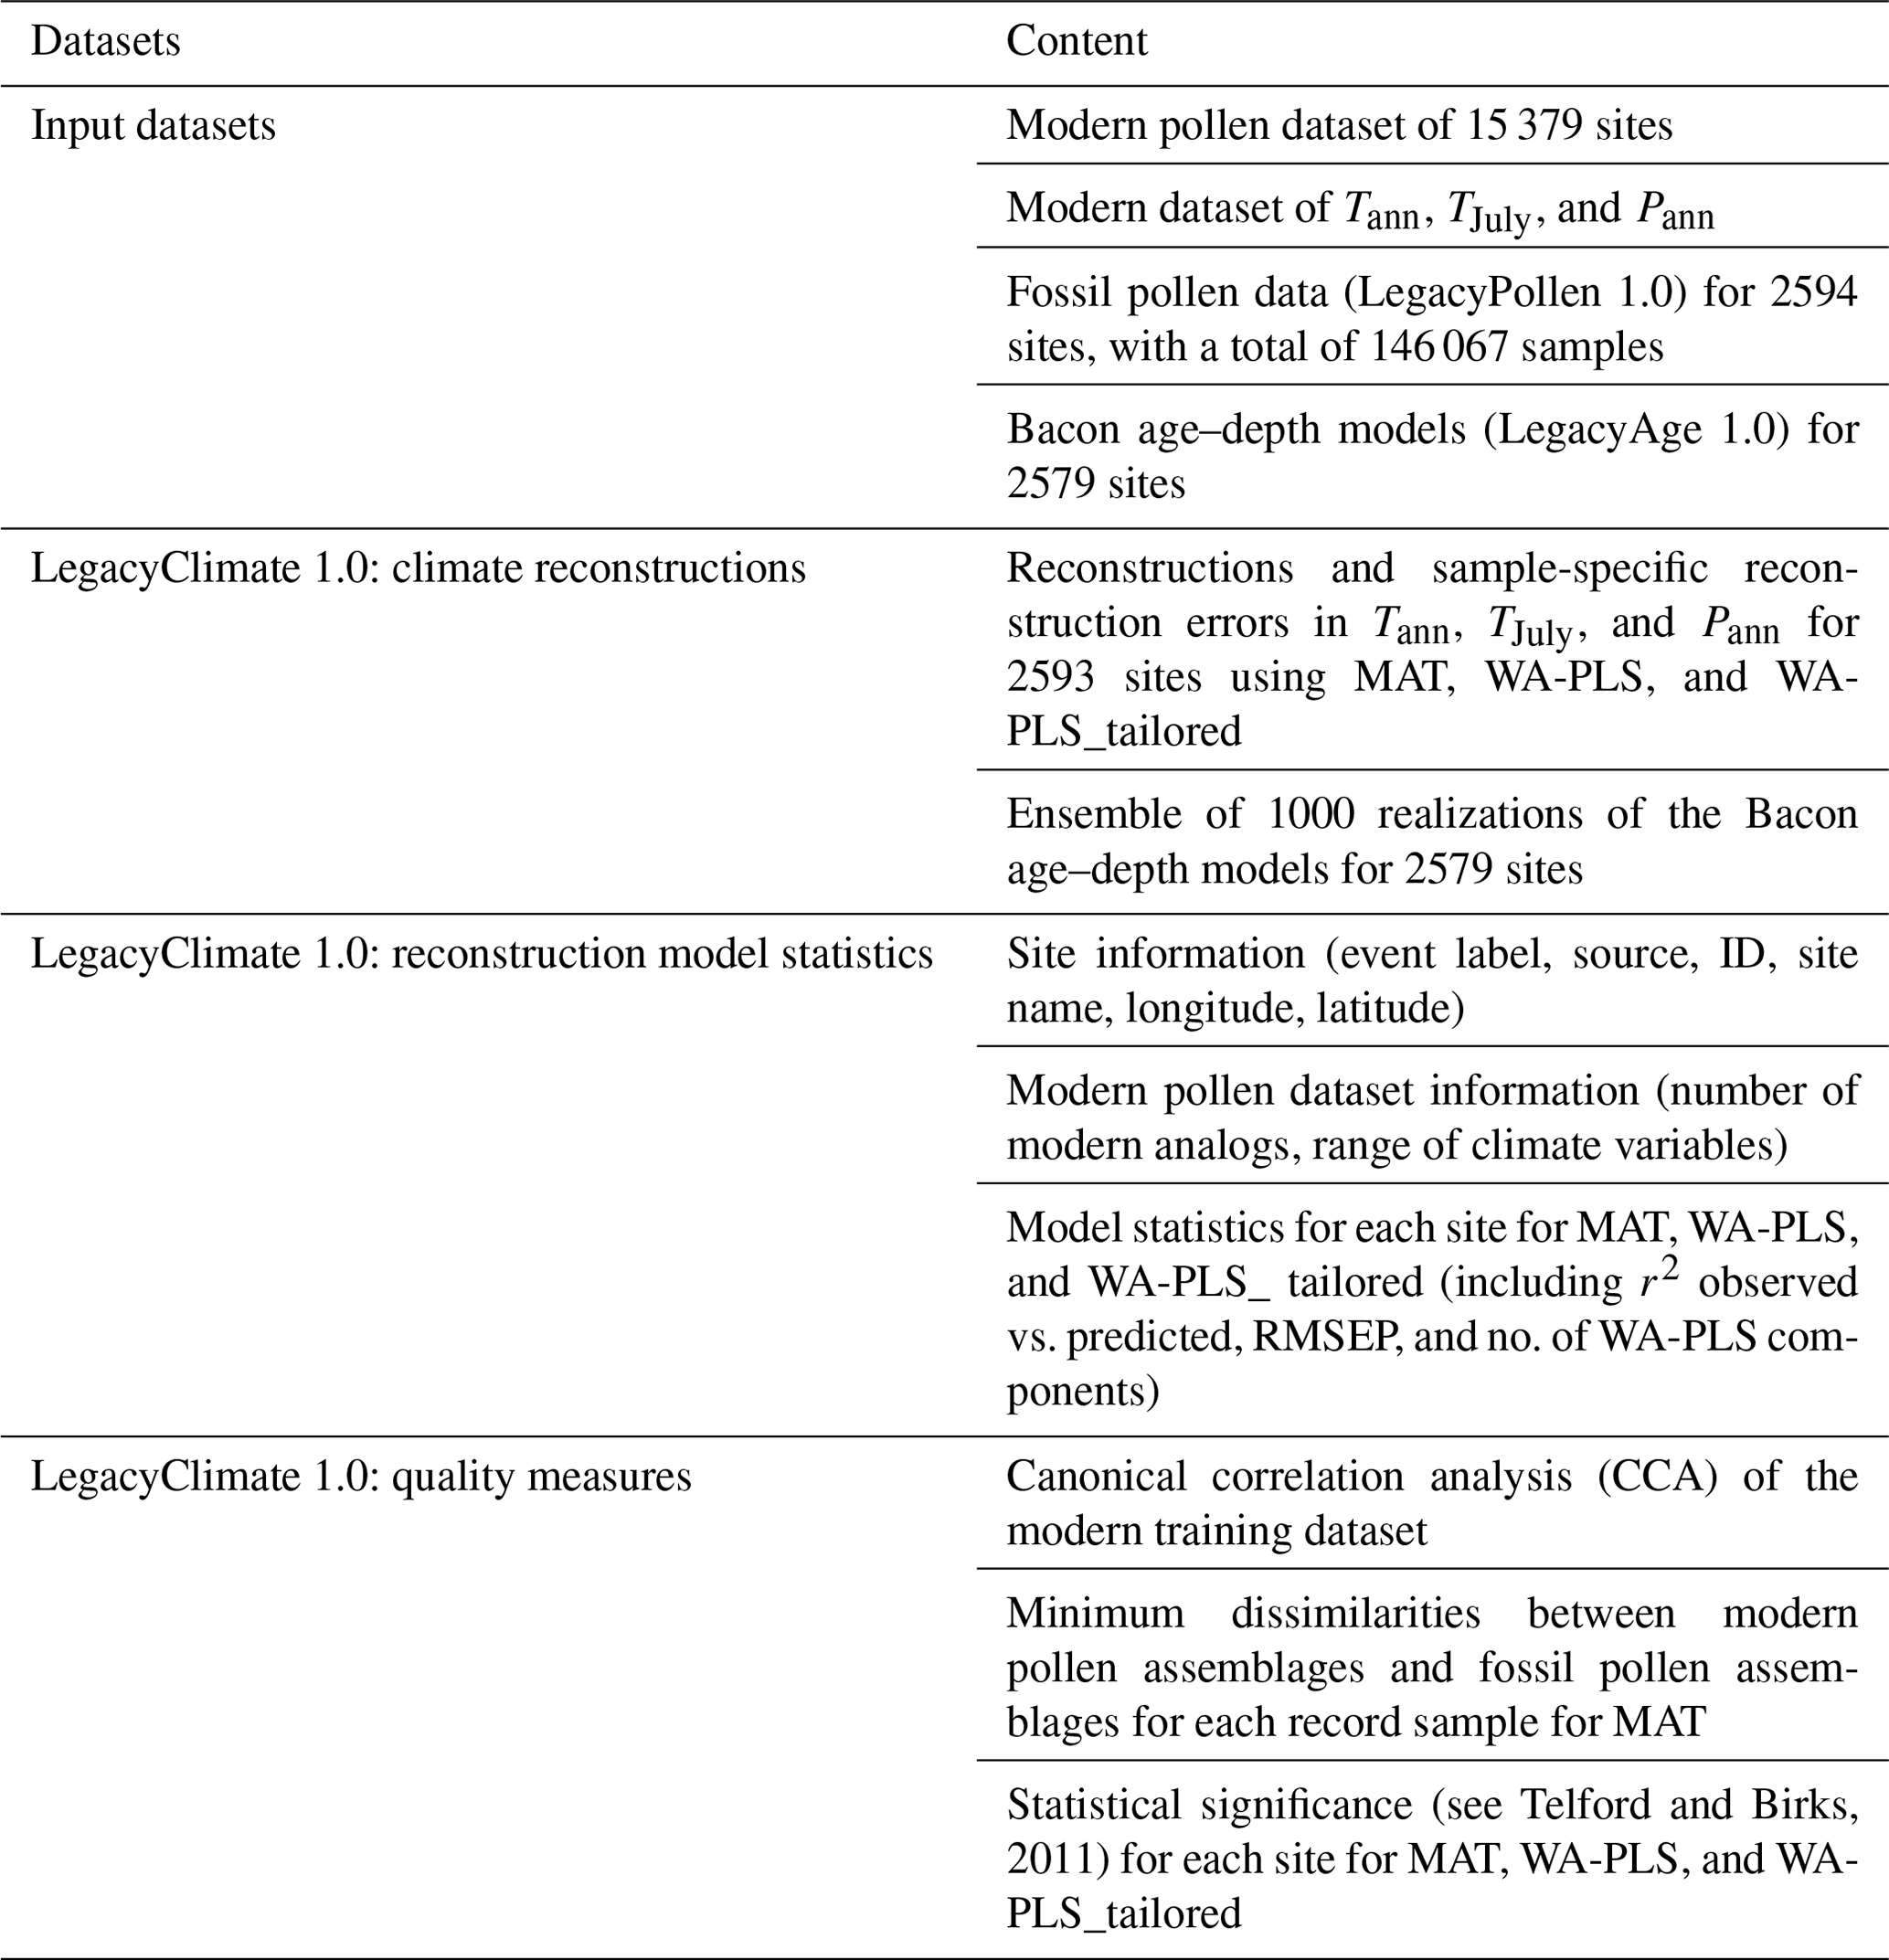
LegacyClimate 1.0 provides pollen-based reconstructions and sample-specific reconstruction errors in Tann, TJuly, and Pann for 2594 fossil pollen records (i.e., a total of 146 067 single pollen samples) from three reconstruction methods (WA-PLS, WA-PLS_tailored, and MAT). Furthermore, we provide the method-specific model metadata and quality measures for each record and each climate variable (Table 1). To ease data handling, the dataset files are separated into western North America, eastern North America, Europe, and Asia.
Table 1Structure and content of the LegacyClimate 1.0 data with details about the information contained in the input datasets, in the climate reconstructions, and in the reconstruction model statistics.
4.1 Spatial and temporal coverage of LegacyClimate 1.0
In total, we provide reconstructions for 2594 fossil pollen records. Among them, 670 records are located in eastern North America, 361 records in western North America, 1075 records in Europe, and 488 records in Asia (Fig. 1). Some records are included that come from marine cores which were taken from the continental shelf. They contain information from source areas from the nearby continents (e.g., fluvially transported material). If users want to focus on terrestrial-only records, then those marine sites could be filtered out by the archive type provided in the metadata. Climate reconstructions for one fossil record in the western North American Dataset on Hawaii (dataset ID 17832; Keālia Pond) could not be performed, as there were no modern training data available within a 2000 km area.
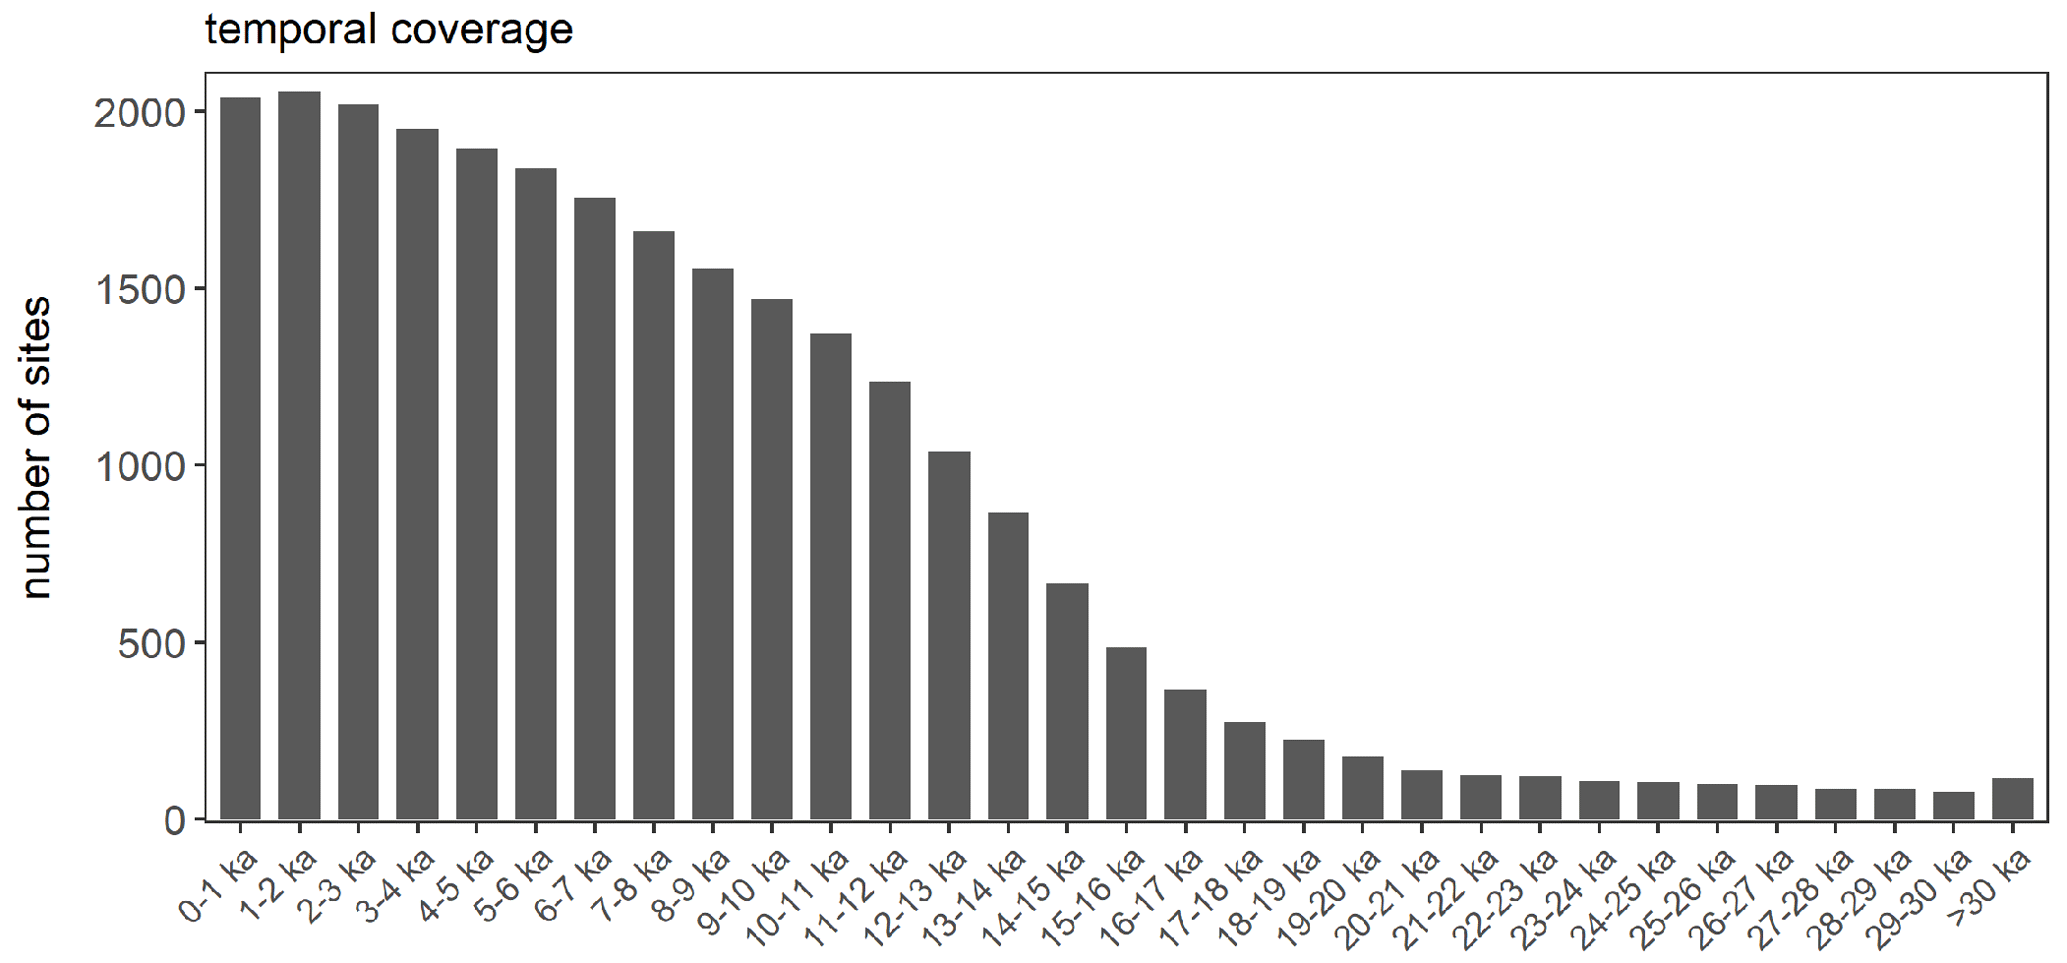
The temporal coverage of the records is rather uneven. A total of 75 and 666 records cover the periods between 30–29 and 15–14 cal kyr BP, respectively (Fig. 2).
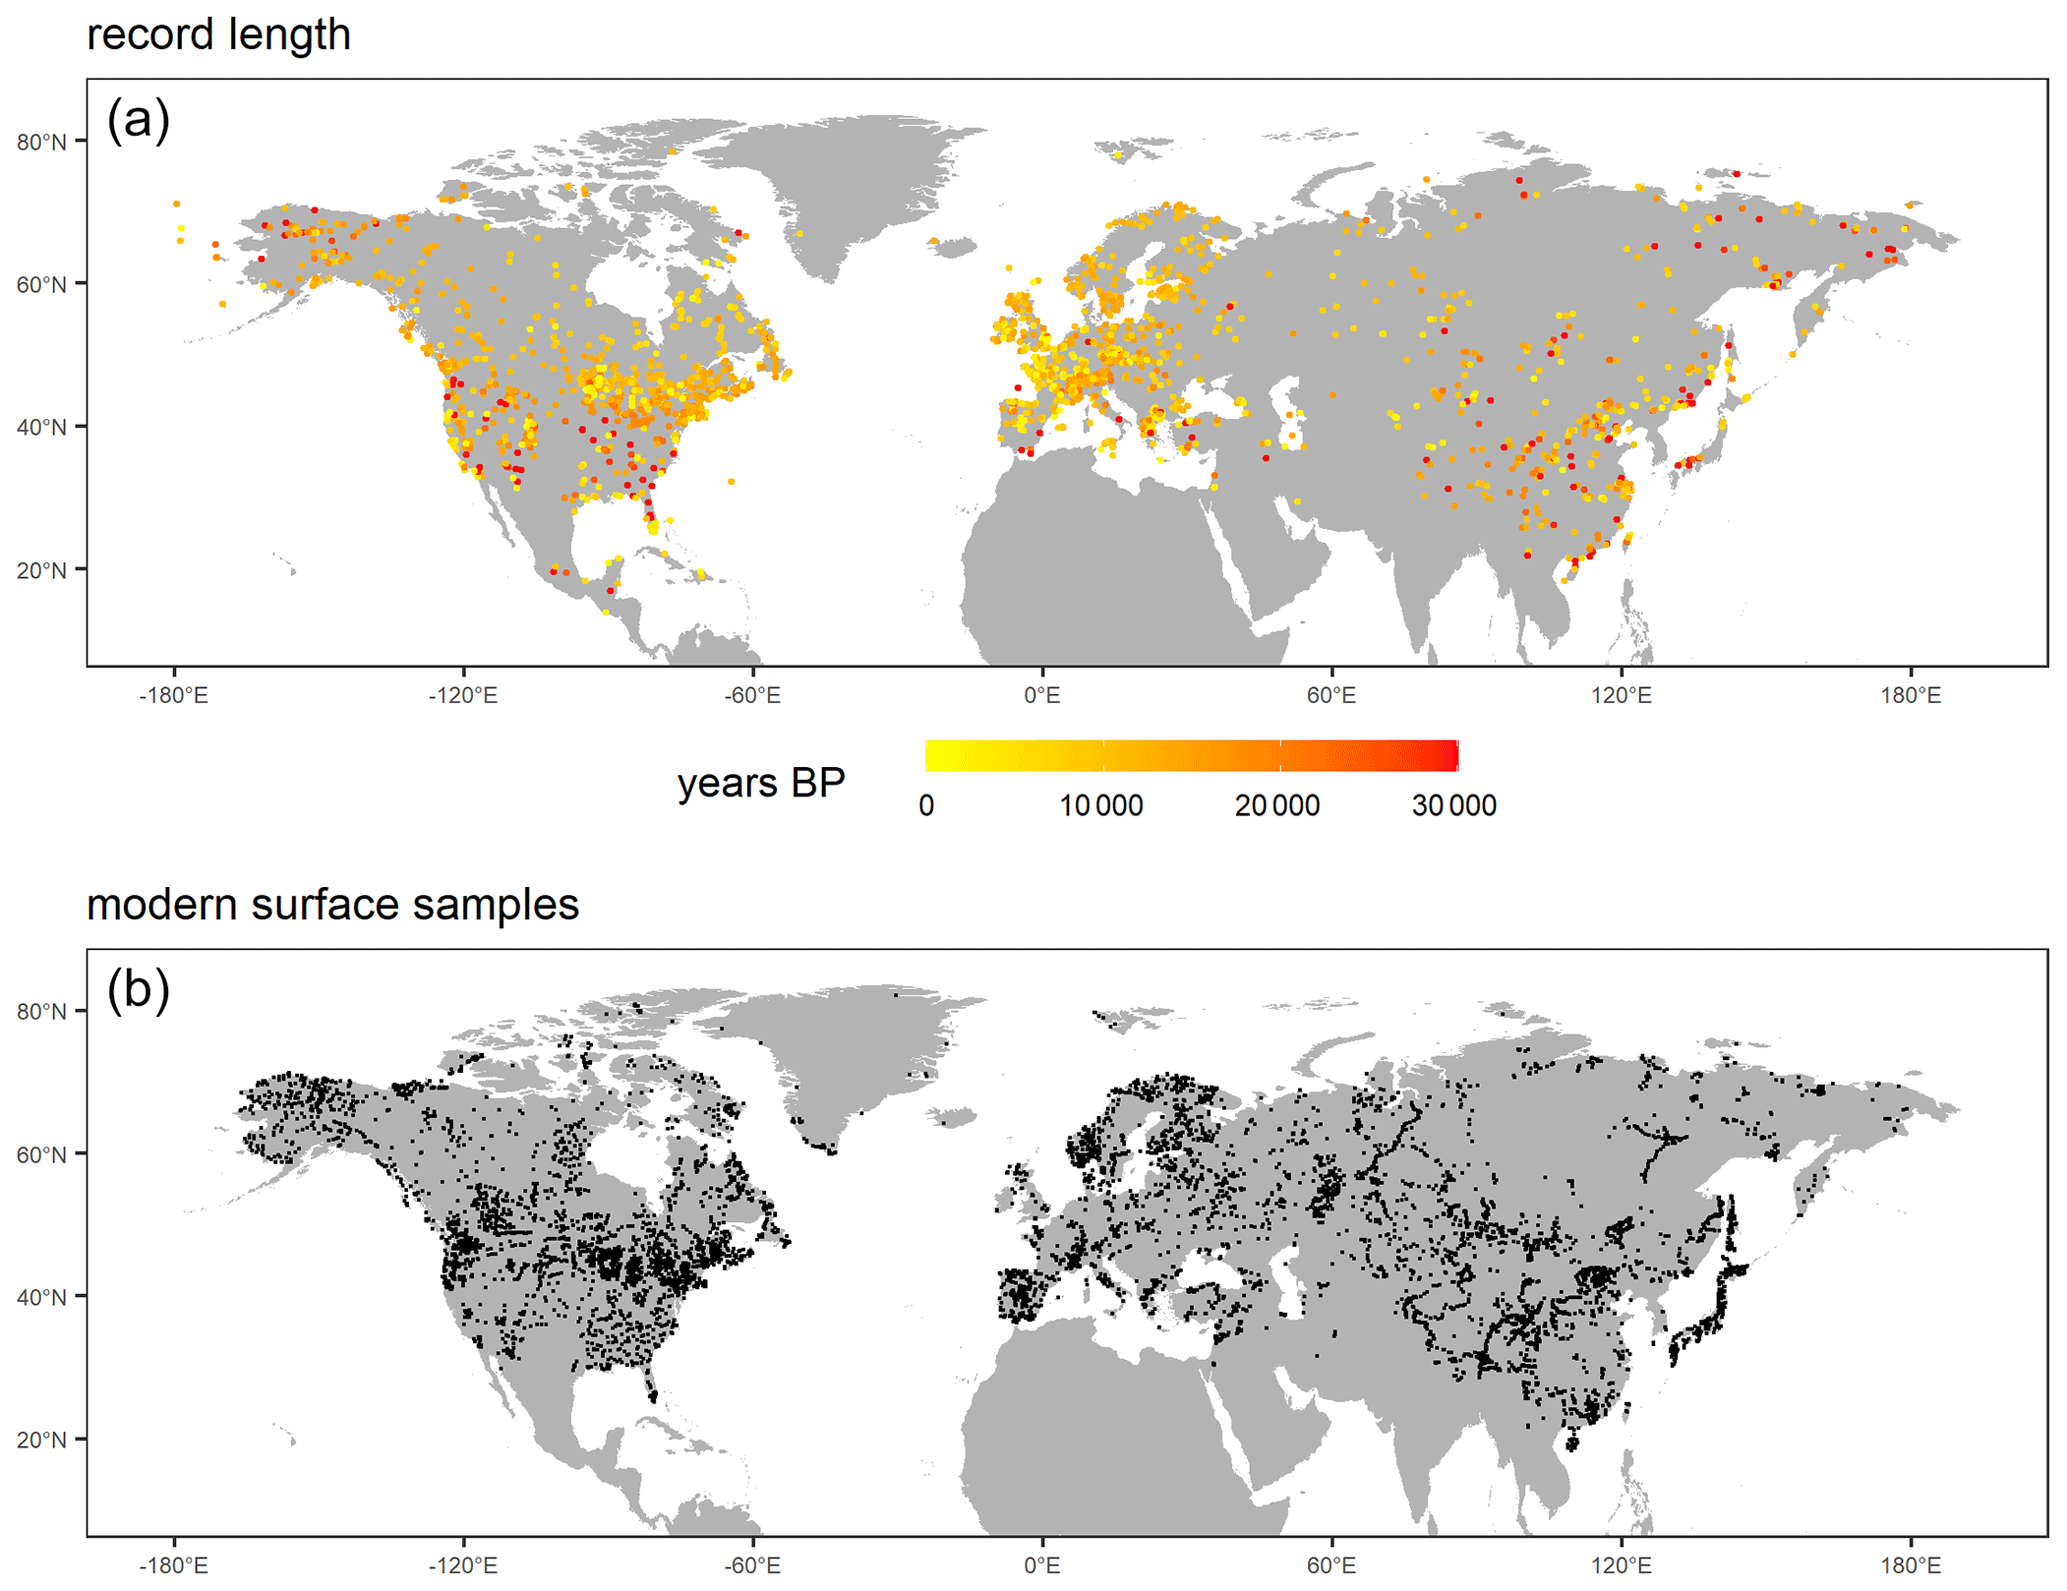
Figure 1(a) Map indicating the spatial distribution and record lengths covered by the LegacyPollen 1.0 dataset (Herzschuh et al., 2022b) for which climate reconstructions, temporal and reconstruction uncertainties, and reconstruction quality measures are provided in LegacyClimate 1.0, with a total of 2594 records. (b) Spatial distribution of a modern pollen dataset used for reconstruction with a total of 15 379 sites.
4.2 Modern relationships between pollen and climate assessed by constrained ordination
Results from CCA applied to modern datasets reveal that TJuly-constrained ordinations have high ratios, indicating a strong relationship between this climate variable and modern pollen assemblages in eastern North America, while low ratios can be found in central Asia. The spatial pattern of of ordinations constrained by Tann is similar overall to those of TJuly, but the ratios are slightly higher for Tann than for TJuly. Reconstructions for Pann show low ratios in Europe and eastern North America. Areas with high ratios are concentrated in Alaska and East Asia (Fig. 3).
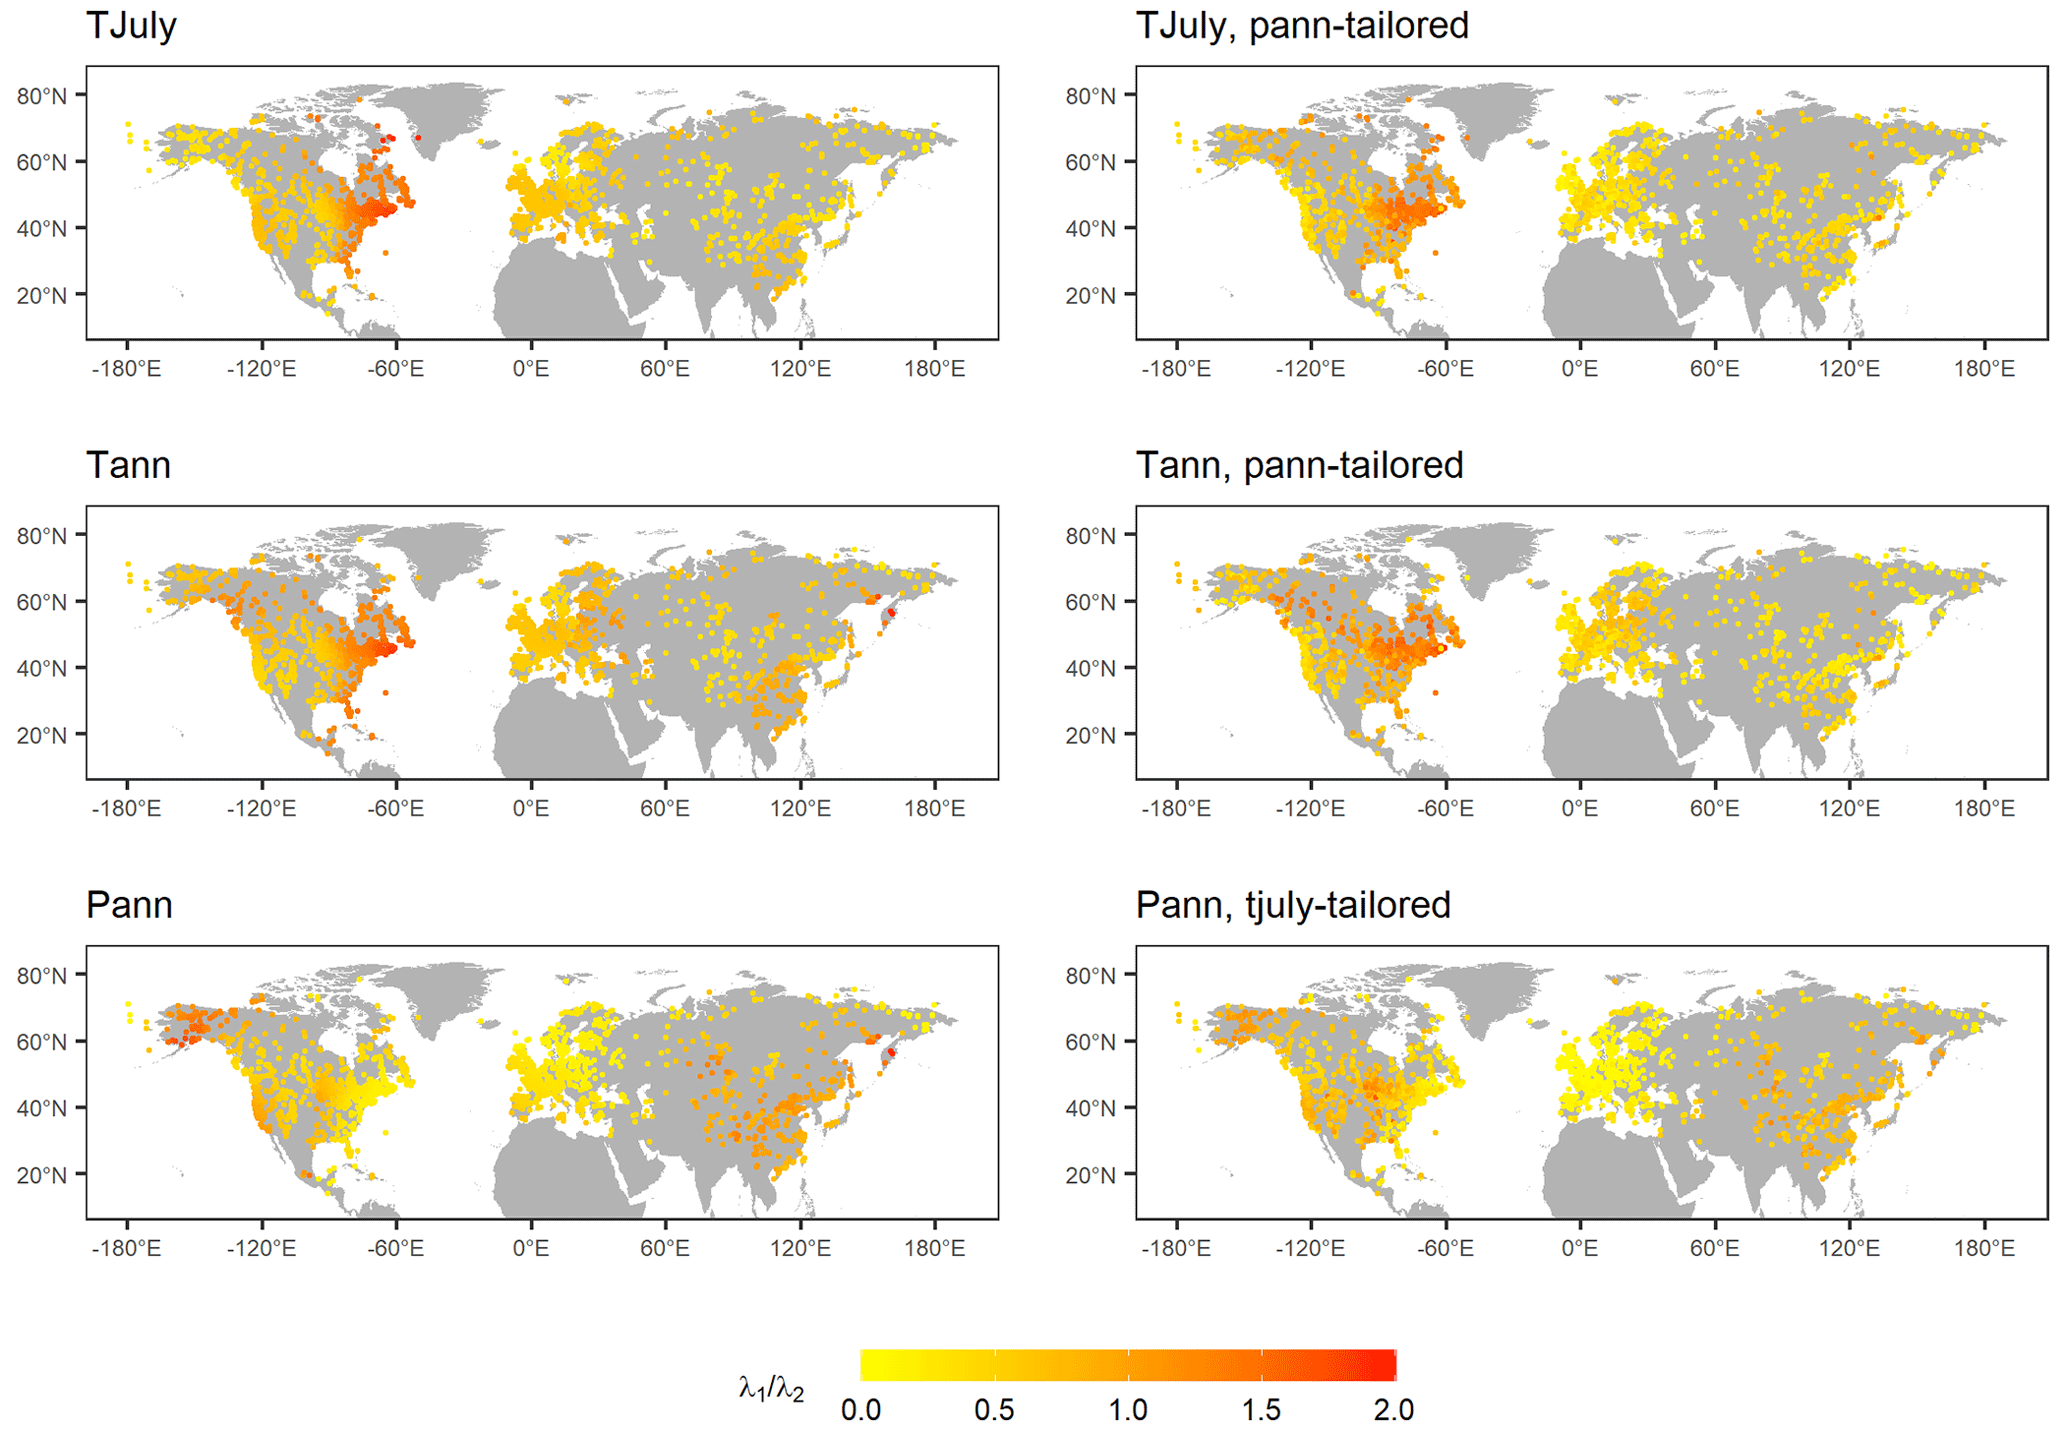
Figure 3Maps showing , representing the ratio of the explained variance of the first axis (constrained) vs. the second (unconstrained) axis, as revealed by applying a CCA to all modern training datasets that were used for the reconstructions. High ratios () indicate a strong relationship between the modern pollen datasets and climate and can be used to determine ecologically important determinants. Constraining variables and the tailoring of the dataset (see Sect. 2) is indicated in the captions of the maps.
4.3 Analog quality
The dissimilarity (squared-chord distance) between modern pollen assemblages and fossil pollen assemblages was calculated and extracted for distinct time slices at 9000, 6000, and 3000 cal years BP. In total, 36.4 % (9000 cal years BP), 39.2 % (6000 cal years BP), and 45.6 % (3000 cal years BP) records indicate a very good (<1 %) analog quality. The central part of the North American continent, Scandinavia, and central Asia show a very good analog quality for all time slices investigated. Poor (<5 %) analogs can be found in western Europe, the eastern parts of the United States, and along the East Asian coastline. Non-analogs (>5 %) are found for 22.6 % (9000 cal years BP), 20.47 % (6000 cal years BP), and 12.5 % (3000 cal years BP) records, respectively, especially in western Europe, and at 9000 cal years BP in Alaska (Fig. 4).
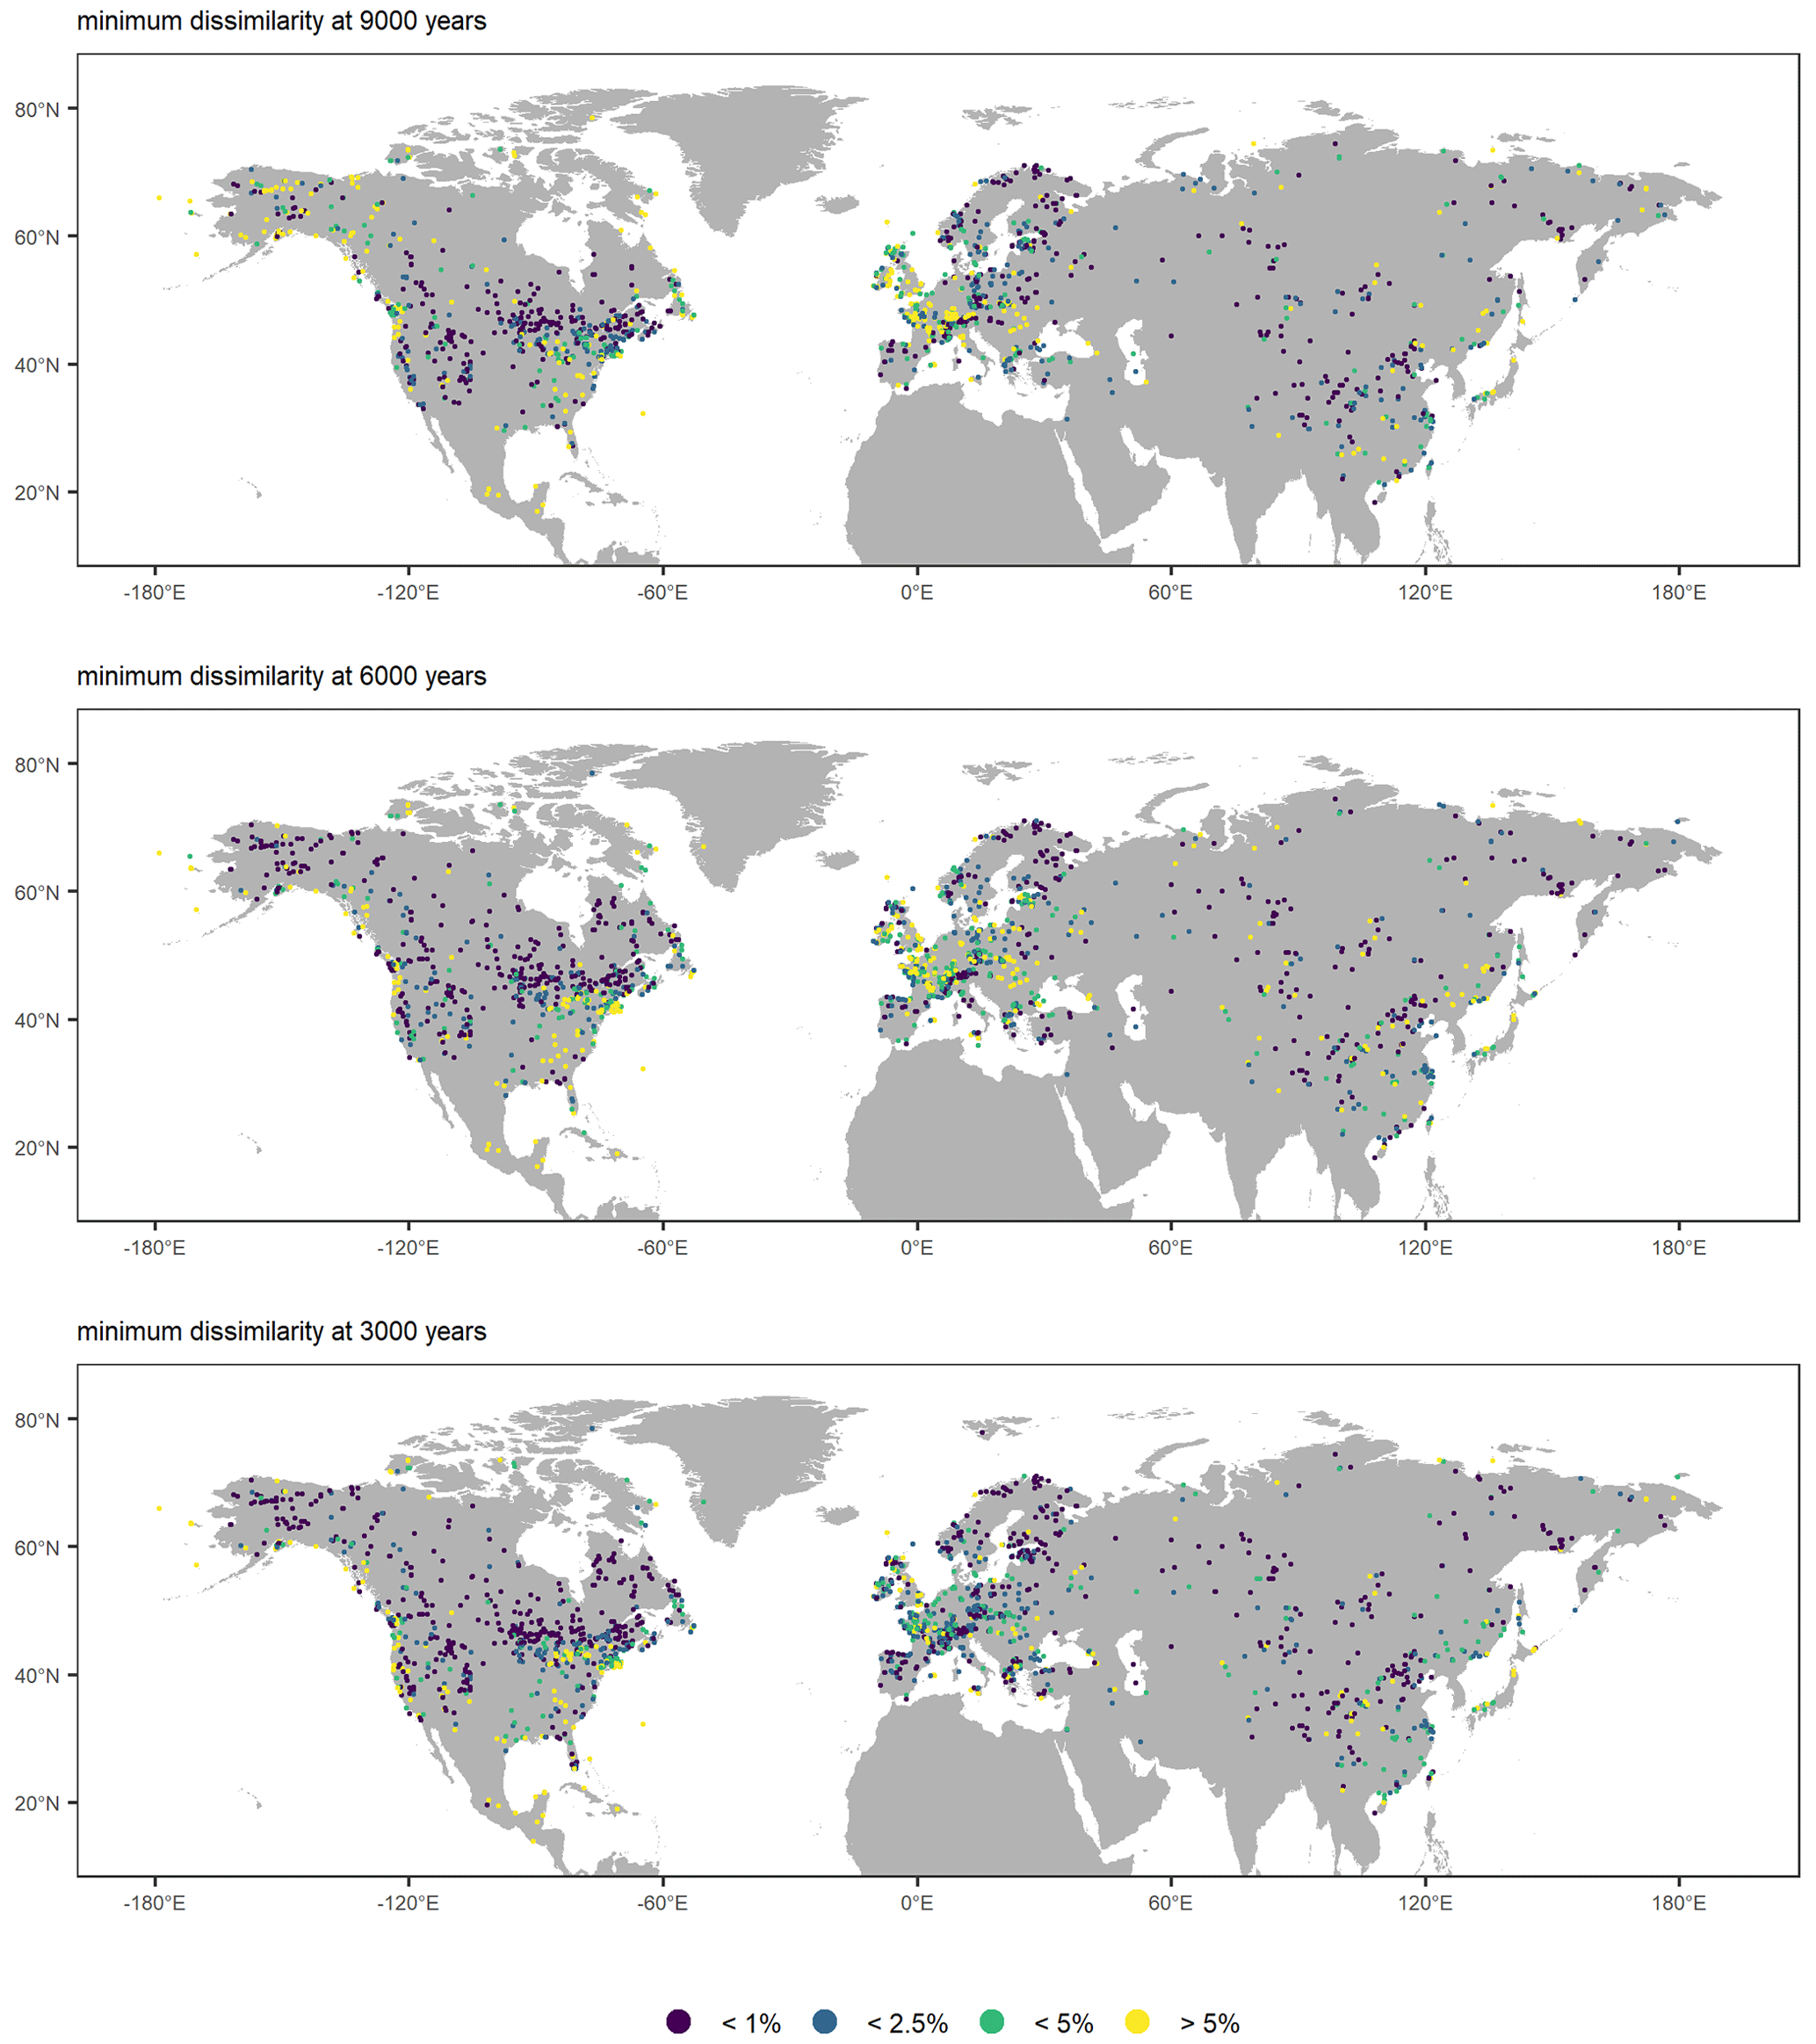
Figure 4Analog quality as assessed by the squared-chord distance between modern pollen assemblages and fossil pollen assemblages. The results identify very good (<1 %), good (<2.5 %), and poor (<5 %) analogs. The distances >5 % are considered to indicate non-analog situations (as a percentage of all distances among pollen samples in the modern dataset used for calibration).
4.4 Prediction errors found in LegacyClimate 1.0
The mean RMSEPs and their standard deviations for Tann are 1.98±0.52 (MAT), 2.61±0.53 (WA-PLS), and 2.24±0.61 ∘C (WA-PLS_tailored) and mean RMSEPs as a percentage of the modern Tann range are 7.68±1.93 % (MAT), 10.09±2.05 % (WA-PLS), and 10.26±2.79 % (WA-PLS_tailored). The largest mean RMSEP values are located in central Asia in Kazakhstan, Mongolia, and the northwestern parts of the Tibetan Plateau and are consistent across all three reconstruction methods. Other areas with large mean RMSEP values are located in western North America, southern and central Europe, and Southeast Asia. The smallest RMSEPs can be found along the east coast of North America. Relative to the modern temperature range, the RMSEP from this region also reveals the lowest fraction. In general, MAT has the lowest mean error fraction relative to the modern temperature range of all three methods.
The mean RMSEPs of TJuly are 1.90±0.63 (MAT), 2.50±0.73 (WA-PLS), and 2.21±0.75 ∘C (WA-PLS_tailored) and mean percentages of the TJuly range are 8.11±1.64 % (MAT), 10.71±1.94 % (WA-PLS), and 10.70±2.60 % (WA-PLS_tailored). Thus, they are slightly smaller than those of Tann but slightly larger as a percentage of the range. The spatial patterns are, however, largely similar to those of Tann.
The mean RMSEPs of Pann are 176.38±51.40 (MAT), 244.48±75.84 (WA-PLS), and 232.71±98.57 mm (WA-PLS_tailored) and mean percentages of Pann range are 6.78±1.48 % (MAT), 9.27±1.70 % (WA-PLS), and 10.26±2.67 % (WA-PLS_tailored). High RMSEPs are found for western North America, Europe, and along the coastline of Southeast Asia, while the lowest RMSEP values are found for central Asia. A clear division in RMSEPs is found on the North American continent; while the western part of North America (with the exception of Alaska) has a rather high RMSEP, the eastern part of North America has a smaller RMSEP. This pattern is found for all three methods (Fig. 5).
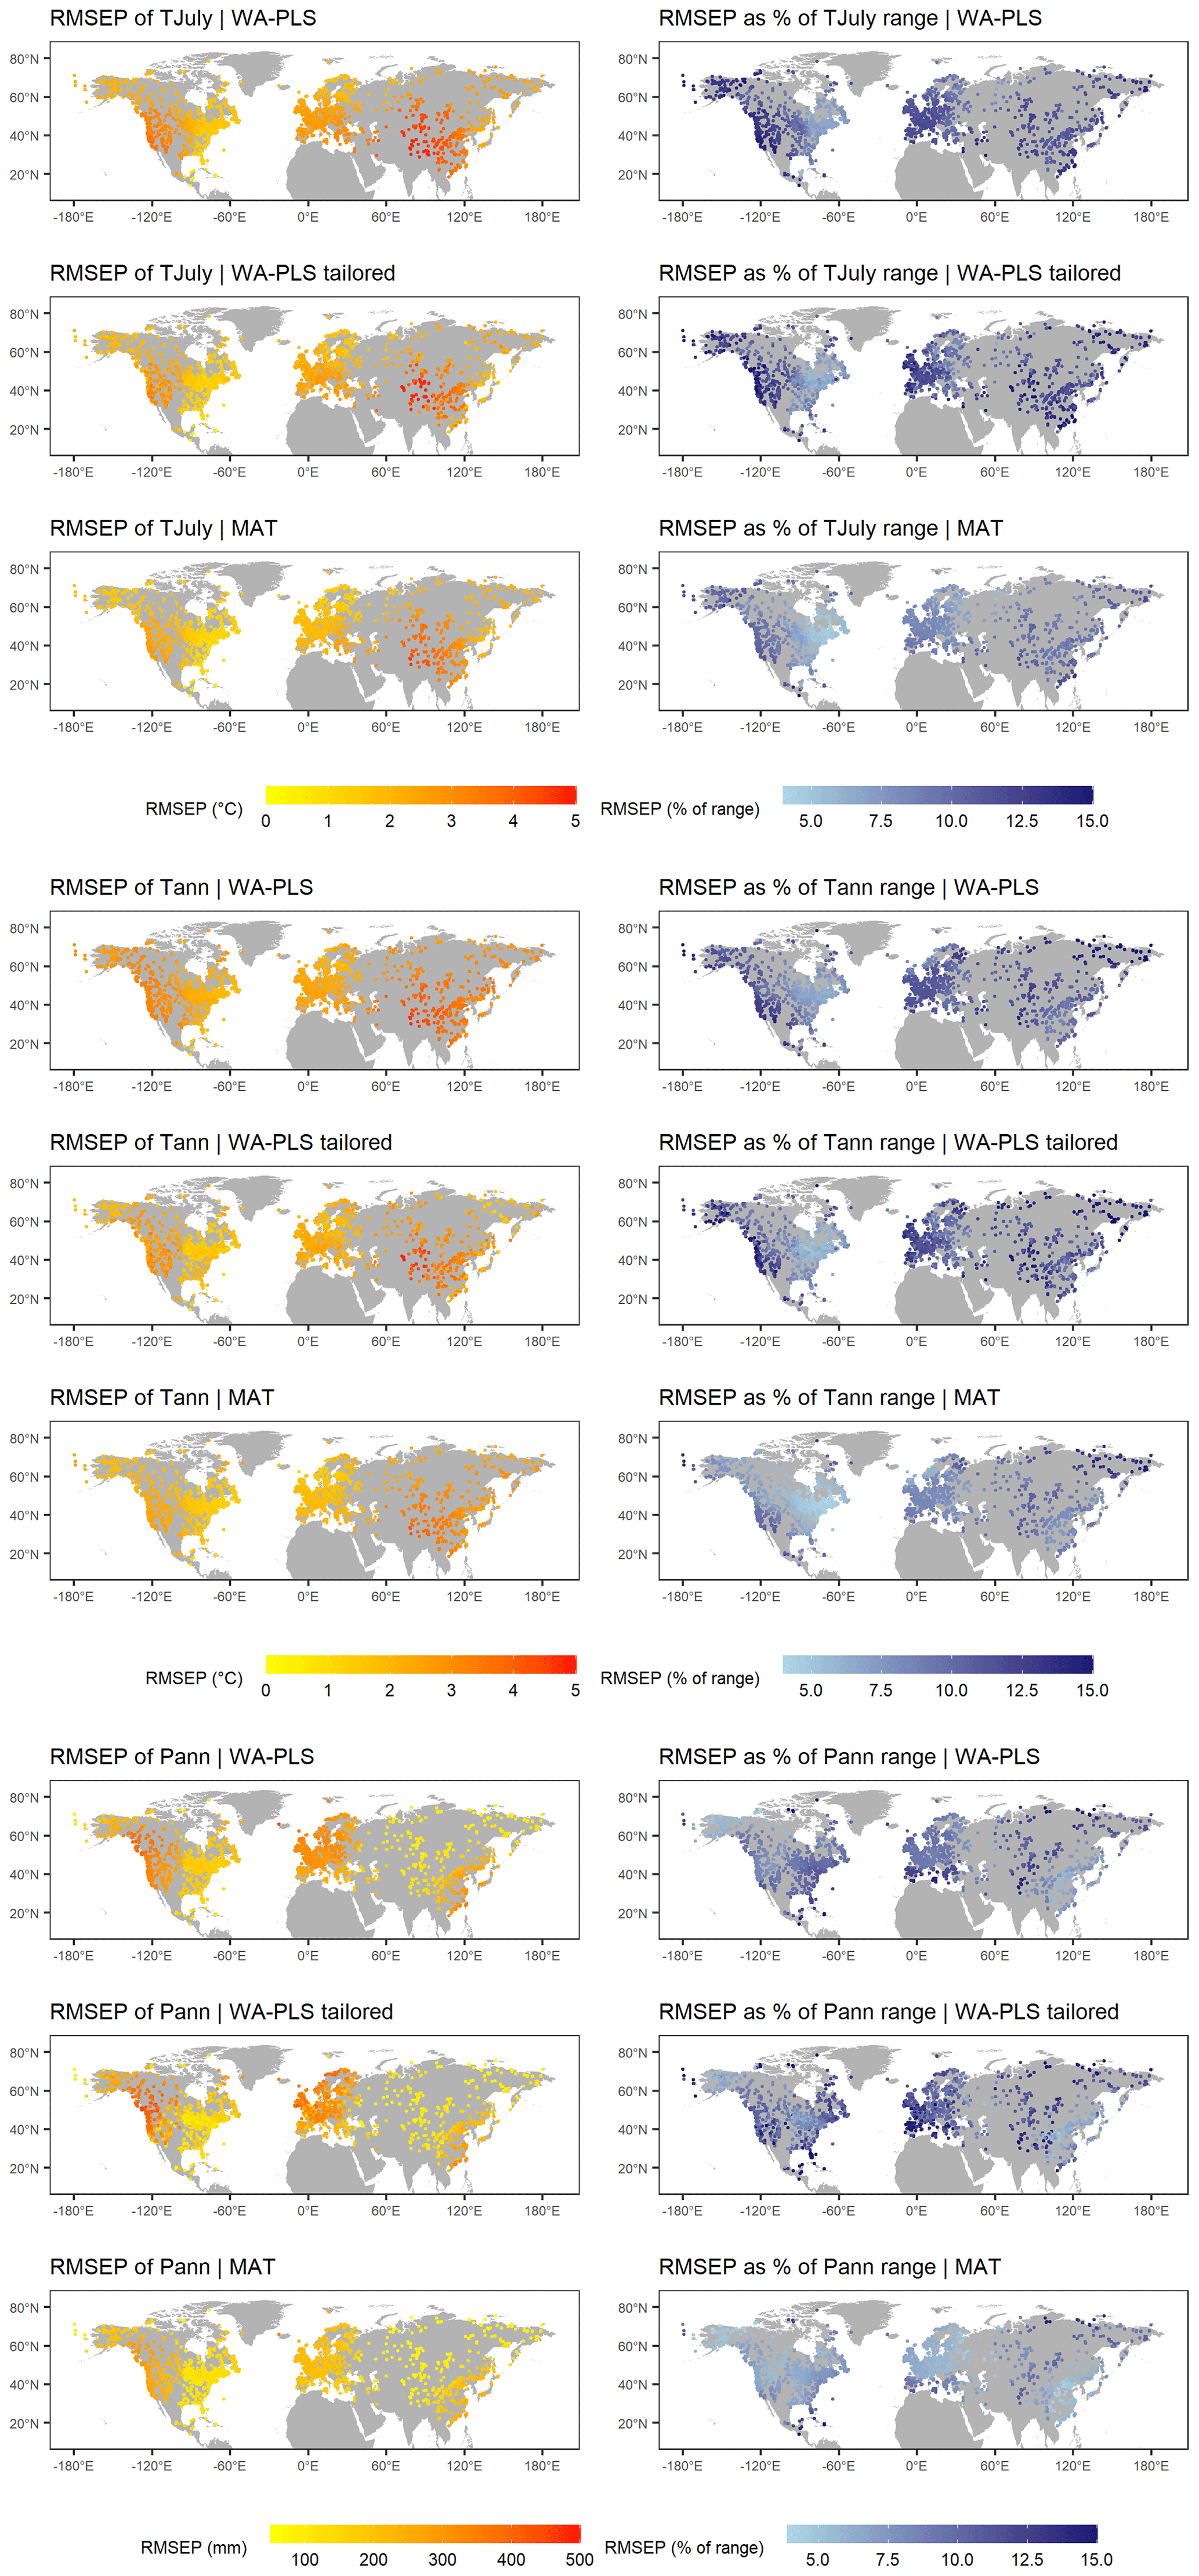
Figure 5Spatial distribution of root mean squared errors in the prediction (RMSEP), as inferred from the leave-one-out cross-validation, presented as absolute values and as a percentage of the range of the mean July temperature (TJuly), mean annual temperature (Tann), and annual precipitation (Pann) in the modern pollen data used for reconstruction for the three methods applied (weighted averaging partial least squares regression (WA-PLS), WA-PLS using a training set from within a limited climate range (WA-PLS_tailored), and modern analog technique (MAT)).
4.5 Significance test
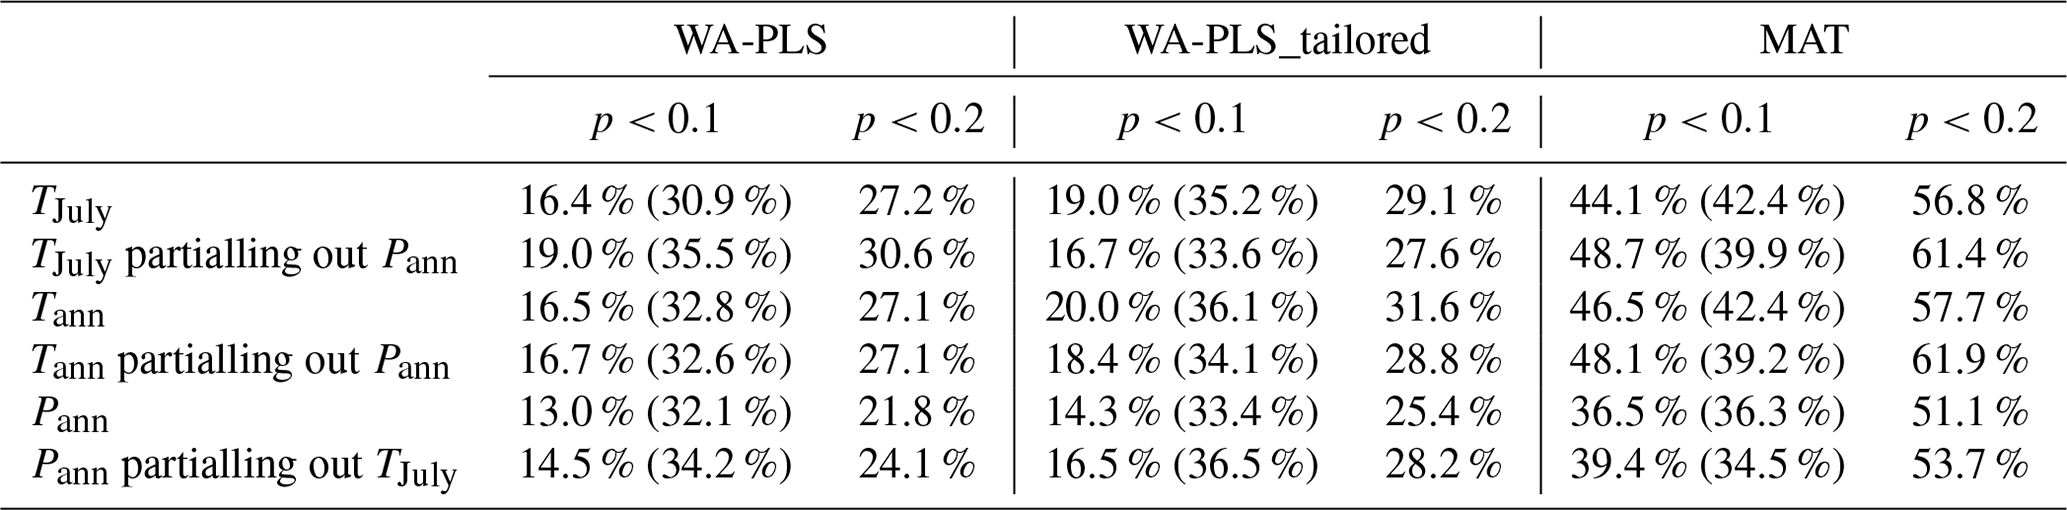
A significance test (p<0.1, in addition to p<0.2; see Sect. 2), according to Telford and Birks (2011), was performed for each record (Fig. 6; Table 2). For the TJuly reconstruction, 16.4 % (p<0.2; 27.2 %; WA-PLS) and 19.0 % (p<0.2; 29.1 %; WA-PLS_tailored) of all records passed the significance test when included as a single variable in the significance test. Partialling out precipitation as a conditional variable causes an increase in the number of significant records to 19.0 % (p<0.2; 30.6 %) for WA-PLS of TJuly but a decrease for WA-PLS_tailored to 16.7 % (p<0.2; 27.6 %) of all records. The Tann reconstruction is significant for 16.5 % (p<0.2; 27.1 %; WA-PLS) and 20.0 % (p<0.2; 31.6 %; WA-PLS_tailored) of all records when tested as a single variable. When partialling out precipitation, the number of significant records slightly increases for WA-PLS but decreases for WA-PLS_tailored. In total, 13.0 % (p<0.2; 21.8 %; WA-PLS) and 14.3 % (p<0.2; 25.4 %; WA-PLS_tailored) of all records pass the significance test when testing Pann as a single variable. Partialling out the mean July temperature as a conditional variable increases the number of significant records for both WA-PLS and WA-PLS_tailored.
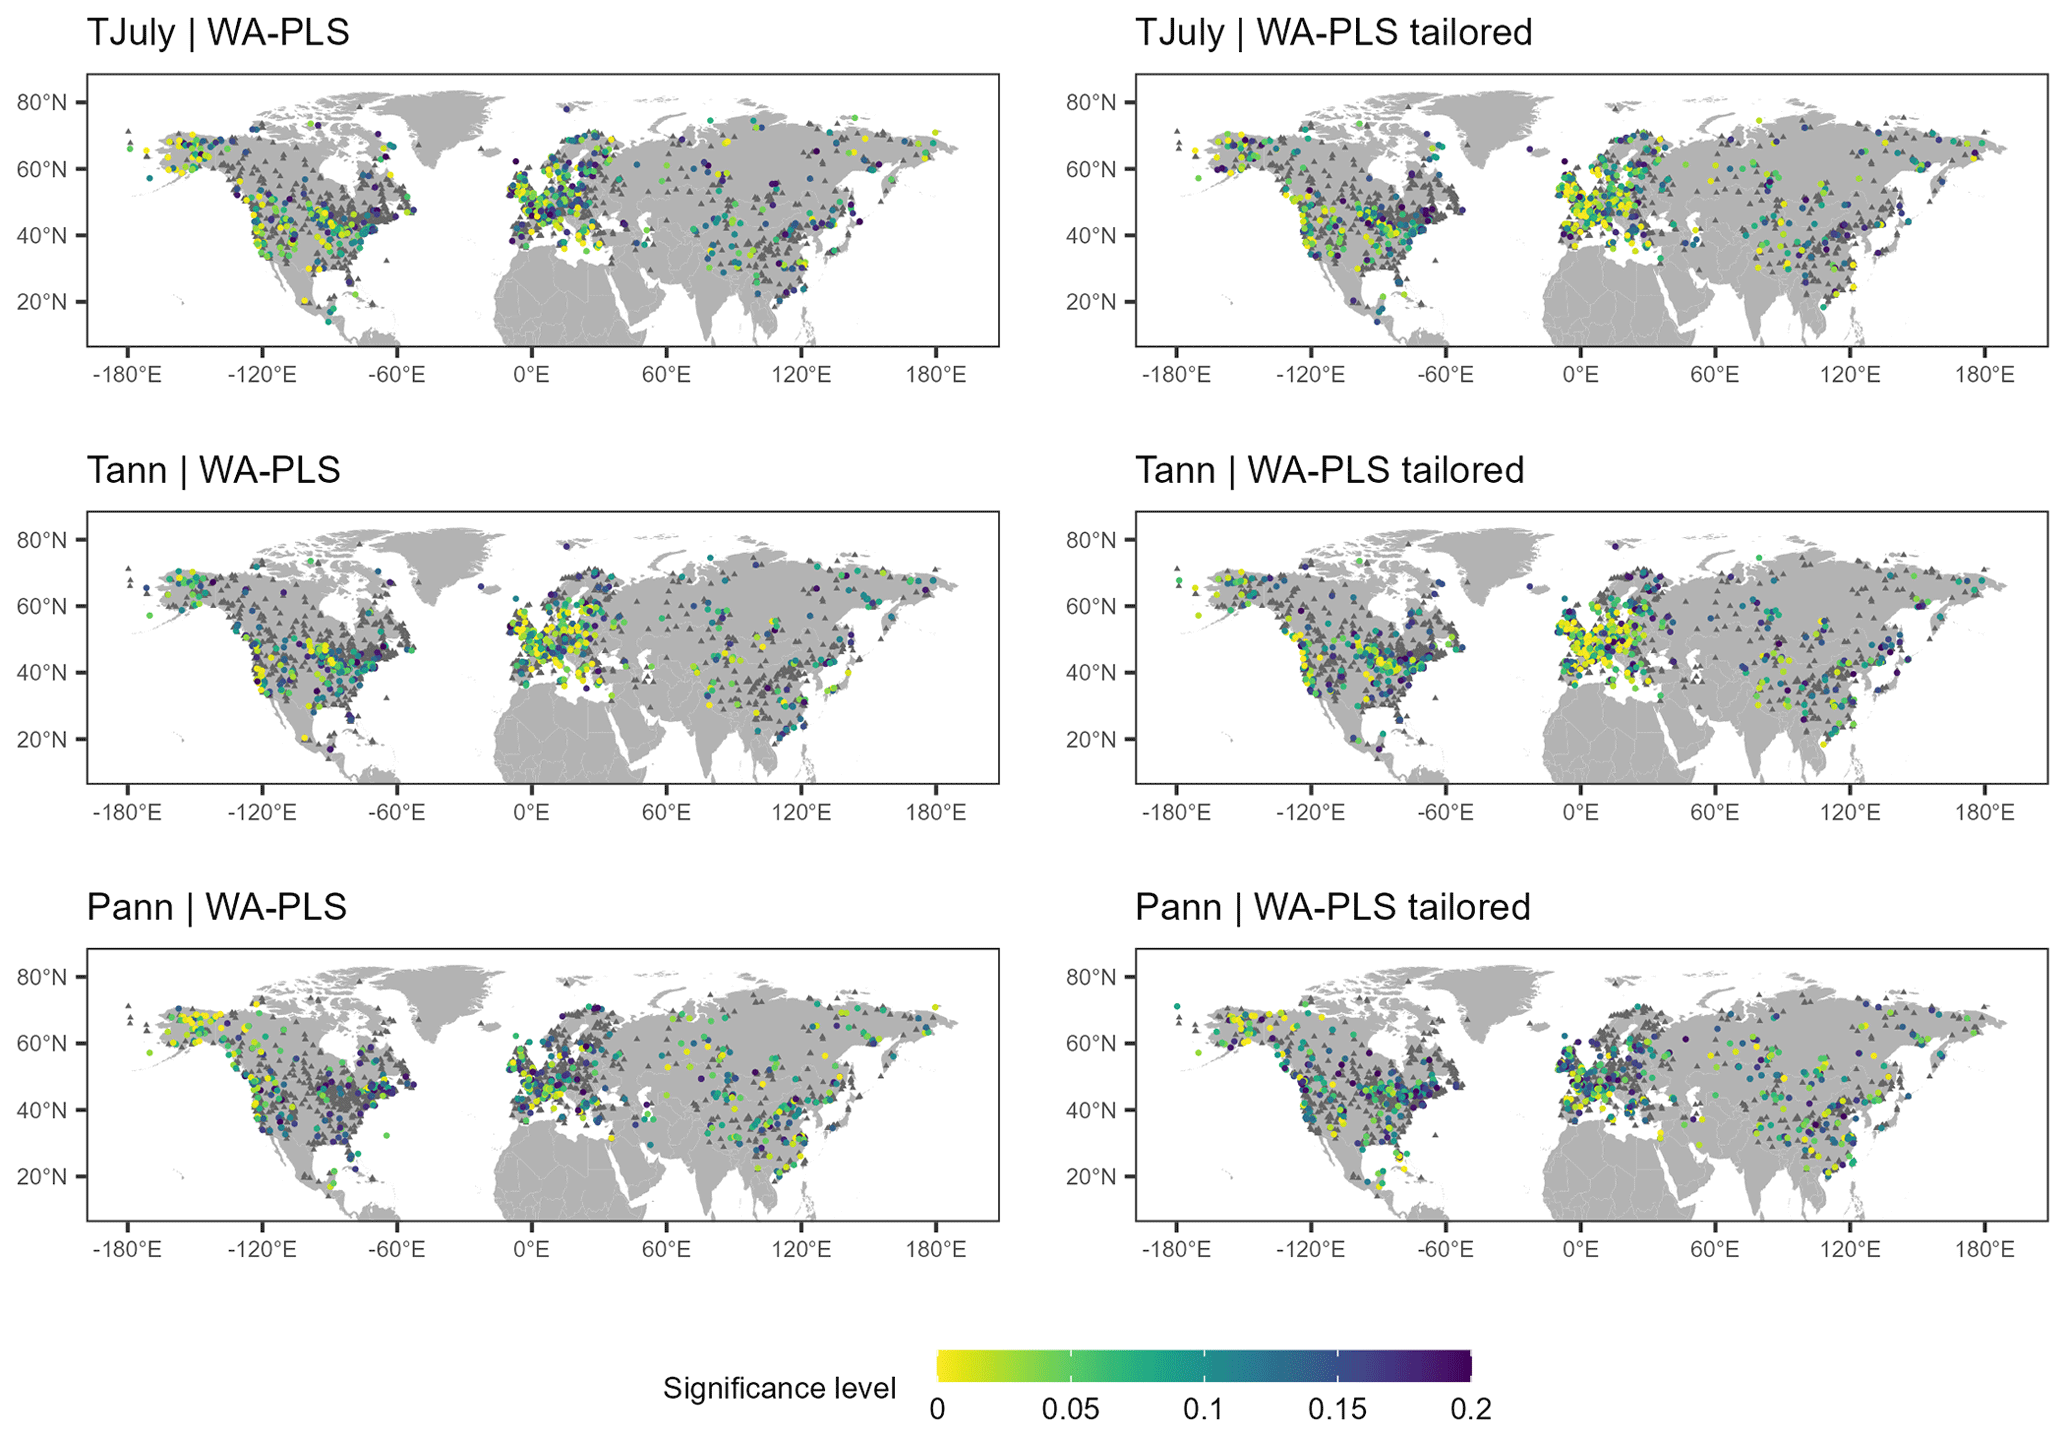
Figure 6Maps showing mean July temperature (TJuly), mean annual temperature (Tann), and annual precipitation (Pann) records that passed the reconstruction significance test (p<0.2). Colors indicate the significance level. Records that did not pass the significance level (p≧0.2) are shown as gray rectangles.
Table 2Percentage of records that pass the reconstruction significance test (p<0.1 and p<0.2; see Telford and Birks, 2011). The values in parentheses for p<0.1 indicate the significance values without taking the spatial autocorrelation into account.
4.6 Human impact
We used the abundance of Plantaginaceae and Rumex as indicators of grazing and intense animal husbandry. An overall weak human impact is inferred for North America and northern Asia. The indicators show a strong human impact only in individual records at 9000 cal years BP in China and the Mediterranean region (Fig. 7). The percentage values of Plantaginaceae and Rumex were high, especially in Europe for 3000 and 1000 cal years BP, which indicates the growing human impact on that region. High Plantaginaceae correlate with low TJuly and high Pann in central Europe, indicating potential biases in the temperature reconstructions (i.e., temperatures that are too low become reconstructed). Similar correlations are found for Rumex, especially in northern Europe (Fig. 8).
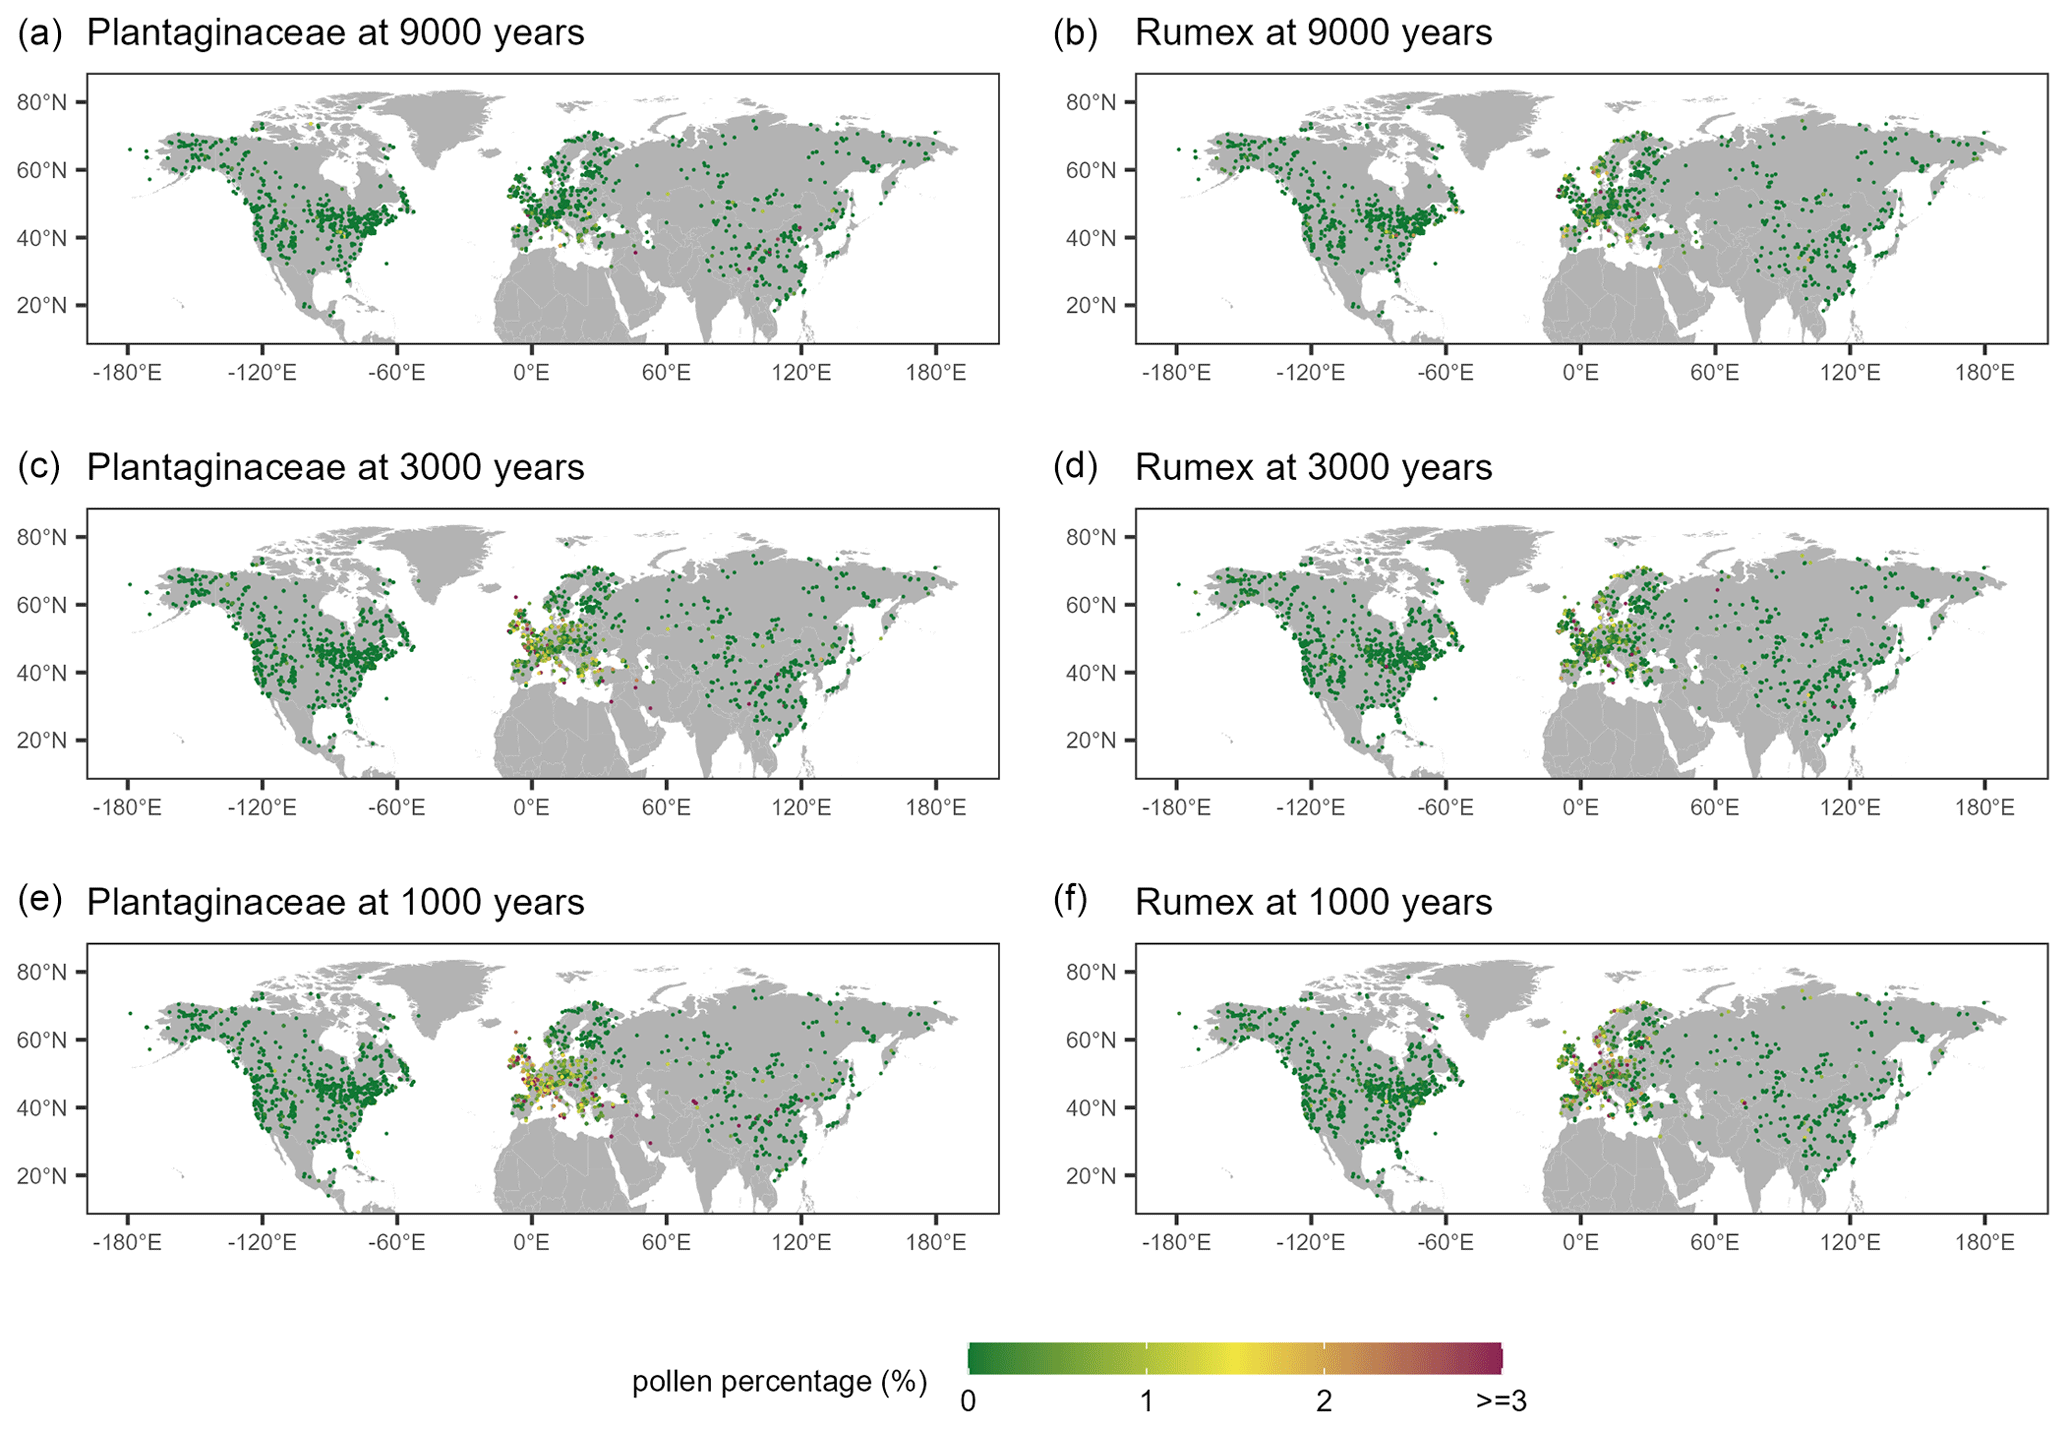
Figure 7Abundance of Plantaginaceae (a, c, e) and Rumex (b, d, f) at 9000, 3000, and 1000 cal years BP. Colors indicate percentage values.
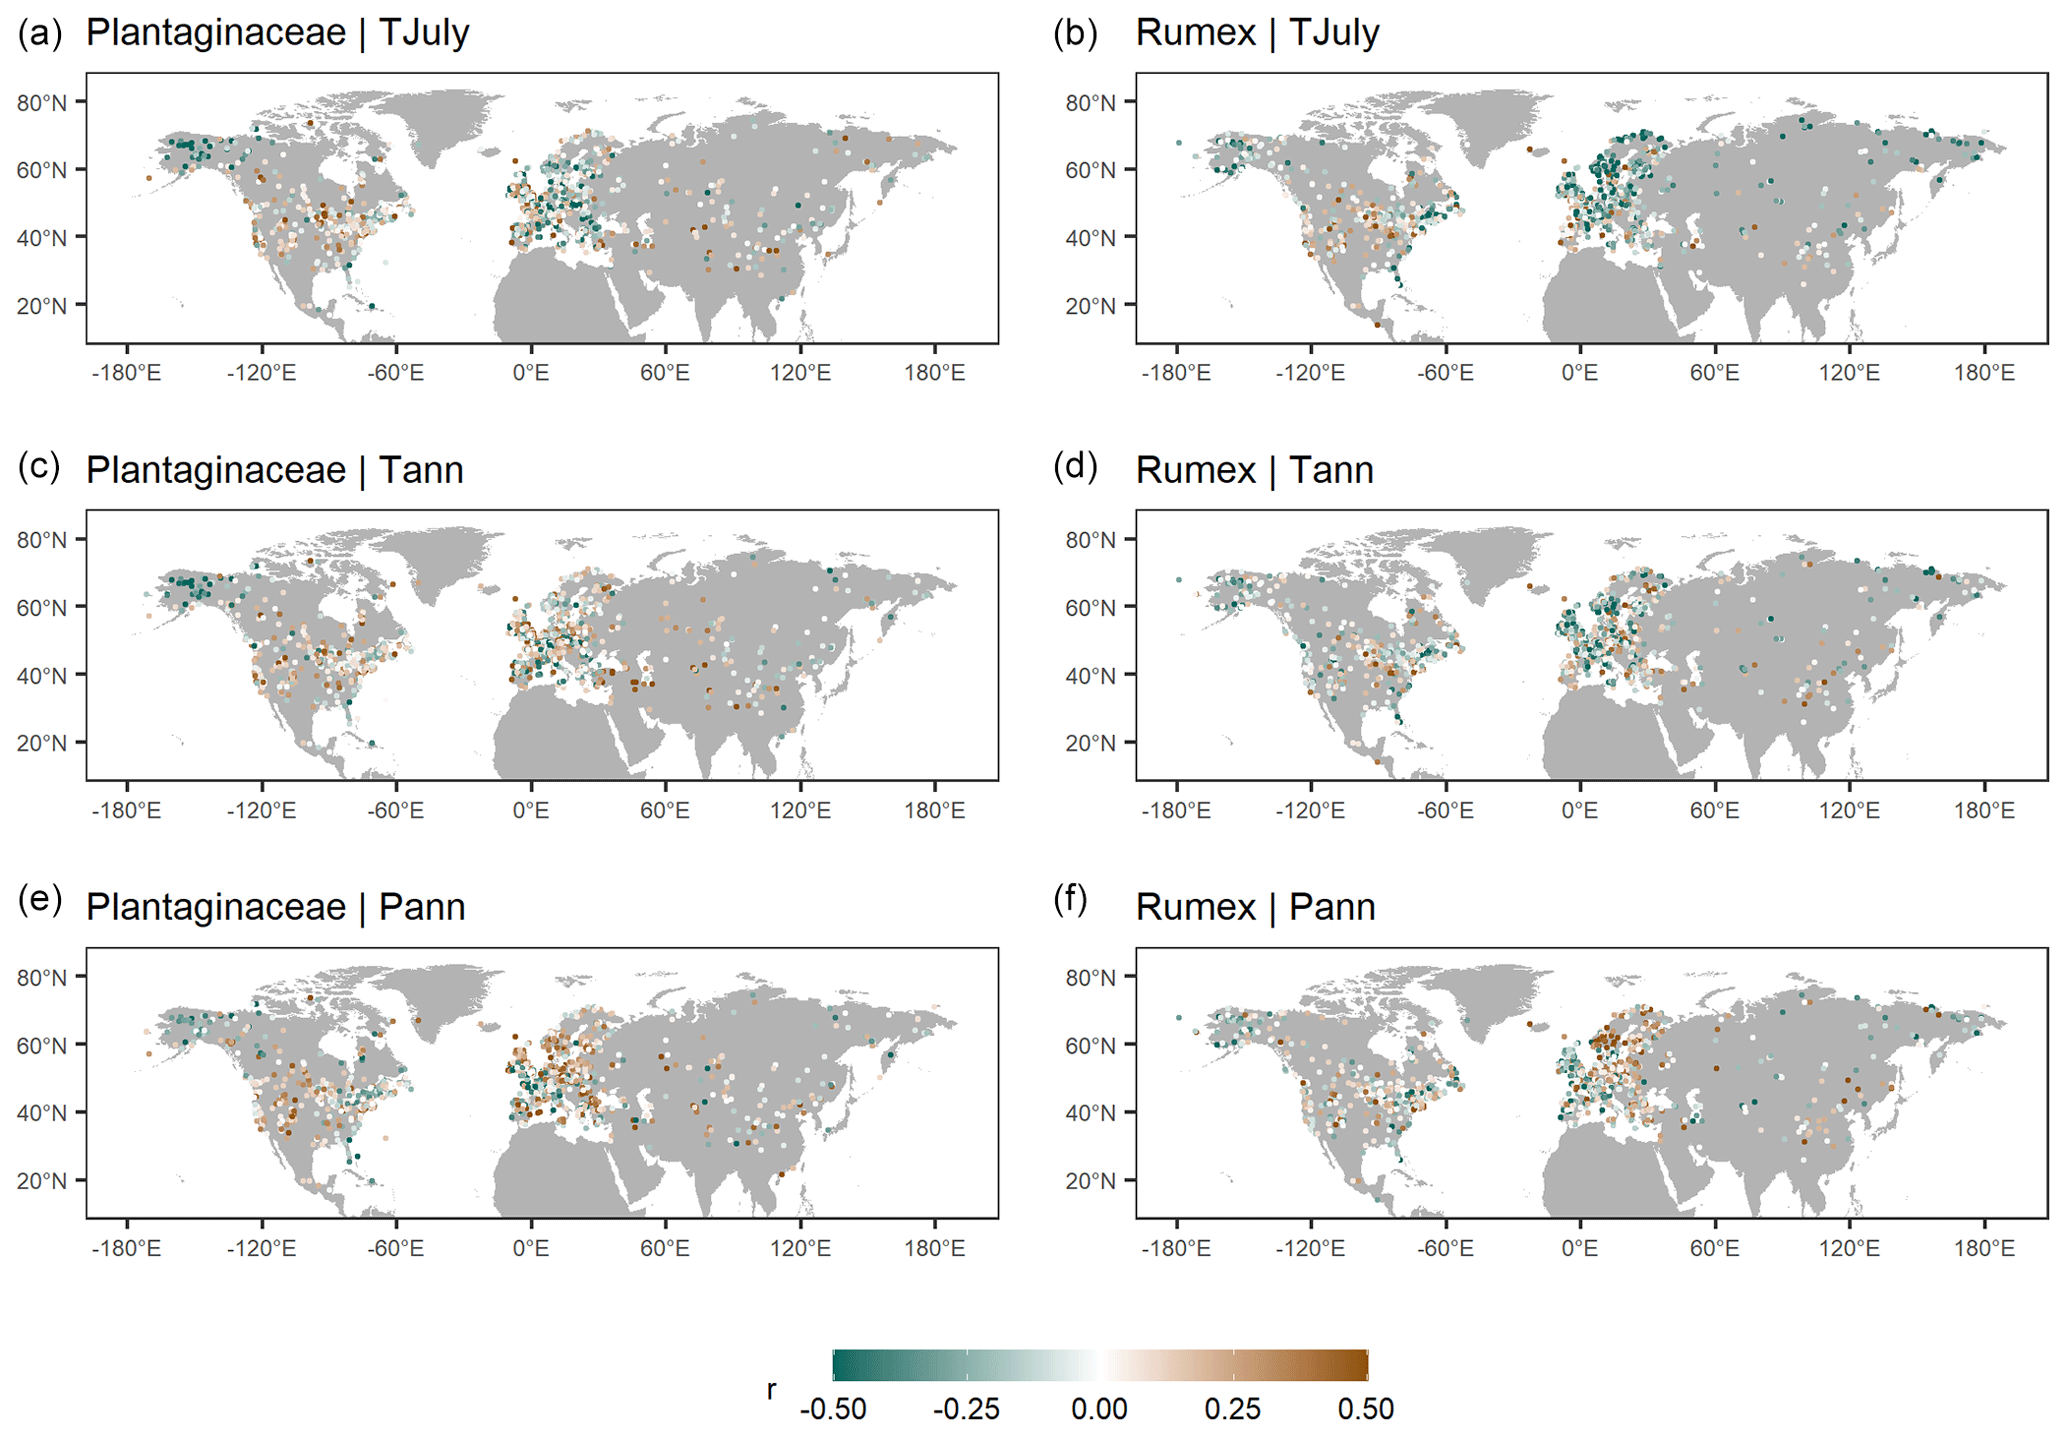
Figure 8Correlation between the percentage of Plantaginaceae (a, c, e) and Rumex (b, d, f) and reconstructed TJuly, Tann and Pann with WA-PLS.
4.7 Assessment of major temporal patterns of LegacyClimate 1.0
To illustrate the difference between mid and late Holocene climate, we calculated the value for the three climate variables at 6 and 1 cal kyr BP, each time taking the average of the interpolated values at those ages for the ensemble of 1000 realizations of the age–depth models (Li et al., 2022). Differences between these time slices reveal warmer and drier conditions during the mid-Holocene compared with late Holocene conditions, especially in eastern North America and also in central and northern Europe. The overall patterns are in good agreement for all three methods but show differences on a regional scale, especially when comparing the reconstructions with WA-PLS and MAT. For TJuly, the reconstruction with MAT shows greater temperature differences in western North America and Southeast Asia. Compared to the reconstruction with WA-PLS, there is a reduced cooling from 6 to 1 cal kyr BP in eastern Europe and a warming instead of a cooling in the western Mediterranean region and along the Southeast Asian coastline in MAT. For large areas in North America and Europe, the reconstructions with WA-PLS suggest an increase in precipitation from 6 to 1 cal kyr BP. A shift to drier conditions can be found along the southeastern coastline in North America, in the Mediterranean Region, and especially in Southeast Asia. The reconstruction with MAT reveals a gradient from increasing precipitation in southwestern Europe to decreasing precipitation in northeastern Europe. In contrast to the reconstructions with WA-PLS, records along the Southeast Asian coastline suggest an increase in precipitation with MAT rather than a decrease (Fig. 9).
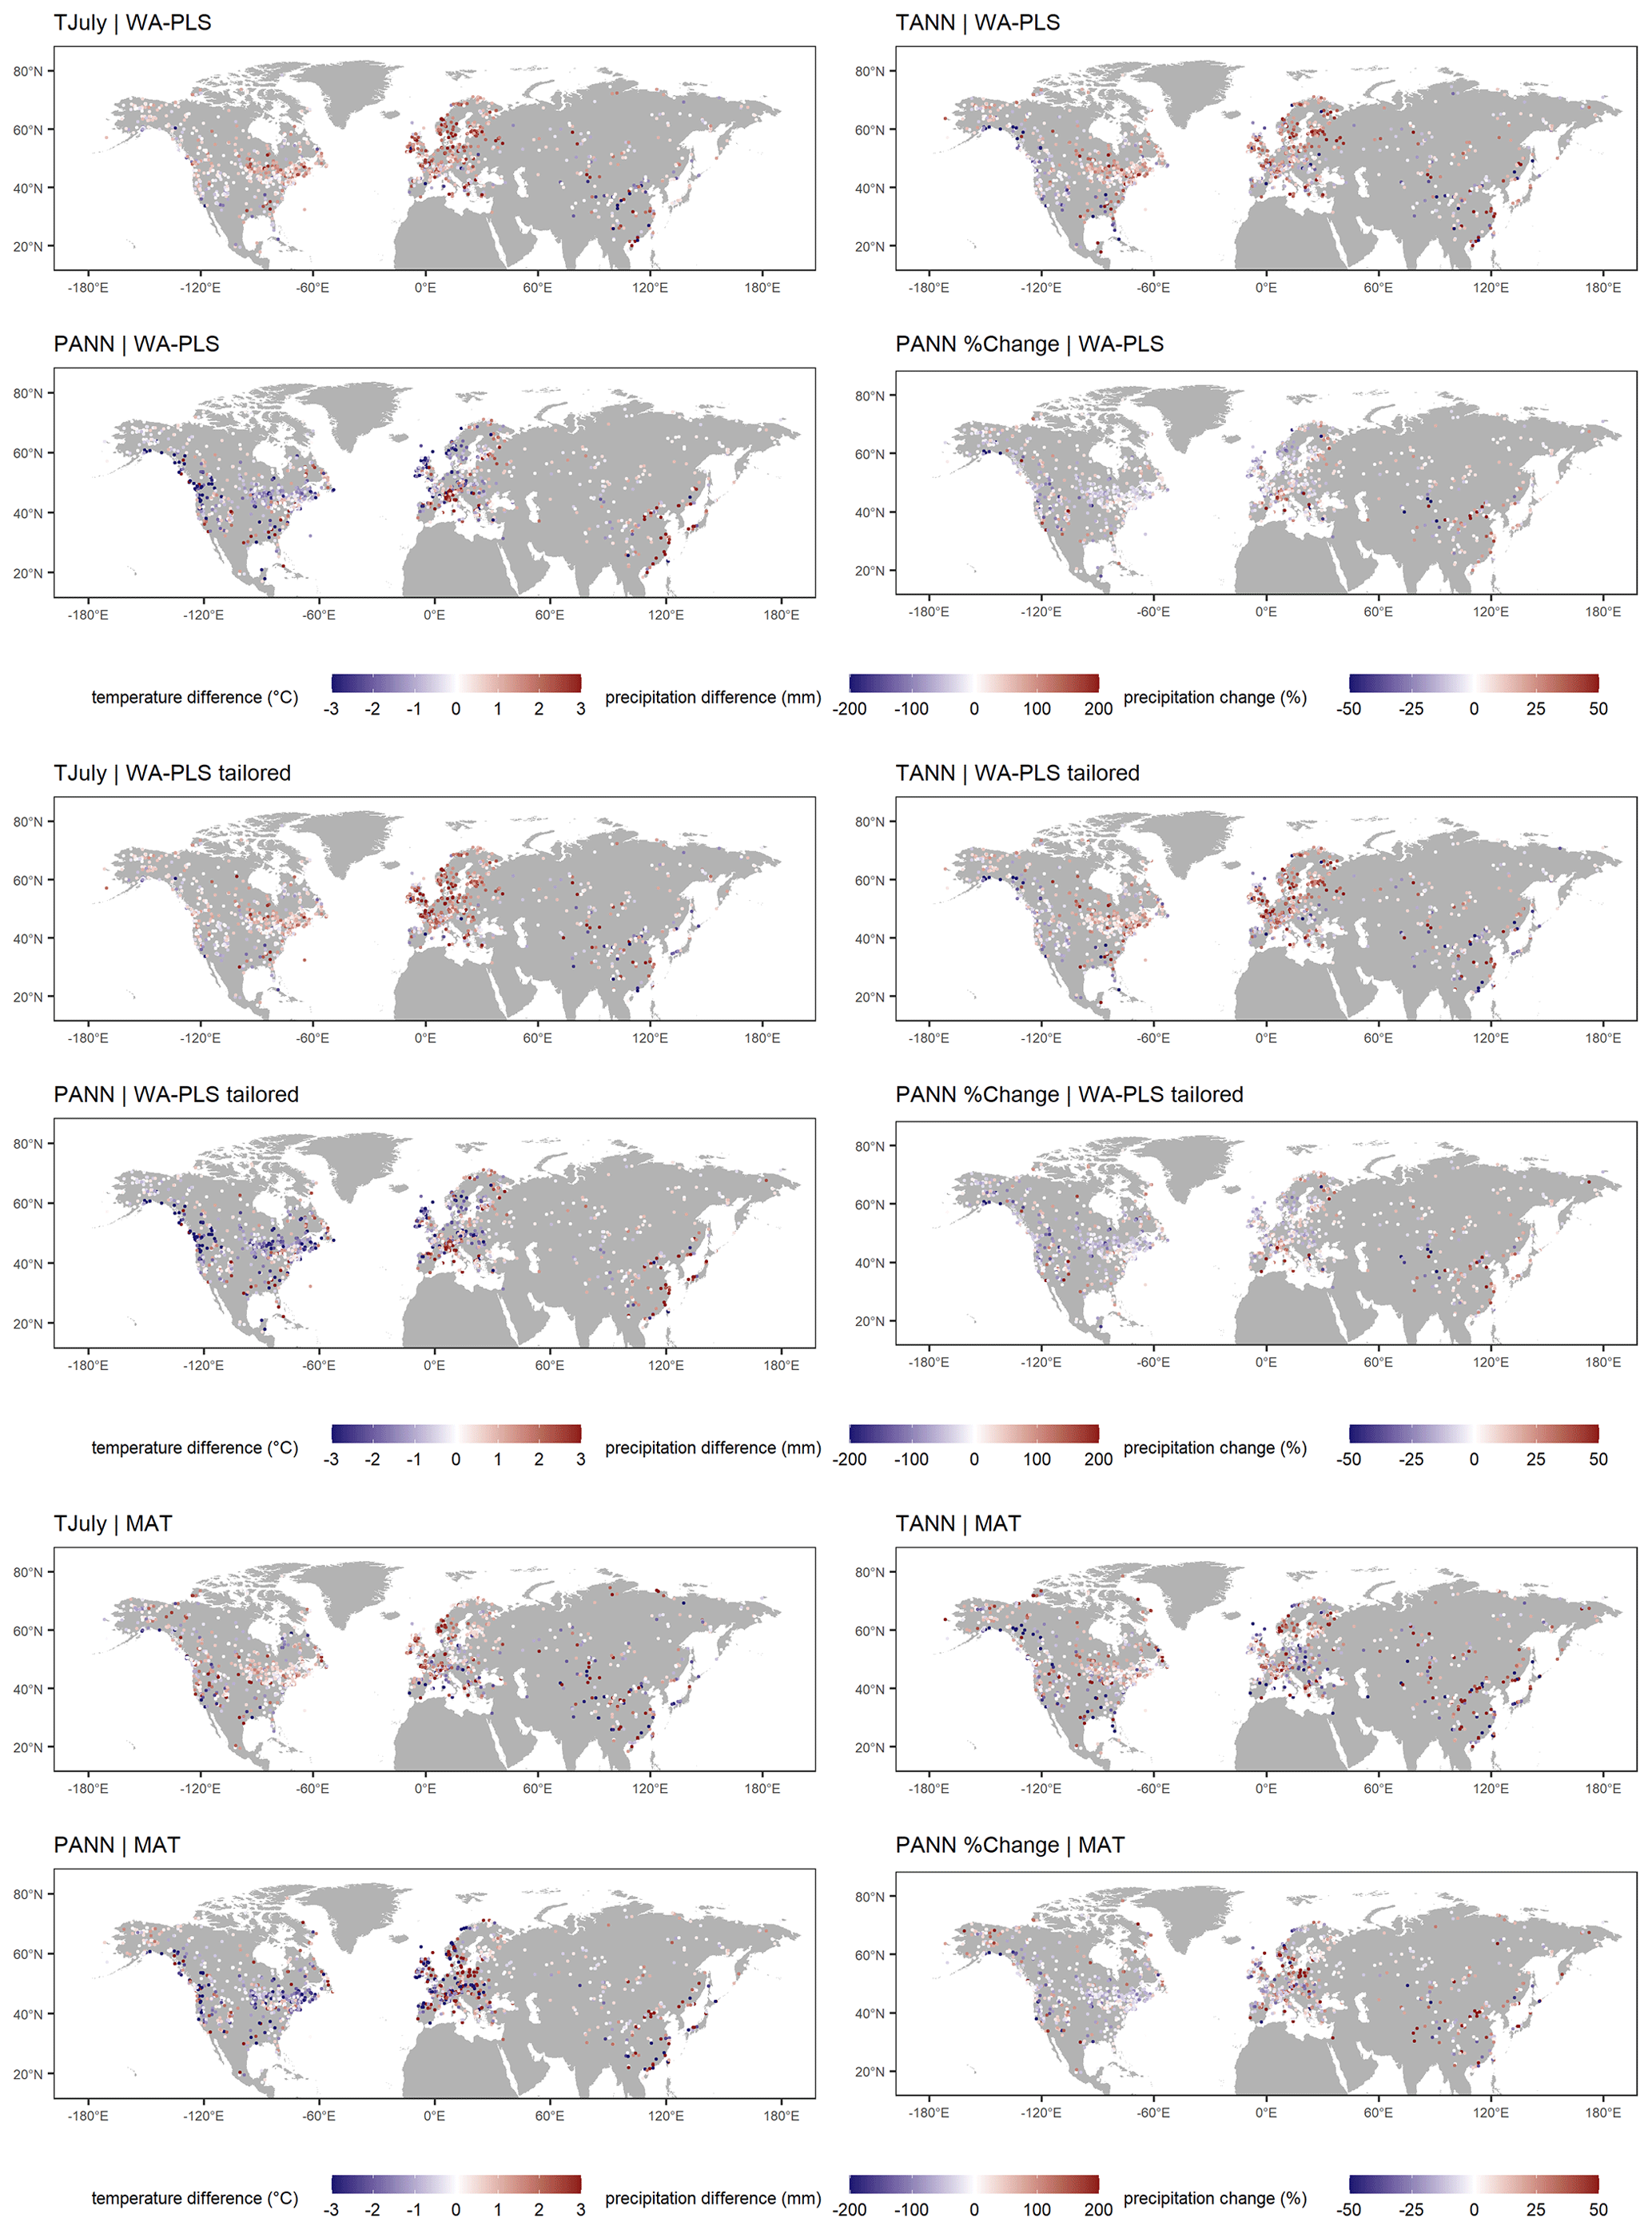
Figure 9Difference from 6 to 1 cal kyr BP for mean July temperature (TJuly), mean annual temperature (Tann), annual precipitation (Pann), and Pann %, as reconstructed from WA-PLS (upper panel), WA-PLS_tailored (middle panel), and MAT (lower panel).
Time series of absolute Tann reconstructions reveal temporal in addition to latitudinal spatial variation on the single continents. Eastern North America and Asia show the most variation in the low latitudes. It is also eastern North America that shows the most pronounced latitudinal gradient. In western North America, the most variation takes place in the high latitudes, while the variation is concentrated to the midlatitudes in Europe. Especially in North America, the warming since the last deglaciation and the beginning of the Holocene is clearly shown in the temporal variation in the time series (Fig. 10).
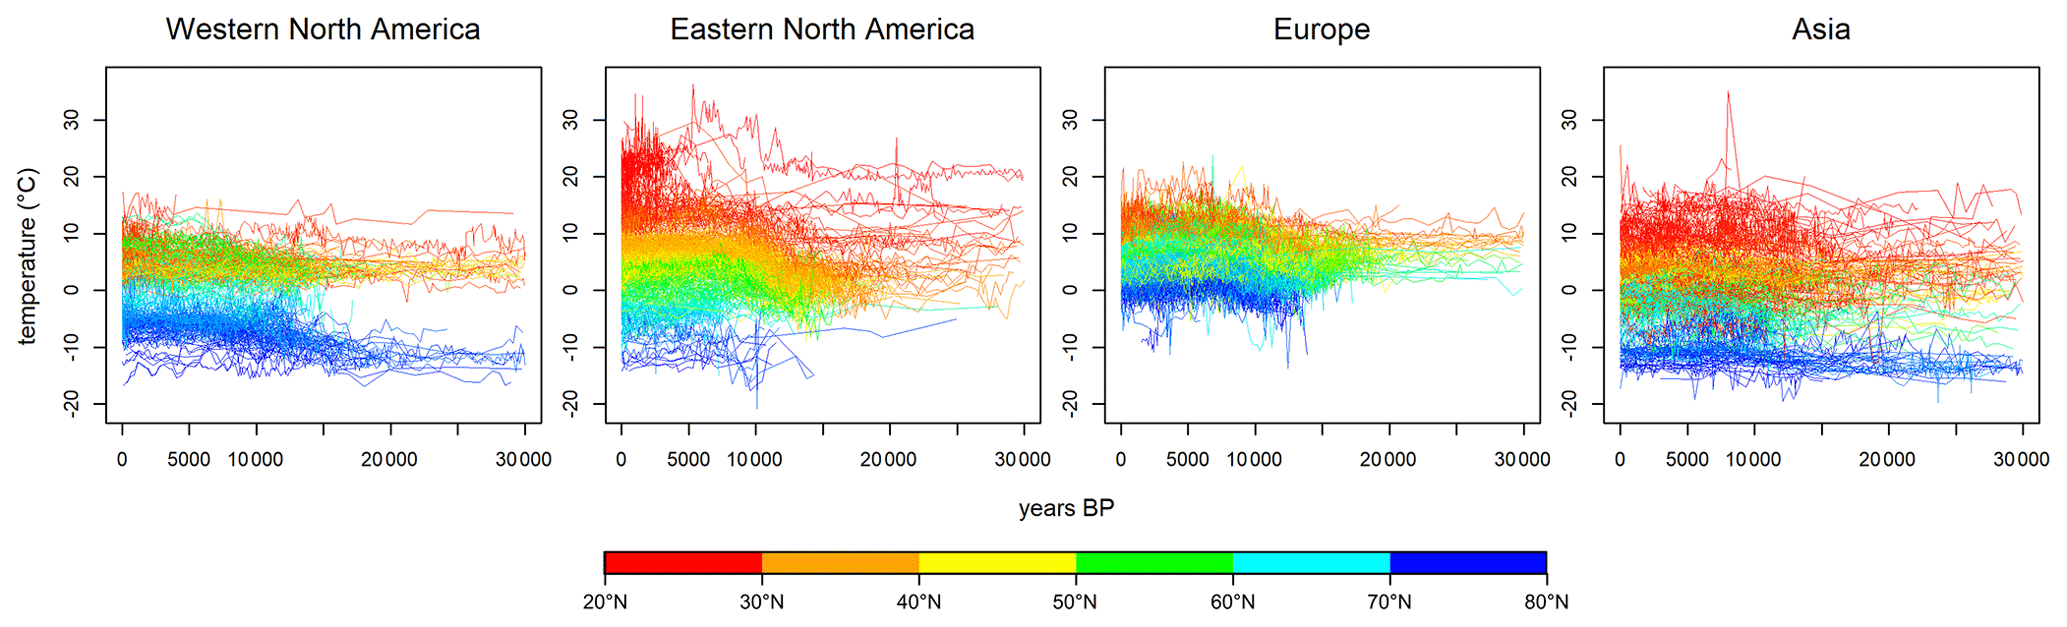
Figure 10Time series of absolute mean annual temperature (Tann) reconstruction with WA-PLS for each (sub-)continent. Colors denote the latitude of the record origin. Age and reconstruction uncertainties are not plotted but are available for each time series.
4.8 Assessment of consistency among reconstruction methods
Reconstructions with MAT are, in general, in good agreement with those derived from the WA-PLS. Comparing MAT with WA-PLS, 37.3 % (TJuly), 38.9 % (Tann), and 30.4 % (Pann) of all records have a positive correlation of r≧0.6. Strong positive correlations () can mainly be identified in eastern North America, while a weak correlation can be found for large areas in central North America and most of Europe (Fig. 11).
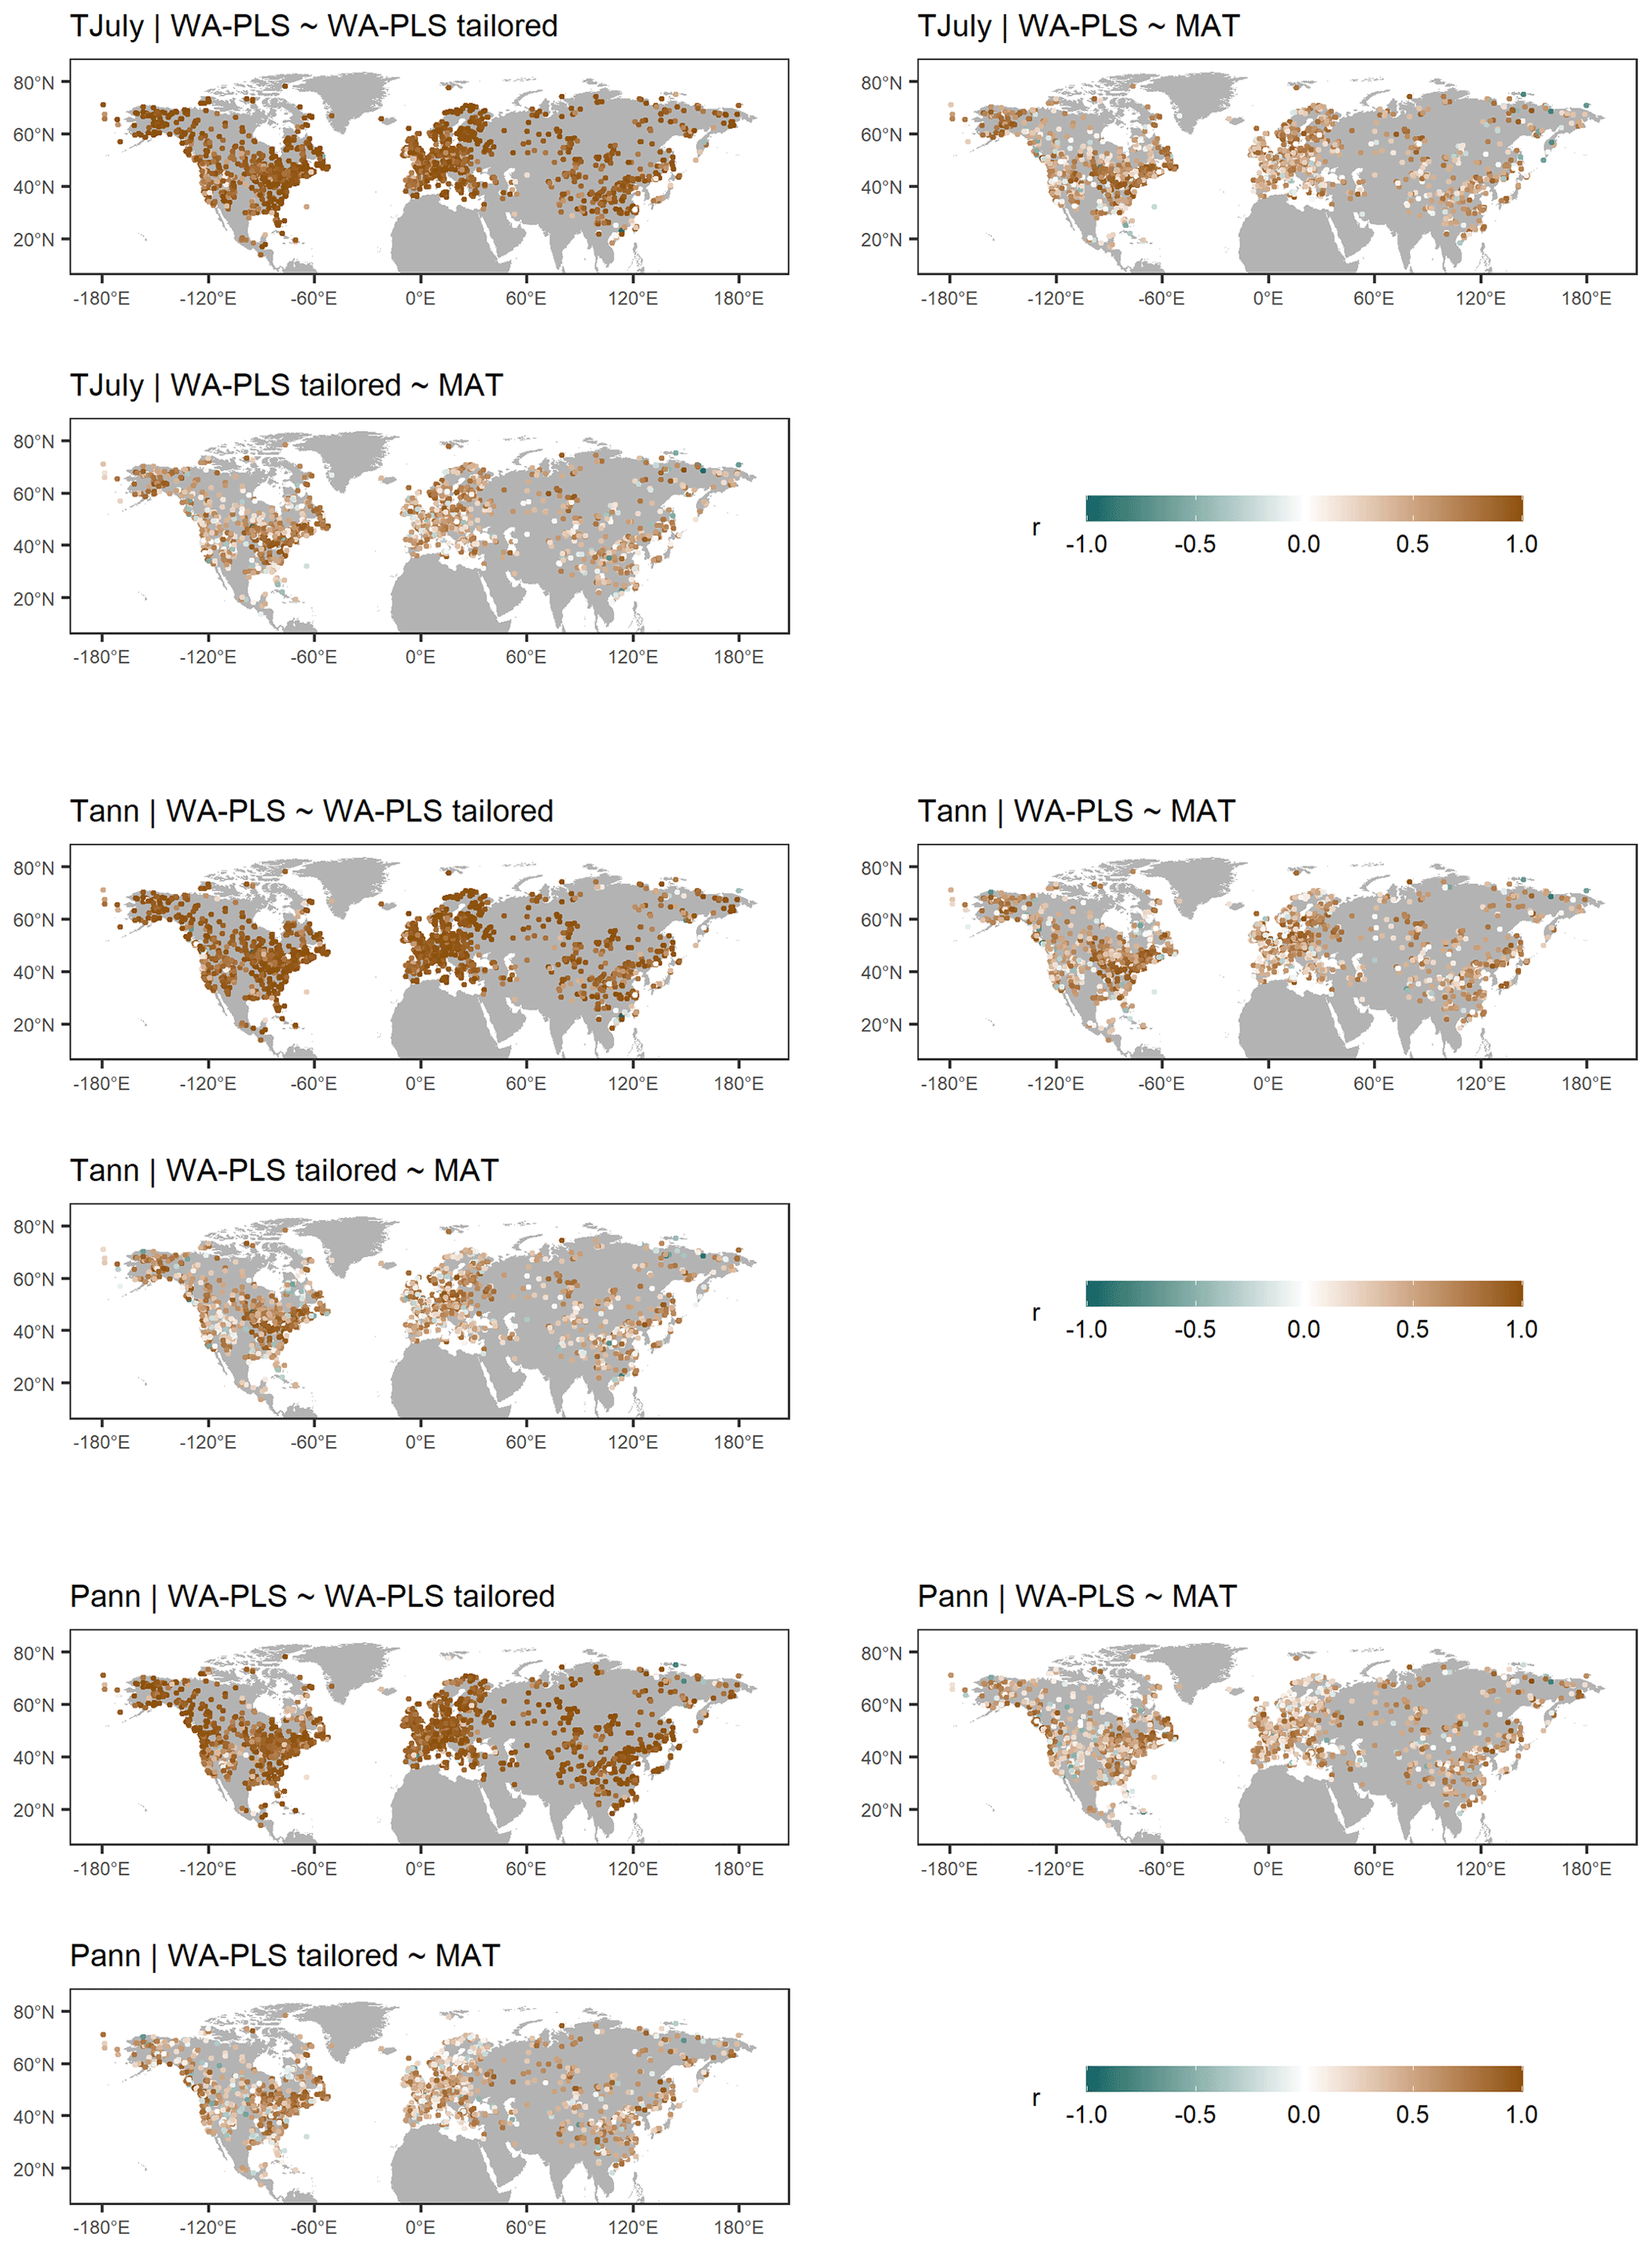
Figure 11Correlation between the time series of the three different reconstruction methods used, namely the weighted averaging partial least squares using a global training set (WA-PLS), WA-PLS using a training set with a limited modern climate range (WA-PLS_tailored), and the modern analog technique (MAT), for the three climate variables of mean July temperature (TJuly), mean annual temperature (Tann), and annual precipitation (Pann).
WA-PLS_tailored used a reduced modern training dataset (illustrated for an example in Appendix Fig. 2). The tailoring successfully reduced the covariation in temperature and precipitation in the modern dataset, as indicated by the distribution of the correlation coefficient in Fig. 12. Nevertheless, the obtained reconstructions are largely consistent between WA-PLS and WA-PLS tailored, with a correlation of r≧0.9 found for 59.2 % of all records for TJuly, 60.7 % for Tann, and 56.5 % for Pann.
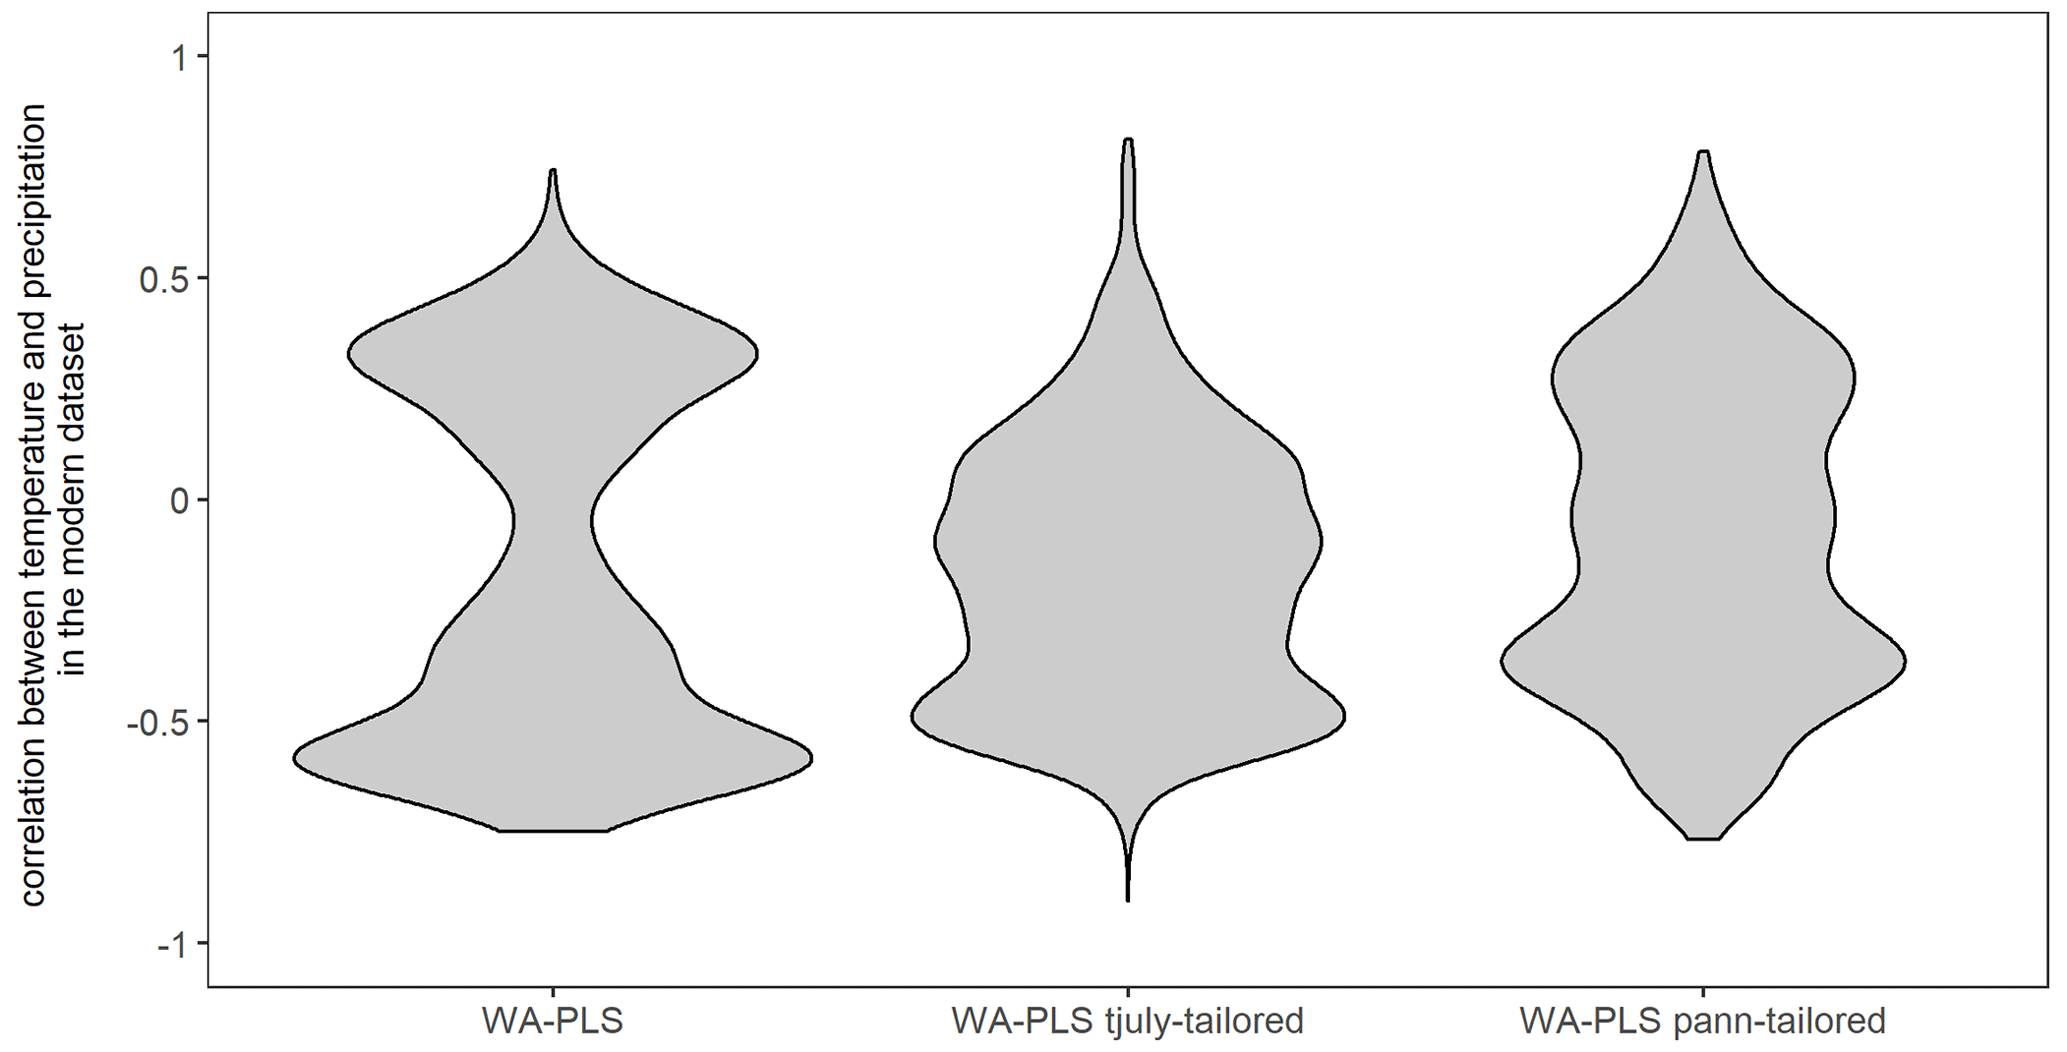
Figure 12Violin plot of the correlation coefficients between TJuly and Pann in the 15 379 training datasets used for the reconstructions. The plots, from left to right, show the WA-PLS reconstructions, WA-PLS TJuly tailored (used for the reconstruction of Pann), and WA-PLS Pann tailored (used for the reconstruction of TJuly).
The compilation of reconstructed TJuly, Tann, and Pann is open access and available from PANGAEA (https://doi.org/10.1594/PANGAEA.930512; see the “Other version” section; Herzschuh et al., 2023a). The dataset files are stored in machine-readable data format (.CSV), which are already separated into western North America, eastern North America, Europe, and Asia for easy access and use.
The R code to run the reconstructions for single sites is available from Zenodo (https://doi.org/10.5281/zenodo.7887565; Herzschuh et al., 2023b), including harmonized open-access modern and fossil pollen datasets, so that customized reconstructions can be easily established.
7.1 Impact of the fossil pollen data source on LegacyClimate 1.0 quality
LegacyClimate 1.0 contains reconstructions of climate variables from fossil pollen data derived from open-access data repositories. The fossil records were derived from multiple natural archives (most commonly, assemblages from continuous lacustrine and peat accumulations; Herzschuh et al., 2022b). Different sizes of lakes and peat areas result in varying sizes of pollen source areas and thus the spatial representativeness of a record. While small lakes and peatlands are considered to provide information about the (extra-)local scale, the regional signal is better represented in pollen assemblages from large lakes (Jackson, 1990; Sugita, 1993). However, taphonomic changes in the records originating, for example, from lake-level changes may impact the reconstructed climate. Pollen from azonal riverine vegetation might be over-represented in fluvially impacted pollen records.
Our dataset is based on taxonomically harmonized modern and fossil pollen datasets using a restricted number of taxa. Such an approach guarantees that all records are handled consistently. Although losing taxonomic information when merging taxa together into a higher taxonomic level, it also increases the possibility of matching climate analogs in the modern and the fossil datasets. However, one needs to keep in mind that species with different ecological requirements may be merged together into one genus or family, for example, Pinus species that are restricted to tropical or subtropical areas in China or ones that grow in boreal forests (Cao et al., 2013; Tian et al., 2017).
Along with the pollen assemblages, data repositories also provide chronological information for fossil records. The quality of such chronologies varies strongly with respect to dating methods, calibration, and numerical algorithms for determining an age–depth relationship (Blois et al., 2011; Trachsel and Telford, 2017). Having accurate and precise chronologies is thus of pivotal importance for reconstructing past climate in order to identify spatiotemporal patterns and in order to help evaluate climate model outputs. The advantage of the fossil pollen dataset used for the reconstruction presented here (i.e., LegacyPollen 1.0; Herzschuh et al., 2022b) is that it has harmonized chronologies (LegacyAge 1.0), along with information about uncertainties, in addition to related metadata and scripts that allow a customized re-establishment of the chronologies (Li et al., 2022). Accordingly, we were able to provide sample-specific age uncertainties along with reconstruction uncertainties.
7.2 Modern pollen and climate data sources and LegacyClimate 1.0 quality
We a priori selected TJuly, Tann, and Pann as target variables for our reconstructions. However, we provide (i.e., explained variance of the climate variable in the modern pollen dataset relative to the variance explained by the unconstrained first axis; ter Braak, 1988), a commonly used proxy for the assessment of reconstructions. The higher the in the spatial modern dataset, the higher the chance that this target climate variable has also impacted vegetation over time and is thus reflected in the variation in the fossil pollen dataset. As a rule of thumb, a ratio of 1 is considered to indicate reliable reconstructions (Juggins, 2013), though useful reconstructions may also be obtained from datasets with lower values. As expected, maps of RMSEPs reveal similar spatial patterns as the results of constrained ordination. Our results indicate that calibration sets from Europe in particular have low ratios and a high RMSEP for all climate variables (despite having a high number of modern samples), likely related to the human impact on the modern and fossil data. Some areas that are known for their sensitivity to precipitation, e.g., East Asia, show low RMSEPs as expected for Pann on the one hand but show a low sensitivity to Tann and TJuly on the other.
For our study we used the, to our knowledge, largest modern dataset ever used in a pollen-based climate reconstruction. For fossil pollen records in areas with an insufficient coverage of modern surface pollen samples (e.g., central Asia or western Siberia), it might be difficult to create a calibration dataset that maps the required variety of environmental and climatic gradients and therefore find enough modern analogs for reconstructions with a classification approach such as MAT. This is indicated by the high RMSEPs as percentages of gradient length in these areas. Our routine uses the modern pollen data from within a radius of 2000 km around the site of the fossil record. The information provided in the reconstruction metadata, including number of modern pollen samples and ranges of reconstructed variables, allows an assessment of the modern dataset used for reconstruction. Our assessments of the modern dataset (e.g., using CCA), the transfer function (e.g., RMSEP), and the reconstruction (e.g., the significance test) also revealed the potential biases in the pollen-based reconstruction and pointed to limitations. Further validation and assessments of the results and more comprehensive uncertainty analyses, e.g., by applying forward modeling approaches (Izumi and Bartlein, 2016; Parnell et al., 2016), would be highly valuable.
7.3 Reconstruction method and LegacyClimate 1.0 quality
Overall, the three reconstruction approaches, MAT, WA-PLS, and WA-PLS_tailored, yield rather similar results (i.e., indicated by the overall high correlation between the reconstructions of the different methods; Fig. 11). Accordingly, the major trends at global or continental scales are similar, even if the actual amplitude of change may vary locally. As each method has its own strengths and weaknesses, there is not one set of reconstructions that is absolutely superior. One advantage of our multi-method reconstruction dataset is that users can identify the methods that are likely to perform best in a selected region and/or specific reconstructions. MAT is often recommended for large-scale studies, but it is highly sensitive to the quality of analogs (Chevalier et al., 2020). Low-analog situations can arise from two causes, namely climate conditions that differ strongly from today (e.g., the low atmospheric CO2 concentration during the Last Glacial Maximum (LGM; ca. 19.0–26.5 cal kyr BP; Clark et al., 2009; Li et al., 2022) or in regions with limited modern samples (e.g., extratropical Asia). Furthermore, growing human influence on the landscape since the mid to late Holocene, especially in densely settled regions in Europe, contributed to gaps within the potential bioclimatic space of taxa and probably also led to extinction events, especially for disturbance-dependent taxa (Zanon et al., 2018). We report the analog distance for each sample to help identify such situations. From our assessments, we revealed that the analogs' quality is rather good overall, at least for the Holocene, except for western Europe and the British Isles in particular (Fig. 4).
In contrast to MAT, WA-PLS (and most regression techniques in general) model relationships between pollen and climate and are, as such, less sensitive to the low-analog situations (Birks et al., 2010). They are, however, based on some modeling assumptions, such as the unimodality of the response of the pollen taxa to climate (ter Braak and Juggins, 1993). This condition is not always met at the continental scale, primarily because of the limited taxonomic resolution of pollen data that merges several plant species with distinct climate requirements as one single pollen taxon. WA-PLS_tailored has the same limitation, but it has the advantage of reducing the influence of the correlation between variables when reconstructing, for instance, temperature and precipitation. This may be particularly relevant for regions with a temperature–moisture-driven circulation system, such as the East Asian summer monsoon (EASM), which can heavily affect precipitation patterns in certain regions (Herzschuh et al., 2019). Using WA-PLS_tailored also increases the number of records that pass a significance level of p<0.1 (Telford and Birks, 2011). Providing several reconstructions based on different assumptions also allows exploring, even if only partially, the uncertainties associated with the modeling assumptions (e.g., MAT vs. WA-PLS, the number of analogs, and the type of metric used to compare pollen samples).
The significance tests (see Telford and Birks, 2011) revealed a rather low percentage of reconstructions to be substantial (p<0.1). However, a failed significance test does not necessarily mean that the reconstruction is not reliable, but the results should be treated more cautiously, as the Telford–Birks test is rather conservative (Luoto et al., 2014; Hébert et al., 2022). Several reasons for possible false negative errors are reported and discussed in the literature, including the test supposedly being sensitive to the size of the training data, a low magnitude of an input climate signal, the trajectory of the core samples through calibration space, or poor analog situations (Luoto et al., 2014; Self et al., 2015; Andrén et al., 2015; Hébert et al., 2022).
All reconstruction methods used in this study heavily rely on extensive collections of modern assemblage data covering diverse climatic and environmental gradients and are applicable on a broad spatial scale. As discussed, all the methods may struggle with some intrinsic characteristics of pollen data and of pollen compilations, including complex species responses, sensitivity to spatial autocorrelation, and limited analogs that may produce poor results in so-called “quantification deserts” (Chevalier, 2019), where fossil pollen is hardly preserved or nearby modern surface pollen samples are missing (Chevalier et al., 2020). However, we designed our datasets so that more methods can be included in our reconstruction scripts (https://doi.org/10.5281/zenodo.7887565; Herzschuh et al., 2023b), such as CREST, an approach that combines presence-only occurrence data from species distribution databases instead of modern pollen samples to estimate the responses of pollen taxa to the climate variable to reconstruct to a climate variable (Chevalier et al., 2014; Chevalier, 2022). CREST is, therefore, more independent from the availability of modern pollen samples. Employing inverse-modeling through iterative forward modeling (IMIFM; Izumi and Bartlein, 2016) might also be possible in such regions. Its use would be particularly interesting to reconstruct the LGM samples because IMIFM is the only technique that can explicitly take the effect of CO2 on plants into consideration (Chevalier et al., 2020). The inclusion of CREST and/or IMIFM in such large-scale studies would complement our multi-model reconstruction ensemble by exploring a larger fraction of the “method uncertainty” space in greater detail (e.g., Brewer et al., 2008). Kucera et al. (2005) propose several metrics for a multi-technique approach to assess the uncertainty space, namely correlations between the residuals (observed minus reconstructed values) and between pairs of techniques are used to investigate the similarity in the reconstructions among different techniques. The correlation between the residuals in seasonal reconstructions (e.g., summer and winter temperatures; summer and annual temperatures) can be used to investigate the degree of independence of different seasonal reconstructions. Error rate estimates (RMSEP) determined by the cross-validation of the calibration datasets and the leave-one-out method can be used to compare the calibration of individual transfer function techniques, though it should be considered that error estimates may vary with the choice of the cross-validation procedure (Kucera et al., 2005).
7.4 Potential use of LegacyClimate 1.0
Our LegacyPollen 1.0 fossil pollen synthesis (Herzschuh et al., 2022b) contains records from all over the Northern Hemisphere extratropics. We used this synthesis to produce our LegacyClimate 1.0 reconstruction dataset, which thus can be used to infer spatiotemporal patterns in climate reconstructions that are not limited to a local or regional scale. Although several hemispheric or global reconstruction studies exist, they have been largely restricted to temperature or have included relatively few records (Marcott et al., 2013; Marsicek et al., 2018; Routson et al., 2019; Kaufman et al., 2020a, b). Our dataset is therefore a valuable addition. It may be used in a multi-proxy approach, to synthesize marine and terrestrial records in order to assess temperature development during the Holocene, and can help to highlight possible interdependencies between oceans and land masses. Globally or hemispherically averaged temperature reconstructions from proxy data indicate peak temperatures during the Holocene thermal maximum around 6000 ka, followed by a pronounced cooling trend toward the late Holocene, which is also visible in our pollen-based reconstructions (Fig. 10). Hence, spatial variability in the Holocene temperature trends (e.g., missing of a pronounced maximum for certain latitudinal bands; delayed thermal maximum on land compared to the ocean) indicate a more local rather than a global Holocene thermal maximum (Kaufman et al., 2020b; Osman et al., 2021; Cartapanis et al., 2022). In contrast, climate models simulate a monotonic warming throughout the Holocene, which resulted in the Holocene conundrum debate (Liu et al., 2014). The debate has since progressed and hints at discrepancies in data–model comparisons due to spatiotemporal dynamics related to heterogeneous responses to climate forcing and feedbacks (i.e., the timing of a Holocene thermal maximum in the Northern Hemisphere extratropics between reconstructions from continental and from marine proxy records; Cartapanis et al., 2022) and sometimes poor spatial averaging due to unevenly distributed proxies. Proxy-only reconstructions often rely on latitudinal binning and weighting, which makes this approach particularly sensitive to latitudinal bands that contain only sparse spatial coverage and thus do not represent a true global average (Osman et al., 2021). Those spatiotemporal dynamics should be considered in a data–model comparison.
Temperature reconstructions often use either mean annual temperatures (Birks, 2019; Bova et al., 2021) or global mean surface temperatures (Marcott et al., 2013; Marsicek et al., 2018; Kaufman et al., 2020a, b). Despite Tann being more commonly used in multi-proxy comparisons, it might be useful to also consider TJuly, as on a regional scale the mean July temperature (or in general summer temperature) is more important in high latitudes in particular. However, it is argued that proxy-based climate reconstructions are seasonally biased and therefore might be the reason for the observed proxy–model divergence (Liu et al., 2014; Rehfeld et al., 2016; Kaufman et al., 2020b). In this respect, it might help that we provide TJuly along with Tann reconstructions derived from our tailoring approach, which provides the opportunity to assess seasonal impacts on the reconstruction (especially in the high latitudes) in addition to a consistent reconstruction synthesis.
So far, reconstructions of precipitation have not been implemented on a hemispheric scale. The interconnection between temperature and precipitation (Trenberth, 2011) and its spatiotemporal variation across the Northern Hemisphere is therefore an important aspect of evaluating climate models (Wu et al., 2013; Hao et al., 2019; Herzschuh et al., 2022a). A broad-scale quantitative reconstruction of temperature and precipitation would therefore be of great value for evaluating transient climate model experiments such as TraCE-21K (He, 2010).
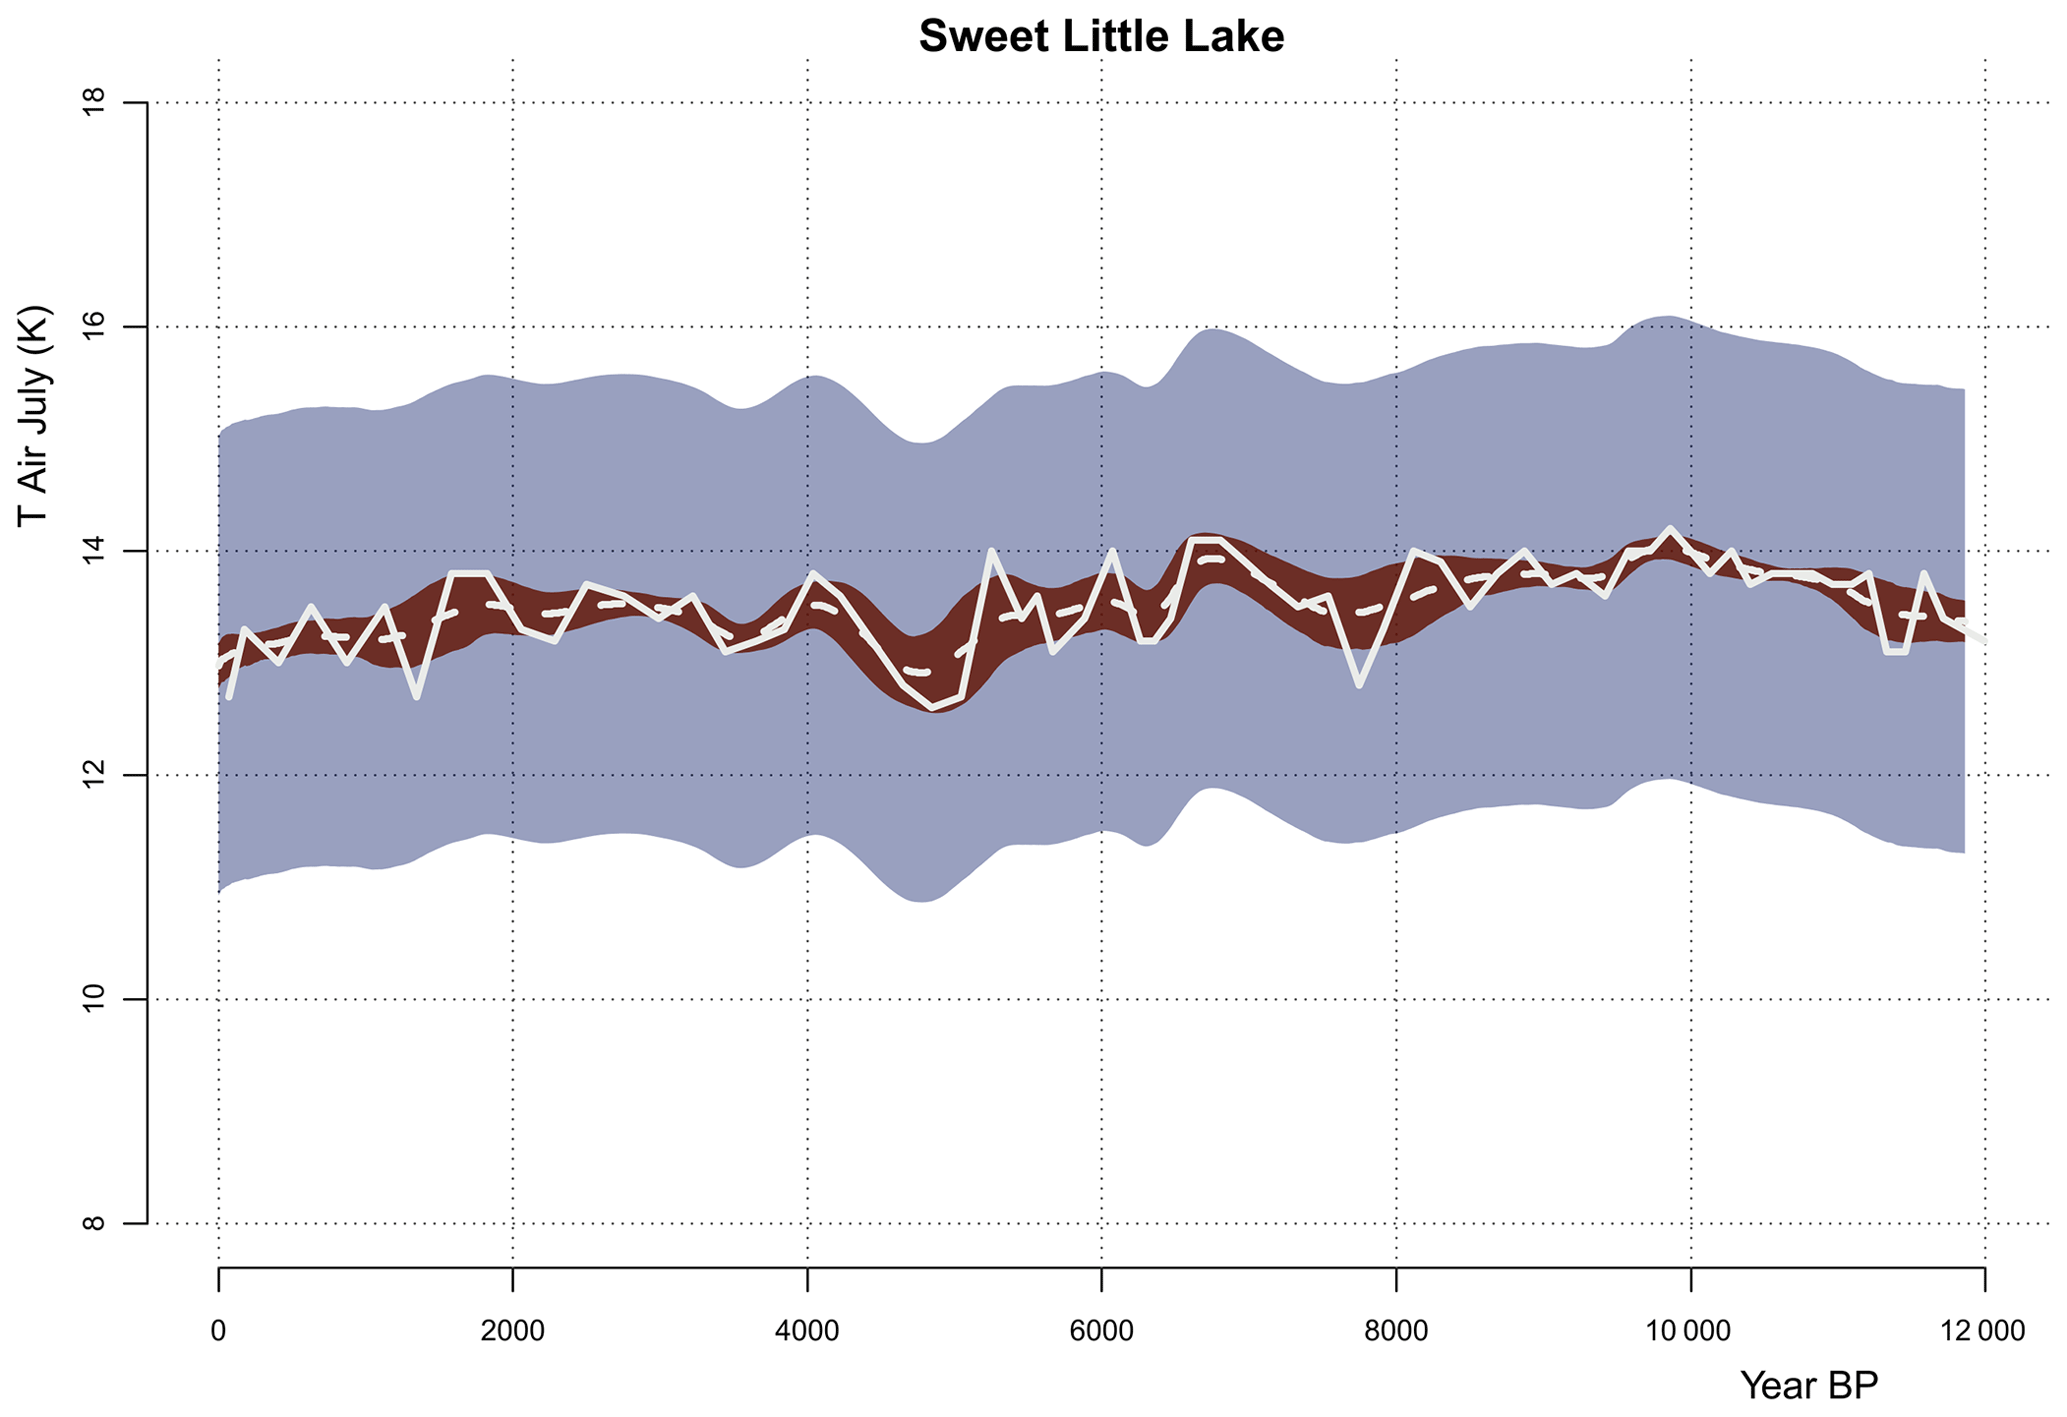
Figure A1Reconstruction error (shaded blue) and the chronological error (shaded red) around the reconstruction smoothed by the time uncertainty (i.e., when we interpolate at regular time steps for the 1000 realizations and average over the ensemble; dashed white). The original reconstruction with the median ages is also shown for comparison (solid white); this underlines the point that averaging over the age models only preserves the low frequencies but (unrealistically) smooths out the high frequencies.
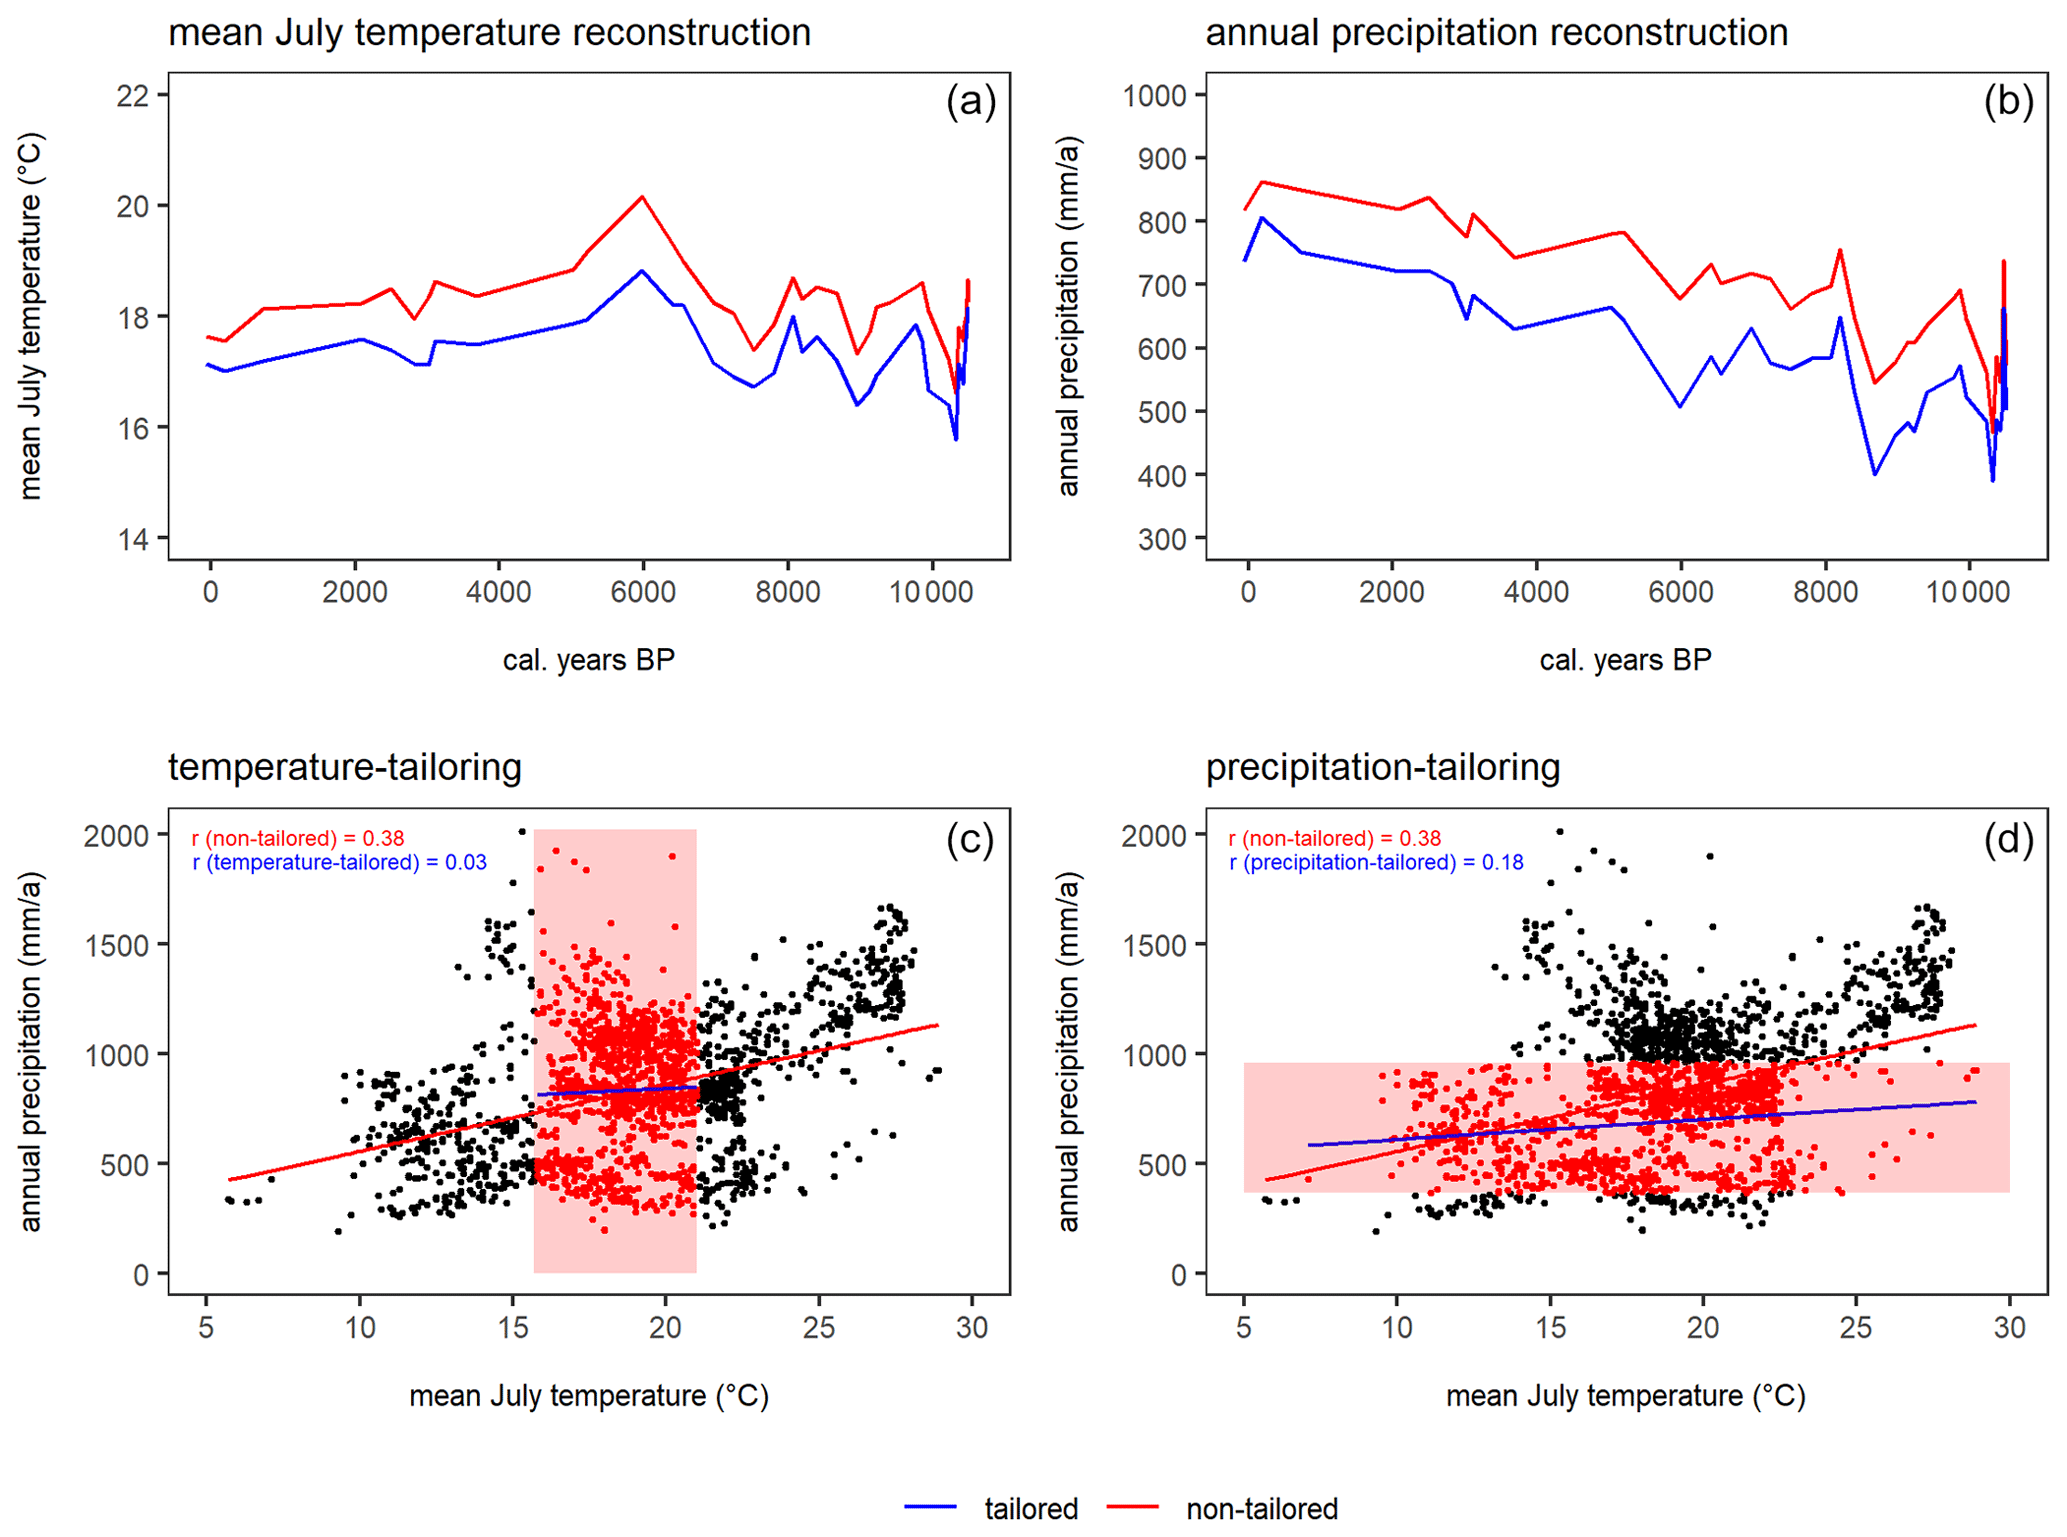
Figure A2Example to illustrate the effect of tailoring the modern dataset for the location of Yellow Dog Pond (dataset ID 3047) in eastern North America. (a, b) Reconstruction of TJuly and Pann with WA-PLS (red) and WA-PLS_tailored (blue). (c, d) Correlation of TJuly and Pann in the modern dataset and the effect of tailoring the modern dataset (indicated with the red box). Correlations are given for non-tailored (red) and tailored (blue) data.
UH designed the study and reconstruction dataset. CL and TB compiled the metadata and the harmonized pollen dataset. TB wrote the R scripts and ran the analyses under the supervision of UH. UH, TB, and MC wrote the first draft. All authors discussed the results and contributed to the final version of this paper.
The contact author has declared that none of the authors has any competing interests.
Publisher’s note: Copernicus Publications remains neutral with regard to jurisdictional claims in published maps and institutional affiliations.
We would like to express our gratitude to all the palynologists and geologists, who, either directly or indirectly by providing their work to the Neotoma Paleoecology Database, contributed pollen data and chronologies to the dataset. The work of the data contributors, the data stewards, and the Neotoma community is gratefully acknowledged. We thank Andrej Andreev, Mareike Wieczorek, and Birgit Heim from the Alfred Wegener Institute for providing information on pollen records and data uploads. We also thank Cathy Jenks for copy-editing a previous version of this work.
This research has been supported by the Bundesministerium für Bildung, Wissenschaft, Forschung und Technologie (grant no. 01LP1510C), the European Research Council, H2020 (GlacialLegacy; grant no. 772852), the Bundesministerium für Bildung, Wissenschaft, Forschung und Technologie (grant no. 01LP1926D), the China Scholarship Council (grant no. 201908130165), and the Russian Science Foundation (grant no. 20-17-00110).
This paper was edited by Hanqin Tian and reviewed by Patrick Bartlein and one anonymous referee.
Andrén, E., Klimaschewski, A., Self, A. E., St. Amour, N., Andreev, A. A., Bennett, K. D., Conley, D. J., Edwards, T. W. D., Solovieva, N., and Hammarlund, D.: Holocene climate and environmental change in north-eastern Kamchatka (Russian Far East), inferred from a multi-proxy study of lake sediments, Global Planet. Change, 134, 41–54, https://doi.org/10.1016/j.gloplacha.2015.02.013, 2015.
Behre, K. E.: The rôle of man in European vegetation history, in: Vegetation history, edited by: Huntley, B. and Webb, T., Handbook of vegetation science, 7, Springer, Dordrecht, https://doi.org/10.1007/978-94-009-3081-0_17, 1988.
Birks, H. J. B.: Contributions of Quaternary botany to modern ecology and biogeography, Plant Ecol. Divers., 12, 189–385, https://doi.org/10.1080/17550874.2019.1646831, 2019.
Birks, H. J. B., Heiri, O., Seppä, H., and Bjune, A. E.: Strengths and Weaknesses of Quantitative Climate Reconstructions Based on Late-Quaternary, Open Ecol. J., 3, 68–110, https://doi.org/10.2174/1874213001003020068, 2010.
Blaauw, M. and Christen, J. A.: Flexible paleoclimate age-depth models using an autoregressive gamma process, Bayesian Anal., 6, 457–474, https://doi.org/10.1214/11-BA618, 2011.
Blois, J. L., Williams, J. W., Grimm, E. C., Jackson, S. T., and Graham, R. W.: A methodological framework for assessing and reducing temporal uncertainty in paleovegetation mapping from late-Quaternary pollen records, Quaternary Sci. Rev., 30, 1926–1939, https://doi.org/10.1016/j.quascirev.2011.04.017, 2011.
Bova, S., Rosenthal, Y., Liu, Z., Godad, S. P., and Yan, M.: Seasonal origin of the thermal maxima at the Holocene and the last interglacial, Nature, 589, 548–553, https://doi.org/10.1038/s41586-020-03155-x, 2021.
Brewer, S., Guiot, J., Sánchez-Goñi, M. F., and Klotz, S.: The climate in Europe during the Eemian: a multi-method approach using pollen data, Quaternary Sci. Rev., 27, 2303–2315, https://doi.org/10.1016/j.quascirev.2008.08.029, 2008.
Cao, X., Ni, J., Herzschuh, U., Wang, Y., and Zhao, Y.: A late Quaternary pollen dataset from eastern continental Asia for vegetation and climate reconstructions: Set up and evaluation, Rev. Palaeobot. Palyno., 194, 21–37, https://doi.org/10.1016/j.revpalbo.2013.02.003, 2013.
Cao, X., Herzschuh, U., Telford, R. J., and Ni, J.: A modern pollen–climate dataset from China and Mongolia: Assessing its potential for climate reconstruction, Rev. Palaeobot. Palyno., 211, 87–96, https://doi.org/10.1016/j.revpalbo.2014.08.007, 2014.
Cao, X., Tian, F., Telford, R. J., Ni, J., Xu, Q., Chen, F., Liu, X., Stebich, M., Zhao, Y., and Herzschuh, U.: Impacts of the spatial extent of pollen-climate calibration-set on the absolute values, range and trends of reconstructed Holocene precipitation, Quaternary Sci. Rev., 178, 37–53, https://doi.org/10.1016/j.quascirev.2017.10.030, 2017.
Cao, X., Tian, F., Andreev, A., Anderson, P. M., Lozhkin, A. V., Bezrukova, E., Ni, J., Rudaya, N., Stobbe, A., Wieczorek, M., and Herzschuh, U.: A taxonomically harmonized and temporally standardized fossil pollen dataset from Siberia covering the last 40 kyr, Earth Syst. Sci. Data, 12, 119–135, https://doi.org/10.5194/essd-12-119-2020, 2020.
Cartapanis, O., Jonkers, L., Moffa-Sanchez, P., Jaccard, S. L., and de Vernal, A.: Complex spatio-temporal structure of the Holocene Thermal Maximum, Nat. Commun., 13, 5662, https://doi.org/10.1038/s41467-022-33362-1, 2022.
Chen, F., Chen, J., Huang, W., Chen, S., Huang, X., Jin, L., Jia, J., Zhang, X., An, C., Zhang, J., Zhao, Y., Yu, Z., Zhang, R., Liu, J., Zhou, A., and Feng, S.: Westerlies Asia and monsoonal Asia: Spatiotemporal differences in climate change and possible mechanisms on decadal to sub-orbital timescales, Earth Sci. Rev., 192, 337–354, https://doi.org/10.1016/j.earscirev.2019.03.005, 2019.
Chevalier, M.: Enabling possibilities to quantify past climate from fossil assemblages at a global scale, Global Planet. Change, 175, 27–35, https://doi.org/10.1016/j.gloplacha.2019.01.016, 2019.
Chevalier, M.: crestr: an R package to perform probabilistic climate reconstructions from palaeoecological datasets, Clim. Past, 18, 821–844, https://doi.org/10.5194/cp-18-821-2022, 2022.
Chevalier, M., Cheddadi, R., and Chase, B. M.: CREST (Climate REconstruction SofTware): a probability density function (PDF)-based quantitative climate reconstruction method, Clim. Past, 10, 2081–2098, https://doi.org/10.5194/cp-10-2081-2014, 2014.
Chevalier, M., Davis, B. A. S., Heiri, O., Seppä, H., Chase, B. M., Gajewski, K., Lacourse, T., Telford, R. J., Finsinger, W., Guiot, J., Kühl, N., Maezumi, S. Y., Tipton, J. R., Carter, V. A., Brussel, T., Phelps, L. N., Dawson, A., Zanon, M., Vallé, F., Nolan, C., Mauri, A., de Vernal, A., Izumi, K., Holmström, L., Marsicek, J., Goring, S., Sommer, P. S., Chaput, M., and Kupriyanov, D.: Pollen-based climate reconstruction techniques for late Quaternary studies, Earth Sci. Rev., 210, 103384, https://doi.org/10.1016/j.earscirev.2020.103384, 2020.
Clark, P. U., Dyke, A. S., Shakun, J. D., Carlson, A. E., Clark, J., Wohlfarth, B., Mitrovica, J. X., Hostetler, S. W., and McCabe, A. M.: The Last Glacial Maximum, Science, 325, 710–714, https://doi.org/10.1126/science.1172873, 2009.
Davis, B. A. S., Zanon, M., Collins, P., Mauri, A., Bakker, J., Barboni, D., Barthelmes, A., Beaudouin, C., Bjune, A. E., Bozilova, E., Bradshaw, R. H. W., Brayshay, B. A., Brewer, S., Brugiapaglia, E., Bunting, J., Connor, S. E., de Beaulieu, J.-L., Edwards, K., Ejarque, A., Fall, P., Florenzano, A., Fyfe, R., Galop, D., Giardini, M., Giesecke, T., Grant, M. J., Guiot, J., Jahns, S., Jankovská, V., Juggins, S., Kahrmann, M., Karpińska-Kołaczek, M., Kołaczek, P., Kühl, N., Kuneš, P., Lapteva, E. G., Leroy, S. A. G., Leydet, M., Guiot, J., Jahns, S., Jankovská, V., Juggins, S., Kahrmann, M., Karpińska-Kołaczek, M., Kołaczek, P., Kühl, N., Kuneš, P., Lapteva, E. G., Leroy, S. A. G., Leydet, M., López Sáez, J. A., Masi, A., Matthias, I., Mazier, F., Meltsov, V., Mercuri, A. M., Miras, Y., Mitchell, F. J. G., Morris, J. L., Naughton, F., Nielsen, A. B., Novenko, E., Odgaard, B., Ortu, E., Overballe-Petersen, M. V., Pardoe, H. S., Peglar, S. M., Pidek, I. A., Sadori, L., Seppä, H., Severova, E., Shaw, H., Święta-Musznicka, J., Theuerkauf, M., Tonkov, S., Veski, S., van der Knaap, W. O., van Leeuwen, J. F. N., Woodbridge, J., Zimny, M., and Kaplan, J. O.: The European Modern Pollen Database (EMPD) project, Veg. Hist. Archaeobot., 22, 521–530, https://doi.org/10.1007/s00334-012-0388-5, 2013.
Davis, B. A. S., Chevalier, M., Sommer, P., Carter, V. A., Finsinger, W., Mauri, A., Phelps, L. N., Zanon, M., Abegglen, R., Åkesson, C. M., Alba-Sánchez, F., Anderson, R. S., Antipina, T. G., Atanassova, J. R., Beer, R., Belyanina, N. I., Blyakharchuk, T. A., Borisova, O. K., Bozilova, E., Bukreeva, G., Bunting, M. J., Clò, E., Colombaroli, D., Combourieu-Nebout, N., Desprat, S., Di Rita, F., Djamali, M., Edwards, K. J., Fall, P. L., Feurdean, A., Fletcher, W., Florenzano, A., Furlanetto, G., Gaceur, E., Galimov, A. T., Gałka, M., García-Moreiras, I., Giesecke, T., Grindean, R., Guido, M. A., Gvozdeva, I. G., Herzschuh, U., Hjelle, K. L., Ivanov, S., Jahns, S., Jankovska, V., Jiménez-Moreno, G., Karpińska-Kołaczek, M., Kitaba, I., Kołaczek, P., Lapteva, E. G., Latałowa, M., Lebreton, V., Leroy, S., Leydet, M., Lopatina, D. A., López-Sáez, J. A., Lotter, A. F., Magri, D., Marinova, E., Matthias, I., Mavridou, A., Mercuri, A. M., Mesa-Fernández, J. M., Mikishin, Y. A., Milecka, K., Montanari, C., Morales-Molino, C., Mrotzek, A., Muñoz Sobrino, C., Naidina, O. D., Nakagawa, T., Nielsen, A. B., Novenko, E. Y., Panajiotidis, S., Panova, N. K., Papadopoulou, M., Pardoe, H. S., Pędziszewska, A., Petrenko, T. I., Ramos-Román, M. J., Ravazzi, C., Rösch, M., Ryabogina, N., Sabariego Ruiz, S., Salonen, J. S., Sapelko, T. V., Schofield, J. E., Seppä, H., Shumilovskikh, L., Stivrins, N., Stojakowits, P., Svobodova Svitavska, H., Święta-Musznicka, J., Tantau, I., Tinner, W., Tobolski, K., Tonkov, S., Tsakiridou, M., Valsecchi, V., Zanina, O. G., and Zimny, M.: The Eurasian Modern Pollen Database (EMPD), version 2, Earth Syst. Sci. Data, 12, 2423–2445, https://doi.org/10.5194/essd-12-2423-2020, 2020.
Eyring, V., Cox, P. M., Flato, G. M., Gleckler, P. J., Abramowitz, G., Caldwell, P., Collins, W. D., Gier, B. K., Hall, A. D., Hoffman, F. M., Hurtt, G. C., Jahn, A., Jones, C. D., Klein, S. A., Krasting, J. P., Kwiatkowski, L., Lorenz, R., Maloney, E., Meehl, G. A., Pendergrass, A. G., Pincus, R., Ruane, A. C., Russell, J. L., Sanderson, B. M., Santer, B. D., Sherwood, S. C., Simpson, I. R., Stouffer, R. J., and Williamson, M. S.: Taking climate model evaluation to the next level, Nat. Clim. Change, 9, 102–110, https://doi.org/10.1038/s41558-018-0355-y, 2019.
Fick, S. E. and Hijmans, R. J.: WorldClim 2: new 1-km spatial resolution climate surfaces for global land areas, Int. J. Climatol., 37, 4302–4315, https://doi.org/10.1002/joc.5086, 2017.
Gajewski, K., Vance, R., Sawada, M., Fung, I., Gignac, L. D., Halsey, L., John, J., Maisongrande, P., Mandell, P., Mudie, P. J., Richard, P. J. H., Sherin, A. G., Soroko, J., and Vitt, D. H.: The climate of North America and adjacent ocean waters ca. 6 ka, Can. J. Earth Sci., 37.5, 661–681, 2000.
Hao, Z., Phillips, T. J., Hao, F., and Wu, X.: Changes in the dependence between global precipitation and temperature from observations and model simulations, Int. J. Climatol., 39, 4895–4906, https://doi.org/10.1002/joc.6111, 2019.
He, F.: Simulating transient climate evolution of the last deglaciation with CCSM3, PhD thesis, University of Wisconsin-Madison, USA, 185 pp., 2010.
Hébert, R., Herzschuh, U., and Laepple, T.: Millennial-scale climate variability over land overprinted by ocean temperature fluctuations, Nat. Geosci., 15, 899–905, https://doi.org/10.1038/s41561-022-01056-4, 2022.
Herzschuh, U., Cao, X., Laepple, T., Dallmeyer, A., Telford, R. J., Ni, J., Chen, F., Kong, Z., Liu, G., Liu, K.-B., Liu, X., Stebich, M., Tang, L., Tian, F., Wang, Y., Wischnewski, J., Xu, Q., Yan, S., Yang, Z., Yu, G., Zhang, Y., Zhao, Y., and Zheng, Z.: Position and orientation of the westerly jet determined Holocene rainfall patterns in China, Nat. Commun., 10, 2376, https://doi.org/10.1038/s41467-019-09866-8, 2019.
Herzschuh, U., Böhmer, T., Li, C., Cao, X., Hébert, R., Dallmeyer, A., Telford, R. J., and Kruse, S.: Reversals in temperature-precipitation correlations in the Northern Hemisphere extratropics during the Holocene, Geophys. Res. Lett., 49, e2022GL099730, https://doi.org/10.1029/2022GL099730, 2022a.
Herzschuh, U., Li, C., Böhmer, T., Postl, A. K., Heim, B., Andreev, A. A., Cao, X., Wieczorek, M., and Ni, J.: LegacyPollen 1.0: a taxonomically harmonized global late Quaternary pollen dataset of 2831 records with standardized chronologies, Earth Syst. Sci. Data, 14, 3213–3227, https://doi.org/10.5194/essd-14-3213-2022, 2022b.
Herzschuh, U., Böhmer, T., Li, C., and Cao, X.: Northern Hemisphere temperature and precipitation reconstruction from taxonomically harmonized pollen data set with revised chronologies using WA-PLS and MAT (LegacyClimate 1.0), PANGAEA [dataset], https://doi.org/10.1594/PANGAEA.930512, 2023a.
Herzschuh, U., Böhmer, T., Li, C., Chevalier, M., Hébert, R., Dallmeyer, A., Cao, X., Bigelow, N. H., Nazarova, L., Novenko, E. Y., Park, J., Peyron, O., Rudaya, N. A., Schlütz, F., Shumilovskikh, L. S., Tarasov, P. E., Wang, Y., Wen, R., Xu, Q., and Zheng, Z.: LegacyClimate 1.0: a dataset of pollen-based climate reconstructions from 2594 Northern Hemisphere sites covering the last 30 kyr and beyond, Zenodo [code], https://doi.org/10.5281/zenodo.7887565, 2023b.
Hijmans, R. J., van Etten, J., Sumner, M., Cheng, J., Baston, D., Bevan, A., Bivand, R., Busetto, L., Canty, M., Fasoli, B., Forrest, D., Ghosh, A., Golicher, D., Gray, J., Greenberg, J. A., Hiemstra, P., Hingee, K., Ilich, A., Institute for Mathematics Applied Geosciences, Karney, C., Mattiuzzi, M., Mosher, S., Naimi, B., Nowosad, J., Pebesma, E., Lamigueiro, O. P., Racine, E. B., Rowlingson, B., Shortridge, A., Venables, B., and Wueest, R.: Raster: Geographic Data Analysis and Modeling, R package version 3.5-11, https://cran.r-project.org/web/packages/raster (last access: 22 November 2021), 2021.
Hill, M. O.: Diversity and Evenness: A Unifying Notation and Its Consequences, Ecology, 54, 427–432, https://doi.org/10.2307/1934352, 1973.
Izumi, K. and Bartlein, P. J.: North American paleoclimate reconstructions for the Last Glacial Maximum using an inverse modeling through iterative forward modeling approach applied to pollen data: Pollen-Based Climate Reconstruction, Geophys. Res. Lett., 43, 10965–10972, https://doi.org/10.1002/2016GL070152, 2016.
Jackson, S. T.: Pollen source area and representation in small lakes of the northeastern United States, Rev. Palaeobot. Palynol., 63, 53–76, https://doi.org/10.1016/0034-6667(90)90006-5, 1990.
Jackson, S. T. and Williams, J. W.: Modern analogs in quaternary paleoecology: Here Today, Gone Yesterday, Gone Tomorrow?, Annu. Rev. Earth Planet. Sci., 32, 495–537, https://doi.org/10.1146/annurev.earth.32.101802.120435, 2004.
Juggins, S.: Quantitative reconstructions in palaeolimnology: new paradigm or sick science?, Quaternary Sci. Rev., 64, 20–32, https://doi.org/10.1016/j.quascirev.2012.12.014, 2013.
Juggins, S.: rioja: Analysis of Quaternary Science Data, R package version 0.9-21, https://cran.r-project.org/web/packages/rioja (last access: 22 November 2021), 2019.
Kaufman, D., McKay, N., Routson, C., Erb, M., Davis, B., Heiri, O., Jaccard, S., Tierney, J., Dätwyler, C., Axford, Y., Brussel, T., Cartapanis, O., Chase, B., Dawson, A., de Vernal, A., Engels, S., Jonkers, L., Marsicek, J., Moffa-Sánchez, P., Morrill, C., Orsi, A., Rehfeld, K., Saunders, K., Sommer, P. S., Thomas, E., Tonello, M., Tóth, M., Vachula, R., Andreev, A., Bertrand, S., Biskaborn, B., Bringué, M., Brooks, S., Caniupán, M., Chevalier, M., Cwynar, L., Emile-Geay, J., Fegyveresi, J., Feurdean, A., Finsinger, W., Fortin, M.-C., Foster, L., Fox, M., Gajewski, K., Grosjean, M., Hausmann, S., Heinrichs, M., Holmes, N., Ilyashuk, B., Ilyashuk, E., Juggins, S., Khider, D., Koinig, K., Langdon, P., Larocque-Tobler, I., Li, J., Lotter, A., Luoto, T., Mackay, A., Magyari, E., Malevich, S., Mark, B., Massaferro, J., Montade, V., Nazarova, L., Novenko, E., Pařil, P., Pearson, E., Peros, M., Pienitz, R., Płóciennik, M., Porinchu, D., Potito, A., Rees, A., Reinemann, S., Roberts, S., Rolland, N., Salonen, S., Self, A., Seppä, H., Shala, S., St-Jacques, J.-M., Stenni, B., Syrykh, L., Tarrats, P., Taylor, K., van den Bos, V., Velle, G., Wahl, E., Walker, I., Wilmshurst, J., Zhang, E., and Zhilich, S.: A global database of Holocene paleotemperature records, Sci. Data, 7, 115, https://doi.org/10.1038/s41597-020-0445-3, 2020a.
Kaufman, D., McKay, N., Routson, C., Erb, M., Dätwyler, C., Sommer, P. S., Heiri, O., and Davis, B.: Holocene global mean surface temperature, a multi-method reconstruction approach, Sci. Data, 7, 201, https://doi.org/10.1038/s41597-020-0530-7, 2020b.
Kucera, M., Weinelt, M., Kiefer, T., Pflaumann, U., Hayes, A., Weinelt, M., Chen, M.-T., Mix, A. C., Barrows, T. T., Cortijo, E., Duprat, J., Juggins, S., and Waelbroeck, C.: Reconstruction of sea-surface temperatures from assemblages of planktonic foraminifera: multi-technique approach based on geographically constrained calibration data sets and its application to glacial Atlantic and Pacific Oceans, Quaternary Sci. Rev., 24, 951–998, https://doi.org/10.1016/j.quascirev.2004.07.014, 2005.
Li, C., Postl, A. K., Böhmer, T., Cao, X., Dolman, A. M., and Herzschuh, U.: Harmonized chronologies of a global late Quaternary pollen dataset (LegacyAge 1.0), Earth Syst. Sci. Data, 14, 1331–1343, https://doi.org/10.5194/essd-14-1331-2022, 2022.
Liu, Z., Zhu, J., Rosenthal, Y., Zhang, X., Otto-Bliesner, B. L., Timmermann, A., Smith, R. S., Lohmann, G., Zheng, W., and Timm, O. E.: The Holocene temperature conundrum, P. Natl. Acad. Sci. USA, 111, E3501–E3505, https://doi.org/10.1073/pnas.1407229111, 2014.
Luoto, T. P., Kaukolehto, M., Weckström, J., Korhola, A., and Väliranta, M.: New evidence of warm early-Holocene summers in subarctic Finland based on an enhanced regional chironomid-based temperature calibration model, Quaternary Res., 81, 50–62, https://doi.org/10.1016/j.yqres.2013.09.010, 2014.
Marcott, S. A., Shakun, J. D., Clark, P. U., and Mix, A. C.: A Reconstruction of Regional and Global Temperature for the Past 11,300 Years, Science, 339, 1198–1201, https://doi.org/10.1126/science.1228026, 2013.
Marsicek, J., Shuman, B. N., Bartlein, P. J., Shafer, S. L., and Brewer, S.: Reconciling divergent trends and millennial variations in Holocene temperatures, Nature, 554, 92–96, https://doi.org/10.1038/nature25464, 2018.
Mauri, A., Davis, B. A. S., Collins, P. M., and Kaplan, J. O.: The climate of Europe during the Holocene: a gridded pollen-based reconstruction and its multi-proxy evaluation, Quaternary Sci. Rev., 112, 109–127, https://doi.org/10.1016/j.quascirev.2015.01.013, 2015.
Nychka, D., Furrer, R., Paige, J., Sain, S., Gerber, F., and Iverson, M.: fields: Tools for Spatial Data, R package version 10.3, https://cran.r-project.org/web/packages/fields/index.html (last access: 22 November 2021), 2020.
Oksanen, J., Blanchet, F. G., Friendly, M., Kindt, R., Legendre, P., McGlinn, D., Minchin, P. R., O'Hara, R. B., Simpson, G. L., Solymos, P., Stevens, M. H. H., Szoecs, E., and Wagner, H.: Vegan: Community Ecology Package, R package version 2.5-7, https://cran.r-project.org/web/packages/vegan (last access: 22 November 2021), 2020.
Osman, M. B., Tierney, J. E., Zhu, J., Tardif, R., Hakim, G. J., King, J., and Poulsen, C. J.: Globally resolved surface temperatures since the Last Glacial Maximum, Nature, 599, 239–244, https://doi.org/10.1038/s41586-021-03984-4, 2021.
Overpeck, J. T., Webb, T., and Prentice, I. C.: Quantitative Interpretation of Fossil Pollen Spectra: Dissimilarity Coefficients and the Method of Modern Analogs, Quaternary Res., 23, 87–108, https://doi.org/10.1016/0033-5894(85)90074-2, 1985.
Parnell, A. C., Haslett, J., Sweeney, J., Doan, T. K., Allen, J. R. M., and Huntley, B.: Joint palaeoclimate reconstruction from pollen data via forward models and climate histories, Quaternary Sci. Rev., 151, 111–126, https://doi.org/10.1016/j.quascirev.2016.09.007, 2016.
R Core Team: R: A language and environment for statistical computing, R Foundation for Statistical Computing, Vienna, Austria, https://www.R-project.org/ (last access: 22 November 2021), 2020.
Rehfeld, K., Trachsel, M., Telford, R. J., and Laepple, T.: Assessing performance and seasonal bias of pollen-based climate reconstructions in a perfect model world, Clim. Past, 12, 2255–2270, https://doi.org/10.5194/cp-12-2255-2016, 2016.
Routson, C. C., McKay, N. P., Kaufman, D. S., Erb, M. P., Goosse, H., Shuman, B. N., Rodysill, J. R., and Ault, T.: Mid-latitude net precipitation decreased with Arctic warming during the Holocene, Nature, 568, 83–87, https://doi.org/10.1038/s41586-019-1060-3, 2019.
Self, A. E., Jones, V. J., and Brooks, S. J.: Late Holocene environmental change in arctic western Siberia, Holocene, 25, 150–165, https://doi.org/10.1177/0959683614556387, 2015.
Simpson, G. L.: Analogue Methods in Palaeolimnology, in: Tracking Environmental Change Using Lake Sediments: Data Handling and Numerical Techniques, edited by: Birks, H. J. B., Lotter, A. F., Juggins, S., and Smol, J. P., Springer Netherlands, Dordrecht, 495–522, https://doi.org/10.1007/978-94-007-2745-8_15, 2012.
Simpson, G. L., Oksanen, J., and Maechler, M.: analogue: Analogue and Weighted Averaging Methods for Palaeoecology, R package version 0.17-6, https://cran.r-project.org/web/packages/analogue (last access: 22 November 2021), 2021.
Sugita, S.: A Model of Pollen Source Area for an Entire Lake Surface, Quaternary Res., 39, 239–244, https://doi.org/10.1006/qres.1993.1027, 1993.
Tarasov, P. E., Nakagawa, T., Demske, D., Österle, H., Igarashi, Y., Kitagawa, J., Mokhova, L., Bazarova, V., Okuda, M., Gotanda, K., Miyoshi, N., Fujiki, T., Takemura, K., Yonenobu, H., and Fleck, A.: Progress in the reconstruction of Quaternary climate dynamics in the Northwest Pacific: A new modern analogue reference dataset and its application to the 430-kyr pollen record from Lake Biwa, Earth Sci. Rev., 108, 64–79, https://doi.org/10.1016/j.earscirev.2011.06.002, 2011.
Telford, R. J.: palaeoSig: Significance Tests for Palaeoenvironmental Reconstructions, R package version 2.0-3, https://cran.r-project.org/web/packages/palaeoSig (last access: 22 November 2021), 2019.
Telford, R. J. and Birks, H. J. B.: A novel method for assessing the statistical significance of quantitative reconstructions inferred from biotic assemblages, Quaternary Sci. Rev., 30, 1272–1278, https://doi.org/10.1016/j.quascirev.2011.03.002, 2011.
ter Braak, C. J. F.: CANOCO – a FORTRAN program for canonical community ordination by (Partial) (Detrended) (Canonical) correspondence analysis and redundancy analysis, Agricultural Mathematics Group, Wageningen, 1988.
ter Braak, C. J. F. and Juggins, S.: Weighted averaging partial least squares regression (WA-PLS): an improved method for reconstructing environmental variables from species assemblages, Hydrobiologia, 269, 485–502, https://doi.org/10.1007/BF00028046, 1993.
Tian, F., Cao, X., Dallmeyer, A., Zhao, Y., Ni, J., and Herzschuh, U.: Pollen-climate relationships in time (9 ka, 6 ka, 0 ka) and space (upland vs. lowland) in eastern continental Asia, Quaternary Sci. Rev., 156, 1–11, https://doi.org/10.1016/j.quascirev.2016.11.027, 2017.
Trachsel, M. and Telford, R. J.: All age–depth models are wrong, but are getting better, Holocene, 27, 860–869, https://doi.org/10.1177/0959683616675939, 2017.
Trenberth, K. E.: Changes in precipitation with climate change, Clim. Res., 47, 123–138, https://doi.org/10.3354/cr00953, 2011.
Whitmore, J., Gajewski, K., Sawada, M., Williams, J. W., Shuman, B., Bartlein, P. J., Minckley, T., Viau, A. E., Webb, T., Shafer, S., Anderson, P., and Brubaker, L.: Modern pollen data from North America and Greenland for multi-scale paleoenvironmental applications, Quaternary Sci. Rev., 24, 1828–1848, https://doi.org/10.1016/j.quascirev.2005.03.005, 2005.
Williams, J. W., Grimm, E. C., Blois, J. L., Charles, D. F., Davis, E. B., Goring, S. J., Graham, R. W., Smith, A. J., Anderson, M., Arroyo-Cabrales, J., Ashworth, A. C., Betancourt, J. L., Bills, B. W., Booth, R. K., Buckland, P. I., Curry, B. B., Giesecke, T., Jackson, S. T., Latorre, C., Nichols, J., Purdum, T., Roth, R. E., Stryker, M., and Takahara, H.: The Neotoma Paleoecology Database, a multiproxy, international, community-curated data resource, Quaternary Res., 89, 156–177, https://doi.org/10.1017/qua.2017.105, 2018.
Williams, J. W., Webb III, T., Richard, P. H., and Newby, P.: Late Quaternary biomes of Canada and the eastern United States, J. Biogeogr., 27, 585–607, https://doi.org/10.1046/j.1365-2699.2000.00428.x, 2000.
Wu, R., Chen, J., and Wen, Z.: Precipitation-surface temperature relationship in the IPCC CMIP5 models, Adv. Atmos. Sci., 30, 766–778, https://doi.org/10.1007/s00376-012-2130-8, 2013.
Zanon, M., Davis, B. A. S., Marquer, L., Brewer, S., and Kaplan, J. O.: European Forest Cover During the Past 12,000 Years: A Palynological Reconstruction Based on Modern Analogs and Remote Sensing, Front. Plant Sci., 9, 253, https://doi.org/10.3389/fpls.2018.00253, 2018.
- Abstract
- Introduction
- Methods
- Dataset description LegacyClimate 1.0: input data, reconstructions, and reconstruction model statistics
- Dataset assessment
- Data availability
- Code availability
- Discussion
- Appendix A
- Author contributions
- Competing interests
- Disclaimer
- Acknowledgements
- Financial support
- Review statement
- References