the Creative Commons Attribution 4.0 License.
the Creative Commons Attribution 4.0 License.
 | 01 Jun 2023
A multi-dimensional dataset of Ordovician to Silurian graptolite specimens for virtual examination, global correlation, and shale gas exploration
Yan-Sen Chen
Xuan Ma
Xiao-Jing Tong
Yi-Tong Sun
Xiao-Yan Dong
Dan-Ni Fan
Shuang-Shuang Song
Yan-Yan Zhu
Ning Yang
Qing Xia
Multi-elemental and multi-dimensional data are more and more important in the development of data-driven research, as is the case in modern paleontology, in which, in an examination by experts, or some day artificial intelligence, every fossil specimen plays a fundamental role. We here release a dataset of 1550 graptolite specimens representing 113 Ordovician to Silurian graptolite species or subspecies that are significant in global stratigraphic correlation and shale gas exploration. The dataset contains 2951 high-resolution images and a data table of each specimen's scientific information, including the taxonomic, geologic, and geographic information, comments, and references. Our dataset provides images for specialists or laypeople worldwide, is supported by the tool FSIDvis (Fossil Specimen Image Dataset Visualizer), which we developed to facilitate the interactive exploration of the rich-attribution image dataset, and includes a nonlinear-dimension reduction technique, t-SNE (t-distributed stochastic neighbor embedding), to project image data into a two-dimensional space to visualize and explore the similarities. Our dataset potentially contributes to virtual examinations of specimens, global bio-stratigraphic correlation, and improvement of the shale gas exploration efficiency. All data, images and the spreadsheet are available at https://doi.org/10.5281/zenodo.6688670 (Xu, 2022).
- Article
(7342 KB) - Full-text XML
- BibTeX
- EndNote


Fossils are direct evidence of prehistoric life and are probably the most important research object in the study of paleontology and stratigraphy, during which fossils are collected, sampled, illustrated, described, curated, and deposited as permanent specimens in a museum or another institution for further investigation (Shute and Foster, 1999). Examinations of fossil specimens are a key and indispensable part of descriptive paleontology. Such examinations, however, can be partially achieved in a convenient and low-cost way with the aid of multi-dimensional fossil specimen dataset as in this study.
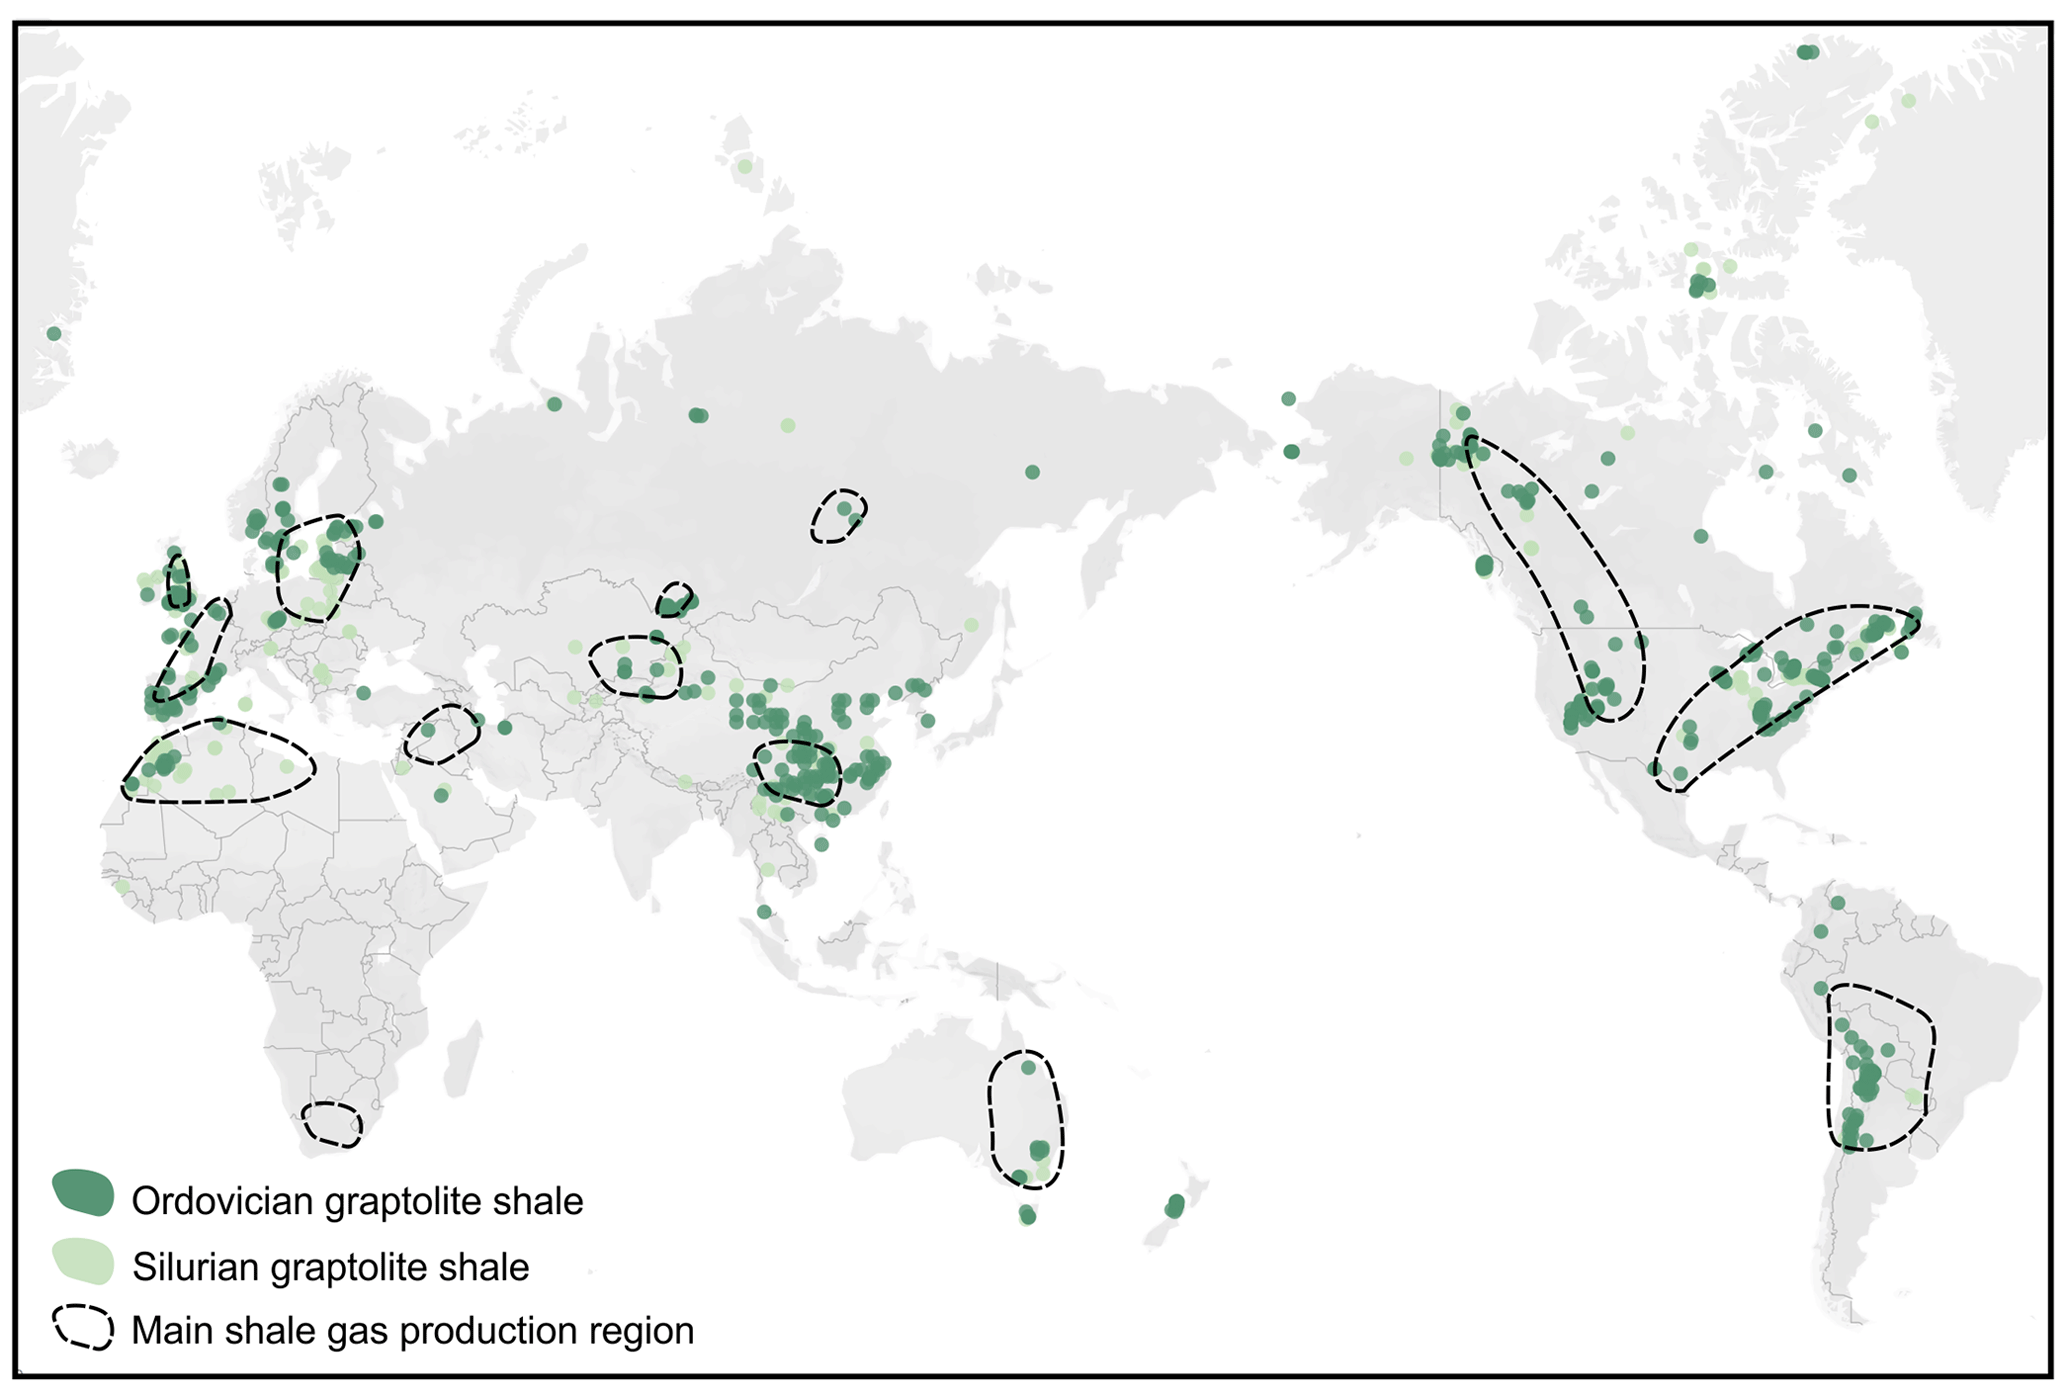
Figure 1Global distribution of graptolite shale and shale gas production region. Most graptolite fossils were yielded from these shale sediments, and their distribution is based on their occurrence records in global Ordovician and Silurian sediments. All data are from Peters and McClennen (2016) and Xu et al. (2020). The map is from © OpenStreetMap contributors (2021) and distributed under the Open Data Commons Open Database License (ODbL) v1.0.
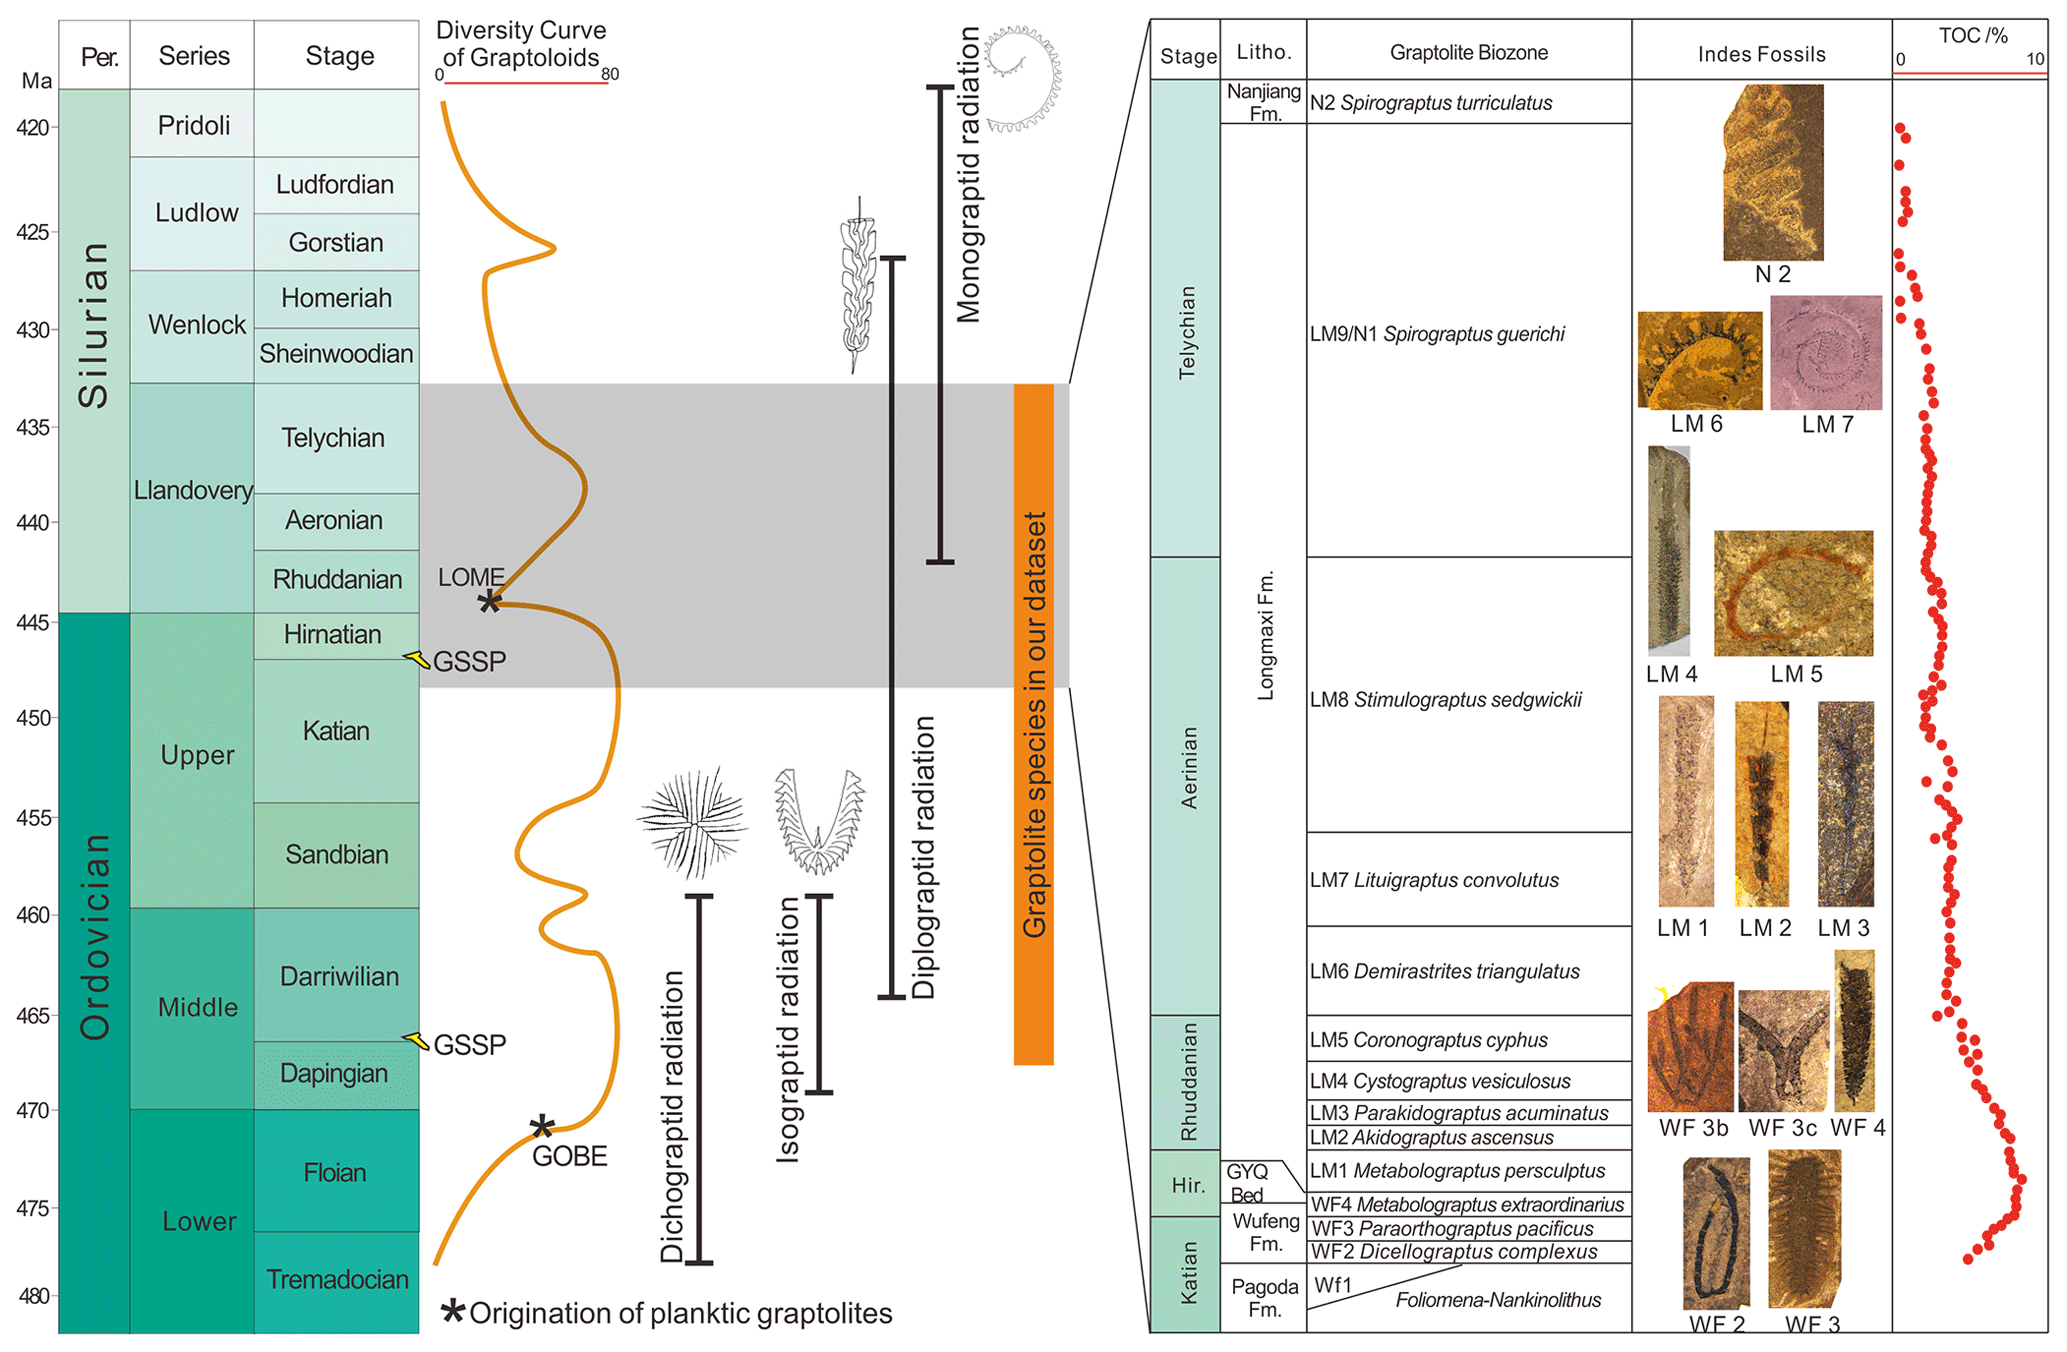
Figure 2Graptolite species of our dataset are significant to the biostratigraphy and dating of Ordovician and Silurian sediments. These graptolites also witnessed several macro-evolution events, including the great Ordovician biodiversity event (GOBE) and Late Ordovician mass extinction (LOME). The radiation of several graptolite groups (bold vertical lines) occurs in this geological time. Two global stratotype sections and points (GSSPs), based on a graptolite species record, are in southern China (the spike marks on the left of the figure; data from Goldman et al., 2020). Bio- or indication zones based on graptolite species assist with identifying mining beds for shale gas exploration in southern China. In total, 16 graptolite indicator zones are used in the shale gas exploration in China (Zou et al., 2015; on the right of the figure).
Graptolites are an extinct group of marine, colonial, and organic-walled hemichordates and have over 210 genera/3000 species in worldwide fossil records from the Cambrian to Carboniferous (c. 510–320 Ma) shales (Maletz, 2017). Graptolites extensively diversified in the Ordovician Period and witnessed the second-largest mass extinction in geological life history (i.e., the end-Ordovician mass extinction; Goldman et al., 2020). Graptolites evolved quickly and spread globally in the Palaeozoic Era (Fig. 1), and its species are widely used as significant index fossils for determining rock ages and regional biostratigraphic correlation. Biozones based on graptolite species dividing the Ordovician and Silurian periods are generally less than 1 million years in duration; such a short geological interval makes a precise understanding of life evolution in geological history possible (Chen et al., 2012, 2018). Up to 102 Ordovician and Silurian graptolite species were selected as global biozones for dating the sediments and understanding the evolutionary pattern of paleobiology, and 13 global stratotype sections and points (GSSPs) are defined by the first appearance datum (FAD) of graptolite species from the Cambrian, Ordovician, and Silurian systems (Goldman et al., 2020; Fig. 2).
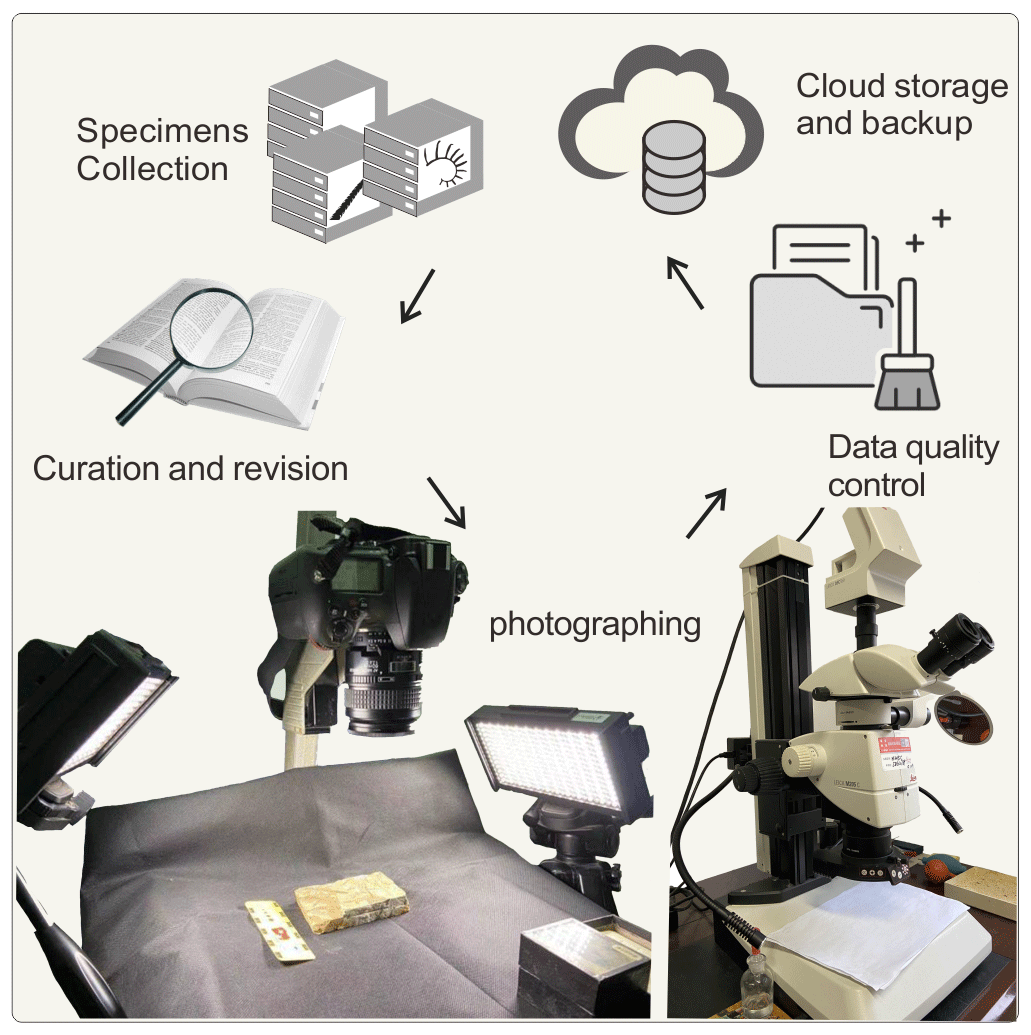
Figure 3The process of creating the graptolite specimen image dataset. The graptolite specimens were carefully curated and revised to select the species with biostratigraphy and application significances. Every image was obtained from specimens that were macro-photographed using a single-lens reflex (SLR) camera and microscope. After professional revision and cleaning, the whole dataset was uploaded to and stored in our cloud server.
Additionally, biozones or indication zones based on graptolite species assist with identifying mining beds for shale gas exploration (Fig. 1). Graptolitic shale yields a significant volume of shale gas and comprises more than 9 % of the global hydrocarbons rocks (Klemme and Ulmishek, 1991; Podhalańska, 2013). In China, over 61.4 % of the natural gas is yielded from the Ordovician and Silurian graptolitic shale of southern China (Zou et al., 2019). Identification of graptolite species helps to locate shale gas mining beds, especially since 16 graptolite species were chosen as the “golden callipers” to locate favorable exploration beds (FEBs) of shale gas from China (Zou et al., 2015; Fig. 2).
In this paper, we describe a multi-dimensional and integrated dataset of graptolite specimens. The dataset potentially contributes to a range of scientific activities and provides (1) easy access to and virtual examination of fossil specimens through high-resolution images and detailed scientific information for teaching and training in paleontology and geologic survey, (2) a standard fossil specimen image dataset to use in biostratigraphic correlations and to improve exploration efficiency in the shale gas industry, and (3) a potential aid for developing image-based automated classification.
All images in our dataset were taken from graptolite specimens that are preserved in shale and were collected from China. These specimens are housed at the Nanjing Institute of Geology and Paleontology (NIGP), Chinese Academy of Sciences (CAS), with serial numbers and the prefix NIGP.
We spent over 2 years photographing every specimen, using a Nikon D800E single-lens reflex (SLR) camera, with a Nikkor 60 mm macro-lens, and a Leica M125 or M205C microscope equipped with Leica cameras (Fig. 3). Every image is well focused and shows the morphology of the graptolite. In total, we took 40 597 images, including 20 644 camera photos (each with a resolution of 4912 × 7360) and 19 953 microscope photos (each with a resolution of 2720 × 2048). Photos with a low contrast or bad focus were removed from the whole collection. We only selected photos that show the morphology of the specimen and the diagnostic characters of each graptolite species that the specimen represents (Fig. 4). We selected one or two images for each specimen as the final dataset, which have been uploaded to and stored in our cloud server (Fig. 3).
Our final dataset consists of 2951 high-resolution images and a related spreadsheet. Every image is a high-resolution photo taken from a collection of 1550 graptolite specimens. These specimens were formally published between 1958 and 2020. They belong to 113 graptolite species or subspecies of 41 genera and 16 families of the order Graptoloidea (see the spreadsheet; Fig. 5). The geological age of these graptolite species ranges from the Middle Ordovician (467.3 Ma) to the Telychian Stage of the Silurian Period (433.4 Ma; Fig. 5).
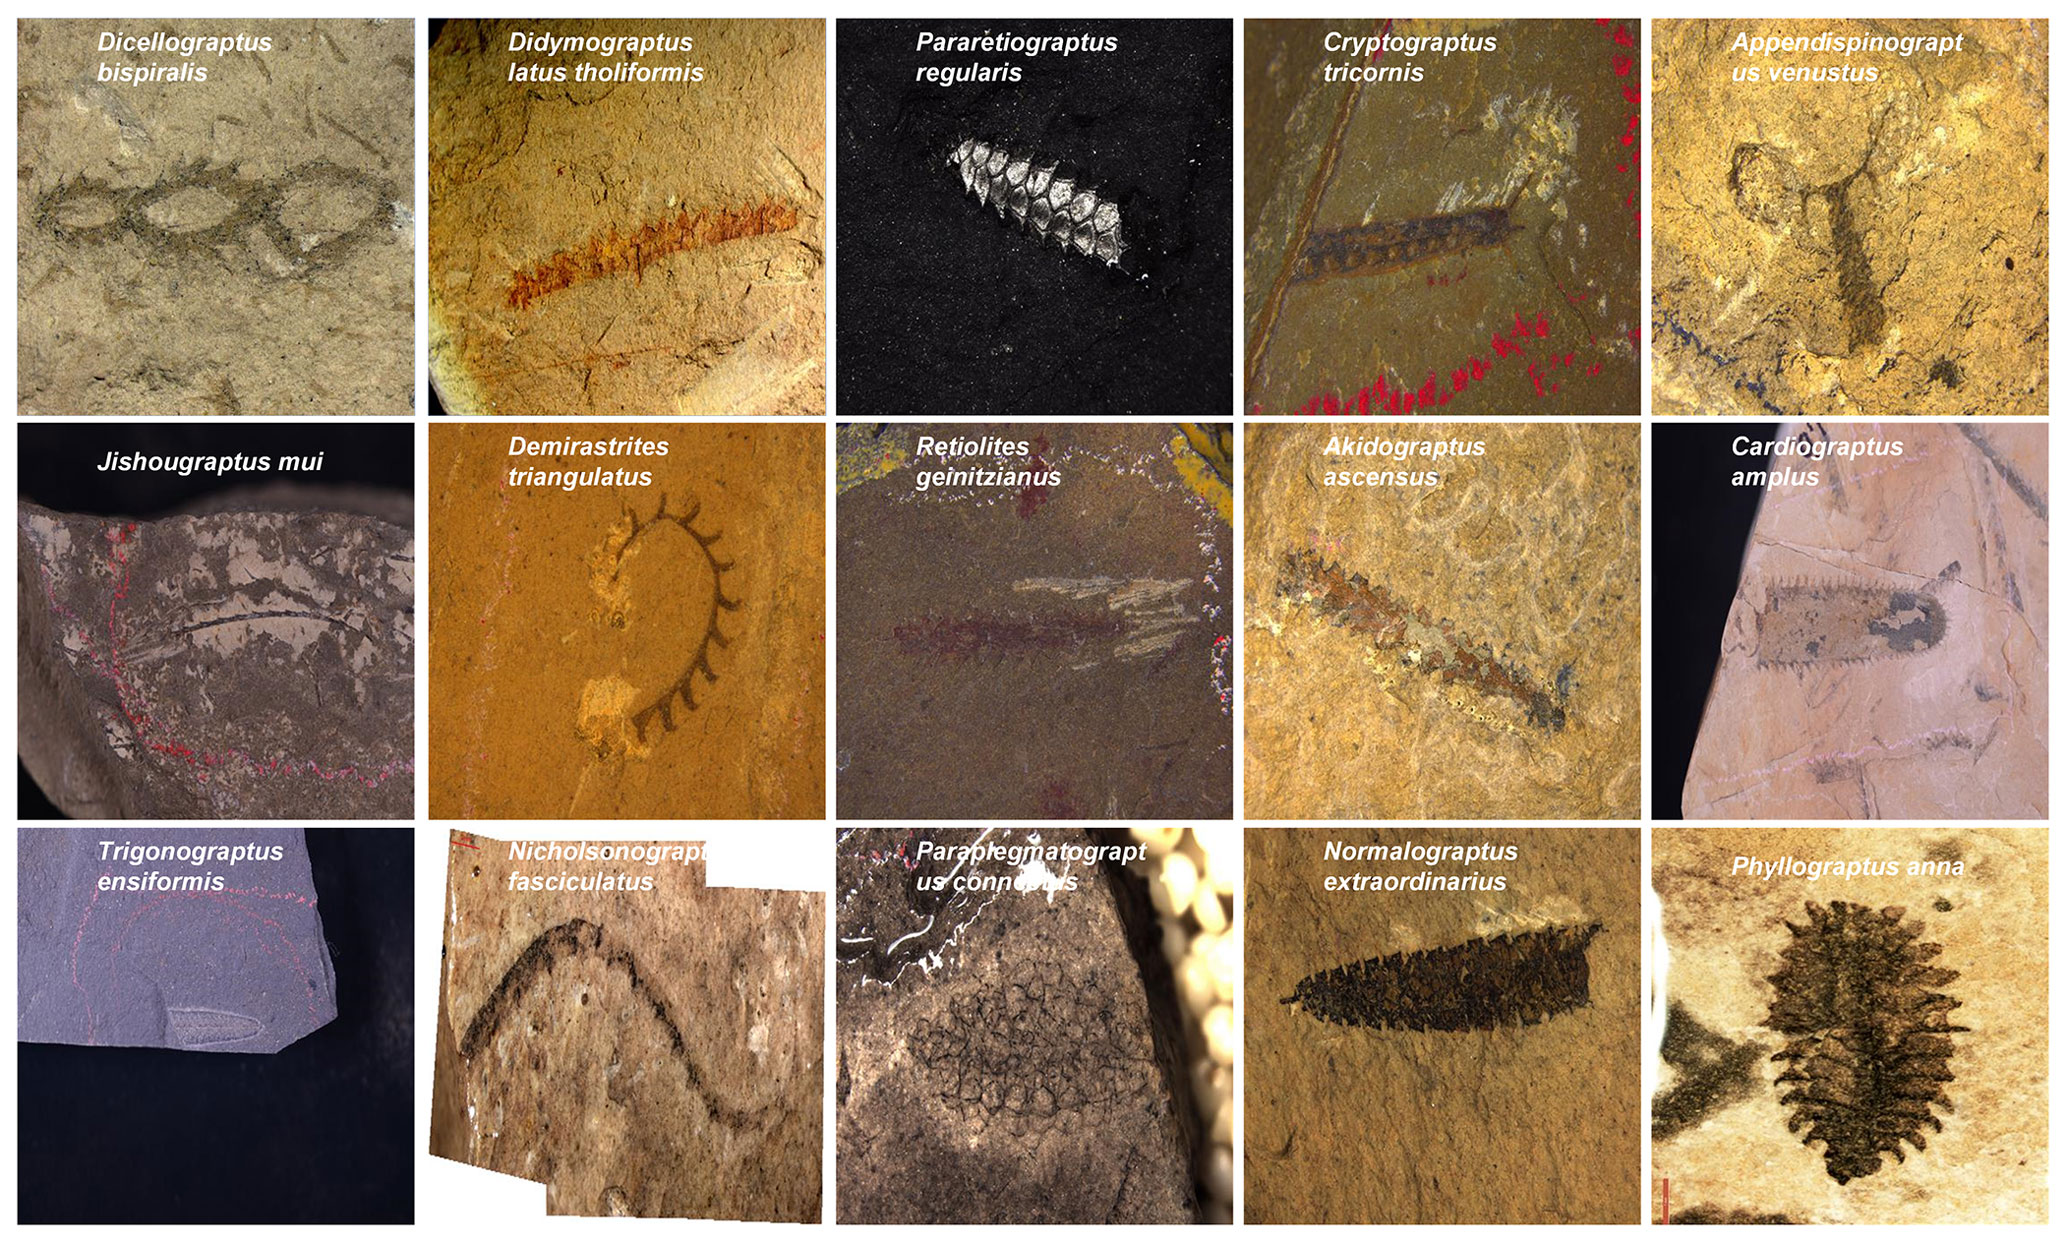
Figure 4Typical images of the graptolite specimens in our dataset. Every image was taken from a unique graptolite specimen. Our dataset only selected the photos that clearly show the morphology of every specimen and diagnostic character of each graptolite species that the specimens represent. The scientific species name of every specimen is given at the top of each image.
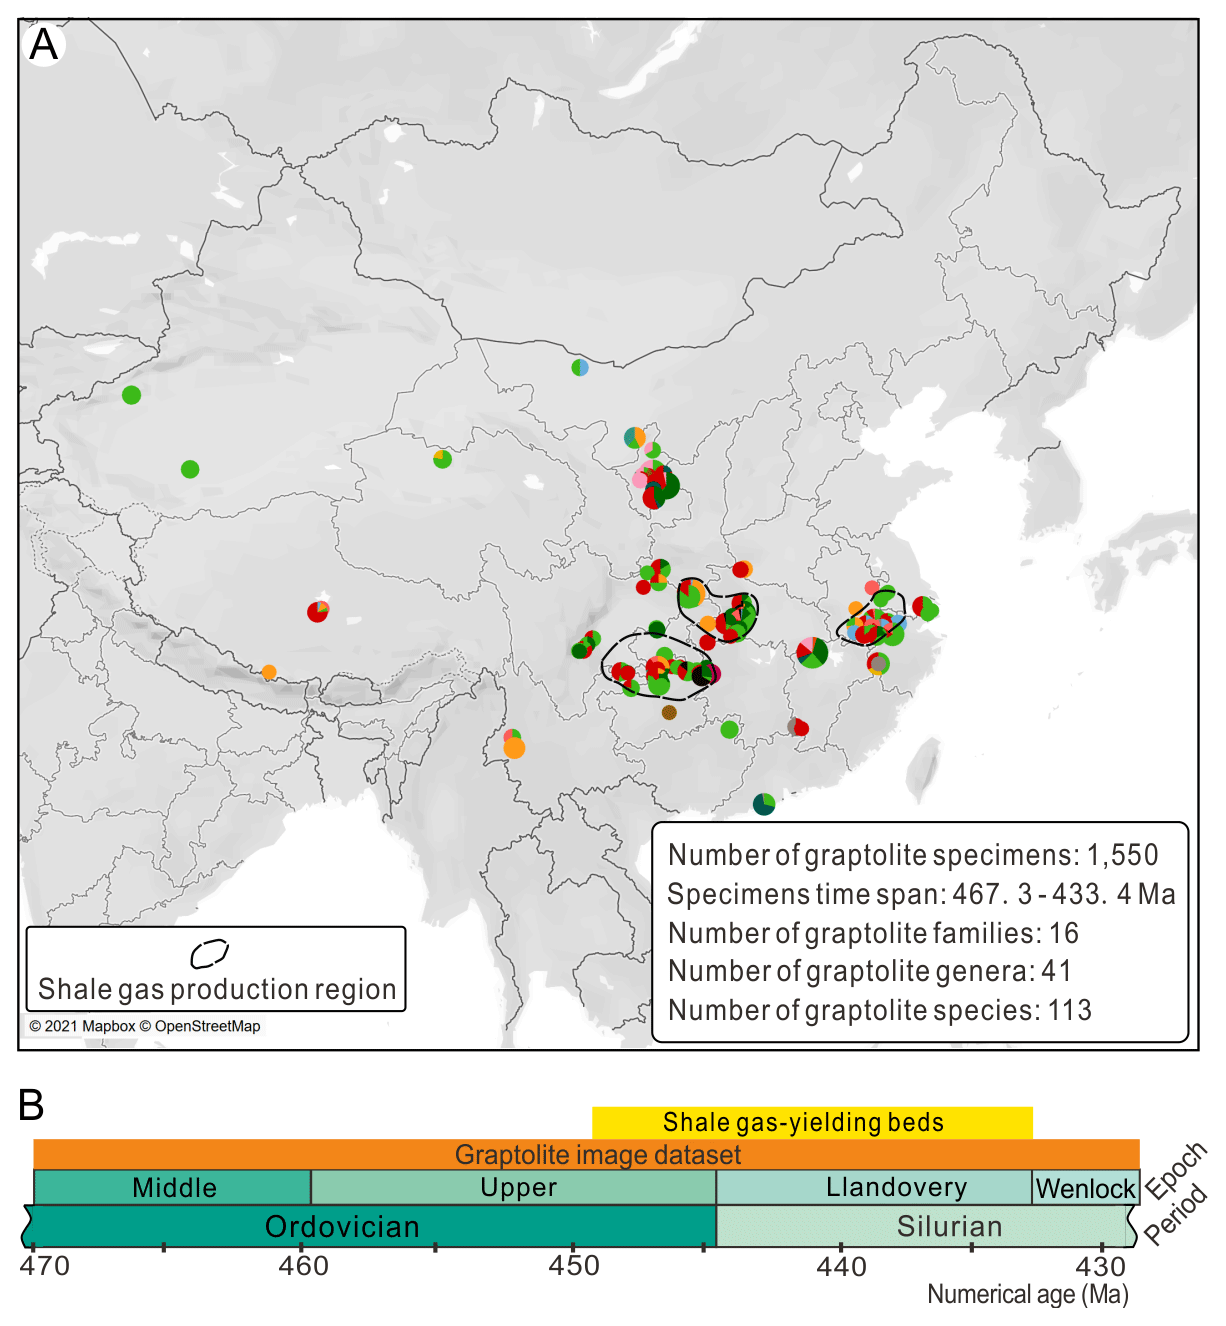
Figure 5Geographic distribution (a) and geologic range (b) of graptolite species of our dataset. Each graptolite specimen locality is represented by a pie chart, where each color is encoded as one graptolite family of the order Graptoloidea. The sector size is proportional to the specimen number for every family. The radius of the pie chart is proportional to the total number of specimens from the same locality. The dashed lines circle the main areas of shale gas production. The map is from © OpenStreetMap contributors (2021) and distributed under the Open Data Commons Open Database License (ODbL) v1.0.
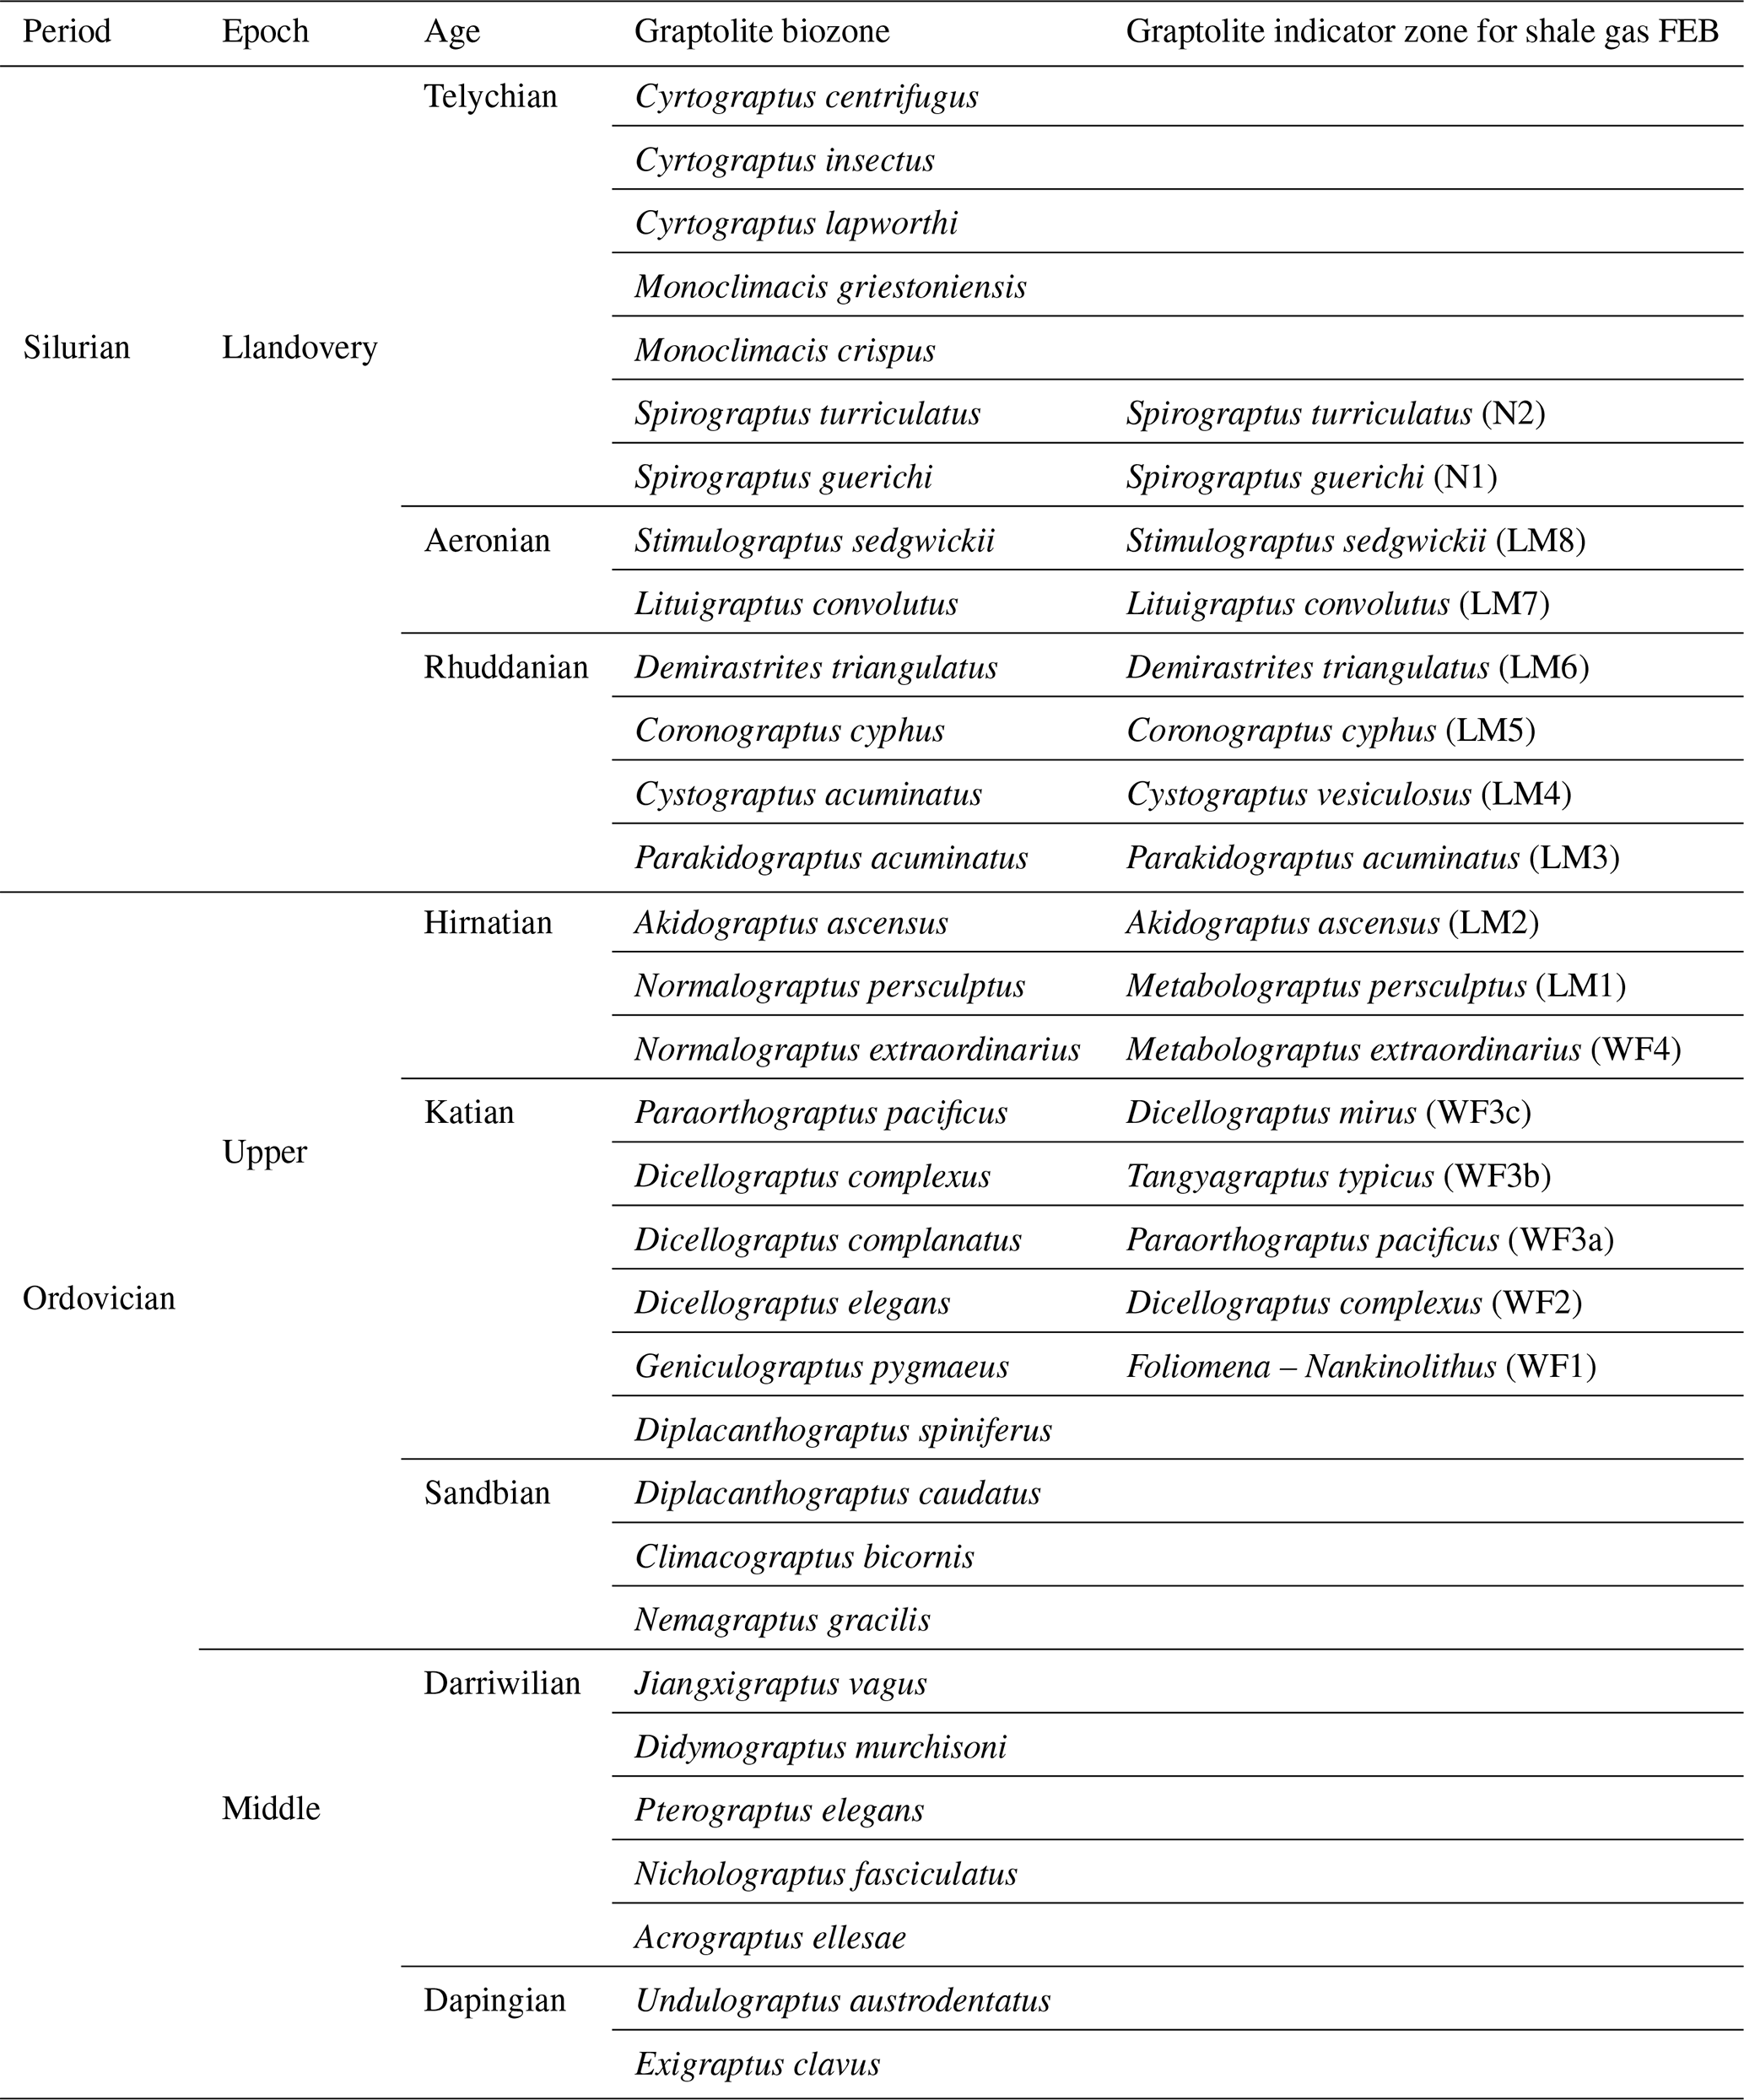
These graptolite species have relatively abundant fossil records and are significant in regional and global biostratigraphic correlations. They are commonly used in geological age determination and shale gas FEB indication, including 32 graptolite biozones from the Darriwilian Stage of the Ordovician Period (467.3 Ma) to the Telychian Stage of the Silurian Period (433.4 Ma) and 16 golden callipers of shale gas FEBs for the case of 20–80 m thick graptolite shale in China (Table 1). These species also include two “golden spike” graptolite species for the two GSSPs in southern China (i.e., bases of the Darriwilian Stage in the Middle Ordovician Series and the Hirnantian Stage in the Upper Ordovician Series; Goldman et al., 2020; Zhang et al., 2020).
Table 1Graptolite species selected as global biozone and indicator zone (right) for shale gas favorable exploration beds (FEBs) of our dataset.
The name of the individual image file is initialled by the specimen's unique number and taxonomical species name. Every specimen was photographed with a scale bar. The scale is attached to an image of the entire rock specimen. The other image is a close-up of the fossil within the colored loop drawn on the whole specimen. Occasionally, in the large images, the scale bar is embedded and beside the fossil specimen. For example, in the file named “9721Cardiograptus_amplus_S.jpg”, the genus name and species name are connected by the underline symbol, thereby avoiding the space symbol. The number “9721” is the specimen number, “Cardiograptus_amplus” means that the species name is Cardiograptus amplus, and “_S” means it is a photo with scale bar. In all scale bars, the minimum unit is 1 mm.
The image files are in JPG format. The single JPG file size ranges from 822 KB to 7.055 MB. The whole volume of the dataset is 10.4 GB. The quality of the specimen images in our dataset is much better than that in any previous publication because most specimens were first studied many years ago, and their illustrations were in black and white, in low-resolution, and/or printed in paper publications only. Most of these specimens were illustrated only once or never clearly photographed. The image collection of our dataset provides a necessary complement for these specimens and, furthermore, unfolds their scientific value to experts or anyone who is interested in paleontology.
Every of specimen is tagged with scientific information, including the genus and species names, nominator, nomination year, specimen number, collection number, locality (province, city, and county), geologic horizon and section, collector name, collecting time, identifier, identifying time, related references, and illustration labels. Specimens can be indexed and located in their detailed housing drawers and cabinets using any of above field elements. Their detailed geologic information can also be obtained from the geological-section-based database, the Geobiodiversity Database (Xu et al., 2020), and forms a key element of fossil specimen metadata (Xu et al., 2022). All related information is collected and recorded in a separate spreadsheet released with our image dataset (Xu, 2022).
Some specimens in our collection have a long research history, since 1958, and their taxonomical status might have changed in light of graptolite systematic studies (Maletz, 2017; Zhang et al., 2020). We invited graptolite paleontologists to curate every specimen to make sure that the scientific information is updated and widely accepted. The spreadsheet includes the following fields: species ID, phylum, class, order, suborder, infra-order, family, subfamily, genus, revised species name, tagged species name, total number of specimens, specimen serial number, image file name, microscope photo number, SLR photo number, stage, age from, age to, mean age value, locality, longitude, latitude, horizon, and first published reference. It is noted that the revised species name of every specimen reflects the emendation and correction study in Ma (2020), with comments from graptolite experts Zhang Yuandong and Chen Qing (NIGP, CAS), which may differ from formal synonyms and might need further study or peer-reviewing. One can always search for specimens according to the tagged species names and examine specimens through our dataset, which, with the image collection and comprehensive information of a large batch of fossil specimens, supports the virtual examination of specimens in a convenient and low-cost way. Experts or laypeople can look through, examine, and even measure fossil specimens without the need for regional/international travel and formalities. This greatly benefits paleontology in research, teaching, and science communication (Rahman et al., 2012).
We have developed an interactive web exploration tool, FSIDvis (Fossil Specimen Image Dataset Visualizer), to assist users in better examining the scientific contents of our data (Fig. 6).
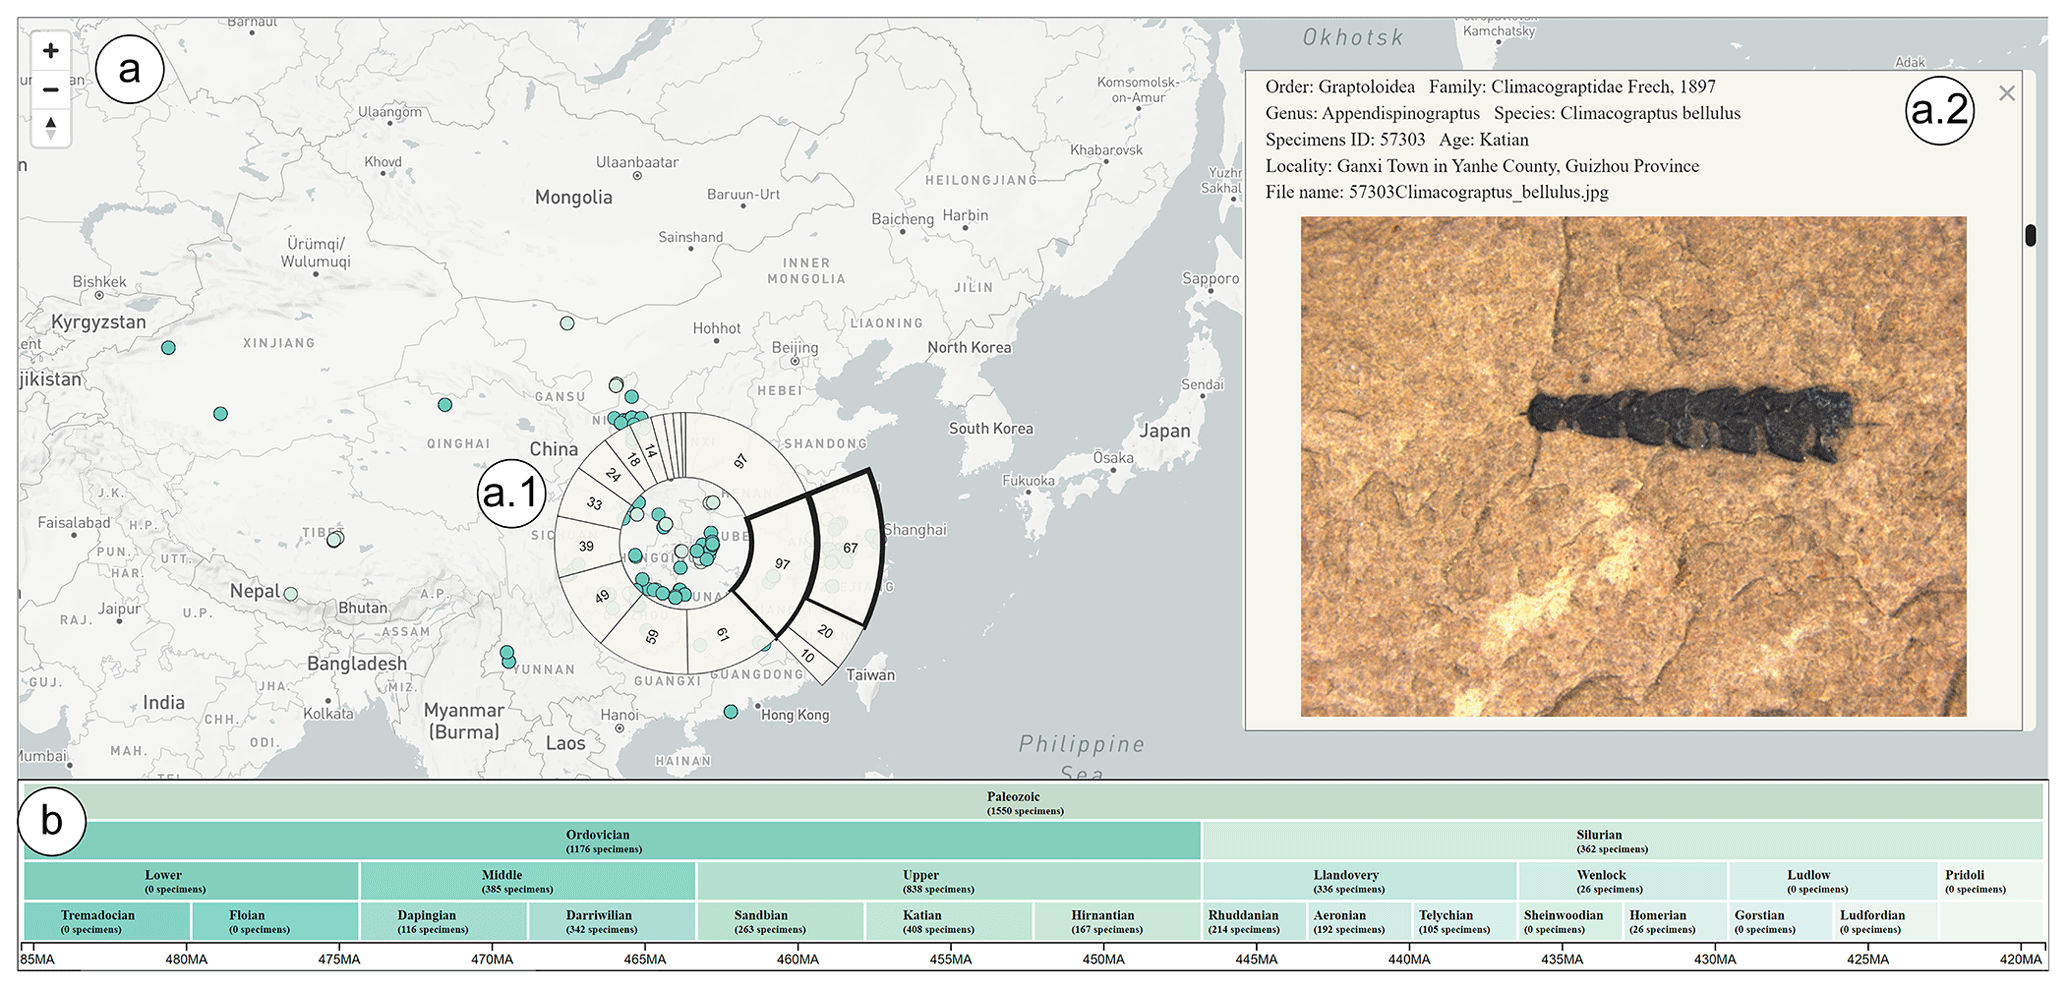
Figure 6The FSIDvis (Fossil Specimen Image Dataset Visualizer) system interface. (a) Fossil with a geographic distribution view, showing the fossil specimen location on the map. The lens (a.1) is a tailor-designed specimen picker that allows users to collect fossils of interest in a region, where the inner ring and outer ring represent the family and genus. When the user chooses a genus, then the corresponding detailed species with images will be listed in the fossil list view (a.2), with detailed information and a further high-resolution image if the specimens are given. Users can hit the space bar to lock the selection. (b) Geological-age-scale view, providing the geologic age selection ability; the top one is the chronostratigraphic age scale, and the bottom one is an age slider that allows the user to choose a specific age slot interactively. The map is from © OpenStreetMap contributors (2021) and distributed under the Open Data Commons Open Database License (ODbL) v1.0.
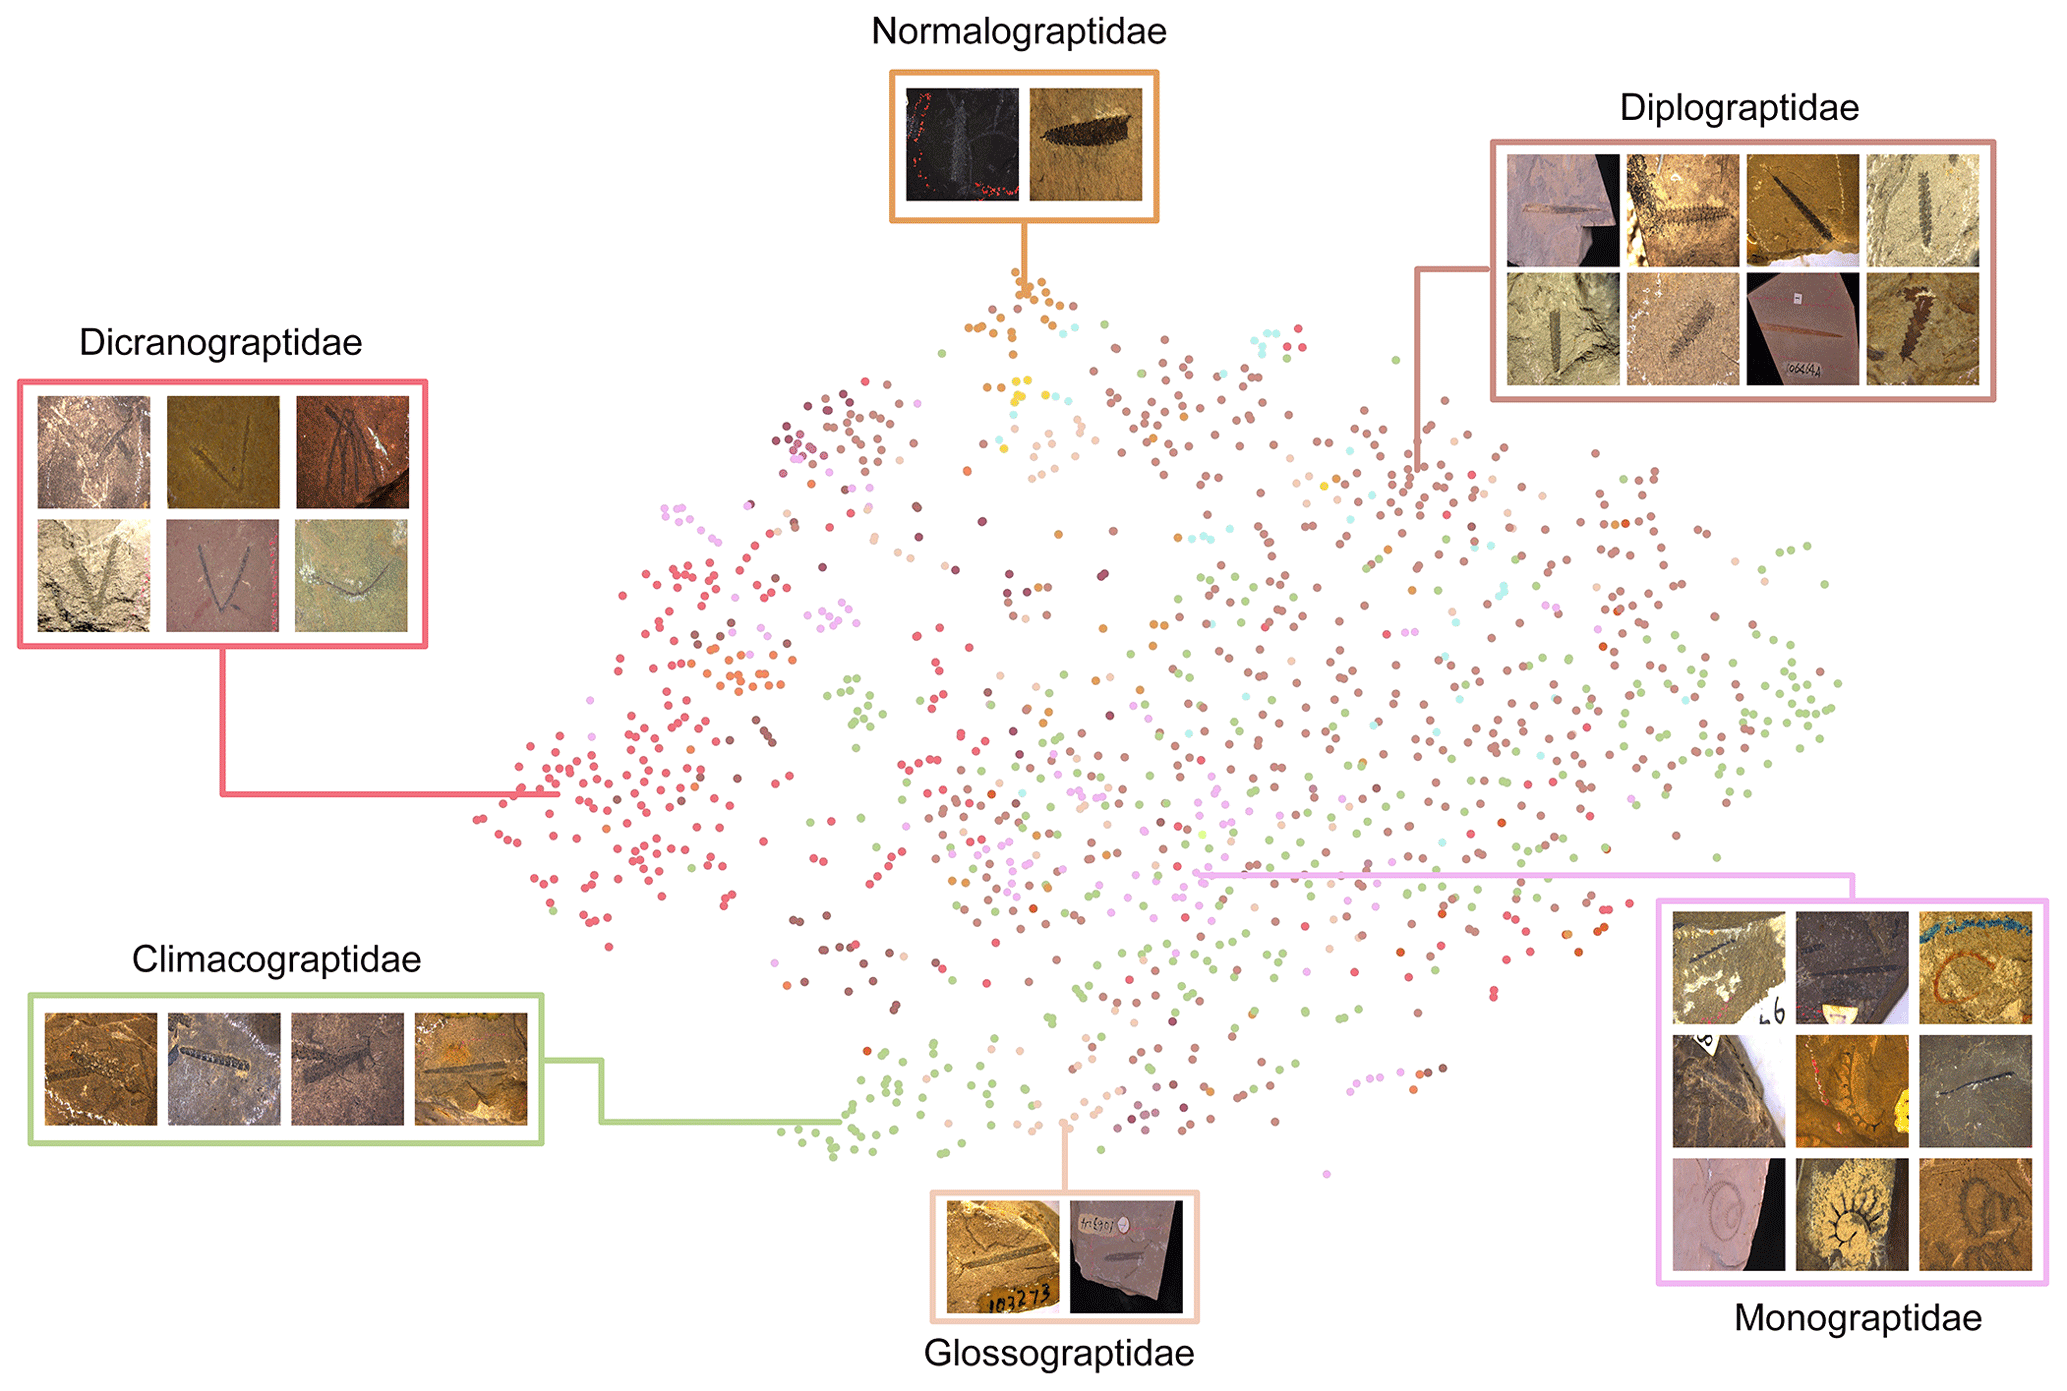
Figure 7t-SNE visualization of our graptolite specimen images. Individual specimens are denoted by different colors and grouped in the visualization. These groups also taxonomically match different graptolite families (blocks with several small images).
We further explore the distribution of these graptolite images and visualize the t-SNE (t-distributed stochastic neighbor embedding) feature embedded in our graptolite dataset (Fig. 7), using different colors to denote different families. In detail, for each annotated image, we first resized it into 448 × 448 pixels and then fed it into the trained convolutional neural network (CNN) model. The output feature map from the last average pooling layer is flattened and projected to a 113-dimensional (number of species), fully connected layer to represent an image embedding. After that, we use t-SNE, a nonlinear dimension reduction technique for high-dimensional data, to project the embedded information in the image into the two-dimensional space for visualization. Finally, we indicate the image data distribution with a scatterplot; we use 15 colors to represent 15 families of the order Graptoloidea, covering 42 genera and 113 species. The distribution of the images in this figure is based on species, showing the potential of the automatic classification of graptolite species using CNN (Niu and Xu, 2022).
The dataset is archived and publicly available from https://doi.org/10.5281/zenodo.6688670 (Xu, 2022). The visualization tool FSIDvis is available at http://fsidvis.fossil-ontology.com:8089/ (Xu et al., 2021).
A multi-dimensional, integrated dataset based on 1550 pieces of graptolite specimens is released. It contains 2951 high-resolution images and a spreadsheet showing structured records of every specimen's scientific information. During the preparation of the dataset, 113 Ordovician to Silurian graptolite species or subspecies were selected for their significances in stratigraphic correlation and shale gas exploration, and all specimens were carefully photographed and taxonomically curated.
Our dataset provides experts or laypeople with a mean of virtual examination of a batch of fossil specimens in a convenient and low-cost way. It potentially contributes to global biostratigraphic correlation, especially with those biozone graptolite species, and in the shale gas industry to the improvement of exploration efficiency. A fossil specimen database needs to fulfill the purpose and requirements of virtual examination of specimens. This greatly benefits paleontologic research and science communication. The whole dataset is visualized by the tool FSIDvis (Fossil Specimen Image Data Visualizer) and a nonlinear dimension reduction technique, t-SNE.
Conceptualization: HHX and ZBN; data curation: XM, HHX, XJT, and YTS; formal analysis: ZBN and HHX; funding acquisition: HHX; investigation: YSC, XJT, YTS, XYD, DNF, SSS, YYZ, NY, and QX; methodology: ZBN and HHX; project administration: HHX; resources: HHX, YSC and XM; software: ZBN and YSC; supervision: HHX; validation: HHX; visualization: HHX; writing – original draft preparation: HHX and ZBN; writing – review and editing: HHX.
The contact author has declared that none of the authors has any competing interests.
Publisher's note: Copernicus Publications remains neutral with regard to jurisdictional claims in published maps and institutional affiliations.
The authors thank the following individuals: Zhang Yuandong and Chen Qing (NIGP, CAS) for careful curating and examining of graptolite specimens, Peter M. Sadler (University of California, USA) for commenting on and improving the paper, Pan Zhaohui (Institute of Vertebrate Paleontology and Paleoanthropology, CAS), and Pan Yaohua and Wu Junqi (College of Intelligence and Computing, Tianjin University) for the constructive suggestions and help.
This research has been supported by National Key R&D Program of China (grant no. 2022YFF0800200), Special Project on Network and Informatization of the Chinese Academy of Sciences (grant no. CAS-WX2021SF-0205), and National Natural Science Foundation of China (grant no. 61802278). This work is a contribution to the Deep-time Digital Earth (DDE) Big Science Program.
This paper was edited by Kirsten Elger and reviewed by Peter Sadler and one anonymous referee.
Chen, X., Zhang, Y.-D., Li, Y., Fan, J.-X, Tang, P., Chen, Q., and Zhang, Y.-Y.: Biostratigraphic correlation of the Ordovician black shales in Tarim Basin and its peripheral regions, Sci. China Earth Sci., 55, 1230–1237, https://doi.org/10.1007/s11430-012-4448-6, 2012.
Chen, X., Chen, Q., Zhen, Y.-Y., Wang, H., Zhang, L., Zhang, J., Wang, W.-H., and Xiao, Z.-H.: Circumjacent distribution pattern of the Lungmachian graptolitic black shale (early Silurian) on the Yichang Uplift and its peripheral region, Sci. China Earth Sci., 61, 1195–1203, https://doi.org/10.1007/s11430-017-9222-x, 2018.
Goldman, D., Sadler, P. M., and Leslie, S. A.: The Ordovician Period, in: Geologic Time Scale 2020, Elsevier, 631–694, https://doi.org/10.1016/B978-0-12-824360-2.00020-6, 2020.
Klemme, H. D. and Ulmishek, G. F.: Effective petroleum source rocks of the world: stratigraphic distribution and controlling depositional factors, AAPG Bull., 75, 1809–1851, 1991.
Ma, X.: Palaeontology, biostratigraphy and palaeoecology of the graptolite from the Hulo Formation (Darriwilian – Sandbian) in northwestern Zhejiang Province, East China, PhD dissertation, Zenodo, https://doi.org/10.5281/zenodo.7827023, 2020.
Maletz, J.: Part V, Second Revision, Chapter 13: The history of graptolite classification, Treatise Online, 88, 1–11, https://doi.org/10.17161/to.v0i0.6544, 2017.
Niu, Z.-B. and Xu, H.-H.: AI-based graptolite identification improve shale gas exploration, bioRxiv [preprint], https://doi.org/10.1101/2022.01.17.476477, 2022.
Peters, S. E. and McClennen, M.: The Paleobiology Database application programming interface, Paleobiology, 42, 1–7, 2016.
Podhalańska, T.: Graptolites–stratigraphic tool in the exploration of zones prospective for the occurrence of unconventional hydrocarbon deposits, Przegląd Geologiczny, 61, 621–629, 2013.
Rahman, I. A., Adcock, K., and Garwood, R. J.: Virtual fossils: a new resource for science communication in paleontology, Evolution: Education and Outreach, 5, 635–641, 2012.
Shute, C. H. and Foster, T. S.: Curation in museum collections, in: Fossil plants and spores: modern techniques, edited by: Jones, T. P. and Rowe, N. P., Geological Society of London, 184–186, ISBN 186239048, 1999.
Xu, H.-H.: High-resolution images of 1550 Ordovician to Silurian graptolite specimens for global correlation and shale gas exploration, Zenodo [data set], https://doi.org/10.5281/zenodo.6688670, 2022.
Xu, H.-H., Niu, Z.-B., and Chen, Y.-S.: A status report on a section-based stratigraphic and palaeontological database – the Geobiodiversity Database, Earth Syst. Sci. Data, 12, 3443–3452, https://doi.org/10.5194/essd-12-3443-2020, 2020.
Xu, H.-H., Niu, Z.-B., and Chen, Y.-S.: Software: Fossil specimen image dataset visualizer system (FSTDvis, v1.0), National Copyright Administration of the People’s Republic of China, Registration number: 2021SR2201857, http://fsidvis.fossil-ontology.com:8089/ (last access: 5 November 2022), 2021.
Xu, H.-H., Nie, T., Guo, W., Chen, Y.-S., and Yuan, W.-W.: Palaeontological fossil specimen metadata standard, Acta Palaeotologica Sinica, 61, 280–290, https://doi.org/10.19800/j.cnki.aps.2022007, 2022.
Zhang, Y. D., Zhan, R. B., Wang, Z. H., Yuan, W., Fang, X., Liang, Y., Yan, K., Wang, Y.-J., Liang, K., Zhang, J.-P., Chen, T.-E., Zhou, Z.-Q., Chen, Q., Jeon, J., Ma, X., Li, W.-J., Wu, X.-J., and Wei, X.: Illustrations of index fossils from the Ordovician strata in China, Zhejiang University Press, 1–575, ISBN 9787308198400, 2020.
Zou, C. N., Dong, D., Wang, Y., Li, J.-X., Huang, J.-L. Wang, S.-F., Guan, Q.-Z., Zhang, C., and Wang, H.-Y.: Shale gas in China: Characteristics, challenges and prospects (I), Petrol. Explor. Dev., 42, 689–701, https://doi.org/10.11698/PED.2015.06.01, 2015.
Zou, C. N., Gong, J., Wang, H. Y., and Shi, Z.-S.: Importance of graptolite evolution and biostratigraphic calibration on shale gas exploration, China Petroleum Exploration, 24, 1–6, https://doi.org/10.3969/j.issn.1672-7703.2019.01.001, 2019.