the Creative Commons Attribution 4.0 License.
the Creative Commons Attribution 4.0 License.
 | 12 Jan 2023
A database of marine macronutrient, temperature and salinity measurements made around the highly productive island of South Georgia, the Scotia Sea and the Antarctic Peninsula between 1980 and 2009
Michael J. Whitehouse
Katharine R. Hendry
Geraint A. Tarling
Sally E. Thorpe
We present a database from substantial collections of macronutrient data made on 20 oceanographic cruises, primarily from around the island of South Georgia and the Scotia Sea. This sector of the Southern Ocean was studied comprehensively during the Discovery Investigations between ∼1920 and 1950 and resulted in the hugely influential Discovery Reports. Following this pioneering research period, there was a lull of several decades prior to the British Antarctic Survey (BAS) initiation of an offshore biological programme to study the ecology of the South Atlantic sector of the Southern Ocean. These studies began in the late 1970s and have continued until the present day. Between 1980 and 2009, the programme included macronutrient measurements as part of an integrated ecosystem analysis. In addition to South Georgia and the Scotia Sea, measurements were also made in the Bellingshausen Sea and the waters to the west of the Antarctic Peninsula. Data were collected during all months of the year with the exceptions of May and June and compiled into a database. Vertical profile samples were taken from water bottles, while data along transects were collected by monitoring the ship's non-toxic seawater supply. Nutrients measured were silicate (Si(OH)4–Si), phosphate (PO4–P), nitrate (NO3–N), ammonium (NH4–N), and nitrite (NO2–N). Our database includes nutrient data along with contemporaneous temperature and salinity data where available. Further background and supporting information is included for context. The profile and underway sample data have been deposited at the UK Polar Data Centre and are publicly available in NetCDF and CSV formats from https://doi.org/10.5285/4014370F-8EB2-492B-A5F3-6DC68BF12C1E (Whitehouse et al., 2022).
- Article
(4986 KB) - Full-text XML
- BibTeX
- EndNote


1.1 Geography and physical oceanography
The island of South Georgia lies on the Scotia Ridge, a submarine arc in the south-western Atlantic sector of the Southern Ocean that extends eastwards from South America to the South Sandwich Islands, returning westwards to the Antarctic Peninsula. The arc forms the northern, eastern and southern boundaries of the Scotia Sea, with the Drake Passage forming the western boundary.
South Georgia and its broad continental shelf lie within the Antarctic Zone (AAZ) of the predominantly eastward-flowing Antarctic Circumpolar Current (ACC). The AAZ is bounded by the Polar Front (PF) to the north and the Southern Antarctic Circumpolar Current Front (SACCF) to the south (see Fig. 1; Nowlin and Klinck, 1986; Orsi et al., 1995). In the Scotia Sea, the ACC is deflected north-eastward by the local bathymetry. The SACCF approaches South Georgia from the south-west and is inflected around the eastern and northern continental shelves of the island before retroflecting eastwards at the Northwest Georgia Rise (Orsi et al., 1995; Thorpe et al., 2002; Meredith et al., 2003; Boehme et al., 2008). The oceanic circulation at South Georgia has been studied with Eulerian and Lagrangian observations and modelled at increasingly higher resolutions. These studies demonstrate a north-westward flow along the island's northern shelf edge, cross-shelf exchange and areas of retention on the island's continental shelf (Hardy and Gunther, 1935; Maslennikov, 1979; Priddle et al., 1986; Latogursky et al., 1990; Trathan et al., 1997; Brandon et al., 1999, 2000; Young et al., 2014). Recent fine-scale ocean models not only reconstruct the larger-scale circulation features, but also resolve eddy-scale processes and suggest the existence of coastal upwelling jet structures that have yet to be physically observed (Young et al., 2011, 2014; Matano et al., 2020).
The long-term mean positions of the ACC fronts mask the degree of large-scale and mesoscale variability. Meandering and eddy shedding have been described for ACC fronts (e.g. Lutjeharms and Baker, 1980; Bryden, 1983). In areas of irregular bottom topography such as the north-eastern Scotia Sea, the fronts are particularly variable (e.g. Gordon et al., 1977; Peterson and Whitworth, 1989; Boehme et al., 2008). The positions of fronts and eddies influence the waters and plankton communities around South Georgia. There is some evidence, for example, that eddies from north of the PF input warmer water to the island and introduce physical structure to the water column that facilitates the resupply of nutrients from deeper to surface waters (Atkinson et al., 1990; Whitehouse et al., 1996b).
1.2 Research history
South Georgia has been commercially exploited for centuries, from the sealing of the late 1700s (Bonner, 1984; Headland, 1984) to the whaling industry in the early 20th century (Harmer, 1931; Kemp and Bennett, 1932) and the current krill fishery in the Southern Ocean (Everson and Goss, 1991; Trathan et al., 1998).
The Discovery Investigations were initiated in the 1920s to provide an ecosystem approach to managing whaling. Multi-ship surveys were undertaken to understand the causes of the region's high primary productivity and how it supported the fisheries. The resulting Discovery Reports covered many topics from oceanography to whales, and the report on the plankton by Hardy and Gunther (1935) linked the environment and higher trophic levels using some very modern concepts. For example, they suspected that micronutrients controlled phytoplankton productivity. Later Discovery Investigations broadened their coverage to include South Georgia as part of the Scotia Sea–Antarctic Circumpolar Current system (e.g. Foxton, 1956; Marr, 1962; Mackintosh, 1973).
The Discovery Investigations laid the foundations for our understanding of phytoplankton growth and nutrient use at South Georgia. Hardy and Gunther (1935) and Hardy (1967) correlated locally reduced phosphate concentrations with elevated phytoplankton biomass, suggesting that phosphate depletion provided a time-integrated “memory” of primary production. Clowes (1938) showed summer silicate and phosphate reductions and possible year-to-year variation in phytoplankton utilisation and suggested that silicate concentrations may, in some years, limit phytoplankton growth. A wider-scale context was provided by Hart (1934, 1942), who noted the general failure of Antarctic marine phytoplankton to deplete fully the abundant pools of macronutrients in the surface waters, now known as the high-nutrient–low-chlorophyll paradox (HNLC).
Between 1940 and 1970, much less scientific work was undertaken in the vicinity of South Georgia. However, from the late 1970s to the present day, attention has been renewed, with work being undertaken by the British Antarctic Survey (BAS). Altogether, offshore ecological studies have been conducted sporadically in the South Georgia marine environment and in the Scotia Sea for about a century.
1.3 Phytoplankton productivity and nutrient controls
The AAZ's open ocean is generally considered to be a zone of low productivity. However, the South Georgia region is characterised by high biomass and productivity of phytoplankton, zooplankton and vertebrate predators. Although the AAZ is characterised by HNLC conditions (maximum chlorophyll a ∼1 mg m−3), parts of the Scotia Sea may be more productive (but still usually with <2.5 mg chlorophyll a m−3, Rönner et al., 1983; Jacques, 1989; Tréguer and Jacques, 1992; Korb et al., 2005). However, during a series of cruises across the Scotia Sea, concentrations of chlorophyll a >3 mg m−3 were found at ∼58∘ S in spring (Korb et al., 2012). Phytoplankton blooms with >0.75 mg m−3 chlorophyll a persisted for >6 months during the 2006/2007 season in this mid-Scotia Sea zone. Similarly, a large-scale bloom investigated during the 2011/2012 season downstream of South Georgia revealed chlorophyll-a concentrations of >3 mg m−3, peaking in December, with the bloom persisting (chlorophyll a >0.5 mg m−3) until mid-March. Furthermore, in comparison to those in the open ocean, the South Georgia bloom was characterised by higher chlorophyll-a-specific carbon fixation, indicative of high photosynthetic efficiency (Hoppe et al., 2017).
With decades of both field observations and remotely sensed ocean colour data available to investigate spatial and temporal variability, there is clear evidence that phytoplankton blooms are more frequent and more intense downstream of South Georgia and into the Georgia Basin relative to upstream (e.g. Borrione and Schlitzer, 2013). High phytoplankton concentrations (>20 mg chlorophyll a m−3) may be linked to enhanced supplies of iron (up to 4 nmol m−3, de Baar et al., 1995; Whitehouse et al., 2000; Korb et al., 2004; Nielsdóttir et al., 2012; Schlosser et al., 2018) or reduced forms of nitrogen (up to 3 mmol ammonium m−3, Owens et al., 1991; Priddle et al., 1997; Whitehouse et al., 1999). Although macronutrients are generally non-limiting in the AAZ, silicate concentrations (<1 mmol m−3) limit growth at South Georgia in some summers (Whitehouse et al., 1996a, 2008a). During trans-Scotia Sea cruises from ∼61 to 50∘ S, substantial latitudinal gradients were found for silicate, nitrate and phosphate (Whitehouse et al., 2012). Surface ammonium concentrations were substantially higher to the north of the North Scotia Ridge, although a peak in values was measured around the southern boundary of the ACC, coincident with increased mid-Scotia Sea chlorophyll-a concentrations. These transects crossed multiple oceanographic features that may each contribute to increased productivity and nutrient depletion. However, silicate was the only macronutrient to be found at limiting concentrations, and only north of 56∘ S (Whitehouse et al., 2012).
Observations, together with coupled hydrodynamic and biogeochemical models, support a strong supply of iron downstream of South Georgia sourced from shallow shelf sediments (<20 m water depth), glacial meltwaters and particulates, upwelling deep waters transported by the ACC and topographic steering, and a lesser contribution from dust (Nielsdóttir et al., 2012; Borrione et al., 2014; Hoppe et al., 2017; Schlosser et al., 2018; Matano et al., 2020). The alleviation of iron limitation not only drives the phytoplankton bloom initiation, but also has the potential to shift the uptake ratio of macronutrients, impacting regional stoichiometry (Borrione et al., 2014; Hoppe et al., 2017). However, the lateral advection of iron alone cannot explain the variability in duration of downstream blooms near South Georgia (Robinson et al., 2016). Mixed-layer depths and phytoplankton–zooplankton interactions will also influence nutrient stoichiometry; grazing pressure plays an important role in bloom dynamics and rapid, shallow nutrient cycling effectively traps nutrients in the surface mixed layers of the downstream waters (Robinson et al., 2016; Schlosser et al., 2018; Cavan et al., 2019).
Although there is intensive recycling in the surface mixed layer, the high summer primary productivity to the north of South Georgia is reflected in organic carbon export and inorganic carbon uptake. For example, in austral summer 2012, the fluxes of particulate organic carbon (POC) collected in sediment traps downstream and upstream of South Georgia (1500–2000 m water depth) were 46–904 and 38–205 respectively (Rembauville et al., 2016). That study also found downstream export to have a relatively low Si:C ratio due to a lower proportion of empty diatom frustules, with over 40 % of the sinking POC associated with diatom resting spores. The extensive summer blooms around South Georgia also deplete dissolved inorganic carbon (DIC), acting as a strong sink for atmospheric CO2, although this is countered in the winter due to strong mixing (Jones et al., 2012).
Despite some retention over the continental shelf of South Georgia, the high productivity of phytoplankton is widespread, extending into deep waters to the north of the island and to the PF (>8 mg chlorophyll a m−3, Fryxell et al., 1979; El-Sayed and Weber, 1982; Whitehouse et al., 1996b, 2000; Korb et al., 2004, 2008; Korb and Whitehouse, 2004; Hoppe et al., 2017). Such high productivity can also be sustained for thousands of kilometres downstream (Korb et al., 2004), in part due to the supply of nutrients by meandering mesoscale structures that form during interactions between the oceanic fronts and topographic features (Smith et al., 2010; Jones et al., 2017). Indeed, the large spatial extent and long growth season (Korb et al., 2004; Hoppe et al., 2017) mean that the South Georgia blooms are associated with the strongest predicted carbon sink in the Southern Ocean (Schlitzer, 2002).
In this paper we present a multi-year nutrient dataset along with concurrent temperature and salinity measurements. We detail methods, consider preliminary data evaluation, and summarise previous data management and utilisation. In addition to data availability, we consider their potential use and also catalogue supporting cruise report information.
The present macronutrient database has been collated from direct measurements made by BAS scientists (principally MJW) as part of sampling campaigns conducted from scientific research vessels to the respective regions of the Southern Ocean. Samples were collected via two principal collection methods: CTD (conductivity, temperature, depth) rosette water bottles or, additionally on the RRS James Clark Ross, the ship's non-toxic seawater supply while underway. Initial measurements were made at sea and concentrations calculated post-cruise. These data were initially published in a number of different sources which have been compiled as part of the present exercise (see Whitehouse et al., 2022). Furthermore, we have carried out additional quality control of these measurements and added supplementary data fields to the database that we are now making accessible externally (Whitehouse et al., 2022).
2.1 Sampling sites
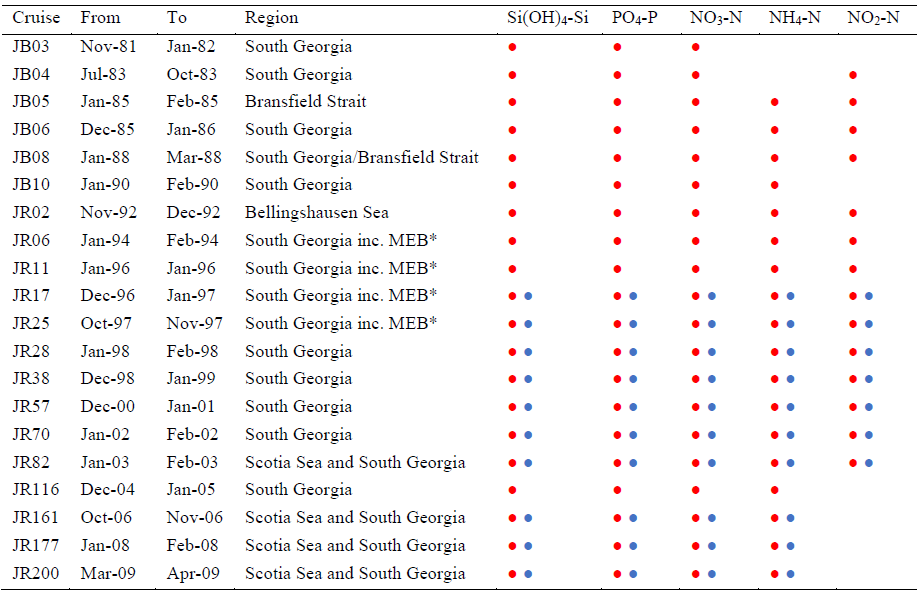
The current dataset was collected between 1980 and 2009 (Table 1).
Table 1Cruise, duration, region and nutrients measured at CTD stations (![]() )
and during transects (
)
and during transects (![]() ). * MEB: Maurice Ewing Bank transect between
48∘ S, 44∘ W and 54∘ S, 39∘ W.
Concurrent temperature and salinity values are presented for all CTD
profiles and for cruises JR161, JR177 and JR200 transect measurements.
). * MEB: Maurice Ewing Bank transect between
48∘ S, 44∘ W and 54∘ S, 39∘ W.
Concurrent temperature and salinity values are presented for all CTD
profiles and for cruises JR161, JR177 and JR200 transect measurements.
Measurements were made predominantly around the island of South Georgia and across the wider Scotia Sea, with additional sampling to the west of the Antarctic Peninsula and in the Bellingshausen Sea (Fig. 1a and b).
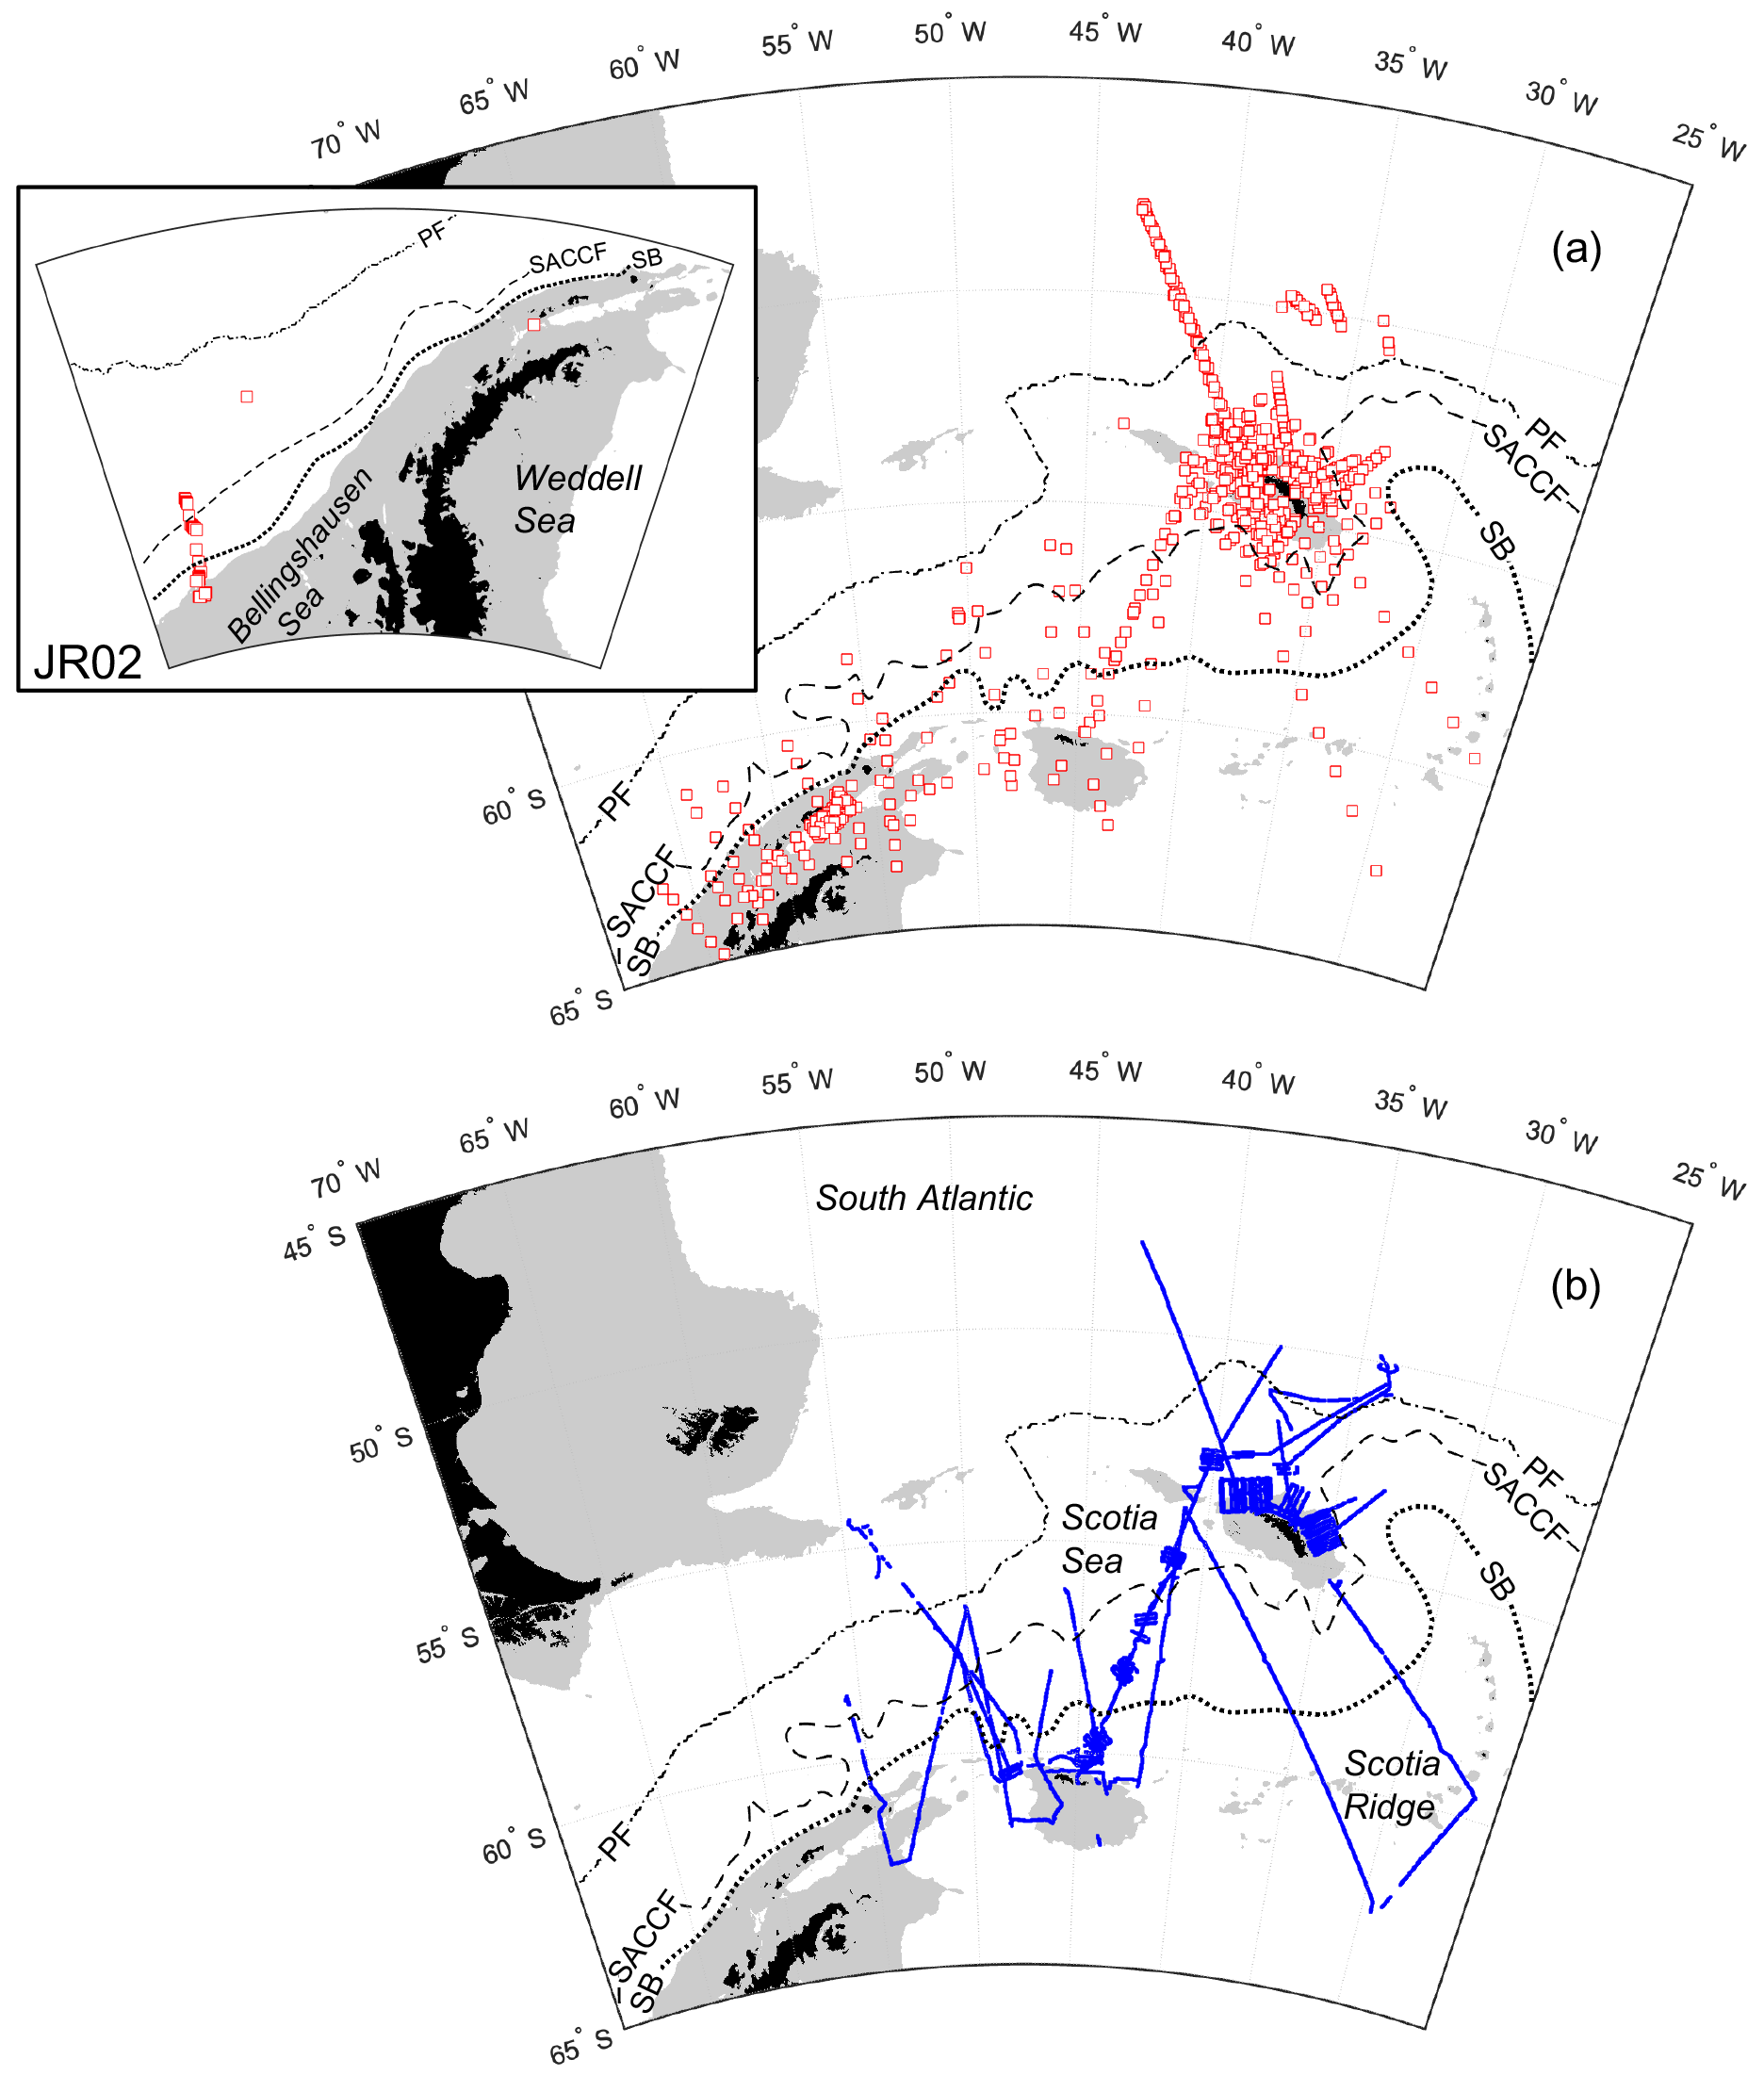
Figure 1Sample locations of (a) CTD vertical profiles with inset to show stations sampled in the Bellingshausen Sea during cruise JR02; (b) transect data points. Southern Ocean fronts are shown in each panel: PF, Polar Front; SACCF, Southern Antarctic Circumpolar Current Front; SB, southern boundary of the Antarctic Circumpolar Current (Orsi et al., 1995; Moore et al., 1999; Thorpe et al., 2002; Orsi and Harris, 2019). Pale grey areas show water depths <1000 m (Amante and Eakins, 2009; NOAA National Geophysical Data Center, 2009). Coastline following GSHHG, version 2.3.7 (Wessel and Smith, 2022).
During nearly 30 years of sampling, some sites were repeatedly visited. Two monitoring areas termed the Eastern Core Box (ECB) and the Western Core Box (WCB) to the north of South Georgia have been studied intensively with a set of repeat transects oriented across the north-eastern and north-western shelf breaks to sample on- and off-shelf waters (Fig. 2a).
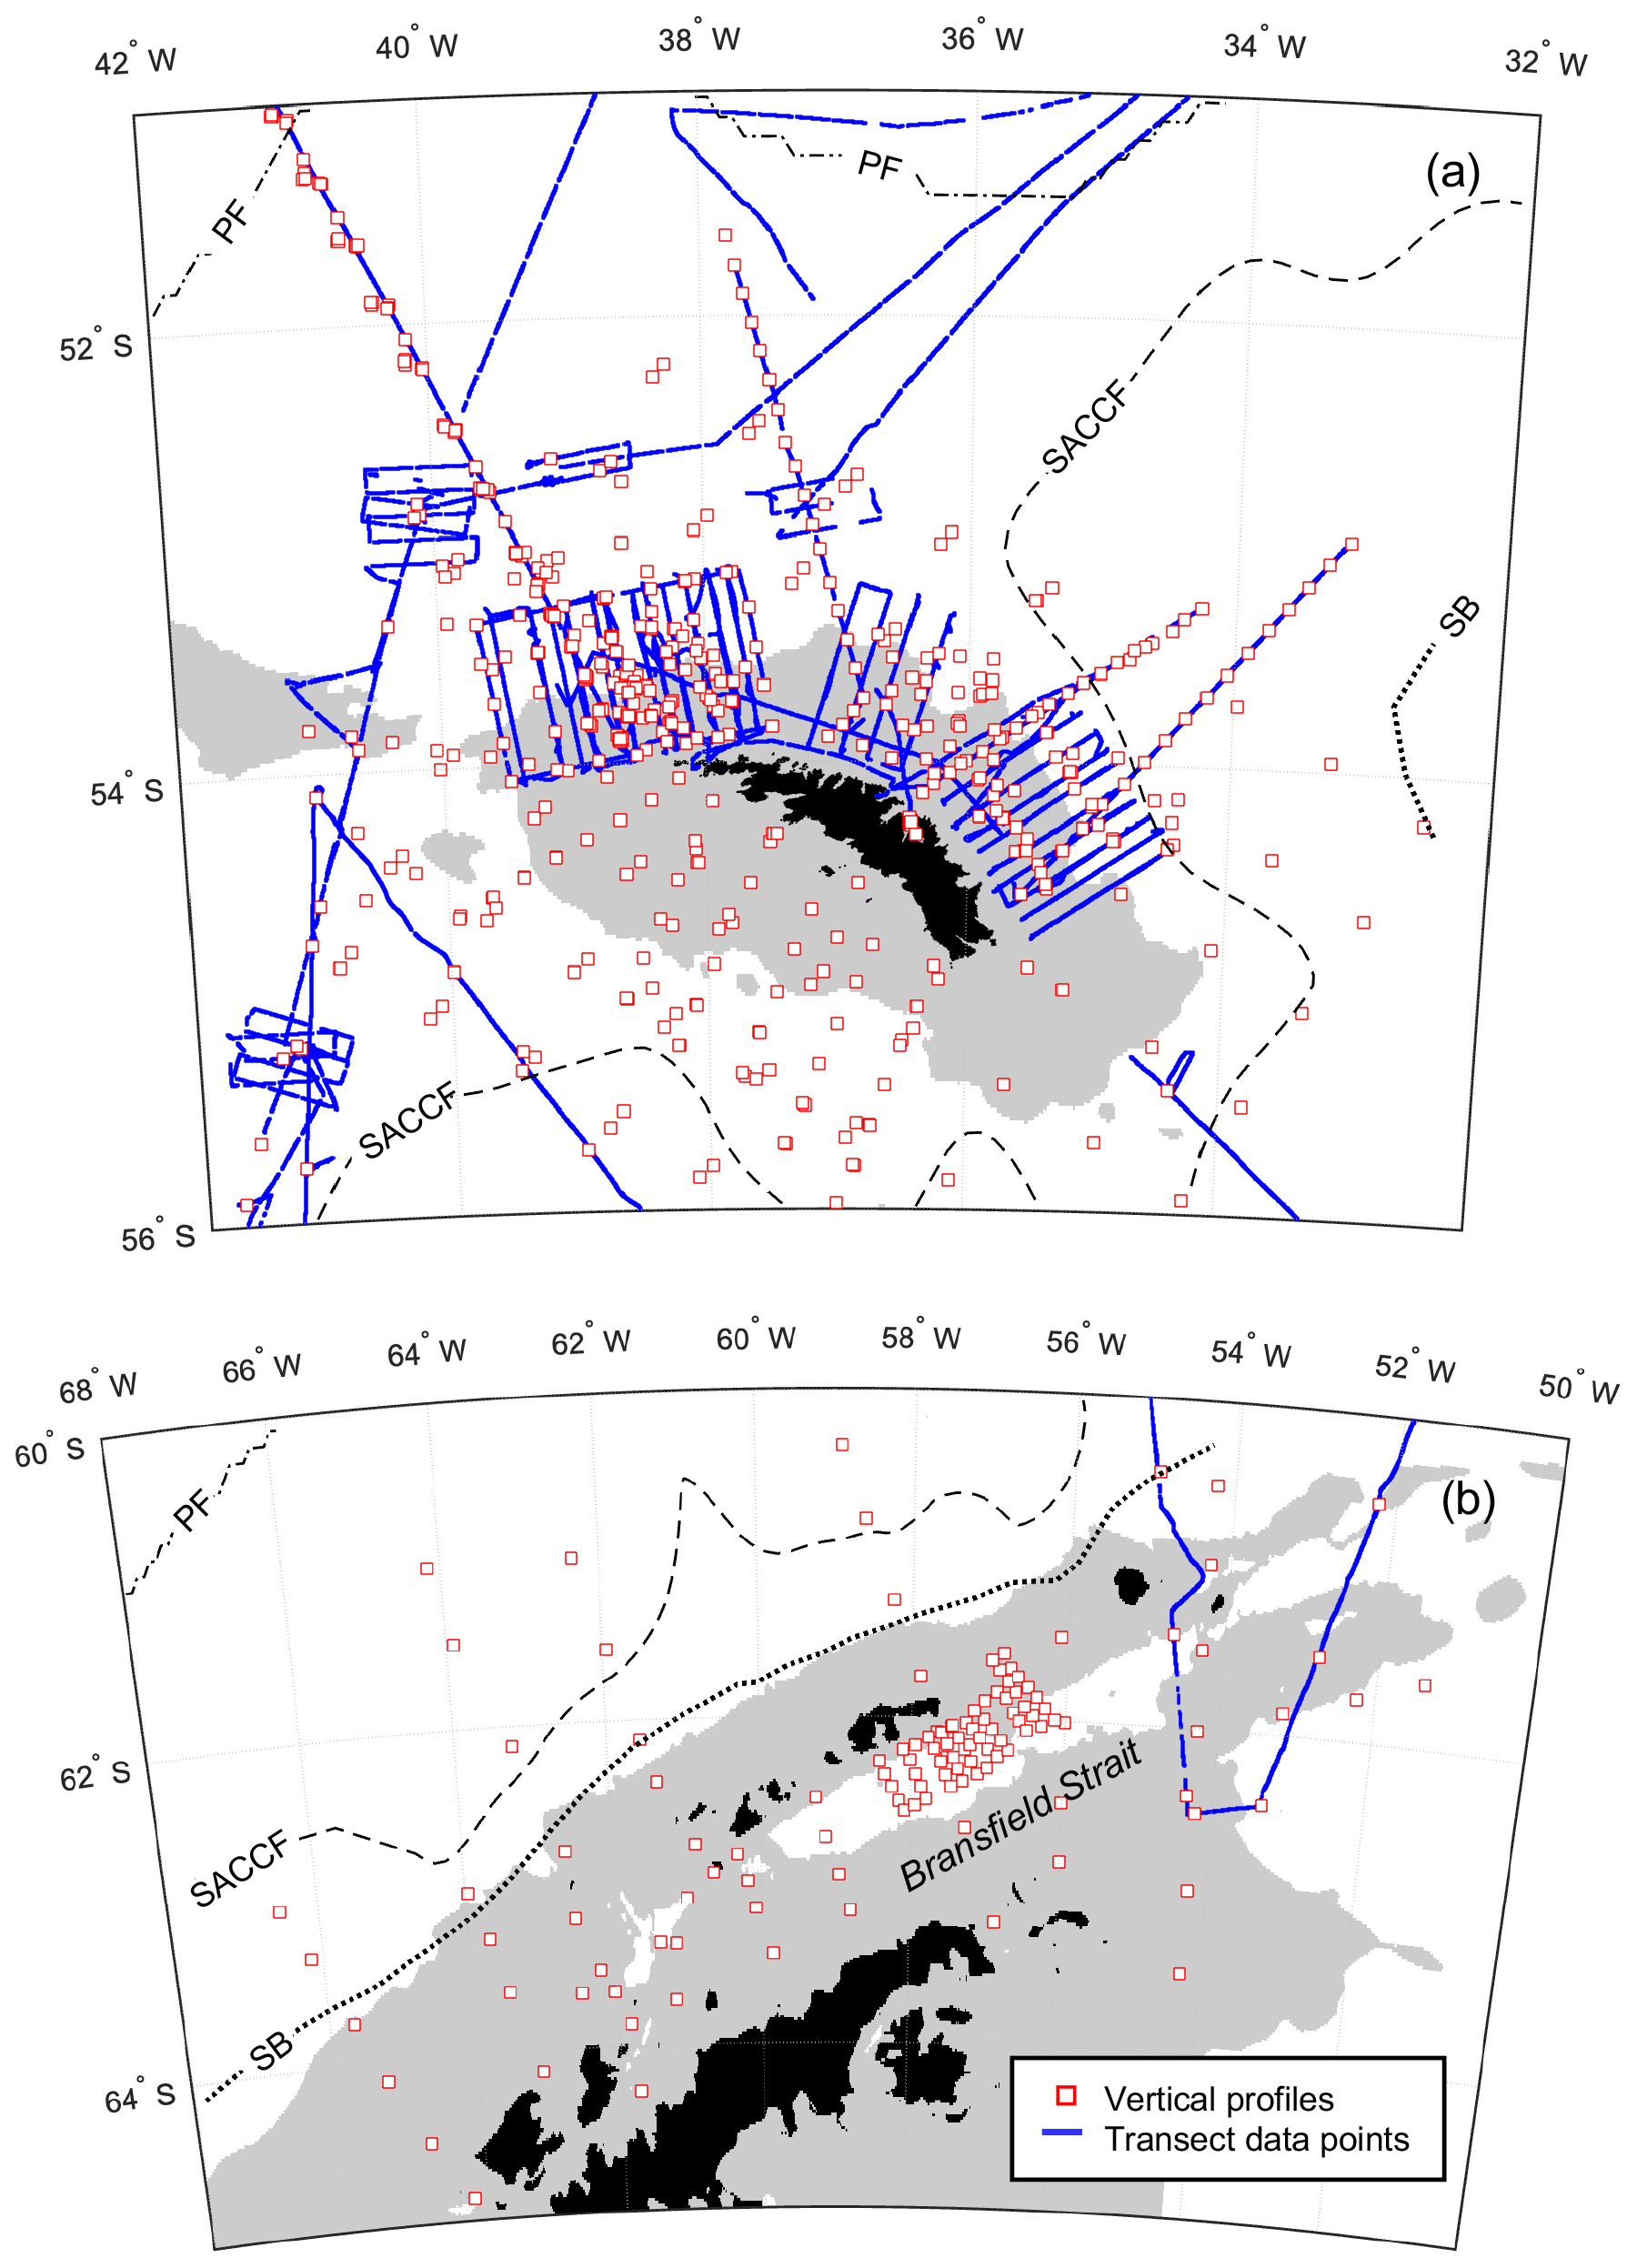
Figure 2Smaller-scale detail of sampling around (a) South Georgia. (b) Antarctic Peninsula. Southern Ocean fronts, pale grey areas and coastline are as in Fig. 1.
A series of stations spanning >700 km from the western end of South Georgia to the north-west crossed the PF and a number of bathymetric features, including the Maurice Ewing Bank (50.7∘ S, 43.5∘ W) after which the transect was named. Three cruises crossed the Scotia Sea from south to north in consecutive years and covered spring, summer and autumn periods (see Tarling et al., 2012). These cruises along with the Core Box surveys to the north of South Georgia included extensive underway sampling (see Sect. 2.2), while surveying near the Antarctic Peninsula comprised predominantly station grids (Fig. 2b).
2.2 Chemistry instrumentation and methods
In 1979, a segmented-flow analyser (SFA) was built in-house to analyse macronutrient measurements for the BAS offshore programme. It was based on Chemlab colorimeters and Ismatec proportioning pumps (Whitehouse and Woodley, 1987). Originally, data were logged to a paper chart and processed manually. In the mid-1980s, data extraction was automated and processing was managed with a digitising tablet and associated PC (Woodley, 1989). During 1993, the analyser was completely remodelled around Technicon colorimeters, the Ismatec proportioning pumps were updated, the chemistry manifolds were re-built and data were logged to a PC (Whitehouse, 1997). Data acquisition and subsequent processing were achieved with custom-built software (see Whitehouse and Preston, 1997).
All data were collected during BAS or other Natural Environment Research Council cruises aboard the RRS John Biscoe (cruises prefixed JB) or the RRS James Clark Ross (cruises prefixed JR). The macronutrients analysed are described fully in Whitehouse and Woodley (1987). They agree with the internationally accepted conventions for silicic acid (Si(OH)4–Si), orthophosphate (PO4–P), nitrate (NO3–N), nitrite (NO2–N) and ammonium (NH4–N). All concentrations are expressed in mmol m−3. A statistical analysis of the chemistry methods was documented in Whitehouse and Woodley (1987), but we present a summary for this analysis in Table 2.
Table 2Replication and limits of detection measured for chemistry methods (Whitehouse and Woodley, 1987).
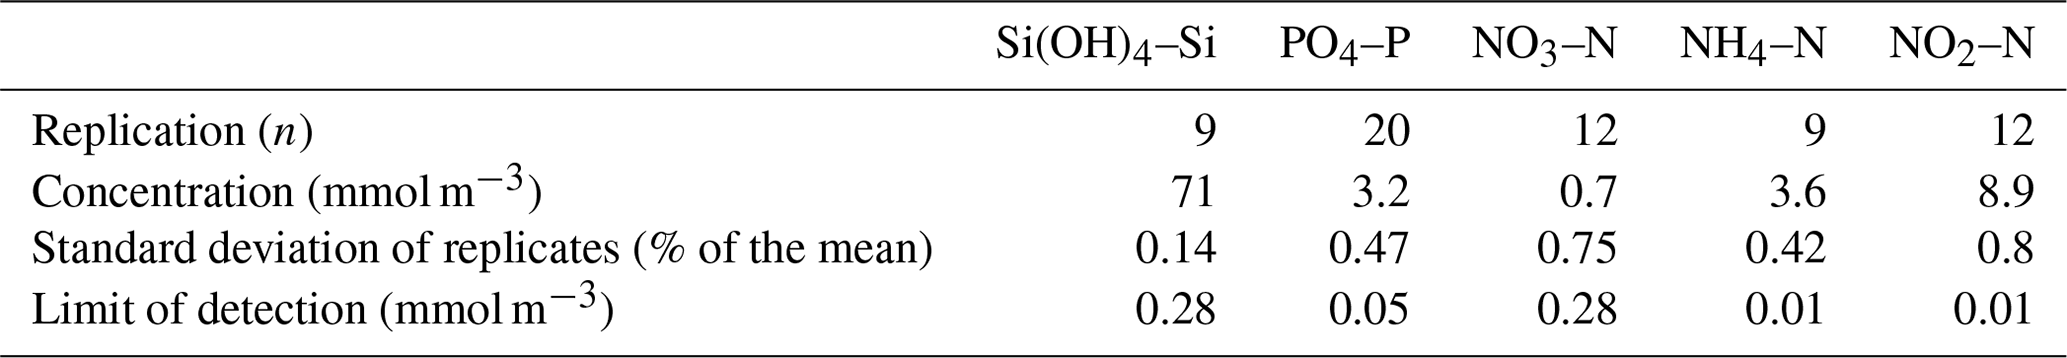
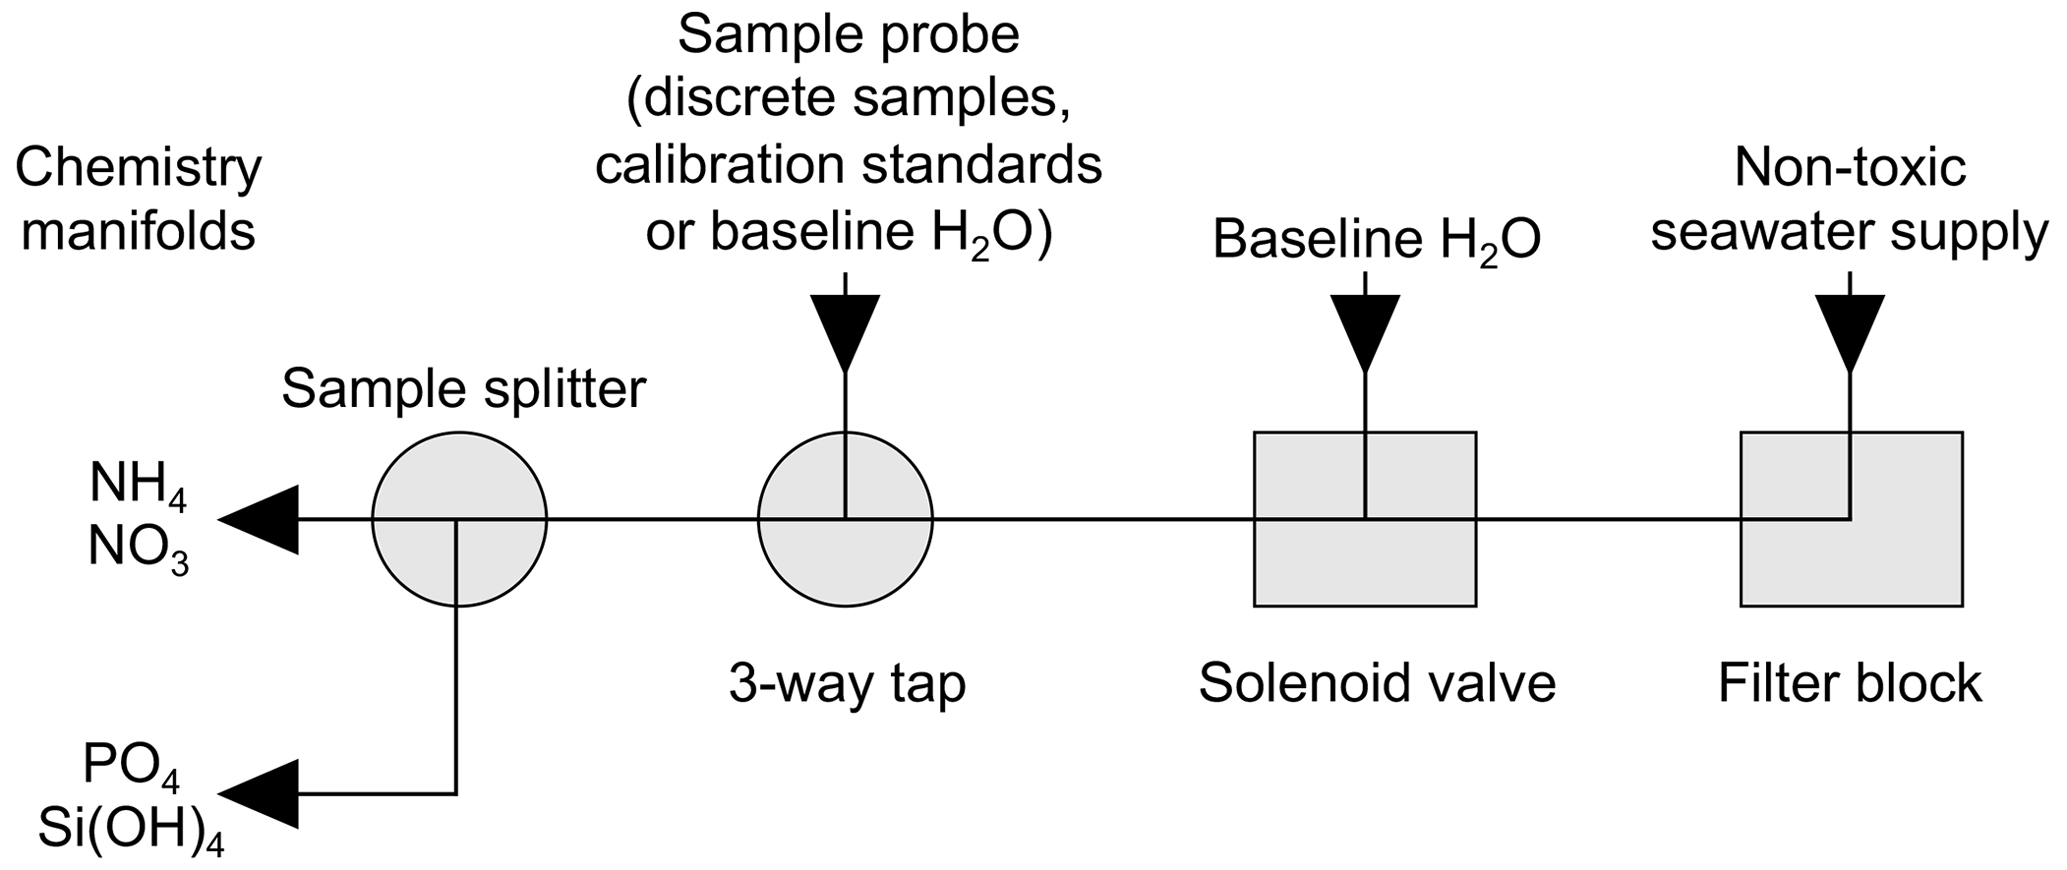
Figure 3Sample handling schematic for flow of samples, standards and baseline blanks between the ship's non-toxic seawater supply and the chemistry manifolds of the segmented-flow analyser.
Data were collected by means of two sampling methods. First of all, sub-samples were taken from CTD rosette water bottles that provide the conventional vertical profiles. Water samples were taken from CTD upcasts, in which bottles were fired at depths ranging from 5500 to 0.5 m. Secondly, samples were analysed continuously from the ship's non-toxic seawater supply while the vessel was underway to provide high-resolution horizontal coverage of near-surface conditions during transects. Here we document further details of the sample handling regime.
The ship's non-toxic seawater inlet was at ∼6–7 m and forward of the bows to avoid contamination. The time lag between seawater entering the ship's non-toxic inlet and reaching the chemistry laboratory was ∼60 s (Simon Wright, Deck Engineer, personal communication, 31 December 1996). On arrival at the chemistry laboratory, the stream of seawater passed through a tangential flow filter block (Morris et al., 1978) fitted with a filter membrane (pre-1990 Whatman GF/C, pore size 1.2 µm, and then a mixed ester Whatman WME, pore size 0.45 µm) (Fig. 3).

Figure 4Flowchart of dataset compilation, including sample collection, data processing and utilisation.
A sub-sample was then pumped through a solenoid valve controlled with an electric timer. Typically, a 5 min baseline check was automatically introduced once per hour while the ship was underway and horizontal profiles were being measured. The sample stream then passed through a three-way tap before arriving at a sample stream splitter followed by introduction to the chemistry manifolds. The three-way tap allowed manual interruption of the sample stream to introduce discrete samples from the CTD water bottles along with calibration standards and blank solutions for the calculation of baselines, refractive index compensation and flow-through times.
The time lag between the sample entering the laboratory and passing through the analyser to the detector varied between the different nutrient analyses depending on the complexity of the chemistries used. Therefore, underway measurements were time and date stamped at the analyser's detector by referencing the ship's central clock to enable integration with navigation and other underway measurements such as physical oceanography and phytoplankton-related information (see Whitehouse and Preston, 1997). The underway data were originally logged at a 10 s interval. However, given the time lag between seawater entering the ship's non-toxic inlet and reaching the chemistry laboratory (∼60 s), the detector's output was averaged over 1 min intervals during post-cruise processing to give a more realistic sampling sensitivity.
2.3 Temperature and conductivity measurements
Temperature and conductivity measurements were taken during CTD vertical profiles and with a thermosalinograph as part of the underway system that sampled from the ship's non-toxic seawater supply. During most cruises, the vertical profile conductivity measurements were calibrated against samples drawn from the CTD water bottles. Temperature and salinity data from the profile upcast were averaged onto the depth and time of the bottle firing for most nutrient samples taken from the CTD water bottles, but, where this was not possible, the downcast profile data were binned onto the depth (±2 m) of the nutrient sample. Further details are provided in the respective cruise reports (Appendix A). For this dataset, the underway temperature and conductivity measurements have not been calibrated against sample measurements but were averaged over a 60 s interval to smooth the data.
2.4 Dataset compilation
The compilation of the dataset is summarised in Fig. 4.
CTD water bottle data were compiled with ship identification information, cruise number, event number, geographic location and depth. Temperature and salinity data were extracted and matched with profile nutrient data from each cruise using latitude and depth as primary selector variables, with event numbers and timestamps used as secondary checks.
The ship's non-toxic seawater supply data were compiled with ship identification information, cruise number, geographic location, temperature and salinity, and each timestamp was reformatted as a date vector, a serial date number, and a datetime string (DD-MMM-YYYYThh:mm:ssZ). The serial date numbers were ordered temporally, converted into a datetime string (DD-MMM-YYYYThh:mm:ssZ) and converted to a table with minute intervals and corresponding arithmetic means of concentrations of each nutrient, temperature and salinity.
The profile and underway sample data have been deposited at the UK Polar Data Centre and are publicly available in NetCDF and CSV formats (Whitehouse et al., 2022). All available cruise reports (17 in total) that provide cruise and individual projects as well as additional background information on the current dataset have been compiled (Appendix A).
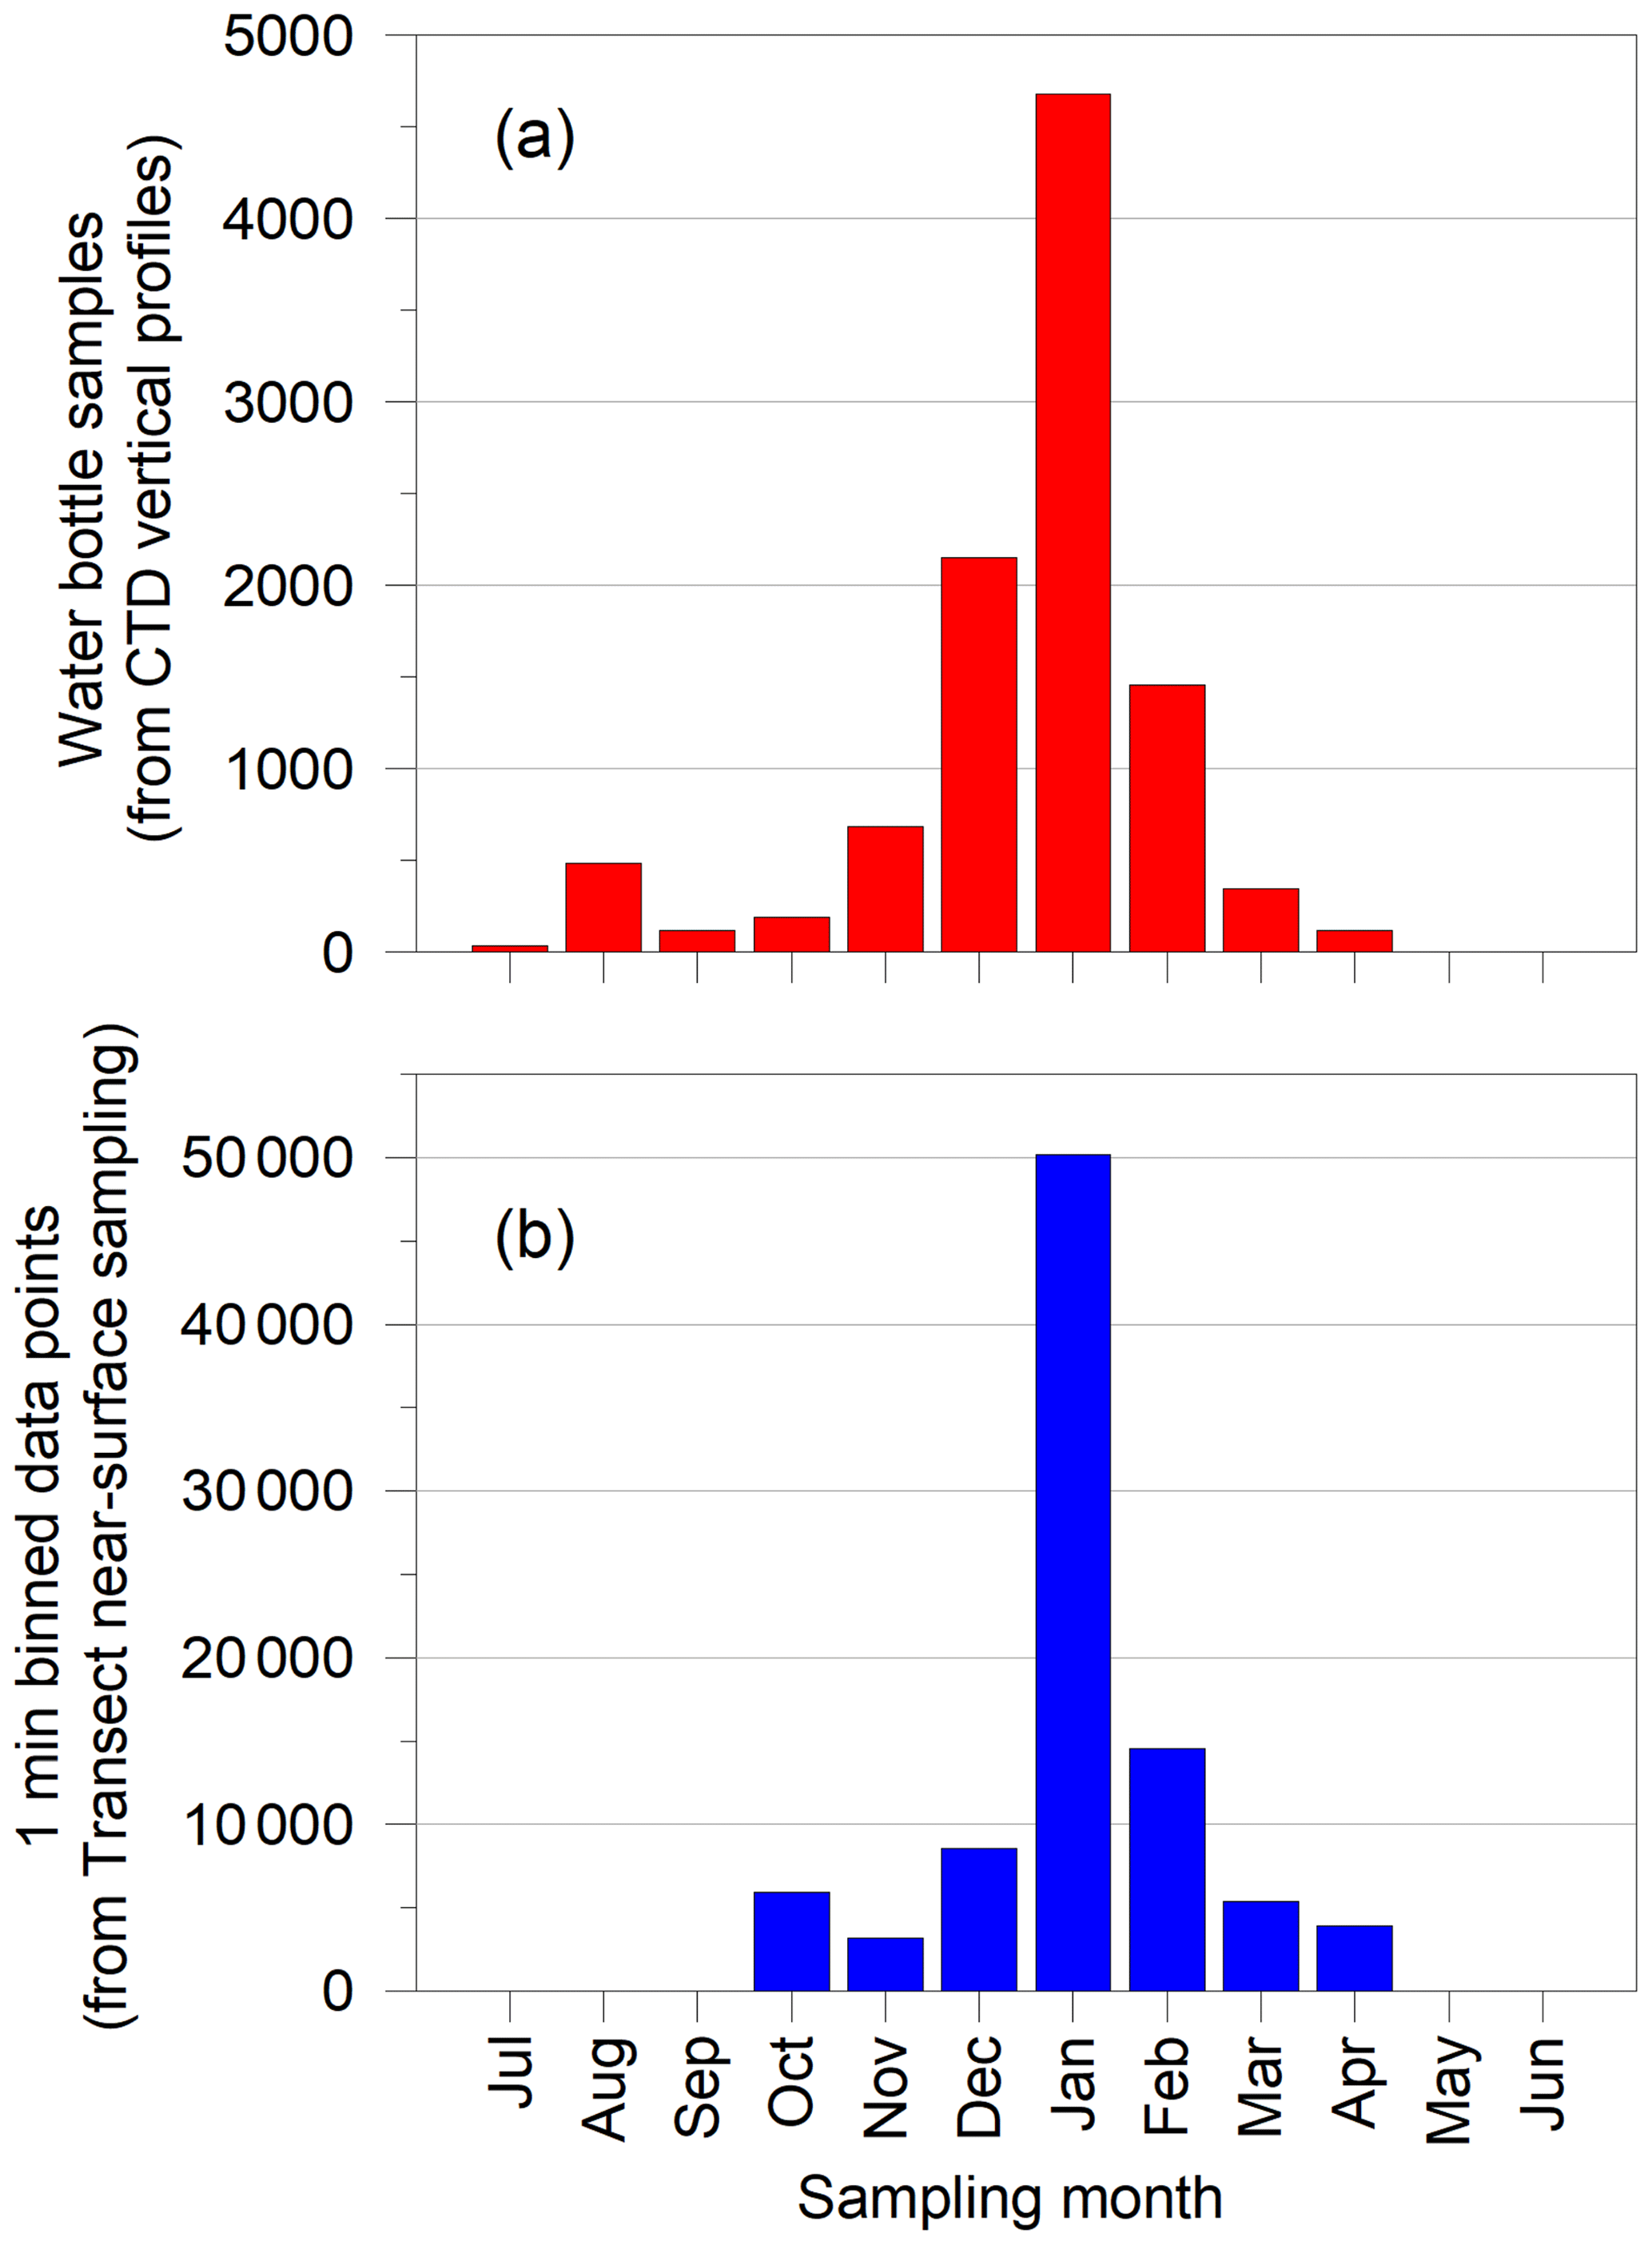
Figure 5Monthly totals for nutrient samples from CTD water bottles and transect data points.

Figure 6Potential temperature–salinity plots for (a) CTD vertical profiles and (b) transect data points. Data have been colour coded according to their location relative to the long-term mean positions of the PF, SACCF and SB (see Fig. 1). SAZ: Subantarctic Zone, PFZ: Polar Frontal Zone, SASW: Subantarctic Surface Water, AASW: Antarctic Surface Water.
3.1 Data evaluation
In all, ∼10 000 CTD water bottles were sampled and analysed, and ∼900 000 1 min bins of data were recorded from the underway sampling over the period 1980–2009. As with other high-latitude marine sampling projects, logistics and sea ice conditions dictated when surveys could be conducted. January was the most frequent month of collection, although sampling occurred in all months apart from May and June (Fig. 5).
Oceanographically, the profile data spanned the southern boundary of the ACC (SB), SACCF, PF and the Subantarctic Front (SAF) to the north of the PF (Fig. 6a). Antarctic Surface Water, Polar Frontal Zone surface water and shelf waters were evident in the underway data (Fig. 6b).
On repeated transects to the north of South Georgia (cruises JR17, JR28 and JR38) and across the Scotia Sea (JR161, JR177 and JR200), near-surface nutrient values (0–7 m) were compared with a mean value derived from CTD water bottle data (0–50 m) to assess whether surface values were representative of deeper parts of the water column (Table 3).
Table 3Relationship between mean surface (0 to 7 m) nutrient data with those averaged over 0 to 50 m using linear regressions. All available data from six cruises were examined during two studies: (a) to the north of South Georgia with 50 % of stations on-shelf (Whitehouse et al., 2009); (b) repeated transects across the Scotia Sea sampling deep oceanic waters (Whitehouse et al., 2012).
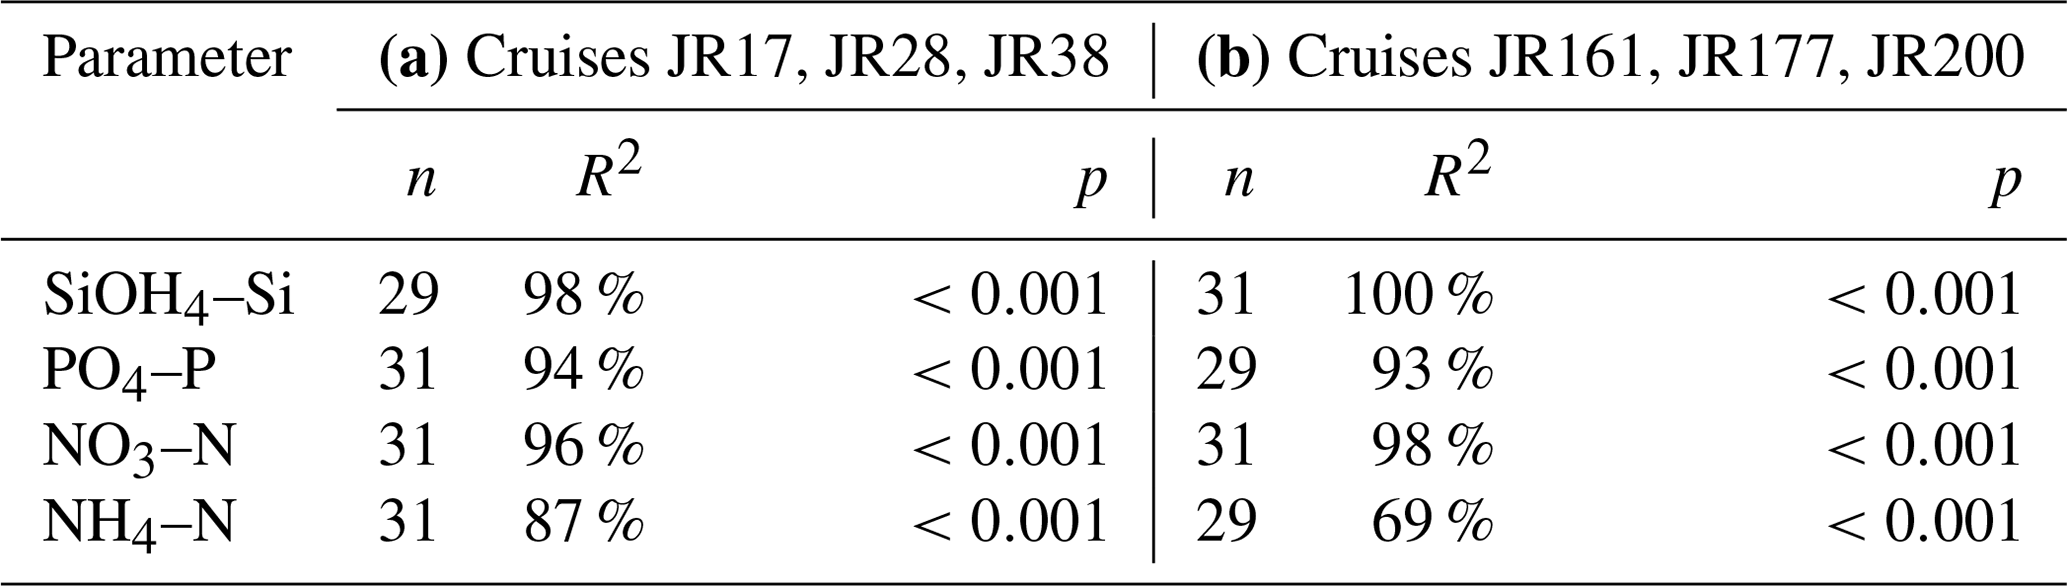
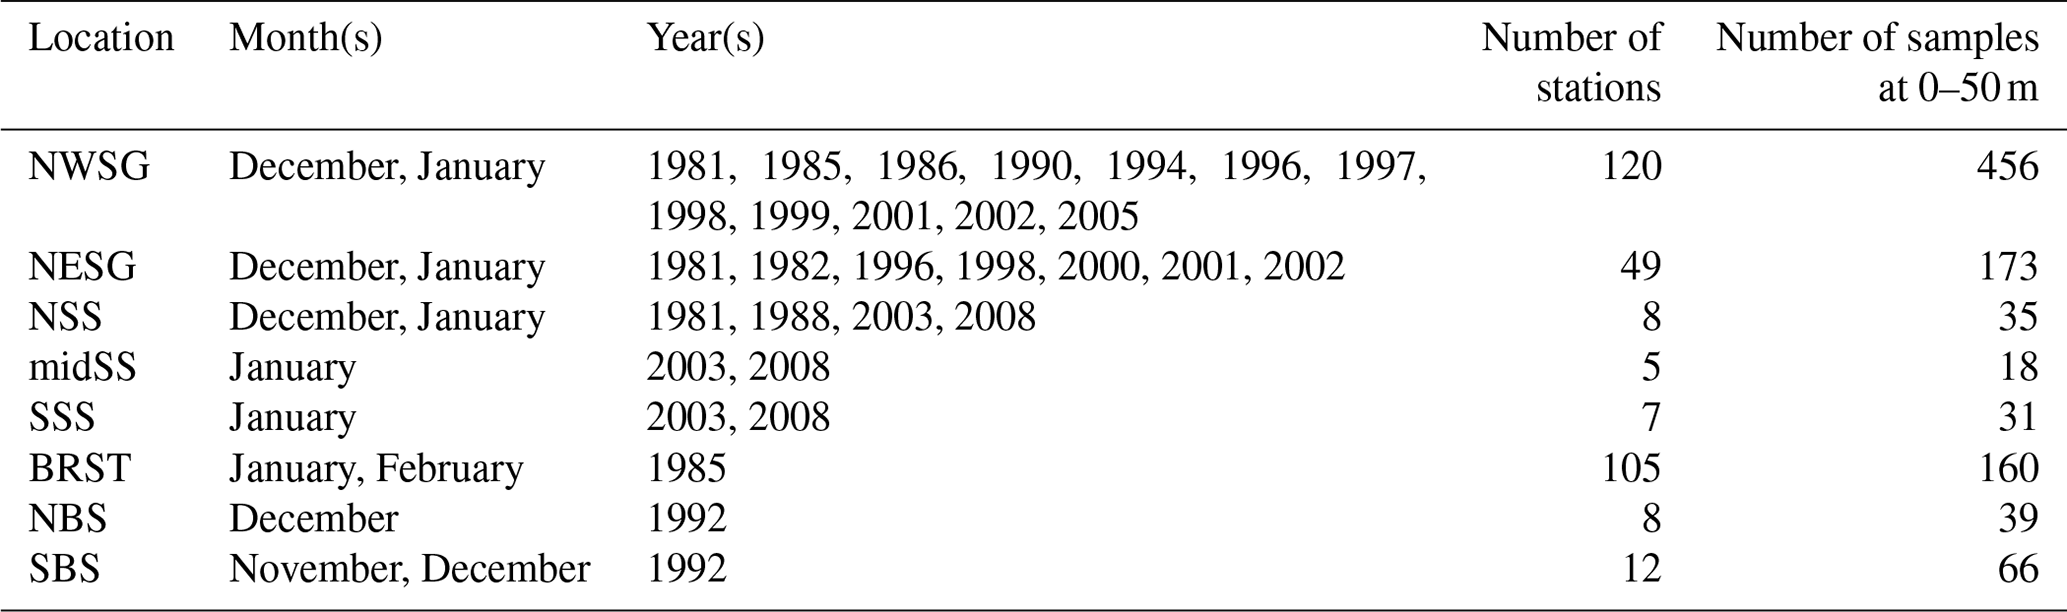
Table 4Details of the profile samples used to derive the austral summer properties for 0–50 m (Fig. 8). Refer to Fig. 7 for locations. Number of samples refers to the number of Niskin bottles for which at least one inorganic nutrient was analysed for the given location, months and depth range.
Linear regressions for all comparisons were highly significant (p<0.001). For Si(OH)4–Si, PO4–P and NO3–N, R2 values were ≥93 %. For NH4–N, R2 values were lower, and a difference was observed between the South Georgia cruises (87 %) and those in the Scotia Sea (69 %). This was doubtless due to the different water column characteristics sampled during the two studies. The South Georgia cruises include many on-shelf stations to the north of the island, where NH4–N is biologically generated and constrained bathymetrically to the surface waters. For the offshore Scotia Sea stations, NH4–N concentrations were relatively low, pycnoclines were deeper, and the upper mixed layer frequently extended below 50 m (Korb and Whitehouse, 2004; Korb et al., 2012).
3.2 Regionality
To illustrate regional variation within the dataset, we sub-sampled austral summer, near-surface (0–50 m) profile data from eight areas in distinct oceanographic regimes (Fig. 7, Table 4).
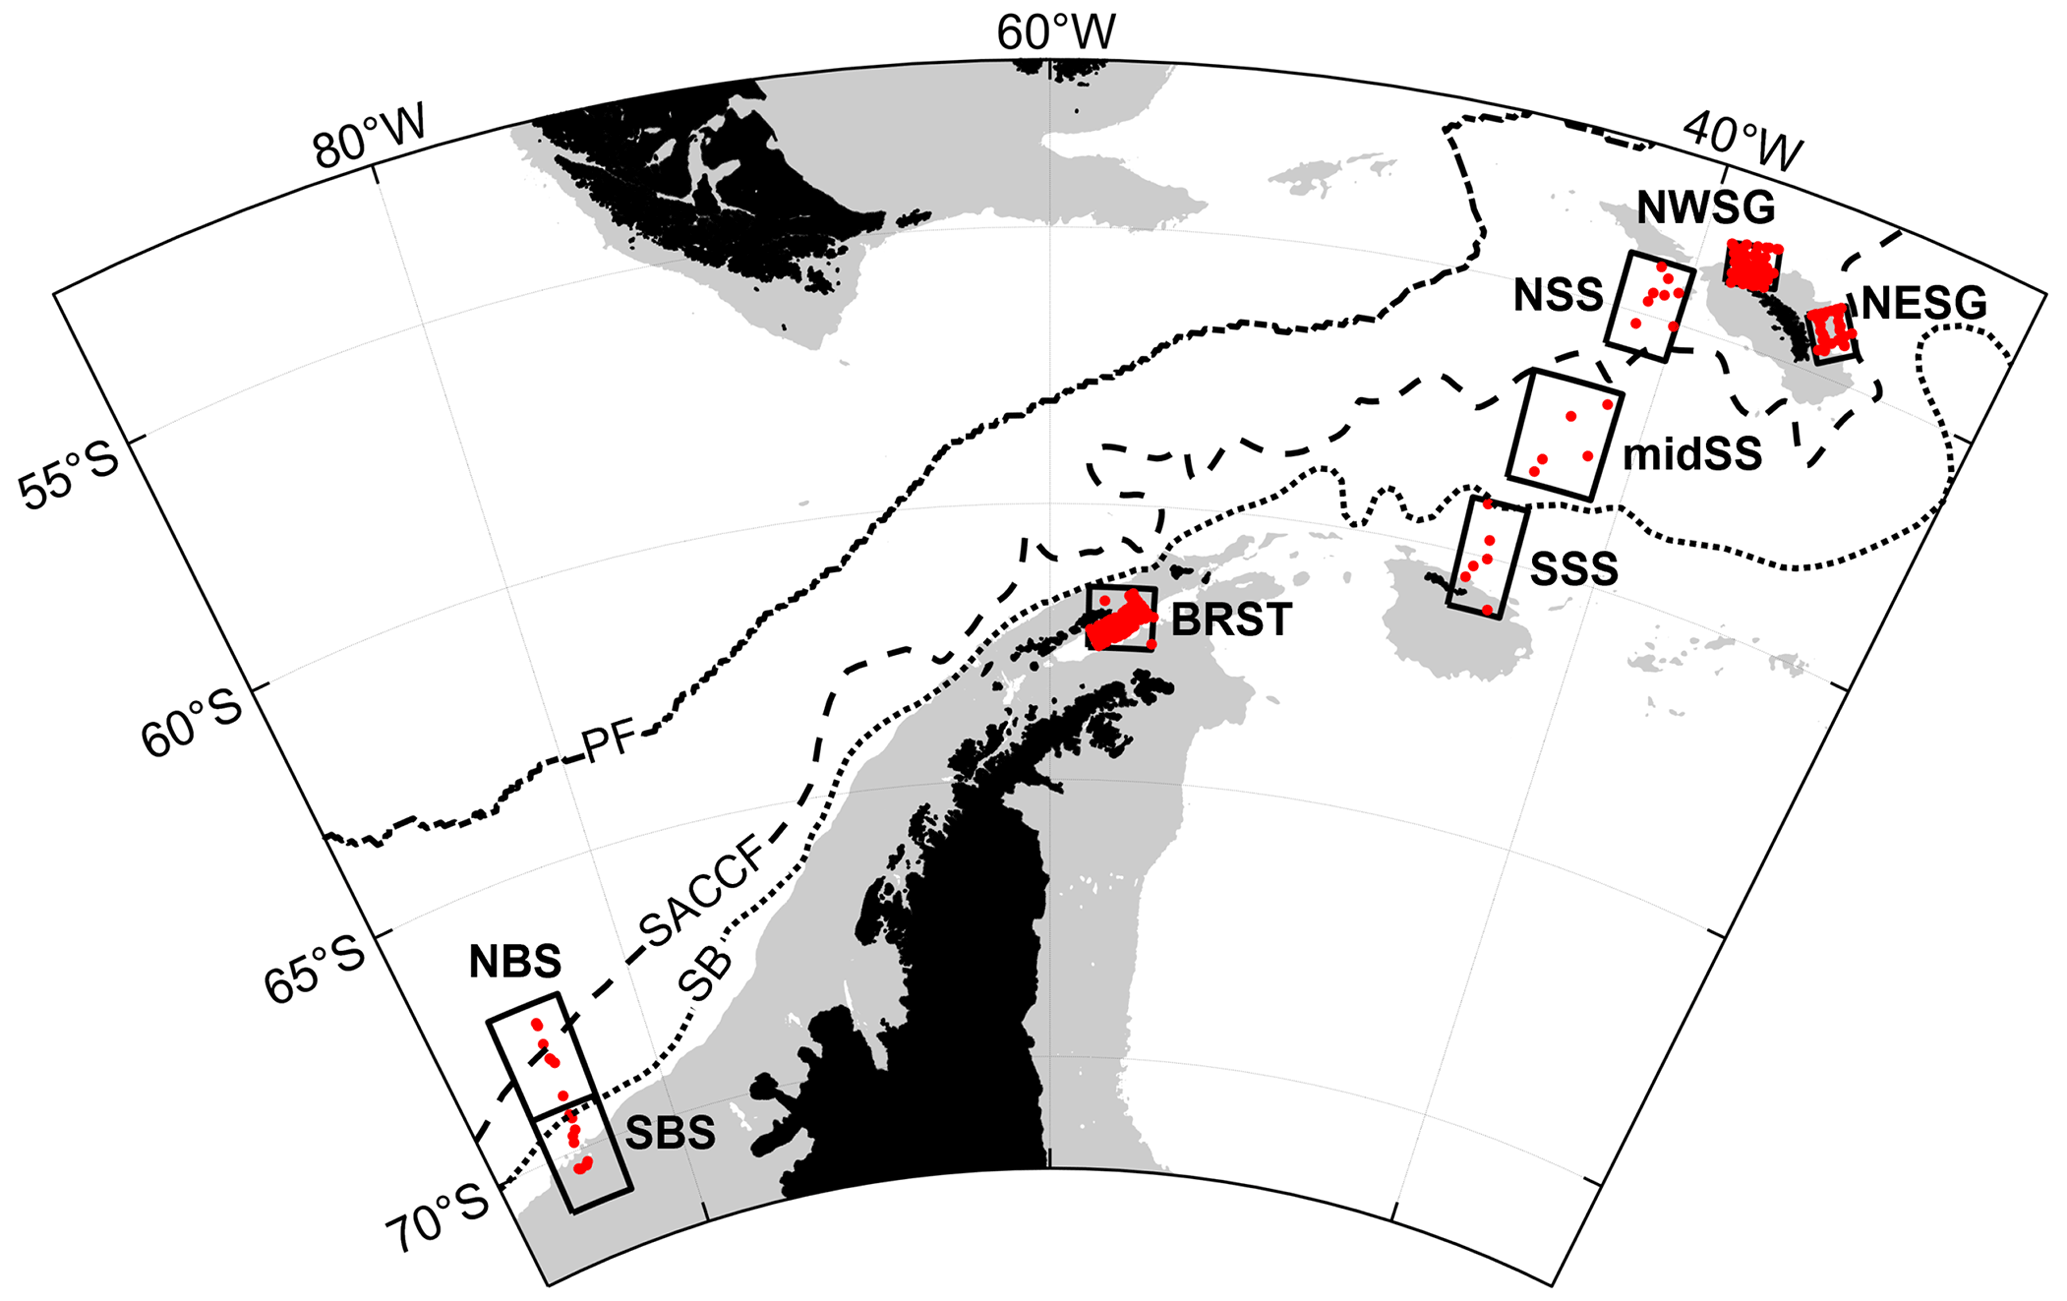
Figure 7Areas sub-sampled to illustrate regional variation: NWSG: north-western South Georgia; NESG: north-eastern South Georgia; NSS: northern Scotia Sea; midSS: mid-Scotia Sea; SSS: southern Scotia Sea; BRST: Bransfield Strait; NBS: northern Bellingshausen Sea; SBS: southern Bellingshausen Sea. Red dots mark sample locations included in the analyses. Southern Ocean fronts and bathymetry are shown as in Fig. 1.
3.2.1 South Georgia
Early descriptions of silicate and phosphate distributions at South Georgia were presented by Clowes (1938), but modern techniques have expanded spatial and temporal sampling and allowed the analysis of nutrients such as nitrate, nitrite, and ammonium in addition to silicate and phosphate.
To the north-west of South Georgia, the warmest and most productive waters with regards to phytoplankton are found. Indeed, the area is predicted to be the strongest carbon sink in the Southern Ocean (Schlitzer, 2002), and phytoplankton blooms can extend >2000 km downstream to the east (de Baar et al., 1995; Korb et al., 2004). This is the most comprehensively sampled of the eight areas presented in this analysis (Fig. 7, Table 4). Surface temperatures average ∼3 ∘C in summer (Fig. 8) and macronutrients are generally plentiful apart from silicate that can be depleted to limiting concentrations. In addition, marine life is abundant around the island, supplying multiple sources of regenerated, reduced nitrogen.
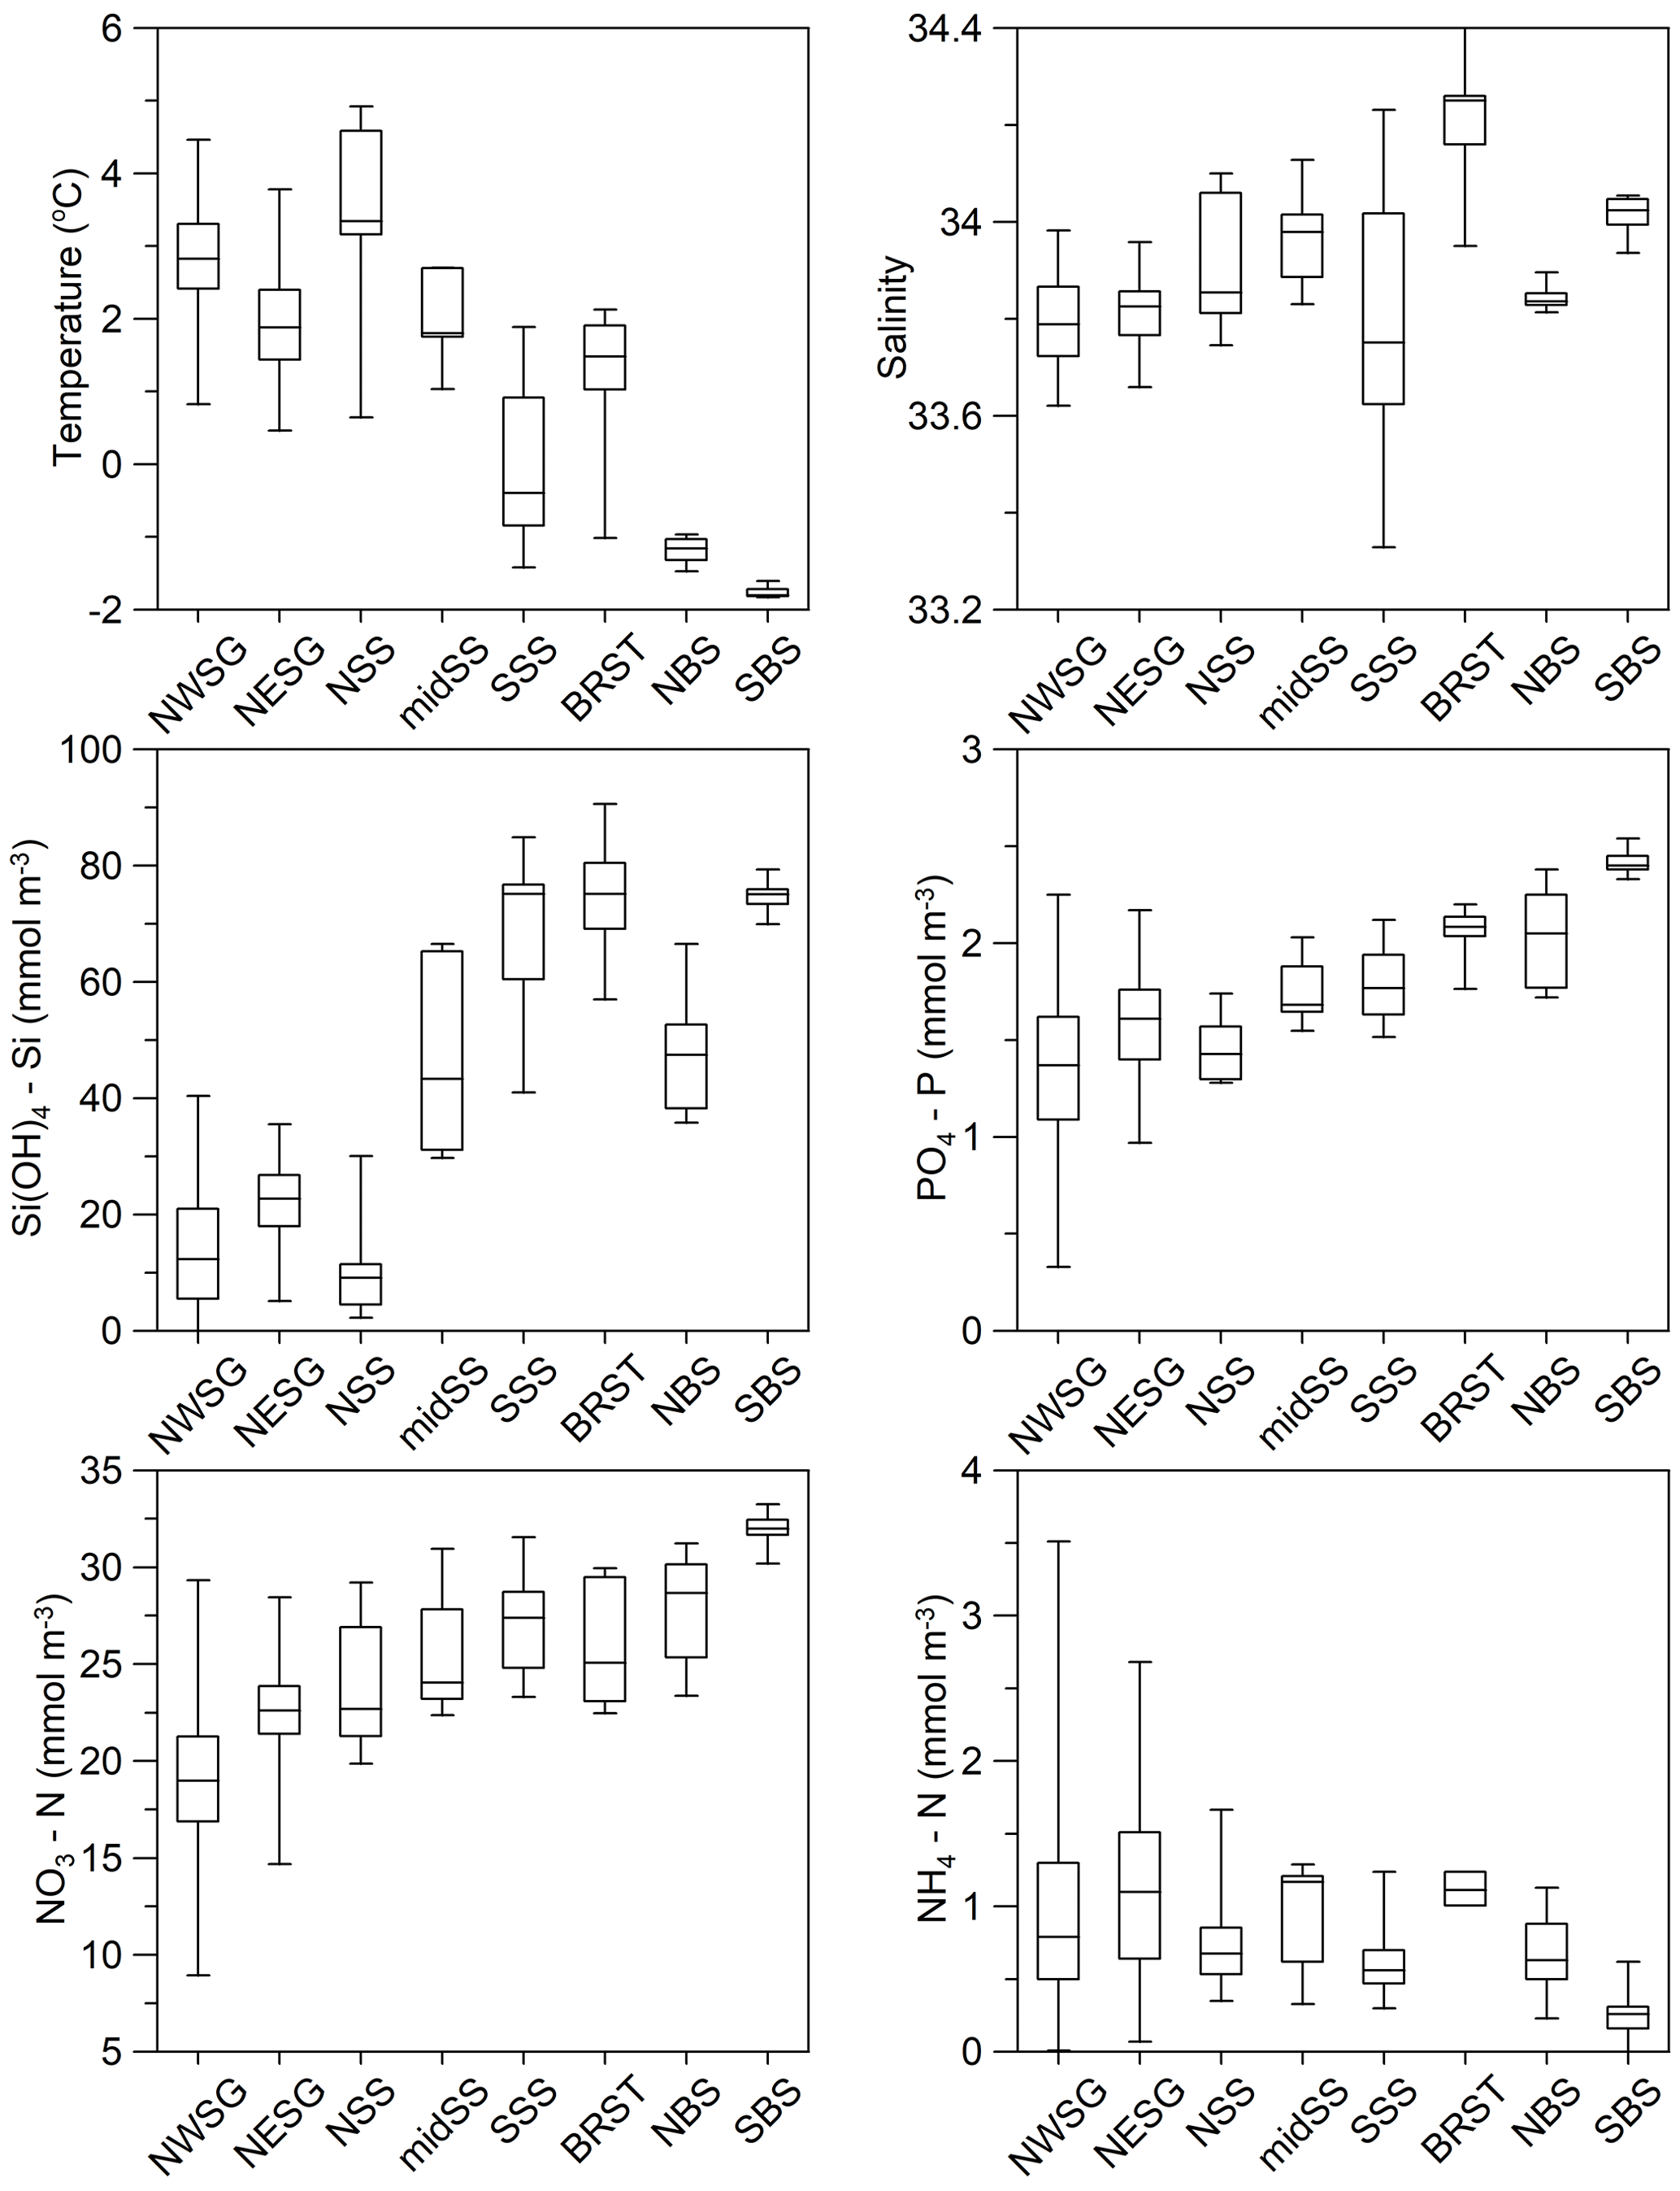
Figure 8Regional variability in physical and chemical near-surface (0–50 m) ocean properties for austral summer profile data. The box and whisker plots comprise a box that is defined by the region's lower and upper quartiles, the line in the centre of the box is the median, and the whiskers indicate the extreme values (minimum and maximum). Refer to Fig. 7 for sample locations and to Table 4 for temporal coverage and numbers of data points.
Waters to the north-east of South Georgia are influenced by the SACCF and are cooler. Macronutrient concentrations are higher than to the west of the island, but even so, silicate levels are low relative to the Southern Ocean as a whole. By contrast, ammonium concentrations tend to be higher, and this has been linked to nitrogen regenerated by an abundance of euphausiids and copepods in this region (Atkinson and Whitehouse, 2000, 2001). Historically, Antarctic krill Euphausia superba and krill predator abundance were highest in this region, although whale populations were demolished in the early 20th century (Headland, 1984), and krill abundance around the island has declined in recent years (Atkinson et al., 2022).
A compilation of data collected before the mid-1990s (including part of the current dataset) presented seasonal trends for macronutrients and considered their relationship with physical oceanography, phytoplankton use and interannual variability (Whitehouse et al., 1996a). Further subsets of the current dataset have been used in a comparison of conditions around the island and contrasting east versus west (Whitehouse et al., 1993, 1999), and in considering nutrient dynamics around the island's shelf break (Whitehouse et al., 2008a) and the Maurice Ewing Bank transect (Whitehouse et al., 1996b, 2000). Atkinson et al.'s (2001) South Georgia review sets nutrient characteristics in an ecological context, and the role of macronutrients in phytoplankton dynamics has been explored in several studies (e.g. Atkinson and Whitehouse, 2000; Whitehouse et al., 2009, 2011). Ocean warming (by ∼1 ∘C over the last century) has also been documented for the island (Whitehouse et al., 2008b).
3.2.2 Scotia Sea
Phytoplankton productivity in the Scotia Sea is high relative to the Southern Ocean as a whole, but it is subject to strong temporal and spatial variability largely associated with oceanographic gradients across the region's frontal zones (see Tarling et al., 2012). This variability is evident in the physical properties of the water: the mid-Scotia Sea is cooler than the northern Scotia Sea as it lies south of SACCF, and the southern Scotia Sea is colder again, being south of the SB. The southern Scotia Sea has the largest range in summer salinity, possibly due to interannual variability in sea ice extent in this region (Fig. 8).
This summer variability is also evident in macronutrient concentrations. Similar to the north-west of South Georgia, the northern Scotia Sea has relatively warm surface waters due to being north of the SACCF, and silicate concentrations may be limiting for diatom growth (Fig. 8). Also, reduced nitrate and elevated ammonium concentrations indicate both iron availability and regeneration of reduced nitrogen.
Silicate concentrations increase into the mid-Scotia Sea and again into the southern Scotia Sea region (Fig. 8), reflecting the biogeochemical gradients across the SACCF and SB. Nitrate and phosphate concentrations remain relatively high in the mid-Scotia Sea and southern Scotia Sea regions, although ammonium levels, especially in the mid-Scotia Sea, indicate a degree of nitrogen regeneration. Multi-seasonal macronutrient concentration variability is documented by Whitehouse et al. (2012), as are their relationships with primary production (Korb et al., 2005, 2012).
3.2.3 Bransfield Strait and the Bellingshausen Sea
Many of the stations sampled in the Bransfield Strait comprise the BAS contribution to SIBEX (the Second International BIOMASS Experiment) (El Sayed, 1994). As far as we know, the macronutrient measurements have only been used partially in relation to phytoplankton distribution (Heywood and Priddle, 1987) and physiology (Owens et al., 1991).
Sampling in this region took place primarily in January and February. Cool surface waters and relatively high macronutrient concentrations are typical of the southern region of the Southern Ocean (Fig. 8). However, elevated ammonium concentrations have been measured here, associated with a variety of phytoplankton communities (Owens et al., 1991). In early February 1985, silicate depletion coincided with a patch of high phytoplankton biomass off King George Island, South Shetland Islands. The patch remained stationary over a period of at least 11 d and was centred on an eddy at the apex of a tight meander formed by water passing around the eastern end of King George Island and being turned back immediately by the strong north-eastern flow of water within the Bransfield Strait (Heywood and Priddle, 1987).
Unlike the previous regions, the Bellingshausen Sea samples were collected during late spring and early summer (November and December) as part of a marginal ice zone survey. This study, entitled the STERNA cruise, was a component of the Southern Ocean JGOFS (Joint Global Ocean Flux Study, Turner et al., 1995).
These data, in contrast to those from the other regions, document the initiation of a phytoplankton bloom at the break-out of the winter's pack ice. The southern stations show typical winter conditions with cold, high nutrient waters apparent (Fig. 8). To the north, the major reduction in silicate concentrations is related to latitudinal hydrographic change. However, the waters have begun to warm, and there are indications of nutrient drawdown. Macronutrient variability and uptake are described by Whitehouse et al. (1995).
The profile and underway sample data have been deposited at the UK Polar Data Centre and are publicly available in NetCDF and CSV formats from https://doi.org/10.5285/4014370F-8EB2-492B-A5F3-6DC68BF12C1E (Whitehouse et al., 2022).
We have presented here a new macronutrient database, including depth profiles and continuous underway surface measurements of silicic acid, phosphate, nitrate, ammonium, and nitrite, along with co-located temperature and salinity. Data were collected throughout the year from a variety of biological “hotspots” within the Southern Ocean, including South Georgia and the wider Scotia Sea, the Western Antarctic Peninsula, and the Bellingshausen Sea. One of the key challenges in understanding carbon cycling in the Southern Ocean is disentangling long-term responses from significant spatial and temporal variability in physical and biogeochemical parameters. As such, there is a critical need for regional long-term observational datasets that are openly accessible to generate a better mechanistic understanding of the drivers of primary production. The new data product described here provides an unprecedented view of biogeochemical cycling in biologically productive regions of the Southern Ocean across a critical period in recent climate history and illustrates the importance of FAIR (findable, accessible, interoperable, and reusable) sharing of scientifically valuable observational datasets.
Further information is available for most of the cruises during which data for the current database were collected. This includes the specific aim of each cruise, the methodology and preliminary results.
Cruise reports are listed in chronological order: JB04 (Heywood, 1983), JB08 (Priddle, 1988), JB10 (Watkins and Priddle, 1990), JR02 (Owens, 1992), JR06 (White, 1994), JR11 (Priddle and Swanson, 1996), JR17 (Priddle, 1996), JR25 (Priddle, 1997), JR28 (Murphy, 1998), JR38 (Everson, 1999), JR57 (Ward, 2001), JR70 (Ward, 2002), JR82 (Atkinson, 2003), JR116 (Ward, 2005), JR161 (Shreeve, 2006), JR177 (Tarling, 2008), JR200 (Korb, 2009).
For cruises JR11, JR17 and JR25, pdf files can be requested from the Polar Data Centre at PDCServiceDesk@bas.ac.uk.
Cruise reports are not available for JB03, JB05 or JB06.
MJW, KRH, GAT, SET and PtH conceived the data paper and wrote the manuscript. All the authors commented on the paper and contributed to the quality check.
The contact author has declared that none of the authors has any competing interests.
Publisher's note: Copernicus Publications remains neutral with regard to jurisdictional claims in published maps and institutional affiliations.
We are most grateful to the officers and crew of the RRS John Biscoe and the RRS James Clark Ross, along with the cruises' Principal Scientists. We are also indebted to Vince Woodley, Julian Priddle, Beki Korb and Min Gordon for their assistance with chemical and data analysis and to the numerous scientists and technicians for their assistance with CTD and underway sampling and calibration of temperature and salinity data. Michael J. Whitehouse would also like to thank Barry Heywood, Julian Priddle and Pete Ward for their advice and guidance over many years. Finally, we are grateful to an anonymous referee and Elizabeth Jones for their constructive comments on an earlier manuscript draft.
The contributions of Katharine R. Hendry, Geraint A. Tarling, Sally E. Thorpe, and Petra ten Hoopen were supported by the BIOPOLE National Capability Multicentre Round 2 funding from the Natural Environment Research Council (grant no. NE/W004933/1). Geraint A. Tarling and Sally E. Thorpe were also supported by NC-ALI funding to the Ecosystems team at the British Antarctic Survey.
This paper was edited by François G. Schmitt and reviewed by Elizabeth Jones and one anonymous referee.
Amante, C. and Eakins, B. W.: ETOPO1 1 Arc-Minute Global Relief Model: Procedures, Data Sources and Analysis, NOAA Technical Memorandum NESDIS NGDC-24, National Geophysical Data Center, NOAA, https://doi.org/10.7289/V5C8276M, 2009.
Atkinson, A.: RRS James Clark Ross Cruise JR82: Large scale distribution in the Scotia Sea, BODC Cruise Inventory, 164 pp., https://www.bodc.ac.uk/resources/inventories/cruise_inventory/reports/jr82.pdf (last access: April 2022), 2003.
Atkinson, A. and Whitehouse, M. J.: Ammonium excretion by Antarctic krill Euphausia superba at South Georgia, Limnol. Oceanogr., 45, 55–63, https://doi.org/10.4319/lo.2000.45.1.0055, 2000.
Atkinson, A. and Whitehouse, M.: Ammonium regeneration by Antarctic mesozooplankton: an allometric approach, Mar. Biol., 139, 301–312, https://doi.org/10.1007/s002270100590, 2001.
Atkinson, A., Ward, P., Peck, J. M., and Murray, A. W. A.: Mesoscale distribution of zooplankton around South Georgia, Deep-Sea Res., 37, 1213–1227, https://doi.org/10.1016/0198-0149(90)90039-X, 1990.
Atkinson, A., Whitehouse, M. J., Priddle, J., Cripps G. C., Ward, P., and Brandon, M. A.: South Georgia, Antarctica: a productive, cold water, pelagic ecosystem, Mar. Ecol-Prog. Ser., 216, 279–308, https://doi.org/10.3354/meps216279, 2001.
Atkinson, A., Hill, S. L., Reiss, C. S., Pakhomov, E. A., Beaugrand, G., Tarling, G. A., Yang, G., Steinberg, D. K., Schmidt, K., Edwards, M., Rombolá, E., and Perry, F. A.: Stepping stones towards Antarctica: Switch to southern spawning grounds explains an abrupt range shift in krill, Glob. Change Biol., 28, 1359–1375, https://doi.org/10.1111/gcb.16009, 2022.
Boehme, L., Meredith, M. P., Thorpe, S. E., Biuw, M., and Fedak, M.: Antarctic Circumpolar Current frontal system in the South Atlantic: Monitoring using merged Argo and animal-borne sensor data, J. Geophys. Res-Oceans, 113, C9, https://doi.org/10.1029/2007JC004647, 2008.
Bonner, W. N.: Conservation in the Antarctic, in: Antarctic Ecology vol 2, edited by: Laws, R. M., Academic Press, London, 821–850, 1984.
Borrione, I. and Schlitzer, R.: Distribution and recurrence of phytoplankton blooms around South Georgia, Southern Ocean, Biogeosciences, 10, 217–231, https://doi.org/10.5194/bg-10-217-2013, 2013.
Borrione, I., Aumont, O., Nielsdóttir, M. C., and Schlitzer, R.: Sedimentary and atmospheric sources of iron around South Georgia, Southern Ocean: a modelling perspective, Biogeosciences, 11, 1981–2001, https://doi.org/10.5194/bg-11-1981-2014, 2014.
Brandon, M. A., Murphy. E, J., Whitehouse, M. J., Trathan, P. N., Murray, A. W. A., Bone, D. G., and Priddle, J.: The shelf break front to the east of the sub-Antarctic island of South Georgia, Cont. Shelf Res., 19, 799–819, https://doi.org/10.1016/S0278-4343(98)00112-5, 1999.
Brandon, M. A., Murphy, E. J., Trathan, P. N., and Bone, D. G.: Physical oceanographic conditions to the northwest of the sub-Antarctic island of South Georgia, J. Geophys. Res., 105, 23983–23996, https://doi.org/10.1029/2000JC900098, 2000.
Bryden, H. L.: The Southern Ocean, in: Eddies in Marine Science, edited by Robinson, A. R., Springer-Verlag, New York, 265–277, https://doi.org/10.1007/978-3-642-69003-7_14, 1983.
Cavan, E. L., Belcher, A., Atkinson, A., Hill, S. L., Kawaguchi, S., McCormack, S., and Boyd, P. W.: The importance of Antarctic krill in biogeochemical cycles, Nat. Commun., 10, 1–13, https://doi.org/10.1038/s41467-019-12668-7, 2019.
Clowes, A. J.: Phosphate and silica in the Southern Ocean, Discovery Report, 19, 1–120, 1938.
de Baar, J. W., de Jong, J. T. M., Bakker, D. C. E., Löscher, B. M., Veth, C., Bathmann, U., and Smetacek, V.: Importance of iron for plankton blooms and carbon dioxide drawdown in the Southern Ocean, Nature, 373, 412–415, https://doi.org/10.1038/373412a0, 1995.
El-Sayed, S. Z. (Ed.): Southern Ocean ecology: The BIOMASS perspective, Camb. Univ. Press, J. Mar. Biol. Assoc. U. K., 74, 743–743, xxi, 399 pp., 1994.
El-Sayed, S. Z. and Weber, L. H.: Spatial and temporal variations in phytoplankton biomass and primary productivity in the southwest Atlantic and the Scotia Sea, Polar Biol., 1, 83–90, 1982.
Everson, I.: RRS James Clark Ross Cruise JR38: Variability of the South Georgia Marine Ecosystem, BODC Cruise Inventory, 55 pp., https://www.bodc.ac.uk/resources/inventories/cruise_inventory/reports/jr38.pdf (last access: April 2022). 1999.
Everson, I. and Goss, C.: Krill fishing activity in the southwest Atlantic, Antarct. Sci., 3, 351–358, https://doi.org/10.1017/S0954102091000445, 1991.
Foxton, P.: The distribution of the standing stock of zooplankton in the Southern Ocean, Discovery Report, 28, 191–236, 1956.
Fryxell, G. A., Villareal, T. A., and Hoban, M. A.: Thalassiosira scotia, sp. Nov.: observations on a phytoplankton increase in early austral spring north of the Scotia Ridge, J. Plankton Res., 1, 355–370, https://doi.org/10.1093/plankt/1.4.355, 1979.
Gordon, A. L., Georgi, D. T., and Taylor, H. W.: Antarctic Polar Front Zone in the western Scotia Sea, summer 1975, J. Phys. Oceanogr., 7, 309–328, https://doi.org/10.1175/1520-0485(1977)007<0309:APFZIT>2.0.CO;2, 1977.
Hardy, A. C.: Great Waters, Collins, London, 542 pp., 1967.
Hardy, A. C. and Gunther, E. R.: The plankton of the South Georgia whaling grounds and adjacent waters, 1926–27, Discovery Report, 11, 1–456, 1935.
Harmer, S. F.: Southern whaling, P. Linn. Soc. London, 142, 85–163, 1931.
Hart, T. J.: On the plankton of the south west Atlantic and the Bellingshausen Sea 1929–31, Discovery Report, 8, 1–268, 1934.
Hart, T. J.: Phytoplankton periodicity in Antarctic surface waters, Discovery Report, 21, 261–365, 1942.
Headland, R. K.: The island of South Georgia, Cambridge University Press, Cambridge, 293 pp., 1984.
Heywood, R. B.: RRS John Biscoe Cruise JB04: Offshore Biological Programme, BODC Cruise Inventory, 32 pp., https://www.bodc.ac.uk/resources/inventories/cruise_inventory/reports/john_biscoe4_83.pdf (last access: April 2022), 1983.
Heywood, R. B. and Priddle, J.: Retention of phytoplankton by an eddy, Cont. Shelf Res., 7, 937–955, https://doi.org/10.1016/0278-4343(87)90007-0, 1987.
Hoppe, C. J. M., Klaas, C., Ossebaar, S., Soppa, M. A., Cheah, W., Laglera, L. M., and Trimborn, S.: Controls of primary production in two phytoplankton blooms in the Antarctic Circumpolar Current, Deep-Sea Res. Pt. II, 138, 63–73, https://doi.org/10.1016/j.dsr2.2015.10.005, 2017.
Jacques, G.: Primary production in the open Antarctic Ocean during austral summer. A review, Vie Milieu, 39, 1–17, 1989.
Jones, E. M., Bakker, D. C., Venables, H. J., and Watson, A. J.: Dynamic seasonal cycling of inorganic carbon downstream of South Georgia, Southern Ocean, Deep-Sea Res. Pt. II, 59–60, 25–35, https://doi.org/10.1016/j.dsr2.2011.08.001, 2012.
Jones, E. M., Hoppema, M., Strass, V., Hauck, J., Salt, L., Ossebaar, S., and de Baar, H. J.: Mesoscale features create hotspots of carbon uptake in the Antarctic Circumpolar Current, Deep-Sea Res. Pt. II, 138, 39–51, https://doi.org/10.1016/j.dsr2.2015.10.006, 2017.
Kemp, S. and Bennett, A. G.: On the distribution and movements of whales on the South Georgia and South Shetland whaling grounds, Discovery Report, 6, 165–190, 1932.
Korb, R.: RRS James Clark Ross Cruise JR200: Life cycles and trophic interactions of the Scotia Sea pelagic community: from the South Orkneys to the Polar Front, BODC Cruise Inventory, 205 pp., https://www.bodc.ac.uk/resources/inventories/cruise_inventory/reports/jr200.pdf (last access: April 2022), 2009.
Korb, R. E. and Whitehouse, M.: Contrasting primary production regimes around South Georgia, Southern Ocean: large blooms versus high nutrient, low chlorophyll waters, Deep-Sea Res. Pt. I, 51, 721–738, https://doi.org/10.1016/j.dsr.2004.02.006, 2004.
Korb, R. E., Whitehouse, M. J., and Ward, P.: SeaWiFS in the Southern Ocean: spatial and temporal variability in phytoplankton biomass around South Georgia. Deep-Sea Res. Pt. II, 51, 99–116, https://doi.org/10.1016/j.dsr2.2003.04.002, 2004.
Korb, R. E., Whitehouse, M. J., Thorpe, S. E., and Gordon, M.: Primary production across the Scotia Sea in relation to the physico-chemical environment, J. Marine Syst., 57, 231–249, https://doi.org/10.1016/j.jmarsys.2005.04.009, 2005.
Korb, R. E., Whitehouse, M. J., Atkinson, A., and Thorpe, S. E.: Magnitude and maintenance of the phytoplankton bloom at South Georgia: a naturally iron-replete environment, Mar. Ecol-Prog. Ser., 368, 75–91, https://doi.org/10.3354/meps07525, 2008.
Korb, R. E., Whitehouse, M. J., Ward, P., Gordon, M., Venables, H. J., and Poulton, A. J.: Regional and seasonal differences in microplankton biomass, productivity, and structure across the Scotia Sea: implications for the export of Biogenic carbon. Deep-Sea Res. Pt. II, 59–60, 67–77, https://doi.org/10.1016/j.dsr2.2011.06.006, 2012.
Latogursky, V. I., Makarov, R. R., and Maklgin, L. G.: Distribution, biomass and characteristics of the Euphausia superba fishery around South Georgia (Sub Area 48.3). Selected scientific papers presented to the scientific committee of CCAMLR (Commission for the Conservation of Antarctic Marine Living Resources), 25, Old Wharf Rd, Hobart, Tasmania 7000, Australia (SC-CCAMLR-SSP/7) CCAMLR, 123–147, 1990.
Lutjeharms, J. R. E. and Baker, D. Jr.: A statistical analysis of the mesoscale dynamics of the Southern Ocean, Deep-Sea Res., 27, 145–159, https://doi.org/10.1016/0198-0149(80)90093-X, 1980.
Mackintosh, N. A.: Distribution of post larval krill in the Antarctic, Discovery Report, 36, 95–156, 1973.
Marr, J. W. S.: The natural history and geography of the Antarctic krill (Euphausia superba Dana), Discovery Report, 32, 33–464, 1962.
Maslennikov, V. V.: Regional characteristics of the Antarctic surface waters in the southwestern part of the Atlantic sector, in: Antarctica, vol. 18, Nauka, Moscow, 134–139, 1979.
Matano, R. P., Combes, V., Young, E. F., and Meredith, M. P.: Modeling the impact of ocean circulation on chlorophyll blooms around South Georgia, Southern Ocean, J. Geophys. Res.-Oceans, 125, e2020JC016391, https://doi.org/10.1029/2020JC016391, 2020.
Meredith, M. P., Watkins, J. L., Murphy, E. J., Cunningham, N. J., Wood, A. G., Korb, R., Whitehouse, M. J., Thorpe, S. E., and Vivier, F.: An anticyclonic circulation above the Northwest Georgia Rise, Southern Ocean, Geophys. Res. Lett., 30, 2061, https://doi.org/10.1029/2003GL018039, 2003.
Moore, J. K., Abbott, M. R., and Richman, J. G.: Location and dynamics of the Antarctic Polar Front from satellite sea surface temperature data, J. Geophys. Res.-Oceans, 104, 3059–3073, https://doi.org/10.1029/1998JC900032, 1999.
Morris, A. W., Howland, R. J. M., and Bale, A. J.: A filtration unit for use with continuous autoanalytical systems applied to highly turbid waters, Estuar. Coast. Mar. Sci., 6, 105–109, https://doi.org/10.1016/0302-3524(78)90045-2, 1978.
Murphy, E. J.: RRS James Clark Ross Cruise JR28: Variability of the South Georgia Marine Ecosystem, BODC Cruise Inventory, 160 pp., https://www.bodc.ac.uk/resources/inventories/cruise_inventory/reports/jr028.pdf (last access: April 2022), 1998.
Nielsdóttir, M. C., Bibby, T. S., Moore, C. M., Hinz, D. J., Sanders, R., Whitehouse, M., and Achterberg, E. P.: Seasonal and spatial dynamics of iron availability in the Scotia Sea, Mar. Chem., 130, 62–72, https://doi.org/10.1016/j.marchem.2011.12.004, 2012.
NOAA National Geophysical Data Center: ETOPO1 1 Arc-Minute Global Relief Model, NOAA National Centers for Environmental Information, 2009.
Nowlin Jr., W. D. and Klinck, J. M.: The physics of the Antarctic Circumpolar Current, Rev. Geophys., 24, 469–491, https://doi.org/10.1029/RG024i003p00469, 1986.
Orsi, A. H. and Harris, U.: Fronts of the Antarctic Circumpolar Current – GIS data, Ver. 1, Australian Antarctic Data Centre, https://data.aad.gov.au/metadata/records/antarctic_circumpolar_current_fronts (last access: April 2022), 2019.
Orsi, A. H., Whitworth III, T., and Nowlin Jr., W. D.: On the meridional extent and fronts of the Antarctic Circumpolar Current, Deep-Sea Res., 42, 641–673, https://doi.org/10.1016/0967-0637(95)00021-W, 1995.
Owens, N. J. P.: RRS James Clark Ross Cruise JR02: Biogeochemical Ocean Flux Study, BODC Cruise Inventory, 245 pp., https://www.bodc.ac.uk/resources/inventories/cruise_inventory/reports/jr02_92.pdf (last access: April 2022), 1992.
Owens, N. J. P., Priddle, J., and Whitehouse, M. J.: Variations in phytoplanktonic nitrogen assimilation around South Georgia and in the Bransfield Strait (Southern Ocean), Mar. Chem., 35, 287–304, https://doi.org/10.1016/S0304-4203(09)90023-8, 1991.
Peterson, R. G. and Whitworth III, T.: The subantarctic and polar fronts in relation to the deep water masses through the Southwestern Atlantic, J. Geophys. Res., 94, 10817–10838, https://doi.org/10.1029/JC094iC08p10817, 1989.
Priddle, J.: RRS John Biscoe Cruise JB08: South Georgia and Bransfield Strait Marine Biology, BODC Cruise Inventory, 52 pp., https://www.bodc.ac.uk/resources/inventories/cruise_inventory/reports/john_biscoe08.pdf (last access: April 2022), 1988.
Priddle, J.: RRS James Clark Ross Cruise JR17: BAS Marine Life Sciences, BAS Cruise Archive, 44 pp., 1996.
Priddle, J.: RRS James Clark Ross Cruise JR25: Spring Processes, BAS Cruise Archive, 116 pp., 1997.
Priddle, J. and Swanson, C.: RRS James Clark Ross Cruise JR11: Marine Life Sciences Pelagic Ecosystem Studies, BAS Cruise Archive, 46 pp., 1996.
Priddle, J., Heywood, R. B., and Theriot, E.: Some environmental factors influencing phytoplankton in the Southern Ocean around South Georgia, Polar Biol., 5, 65–79, https://doi.org/10.1007/BF00443379, 1986.
Priddle, J., Whitehouse, M. J., Atkinson, A., Brierley, A. S., and Murphy, E. J.: Diurnal changes in mixed layer ammonium concentrations – interplay between zooplankton and phytoplankton, J. Plankton Res., 19, 1305–1330, https://doi.org/10.1093/plankt/19.9.1305, 1997.
Rembauville, M., Manno, C., Tarling, G. A., Blain, S., and Salter, I.: Strong contribution of diatom resting spores to deep-sea carbon transfer in naturally iron-fertilized waters downstream of South Georgia, Deep-Sea Res. Pt. I, 115, 22–35, https://doi.org/10.1016/j.dsr.2016.05.002, 2016.
Robinson, J. O. S. I. E., Popova, E. E., Srokosz, M. A., and Yool, A.: A tale of three islands: Downstream natural iron fertilization in the Southern Ocean, J. Geophys. Res.-Oceans, 121, 3350–3371, https://doi.org/10.1002/2015JC011319, 2016.
Rönner, U., Sörrenson, F., and Holm-Hansen, O.: Nitrogen assimilation by phytoplankton in the Scotia Sea, Polar Biol., 2, 137–147, https://doi.org/10.1007/BF00448963, 1983.
Schlitzer, R.: Carbon export fluxes in the Southern Ocean: results from inverse modeling and comparison with satellite-based estimates, Deep-Sea Res. Pt. II, 49, 1623–1644, https://doi.org/10.1016/S0967-0645(02)00004-8, 2002.
Schlosser, C., Schmidt, K., Aquilina, A., Homoky, W. B., Castrillejo, M., Mills, R. A., Patey, M. D., Fielding, S., Atkinson, A., and Achterberg, E. P.: Mechanisms of dissolved and labile particulate iron supply to shelf waters and phytoplankton blooms off South Georgia, Southern Ocean, Biogeosciences, 15, 4973–4993, https://doi.org/10.5194/bg-15-4973-2018, 2018.
Shreeve, R.: RRS James Clark Ross Cruise JR161: A study of pelagic marine food web interactions and condition factors of zooplankton across the Scotia Sea, BODC Cruise Inventory, 324 pp., https://www.bodc.ac.uk/resources/inventories/cruise_inventory/reports/jr161.pdf (last access: April 2022), 2006.
Smith, I. J., Stevens, D. P., Heywood, K. J., and Meredith, M. P.: The flow of the Antarctic circumpolar current over the north scotia ridge, Deep-Sea Res. Pt. I, 57, 14–28, https://doi.org/10.1016/j.dsr.2009.10.010, 2010.
Tarling, G.: RRS James Clark Ross Cruise JR177: Life cycles and trophic interactions of the Scotia Sea pelagic community: from ice-edge to Polar Front, BODC Cruise Inventory, 321 pp., https://www.bodc.ac.uk/resources/inventories/cruise_inventory/reports/jr177.pdf (last access: April 2022), 2008.
Tarling, G. A., Ward, P., Atkinson, A., Collins, M., and Murphy, E. J.: Editorial: Discovery 2010: understanding the Scotia Sea food web, Deep-Sea Res. Pt. II, 59–60, 1–13, https://doi.org/10.1016/j.dsr2.2011.10.001, 2012.
Thorpe, S. E., Heywood, K. J., Brandon, M. A., and Stevens, D. P.: Variability of the southern Antarctic Circumpolar Current front north of South Georgia, J. Marine Syst. 37, 87–105, https://doi.org/10.1016/S0924-7963(02)00197-5, 2002.
Trathan, P. N., Brandon, M. A., Murphy, E. J., and Thorpe, S. E.: Characterization of the Antarctic Polar Frontal Zone to the north of South Georgia in summer 1984, J. Geophys. Res., 102, 10483–10497, https://doi.org/10.1029/97JC00381, 1997.
Trathan, P. N., Everson, I., Murphy, E. J., and Parkes, G. B.: Analysis of haul data from the South Georgia krill fishery, CCAMLR Sci., 5, 9–30, 1998.
Tréguer, P. and Jacques, G.: Dynamics of nutrients and phytoplankton, and fluxes of carbon, nitrogen and silicon in the Antarctic Ocean, Polar Biol., 12, 149–162, https://doi.org/10.1007/BF00238255, 1992.
Turner, D. R., Owens, N. J., and Priddle, J.: Southern Ocean JGOFS: The U.K. “STERNA” study in the Bellingshausen Sea, Deep-Sea Res. Pt. II, 42, 905–906, https://doi.org/10.1016/0967-0645(95)00076-3, 1995.
Ward, P.: RRS James Clark Ross Cruise JR57: Variability in the Southern Ocean, BODC Cruise Inventory, 77 pp., https://www.bodc.ac.uk/resources/inventories/cruise_inventory/reports/jr57.pdf (last access: April 2022), 2001.
Ward, P.: RRS James Clark Ross Cruise JR70: Flux and Marine Production Experiment, BODC Cruise Inventory, 155 pp., https://www.bodc.ac.uk/resources/inventories/cruise_inventory/reports/jr70.pdf (last access: April 2022), 2002.
Ward, P.: RRS James Clark Ross Cruise JR116: A study of community structure and production along the southern shelf of South Georgia and links with the Georgia Basin, BODC Cruise Inventory, 127 pp., https://www.bodc.ac.uk/resources/inventories/cruise_inventory/reports/jr116.pdf (last access: April 2022), 2005.
Watkins, J. L. and Priddle, J.: RRS John Biscoe Cruise JB10: South Georgia Marine Biology, BODC Cruise Inventory, 12 pp., https://www.bodc.ac.uk/resources/inventories/cruise_inventory/reports/john_biscoe10_90leg1_2.pdf (last access: April 2022), 1990.
Wessel, P. and Smith, W. H. F.: A Global Self-consistent, Hierarchical, High-resolution Shoreline Database (Version 2.3.7), https://www.soest.hawaii.edu/pwessel/gshhg/, last access: April 2022.
White, M.: RRS James Clark Ross Cruise JR06: South Georgia and South Orkneys Marine Biology (Predator/Prey cruise), BODC Cruise Inventory, 218 pp., https://www.bodc.ac.uk/resources/inventories/cruise_inventory/reports/jr06.pdf (last access: April 2022), 1994.
Whitehouse, M. J.: Automated seawater nutrient chemistry, British Antarctic Survey, Cambridge, 14 pp., 1997.
Whitehouse, M. J. and Preston, M.: A flexible computer-based technique for the analysis of data from a sea-going nutrient autoanalyzer, Anal. Chim. Acta., 345, 197–202, https://doi.org/10.1016/S0003-2670(96)00630-7, 1997.
Whitehouse, M. J. and Woodley, V. R.: Automated Seawater Nutrient Analysis, British Antarctic Survey, Cambridge, 41 pp., 1987.
Whitehouse, M. J., Symon, C., and Priddle, J.: Variations in the distribution of chlorophyll a and inorganic nutrients around South Georgia, South Atlantic, Antarct. Sci., 5, 367–376, https://doi.org/10.1017/S0954102093000495, 1993.
Whitehouse, M. J., Priddle, J., and Woodward, E. M. S.: Spatial variability of inorganic nutrients in the marginal ice zone of the Bellingshausen Sea during the Austral spring, Deep-Sea Res. Pt. II, 42, 1047–1058, https://doi.org/10.1016/0967-0645(95)00074-Z, 1995.
Whitehouse, M. J., Priddle, J., and Symon, C.: Seasonal and annual change in seawater temperature, salinity, nutrient and chlorophyll a distributions around South Georgia, South Atlantic, Deep-Sea Res., 43, 425–443, https://doi.org/10.1016/0967-0637(96)00020-9, 1996a.
Whitehouse, M. J., Priddle, J., Trathan, P. N., and Brandon, M. A.: Substantial open-ocean phytoplankton blooms to the north of South Georgia, South Atlantic, during summer 1994, Mar. Ecol-Prog. Ser., 140, 187–197, https://doi.org/10.3354/meps140187, 1996b.
Whitehouse, M. J., Priddle, J., Brandon, M. A., and Swanson, C.: A comparison of chlorophyll/nutrient dynamics at two survey sites near South Georgia, and the potential role of planktonic nitrogen recycled by land-based predators, Limnol. Oceanogr., 44, 1498–1508, https://doi.org/10.4319/lo.1999.44.6.1498, 1999.
Whitehouse, M. J., Priddle, J., and Brandon, M. A.: Chlorophyll/nutrient characteristics in the water masses to the north of South Georgia, Southern Ocean, Polar Biol. 23, 373–382, https://doi.org/10.1007/s003000050458, 2000.
Whitehouse, M. J., Korb, R. E., Atkinson, A., Thorpe, S. E., and Gordon, M.: Formation, transport and decay of an intense phytoplankton bloom within the High-Nutrient Low-Chlorophyll belt of the Southern Ocean, J. Mar. Syst., 70, 150–167, https://doi.org/10.1016/j.jmarsys.2007.05.003, 2008a.
Whitehouse, M. J., Meredith, M. P., Rothery, P., Atkinson, A., Ward, P., and Korb, R. E.: Rapid warming of the ocean around South Georgia, Southern Ocean, during the 20th century: Forcings, characteristics and implications for lower trophic levels, Deep-Sea Res., 55, 1218–1228, https://doi.org/10.1016/j.dsr.2008.06.002, 2008b.
Whitehouse, M. J., Atkinson, A., Ward, P., Korb, R. E., Rothery, P., and Fielding, S.: Role of krill versus bottom-up factors in controlling phytoplankton biomass in the northern Antarctic waters of South Georgia, Mar. Ecol.-Prog. Ser., 393, 69–82, https://doi.org/10.3354/meps08288, 2009.
Whitehouse, M. J., Atkinson A., and Rees, A. P.: Close coupling between ammonium uptake by phytoplankton and excretion by Antarctic krill, Euphausia superba, Deep-Sea Res., 58, 725–732, https://doi.org/10.1016/j.dsr.2011.03.006, 2011.
Whitehouse, M. J., Atkinson, A., Korb, R. E., Venables. H. J., Pond, D. W., and Gordon, M.: Substantial primary production in the land-remote region of the central and northern Scotia Sea, Deep-Sea Res. Pt. II, 59–60, 47–56, https://doi.org/10.1016/j.dsr2.2011.05.010, 2012.
Whitehouse, M. J., Hendry, K. R., Tarling, G. A., Thorpe, S. E., and ten Hoopen, P.: Macronutrient, temperature and salinity measurements made around the island of South Georgia and the wider Scotia Sea, the Antarctic Peninsula, and in the Bellingshausen Sea between 1980 and 2009 (Version 1.0), NERC EDS UK Polar Data Centre [data set], https://doi.org/10.5285/4014370F-8EB2-492B-A5F3-6DC68BF12C1E, 2022.
Woodley, V. R.: A user-friendly software interface for a program using a digitizer in automated seawater nutrient analysis, diploma dissertation, University of Cambridge, Cambridge, UK, 46 pp., 1989.
Young, E. F., Meredith, M. P., Murphy, E. J., and Carvalho, G. R.: High-resolution modelling of the shelf and open ocean adjacent to South Georgia, Southern Ocean, Deep Sea Res. Pt. II, 58, 1540–1552, https://doi.org/10.1016/j.dsr2.2009.11.003, 2011.
Young, E. F., Thorpe, S. E., Banglawala, N., and Murphy, E. J.: Variability in transport pathways on and around the South Georgia shelf, Southern Ocean: Implications for recruitment and retention, J. Geophys. Res.-Oceans, 119, 241–252, https://doi.org/10.1002/2013JC009348, 2014.