the Creative Commons Attribution 4.0 License.
the Creative Commons Attribution 4.0 License.
 | 16 May 2023
Panta Rhei benchmark dataset: socio-hydrological data of paired events of floods and droughts
Heidi Kreibich
Kai Schröter
Giuliano Di Baldassarre
Anne F. Van Loon
Maurizio Mazzoleni
Guta Wakbulcho Abeshu
Svetlana Agafonova
Amir AghaKouchak
Hafzullah Aksoy
Camila Alvarez-Garreton
Blanca Aznar
Laila Balkhi
Marlies H. Barendrecht
Sylvain Biancamaria
Liduin Bos-Burgering
Chris Bradley
Yus Budiyono
Wouter Buytaert
Lucinda Capewell
Hayley Carlson
Yonca Cavus
Anaïs Couasnon
Gemma Coxon
Ioannis Daliakopoulos
Marleen C. de Ruiter
Claire Delus
Mathilde Erfurt
Giuseppe Esposito
Didier François
Frédéric Frappart
Jim Freer
Natalia Frolova
Animesh K. Gain
Manolis Grillakis
Jordi Oriol Grima
Diego A. Guzmán
Laurie S. Huning
Monica Ionita
Maxim Kharlamov
Dao Nguyen Khoi
Natalie Kieboom
Maria Kireeva
Aristeidis Koutroulis
Waldo Lavado-Casimiro
Hong-Yi Li
Maria Carmen LLasat
David Macdonald
Johanna Mård
Hannah Mathew-Richards
Andrew McKenzie
Alfonso Mejia
Eduardo Mario Mendiondo
Marjolein Mens
Shifteh Mobini
Guilherme Samprogna Mohor
Viorica Nagavciuc
Thanh Ngo-Duc
Huynh Thi Thao Nguyen
Pham Thi Thao Nhi
Olga Petrucci
Nguyen Hong Quan
Pere Quintana-Seguí
Saman Razavi
Elena Ridolfi
Jannik Riegel
Md Shibly Sadik
Nivedita Sairam
Elisa Savelli
Alexey Sazonov
Sanjib Sharma
Johanna Sörensen
Felipe Augusto Arguello Souza
Kerstin Stahl
Max Steinhausen
Michael Stoelzle
Wiwiana Szalińska
Qiuhong Tang
Fuqiang Tian
Tamara Tokarczyk
Carolina Tovar
Thi Van Thu Tran
Marjolein H. J. van Huijgevoort
Michelle T. H. van Vliet
Sergiy Vorogushyn
Thorsten Wagener
Yueling Wang
Doris E. Wendt
Elliot Wickham
Long Yang
Mauricio Zambrano-Bigiarini
Philip J. Ward
As the adverse impacts of hydrological extremes increase in many regions of the world, a better understanding of the drivers of changes in risk and impacts is essential for effective flood and drought risk management and climate adaptation. However, there is currently a lack of comprehensive, empirical data about the processes, interactions, and feedbacks in complex human–water systems leading to flood and drought impacts. Here we present a benchmark dataset containing socio-hydrological data of paired events, i.e. two floods or two droughts that occurred in the same area. The 45 paired events occurred in 42 different study areas and cover a wide range of socio-economic and hydro-climatic conditions. The dataset is unique in covering both floods and droughts, in the number of cases assessed and in the quantity of socio-hydrological data. The benchmark dataset comprises (1) detailed review-style reports about the events and key processes between the two events of a pair; (2) the key data table containing variables that assess the indicators which characterize management shortcomings, hazard, exposure, vulnerability, and impacts of all events; and (3) a table of the indicators of change that indicate the differences between the first and second event of a pair. The advantages of the dataset are that it enables comparative analyses across all the paired events based on the indicators of change and allows for detailed context- and location-specific assessments based on the extensive data and reports of the individual study areas. The dataset can be used by the scientific community for exploratory data analyses, e.g. focused on causal links between risk management; changes in hazard, exposure and vulnerability; and flood or drought impacts. The data can also be used for the development, calibration, and validation of socio-hydrological models. The dataset is available to the public through the GFZ Data Services (Kreibich et al., 2023, https://doi.org/10.5880/GFZ.4.4.2023.001).
- Article
(1012 KB) - Full-text XML
- BibTeX
- EndNote


The Panta Rhei initiative of the International Association of Hydrological Sciences (IAHS) aims to increase our knowledge of interactions and feedback between hydrological and social processes. Panta Rhei research focuses on understanding and modelling spatial and temporal dynamics of human–water systems in order to inform water management and hydrological risk reduction under global change while supporting the achievement of water-related sustainability goals (Montanari et al., 2013; McMillan et al., 2016; Di Baldassarre et al., 2019). In particular, a large amount of work in Panta Rhei has focused on floods and droughts and their interplay with human societies.
In recent decades, flood and drought impacts have been significantly increasing in many regions of the world (Bouwer, 2011; Stahl et al., 2016), even where flow regimes are heavily engineered and regulated by dams, reservoirs, and other infrastructure (Razavi et al., 2020; Van Loon et al., 2022). Due to complex human–water system interactions, the attribution of trends in flood and drought impacts is particularly challenging (Merz et al., 2012a; Van Loon et al., 2016). For instance, trend analyses of flood impacts revealed that the observed increase in impacts is dominated by an increase in exposure, although changes in hazard, driven by climate change, may play a role as well (Bouwer, 2011; Merz et al., 2012b). It is suggested that climate signals leading to an increase in hazard might be masked by a counteracting decrease in vulnerability due to human interventions (Di Baldassarre et al., 2015; Jongman et al., 2015; Mechler and Bouwer, 2015). Vulnerability can be positively influenced by risk management practices, but it can also be negatively influenced, for example by the use of more water-sensitive building materials (floods) or more water-stress-sensitive crop types (droughts) (De Ruiter et al., 2021; Kuhlicke et al., 2020; Ward et al., 2020). Few datasets are available on the temporal dynamics of vulnerability and its influence on impacts (Bubeck et al., 2012; De Ruiter and Van Loon, 2022).
There is an urgent need to detect trends in hazard, exposure, and vulnerability, and their joint effects on impacts, in order to understand and, in turn, model and project the dynamics of flood and drought risks (e.g. Sairam et al., 2019; Ward et al., 2020). However, due to a lack of empirical data, little is known about trends in flood and drought impacts and their causes (Kreibich et al., 2019). Impact data are seldom available, and, when present, they are highly fragmented and uncertain (Downton and Pielke, 2005; Gall et al., 2009; Hayes et al., 2011; Stahl et al., 2016; Kron et al., 2012).
Some trend analyses of impact data have been undertaken at continental (Barredo, 2009) and global scales (Neumayer and Barthel, 2011), since sufficient data about events and related impacts are available at such large spatial scales. Yet, these studies cannot disentangle the changes in exposure and vulnerability that influence impacts (Bouwer, 2011; Merz et al., 2012a). For such detailed analyses, case studies need to be assessed from a socio-hydrologic perspective (Mostert, 2018).
The objective of this paper is to present a Panta Rhei dataset of paired events, i.e. two floods or two droughts that occurred in the same area. The dataset contains data of 45 paired events in 42 study areas encompassing different socio-economic and hydro-climatic conditions. The benchmark dataset includes detailed reports of events and key processes between events, an overview table of key data for all events, and a table of indicators of change indicating the differences between the first and second event of each pair. The innovation and advantages of the dataset lie in its ability to allow detailed context- and location-specific assessments based on the extensive data and reports on each study area and in turn to allow indicator-based comparative analyses across all paired events. A challenge is the heterogeneity of the data in relation to the different hazard types and monitoring approaches in the study areas, which prevents a quantitative comparison between the 45 paired events. A first comparative analysis based on the dataset revealed the general pattern that risk management normally reduces the impacts of floods and droughts but faces difficulties in reducing the impacts of unprecedented events of a magnitude not experienced before (Kreibich et al., 2022). In addition, three risk management success factors were identified based on a detailed analysis of two success stories (Kreibich et al., 2022). Additionally, this dataset has the potential to support the development of models that simulate the dynamics of flood and drought risks generated by the interplay of social and hydrological processes. As such, the dataset can support solving 1 of the 23 unsolved problems in hydrology (Blöschl et al., 2019); namely, “how can we extract information from available data on human and water systems in order to inform the building process of socio-hydrological models and conceptualizations?”
The concept of collecting and analysing paired events of floods and droughts has been developed in two preceding studies. The Panta Rhei working group, “Changes in flood risk”, has previously undertaken a comparative paired-event study (Kreibich et al., 2017). Eight risk reduction success stories were compiled, i.e. paired events where the second flood caused significantly lower impact in comparison with the first flood in the same catchment. Subsequently, together with the Panta Rhei working group, “Drought in the Anthropocene”, the extended concept for the collection of paired events of floods and droughts was developed and presented in the opinion paper How to improve attribution of changes in drought and flood impacts (Kreibich et al., 2019).
2.1 Definitions and concept of paired events of floods and droughts
Floods can be defined as the “temporary covering by water of land not normally covered by water” (EC, 2007) or as water levels higher than a defined maximum (Blöschl et al., 2015). The main types of floods are coastal floods caused by storm surges, inland pluvial floods, riverine floods, and flash floods, which are usually caused by heavy precipitation, sometimes in combination with snowmelt, ice jams, high soil moisture, or high groundwater levels (e.g. Danard et al., 2003; Gaume et al., 2009; Skougaard Kaspersen et al., 2015; Tarasova et al., 2019; Stein et al., 2019). In contrast, drought can be defined using a precipitation deficiency threshold over a predetermined period of time (WMO, 2006) or more generally as an exceptional lack of water compared to normal conditions (Van Loon et al., 2016). Besides precipitation, temperature can also play an important role as a driver of droughts, either in relation to evapotranspiration or to changes in snow accumulation and melt (e.g. Teuling et al., 2013; Staudinger et al., 2014; Huning and AghaKouchak, 2018, 2020). Droughts are typically categorized into three types, propagating in the following order: meteorological, soil moisture, and hydrological drought (Wilhite and Glantz, 1985; Tallaksen and Van Lanen, 2004).
Flood and drought risks and their impacts are determined by hazard, exposure, and vulnerability (UNDRR, 2017). Hazard is a process, phenomenon, or human activity that may cause loss of life, injury or other health impacts, property damage, social and economic disruption, or environmental degradation; exposure is the situation of people, infrastructure, housing, production capacities, and other tangible human assets located in hazard-prone areas; and vulnerability is the conditions determined by physical, social, economic, and environmental factors or processes which increase the susceptibility of an individual, a community, assets, or systems to the impacts of hazards (UNDRR, 2017). Impacts, e.g. direct impacts such as fatalities or monetary impacts but also indirect and intangible impacts such as microbial infection (De Man et al., 2014), are a manifestation of risk (EC, 2017). The purpose of risk management is to reduce the impact of events by modifying the hazard, exposure, and/or vulnerability. It is defined as the application of disaster risk reduction policies and strategies to prevent new disaster risk, reduce existing disaster risk, and manage residual risk, contributing to the strengthening of resilience and reduction of disaster losses (UNDRR, 2017).
An important challenge of trend analyses of extremes is that every event, region, situation, etc. is unique and has its own characteristics and processes. The concept of paired events aims to reduce this heterogeneity by analysing comparable events of the same event type (e.g. two riverine floods or two meteorological droughts) that occurred in the same catchment or region (Kreibich et al., 2017, 2022). This concept is analogous to the one of paired catchment studies, which is well established in hydrology and can be used to determine the magnitude of water yield variations resulting from changes in vegetation (Brown et al., 2005). The same concept has also been used for analysing whether changes in flood discharge can be attributed to changes in land use (Prosdocimi et al., 2015) and to disentangle the role of natural and human drivers of hydrological drought severity (Van Loon et al., 2019).
2.2 Data acquisition
The development of this Panta Rhei benchmark dataset of socio-hydrological data of paired events of floods and droughts was driven by a core group of five people (Heidi Kreibich, Kai Schröter, Giuliano di Baldassarre, Anne Van Loon, and Philip Ward) from the Panta Rhei working groups “Changes in flood risk” and “Droughts in the Anthropocene”. The aim was to collect data on paired events of pluvial, riverine, groundwater, and coastal floods and of meteorological, soil moisture, and hydrological droughts. For drought paired events, authors could choose to provide hazard data relative to one drought type (meteorological, soil moisture, hydrological) or even two or three types, depending on the data available and/or the focus on specific impacted sectors. In contrast to the previous paired-event data compilation which contained eight flood paired events (Kreibich et al., 2017), the collection of paired flood or drought events was not limited to success stories but aimed to compile a set of diverse and contrasting cases.
The campaign to collect data on paired events started at the EGU General Assembly in April 2019 in Vienna and was continued with talks promoting the paired-event data collection at the international conferences KOSMOS (August 2019), REKLIM (September 2019), System-Risk (September 2019), and INQUIMUS (November 2019). Communication with the Panta Rhei community and other flood and drought experts identified through a snowballing technique was important. Thus, data on paired events were provided by professionals with excellent local knowledge of the events and risk management practices. The academics and practitioners involved were either based in the study areas or worked with local partners (data providers are all co-authors of this paper).
Based on templates (provided in the Appendix of the data description; Kreibich et al., 2023), detailed review-style reports describing the events and key processes between events in the study areas were collected, with a focus on characterizing impacts, management, hazard, exposure, and vulnerability. The paired-event reports are between 3 and 18 pages long and are structured in the following sections: (1) short description of events with a focus on impacts, (2) descriptions of processes between events with a focus on risk management, (3) event comparison in respect to hazard, (4) event comparison in respect to exposure, (5) event comparison in respect to vulnerability, (6) summary, and (7) references. The reports contain qualitative and quantitative information and data. Qualitative information includes e.g. the description of risk management, and quantitative information includes e.g. the amount of discharge or the number of fatalities.
2.3 Data processing and quality assurance
The processes implemented to assure data quality followed the Delphi method (Okoli and Pawlowski, 2004), which is built on structured discussion and consensus building among experts. First, an internal review process of the collected reports was undertaken by the core group for quality assurance, homogenization, and data gap filling. Each paired-event report was reviewed by two experts from the core group. Firstly, it was important to ensure that there are sufficient information and data in the reports to comprehensively characterize management shortcomings, hazard, exposure, vulnerability and impacts of both events in the study area. Secondly, the information and data provided for the first and second events of a pair must be comparable. This means that, if possible, the same variables must be used for characterizing both events. For instance, if the Standardized Precipitation Index (SPI-12) is used to assess the severity of the first drought, it should also be used for the second drought of the pair.
Based on the review-style reports, two further datasets were developed, namely the key data table and the indicators of change, which were compiled in a second table.
2.3.1 Compilation of key data
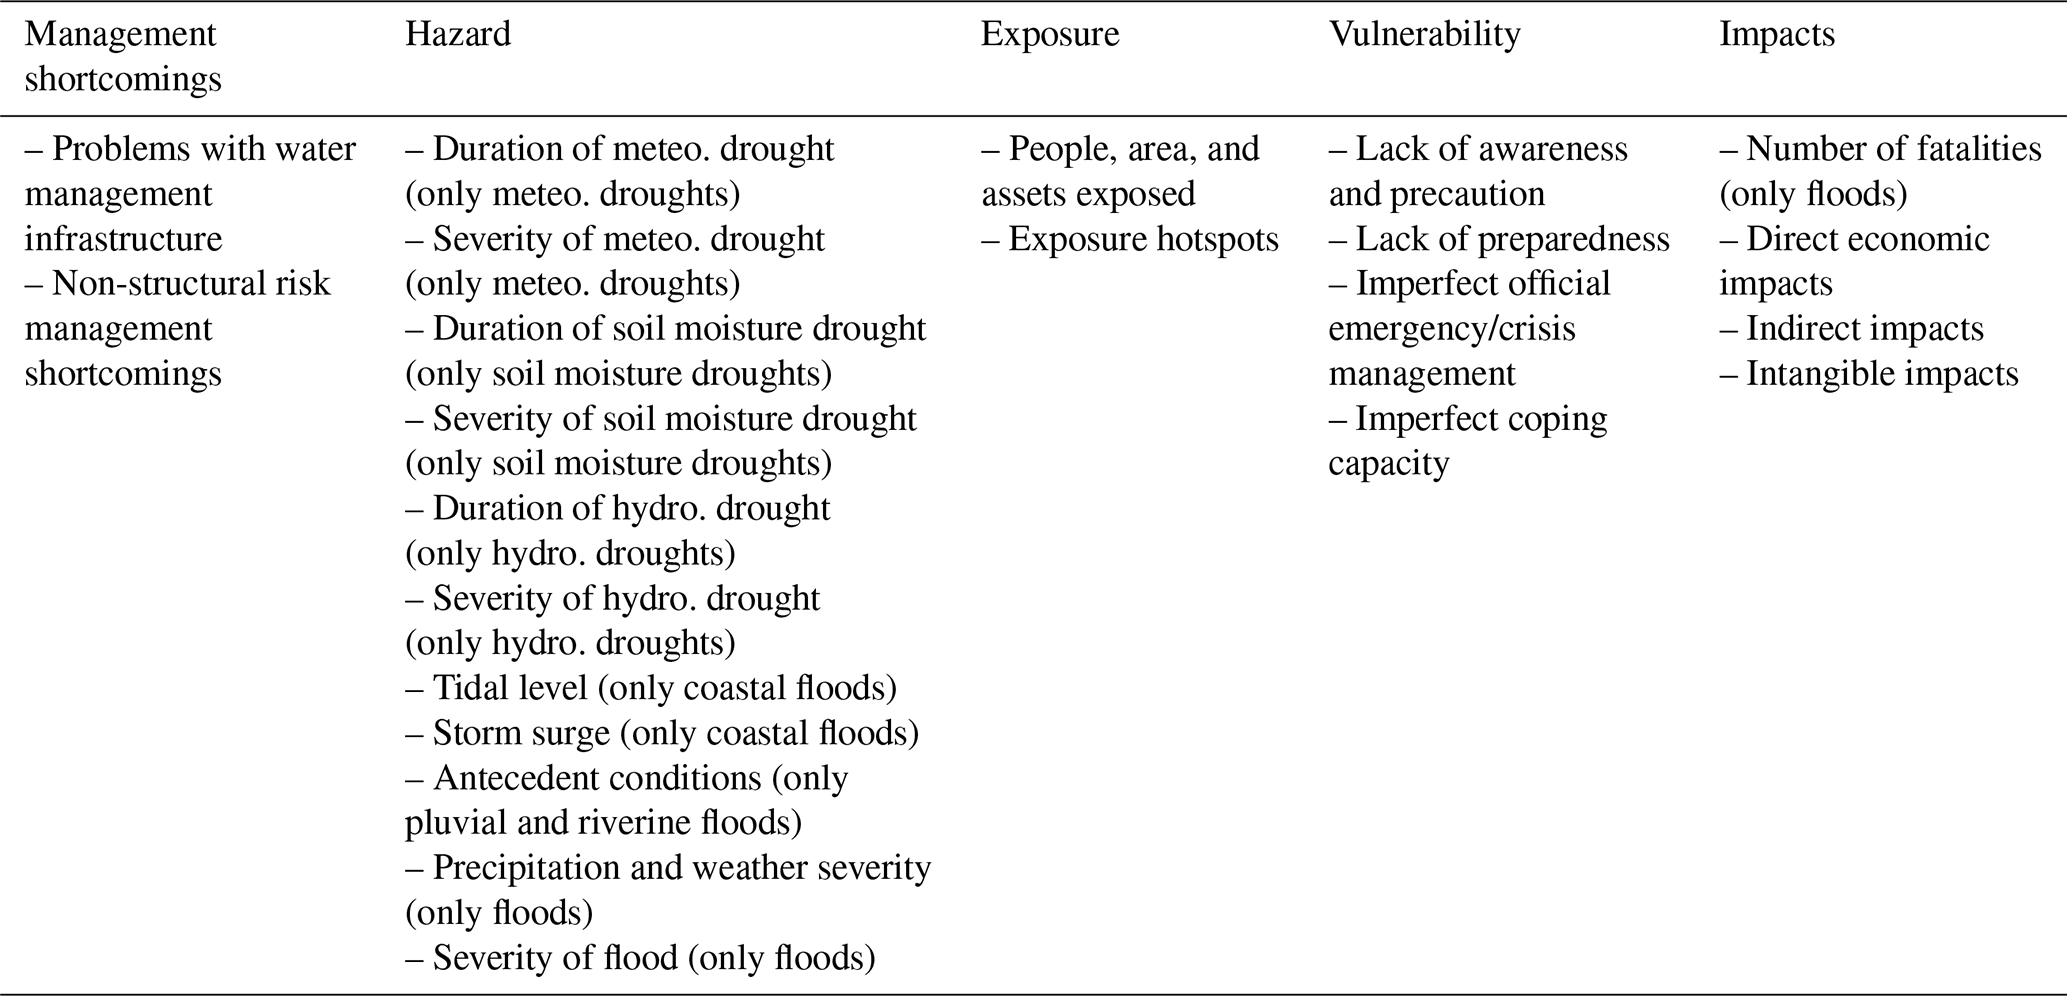
The core group developed the key data table. This means that information and data were compiled to assess various indicators characterizing management shortcomings, hazard, exposure, vulnerability, and impacts (Table 1). As far as possible, the same indicators were used for all event types. For management shortcomings, exposure, and vulnerability, the indicators are the same for all event types. The impact indicators are the same, except for number of fatalities which was not used for droughts, since in our cases fatalities during drought events were not caused by lack of water but by a concurrent heatwave. Necessarily, the hazard indicators are different, not only between floods and droughts, but also e.g. between coastal floods and riverine floods (Table 1).
Table 1Indicators characterizing management shortcomings, hazard, exposure, vulnerability, and impacts of flood and drought events. In general, the indicators are relevant for all event types. If an indicator is only relevant for certain event types, this is indicated in brackets. These indicators are column headers in the key data table.
Commonly, more than one variable is provided per indicator, e.g. extreme rainfall at several meteorological stations to assess the severity of pluvial floods. Examples of how to describe or measure variables to assess the indicators of flood and drought impacts, hazard, exposure, vulnerability, and management shortcomings are provided in the data description (Kreibich et al., 2023). For the assessment of the indicators, the same variables resulting from comparable measurements are used for both events of a pair as far as possible. Thus, variables compiled for the first and second event of a pair are comparable. However, the variables and the data quality differ strongly between the paired events and study areas due to the different event types, monitoring facilities, and detailedness of event documentations. This data heterogeneity makes comparative analyses across the paired events challenging.
Our aim was to compile data on the events that are as complete as possible. As peer-reviewed data sources were not always available for all indicators of impacts, hazard, exposure, vulnerability, and management shortcomings of all events, we also resorted to, for example, newspaper articles or expert knowledge. For transparency reasons, and to give data users the opportunity to judge the quality of the data themselves, data source information (citations, references) is also compiled in the key data table. According to our personal assessment, the sources of the data are categorized in descending quality as follows: scientific study (peer-reviewed paper and PhD thesis), report (by governments, administrations, non-governmental organizations (NGOs), research organizations, projects), own analysis by authors based on database (e.g. official statistics, monitoring data such as weather, discharge data), newspaper article, and expert judgement.
The data compiled in the key data table were first individually quality checked by the respective data providers (i.e. report authors) for each paired event. In a second step, the whole key data table was reviewed by all authors to improve homogeneity across paired events.
2.3.2 Assignment of indicators of change
On the basis of the key data table, indicators of change between the first and second event of a pair were assigned to enable comparative analyses across the paired events. All indicators of change were designed such that consistently positive correlations with impact changes are expected, e.g. lack of awareness and precaution. Thus, a decrease in lack of awareness and precaution is expected to lead to a decrease in impacts and relates to a decrease in vulnerability. The first event was used as the baseline. The changes are indicated as follows, using a Likert scale ranging from −2 to 2. Values of −2 and 2 indicate a large decrease and large increase, respectively. Values of −1 and 1 indicate a small decrease and small increase, respectively, and a value of 0 indicates no change. In cases where more variables are associated with an indicator, a combination or selection of the variables was used for the derivation of the indicator of change based on hydrological reasoning on the most relevant piece of information. In the case of quantitative variables (e.g. precipitation intensities), commonly a change of less than 50 % is treated as small and above 50 % as large. For drought paired events, if more hazard indicators on different drought types (i.e. meteorological, soil moisture, and hydrological drought) are provided, these were taken together to get an overall assessment of change in drought duration and severity. If the drought types showed different behaviour, the most representative value was chosen. The development of the indicators of change had to take into account expert judgements that considered the whole context of the paired event. Representative examples are provided from flood and drought paired events showing how differences in quantitative and qualitative variables between the two events of a pair correspond to the values of the indicators of change (data description of Kreibich et al., 2023).
Additionally, five summary indicators of change were derived for management shortcomings, hazard, exposure, vulnerability, and impacts to enable an easy comparison between flood and drought paired events. These summary indicators of change were derived by qualitatively comparing and integrating the values of their related indicators of change, according to Table 1. For instance, the summary indicator of change of exposure is derived from the two indicators of change of people, area, and assets exposed and exposure hotspots.
Indicators of change were assigned in an iterative process following a quality assurance protocol: for each paired event, first a core group member suggested values for the indicators of change and, consequently, the five summary indicators of change based on the key data table. Next, another member of the core group reviewed these suggestions. In case of doubt, both core group members again checked the variables in the key data table and the paired-event report and provided a joint suggestion. All suggested values for the indicators of change for all paired events were discussed in the core group to assure comparability across paired events. Then, again individually per paired event, the suggested values of the indicators of change were cross-checked with the respective data providers (i.e. report authors of the paired event). Finally, the completed table of indicators of change was reviewed again by all authors to improve homogeneity across paired events.
3.1 Overview of paired events
In total, 45 paired events of floods and droughts from all over the world were collected in 42 study areas (Table 2). In three study areas, we have data on three flood events that formed two paired events, e.g. pluvial floods in 2007, 2010, and 2014 in Malmö, Sweden, with the first paired event of pluvial floods in Malmö 2007 and 2010 (paired-event ID 27), and the second paired event of pluvial floods in Malmö 2010 and 2014 (paired-event ID 45). Our dataset includes 26 flood and 19 drought paired events. Most events occurred between 1970 and 2019, with three exceptions: the drought in 1947 in south-west Germany; the riverine flood in 1951 in Kansas, USA; and the riverine flood in 1963 at the Baiyangdian River, China (Table 2). The average time between the two events of a pair is 16 years with a range of 1 to 71 years. The geographical distribution of the paired events encompasses 3 paired events in South America, 7 in North America, 2 in Africa, 22 in Europe, 10 in Asia, and 1 in Australia (Fig. 1).
Table 2Overview of paired events, sorted according to the summary indicator of change of impacts.
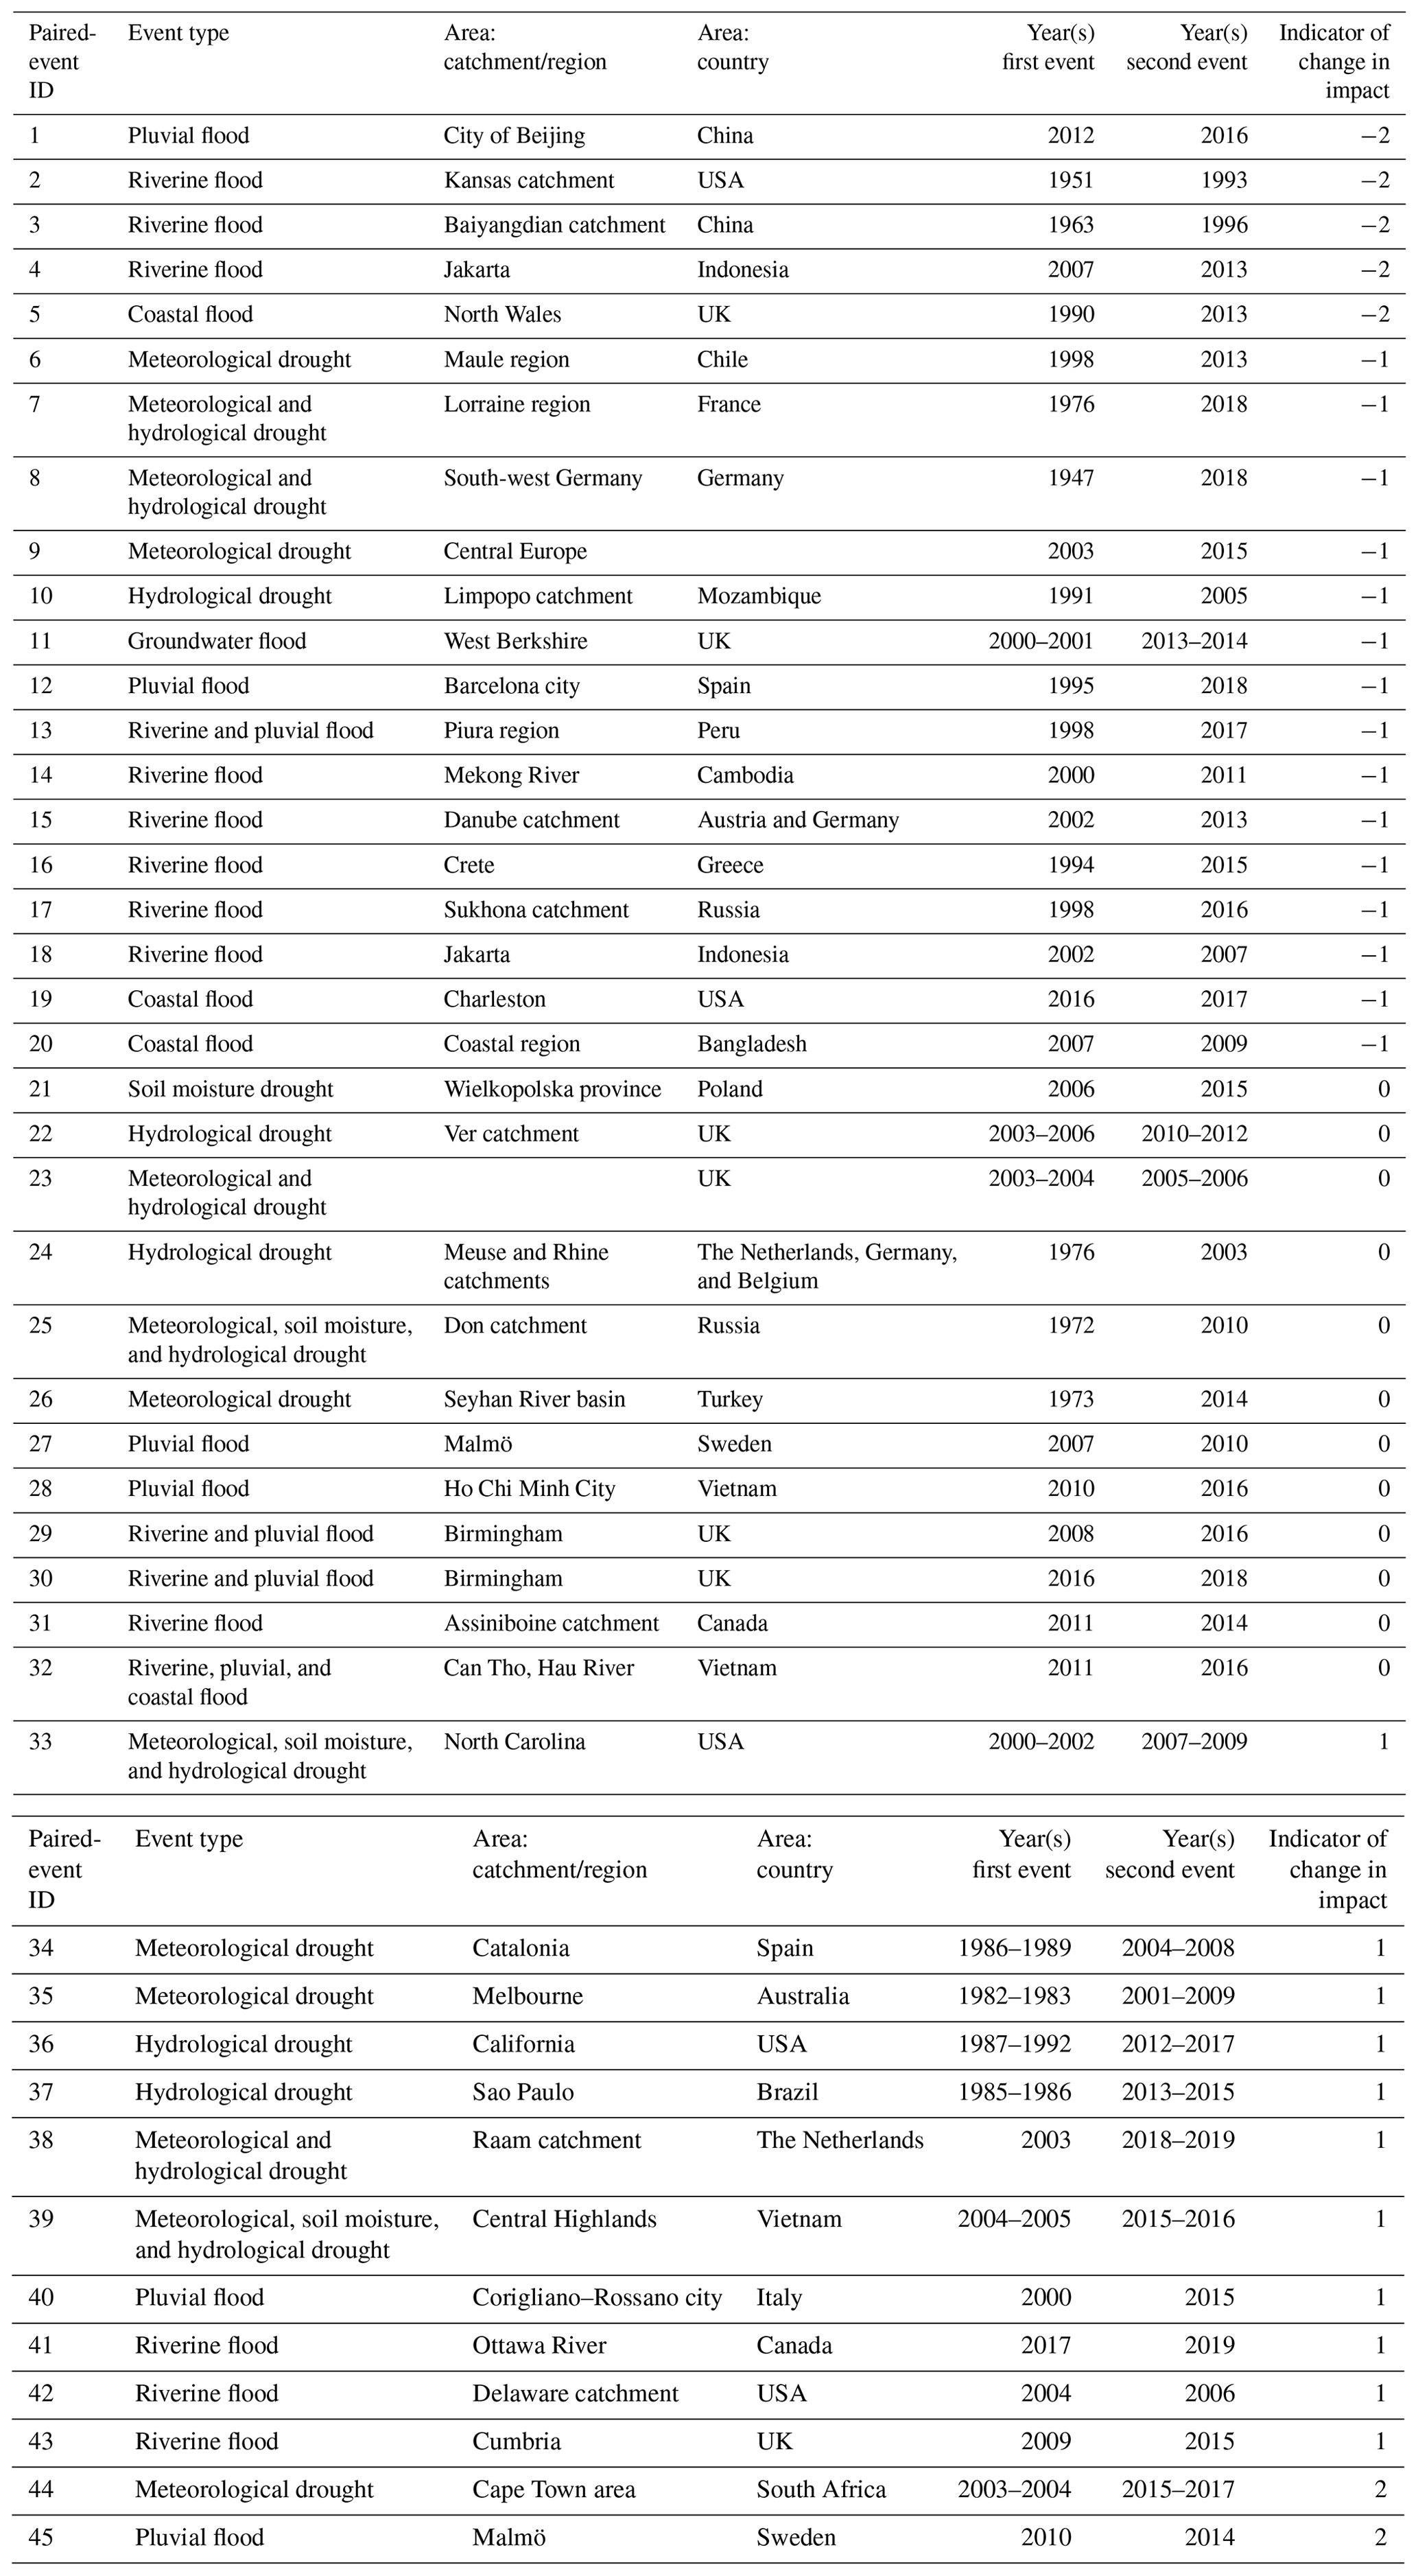
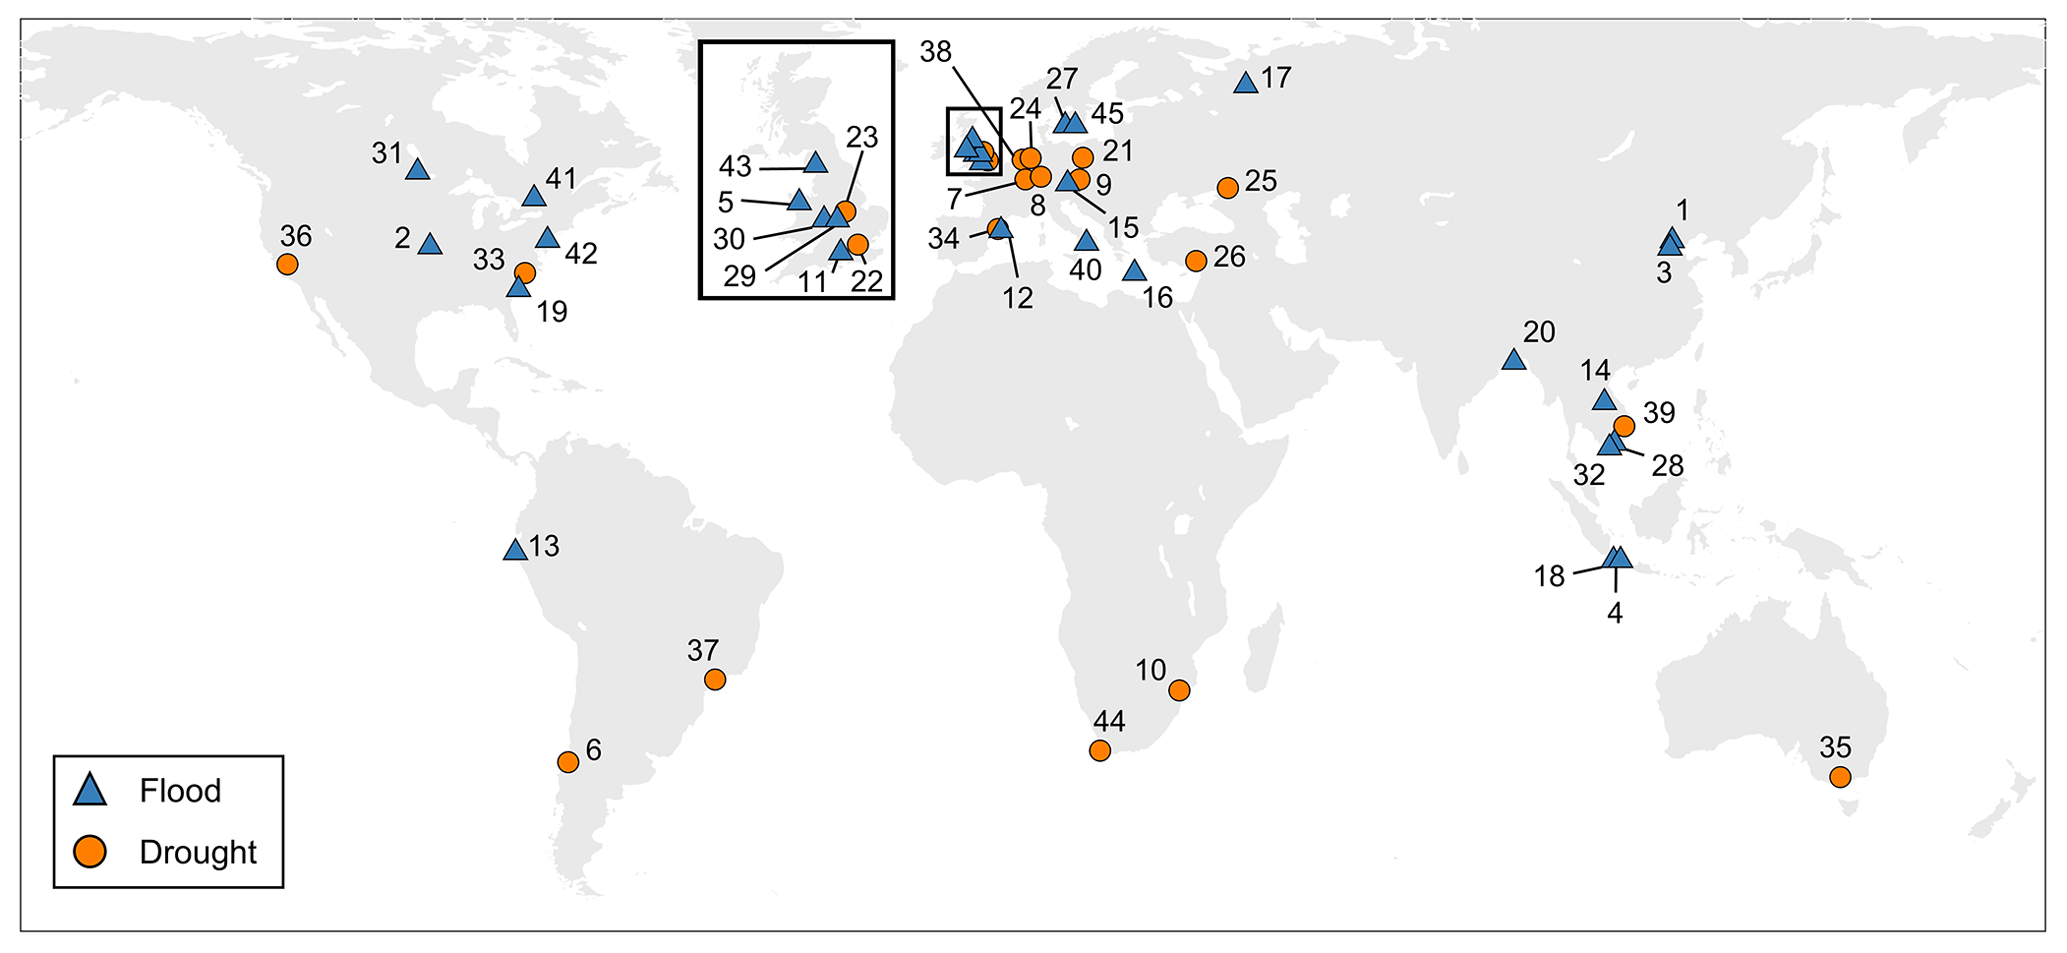
Figure 1Geographical distribution of the paired events; numbers represent the IDs of the paired events.
3.2 Content of the Panta Rhei benchmark dataset
The dataset comprises (1) the paired-event reports, i.e. review-style reports about the events and key processes between the events, particularly with respect to changes in risk management; (2) the key data table containing variables that assess the indicators which characterize management shortcomings, hazard, exposure, vulnerability, and impacts of all events; and (3) the table containing the indicators of change, including the summary indicators of change. These three parts of the dataset are described in detail in the following sections.
3.2.1 Paired-event reports
The reports about the paired events are all written in the style of review papers; i.e. they primarily compile and analyse available information and data from various sources about the events and key processes between the events. For some reports, the authors also undertook their own analyses and included statements based on their expert judgement. The reports are between 3 and 18 pages long and are structured in the following sections: (1) short description of both events with a focus on impacts, (2) description of processes between events with a focus on risk management, (3) event comparison in respect to hazard, (4) event comparison in respect to exposure, (5) event comparison in respect to vulnerability, (6) summary, and (7) references. In the three cases where we have three events, i.e. two paired events in one study area, all three events and processes between events are described in one report. Thus, the dataset contains 43 reports which enable detailed contextual insights into physical and socio-economic changes between the paired drought or flood events in an area.
3.2.2 Key data table
The key data table is an Excel file with the following two spreadsheets: (1) key data, which contain the data of the flood and drought paired events, and (2) references, which contain the references cited in the key data spreadsheet, separated by paired events and linked via the paired-event IDs.
The key data spreadsheet is structured as follows: the first columns identify and roughly characterize the paired event and study area; i.e. their headers are paired-event ID, event type, area: catchment/region, area: country, and year of event. The following columns contain the data (every second column) and the category of the data source (every second column). The data columns contain variables that assess the management shortcomings, hazard, exposure, vulnerability, and impact indicators, structured in analogue to Table 1. Citations leading to the source of the data are included, e.g. citation of a scientific paper. In the following column, the category of the data source is provided to give data users the opportunity to judge the quality of the data themselves. Two rows always belong to one paired event; the first line contains the information of the first event, and the second line contains the information of the second event. The variables compiled for the first and second event of a pair are comparable; i.e. the same variables resulting from comparable measurements are provided as far as possible. Any missing data which could not be retrieved for the specific event are indicated as not available (NA). The indicators which are not relevant for the specific event type are indicated as not relevant (NR).
The reference spreadsheet contains the following columns: paired-event ID, DOI, web link, accessed (web link), and references. If possible, DOIs are given, which is mainly the case for scientific studies. Otherwise, the web link is given if possible; this is often the case for reports. In these cases, additionally the date is provided on which the data source provided via a web link was last accessed. References are provided for all citations contained in the key data spreadsheet; this is mainly the case for scientific study and report categories of the data source.
3.2.3 Table of indicators of change
The table containing the indicators of change is structured in analogue to the key data spreadsheet of the key data table. Differences are the following: (1) the indicators of change characterizing drought hazard are aggregated into two indicators of change, duration of drought and severity of drought, for all drought types; (2) the five summary indicators of change are additionally included; and (3) each event pair is represented by one row, since the indicators of change represent the difference between the data of the first event (first row of paired event in key data) and of the second event (second row of paired event in key data).
Overall, the flood and drought paired events have similar amounts of data availability for the indicators of change, with only 12 % and 14 % NA values respectively. However, for both floods and droughts, data on indirect and intangible impacts are scarce (Fig. 2). For droughts, hazard and exposure data are readily available, while data on coping capacity are scarce. Additionally, storm surge data for coastal floods are scarce (Fig. 2).

Figure 2Fraction of entries (in %) (in contrast to NA values) for each indicator of change of flood (a) and drought (b) paired events.
Across all paired events, a small decrease and no change were the most common values across all summary indicators of change, with 43 % and 25 % respectively (Fig. 3). Large changes () are rare, with counts below 10 % across all indicators of change. Changes in hazard, exposure, and impact show a relatively even distribution (except for large changes), whereas changes in vulnerability and management shortcomings mainly show a decrease.
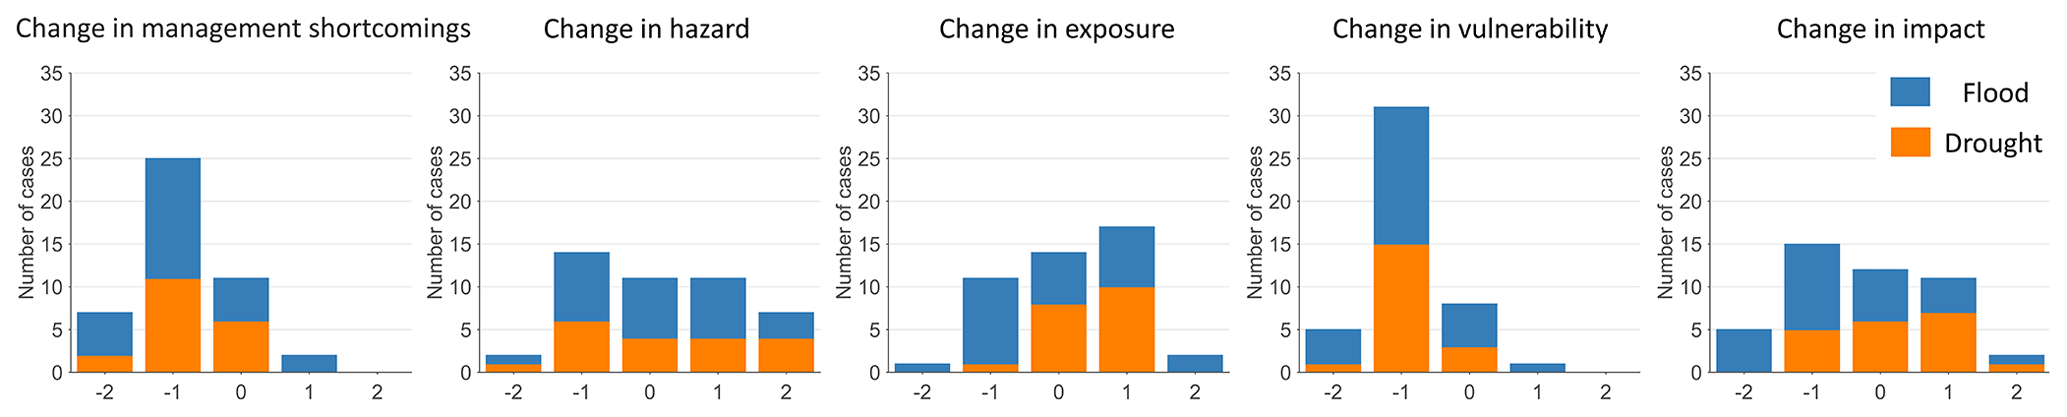
Figure 3Histograms of summary indicators of change for flood and drought paired events, indicating large decrease or increase (), small decrease or increase (), and no change (0) between the first and the second event.
Differences between the collected flood and drought paired events are apparent for exposure and impacts. Flood paired events include one pair with a large decrease in exposure, two pairs with a large increase in exposure and a rather even distribution across small decreases, and no change and a small increase for the rest of the pairs. However, most common is a small decrease in exposure, apparent in 38 % of the flood paired events. In contrast, no large changes () and only one pair with a small decrease in exposure occurred among the drought paired events. Most common is a small increase in exposure, reported in 53 % of the drought paired events, with the remaining 42 % reporting no change in exposure. In five flood paired events, a large decrease in impacts was reported, and many flood paired events showed a small decrease in impacts (38 %). In the collected drought paired events, no large decrease in impacts occurred, and most common is a small increase in impacts (37 %).
The presented dataset supports detailed context- and location-specific assessments of the paired events, based on the paired-event reports and the key data table. Based on the descriptions and the comparable variables per paired event that characterize the management shortcomings, hazard, exposure, vulnerability, and impacts, it is possible to qualitatively attribute changes in impact to their drivers and identify successful or unsuccessful risk management strategies. During the first data analyses, only two paired events, i.e. pluvial floods in Barcelona, Spain, and riverine floods in Danube catchment in Germany and Austria, were analysed in detail and successful risk management strategies identified (Kreibich et al., 2022). This leaves a lot of room for further detailed analyses, e.g. of drought success stories (e.g. droughts in the Wielkopolska province in Poland and in the Don River catchment in Russia), or impact attribution studies. Detailed suggestions for the attribution of changes in drought and flood impacts are provided by Kreibich et al. (2019).
While the variables describing the first and second event of a pair are comparable, variables and data quality differ strongly between the paired events. The great heterogeneity of data and events represents both the strength and the weakness of the Panta Rhei dataset with regard to comparative analyses. As quantitative comparative analyses across all paired events are impossible, such analyses can only be undertaken on the basis of the indicators of change. Although these indicators were created with great care according to the quality assurance protocol, they are subject to uncertainties and caution is required when interpreting the results. Still, such comparative analyses are analogous to other comparative studies in hydrology, which have shown their value especially for obtaining more generic, transferable results (Duan et al., 2006; Blöschl et al., 2013). Conclusions can be drawn about the attribution of impacts or the effectiveness of risk management, based on common patterns of the paired events across socio-economic and hydro-climatic situations. During the first data analyses, only the five summary indicators of change for management shortcomings, hazard, exposure, vulnerability, and impact were analysed. So, there is still much scope for further more detailed comparative analysis by including all indicators of change. Examples of comparative analyses of socio-hydrological data of paired events are provided by Kreibich et al. (2017, 2022).
The table of key data can further support the development of socio-hydrological models individually per paired event. The empirical data available for two points in time (i.e. first data points – data of first event in first row of paired event, and second data points – data of second event in second row of paired event) can be used to estimate the parameters of socio-hydrological flood or drought risk models through Bayesian inference (Barendrecht et al., 2019; Schoppa et al., 2022). Even better would be if complementary data for some of the variables extended the two points in time to build a time series. This might be rather easily possible for monitored data like precipitation amounts or discharge and statistical data like exposed population or assets. Bayesian inference is suitable for the incorporation of different types of socio-hydrology data, i.e. qualitative and quantitative data, less or more uncertain data, and many data points versus only a few data points (Gelman et al., 2014). The gain of using a socio-hydrological modelling approach in combination with empirical data is that it allows for a consistent interpretation of all available data together, including their interactions (Barendrecht et al., 2019). This approach enables the simulation of historical risk dynamics for the study areas and allows us to inform adaptation planning by exploring the possible system evolutions in the future (Schoppa et al., 2023). The dataset has not yet been used to calibrate socio-hydrological models. Due to the diversity of hazard types and the diverse socio-economic and hydro-climatic situations covered by the 45 paired events from all continents, the table of key data can be used to benchmark the performance of socio-hydrological flood or drought risk models. Examples of how heterogenous socio-hydrological data (e.g. discharge time series, level of protection, settlement density, flood awareness, level of private precaution, direct economic damage) can be used to estimate the parameters of socio-hydrological flood models are provided by Barendrecht et al. (2019) and Schoppa et al. (2022).
The “Panta Rhei benchmark dataset: socio-hydrological data of paired events of floods and droughts (version 2)” is published under the Creative Commons Attribution International 4.0 Licence (CC BY 4.0) via GFZ Data Services (Kreibich et al., 2023, https://doi.org/10.5880/GFZ.4.4.2023.001).
Developing sustainable and efficient risk management strategies under non-stationary conditions requires understanding of the temporal changes of flood and drought impacts and their causes. The comprehensive Panta Rhei dataset presented in this paper can support detailed context- and location-specific assessments of changes in impacts and their drivers and of risk management strategies based on the detailed paired-event reports and key data regarding the individual paired events. The dataset can support indicator-based comparative analyses across all paired events and eventually reveal generic and transferable conclusions in the occurrence of common patterns. Such analyses might be particularly useful to attribute changes in flood and drought impacts, including understanding of the role of human activities and decisions in reducing or exacerbating the impacts of drought and flood events. Ultimately, the dataset can support the development and benchmarking of socio-hydrological models and, as such, can support solving the following unsolved problem in hydrology: “how can we extract information from available data on human and water systems in order to inform the building process of socio-hydrological models and conceptualizations?” (Blöschl et al., 2019).
Additionally, we want to encourage more collection of socio-hydrological data of floods and droughts but also of other water-related phenomena. Such data are scarce but essential to understand spatial and temporal dynamics of human–water systems and inform and support improved water management under global change. The contact author, Heidi Kreibich, will be happy to advise and help with data collection if desired. Templates for the collection of socio-hydrological data on paired events of floods and droughts are provided in the appendix of the data description (Kreibich et al., 2023).
HK initiated the compilation of the Panta Rhei benchmark dataset. HK, KS, GdB, AVL, and PW developed the concept for the data collection (including templates and structure of the data tables); coordinated the data collection; and undertook the internal review process, data quality control, and homogenization. All co-authors contributed data included in the paired-event reports. The authors of each paired-event report are responsible for the data of their case study. MM additionally designed the figures. HK, KS, GdB, AVL, and PW wrote the paper with valuable contributions from all co-authors.
The contact author has declared that none of the authors has any competing interests.
Publisher’s note: Copernicus Publications remains neutral with regard to jurisdictional claims in published maps and institutional affiliations.
The present work was developed by the Panta Rhei working groups “Changes in flood risk” and “Droughts in the Anthropocene” within the framework of the Panta Rhei Research Initiative of the International Association of Hydrological Sciences (IAHS).
The work, particularly data collection, was partly undertaken under the framework of the following entities and projects: Center for Climate and Resilience Research (ANID/FONDAP/1522A0001), joint research project ANID/NSFC190018, project ANID/FSEQ210001, PIRAGUA project funded by FEDER through the POCTEFA Programme of the EU, M-CostAdapt project (FEDER/MICINN-AEI/CTM2017-83655-C2-2-R), project RIESGOS (BMBF, 03G0876B), project DECIDER (BMBF, 01LZ1703G), project FLOOD (01LP1903E) as part of the ClimXtreme Research Network, HUMID project (CGL2017-85687-R, AEI/FEDER, UE), project funded by the US National Science Foundation (EAR no. 1804560), NASA award no. NNX15AC27G and NOAA award no. NA19OAR4310294, CENTA NERC grant (NE/lL002493/1), Groundwater Drought Initiative (NE/R004994/1), MaRIUS and ENDOWS projects funded by NERC grant number NE/L010399/1, NERC RAHU project grant NE/S013210/1, AWI Strategy Fund Project PalEX, Helmholtz Climate Initiative REKLIM, Russian Science Foundation (project no. 19-77-10032), Turkish State Meteorological Service, Formas (grant no. 942-2015-149), Vietnam National University–Ho Chi Minh City under grant number C2018-48-01, Vietnam National Foundation for Science and Technology Development (grant no. 105.06-2019.20), the US National Science Foundation project (EAR #1804560), MSCA ETN System-Risk (grant 676027), the Russian Foundation for Basic Research project (no. 18-05-60021-Arctic), the National Natural Science Foundation of China (grant no. 92047301), CNES TOSCA grant SWHYM, the University of California, Division of Agriculture and Natural Resources California Institute for Water Resources and US Geological Survey (grant no. G21AP10611-00), and a California State University Water Resources and Policy Initiatives grant. David Macdonald and Andrew McKenzie publish with the permission of the Director, British Geological Survey. Funding for their input was provided by UK Research and Innovation (UKRI) National Capability resources, devolved to the British Geological Survey, and through the LANDWISE project (NERC; grant no. NE/R004668/1). Publisher's note: Copernicus Publications has not received any payments from Russian or Belarusian institutions for this paper.
We thank the Barcelona City Council, the Länsförsäkringar Skåne, VA SYD, and the Center for Climate and Resilience Research for valuable data and help with data processing.
Elisa Savelli received funding from the European Research Council (ERC) within the project “HydroSocialExtremes: Uncovering the Mutual Shaping of Hydrological Extremes and Society” (ERC Consolidator Grant, grant no. 771678). Elena Ridolfi was supported by the Centre of Natural Hazards and Disaster Science (CNDS) in Sweden. Thorsten Wagener was partially supported by a Royal Society Wolfson Research Merit Award (WM170042) and by the Alexander von Humboldt Foundation in the framework of the Alexander von Humboldt Professorship endowed by the German Federal Ministry of Education and Research. Jim Freer was partly supported by the Global Water Futures program, University of Saskatchewan. Yonca Cavus was supported by the DAAD “Research Grants – Bi-nationally Supervised Doctoral Degrees/Cotutelle” Program. Hafzullah Aksoy performed a portion of his contribution to this study during his stay at the University of Illinois, Urbana-Champaign, USA, supported by a Fulbright Academic Research Scholarship, Istanbul Technical University (project no. MUA-2019-42094), and the Scientific and Technological Research Council of Turkey (TUBITAK). Dao Nguyen Khoi was supported by the Vietnam National Foundation for Science and Technology Development (grant no. 105.06-2019.20). Qiuhong Tang was supported by the National Natural Science Foundation of China (grant nos. 41730645, 41790424). Philip Ward was supported by the Netherlands Organisation for Scientific Research (NWO) (VIDI; grant no. 016.161.324) and the MYRIAD-EU project, which received funding from the European Union's Horizon 2020 research and innovation programme (grant agreement no. 101003276). Maurizio Mazzoleni was supported by the Swedish Research Council Formas and the Centre of Natural Hazards and Disaster Science (CNDS) in Sweden. Laurie Huning was partially supported by the University of California, Division of Agriculture and Natural Resources California Institute for Water Resources and US Geological Survey (grant no. G21AP10611-00) and a California State University Water Resources and Policy Initiatives grant. Anaïs Couasnon was supported by a VIDI grant from NWO that was awarded to Philip Ward (grant no. 016.161.324). Marleen de Ruiter was supported by the MYRIAD-EU project, which received funding from the European Union's Horizon 2020 research and innovation programme (grant agreement no. 101003276). Animesh K. Gain was financially supported by the Marie Skłodowska Curie Global Fellowship of the European Commission (grant agreement no. 787419) and Murdoch University, Australia. Liduin Bos-Burgering and Marjolein Mens were supported by the Deltares research program on water resources, funded by the Dutch Ministry of Economic Affairs and Climate. Fuqiang Tian was partly supported by the National Natural Science Foundation of China (grant no. 92047301). Johanna Mård was supported by the Centre of Natural Hazards and Disaster Science (CNDS). Wouter Buytaert acknowledges funding from the UK Natural Environment Research Council (grant no. NE/S013210/1). Gemma Coxon was funded by a UKRI Future Leaders Fellowship award 9MR/V022857/10. Saman Razavi, Hayley Carlson, and Laila Balkhi were supported by the Integrated Modelling Program for Canada. Huynh Thi Thao Nguyen was supported by the NUFFIC/NICHE VNM 104 project, which was co-funded by the Netherlands Government and Vietnam National University–Ho Chi Minh City. Michelle van Vliet was financially supported by a VIDI grant (project no. VI.Vidi.193.019) of the Netherlands Scientific Organisation (NWO). Anne Van Loon was supported by the European Research Council (ERC) project “PerfectSTORM: Storylines of future extremes” (ERC-2020-StG 948601). Guta Worku Abeshu and Hong-Yi Li were supported as part of the Energy Exascale Earth System Model (E3SM) project, funded by the US Department of Energy, Office of Science, Office of Biological and Environmental Research. Thanh Ngo-Duc was supported by the Vietnam National Foundation for Science and Technology Development (grant no. 105.06-2021.14). María Carmen Llasat was supported by the C3RiskMed research project (Grant PID2020-113638RB-C22) funded by the Spanish Ministry of Science and Innovation MCIN/AEI/10.13039/501100011033.
This paper was edited by Conrad Jackisch and reviewed by two anonymous referees.
Barendrecht, M. H., Viglione, A., Kreibich, H., Merz, B., Vorogushyn, S., and Blöschl, G.: The value of empirical data for estimating the parameters of a sociohydrological flood risk model, Water Resour. Res., 55, 1312–1336, https://doi.org/10.1029/2018WR024128, 2019.
Barredo, J. I.: Normalised flood losses in Europe: 1970–2006, Nat. Hazards Earth Syst. Sci., 9, 97–104, https://doi.org/10.5194/nhess-9-97-2009, 2009.
Blöschl, G., Sivapalan, M., Wagener, T., Viglione, A., and Savenije, H. (Eds.): Runoff Prediction in Ungauged Basins. Synthesis across Processes, Places and Scales, Cambridge University Press, New York, 465 pp., ISBN: 978-1107028180, 2013.
Blöschl, G., Gaál, L., Hall, J., Kiss, A., Komma, J., Nester, T., Parajka, J., Perdigão, R. A. P., Plavcová, L., Rogger, M., Salinas, J. L., and Viglione, A.: Increasing river floods: fiction or reality?, WIREs Water, 2, 329–344, 2015.
Blöschl, G., Bierkens, M. F., Chambel, A., et al.: Twenty-three unsolved problems in hydrology (UPH) – a community perspective, Hydrolog. Sci. J., 64, 1141–1158, https://doi.org/10.1080/02626667.2019.1620507, 2019.
Bouwer, L. M.: Have disaster losses increased due to anthropogenic climate change?, B. Am. Meteorol. Soc., 92, 39–46, 2011.
Brown, A. E., Zhang, L., McMahon, T. A., Western, A. W., and Vertessy, R. A.: A review of paired catchment studies for determining changes in water yield resulting from alterations in vegetation, J. Hydrol., 310, 28–61, https://doi.org/10.1016/j.jhydrol.2004.12.010, 2005.
Bubeck, P., Botzen, W. J. W., Kreibich, H., and Aerts, J. C. J. H.: Long-term development and effectiveness of private flood mitigation measures: an analysis for the German part of the river Rhine, Nat. Hazards Earth Syst. Sci., 12, 3507–3518, https://doi.org/10.5194/nhess-12-3507-2012, 2012.
Danard, M., Munro, A., and Murty. T.: Storm surge hazard in Canada, Nat. Hazards, 28, 407–431, https://doi.org/10.1023/A:1022990310410, 2003.
De Man, H., Van Den Berg, H. H. J. L., Leenen, E. J. T. M., Schijven, J. F., Schets, F. M., Van Der Vliet, J. C., Van Knapen, F., and De Roda Husman, A. M.: Quantitative assessment of infection risk from exposure to waterborne pathogens in urban floodwater, Water Res., 48, 90–99, https://doi.org/10.1016/j.watres.2013.09.022, 2014.
De Ruiter, M. C. and Van Loon, A. F.: The challenges of dynamic vulnerability and how to assess it, iScience, 25, 104720, https://doi.org/10.1016/j.isci.2022.104720, 2022.
De Ruiter, M. C., De Bruijn, J. A., Englhardt, J., Daniell, J. E., de Moel, H., and Ward, P. J.: The Asynergies of Structural Disaster Risk Reduction Measures: Comparing Floods and Earthquakes, Earth's Future, 9, e2020EF001531, https://doi.org/10.1029/2020EF001531, 2021.
Di Baldassarre, G., Viglione, A., Carr, G., Kuil, L., Yan, K., Brandimarte, L., and Blöschl, G.: Perspectives on socio-hydrology: Capturing feedbacks between physical and social processes, Water Resour. Res., 51, 4770–4781, https://doi.org/10.1002/2014WR016416, 2015.
Di Baldassarre, G., Sivapalan, M., Rusca, M., Cudennec, C., Garcia, M., Kreibich, H., Konar, M., Mondino, E., Mård, J., Pande, S., Sanderson, M. R., Tian, F., Viglione, A., Wei, J., Wei, Y., Yu, D. J., Srinivasan, V., and Blöschl, G.: Sociohydrology: Scientific Challenges in Addressing the Sustainable Development Goals, Water Resour. Res., 55, 6327–6355, https://doi.org/10.1029/2018WR023901, 2019.
Downton, M. W. and Pielke Jr., R. A.: How accurate are disaster loss data? The Case of U.S. flood damage, Nat. Hazards, 35, 211–228, 2005.
Duan, Q., Duana,Q., Schaake, J., Andréassian, V., Franks, S., Goteti, G., Gupta, H. V., Gusev, Y. M., Habets, F., Hall, A., Hay, L., Hogue, T., Huang, M., Leavesley, G., Liang, X., Nasonova, O. N., Noilhan, J., Oudin, L., Sorooshian, S., Wagener, T., and Wood, E. F.: Model Parameter Estimation Experiment (MOPEX): An overview of science strategy and major results from the second and third workshops, J. Hydrol., 320, 3–17, 2006.
EC (European Commission): Directive 2007/60/EC of the European Parliament and of the Council of 23 October 2007 on the assessment and management of flood risks, Official Journal of the European Union, OJ L 288, 27–34, YZMVEGC72S, https://www.eea.europa.eu/policy-documents/directive-2007-60-ec-of (last access: 8 May 2023), 2007.
EC (European Commission) Joint Research Centre, Ferrer, M., Poljanšek, K., Clark, I., and De Groeve, T. (Eds.): Science for disaster risk management 2017: knowing better and losing less, Publications Office of the European Union, Luxembourg, https://doi.org/10.2788/842809, ISBN 978-92-79-60679-3, 2017.
Gall, M., Borden, K. A., and Cutter, S. L.: When do losses count? Six fallacies of natural hazards loss data, B. Am. Meteorol. Soc., 90, 799–809, 2009.
Gaume, E., Bain, V., Bernardara, P., Newinger, O., Barbuc, M., Bateman, A., Blaškovicová, L., Blöschl, G., Borga, M., Dumitrescu, A., Daliakopoulos, I., Garcia, J., Irimescu, A., Kohnova, S., Koutroulis, A., Marchi, L., Matreata, S., Medina, V., Preciso, E., Sempere-Torres, D., Stancalie, G., Szolgay, J., Tsanis, I., Velasco, D., and Viglione, A.,: A compilation of data on European flash floods, J. Hydrol., 367, 70–78, https://doi.org/10.1016/j.jhydrol.2008.12.028, 2009.
Gelman, A., Carlin, J. B., Stern, H. S., Dunson, D. B., Vehtari, A., and Rubin, D. B.: Bayesian data analysis, Vol. 2, CRC Press, Boca Raton, FL, 675 pp., ISBN 9780429113079, https://doi.org/10.1201/b16018, 2014.
Hayes, M., Svoboda, M., Wall, N., and Widhalm, M.: The Lincoln declaration on drought indices: universal meteorological drought index recommended, B. Am. Meteorol. Society, 92, 485–488, 2011.
Huning, L. S. and AghaKouchak, A.: Mountain snowpack response to different levels of warming, P. Natl. Acad. Sci. USA, 115, 10932–10937, https://doi.org/10.1073/pnas.1805953115, 2018.
Huning, L. S. and AghaKouchak, A.: Global snow drought hot spots and characteristics, P. Natl. Acad. Sci. USA, 117, 19753–19759, https://doi.org/10.1073/pnas.1915921117, 2020.
Jongman, B., Winsemius, H. C., Aerts, J. C. J. H., Coughlan de Perez, E., van Aalst, M. K., Kron, W., and Ward, P. J.: Declining vulnerability to river floods and the global benefits of adaptation, P. Natl. Acad. Sci. USA, 112, E2271–E2280, 2015.
Kreibich, H., Di Baldassarre, G., Vorogushyn, S., Aerts, J. C. J. H., Apel, H., Aronica, G. T., Arnbjerg-Nielsen, K., Bouwer, L. M., Bubeck, P., Caloiero, T., Do, T. C., Cortès, M., Gain, A. K., Giampá, V., Kuhlicke, C., Kundzewicz, Z. W., Llasat, M. C., Mård, J., Matczak, P., Mazzoleni, M., Molinari, D., Nguyen, D., Petrucci, O., Schröter, K., Slager, K., Thieken, A. H., Ward, P. J., and Merz, B.: Adaptation to flood risk: Results of international paired flood event studies, Earth's Future, 5, 953–965, https://doi.org/10.1002/2017EF000606, 2017.
Kreibich, H., Blauhut, V., Aerts, J. C. J. H., Bouwer, L. M., Van Lanen, H. A. J., Mejia, A., Mens, M., and Van Loon, A. F.: How to improve attribution of changes in drought and flood impacts, Hydrolog. Sci. J., 64, 1–18, https://doi.org/10.1080/02626667.2018.1558367, 2019.
Kreibich, H., Van Loon, A. F., Schröter, K., et al.: The challenge of unprecedented floods and droughts in risk management, Nature, 608, 80–86, https://doi.org/10.1038/s41586-022-04917-5, 2022.
Kreibich, H., Schröter, K., Di Baldassarre, G., Van Loon, A., Mazzoleni, M., Abeshu, G. W., Agafonova, S., AghaKouchak, A., Aksoy, H., Alvarez-Garreton, C., Aznar, B., Balkhi, L., Barendrecht, M. H., Biancamaria, S., Bos-Burgering, L., Bradley, C., Budiyono, Y., Buytaert, W., Capewell, L., Carlson, H., Cavus, Y., Couasnon, A., Coxon, G., Daliakopoulos, I., de Ruiter, M. C., Delus, C., Erfurt, M., Esposito, G., François, D., Frappart, F., Freer, J., Frolova, N., Gain, A. K, Grillakis, M., Grima, J., Guzmán, D. A., Huning, L. S., Ionita, M., Kharlamov, M., Khoi, D., Kieboom, N., Kireeva, M., Koutroulis, A., Lavado-Casimiro, W., Li, H., LLasat, M. C., Macdonald, D., Mård, J., Mathew-Richards, H., McKenzie, A., Mejia, A., Mendiondo, E. M., Mens, M., Mobini, S., Mohor, G. S., Nagavciuc, V., Ngo-Duc, T., Nguyen, H. T. T., Nhi, P. T. T., Petrucci, O., Quan, N. H., Quintana-Seguí, P., Razavi, S., Ridolfi, E., Riegel, J., Sadik, M. S., Sairam, N., Savelli, E., Sazonov, A., Sharma, S., Sörensen, J., Souza, F. A. A., Stahl, K., Steinhausen, M., Stoelzle, M., Szalińska, W., Tang, Q., Tian, F., Tokarczyk, T., Tovar, C., Tran, T. V. T., van Huijgevoort, M. H. J., van Vliet, M. T. H., Vorogushyn, S., Wagener, T., Wang, Y., Wendt, D. E., Wickham, E., Yang, L., Zambrano-Bigiarini, M., and Ward, P. J.: Panta Rhei benchmark dataset: socio-hydrological data of paired events of floods and droughts, Version 2, GFZ Data Services [data set], https://doi.org/10.5880/GFZ.4.4.2023.001, 2023.
Kron, W., Steuer, M., Löw, P., and Wirtz, A.: How to deal properly with a natural catastrophe database – analysis of flood losses, Nat. Hazards Earth Syst. Sci., 12, 535–550, https://doi.org/10.5194/nhess-12-535-2012, 2012.
Kuhlicke, C., Seebauer, S., Hudson, P., Begg, C., Bubeck, P., Dittmer, C., Grothmann, T., Heidenreich, A., Kreibich, H., Lorenz, D. F., Masson, T., Reiter, J., Thaler, T., Thieken, A. H., and Bamberg, S.: The behavioral turn in flood risk management, its assumptions and potential implications, WIREs Water, 7, e1418, https://doi.org/10.1002/wat2.1418, 2020.
McMillan, H., Montanari, A., Cudennec, C., Savenjie, H., Kreibich, H., Krüger, T., Liu, J., Meija, A., van Loon, A., Aksoy, H., Di Baldassarre, G., Huang, Y., Mazvimavi, D., Rogger, M., Bellie, S., Bibikova, T., Castellarin, A., Chen, Y., Finger, D., Gelfan, A., Hannah, D., Hoekstra, A., Li, H., Maskey, S., Mathevet, T., Mijic, A., Acuña, A. P., Polo, M. J., Rosales, V., Smith, P., Viglione, A., Srinivasan, V., Toth, E., van Nooyen, R., and Xia, J.: Panta Rhei 2013-2015: Global perspectives on hydrology, society and change, Hydrolog. Sci. J., 61, 1174–1191, https://doi.org/10.1080/02626667.2016.1159308, 2016.
Mechler, R. and Bouwer, L. M.: Understanding trends and projections of disaster losses and climate change: is vulnerability the missing link?, Climatic Change, 133, 23–35, https://doi.org/10.1007/s10584-014-1141-0, 2015.
Merz, B., Kundzewicz, Z. W., Delgado, J., Hundecha, Y., and Kreibich, H.: Detection and attribution of changes in flood hazard and risk, in: Changes in flood risk in Europe, edited by: Kundzewicz, Z. W., IAHS Press, Wallingford, UK, IAHS Special Publication no. 10, 435–454, ISBN 9780415621892, 2012a.
Merz, B., Vorogushyn, S., Uhlemann, S., Delgado, J., and Hundecha, Y.: HESS Opinions “More efforts and scientific rigour are needed to attribute trends in flood time series”, Hydrol. Earth Syst. Sci., 16, 1379–1387, https://doi.org/10.5194/hess-16-1379-2012, 2012b.
Montanari, A., Young, G., Savenije, H. H. G., Hughes, D., Wagener, T., Ren, L. L., Koutsoyiannis, D., Cudennec, C., Toth, E., Grimaldi, S., Blöschl, G., Sivapalan, M., Beven, K., Gupta, H., Hipsey, M., Schaefli, B., Arheimer, B., Boegh, E., Schymanski, S. J., Di Baldassarre, G., Yu, B., Hubert, P., Huang, Y., Schumann, A., Post, D., Srinivasan, V., Harman, C., Thompson, S., Rogger, M., Viglione, A., McMillan, H., Characklis, G., Pang, Z., and Belyaev, V.: “Panta Rhei–Everything Flows”: Change in hydrology and society–The IAHS Scientific Decade 2013–2022, Hydrolog. Sci. J., 58, 1256–1275, https://doi.org/10.1080/02626667.2013.809088, 2013.
Mostert, E.: An alternative approach for socio-hydrology: case study research, Hydrol. Earth Syst. Sci., 22, 317–329, https://doi.org/10.5194/hess-22-317-2018, 2018.
Neumayer, E. and Barthel, F.: Normalizing economic loss from natural disasters: A global analysis, Global Environ. Chang., 21, 13–24, 2011.
Okoli, C. and Pawlowski, S. D.,: The Delphi method as a research tool: an example, design considerations and applications, Inform. Manage., 42, 15–29, https://doi.org/10.1016/j.im.2003.11.002, 2004.
Prosdocimi, I., Kjeldsen, T. R., and Miller, J. D.: Detection and attribution of urbanization effect on flood extremes using nonstationary flood frequency models, Water Resour. Res., 51, 4244–4262, 2015.
Razavi, S., Gober, P., Maier, H. R., Brouwer, R., and Wheater, H.: Anthropocene flooding: Challenges for science and society, Hydrol. Process., 34, 1996–2000, 2020.
Sairam, N., Schröter, K., Lüdtke, S., Merz, B., and Kreibich, H.: Quantifying Flood Vulnerability Reduction via Private Precaution, Earth's Future, 7, 235–249, https://doi.org/10.1029/2018EF000994, 2019.
Schoppa, L., Barendrecht, M.H., Sieg, T., Sairam, N., and Kreibich, H.: Augmenting a socio-hydrological flood risk model for companies with process-oriented loss estimation, Hydrolog. Sci. J., 67, 1623–1639, https://doi.org/10.1080/02626667.2022.2095207, 2022.
Schoppa, L., Barendrecht, M. H., Paprotny, D., Sairam, D., Sieg, T., and Kreibich, H.: Projecting Flood Risk Dynamics for Effective Long-term Adaptation, Earth's Future, in review, 2023.
Skougaard Kaspersen, P., Høegh Ravn, N., Arnbjerg-Nielsen, K., Madsen, H., and Drews, M.: Influence of urban land cover changes and climate change for the exposure of European cities to flooding during high-intensity precipitation, Proc. IAHS, 370, 21–27, https://doi.org/10.5194/piahs-370-21-2015, 2015.
Stahl, K., Kohn, I., Blauhut, V., Urquijo, J., De Stefano, L., Acácio, V., Dias, S., Stagge, J. H., Tallaksen, L. M., Kampragou, E., Van Loon, A. F., Barker, L. J., Melsen, L. A., Bifulco, C., Musolino, D., de Carli, A., Massarutto, A., Assimacopoulos, D., and Van Lanen, H. A. J.: Impacts of European drought events: insights from an international database of text-based reports, Nat. Hazards Earth Syst. Sci., 16, 801–819, https://doi.org/10.5194/nhess-16-801-2016, 2016.
Staudinger, M., Stahl, K., and Seibert, J.: A drought index accounting for snow, Water Resour. Res., 50, 7861–7872, 2014.
Stein, L., Pianosi, F., and Woods, R.: Event-based classification for global study of river flood generating processes, Hydrol. Process., 34, 1514–1529, https://doi.org/10.1002/hyp.13678, 2019.
Tallaksen, L. M. and Van Lanen, H. A. J. (Eds.): Hydrological drought. Processes and estimation methods for streamflow and groundwater, in: Developments in water science No. 48, Elsevier Science B.V., the Netherlands, ISBN 9780444516886, 2004.
Tarasova, L., Merz, R., Kiss, A., Basso, S., Blöschl, G., Merz, B., Viglione, A., Plötner, S., Guse, B., Schumann, A., Fischer, S., Ahrens, B., Anwar, F., Bárdossy, A., Bühler, P., Haberlandt, U., Kreibich, H., Krug, A., Lun, D., Müller-Thomy, H., Pidoto, R., Primo, C., Seidel, J., Vorogushyn, S., and Wietzke, L.: Causative classification of river flood events, WIREs Water, 6, e1353, https://doi.org/10.1002/wat2.1353, 2019.
Teuling, A. J., Van Loon, A. F., Seneviratne, S. I., Lehner, I., Aubinet, M., Heinesch, B., Bernhofer, C., Grünwald, T., Prasse, H., and Spank, U.: Evapotranspiration amplifies European summer drought, Geophys. Res. Lett., 40, 2071–2075, 2013.
UNDRR (United Nations Office for Disaster Risk Reduction): Sendai Framework Terminology on Disaster Risk Reduction, https://www.undrr.org/terminology (last access: 8 May 2023), 2017.
Van Loon, A. F., Gleeson, T., Clark, J., Van Dijk, A. I. J. M., Stahl, K., Hannaford, J., Di Baldassarre, G., Teuling, A. J., Tallaksen, L. M., Uijlenhoet, R., Hannah, D. M., Sheffield, J., Svoboda, M., Verbeiren, B., Wagener, T., Rangecroft, S., Wanders, N., and Van Lanen, H. A. J.: Drought in the Anthropocene, Nat. Geosci., 9, 89–91, https://doi.org/10.1038/ngeo2646, 2016.
Van Loon, A. F., Rangecroft, S., Coxon, G., Breña Naranjo, J. A., Van Ogtrop, F., and Van Lanen, H. A. J.: Using paired catchments to quantify the human influence on hydrological droughts, Hydrol. Earth Syst. Sci., 23, 1725–1739, https://doi.org/10.5194/hess-23-1725-2019, 2019.
Van Loon, A. F., Rangecroft, S., Coxon, G., Werner, M., Wanders, N., Di Baldassarre, G., Tijdeman, E., Bosman, M., Gleeson, T., Nauditt, A., Aghakouchak, A., Breña-Naranjo, J. A., Cenobio-Cruz, O., Costa, A. C., Fendekova, M., Jewitt, G., Kingston, D. G., Loft, J., Mager, S. M., Mallakpour, I., Masih, I., Maureira-Cortés, H., Toth, E., Van Oel, P., Van Ogtrop, F., Verbist, K., Vidal, J.-P., Wen, L., Yu, M., Yuan, X., Zhang, M., and Van Lanen, H. A.: Streamflow droughts aggravated by human activities despite management, Environ. Res. Lett., 17, 044059, https://doi.org/10.1088/1748-9326/ac5def, 2022.
Ward, P. J., de Ruiter, M. C., Mård, J., Schröter, K., Van Loon, A., Veldkamp, T., von Uexkull, N., Wanders, N., AghaKouchak, A., Arnbjerg-Nielsen, K., Capewell, L., Llasat, M. C., Day, R., Dewals, B., Di Baldassarre, G., Huning, L. S., Kreibich, H., Mazzoleni, M., Savelli, E., Teutschbein, C., van den Berg, H., van der Heijden, A., Vincken, J. M. R., Waterloo, M. J., and Wens, M.: The need to integrate flood and drought disaster risk reduction strategies, Water Security, 11, 100070, https://doi.org/10.1016/j.wasec.2020.100070, 2020.
Wilhite, D. A. and Glantz, M. H.: Understanding the drought phenomenon: The role of definitions, Water Int., 10, 111–120, 1985.
WMO (World Meteorological Organization): Drought monitoring and early warning: Concepts, progress and future challenges, WMO, Geneva, Switzerland, WMO-No. 1006, http://www.wamis.org/agm/pubs/brochures/WMO1006e.pdf (last access: 8 May 2023), 2006.