the Creative Commons Attribution 4.0 License.
the Creative Commons Attribution 4.0 License.
 | 27 Apr 2023
Twelve years of profile soil moisture and temperature measurements in Twente, the Netherlands
Rogier van der Velde
Harm-Jan F. Benninga
Bas Retsios
Paul C. Vermunt
M. Suhyb Salama
Spread across Twente and its neighbouring regions in the east of the Netherlands, a network of 20 profile soil moisture and temperature (5, 10, 20, 40, and 80 cm depths) monitoring stations was established in 2009. Field campaigns have been conducted covering the growing seasons of 2009, 2015, 2016, and 2017, during which soil sampling rings and handheld probes were used to measure the top 5 cm volumetric soil moisture content (VSM) of 28 fields near 12 monitoring stations. In this paper, we describe the design of the monitoring network and the field campaigns, adopted instrumentation, experimental setup, field sampling strategies, and the development of sensor calibration functions. Maintenance and quality control procedures and issues specific to the Twente network are discussed. Moreover, we provide an overview of open third-party datasets (i.e. land cover/use, soil information, elevation, groundwater, and meteorological observations) that can support the use and analysis of the Twente soil moisture and temperature datasets beyond the scope of this contribution.
An indication for the spatial representativeness of the permanent monitoring stations is provided through comparisons of the 5 cm station measurements with the top 5 cm field-averaged VSM derived from the field campaign measurements. The results reveal in general reasonable agreements and root mean squared errors that are dominated by underestimations of the field-averaged VSM, which is particularly apparent for the grass fields and is strong after heavy rain. Further, we discuss the prospects the datasets offer to investigate (i) the reliability of soil moisture references that serve the development and validation of soil moisture products, and (ii) the water and energy exchanges across the groundwater–vadose-zone–atmosphere continuum within a lowland environment in a changing climate.
The datasets discussed are publicly available at https://doi.org/10.17026/dans-znj-wyg5 (Van der Velde et al., 2022).
- Article
(7671 KB) - Full-text XML
-
Supplement
(449 KB) - BibTeX
- EndNote


In virtually every hydrology textbook (e.g. Maidment, 1993; Dingman, 2015, Brutsaert, 2005) one can read that water in the unsaturated soil, hereafter soil moisture, is needed for plants to grow, for groundwater to recharge, and for determining whether rain infiltrates or runs off laterally and contributes to the production of streamflow. Moreover, the availability of soil moisture for evapotranspiration controls heat and water exchanges between the land surface and atmosphere, affecting weather and climate (Seneviratne et al., 2010). Since its foundation in 1992, the Global Climate Observing System (GCOS) acknowledges the crucial role soil moisture plays in the Earth's climate system, supports the development of long-term global monitoring programmes (GCOS, 2004), and has recognised soil moisture as an essential climate variable (GCOS, 2010). Considerable developments have taken place in global soil moisture monitoring with the launch of dedicated microwave satellites, e.g. Soil Moisture and Ocean Salinity (SMOS; Kerr et al., 2010) and Soil Moisture Active Passive (SMAP; Entekhabi et al., 2010), and long-term satellite-based data products have become available (Gruber et al., 2019). In addition, the International Soil Moisture Network (ISMN) hosts in situ soil moisture measurements from across the globe (Dorigo et al., 2011, 2021).
The number of in situ soil moisture monitoring programmes dating back to the 1930s has been small and many relied on soil sampling (Robock et al., 2000). Measurements obtained by weighing wet and dry soil are, however, destructive in nature and labour-intensive. The gravimetric approach is, as such, unsuitable for monitoring purposes due to its inherent limitation in collecting reproducible observations and has also become unfeasible for long-term monitoring as labour costs increased. Indirect estimation of the soil moisture content has therefore been widely investigated (e.g. Vereecken et al., 2008). The large contrast between the relative electric permittivity (εr) of dry soil (3–5) and water (80) and its relative insensitivity to variations in salinity and soil texture have made electromagnetic field sensors operating at frequencies below 1 GHz the standard non-destructive measurement technique used for regional-scale soil moisture monitoring networks (e.g. Martínez-Fernández and Cebalos, 2005; Calvet et al., 2007; Su et al., 2011; Bircher et al., 2012; Smith et al., 2012; Benninga et al., 2018; Bogena et al., 2018; Caldwell et al., 2019; Tetlock et al., 2019). Despite technological advances having facilitated a substantial increase in the worldwide monitoring infrastructure, in situ monitoring networks providing long-term soil moisture data records are still very scarce (GCOS, 2016).
In this paper, we report for the first time the complete in situ soil moisture and soil temperature depth profile datasets collected by a regional-scale monitoring network composed of 20 permanent monitoring stations operated in and around the Twente region situated in the east of the Netherlands as well as complementary surface soil moisture datasets collected during field campaigns held in the growing seasons of 2009, 2015, 2016, and 2017. The installation of the monitoring stations of the Twente network began in the fall of 2008 and was completed by the fall of 2009, and it has witnessed continuous development ever since. Dente et al. (2011) described the early development, and the first scientific use of the data was the validation of SMOS soil moisture products (Dente et al., 2012). Other studies performed with the datasets have focused on field-scale soil moisture retrieval (Van der Velde et al., 2015; Benninga et al., 2020, 2022), upscaling of point measurements to coarse satellite footprints (Van der Velde et al., 2021), and agricultural and hydrological applications (Carranza et al., 2018, 2019; Pezij et al., 2019; Buitink et al., 2020), and the Twente network has been used as one of the core international validation sites for the SMAP surface soil moisture products (Colliander et al., 2017; Chan et al., 2018; Chaubell et al., 2020).
The paper is organised as follows: Section 2 provides an overview of the study area and relevant open third-party datasets, i.e. land cover/use, soil information, elevation, groundwater, and meteorological observations. The design of the monitoring network and the field campaigns, deployed instrumentation, experimental setup, field sampling strategies, and the development of sensor calibration functions are described in Sects. 3 and 4, respectively. In Sect. 5, we discuss data uncertainties related to the sensor calibration and spatial representativeness of the permanent monitoring stations for individual fields and for the entire network. Section 6 highlights several exemplary research opportunities in the prospect of the disclosed dataset, and Sect. 7 presents details related to the processing, flagging, and availability of the datasets. The paper closes with the summary and outlook in Sect. 8.
2.1 Regional characteristics
Twente is a 1500 km2 region in the Netherlands directly bordering Germany towards the east and bound to the west by a glacial ridge known as the Sallandse Heuvelrug. The majority of the network is situated in Twente, other parts are located in the neighbouring regions Salland and Achterhoek with similar characteristics. Glacial ridges formed in the second last glaciation period (Saalien) define the landscape. They have maximum elevations of around 80 m above mean sea level (a.m.s.l.) and consist mostly of fluvial sand deposits with glacial boulder clay sheets. This geomorphological feature in combination with a temperate oceanic climate (Cfb Köppen–Geiger climate classification; Beck et al., 2018) led to a drainage system composed of brooks and small unnavigable rivers flowing via larger rivers into the IJssel Lake. Although deeper groundwater levels of 6 up to 10 m below the surface can be found on the glacial ridges, they are generally shallow and fluctuate from within 1 m below the surface during winters up to maximum depths of 2 to 3 m in summers.
Twente and its surroundings are in the Netherlands considered rural areas with a few mid-sized and small cities, and several villages, and are known for their characteristic bocage landscape with small agricultural fields (1.63 ha on average) separated by tree lines and bushes amidst gently rolling hills. The majority of agriculture has a focus on animal husbandry, whereby the available land is used to produce food for livestock via meadows and the cultivation of maize.
A large number of public datasets of the Netherlands is freely available and made accessible through various initiatives. The following sections describe datasets on topography, soil, groundwater, land cover, and weather that can support the use of the Twente soil moisture and temperature dataset. Section 7 describes how these datasets can be accessed.
2.2 Topography, soils, and groundwater
Detailed spatial elevation data are available from the AHN (“Actueel Hoogtebestand Nederland” in Dutch). AHN (2019) supplies 0.05 m accurate digital terrain models (DTMs) obtained via airborne laser altimetry. In 2019, the third version (AHN3) has been completed and made available at spatial resolutions of 0.5 and 5.0 m. The DTM study area is shown in Fig. 1 with the locations of the monitoring stations. Soil information up to a depth of 1.2 m can be obtained from the soil physical units map of the Netherlands named BOFEK (“BOdemfysische Eenheden Kaart” in Dutch), which is a combination of the soil map of the Netherlands and the Dutch class pedotransfer function (Heinen et al., 2021). An extensive network of groundwater monitoring wells in the Netherlands is supported by various organisations, which are all contributing to a central database that is disseminated via DINOLoket (“Data en Informatie van de Nederlandse Ondergrond” in Dutch) and managed by the Geological Survey of the Netherlands (2021). Not all monitoring wells in the database have records that cover the observation period of the Twente network. The wells nearest to our monitoring stations with a matching temporal coverage are selected and displayed in Fig. 1. Table S1 in the Supplement lists the well ID, coordinates, and distance to the associated soil moisture stations.
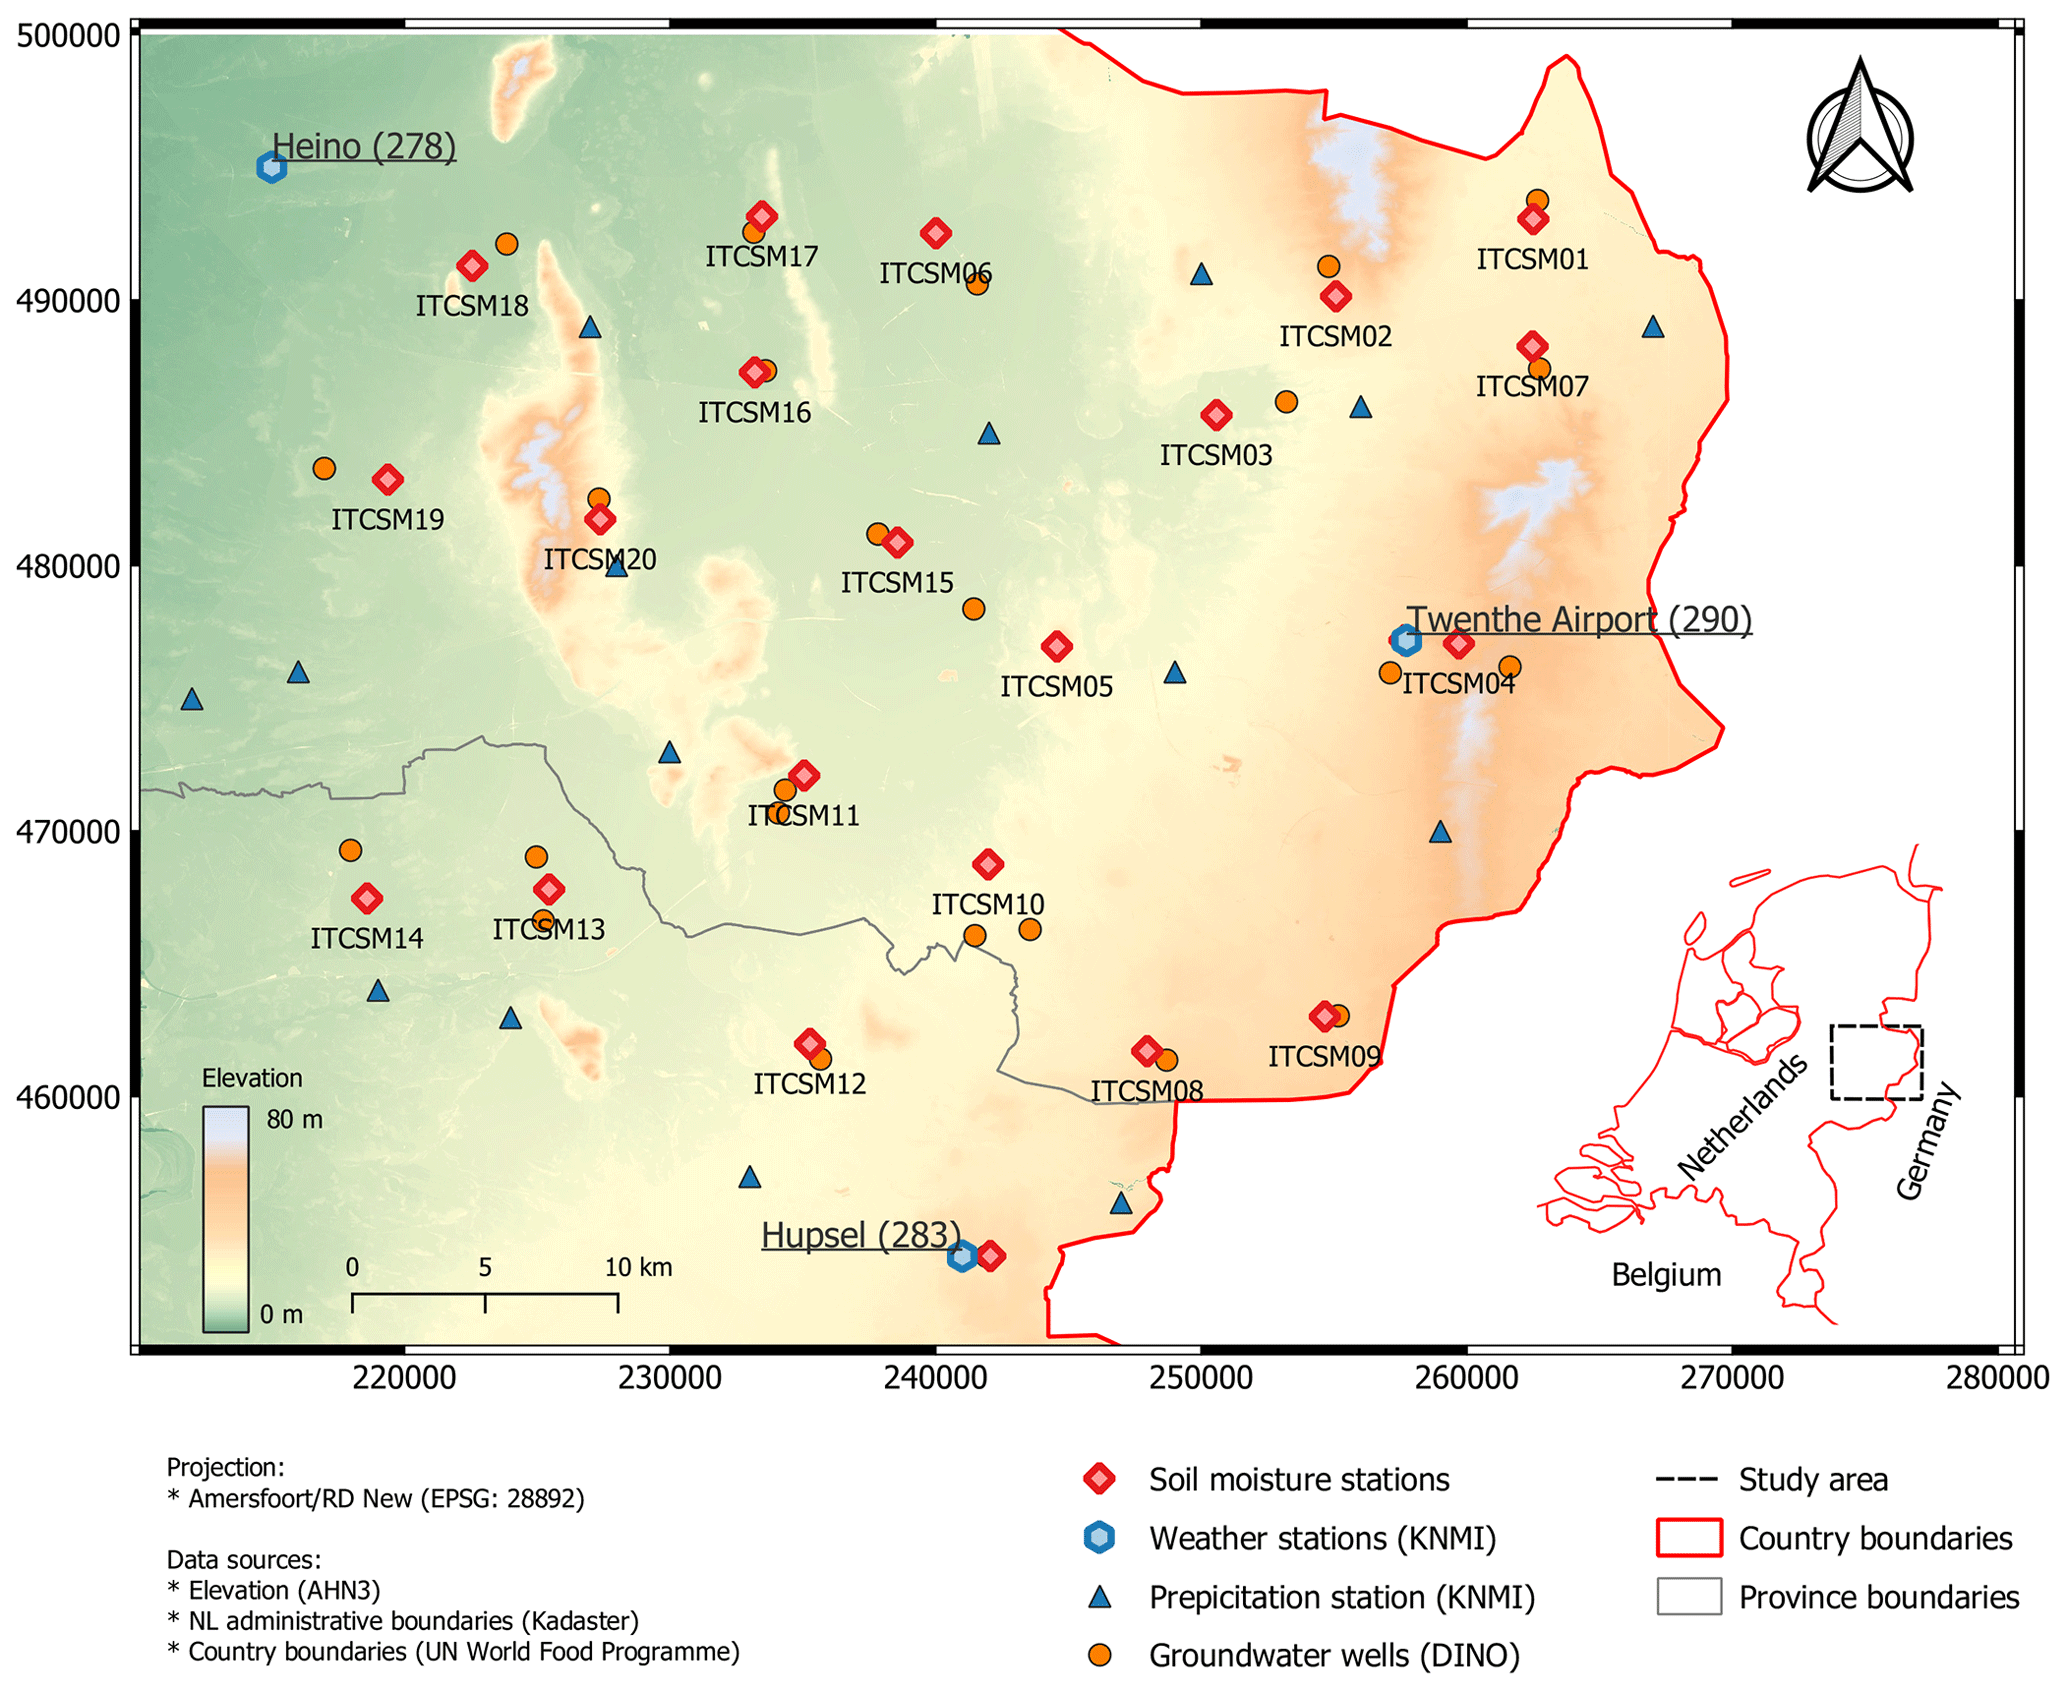
Figure 1The topography of the study area (source: 5 m spatial resolution AHN3; AHN, 2019) and the locations of the soil moisture/temperature monitoring stations, KNMI automated weather stations (underlined with ID in parenthesis), KNMI precipitation stations, and groundwater monitoring wells available in DINOLoket.
The DTM in Fig. 1 shows that the study area has little relief, sloping gently from about 5 m a.m.s.l. in the west to 30 m a.m.s.l. in the east, with some glacial ridges up to an elevation of 80 m a.m.s.l. Sand is, with 76 % areal coverage, the dominant soil type. Wind-blown loamy deposits have an areal coverage of almost 12 % and are found near the surface on the eastern glacial ridge. Organic and peaty soils are present in 4 % of the study area in the parts where water naturally stagnates. The remainder of the region is classified as land cover types for which the soil type is undefined, such as built-up areas and water.
2.3 Land use
Land use information is publicly available from Statistics Netherlands and the Ministry of Economic Affairs and Climate Policy. Statistics Netherlands (2015) provides the main land use classes based on an interpretation of a 1:10 000 topographic map and is published every 2 to 4 years since 1989. The Ministry of Economic Affairs and Climate Policy (2021) is responsible for the crop parcel registry. From 2009, every land owner in the Netherlands has to report each year the crop on each parcel in their possession.
In the 2015 land use map from Statistics Netherlands, 70.2 % of the land is used for agricultural activities, 13 % is mixed coniferous and deciduous forest, 11.3 % is built up, and the remaining 5.5 % is classified as water, recreational, and dry and wet nature. The larger forested areas are mainly found on the glacial ridges, and the agricultural activities take mostly place on the post-glacial soils. From the crop parcel registry in 2015, we find that the agricultural land is covered 70.8 % by grass meadows, 22.4 % by maize, and the remaining 6.8 % is used for potatoes, cereals, and other crops. The grass-growing season is generally from March to November, during which the meadows are either grazed by cattle or cut four to six times per year (Benninga et al., 2022). Maize is planted in the months of April/May and harvested for silage in the period from September to November depending on the vehicle-bearing capacity of the land and growing conditions, in particular the dry matter content of the plants.
2.4 Weather
The locations of the three automated weather stations (AWSs) and 29 rain gauges operated by the Royal Netherlands Meteorological Institute (“Koninklijk Nederlands Meteorologisch Instituut” in Dutch; KNMI, 2021) in the study area are shown in Fig. 1. The rain gauges are part of a network of more than 300 voluntary observers in the Netherlands. The observers manually record with a 0.1 mm resolution the rainfall collected with a World Meteorological Organization (WMO) standard gauge around 09:00 CET in the morning and measure the snow depth with a ruler when applicable. The data are sent to the KNMI for validation in 10 d blocks and made available as daily values.
The three automated weather stations are situated near the villages Heino and Hupsel and at Twente airport near Enschede. They measure wind speed and direction, air temperature at 1.5 and 0.1 m above the surface, sunshine duration, shortwave incoming radiation, precipitation, air pressure, humidity, and cloud cover. The adopted instrumentation and measurement protocols are according to WMO standards, and the quality-controlled data are available as hourly and daily values. The daily set also holds the reference crop evapotranspiration (Eref) calculated through the application of the modified Makkink method described in De Bruin (1987). In addition, radar-derived precipitation is available as approximately 1 km gridded files as gauge-corrected accumulations for 5 min and 3 and 24 h.
For the period 2008–2020, Fig. 2 shows the monthly average of daily mean 1.5 m air temperature and monthly precipitation and Eref sums derived as mean values for the three automated weather stations. The data in this figure support that the soil moisture monitoring network is located in a temperate oceanic climate zone (Cfb). The coldest and warmest months have been January and July, with mean monthly temperatures of 2.9 and 18.3 ∘C, respectively. Precipitation has been evenly distributed throughout the year according to the Köppen–Geiger classification, even though a difference of 53.3 mm exists in sums between the driest (April; 33.5 mm) and wettest (August; 86.8 mm) month.
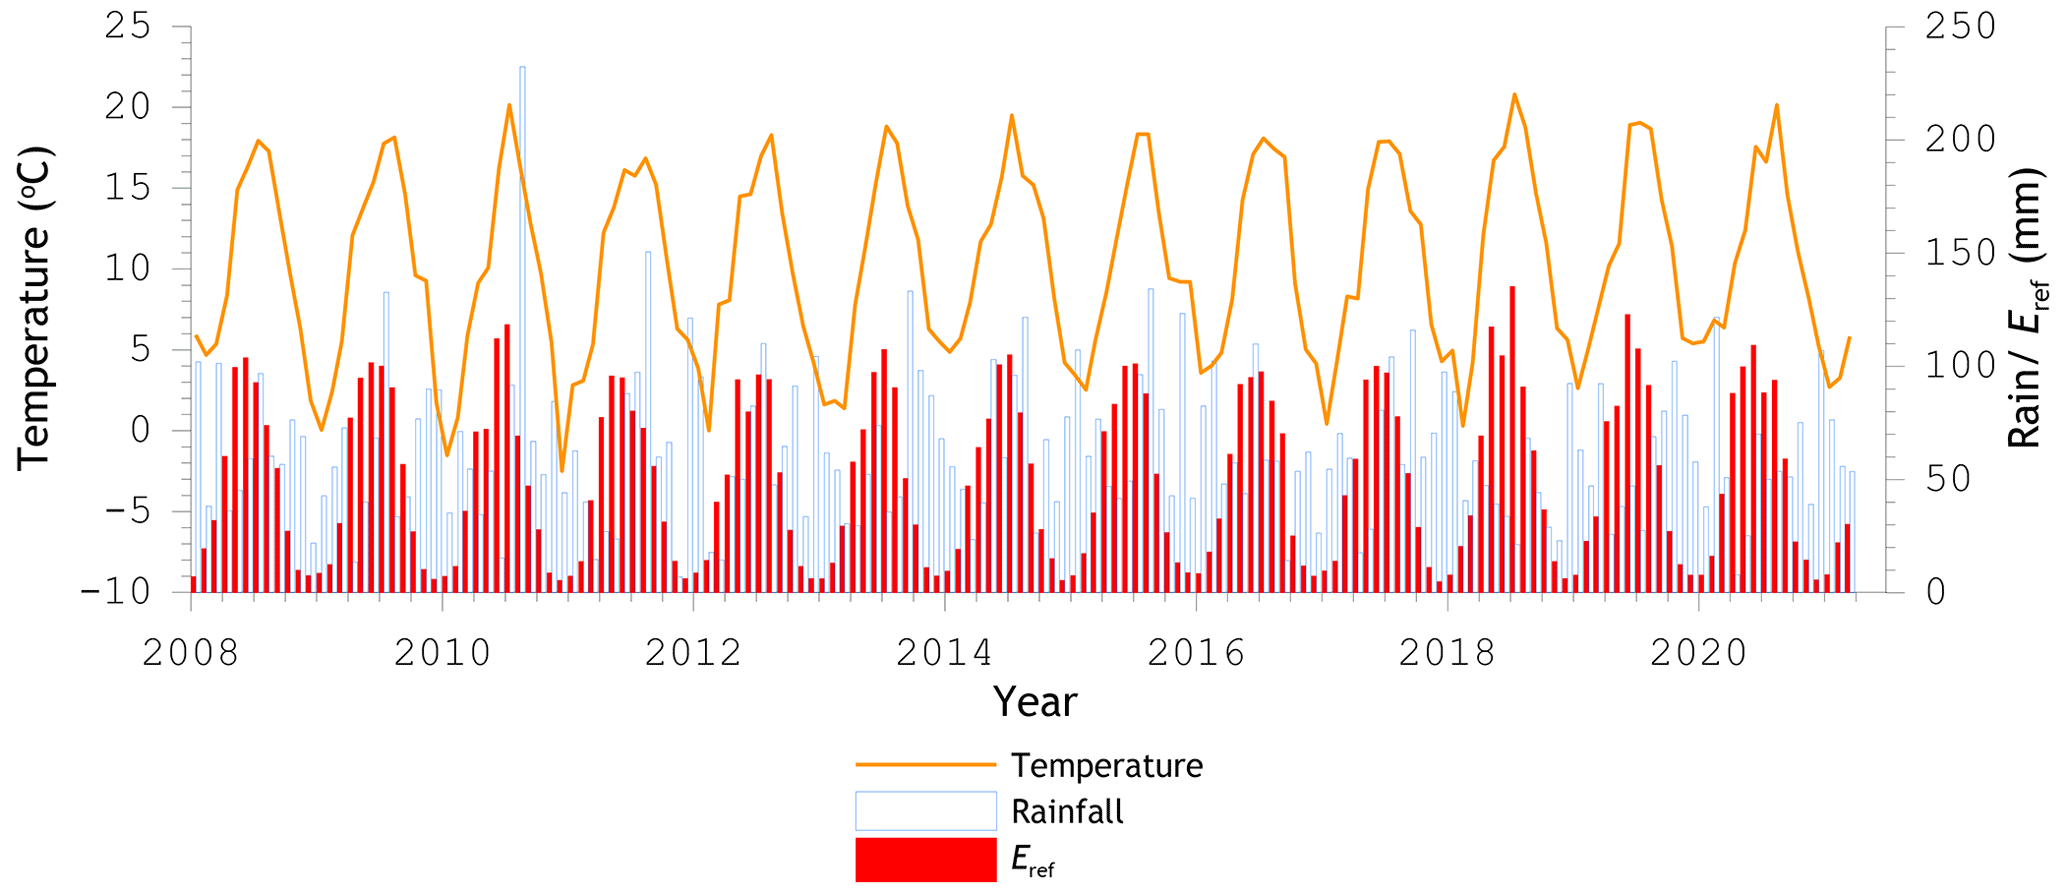
Figure 2Monthly average of the daily mean 1.5 m air temperature, and monthly rainfall and Eref sums derived as mean values from the measurements collected at the KNMI automated weather stations Heino, Hupsel, and Twenthe.
In the past 14 years, the annual precipitation and Eref sums available for the three weather stations have been on average 757.1 and 611.3 mm, respectively, resulting in an annual surplus of 145.8 mm. In the years 2018, 2019, and 2020, northwestern Europe has been struck by droughts (e.g. Buitink et al., 2020; Bakke et al., 2020; Buras et al., 2020) with below-normal precipitation and higher evaporative demands. The most extreme rain day occurred on 26 August 2010, with 49.6, 142.3, and 106.4 mm collected at KNMI stations Heino, Hupsel, and Twenthe.
3.1 Sites
The development of the soil moisture and temperature monitoring network started in November 2008 and was completed in November 2009, but 19 out of the 20 stations were installed already before July 2009. The objective of the measurement infrastructure was to serve as a reference for the validation and calibration of coarse-resolution soil moisture products derived from active and passive microwave satellite observations (Dente et al., 2011). The measurement sites are spread over a roughly 45 km×40 km area, and the individual stations are 5 to 13 km apart as shown in Fig. 1.
In the site selection, care was taken to evenly distribute monitoring stations across the land covers and soil types in the study area. The majority of stations are found on sandy soils, two stations have been installed in sandy soils with a higher organic matter content, one in loamy soil, and one in clayey soil according to the BOFEK soil map. It should be noted that near the surface the organic matter content is higher than one would expect based on the texture class and that grasslands have a dense rooting system. The land on which the monitoring took place is privately owned and actively used for farming. The instrumentation is, therefore, typically placed at the border of fields and preferably several tens of metres away from disturbing features (i.e. trees, roads, and watercourses), as shown in Fig. 3, to minimise disturbance from recurring farming practices and optimise its representativeness for the adjacent fields, which is further discussed in Sect. 5.2.

Figure 3Photos taken of (a and b) the reinstallation of ITC_SM03 on 2 May 2017, (c) ITC_SM18 on 17 July 2019, and (d) ITC_SM02 on 17 July 2019.
The monitoring network has been constantly subject to modifications, such as land cover changes as a result of crop rotation and reinstallations due to changes in land ownership or persistent equipment failures. Table S2 lists for each station the texture class derived from the soil map, land cover per year of the adjacent fields, percentage missing data, and changes made to the measurement setup. The location of the stations and their installation dates are available as a list of geographic (datum: WGS84) and map-projected (Amersfoort/RD New; EPSG: 28892) coordinates.
3.2 Instrumentation and measurement setup
The Twente soil moisture and temperature monitoring network is built with instrumentation manufactured by METER Group (formerly Decagon Devices). The offline and remote versions of the EM50 data logger series have been deployed to perform measurements every minute with ECH2O EC-TM and 5TM (firmware versions 2013 and 4.0) probes and were set to record readings at 15 min intervals. The functionality of the probes was tested using measurements of water and air prior to deployment, and the installed probe types are documented along with the datasets as a quality flag within the datasets (see Sect. 7). Equipment of the METER Group has previously been used for the development of many monitoring networks, such as HOBE in Denmark (Bircher et al., 2012), TERENO in Germany (Bogena et al., 2018), and the Raam in the Netherlands (Benninga et al., 2018), and has been evaluated in several intercomparison studies (e.g. Jackisch et al., 2020; Vaz et al., 2013; Robinson et al., 2008).
The ECH2O probes estimate the volumetric soil moisture (VSM) by characterising the apparent relative electric permittivity via the capacitance that is quantified as the charge needed to polarise the dielectric (soil–water–air mixture) surrounding the prongs and determined as a voltage (Bogena et al., 2007). Benninga et al. (2018) have shown under laboratory conditions that the 5TM probe is sensitive to about 3 to 4 cm of soil layer around the prongs. Readers are referred to the manuals for the details on the instrument design and their technical specifications (Decagon Devices, 2008, 2017).
Figure 3 illustrates typical measurement setups of the Twente network with probes installed at nominal depths of 5, 10, 20, 40, and 80 cm. However, due to budget constraints, several stations are limited to the upper two, three, or four measurement depths. Table S3 provides for each station the installed sensor types and installation depths. At sites with permanent grass cover, excavation of the installation pit started with cutting the grass sod of an area of approximately 40 cm by 40 cm, after which the top 10 to 15 cm (soil layer including grass) was carefully removed and the pit was dug further until the required depth. The probes were installed in a lateral direction with the small sides of the prongs pointing upward to avoid water ponding and with the printed text on the prongs in the upright direction to ensure consistency in the depth of the thermistor. After installation, the pit was backfilled while compacting the soil several times during the filling process, the grass sod was placed back, and a trench was dug to guide the cables to a pole on which the EM50 logger was mounted. The excess cables were buried near the pole. Typically a few months after installation the plot returned to its original state. A similar installation procedure was adopted for cultivated land.
3.3 Capacitance probe calibration
Soil-specific calibrations of electromagnetic field sensors are needed to account for (i) losses (the imaginary component of εr) due to the molecular relaxation and electric conductivity that alter the εr as it appears to a capacitance sensor (Robinson et al., 2008), and (ii) the soil-dependent dielectric response to VSM. Guidelines from the manufacturer (Cobos and Chambers, 2010) were followed to develop soil-specific calibration functions for the EC-TM and 5TM probes using measurements made in the laboratory. With this approach, the sensor-to-sensor variability is assumed to be accounted for by the manufacturer's sensor calibration against known dielectric standards. This can be justified based on the small variability (0.01 m3 m−3) among sensors evaluated by Kizito et al. (2008) and Rosenbaum et al. (2010).
In Dente et al. (2011), the development of the calibration function for the EC-TM probe is described. They performed the calibration on soil collected from 10 sites and could identify three relationships, but at the same time they could not attribute this to a specific soil feature. The conclusion was to use the following general calibration function:
where θ stands for the VSM (m3 m−3), a and b are the intercept (m3 m−3) and slope (–) of the linear regression function, and subscripts p and cp indicate the native probe reading and calibrated probe value. The native probe reading is a direct sensor output obtained by applying the mineral soil calibration to the raw signal (Decagon Devices, 2008). Dente et al. (2011) report an a of 0.0706 m3 m−3 and b of 0.7751, yielding a root mean square error (RMSE) of 0.023 m3 m−3.
The calibration of the 5TM probe was performed in 2015 for soil taken from three sites each belonging to one of three groups earlier identified by Dente et al. (2011). The selected sites were ITC_SM03, ITC_SM07, and ITC_SM08, for which 38, 32, and 29 pairs of gravimetrically determined VSM (GVSM) and probe VSM measurements were collected, respectively. Figure 4a shows the GVSM against the 5TM VSM. Linear equations of the same type as Eq. (1) were fitted through the matchups for each soil individually and all together. The leave-one-out cross-validation procedure is adopted for calculating the performance metrics because of the limited sample size and to provide an uncertainty estimate for coefficients a and b.
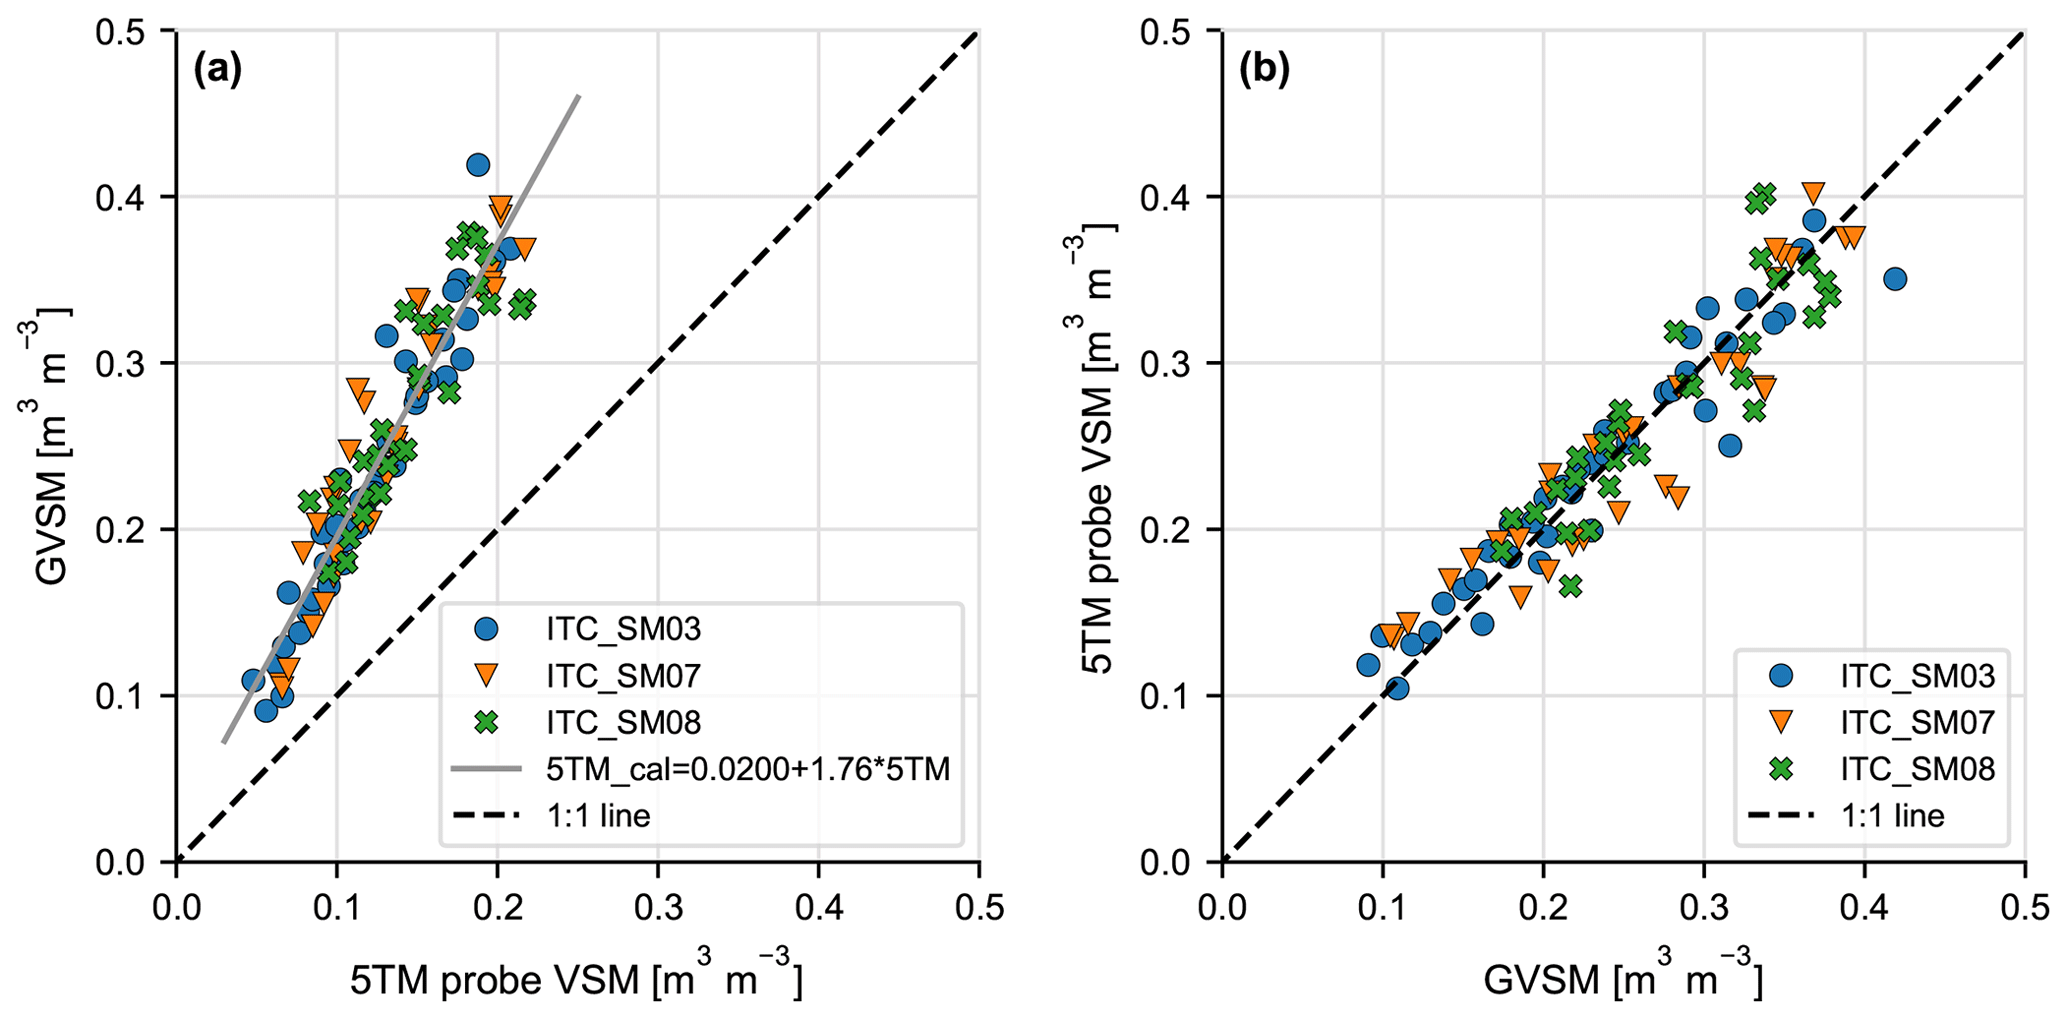
Figure 4(a) Measurements of GVSM against 5TM VSM on soil collected at sites ITC_SM03, ITC_SM07, and ITC_SM08, and (b) calibrated 5TM VSM against GVSM measurements performed for the same soils as in (a).
Table 1 lists the linear regression coefficients (a and b) obtained for the four sets of matchups along with their standard deviation (σ). The RMSE and mean error (ME) calculated from the matchups left for validation and the coefficient of determination (R2) obtained with the mean regression coefficients are provided as well. The listed metrics demonstrate that the performance of the 5TM sensor is in line with that of the EC-TM. Even though the regression coefficients differ among the analysed soils, their point clouds in Fig. 4a have quite some overlap, which does not justify the use of different calibration functions. This is further supported by the fact that the σ is only a fraction of the magnitude of the regression coefficients when including all matchups. Notably, the obtained σs are 4.8 % of the intercept and less than 0.5 % of slope relative to the magnitude, while it goes up to a respective 44 % and 2.4 % when using data from a single site. This suggests that the reliability of the function fitted through all matchups is higher. The “all soils” calibration function is for this reason applied to every site of the Twente network, which is expected to provide an accuracy (RMSE) of 0.028 m3 m−3. Figure 4b presents the validation with the GVSM plotted against the 5TM VSM using the “all soils” mean regression coefficients.
Table 1Mean (μ) regression coefficients and their standard deviations (σ) fitted through pairs of GVSM and 5TM VSM measured in the laboratory on soil collected at sites ITC_SM03, ITC_SM07, and ITC_SM08. Performance metrics, RMSE, ME, and R2, follow from the validation. n stands for the number of matchups.
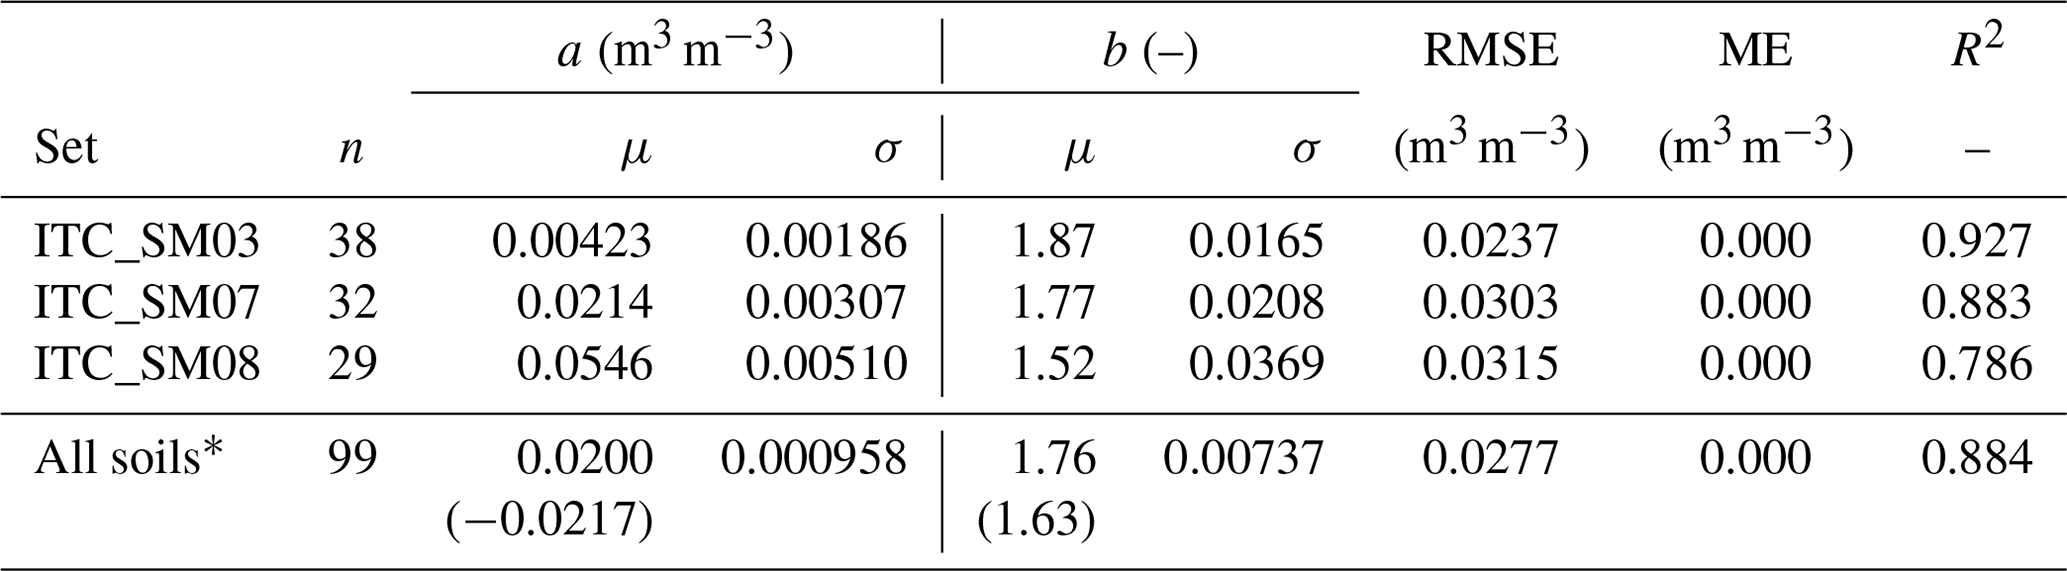
∗ In parenthesis are the calibration coefficients for the 5TM probes with firmware v4.0.
Field campaigns were conducted in 2009, 2015, 2016, and 2017, during which soil moisture was measured in fields with handheld impedance probes and via soil samples taken for GVSM determination. The objective of the campaigns was the validation of soil moisture retrievals from satellite observations via estimates of the spatially aggregated top 5 cm soil moisture content, hereafter referred to as surface soil moisture. The general concept of each field campaign was similar, yet the execution differed every year. For instance, sampling days in 2009 and 2015 took place weekly from the end of summer in September until the beginning of November. In 2016 and 2017, the sampling days were held weekly or biweekly depending on weather and staff availability and covered the entire growing season from April/May till the end of fall in November. An overview of the field campaigns is provided in Table 2, which includes the time, the number of sampling days, and the sampled stations. The following sections describe the sampling strategy, the instrumentation, and the calibration of the probe readings.
Table 2Overview of the soil moisture field campaigns conducted at fields adjacent to monitoring stations. In the far right column, the number in parenthesis stands for the sampled field number, and the letter represents the land cover at the start of the campaign (g: grassland, m: maize, f: forest, fw: fallow winter wheat, w: winter wheat, p: potato). In case of no letter, the field was not sampled during the field campaign.
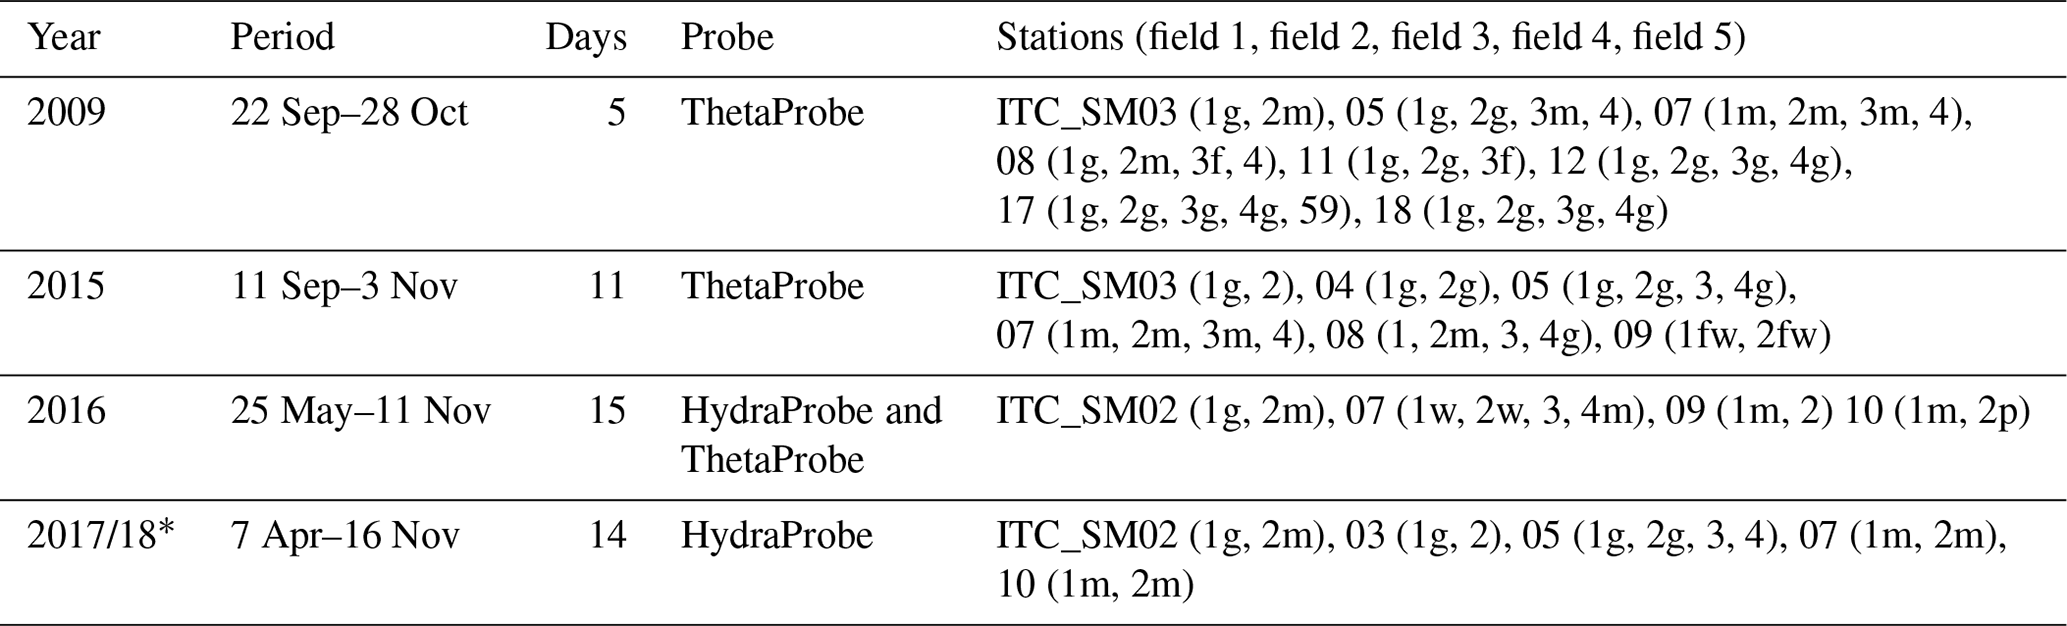
∗ In 2018, a limited number of fields were sampled on 2 February and 10 April.
4.1 Sampling design
Sampling took place at up to five fields near a monitoring station with 28 sampled fields in total near 12 monitoring stations. A maximum of six measurement locations were selected per field about 50 to 100 m apart, which was reduced to a minimum of three locations when the size of the parcel was not big enough. The geographic positions of the measurement locations have been determined using GPS with an accuracy typically better than 4 m.
Figure 5 illustrates the sampling at the measurement locations. The number of handheld impedance probe readings per sampling point varied from nine in the 2009 field campaign to five readings in 2015 and four in 2016–2017. At fields without crop rows, such as grass and wheat, surface soil moisture was measured with the impedance probe at four to nine points within a 1 m2 plot, and next to one of the probe readings a soil sample was taken for GVSM determination. In fields with crop rows, such as maize and potato, probe readings were taken along the transect perpendicular to the crop row, with the soil sample taken in the middle of two rows. The collection of soil samples for GVSM determination was done during each field campaign to calibrate the probe readings and stopped when the covered dynamic range and number of matchups, ideally greater than 25, were suitable to establish a calibration function. The provided data sheets indicate which probe reading matches with the GVSM. Locations of other sampling points are not specified because they were not documented in a consistent manner during the field campaigns.
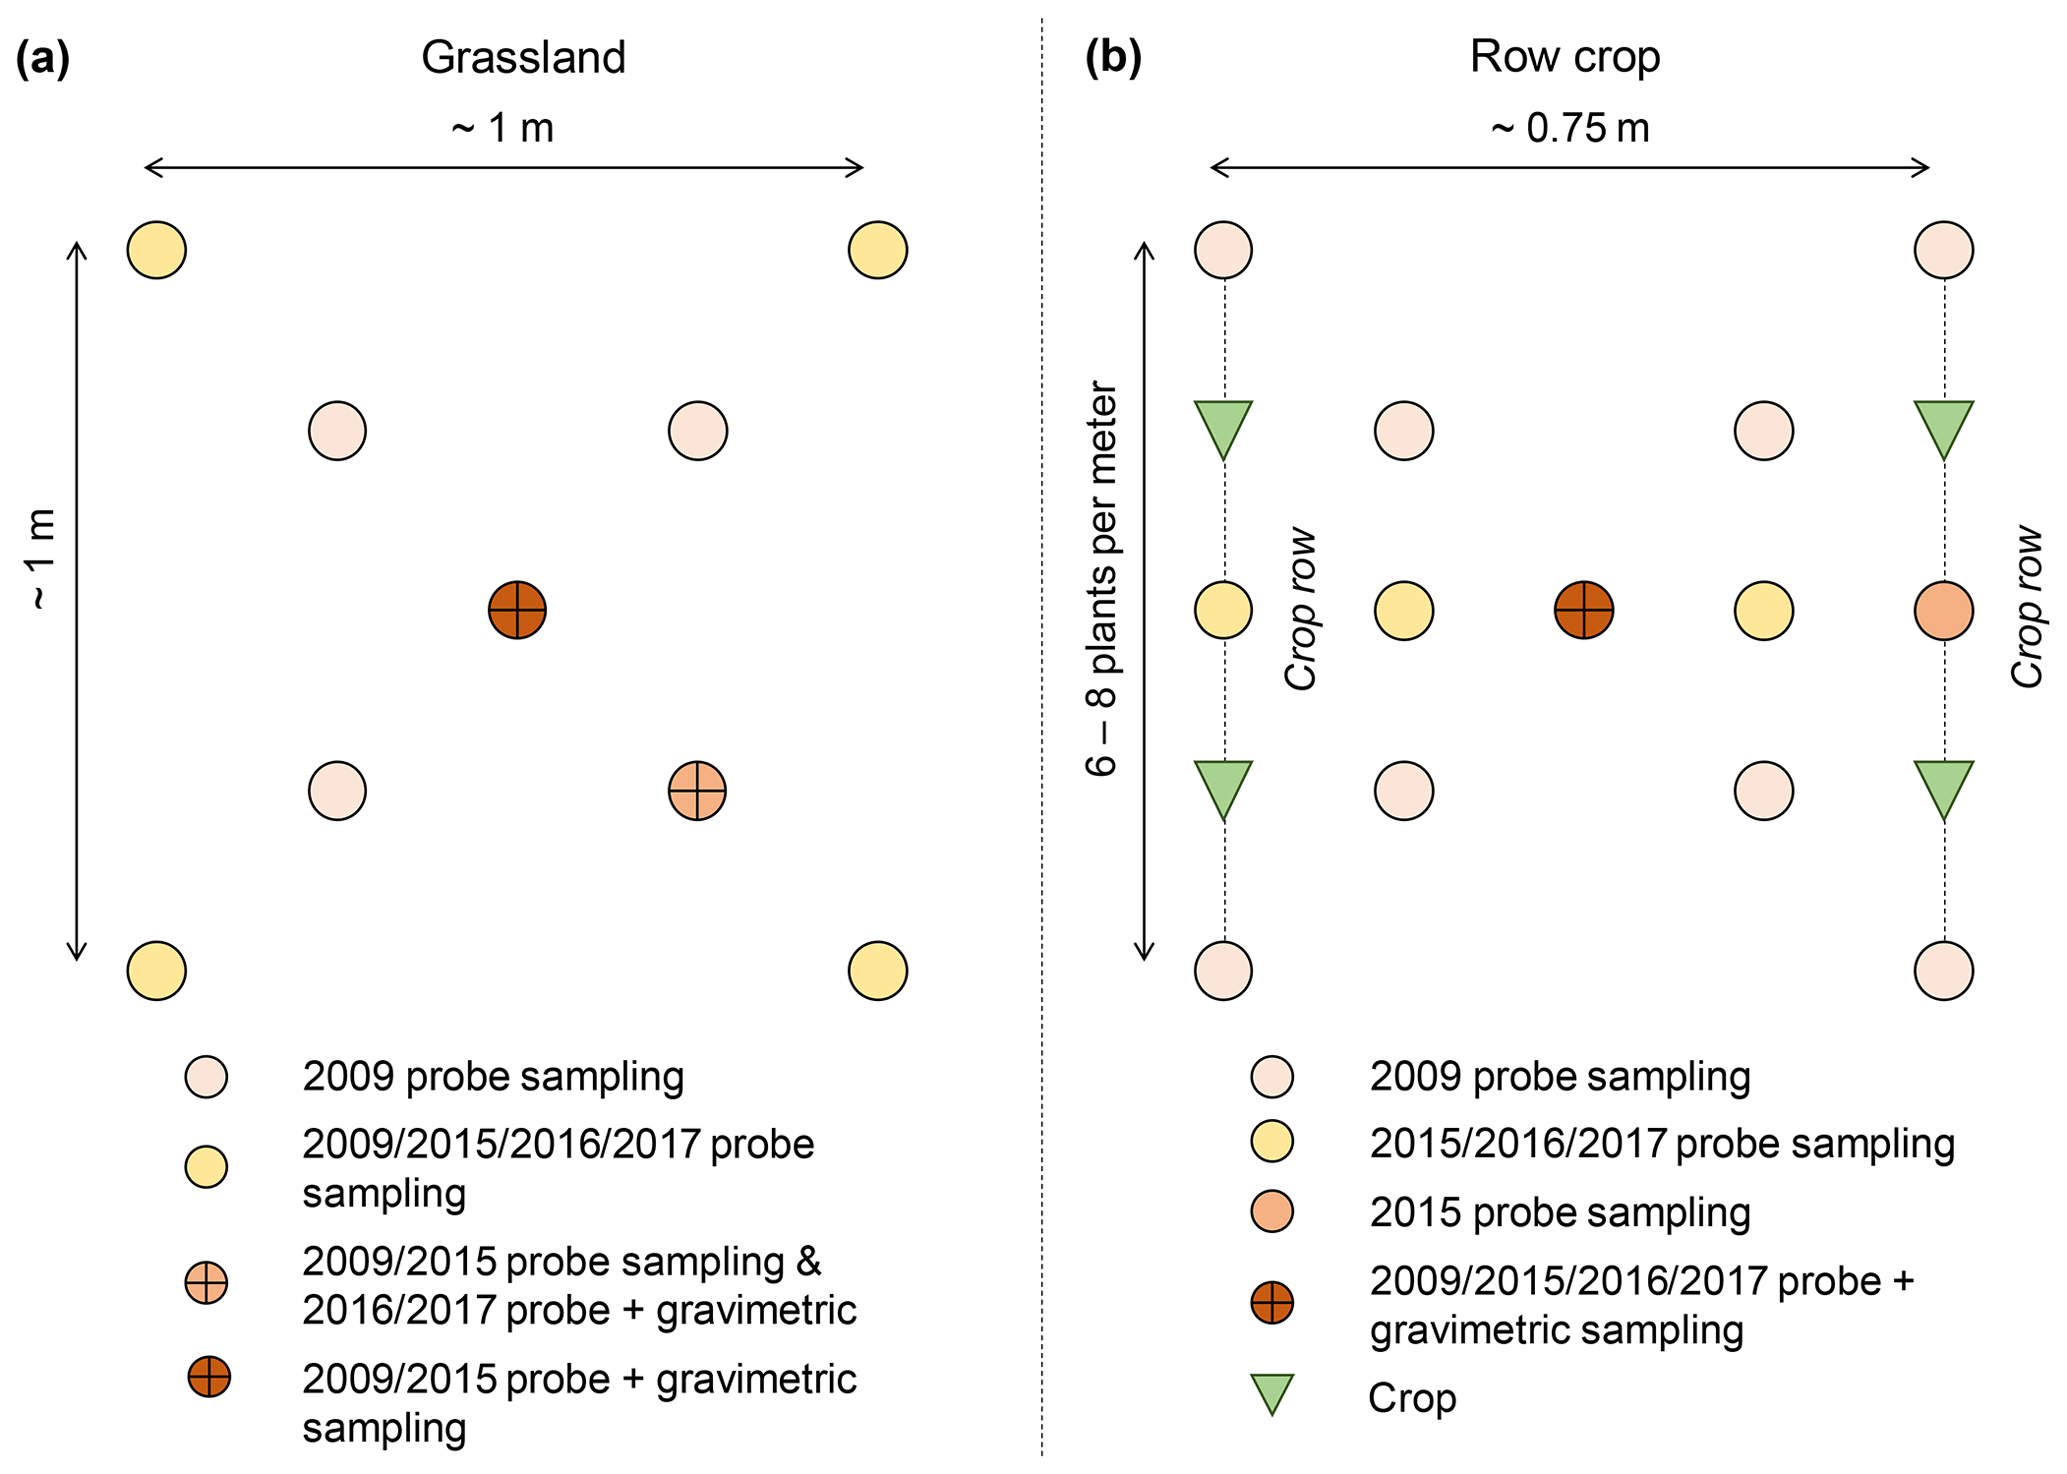
Figure 5Schematisation of impedance probe and GVSM sampling carried out at the sampling locations during the 2009, 2015, 2016, and 2017 field campaigns.
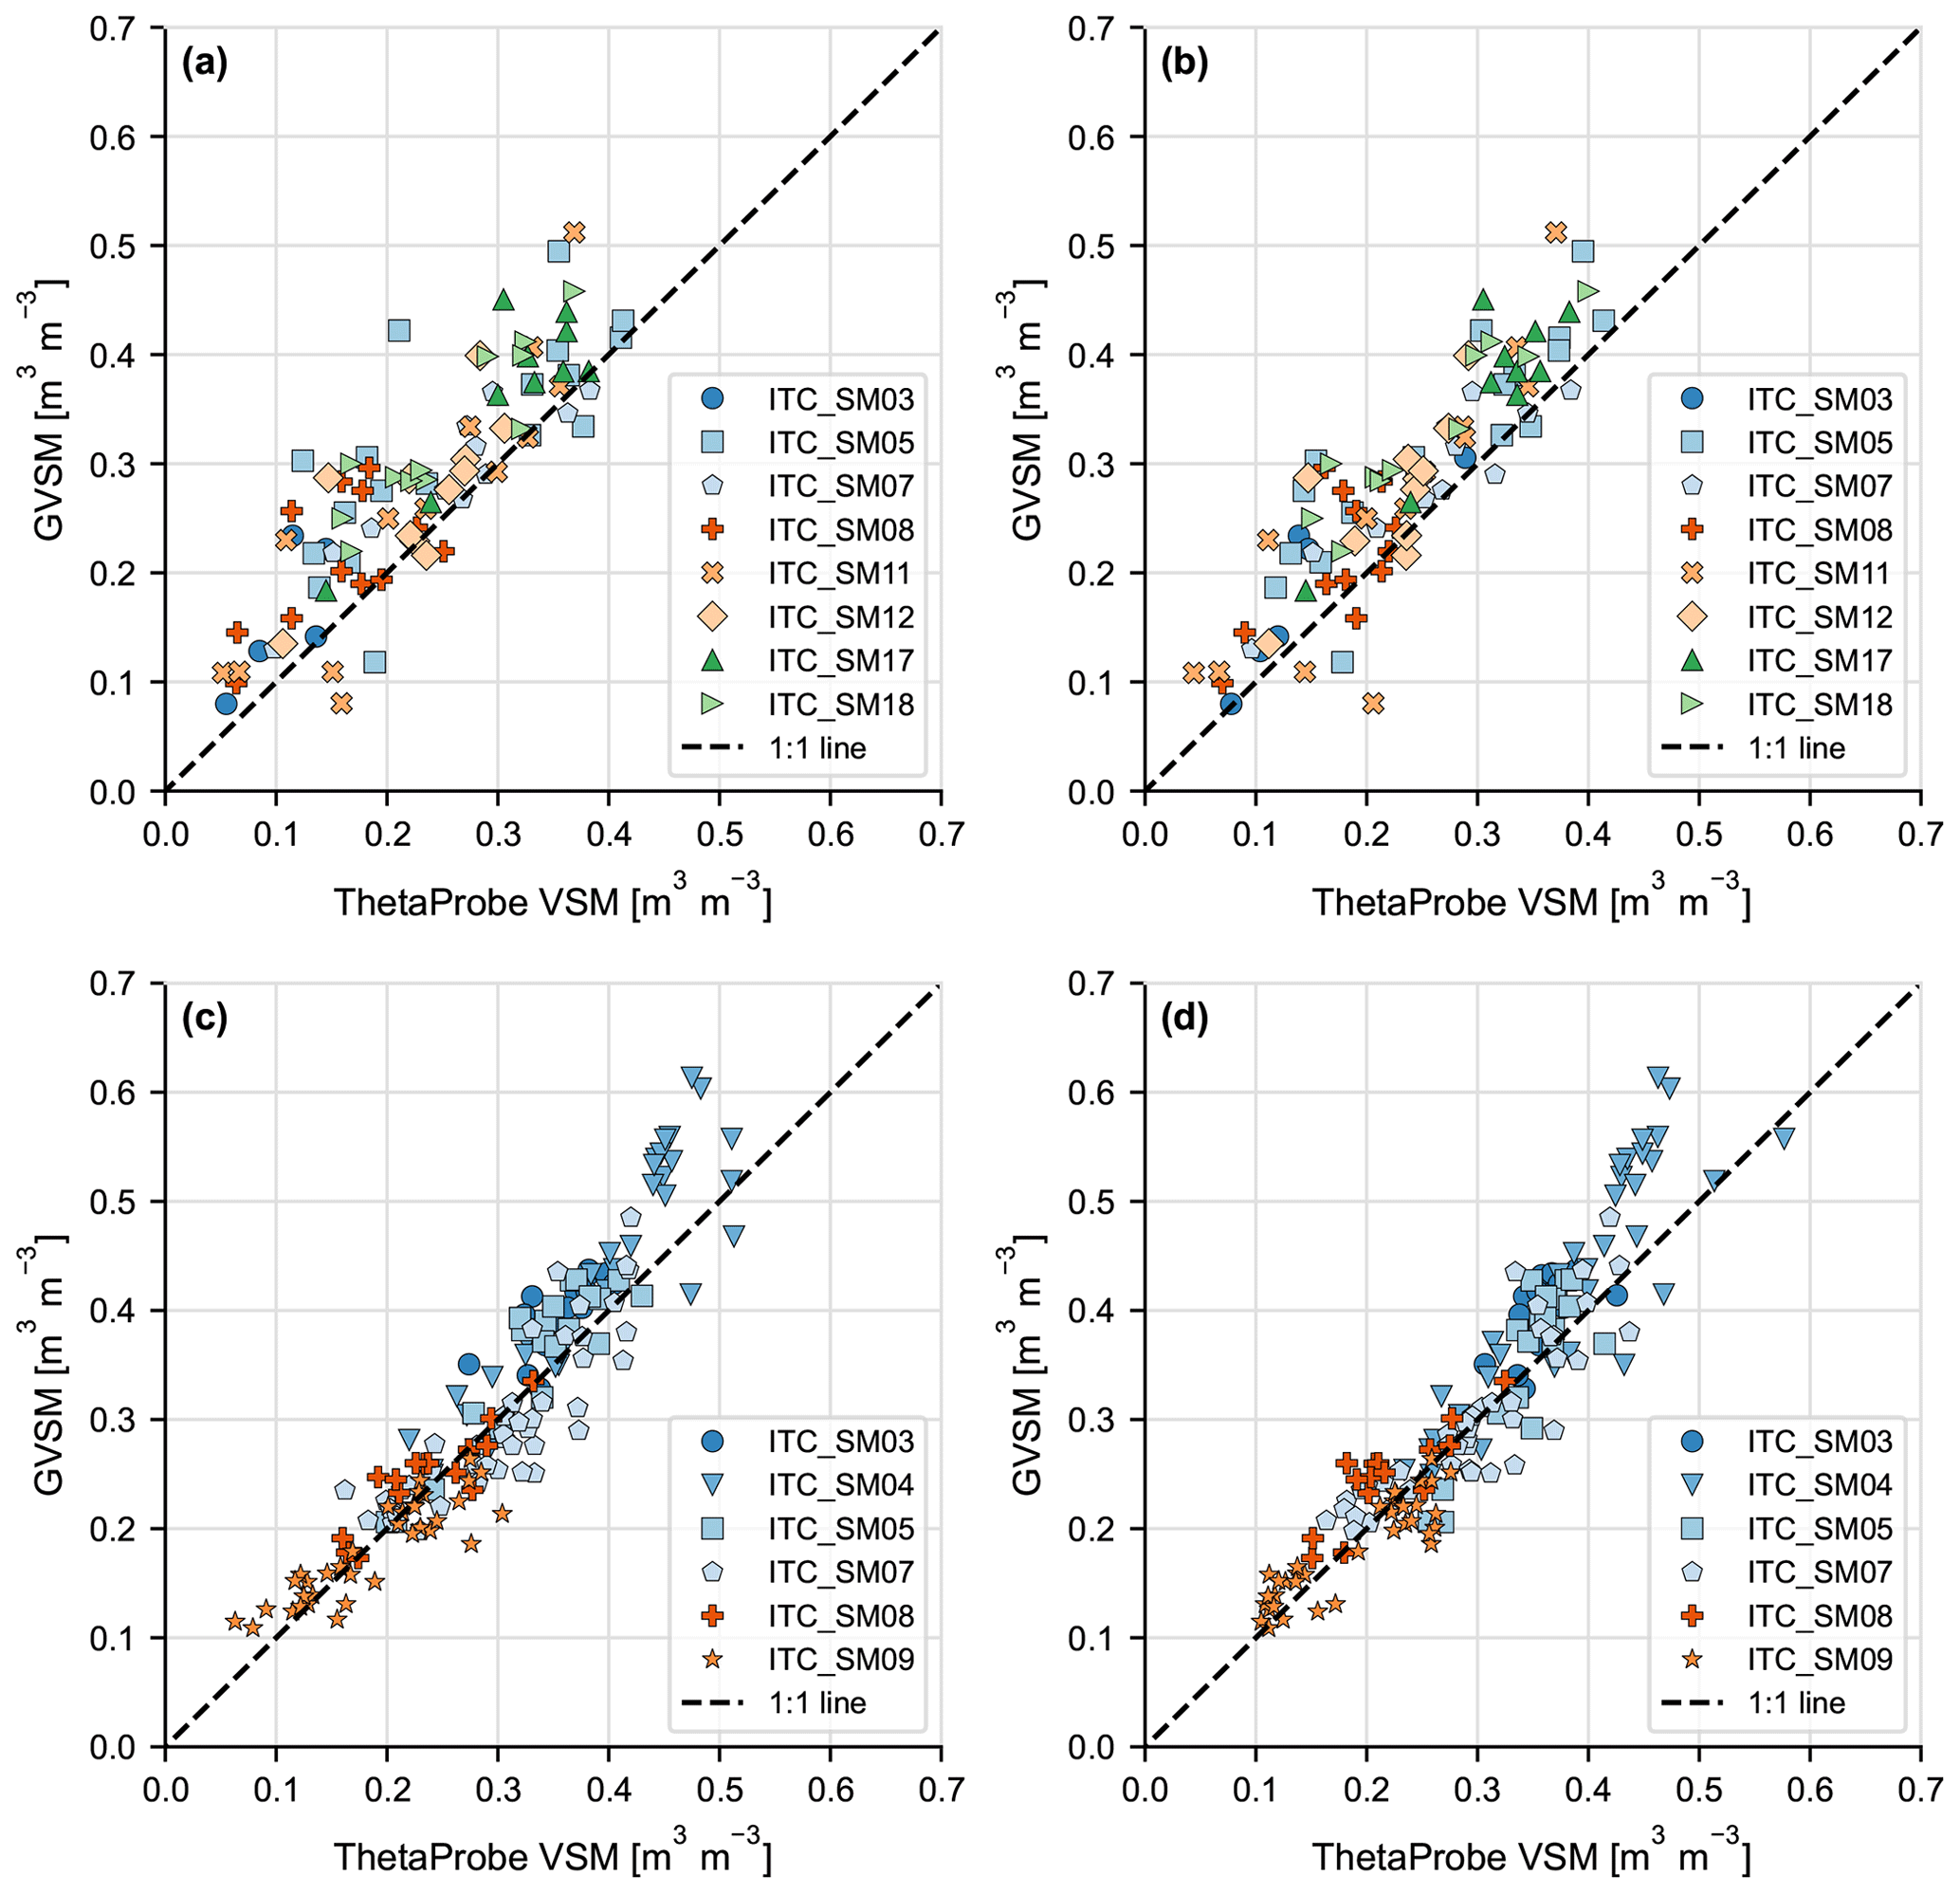
Figure 6Scatterplots of the ThetaProbe VSM against GVSM collected during the 2009 (a, b) and 2015 (c, d) field campaigns. In subplots (a) and (c) are the ThetaProbe VSM readings taken next to a GVSM measurement. In subplots (b) and (d) are the mean of the ThetaProbe VSM readings taken at a sampling point.
4.2 ThetaProbe and HydraProbe
The Delta-T ThetaProbe (Type ML2; Delta-T Devices, 2017) and Stevens HydraProbe (analogue version; Stevens Water Monitoring Systems, 2020) are the two handheld probes that were used during field campaigns. Both instruments exploit the impedance mismatch between a coaxial transmission and a stainless steel pin inserted in the soil that acts as a waveguide and is electrically shielded by three similar pins (Seyfried and Murdock, 2004). The ThetaProbe measures the amplitude difference of a standing sinusoidal wave between the start of a transmission line and the junction where the pins enter the soil as a result of the applied 100 MHz signal. The amplitude difference is used to determine the impedance from which the apparent εr is derived (Gaskin and Miller, 1996). The HydraProbe measures the complex ratio of the reflected and incident voltage of an applied 50 MHz signal to characterise the impedance of the soil to determine the complex εr (Campbell, 1990; Kraft, 1987). Both the ThetaProbe and HydraProbe data loggers have built-in software to convert the voltage output to a soil moisture content. In addition to soil moisture, the HydraProbe also provides bulk electric conductivity and temperature. Because the relationship between εr and VSM is affected by the soil type, calibration of impedance probe measurements is generally needed. In the case of the ThetaProbe, the calibration also accounts for conductive and molecular losses, which is less of an issue with the HydraProbe, as it independently measures the real and imaginary components of the εr.
4.3 Impedance probe calibration
The measurements of the 2009 and 2015 field campaigns were collected with the ThetaProbe, during which a total of 93 and 166 matchups with GVSM were collected at fields near eight and six different stations, respectively. Figure 6 presents plots of GVSM against the ThetaProbe VSM with the 2009 data in the upper panels (Fig. 6a and b) and the 2015 data in the lower panels (Fig. 6c and d). The GVSM against the matching ThetaProbe readings is shown in Fig. 6a and c, and the GVSM values against the mean of the readings at a sampling point are shown in Fig. 6b and d.
In general, it can be noted that all plots show positive relationships and that the scatter among the data points is clearly less in 2015 than in 2009. This is particularly the case for the matching ThetaProbe readings. The explanation for this difference in performance between the years is a combination of the larger number of stations sampled in 2009, the lower number of matchups available for 2009, and the operator skills could also have played a role. Regardless of the scatter noted in the data points of 2009, it is difficult to identify distinct relationships for individual stations. Among the 2015 data points, clusters belonging to a single station are observed, but this is primarily due to the persistent soil moisture levels at specific stations. The attribution of a GVSM–ThetaProbe relationship to a specific soil type or station remains unclear. We have, therefore, chosen to develop the ThetaProbe calibration functions for the 2009 and 2015 field campaigns separately and not for individual stations or specific soil types. This also ensures a sufficient number of matchups and a larger soil moisture range.
The data collection of the 2016 and 2017 field campaigns was performed with the HydraProbe and took place near three stations (ITC_SM02, ITC_SM07, and ITC_SM10) in 2016, to which ITC_SM03 was added in 2017. A total of 285 pairs of GVSM and HydraProbe readings were acquired, with >86 matchups for each station, at which the measurements started in 2016 and 12 matchups for ITC_SM03. Figure 7a and b show the GVSM against the matching HydraProbe reading and the mean of the four readings collected at a sampling location, respectively.
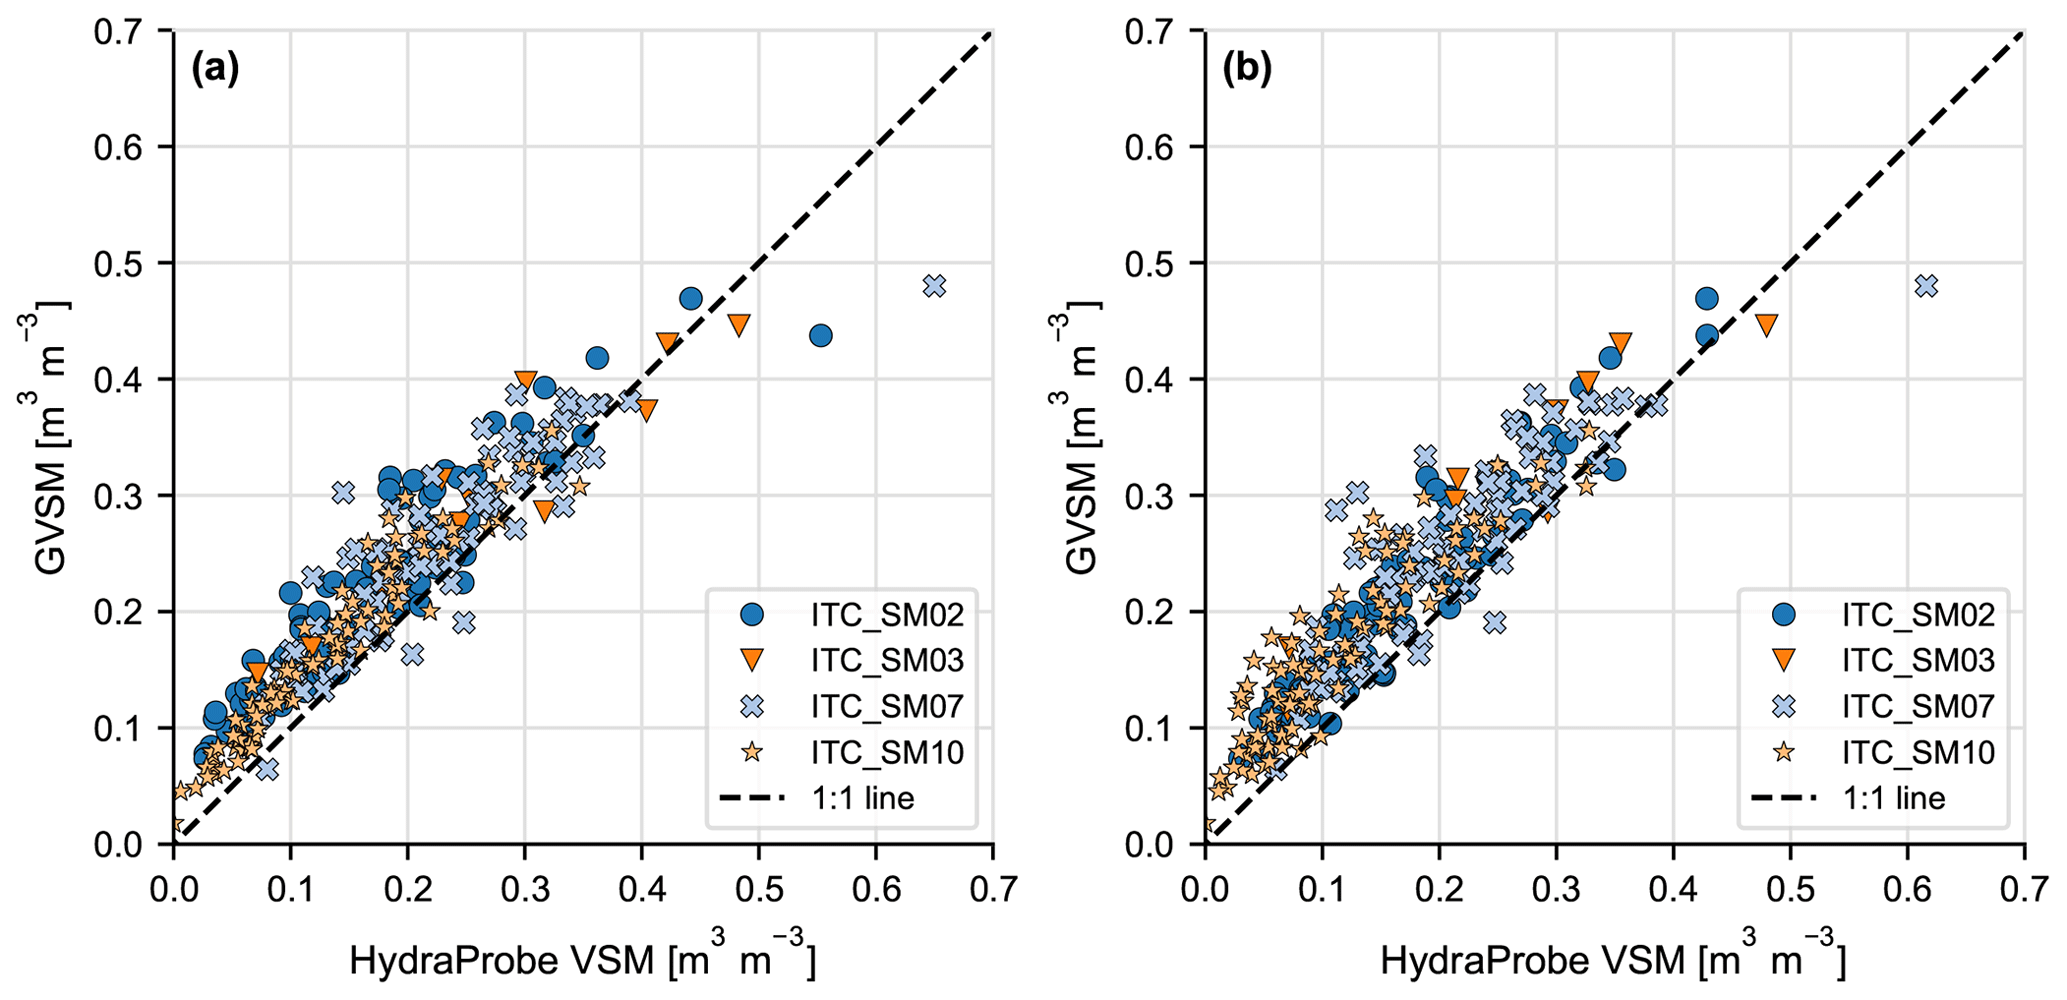
Figure 7Scatterplots with the HydraProbe VSM against the GVSM collected during the 2016 and 2017 field campaigns. In subplot (a) is the HydraProbe VSM reading taken next to the GVSM measurement. In subplot (b) is the mean of the HydraProbe VSM readings matched up.
From a comparison of Fig. 7 with Fig. 6, it is evident that the agreement between the HydraProbe readings and GVSM is equal to or better than the results obtained for the 2009 and 2015 ThetaProbe data. This could be explained by the deployed instruments, the different sets of fields sampled, the number of matchups collected per field, and the extent of the dynamic soil moisture range covered by the matchups. However, it is beyond the scope of this paper to quantify their relative contributions. Also noticeable in Fig. 7 are the small differences among the relationships represented by the groups of the data points belonging to individual stations, which again may question the added value of station-specific calibration functions. However, because of the larger number of GVSM–HydraProbe pairs (>86) and larger soil moisture range for individual stations, we decided to develop station-specific calibration functions for the HydraProbe measurements. Users of the dataset have the choice to apply the calibration function that suits their application best.
The development of calibration functions for the ThetaProbe and HydraProbe measurements consists of fitting linear regression coefficients (a and b) following the same procedure as described in Sect. 3.3 for the 5TM probe. Table 3 provides the μ and σ of the coefficients for the ThetaProbe functions along with performance metrics. Table 4 lists the same information for the HydraProbe.
Table 3Mean (μ) and standard deviation (σ) of regression coefficients (a and b) obtained for pairs of GVSM and ThetaProbe VSM and associated performance metrics (RMSE, ME, R2) for measurements taken during the 2009 and 2015 field campaigns. Two matching ThetaProbe values are used: (i) a reading next to the soil sample (in the table: site), and (ii) the mean of all readings taken at the sampling point (in the table: mean). n stands for the number of matchups.
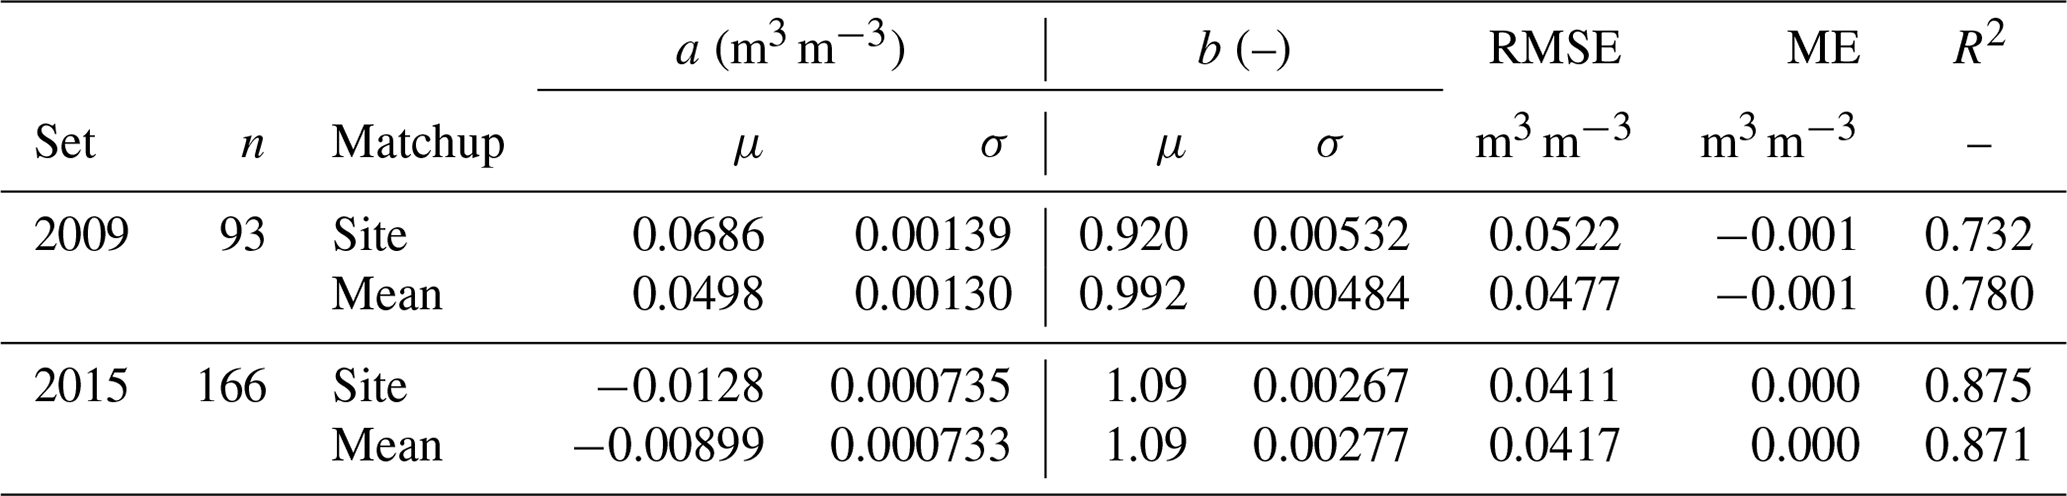
Table 4Similar to Table 3 but for calibrations of 2016–2017 HydraProbe measurements. In this case, calibration functions were also developed for individual stations.
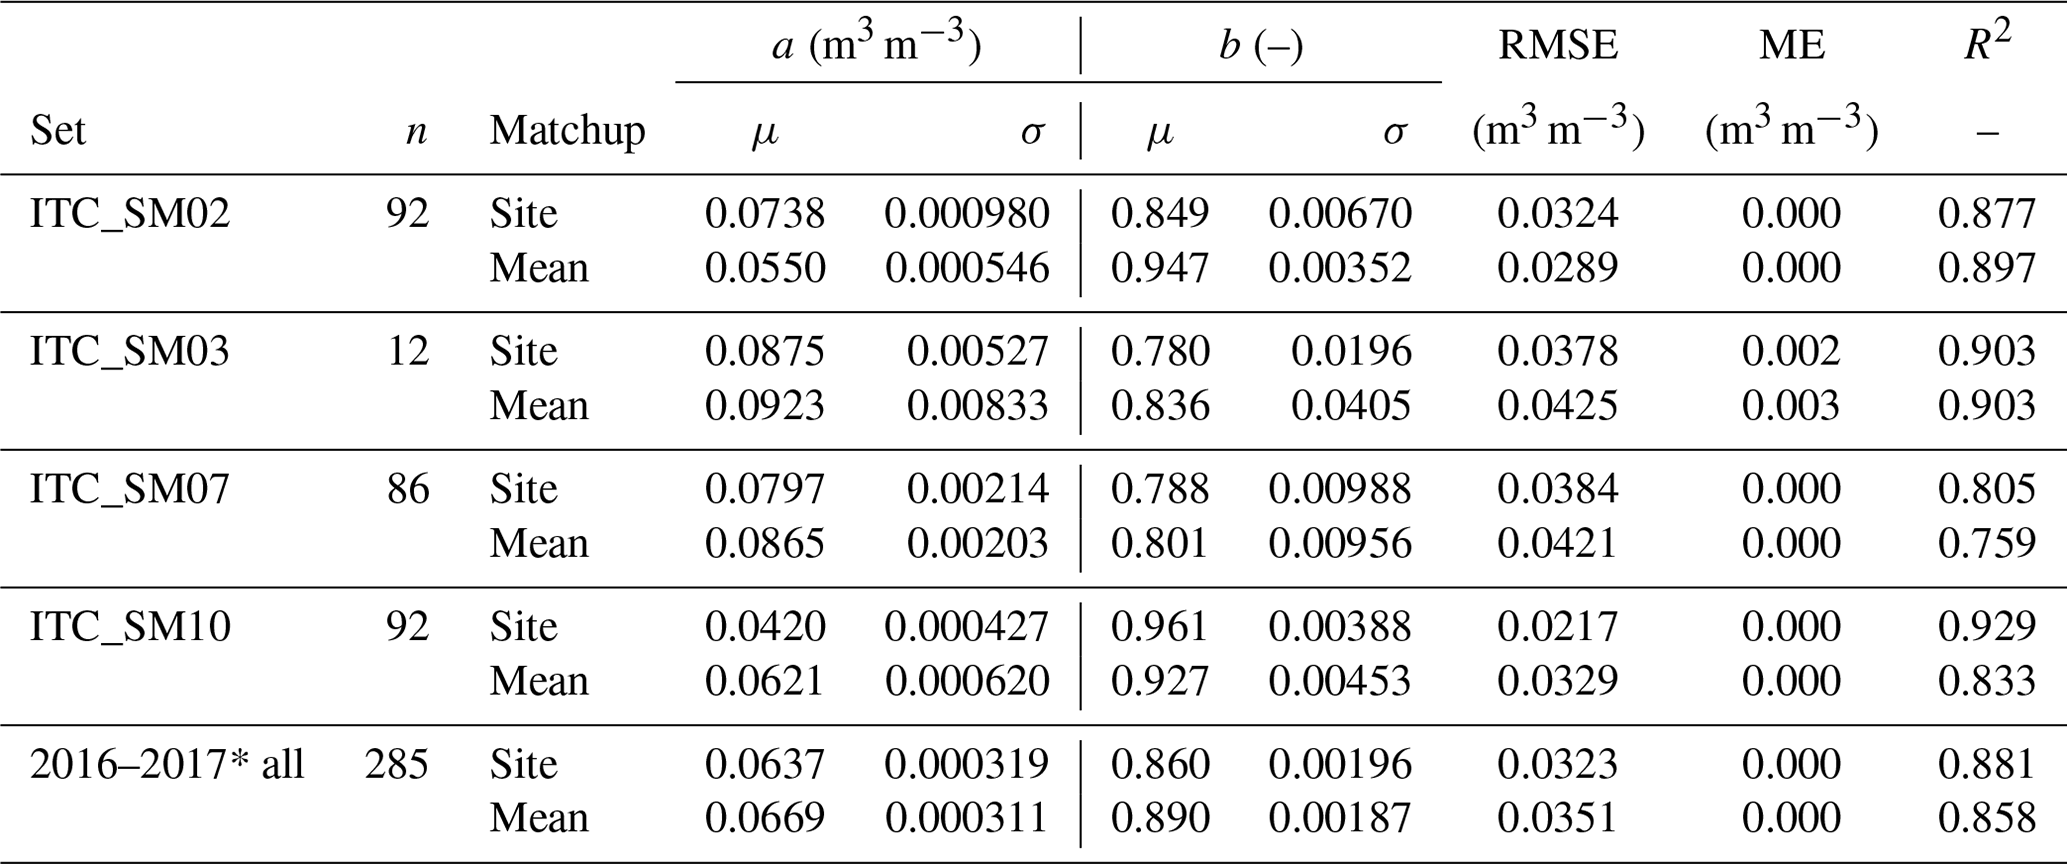
* Three pairs collected on fields adjacent to ITC_SM05 were included in the regional calibration (2016–2017).
The performance metrics presented in Tables 3 and 4 show that the matching probe (“site”) and GVSM measurements led to a better performance in terms of the R2, except for the 2009 field campaign. The same holds when comparing the RMSEs, except for the 2016–2017 results for ITC_SM02 in which case the mean of the probe readings leads to better performance. Of the field campaign calibrations, the calibration developed for the HydraProbe (2016–2017) led to the best results with an RMSE of 0.032 m3 m−3 in comparison to RMSEs of 0.041 m3 m−3 for 2015 and 0.048 m3 m−3 for 2009 obtained for the ThetaProbes. A very good match of the HydraProbe with the GVSM is obtained for ITC_SM10 with an RMSE of 0.022 m3 m−3. The explanation could be a combination of sandy soil and yearly cultivated land, which reduces disturbances due to soil clod and plant roots, and is favourable for reliable soil sampling. Under more difficult circumstances, such as the loamier soil with clods at ITC_SM07, the metrics are closer to yet still better than the ones obtained for the 2009 and 2015 field campaigns.
5.1 Sensor calibration
The soil moisture probes used for the monitoring network (EC-TM and 5TM) and the field campaigns (ThetaProbe and HydraProbe) estimate the εr through voltage measurements. Relationships between the voltage and εr are calibrated by the manufacturers using dielectric standards. A liquid with an εr of 40 is the highest for the METER group probes (personal communication: METER Group, 21 April 2021), which means that the native EC-TM and 5TM probe readings above, respectively, 0.587 and 0.510 m3 m−3 reach beyond the sensors' calibration domain. The εr is transformed into the VSM in the case of the 5TM probe using the empirical Topp et al. (1980) equation and for EC-TM probe using an equivalent third-order polynomial. The ThetaProbe and HydraProbe both determine the VSM through empirical linear relationships with the refractive index, (Gaskin and Miller, 1996; Seyfried et al., 2005), which is equivalent to a second-order polynomial.
The difference in the shape of the probe-specific εr and VSM relationships may compromise the consistency among the probe calibrations that have been performed as the native probe VSM versus the GVSM in Sects. 3.3 and 4.3. We have evaluated its theoretical implications by matching the mineral soil calibrations of the EC-TM, ThetaProbe, and HydraProbe probes with the 5TM VSM through the application of linear fits. The results are RMSEs of respectively 0.004, 0.011, and 0.010 m3 m−3 for the 5–40 εr range whereby the largest of differences of 0.025 m3 m−3 are found for the ThetaProbe and HydraProbe in the wet limit. Yet, linear relationships have been found between the different native probe VSM and the independently determined GVSM in Sects. 3.3 and 4.3. The other measurement uncertainties, such as spatial-scale mismatch and sampling errors, are dominant over the uncertainty caused by the shape of the VSM and εr relationship.
Another point of attention is the inconsistency in the firmware of probes produced in 2013 with the latest version 4.0 and the earlier ones. In 2013, the manufacturer modified their calibration process to include two dielectric standards that turned out to overestimate the εr between 10 and 20 (Chambers and Crawford, 2014). We have applied the function supplied by the manufacturer to convert the 5TM readings and developed calibration functions for both probe versions. The “all soils” calibration coefficients for firmware v4.0 are listed in Table 1 and applied accordingly.
5.2 Spatial representativeness of observed surface soil moisture
Specific for the measurement setup of the Twente monitoring network is the placement of the instrumentation at the border of parcels, which inevitably has consequences for its representativeness of the field. Large differences in the meteorological inputs, e.g. precipitation and incoming solar radiation, are not expected, but small-scale topography, spatially variable soil texture, different land covers and degrees of soil compaction as a result of agricultural management practices, and field-specific drainage infrastructure may cause discrepancies between the VSM at the border and inside of the field. Field averages derived from the surface soil moisture measurements collected during the campaigns (see Sect. 4) have been used to assess this issue. Table 5 lists the number of matchups and performance metrics computed between the field averages and matching station VSM. The metrics in the table have been developed based on crop type (grass, maize, fallow wheat, and potato) and based on days during which more than one station was sampled whereby all field and matching station VSMs are averaged.
Table 5The number of matchups and performance metrics computed between the field-averaged and matching station VSM including the RMSE, ME, coefficients a and b of the linearly regressed line, R2, and standard error of estimate (SEE).

From the metrics in the table, the field VSM sampled in grass meadows near nine permanent monitoring locations agrees, with a mean R2 of 0.50, reasonably well with the station VSM. However, the station measurements systematically underestimate the field VSM by 0.0989 m3 m−3, which may be attributed to edge effects. The border of a meadow is typically a few centimetres higher than the field itself, and grass on the field is mown multiple times per year whereas the border is not, leading to more transpiration and interception of precipitation. Large variability in the agreements between the field and station VSM is, however, noted. The R2 values range for six out of the nine stations from 0.516 to 0.793, while R2 values of 0.36 and 0.38 suggest that stations ITCSM_05 and ITCSM_18 are less representative of the fields. A poor agreement (R2 of 0.06) with the field measurements is found for ITCSM_04, which was a motivation to relocate the measurement setup within the field.
In contrast, the station VSM overestimates the measurements of the ITCSM_09 fallow wheat fields with 0.14 m3 m−3. However, the spread among the matchups around the linearly regressed line is fairly small, resulting in a high R2 of 0.794. The explanation for the overestimation could be that the field is virtually bare soil, whereas the monitoring equipment is placed at the edge of the field covered by grass.
A systematic bias with the field VSM is not noticeable in the metrics obtained for maize. The matchups for maize, however, do suffer from a larger spread among the data points as indicated by the moderate to low R2 values, 0.282 on average. On the one hand, this may be explained by the large variation in land cover across seasons having an impact on the transpiration and interception of precipitation. On the other hand, in particular, the low R2 of the intensively measured ITCSM_10 is quite surprising and cannot only be explained by variation in land cover alone. Further analysis shows that a large part of this weaker agreement stems from 2 d (19 October 2016 and 28 June 2017) with exceptionally large mismatches, which have in common that on average more than 27 mm of precipitation was recorded in total on the day itself and the day before. For 19 October, this led to a 0.21 m3 m−3 underestimation of the field's surface soil moisture and to a 0.08 m3 m−3 underestimation for 28 June. The large rain volumes on those days led to overland flow that accumulated in local depressions and led on those days to the partial flooding of fields as a result of small-scale topography, whereas the instrumentation at ITCSM_10 was installed in a slightly higher and, therefore, drier part of the field. Also, infiltration prior to a dry spell takes time and the topsoil was likely saturated, whereas the infiltration front may not have reached the 5TM influence zone.
The metrics labelled “sampling day” are based on matchups between the mean values of all field-averaged surface soil moisture and corresponding 5 cm station VSM measurements collected on a specific day. They show how the biases found for individual fields propagate when aggregated over a number of fields and provide an indication for the bias of the entire network. In support, Fig. 8 shows the mean of the field-averaged surface soil moisture and the matching mean of the 5 cm station VSM for the years 2015, 2016, and 2017 along with the mean 5 cm VSM of the entire network plus and minus the standard deviation. The time series shows that the field and station VSM match well with each other and the network mean.
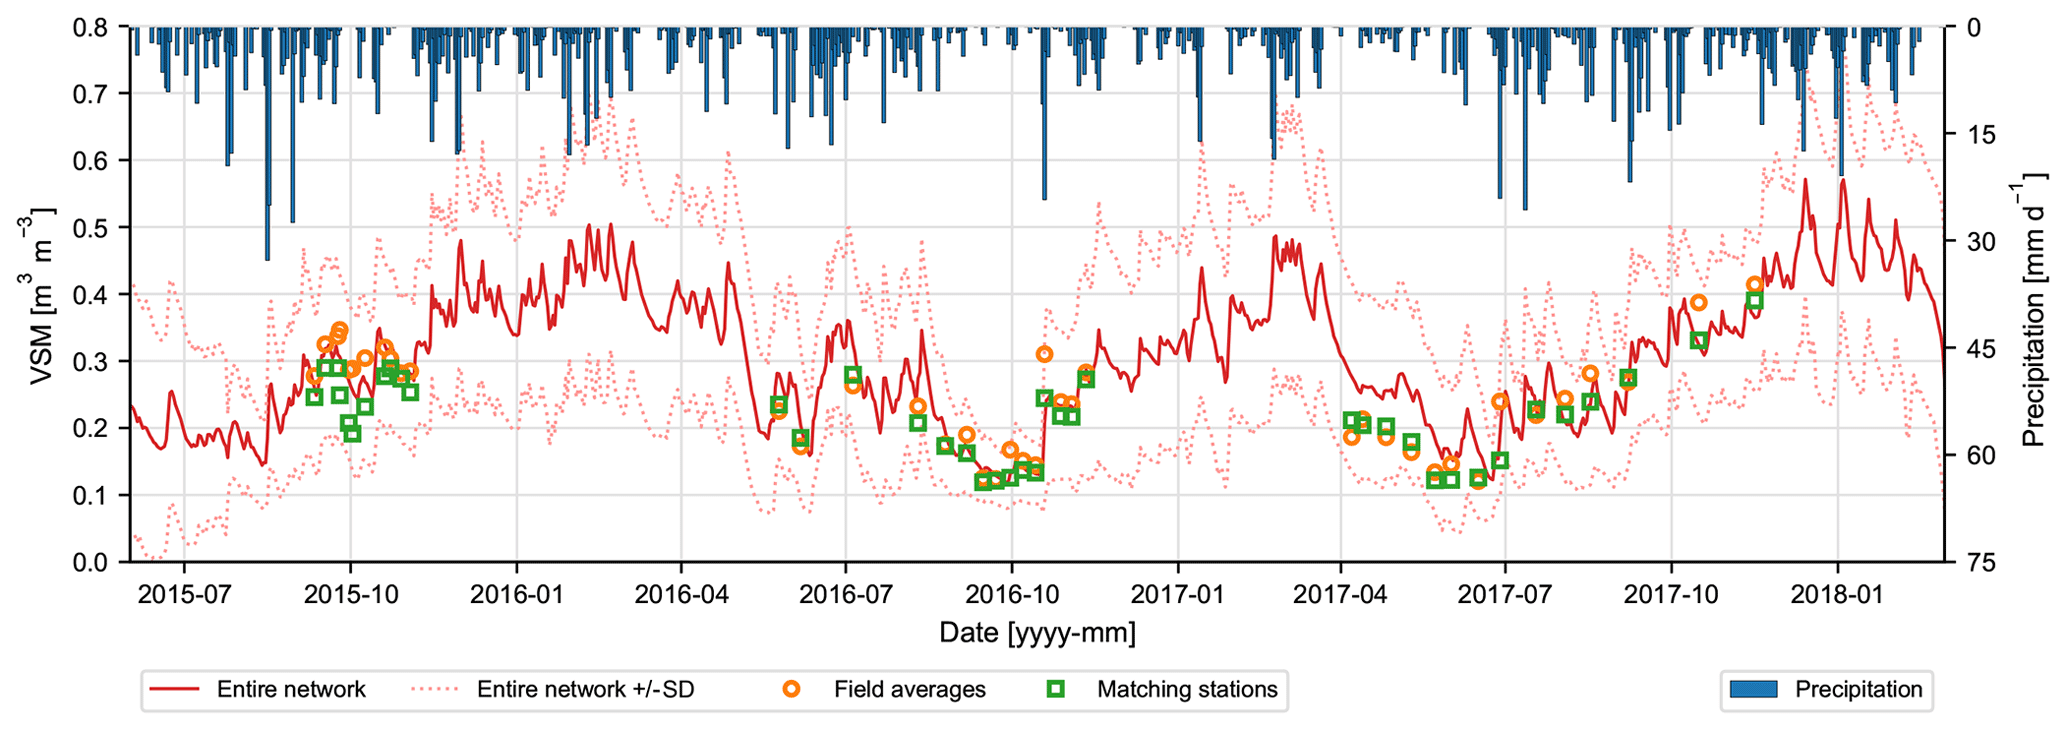
Figure 8Mean values of field-averaged surface soil moisture measured during the 2015, 2016, and 2017 field campaigns (marker: circle) and of 5 cm VSM measured at the matching monitoring stations (marker: square). The solid and dotted lines represent the mean 5 cm VSM of the entire network ± the standard deviation. The precipitation shown on the secondary axis is derived as the arithmetic mean from the data collected by the three KNMI AWSs.
The agreement between the field and station VSM is fairly good with an R2 of 0.770, while the RMSE of 0.0468 m3 m−3 may seem somewhat disappointing given the 0.04 m3 m−3 target accuracy for satellite-based soil moisture products (e.g. Entekhabi et al., 2010; Kerr et al., 2010). The large RMSE is in part attributable to the 0.0303 m3 m−3 underestimation of the field's surface soil moisture, which is specifically large after intensive rainfall, such as the events on 19 October 2016 and 28 June 2017. Also, the large dynamic range from 0.121 up to 0.414 m3 m−3 covered by the field campaigns contributes to the relatively large absolute error. Notably, a 16 % uncertainty level is obtained when performance is computed as an RMSE percentage with respect to the covered dynamic range, which is actually quite similar to previous reports (e.g. Jackson et al., 2010).
The development of the network began in the fall of 2008, and in several studies, subsets of its data records have been used primarily for the development and validation of satellite-based soil moisture products but also for agricultural and hydrometeorological studies. With this contribution, we disclose for the first time the complete, quality-checked, calibrated, and validated records of the permanent monitoring stations and the datasets collected during campaigns held in the growing seasons of 2009, 2015, 2016, and 2017. The soil moisture and temperature depth profiles collected by the network and the surface soil moisture datasets collected during the campaigns offer ample research opportunities to serve, for instance, as a reference for the development and validation of soil moisture data products and to investigate water and energy exchanges across the groundwater–vadose-zone–atmosphere continuum of lowland ecosystem.
6.1 Validation
The validation of both satellite and/or model-based soil moisture products requires the comparison of a satellite footprint/model grid cell with a reference constructed from in situ point measurements. For optimal validation, attention needs to be paid to the effects of weather (e.g. rain events, frozen soil) and the spatial and temporal representativeness of measurements. For instance, we previously reported (Van der Velde et al., 2021) that after filtering for frozen and precipitation conditions, the accuracy of a satellite soil moisture product (SMAP) improved from 0.059 to 0.043 m3 m−3. The data record of the Twente network enables further investigation of these issues.
Figure 8 shows that the mean values of all field-averaged surface soil moisture and corresponding 5 cm station VSM measurements collected on a specific campaign day match fairly well with each other (R2 of 0.770) and the mean of 5 cm station VSM of the entire network. These results provide an indication for the bias of the entire network, but the results presented in Sect. 5.2 also demonstrate that further investigations should address the effect of spatial heterogeneity at field scale. Such investigations could answer questions related to how soil moisture varies in space and how this spatial variability differs throughout seasons and is affected by weather (e.g. intensive rainfall, frozen soil, drought).
In addition, the presented data enable research into the representativeness of station VSM measured with probes installed at a depth of 5 cm for the top 5 cm soil moisture measured during campaigns that are typically considered as reference in validation studies. We carried out a preliminary analysis and found that the best match between the surface soil moisture measured during the field campaigns is found with the 5 cm station VSM that is recorded several hours up to 2 d later. The presented datasets provide an opportunity to further investigate this and the physical processes that affect the near surface soil moisture profile, in particular infiltration and evaporation.
6.2 Groundwater–vadose-zone–atmosphere nexus
As an illustration of the research prospects in the context of water and energy exchanges between the land and atmosphere, Fig. 9 presents soil moisture and temperature depth profiles measured at ITC_SM07 during the 2019 heatwave in northwestern Europe. The figure shows that as the soil dries out, after the rain events on 11 and 13 July, the amplitude of the diurnal soil temperature cycle increases. Analysing these relationships between soil moisture, soil temperature, and other essential climate variables, such as air temperature, incoming solar radiation, evapotranspiration, precipitation, and groundwater, could address research questions on the development and persistence of heatwaves and droughts.
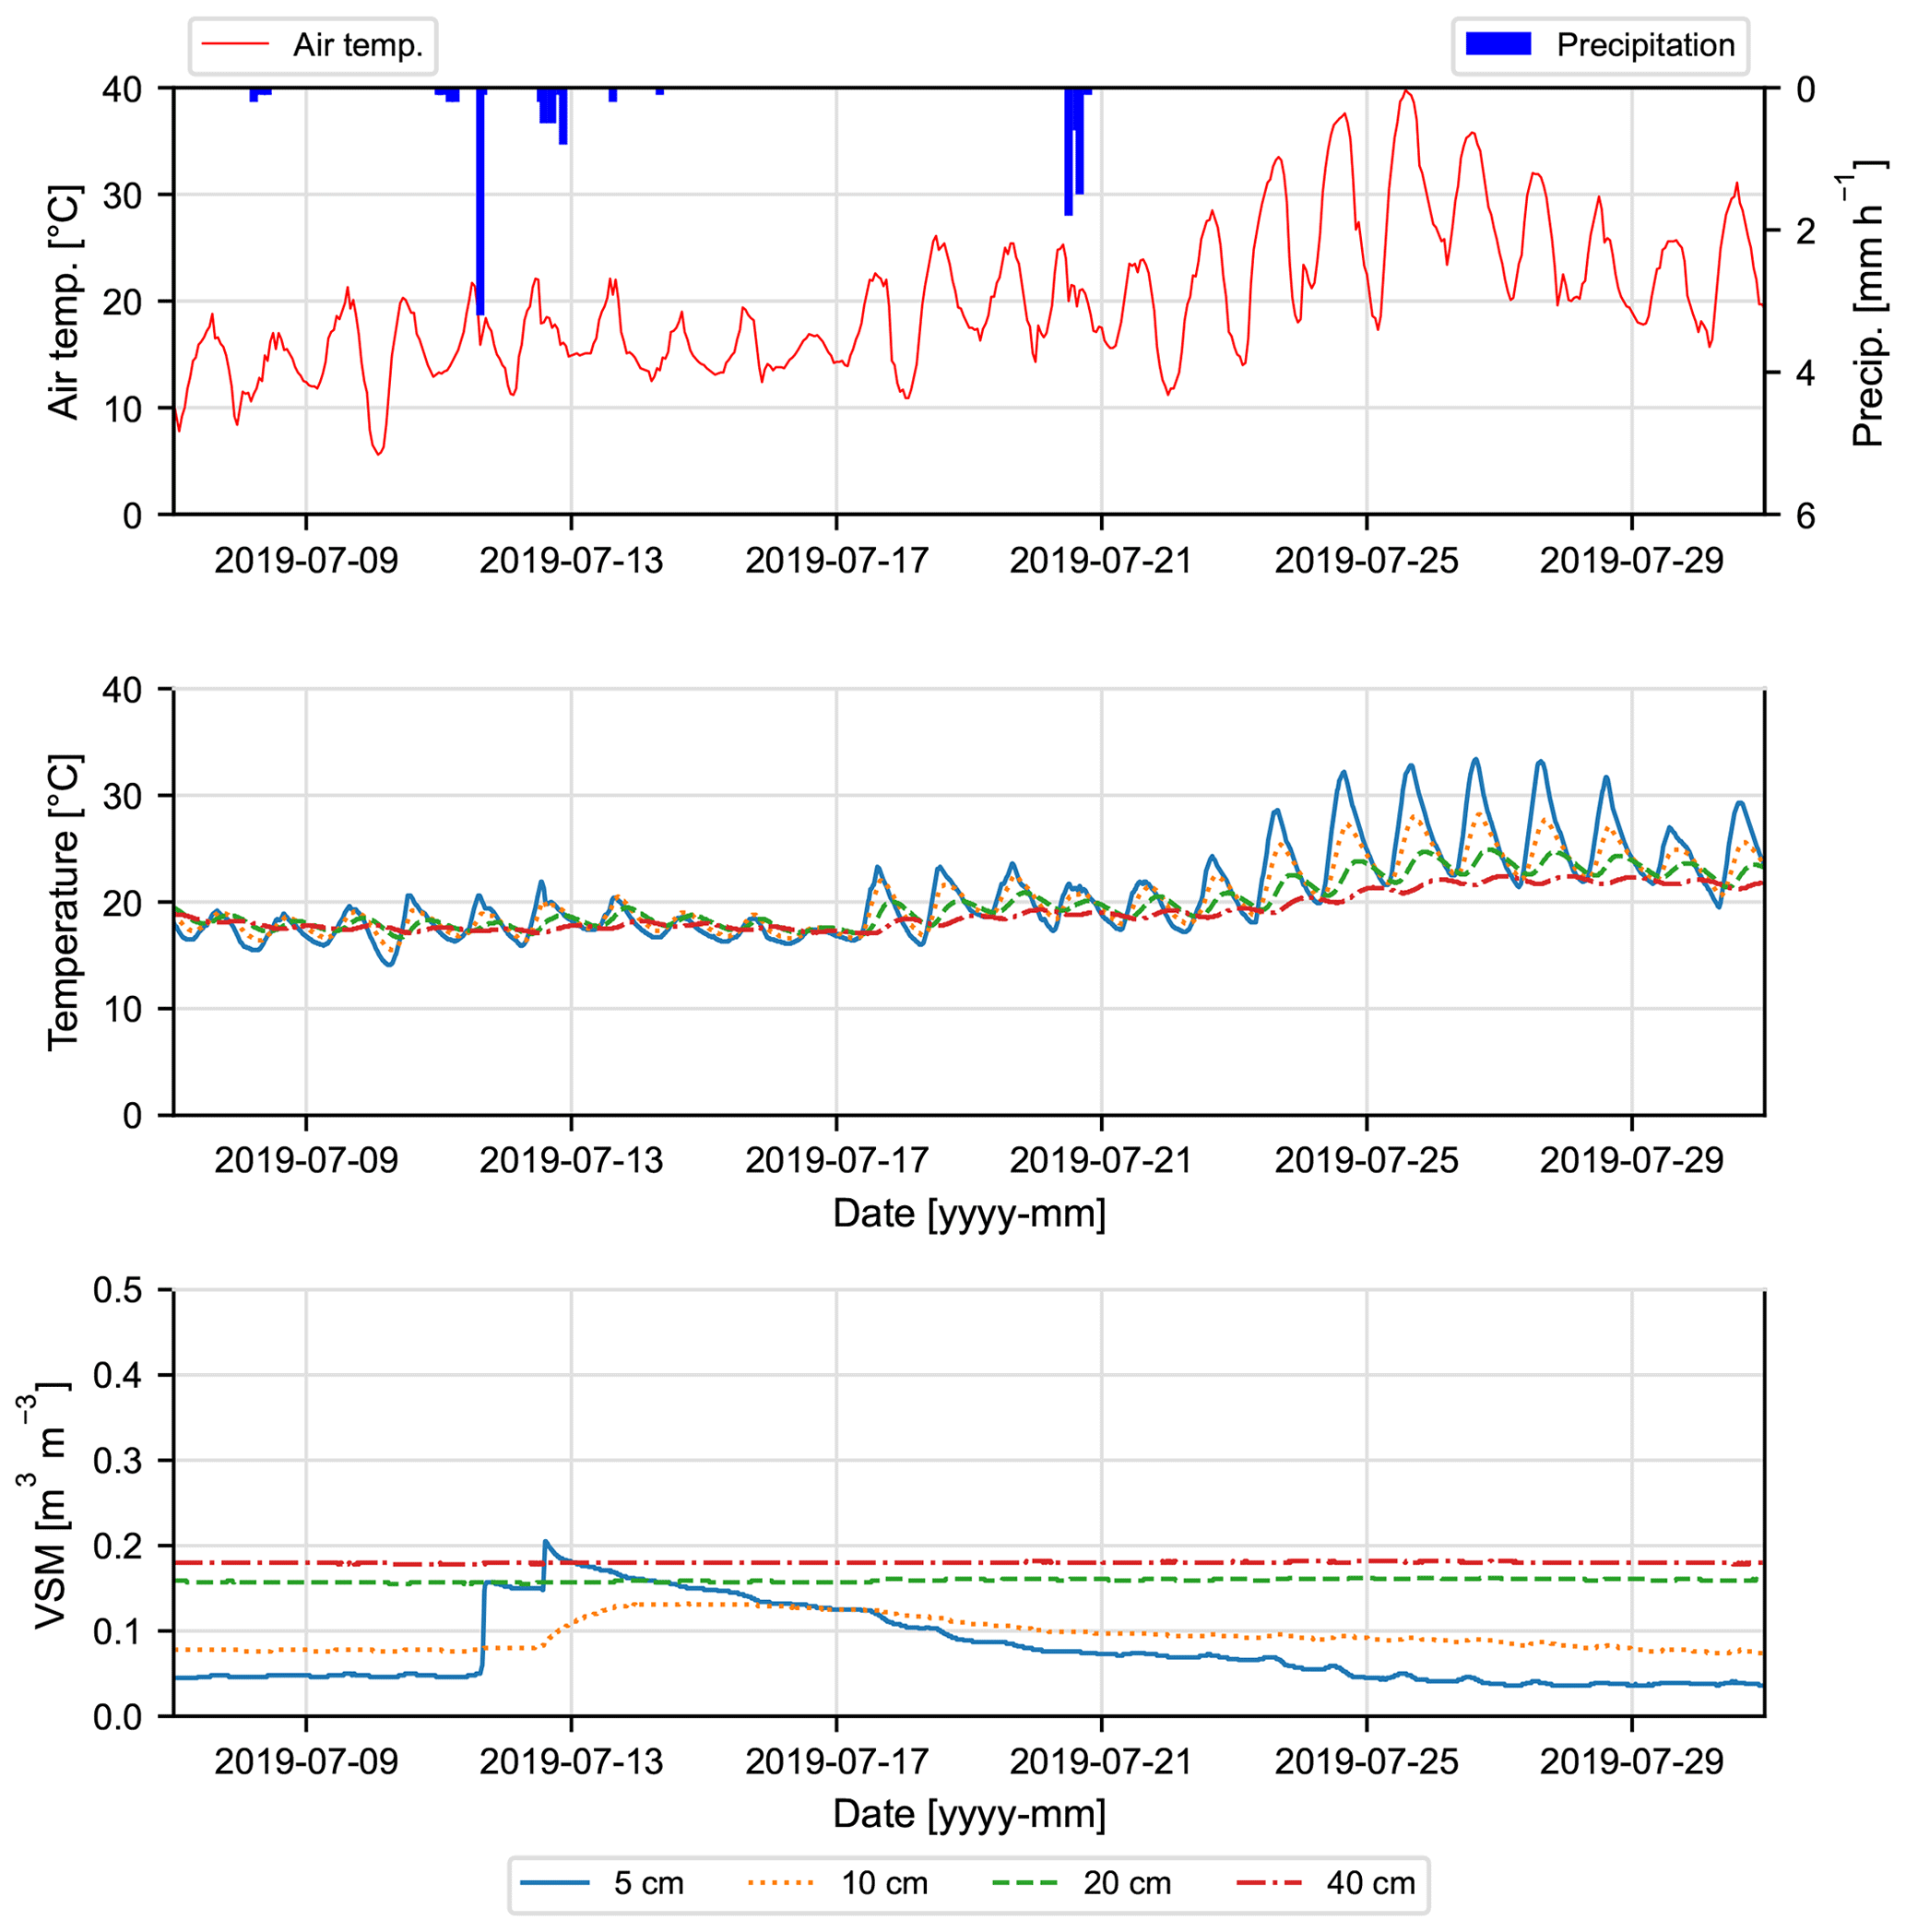
Figure 9Soil moisture and temperature depth profiles measured at ITC_SM07 from 7–31 July covering a 2019 heatwave in northwestern Europe. The upper panel shows the hourly precipitation and air temperature measured at the KNMI AWS Twenthe about 12 km southwest of ITC_SM07.
An example of the groundwater–vadose-zone–atmosphere nexus is presented in Fig. 10, which shows the soil moisture measured at depths of 5, 10, 20, 40, and 80 cm over the period from January 2016 to June 2020 for monitoring stations ITC_SM10 (Fig. 10b), ITC_SM14 (Fig. 10c), and ITC_SM17 (Fig. 10d). The groundwater level measured at the DINOLoket well closest to the respective soil moisture monitoring station (see Table S1) is shown in the same plots, and the upper panel presents the daily precipitation and daily air temperature as averages of the measurements collected at the three KNMI AWSs in the region.
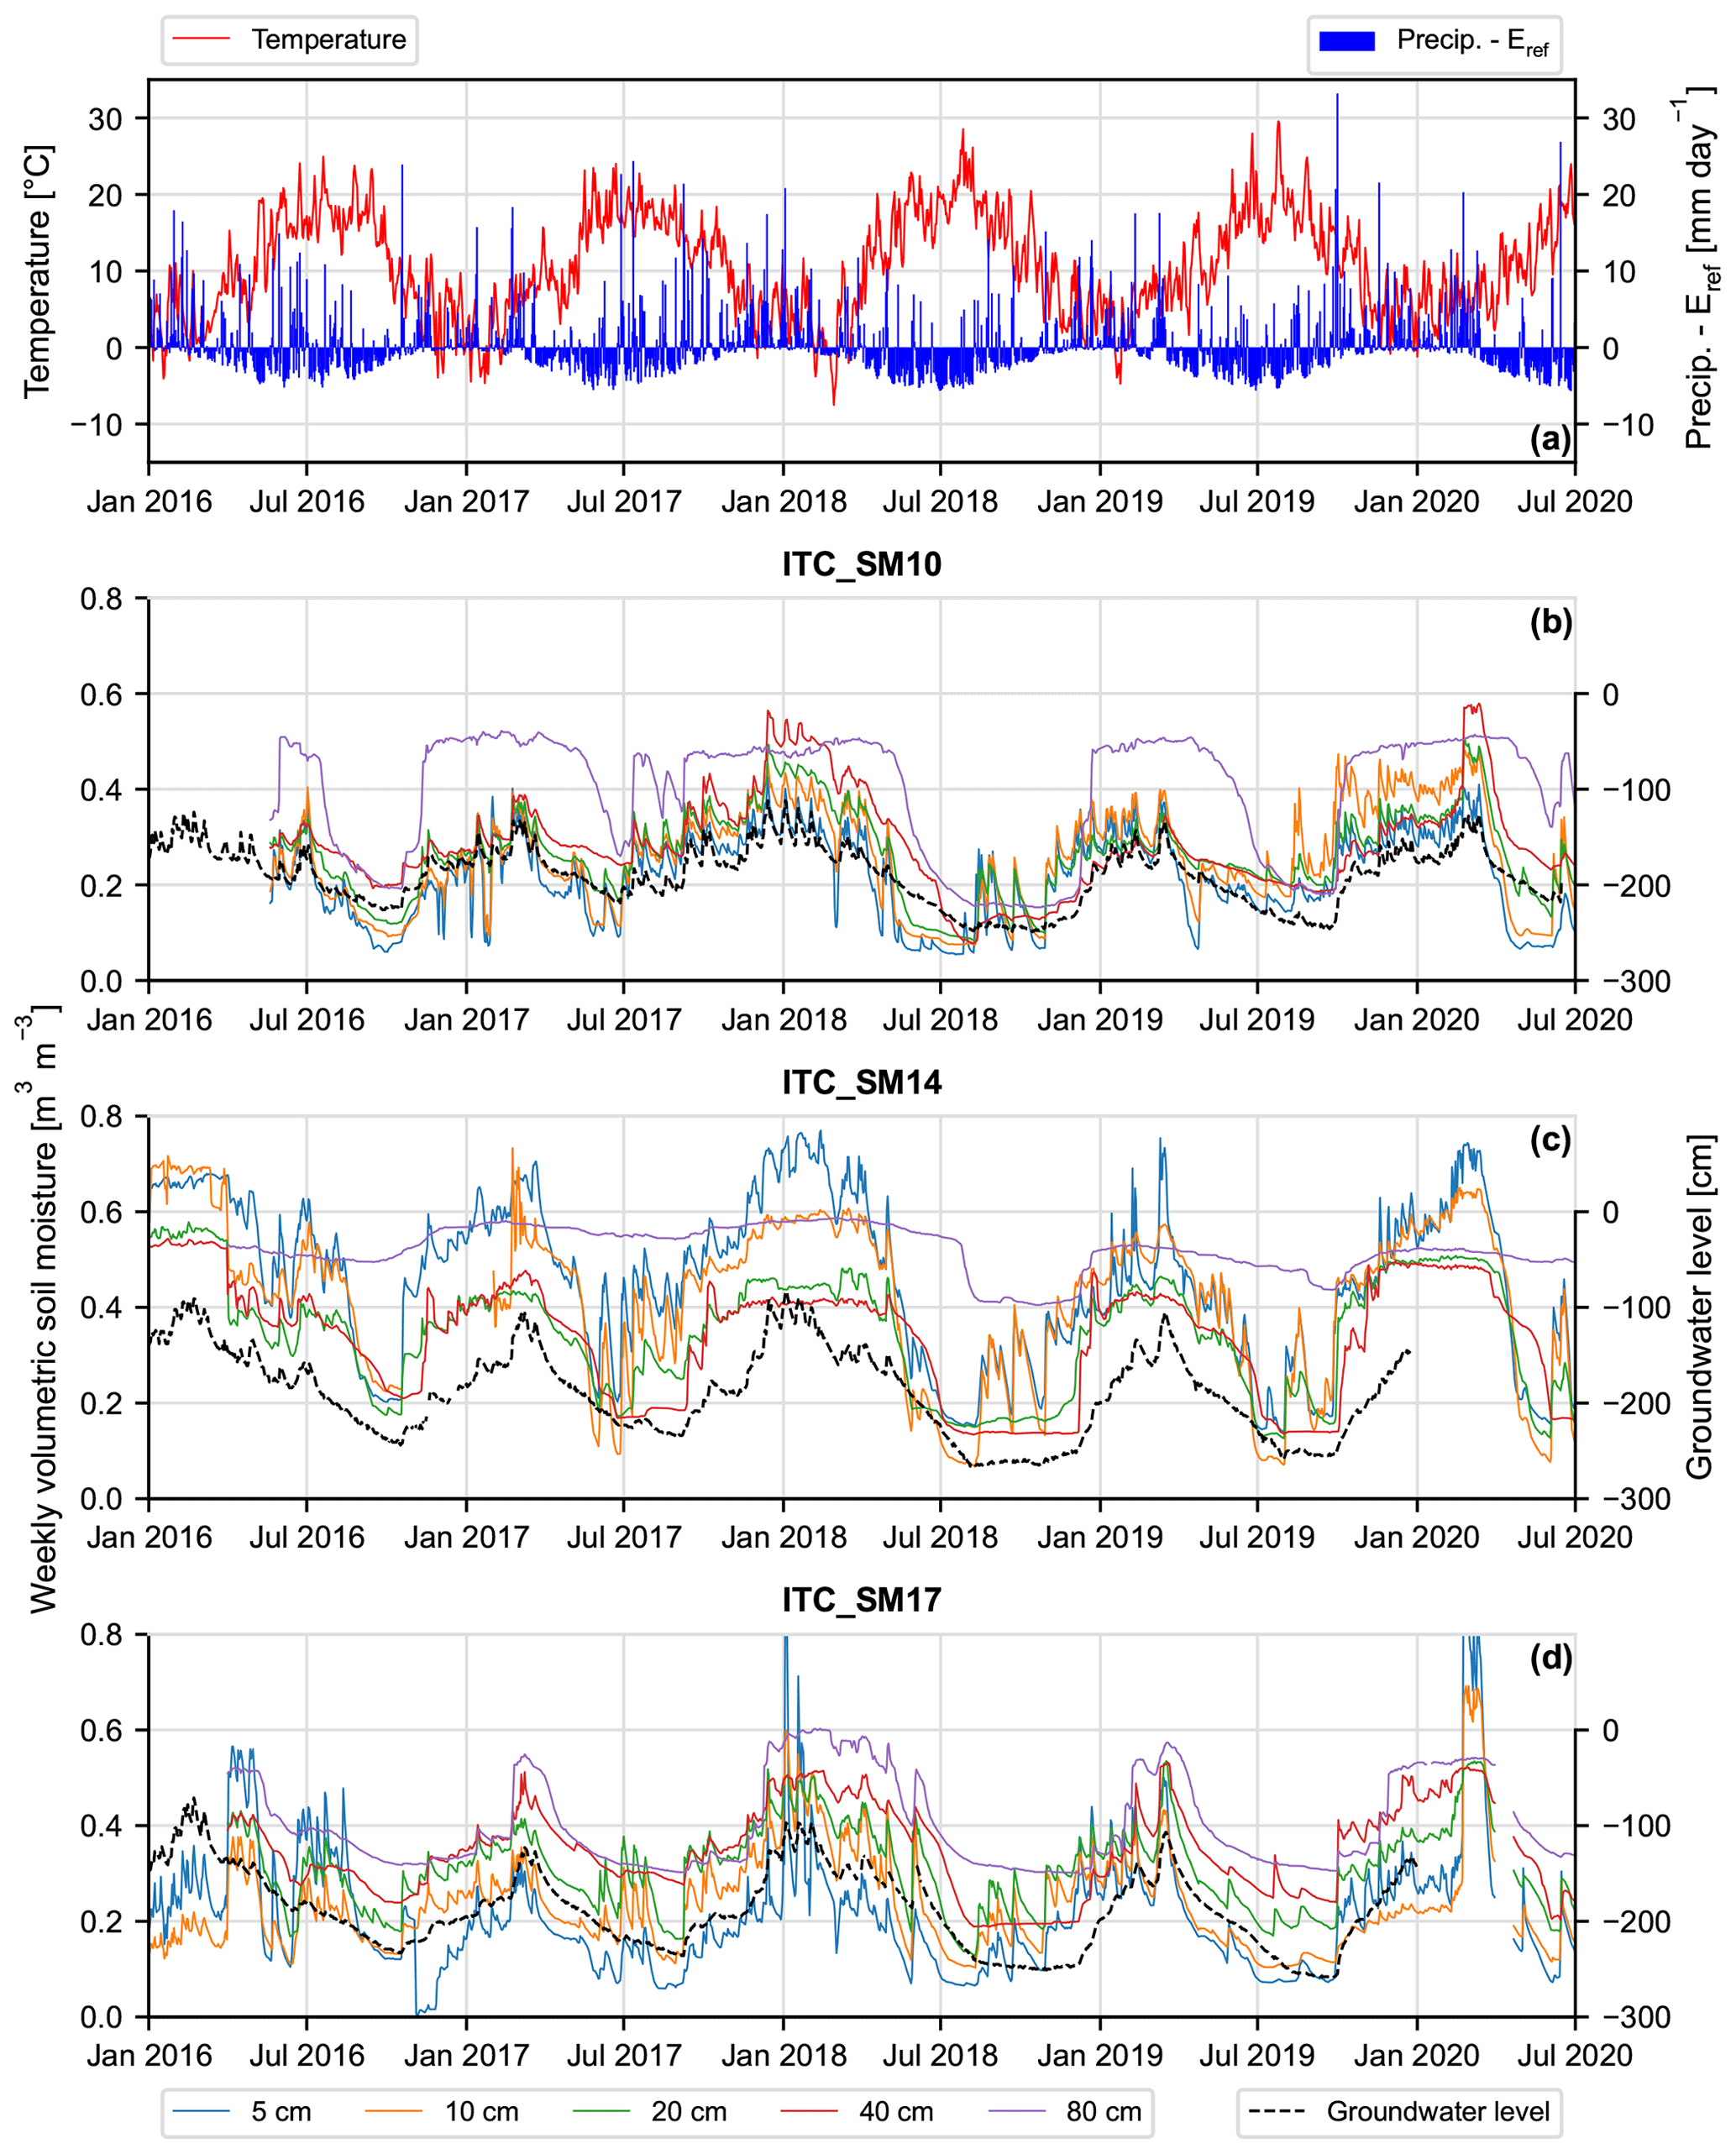
Figure 10(a) Daily rainfall and daily air temperature as averages of the three KNMI automated weather stations. (b–d) Profile of soil moisture measured at (b) ITC_SM10, (c) ITC_SM14, and (d) ITC_SM17, and groundwater level measured in the nearest well available in DINOLoket (see Table S2).
Substantial differences can be noted between the three monitoring stations, which are situated 25 to 30 km apart at elevations varying from 10 to 15 m a.m.s.l. For instance, in Fig. 10c (ITC_SM14), the 80 cm soil moisture content remained at a high level even during the peak of the 2018 drought, whereas deep drops are observed in Fig. 10b (ITC_SM10) and d (ITC_SM17). These measurements demonstrate that the position within a catchment is an important factor for the impact drought has locally, even though drought may be seen as a regional-scale process. An improved understanding of the physical processes underlying such regional differences in hydrological behaviour within lowland ecosystems could assist water managers in making better informed decisions regarding drought mitigation measures.
The overall time series confirms the seasonal dynamics of wet soils and high groundwater levels in winters, and dry circumstances with lower groundwater levels during summers. Also expected is the stronger response to precipitation of the soil moisture contents measured closest to the surface, whereas at 80 cm mainly seasonal variations are noted. Specifically at a depth of 80 cm, the effects of the 2018, 2019, and 2020 are visible, while the topsoil (5 and 10 cm) dries out nearly every summer.
Somewhat surprising in the plots is the response of the groundwater level to precipitation. In all three groundwater level series, increases can be identified after large precipitation events, whereas the soil moisture at 80 cm primarily displays seasonal variations, and individual events are hardly noticeable. Another interesting feature is that the soil moisture at 5 and 10 cm and the groundwater levels are still reasonably correlated. This can likely be attributed to the shallow groundwater table in the study area that causes a natural fast hydrological response. The groundwater table fluctuations match especially well in winter with the variations in soil moisture measured at 5 and 10 cm. The moisture contents measured at 80 cm are under those conditions less responsive to rain events because the surrounding soil is already saturated.
Hence, the disclosed datasets provide also an opportunity to further investigate the linkages between the water content in the vadose zone and the groundwater table. This knowledge may be used to provide soil moisture estimates in regions where groundwater monitoring wells are abundant or groundwater information based on surface soil moisture observed from space in countries where groundwater monitoring networks are absent. The latter has previously been conducted by Sutanudjaja et al. (2013), who estimated groundwater level across the Rhine–Meuse River basin using time series of soil water index retrieved from coarse-resolution scatterometer data. The present dataset allows for more detailed investigations of the relationship between the phreatic groundwater and soil moisture and how they behave in space and time. Moreover, the spatial measurement density of the Twente network and the field campaign data, the access to the other relevant data documented in this paper, and the availability of higher-resolution soil moisture products (e.g. Bauer-Marschallinger et al., 2019; Das et al., 2019) make it possible to study smaller-scale applications than were addressed before.
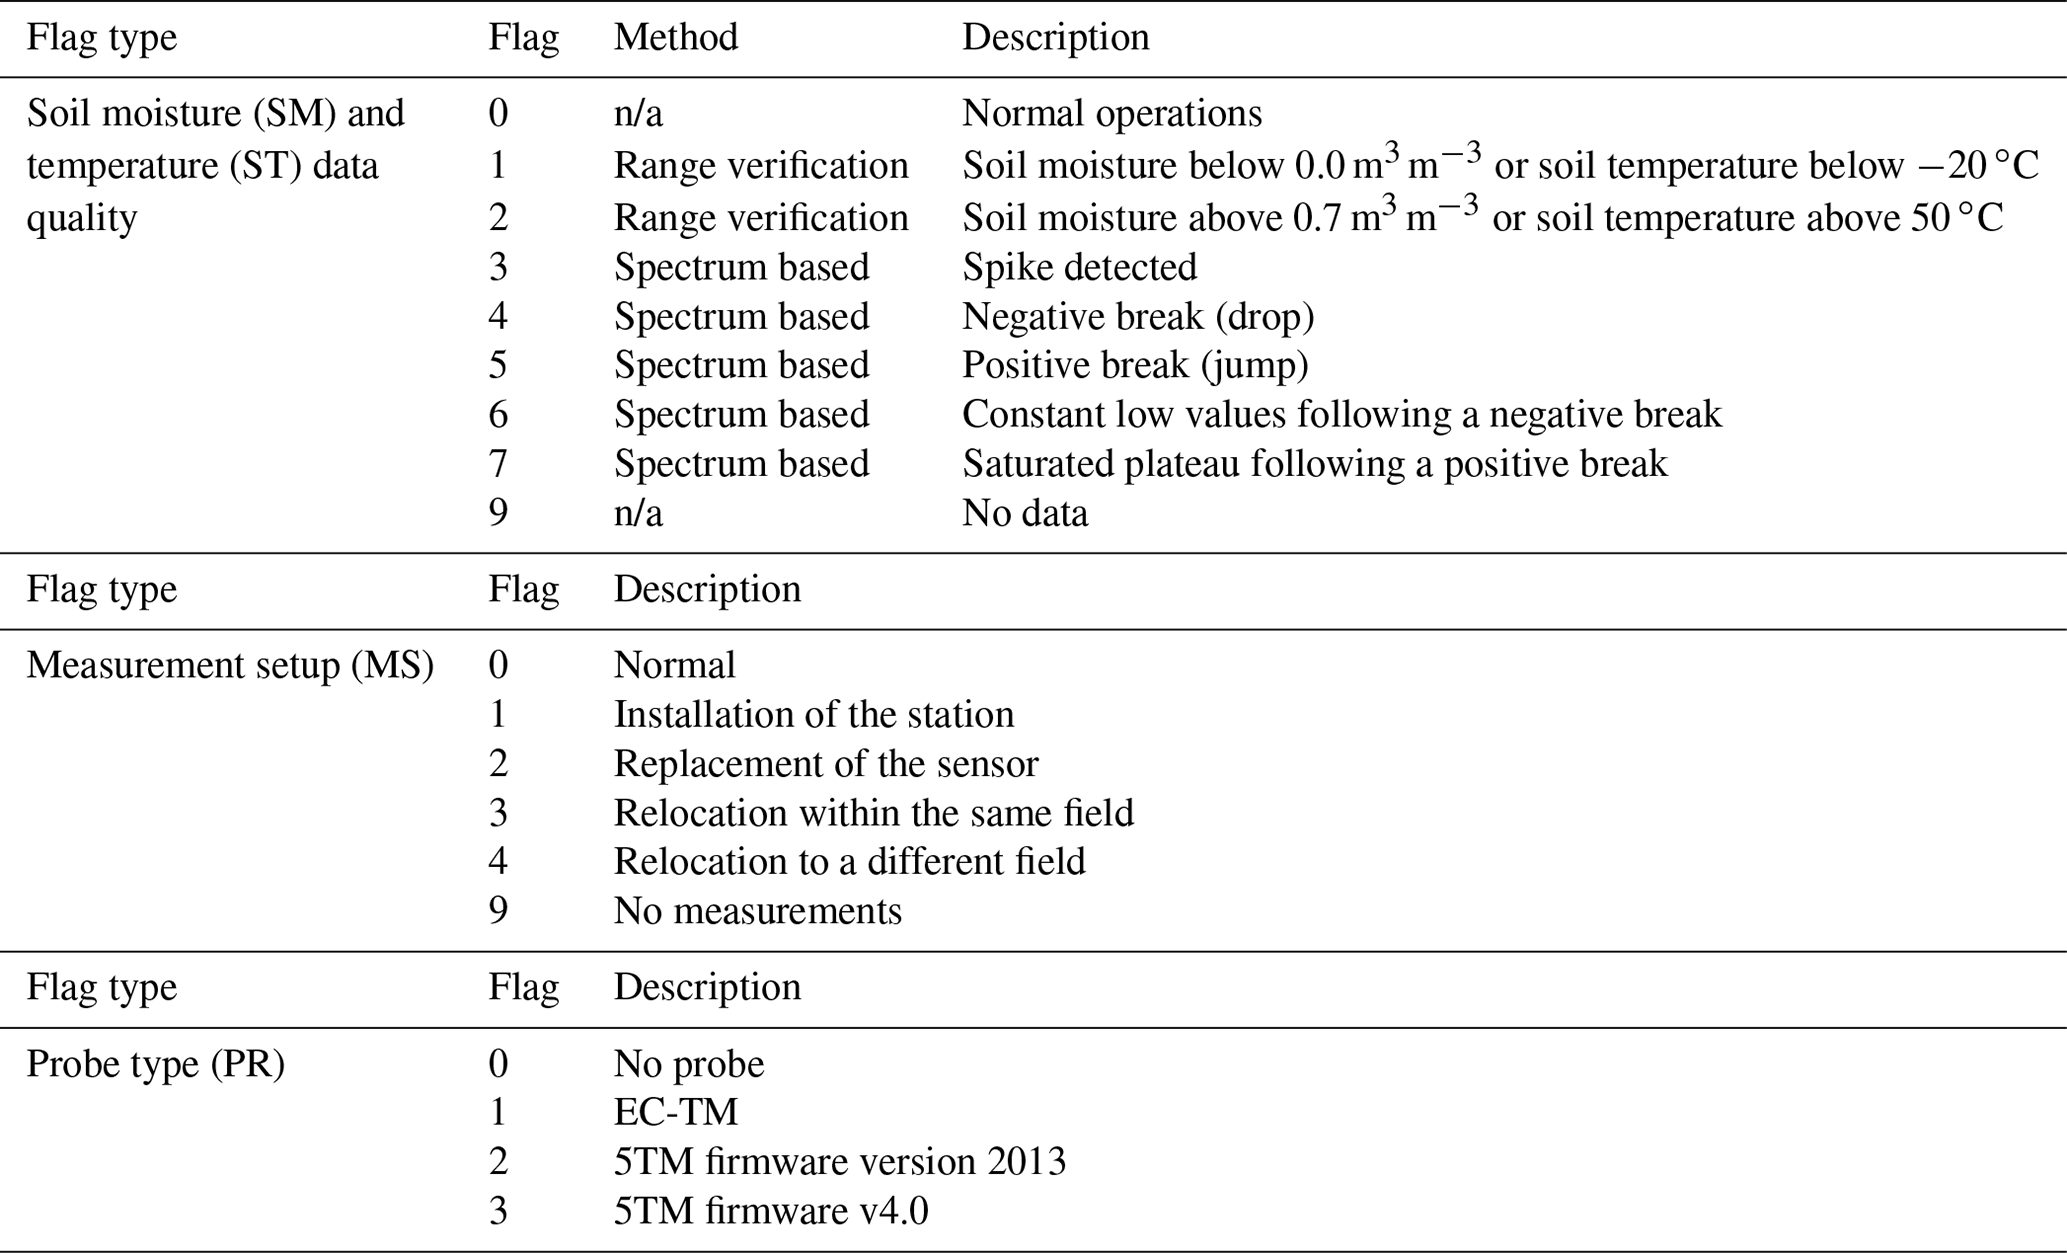
Table 6Soil moisture and temperature data quality, measurements, setup and probe-type flags included in the DQ files created based on the calibrated data files. n/a stands for “not applicable”.
The datasets are made available at three processing levels referred to as raw, processed, and calibrated data. The raw data are the native EM50 data logger files organised per monitoring station. These files are in the MS Excel 97-2003 format and have two worksheets, of which one includes the unprocessed data (digital numbers) and the other holds soil moisture and soil temperature measurements converted from the digital numbers using default calibration functions. For details, we refer to the EC-TM and 5TM manuals (METER Group, 2019) and the readme file provided together with the dataset. The processed data have been developed from the raw data and checked for missing time stamps, missing values have been replaced with −99.999, time stamps have been converted to a consistent date–time format (dd-mm-yyyy hh:mm), and placed in chronological order starting with 1 January of the year the station was installed until 31 December of the year operations were stopped or 2020. The resulting data files, one for each station, have been converted into comma-separated values (CSV) files with suffix _pd. The calibrated data have been obtained through application of the developed calibration functions (Sect. 3.3) to the processed data and are included in the CSV files with suffix _cd.
DQ flags have been created, providing details related to the measurement setup and the reliability of the calibrated data in an automated manner. The DQ flags are documented in separate CSV files with suffix _fg. The files include four sets of flags indicative of the quality of (i) the soil moisture and (ii) the soil temperature data and (iii) specifics related to the measurements setup and (iv) probe type. The DQ flags start respectively with “SM”, “ST”, “MS”, and “PR”, followed by five integers each referring to one of the respective five ports of the EM50 data logger. The automated quality control procedure reported in Dorigo et al. (2013, 2021) has been adopted for (i) and (ii), except for the flags that require external datasets. Table 6 lists the flags and the descriptions for the four flag types. Only the highest digit is visible within the dataset, implying that the order of the flags is associated with an increase in concern for the data quality.
The raw data from the field campaigns are organised on a yearly basis. The processed data consist of soil moisture contents obtained through the application of the default calibration function to the native probe readings and the calibrated data are the processed soil moisture contents to which the field campaign-specific calibration functions have been applied. Details on the data processing can be found in the readme document accompanying the dataset. Both the processed and calibrated data are combined in CSV formatted file with suffix _pd_cd for the stations where field campaigns took place.
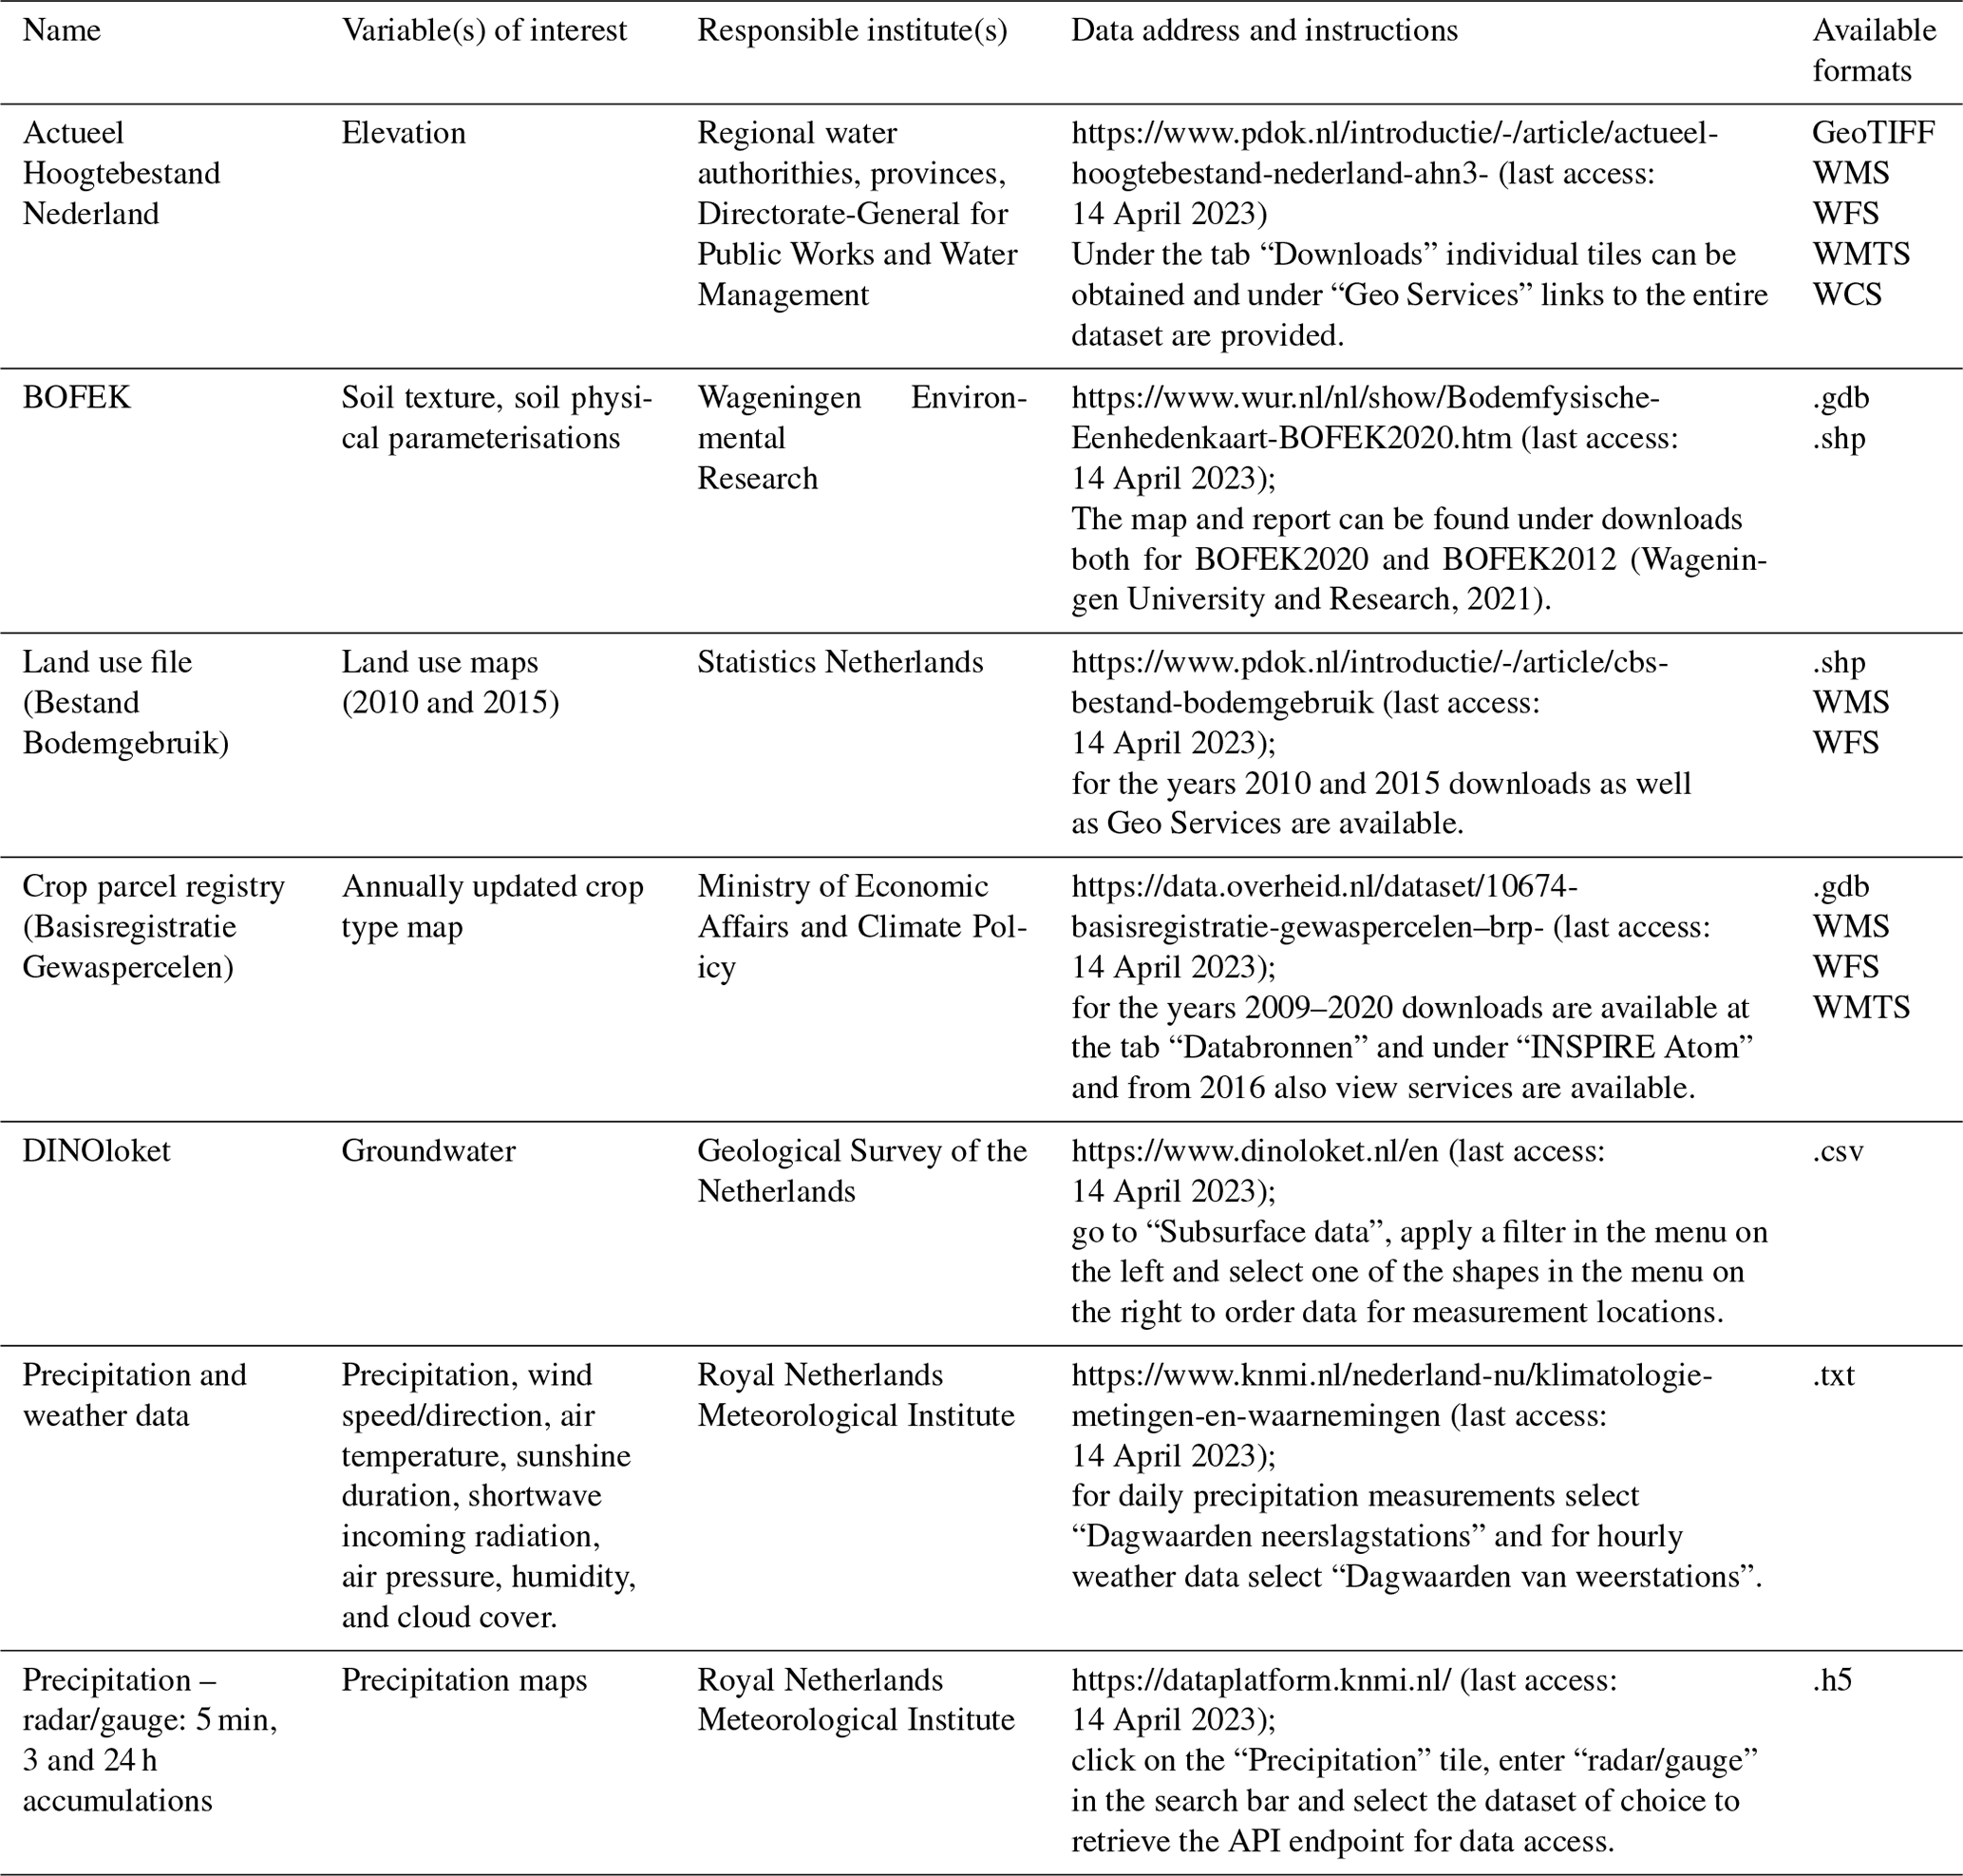
The above-described datasets, coordinates of the monitoring stations, and photos taken during field visits are publicly available at https://doi.org/10.17026/dans-znj-wyg5 (Van der Velde et al., 2022). Folder and file structures and the processing steps are described in a readme file. Table 7 lists the third-party datasets that are available for the study region.
Table 7Open third-party datasets available for the study region described in Sect. 2.
Soil moisture and temperature profile measurements from 2008 to 2020 have been automatically collected at 15 min intervals by a network of 20 permanent monitoring stations spread across the Twente region and neighbouring regions in the east of the Netherlands. The monitoring stations are mostly placed at the border of privately owned parcels used for agriculture with, in order of occurrence, grass, maize, cereals, potato, and natural vegetation as land covers. The experimental setup includes METER Group (formerly Decagon) EC-TM and its successor 5TM capacitance probes installed at nominal depths of 5, 10, 20, 40, and 80 cm. Soil-specific calibration functions have been developed under controlled laboratory conditions for both probe types yielding accuracies of 0.023 and 0.028 m3 m−3 for the EC-TM and 5TM, respectively.
In addition, field campaign data covering the growing seasons of 2009, 2015, 2016, and 2017 are described and disclosed, during which the top 5 cm soil moisture content was measured with handheld probes (Delta-T ThetaProbe, and Stevens HydraProbe) and via soil sampling on a total of 28 fields near 12 different monitoring stations. Pairs of gravimetrically determined soil moisture and probe readings were used to establish calibration functions for the ThetaProbe and HydraProbe. The obtained accuracies for the probe calibrations vary from 0.048 m3 m−3 for the ThetaProbe measurements in 2009 up to 0.032 m3 m−3 for the HydraProbe measurements collected in 2016–2017.
The spatial representativeness of the permanent monitoring stations is investigated through comparisons with the in situ measurements collected during the campaigns, which is found to result for the entire network in a coefficient of determination (R2) of 0.770 and a root mean squared error (RMSE) of 0.0468 m3 m−3. An important part of the RMSE is attributable to a 0.0303 m3 m−3 underestimation, which is particularly apparent for individual grass fields and is generally strong after heavy rainfall.
The soil moisture and temperature datasets offered by the network of permanent monitoring stations and the field campaign datasets provide opportunities to further study and quantify the uncertainties associated with the development of soil moisture references, for instance, to develop and validate satellite and model-based soil moisture products at the scale of footprints and grid cells. This may, for instance, be relevant for the development of calibration/validation plans for upcoming synthetic aperture radar (SAR) missions, such as the NASA-ISRO SAR mission (NISAR; Kellogg et al., 2020) and the Radar Observing System of Europe L-band (ROSE-L; Davidson and Furnell, 2021), which both have soil moisture included as part of their mission objectives. The datasets may further prove of value for investigations focused on the water and energy exchange across the groundwater–vadose-zone–atmosphere continuum of lowland ecosystems, which is particularly relevant in a changing climate due to which these environments are expected to face more frequent occurrences of floods and droughts.
Scientists and professionals worldwide are invited to make free use of the datasets disclosed with this contribution for any purpose that may fit under a Creative Commons, CC BY 4.0 license. Descriptions of open third-party datasets are provided to support the use of the measurements. We welcome any comments or suggestions that can help improve the quality and usability of the datasets. The data collected with the Twente network continue, but plans are underway to update the design of the network to contemporary societal and scientific needs. This may include flood and drought analyses and high-resolution satellite product validation.
The supplement related to this article is available online at: https://doi.org/10.5194/essd-15-1889-2023-supplement.
RvdV and HJFB contributed to the fieldwork, data processing, data quality control, conceptualisation, and writing of the paper. HJFB led the data quality control. BR assisted with the data analysis. MSS assisted with the data analysis and writing of the paper. PCV assisted with writing and is responsible for the continuation of the monitoring network. RvdV coordinated and led the writing of the paper.
The contact author has declared that none of the authors has any competing interests.
Publisher's note: Copernicus Publications remains neutral with regard to jurisdictional claims in published maps and institutional affiliations.
The authors thank the farmers who provided free access to the parcels where the monitoring stations have been installed. The Royal Netherlands Academy of Arts and Sciences (KNAW) is acknowledged for the support via the small data project (Klein Data Project) programme for making the dataset available through its DANS (Data Archiving and Networked Services) platform, project no. KDP002. Laura Dente, Zoltan Vekerdy, and Bob Su are acknowledged for their role in the development and involvement of the monitoring network until 2012. Murat Ucer is mentioned for his contribution to field data collection. Further, the authors would like to thank all the students and researchers who participated in the field data collection over the years.
This research has been supported by the Koninklijke Nederlandse Akademie van Wetenschappen (grant no. KDP-002).
This paper was edited by Sibylle K. Hassler and reviewed by two anonymous referees.
Actueel Hoogtebestand Nederland (AHN): Actueel Hoogtebestand Nederland, https://www.ahn.nl (last access: 14 April 2023), 2019.
Bakke, S. J., Ionita, M., and Tallaksen, L. M.: The 2018 northern European hydrological drought and its drivers in a historical perspective, Hydrol. Earth Syst. Sci., 24, 5621–5653, https://doi.org/10.5194/hess-24-5621-2020, 2020.
Bauer-Marschallinger, B., Freeman, V., Cao, S., Paulik, C., Schaufler, S., Stachl, T., Modanesi, S., Massari, C., Ciabatta, L., Brocca, L., and Wagner, W.: Toward Global Soil Moisture Monitoring With Sentinel-1: Harnessing Assets and Overcoming Obstacles, IEEE T. Geosci. Remote, 57, 520–539, https://doi.org/10.1109/TGRS.2018.2858004, 2019.
Beck, H. E., Zimmermann, N. E., McVicar, T. R., Vergopolan, N., Berg, A., and Wood, E. F.: Present and future Köppen-Geiger climate classification maps at 1-km resolution, Nat. Sci. Data, 5, 180214, https://doi.org/10.1038/sdata.2018.214, 2018.
Benninga, H. F., van der Velde, R., and Su, Z.: Sentinel-1 soil moisture content and its uncertainty over sparsely vegetated fields, J. Hydrol., 9, 1–17, https://doi.org/10.1016/j.hydroa.2020.100066, 2020.
Benninga, H. F., van der Velde, R., and Su, Z.: Soil moisture content retrieval over meadows from Sentinel-1 and Sentinel-2 data using physically based scattering models, Remote Sens. Environ., 280, 113191, https://doi.org/10.1016/j.rse.2022.113191, 2022.
Benninga, H.-J. F., Carranza, C. D. U., Pezij, M., van Santen, P., van der Ploeg, M. J., Augustijn, D. C. M., and van der Velde, R.: The Raam regional soil moisture monitoring network in the Netherlands, Earth Syst. Sci. Data, 10, 61–79, https://doi.org/10.5194/essd-10-61-2018, 2018.
Bircher, S., Skou, N., Jensen, K. H., Walker, J. P., and Rasmussen, L.: A soil moisture and temperature network for SMOS validation in Western Denmark, Hydrol. Earth Syst. Sci., 16, 1445–1463, https://doi.org/10.5194/hess-16-1445-2012, 2012.
Bogena, H., White, T., Bour, O., Li, X., and Jensen, K.: Toward Better Understanding of Terrestrial Processes through Long-Term Hydrological Observatories, Vadose Zone J., 17, 1–10, https://doi.org/10.2136/vzj2018.10.0194, 2018.
Bogena, H. R., Huisman, J. A., Oberdörster, C., and Vereecken, H.: Evaluation of a low-cost soil water content sensor for wireless network applications, J. Hydrol., 344, 32–42, https://doi.org/10.1016/j.jhydrol.2007.06.032, 2007.
Brutsaert, W.: Hydrology – An Introduction, Cambridge University Press, Cambridge, United Kingdom, ISBN 978-0-521-82479-8, 2005.
Buitink, J., Swank, A. M., van der Ploeg, M., Smith, N. E., Benninga, H.-J. F., van der Bolt, F., Carranza, C. D. U., Koren, G., van der Velde, R., and Teuling, A. J.: Anatomy of the 2018 agricultural drought in the Netherlands using in situ soil moisture and satellite vegetation indices, Hydrol. Earth Syst. Sci., 24, 6021–6031, https://doi.org/10.5194/hess-24-6021-2020, 2020.
Buras, A., Rammig, A., and Zang, C. S.: Quantifying impacts of the 2018 drought on European ecosystems in comparison to 2003, Biogeosciences, 17, 1655–1672, https://doi.org/10.5194/bg-17-1655-2020, 2020.
Caldwell, T. G., Bongiovanni, T., Cosh, M. H., Jackson, T. J., Colliander, A., Abolt, C. J., Casteel, R., Larson, T., Scanlon, B. R., and Young, M. H.: The Texas Soil Observation Network: A Comprehensive Soil Moisture Dataset for Remote Sensing and Land Surface Model Validation, Vadose Zone J., 18, 1–20, https://doi.org/10.2136/vzj2019.04.0034, 2019.
Calvet, J.-C., Fritz, N., Froissard, F., Suquia, D., Petitpa, A., and Piguet, B.: In situ soil moisture observations for the CAL/VAL of SMOS: the SMOSMANIA network, International Geoscience and Remote Sensing Symposium, IGARSS, Barcelona, Spain, 23–28 July 2007, 1196–1199, https://doi.org/10.1109/IGARSS.2007.4423019, 2007.
Campbell, J. E.: Dielectric Properties and Influence of Conductivity in Soils at One to Fifty Megahertz, Soil Sci. Soc. Am. J., 54, 332–341, https://doi.org/10.2136/sssaj1990.03615995005400020006x, 1990.
Carranza, C., Benninga, H. J., van der Velde, R., and van der Ploeg, M.: Monitoring agricultural field trafficability using Sentinel-1, Agr. Water Manage., 224, 105698, https://doi.org/10.1016/j.agwat.2019.105698, 2019.
Carranza, C. D. U., van der Ploeg, M. J., and Torfs, P. J. J. F.: Using lagged dependence to identify (de)coupled surface and subsurface soil moisture values, Hydrol. Earth Syst. Sci., 22, 2255–2267, https://doi.org/10.5194/hess-22-2255-2018, 2018.
Chambers, C. and Crawford, L.: Customer Notification: attention 5TM, 5TE and GS3 calibrations, Decagon Devices, Pullman, United States of America, http://publications.metergroup.com/Sales and Support/METER Environment/Customer notification 5TM 2014 issue.pdf (last access: 19 April 2023), 2014.
Chan, S. K., Bindlish, R., O'Neill, P., Jackson, T., Njoku, E., Dunbar, R. S., Chaubell, J., Piepmeier, J., Yueh, S., Entekhabi, D., Colliander, A., Chen, F., Cosh, M. H., Caldwell, T. G., Walker, J., Berg, A. A., McNairn, H., Thibeault, M., Martínez-Fernández, J., Uldall, F., Seyfried, M., Bosch, D. D., Starks, P. J., Holifield-Collins, C. D., Prueger, J. H., van der Velde, R., Asanuma, J., Palecki, M., Small, E. E., Zreda, M., Calvet, J. C., Crow, W. T., and Kerr, Y. H.: Development and assessment of the SMAP enhanced passive soil moisture product, Remote Sens. Environ., 204, 931–941, https://doi.org/10.1016/j.rse.2017.08.025, 2018.
Chaubell, M. J., Yueh, S. H., Scott Dunbar, R., Colliander, A., Chen, F., Chan, S. K., Entekhabi, D., Bindlish, R., O'Neill, P. E., Asanuma, J., Berg, A. A., Bosch, D. D., Caldwell, T., Cosh, M. H., Collins, C. H., Martinez-Fernandez, J., Seyfried, M., Starks, P. J., Su, Z., Thibault, T., and Walker, J.: Improved SMAP Dual-Channel Algorithm for the Retrieval of Soil Moisture, IEEE T. Geosci. Remote, 58, 3894–3905, https://doi.org/10.1109/TGRS.2019.2959239, 2020.
Cobos, D. R. and Chambers, C.: Application Note: Calibrating ECH2O Soil Moisture Sensors, Decagon Devices, Inc., Pullman, WA, USA, https://eu.ictinternational.com/content/uploads/2014/03/13393-04-CalibratingECH2OSoilMoistureProbes.pdf (last access: 14 April 2023), 2010.
Colliander, A., Jackson, T. J., Bindlish, R., Chan, S., Das, N., Kim, S. B., Cosh, M. H., Dunbar, R. S., Dang, L., Pashaian, L., Asanuma, J., Aida, K., Berg, A., Rowlandson, T., Bosch, D. D., Caldwell, T., Caylor, K., Goodrich, D. C., Al Jassar, H., Lopez-Baeza, E., Martinez-Fernandez, J., Gonzalez-Zamora, A., Livingston, S., McNairn, H., Pacheco-Vega, A., Moghaddam, M., Montzka, C., Notarnicola, C., Niedrist, G., Pellarin, T., Prueger, J., Pulliainen, J., Rautiainen, K., Garcia-Ramos, J. V., Seyfried, M., Starks, P. J., Su, Z., Zeng, Y., van der Velde, R., Thibeault, M., Dorigo, W. A., Vreugdenhil, J. M., Walker, J. P., Wu, X., Monerris, A., O'Neill, P. E., Entekhabi, D., Njoku, E. G., and Yueh, S.: Validation of SMAP surface soil moisture products with core validation sites, Remote Sens. Environ., 191, 215–231, https://doi.org/10.1016/j.rse.2017.01.021, 2017.
Das, N. N., Entekhabi, D., Dunbar, R. S., Chaubell, M. J., Colliander, A., Yueh, S., Jagdhuber, T., Chen, F., Crow, W., O'Neill, P. E., Walker, J. P., Berg, A., Bosch, D. D., Caldwell, T., Cosh, M. H., Collins, C. H., Lopez-Baeza, E., and Thibeault, M.: The SMAP and Copernicus Sentinel 1A/B microwave active-passive high resolution surface soil moisture product, Remote Sens. Environ., 233, 111380, https://doi.org/10.1016/j.rse.2019.111380, 2019.
Davidson, M. W. and Furnell, R.: ROSE-L: Copernicus l-band SAR mission, in: 2021 IEEE International Geoscience and Remote Sensing Symposium IGARSS, 11–16 July 2021, Brussels Belgium, IEEE, 872–873, https://doi.org/10.1109/IGARSS47720.2021.9554018, 2021.
De Bruin, H. A. R.: From Penman to Makkink, in: Proceeding and Information/TNO Committee on Hydrological Research, no. 39, Evaporation and weather: Technical meeting 44, Ede, the Netherlands, 25 March 1987, ISBN 90-6743-117-6, 1987.
Decagon Devices: ECH2O-TE/EC-TM, Water Content, EC and Temperature Sensors: Operator's Manual version 7, Decagon Device Inc, Pullman, United States of America, 39 pp., https://library.metergroup.com/Retired and Discontinued/Manuals/ECH2O-TEEC-TMv6-Operators-Manual-(discontinued).pdf (last access: 14 April 2023), 2008.
Decagon Devices: 5TM water content and temperature sensors, version 10 July 2017, Decagon Device Inc, Pullman, United States of America, 17 pp., https://library.metergroup.com/Retired and Discontinued/Manuals/13441_5TM_Web.pdf (last access: 14 April 2023), 2017.
Delta-T Devices: User manual for the ML3 ThetaProbe, version January 2017, Delta-T Devices Ltd, Cambridge, United Kingdom, 47 pp., https://delta-t.co.uk/wp-content/uploads/2017/02/ML3-user-manual-version-2.1.pdf (last access: 14 April 2023), 2017.
Dente, L., Vekerdy, Z., Su, Z., and Ucer, M.: Twente soil moisture and soil temperature monitoring network, University of Twente, Enschede, 19 pp., ISBN 978-90-6164-324-1, 2011.
Dente, L., Su, Z., and Wen, J.: Validation of SMOS Soil Moisture Products over the Maqu and Twente Regions, Sensors, 12, 9965–9986, https://doi.org/10.3390/s120809965, 2012.
Dingman, S. L.: Physical Hydrology, 3rd edn., Waveland Press Inc., Long Grove, United States of America, ISBN 978-1-4786-1118-9, 2015.
Dorigo, W., Himmelbauer, I., Aberer, D., Schremmer, L., Petrakovic, I., Zappa, L., Preimesberger, W., Xaver, A., Annor, F., Ardö, J., Baldocchi, D., Bitelli, M., Blöschl, G., Bogena, H., Brocca, L., Calvet, J.-C., Camarero, J. J., Capello, G., Choi, M., Cosh, M. C., van de Giesen, N., Hajdu, I., Ikonen, J., Jensen, K. H., Kanniah, K. D., de Kat, I., Kirchengast, G., Kumar Rai, P., Kyrouac, J., Larson, K., Liu, S., Loew, A., Moghaddam, M., Martínez Fernández, J., Mattar Bader, C., Morbidelli, R., Musial, J. P., Osenga, E., Palecki, M. A., Pellarin, T., Petropoulos, G. P., Pfeil, I., Powers, J., Robock, A., Rüdiger, C., Rummel, U., Strobel, M., Su, Z., Sullivan, R., Tagesson, T., Varlagin, A., Vreugdenhil, M., Walker, J., Wen, J., Wenger, F., Wigneron, J. P., Woods, M., Yang, K., Zeng, Y., Zhang, X., Zreda, M., Dietrich, S., Gruber, A., van Oevelen, P., Wagner, W., Scipal, K., Drusch, M., and Sabia, R.: The International Soil Moisture Network: serving Earth system science for over a decade, Hydrol. Earth Syst. Sci., 25, 5749–5804, https://doi.org/10.5194/hess-25-5749-2021, 2021.
Dorigo, W. A., Wagner, W., Hohensinn, R., Hahn, S., Paulik, C., Xaver, A., Gruber, A., Drusch, M., Mecklenburg, S., van Oevelen, P., Robock, A., and Jackson, T.: The International Soil Moisture Network: a data hosting facility for global in situ soil moisture measurements, Hydrol. Earth Syst. Sci., 15, 1675–1698, https://doi.org/10.5194/hess-15-1675-2011, 2011.
Dorigo, W. A., Xaver, A., Vreugdenhil, M., Gruber, A., Hegyiová, A., Sanchis-Dufau, A. D., Zamojski, D. Cordes, C., Wagner, W., and Drusch, M.: Global automated qualiy control of in situ soil moisture data from the international soil moisture network, Vadose Zone J., 12, 1–22, https://doi.org/10.2136/vzj2012.0097, 2013.
Entekhabi, D., Njoku, E. G., O'Neill, P. E., Kellog, K. H., Crow, W. T., Edelstein, W. N., Entin, J. K., Goodman, S. D., Jackson, T. J., Johnson, J., Kimball, J., Piepmeier, J. R., Koster, R. D., Martin, N., McDonald, K. C., Moghaddam, M., Moran, S., Reichle, R., Shi, J. C., Spencer, M. W., Thurman, S. W., Leung, T., and van Zyl, J.: The Soil Moisture Active Passive (SMAP) mission, P. IEEE, 98, 704–716, https://doi.org/10.1109/JPROC.2010.2043918, 2010.
Gaskin, G. J., and Miller, J. D.: Measurement of Soil Water Content Using a Simplified Impedance Measuring Technique, J. Agr. Eng. Res., 63, 153–160, https://doi.org/10.1006/jaer.1996.0017, 1996.
Geological Survey of the Netherlands (GDN): DINOloket – Ondergrondgegevens, https://www.dinoloket.nl/ondergrondgegevens (last access: 14 April 2023), 2021.
Global Climate Observing System (GCOS): Implementation plan for the global observing system for climate in support of the UNFCCC, World Meteorological Organization, Geneva, Switzerland, GCOS-No. 92, 136 pp., https://library.wmo.int/doc_num.php?explnum_id=3943 (last access: 14 April 2023), 2004.
Global Climate Observing System (GCOS): Implementation plan for the global observing system for climate in support of the UNFCCC, World Meteorological Organization, Geneva, Switzerland, GCOS-No. 138, 180 pp., https://library.wmo.int/doc_num.php?explnum_id=3851 (last access: 14 April 2023), 2010.
Global Climate Observing System (GCOS): The global observing system for climate: implementation needs, World World Meteorological Organization, Geneva, Switzerland, GCOS-No. 200, 315 pp., https://library.wmo.int/doc_num.php?explnum_id=3417 (last access: 14 April 2023), 2016.
Gruber, A., Scanlon, T., van der Schalie, R., Wagner, W., and Dorigo, W.: Evolution of the ESA CCI Soil Moisture climate data records and their underlying merging methodology, Earth Syst. Sci. Data, 11, 717–739, https://doi.org/10.5194/essd-11-717-2019, 2019.
Heinen, M., Brouwer, F., Teuling, C., and Walvoort, D. J. J.: BOFEK2020 – Bodemfysische schematisatie van Nederland: update bodemfysische eenhedenkaart, Rapport/Wageningen Environmental Research no. 3056, Wageningen Environmental Research, https://doi.org/10.18174/541544, 2021.
Jackisch, C., Germer, K., Graeff, T., Andrä, I., Schulz, K., Schiedung, M., Haller-Jans, J., Schneider, J., Jaquemotte, J., Helmer, P., Lotz, L., Bauer, A., Hahn, I., Šanda, M., Kumpan, M., Dorner, J., de Rooij, G., Wessel-Bothe, S., Kottmann, L., Schittenhelm, S., and Durner, W.: Soil moisture and matric potential – an open field comparison of sensor systems, Earth Syst. Sci. Data, 12, 683–697, https://doi.org/10.5194/essd-12-683-2020, 2020.
Jackson, T. J., Cosh, M. H., Bindlish, R., Starks, P. J., Bosch, D. D., Seyfried, M., Goodrich, D. C., Moran, M. S., and Du, J.: Validation of advanced microwave scanning radiometer soil moisture products, IEEE T. Geosci. Remote, 48, 4256–4271, 539, https://doi.org/10.1109/TGRS.2010.2051035, 2010.
Kellogg, K., Hoffman, P., Standley, S., Shaffer, S., Rosen, P., Edelstein, W., Dunn, C., Baker, C., Barela, P., Shen, Y., Guerrero, A.M., Xaypraseuth, P., Raju Sagi, V., Sreekantha, C.V., Harinath, N., Kumar, R., Bhan, R., and Sarma, C. V. H. S.: NASA-ISRO synthetic aperture radar (NISAR) mission, in: 2020 IEEE Aerospace Conference, 7–14 March 2020, Big Sky, USA, IEEE, 1–21, https://doi.org/10.1109/AERO47225.2020.9172638, 2020.
Kerr, Y. H., Waldteufel, P., Wigneron, J.-P., Delwart, S., Cabot, F., Boutin, J., Escorihuela, M.-J., Font, J., Reul, N., Gruhier, C., Juglea, S. E., Drinkwater, M. R., Hahne, A., Martin-Neira, M., and Mecklenburg, S.: The SMOS mission: New tool for monitoring key elements of the global water cycle, P. IEEE, 98, 666–687, https://doi.org/10.1109/JPROC.2010.2043032, 2010.
Kizito, F., Campbell, C. S., Campbell, G. S., Cobos, D. R., Teare, B. L., Carter, B., and Hopmans, J. W.: Frequency, electrical conductivity and temperature analysis of a low-cost capacitance soil moisture sensor, J. Hydrol., 352, 367–378, https://doi.org/10.1016/j.jhydrol.2008.01.021, 2008.
Kraft, C.: Constitutive parameter measurements of fluids and soil between 500 kHz and 5 MHz using a transmission line technique, J. Geophys. Res., 92, 10650–10656, https://doi.org/10.1029/JB092iB10p10650, 1987.
Maidment, D. R. (Ed.): Handbook of Hydrology, McGraw-Hill Education, New York, United States of America, ISBN 978-0-071-71177-7, 1993.
Martínez-Fernández, J. and Ceballos, A.: Mean soil moisture estimation using temporal stability analysis, J. Hydrol., 312, 28–38, https://doi.org/10.1016/j.jhydrol.2005.02.007, 2005.
METER Group: Em50 version 2019, METER Group Inc, Pullman, United States of America, 55 pp., http://publications.metergroup.com/Manuals/20452_Em50_Manual_Web.pdf (last access: 14 April 2023), 2019.
Ministry of Economic Affairs and Climate Policy: Basisregistratie Gewaspercelen (BRP), https://data.overheid.nl/dataset/10674-basisregistratie-gewaspercelen--brp- (last access: 14 April 2023), 2021.
Pezij, M., Augustijn, D. C. M., Hendriks, D. M. D., Weerts, A. H., Hummel, S., van der Velde, R., and Hulscher, S. J. M. H.: State updating of root zone soil moisture estimates of an unsaturated zone metamodel for operational water resources management, J. Hydrol., 4, 100040, https://doi.org/10.1016/j.hydroa.2019.100040, 2019.
Robinson, D. A., Campbell, C. S., Hopmans, J. W., Hornbuckle, B. K., Jones, S. B., Knight, R., Ogden, F., Selker, J., and Wendroth, O.: Soil Moisture Measurement for Ecological and Hydrological Watershed-Scale Observatories: A Review, Vadose Zone J., 7, 358–389, https://doi.org/10.2136/vzj2007.0143, 2008.
Robock, A., Vinnikov, K. Y., Srinivasan, G., Entin, J. K., Hollinger, S. E., Speranskaya, N. A., Liu, S., and Namkhai, A.: The Global Soil Moisture Data Bank, B. Am. Meteorol. Soc., 81, 1281–1299, https://doi.org/10.1175/1520-0477(2000)081<1281:TGSMDB>2.3.CO;2, 2000.
Rosenbaum, U., Huisman, J. A., Weuthen, A., Vereecken, H., and Bogena, H. R.: Sensor-to-Sensor Variability of the ECH2O EC-5, TE, and 5TE Sensors in Dielectric Liquids, Vadose Zone J., 9, 181–186, https://doi.org/10.2136/vzj2009.0036, 2010.
Royal Netherlands Meteorological Institute (KNMI): Klimatologie – Metingen en waarnemingen, https://www.knmi.nl/nederland-nu/klimatologie-metingen-en-waarnemingen (last access: 14 April 2023), 2021.
Seneviratne, S. I., Corti, T., Davin, E. L., Hirschi, M., Jaeger, E. B., Lehner, I., Orlowsky, B., and Teuling, A. J.: Investigating soil moisture-climate interactions in a changing climate: A review, Earth-Sci. Rev., 99, 125–161, https://doi.org/10.1016/j.earscirev.2010.02.004, 2010.
Seyfried, M. S. and Murdock, M. D.: Measurement of Soil Water Content with a 50 MHz Soil Dielectric Sensor, Soil Sci. Soc. Am. J., 68, 394–403, https://doi.org/10.2136/sssaj2004.3940, 2004.
Seyfried, M. S., Grant, L. E., Du, E., and Humes, K.: Dielectric loss and calibration of the Hydra probe soil water sensor, Vadose Zone J., 4, 1070–1079, https://doi.org/10.2136/vzj2004.0148, 2005.
Smith, A. B., Walker, J. P., Western, A. W., Young, R. I., Ellett, K. M., Pipunic, R. C., Grayson, R. B., Siriwardena, L., Chiew, F. H. S., and Richter, H.: The Murrumbidgee soil moisture monitoring network data set, Water Resour. Res., 48, W07701, https://doi.org/10.1029/2012WR011976, 2012.
Statistics Netherlands (CBS): Bestand bodemgebruik, https://www.cbs.nl/nl-nl/dossier/nederland-regionaal/geografische-data/natuur-en-milieu/bestand-bodemgebruik (last access: 14 April 2023), 2015.
Stevens Water Monitoring Systems: HydraProbe (AKA Hydra Probe II) and HydraProbe Analog, Tech. rep., Stevens Water Monitoring Systems, Inc., Portland, OR, USA, https://stevenswater.zendesk.com/hc/en-us/articles/360034649013-HydraProbe-AKA-Hydra-Probe-II-and-HydraProbe-Analog (last access: 14 April 2023), 2020.
Su, Z., Wen, J., Dente, L., van der Velde, R., Wang, L., Ma, Y., Yang, K., and Hu, Z.: The Tibetan Plateau observatory of plateau scale soil moisture and soil temperature (Tibet-Obs) for quantifying uncertainties in coarse resolution satellite and model products, Hydrol. Earth Syst. Sci., 15, 2303–2316, https://doi.org/10.5194/hess-15-2303-2011, 2011.
Sutanudjaja, E. H., de Jong, S. M., van Geer, F. C., and Bierkens, M. F. P.: Using ERS spaceborne microwave soil moisture observations to predict groundwater head in space and time, Remote Sens. Environ., 138, 172–188, https://doi.org/10.1016/j.rse.2013.07.022, 2013.
Tetlock, E., Toth, B., Berg, A., Rowlandson, T., and Ambadan, J. T.: An 11 year (2007–2017) soil moisture and precipitation dataset from the Kenaston Network in the Brightwater Creek basin, Saskatchewan, Canada, Earth Syst. Sci. Data, 11, 787–796, https://doi.org/10.5194/essd-11-787-2019, 2019.
Topp, G. C., Davis, J. L., and Annan, A. P.: Electromagnetic Determination of Soil Water Content Measurements in Coaxial transmission lines, Water Resour. Res., 16, 574–582, 1980.
Van der Velde, R., Salama, M. S., Eweys, O. A., Wen, J., and Wang, Q.: Soil moisture mapping using combined active or passive microwave observations over the east of the Netherlands, IEEE J. Sel. Top. Appl., 8, 4355–4372, https://doi.org/10.1109/JSTARS.2014.2353692, 2015.
Van der Velde, R., Colliander, A., Pezij, M., Benninga, H.-J. F., Bindlish, R., Chan, S. K., Jackson, T. J., Hendriks, D. M. D., Augustijn, D. C. M., and Su, Z.: Validation of SMAP L2 passive-only soil moisture products using upscaled in situ measurements collected in Twente, the Netherlands, Hydrol. Earth Syst. Sci., 25, 473–495, https://doi.org/10.5194/hess-25-473-2021, 2021.
Van der Velde, R., Benninga, H.-J. F., Retsios, V., Vermunt, P. C., and Salama, M. S.: Twelve years profile soil moisture and temperature measurements in Twente, DANS [data set], https://doi.org/10.17026/dans-znj-wyg5, 2022.
Vaz, C. M. P., Jones, S., Meding, M., and Tuller, M.: Evaluation of Standard Calibration Functions for Eight Electromagnetic Soil Moisture Sensors, Vadose Zone J., 12, vzj2012.0160, https://doi.org/10.2136/vzj2012.0160, 2013.
Vereecken, H., Huisman, J. A., Bogena, H., Vanderborght, J., Vrugt, J. A., and Hopmans, J. W.: On the value of soil moisture measurements in vadose zone hydrology: A review, Water Resour. Res., 44, W00D06, https://doi.org/10.1029/2008WR006829, 2008.
Wageningen University and Research: BOFEK2020 – Bodemfysische schematisatie van Nederland, Wageningen, the Netherlands, https://www.wur.nl/nl/show/Bodemfysische-Eenhedenkaart-BOFEK2020.htm (last access: 14 April 2023), 2021.
- Abstract
- Introduction
- Study area and open datasets
- Monitoring network
- Field campaigns to observe surface soil moisture
- Data uncertainties
- Research opportunities
- Data availability
- Summary and outlook
- Author contributions
- Competing interests
- Disclaimer
- Acknowledgements
- Financial support
- Review statement
- References
- Supplement