the Creative Commons Attribution 4.0 License.
the Creative Commons Attribution 4.0 License.
 | 20 Apr 2023
Mass balance of the Greenland and Antarctic ice sheets from 1992 to 2020
Inès N. Otosaka
Andrew Shepherd
Erik R. Ivins
Nicole-Jeanne Schlegel
Charles Amory
Michiel R. van den Broeke
Martin Horwath
Ian Joughin
Michalea D. King
Gerhard Krinner
Sophie Nowicki
Anthony J. Payne
Eric Rignot
Ted Scambos
Karen M. Simon
Benjamin E. Smith
Louise S. Sørensen
Isabella Velicogna
Pippa L. Whitehouse
Geruo A
Cécile Agosta
Andreas P. Ahlstrøm
Alejandro Blazquez
William Colgan
Marcus E. Engdahl
Xavier Fettweis
Rene Forsberg
Hubert Gallée
Alex Gardner
Lin Gilbert
Noel Gourmelen
Andreas Groh
Brian C. Gunter
Christopher Harig
Veit Helm
Shfaqat Abbas Khan
Christoph Kittel
Hannes Konrad
Peter L. Langen
Benoit S. Lecavalier
Chia-Chun Liang
Bryant D. Loomis
Malcolm McMillan
Daniele Melini
Sebastian H. Mernild
Ruth Mottram
Jeremie Mouginot
Johan Nilsson
Brice Noël
Mark E. Pattle
William R. Peltier
Nadege Pie
Mònica Roca
Ingo Sasgen
Himanshu V. Save
Ki-Weon Seo
Bernd Scheuchl
Ernst J. O. Schrama
Ludwig Schröder
Sebastian B. Simonsen
Thomas Slater
Giorgio Spada
Tyler C. Sutterley
Bramha Dutt Vishwakarma
Jan Melchior van Wessem
David Wiese
Wouter van der Wal
Bert Wouters
Ice losses from the Greenland and Antarctic ice sheets have accelerated since the 1990s, accounting for a significant increase in the global mean sea level. Here, we present a new 29-year record of ice sheet mass balance from 1992 to 2020 from the Ice Sheet Mass Balance Inter-comparison Exercise (IMBIE). We compare and combine 50 independent estimates of ice sheet mass balance derived from satellite observations of temporal changes in ice sheet flow, in ice sheet volume, and in Earth's gravity field. Between 1992 and 2020, the ice sheets contributed 21.0±1.9 mm to global mean sea level, with the rate of mass loss rising from 105 Gt yr−1 between 1992 and 1996 to 372 Gt yr−1 between 2016 and 2020. In Greenland, the rate of mass loss is 169±9 Gt yr−1 between 1992 and 2020, but there are large inter-annual variations in mass balance, with mass loss ranging from 86 Gt yr−1 in 2017 to 444 Gt yr−1 in 2019 due to large variability in surface mass balance. In Antarctica, ice losses continue to be dominated by mass loss from West Antarctica (82±9 Gt yr−1) and, to a lesser extent, from the Antarctic Peninsula (13±5 Gt yr−1). East Antarctica remains close to a state of balance, with a small gain of 3±15 Gt yr−1, but is the most uncertain component of Antarctica's mass balance. The dataset is publicly available at https://doi.org/10.5285/77B64C55-7166-4A06-9DEF-2E400398E452 (IMBIE Team, 2021).
- Article
(3490 KB) - Full-text XML
- BibTeX
- EndNote


The Antarctic and Greenland ice sheets store the vast majority (99 %) of Earth's freshwater ice on land. The rate of change in ice sheet mass – or ice sheet mass balance – is the net difference between mass loss through solid ice discharge at the grounding line, melting at the bed and at the ice–ocean interface, and the surface mass balance (SMB; precipitation minus meltwater runoff, sublimation, evaporation, and erosion). Over the past 3 decades (between the 1990s and 2010s), ice losses from Antarctica and Greenland increased 6-fold (IMBIE Team, 2018, 2020), raising the global sea level (WCRP Global Sea Level Budget Group, 2018) and with it the risk of coastal flooding worldwide (Kulp and Strauss, 2019; Vitousek et al., 2017; Hanson et al., 2011). In Antarctica, the losses have arisen primarily due to ocean-driven melting of ice shelves (Adusumilli et al., 2020; Paolo et al., 2015) and their collapse (Cook and Vaughan, 2010), which have accelerated the ice flow (Hogg et al., 2017; Selley et al., 2021; Rignot et al., 2004), retreat (Konrad et al., 2018; Milillo et al., 2022; Jenkins et al., 2018), and drawdown (Konrad et al., 2017; Shepherd et al., 2019) of numerous marine-terminating ice streams. In Greenland, increasing air temperatures (Hanna et al., 2021) and decreasing cloud cover (Hofer et al., 2017) have exacerbated summertime surface melting (Leeson et al., 2015; Tedesco and Fettweis, 2020) and runoff (Trusel et al., 2018; Slater et al., 2021), in tandem with the speeding up (Rignot and Kanagaratnam, 2006) and retreat (King et al., 2020) of outlet glaciers responding to a warming ocean (Straneo and Heimbach, 2013). While ice sheet response to climate forcing remains the least constrained component of the 21st century sea level budget (Pattyn and Morlighem, 2020; Fox-Kemper et al., 2021), maintaining the long-term observational record of ice sheet mass balance is critical to improving ice sheet model skill (Edwards et al., 2021; Ritz et al., 2015) and confidence in projections of sea level rise (Aschwanden et al., 2021; Slater et al., 2020; Shepherd and Nowicki, 2017).
Thanks to the launch of new satellite missions and the development of improved geophysical corrections and models of SMB and glacial isostatic adjustment (GIA), it is now possible to routinely monitor ice sheet mass changes using observations of ice flow derived from satellite radar and optical imagery (e.g. Gardner et al., 2018; Moon et al., 2012; Mouginot et al., 2017), surface elevation changes (derived from satellite altimetry; e.g. Sandberg Sørensen et al., 2018; Smith et al., 2020), and fluctuations in Earth's gravity field (derived from satellite gravimetry from GRACE and its follow-on; e.g. Tapley et al., 2019; Velicogna et al., 2020; Sasgen et al., 2020). The Ice Sheet Mass Balance Inter-comparison Exercise (IMBIE) has shown that there is good agreement between these satellite methods (Shepherd et al., 2012) and that combining independent satellite-based ice sheet mass balance estimates reduces the uncertainty in the estimates of Greenland and Antarctica's contribution to sea level rise. By adopting a common framework to support the comparison and aggregation of ice sheet mass balance estimates generated by different participants, it is possible to assess differences between techniques and the impact of using different geophysical corrections, SMB models, or GIA models in ice sheet mass balance estimation to produce a reconciled time series of ice sheet mass changes. SMB models are required for estimating the net mass balance in the input–output method, while GIA models are necessary to correct ice sheet mass balance estimates derived from satellite gravimetry and, to a lesser extent, those derived from satellite altimetry. The GIA is the result of solid Earth mass redistribution caused by changes in ice mass since the last glaciation. Gravimetry fields record the combined effect of mass redistribution due to the GIA and recent changes in ice sheet mass balance. The GIA contribution therefore needs to be modelled separately and removed from the gravimetry fields, especially since it is of the same order of magnitude as the ice sheet mass balance signal (Caron and Ivins, 2020; Sutterley et al., 2014a). Altimetry elevation change estimates also need to be corrected for the GIA. However, contrary to gravimetry estimates, altimetry estimates are less sensitive to the GIA, as it manifests as an uplift (or subsidence) rate of the order of a few millimetres per year, which is much smaller than the elevation changes recorded. The most recent IMBIE assessments for the Antarctic Ice Sheet and the Greenland Ice Sheet covered the periods 1992 to 2017 and 1992 to 2018, respectively and reported a combined contribution of 17.8±1.8 mm to the global mean sea level (g.m.s.l.) between 1992 and 2017 (IMBIE Team, 2018, 2020). Here, we extend these records to cover the same extended period (1 January 1992 to 31 December 2020) for both ice sheets. In the rest of the paper, all of time periods cited refer to the period extending from 1 January of the first year quoted to 31 December of the second year quoted.
In the years since our most recent assessment, there have been notable changes in ice sheet mass in both hemispheres and in the availability of satellite observations and ancillary datasets with which to detect these changes. In Greenland, for example, atmospheric blocking and reduced summertime snowfall (Tedesco and Fettweis, 2020) led to near-record levels of meltwater runoff in 2019 (Slater et al., 2021), which, in combination with progressively increasing ice discharge (Mouginot et al., 2019), set a new record for annual ice losses during the satellite era (Sasgen et al., 2020). In Antarctica, pervasive mass losses have continued in the Amundsen Sea sector (Groh and Horwath, 2021) as a consequence of further grounding line retreat (Milillo et al., 2022) and the associated glacier speed-up (Joughin et al., 2021). A follow-on to the GRACE satellite mission (GRACE-FO) was launched in May 2018 (Tapley et al., 2019), the ICESat-2 satellite laser altimeter mission was launched in September 2018 (Smith et al., 2020), and updated products have been released for many others – including swath altimetry from CryoSat-2 (Gourmelen et al., 2018). To accompany these observations, there have been updated models of GIA (e.g. Caron and Ivins, 2020) to correct the mass and elevation changes associated with solid Earth movement, of firn densification (e.g. Stevens et al., 2020) to correct changes in elevation for surface processes, and of SMB (e.g. Fettweis et al., 2020; Mottram et al., 2021) to aid mass budget and mass balance partitioning calculations.
Here, we make use of new satellite observations, new methods, and models to provide an updated IMBIE assessment of the Greenland and Antarctic ice sheet mass balance, extending our most recent records by 3 and 4 years, respectively. We provide a description of the datasets incorporated in this updated assessment and of the aggregation methods employed. We also discuss differences between the ice sheet mass balance estimates derived from altimetry, gravimetry, and the input–output method, and we present extended reconciled time series of the ice sheet mass change. We discuss the limitations of our dataset and outline a roadmap for future improvements.
2.1 Data background
Fluctuations in ice sheet mass are a key indicator of ice sheet stability and can be inferred using a range of satellite techniques (Shepherd et al., 2012). Satellite altimetry measures ice sheet elevation change, which is computed at orbit-crossing points by calculating the difference in ice sheet elevation at a crossover point between ascending and descending satellite passes (e.g. Wingham et al., 1998), using clusters of data points acquired along all ground tracks (e.g. Pritchard et al., 2009), or by differencing height models separated over time (e.g. Csatho et al., 2014). Mass balance is estimated by accounting for changes in bedrock elevation (e.g. Caron and Ivins, 2020) and then by either prescribing the density associated with the elevation fluctuation (e.g. Shepherd et al., 2019) or by making a model-based correction for changes in firn compaction (Sørensen et al., 2011). The technique is unique in charting the patterns of mass imbalance with a fine (monthly) temporal sampling and fine (102 km2) spatial resolution, and there are continental-scale measurements dating back to the early 1990s. Satellite measurements of ice velocity computed from sequential radar and optical imagery (e.g. Rignot and Kanagaratnam, 2006) are the basis of ice sheet input–output assessments (e.g. Rignot et al., 2019; Mouginot et al., 2019). Ice velocities are combined with estimates of ice thickness (e.g. Morlighem et al., 2017) to compute changes in marine-terminating glacier discharge and then with regional climate model estimates of SMB sources (snowfall and rainfall) and sinks (runoff, sublimation, evaporation, and erosion; e.g. Fettweis et al., 2020; Mottram et al., 2021) to measure temporal changes in net mass balance. The technique provides monthly to annual temporal sampling and drainage-basin-scale spatial resolution, and there are continental-scale measurements dating back to the late 1970s. During the last decade, new satellite missions with a more frequent revisit time (down to 6 d, using image pairs from Sentinel-1A and Sentinel-1B available during the period 2016 to 2021 – until the end of Sentinel-1B mission) have been used to improve the temporal resolution of ice velocity measurements, allowing the investigation of seasonal fluctuations in ice velocity (King et al., 2018; Lemos et al., 2018) and producing monthly estimates of ice discharge at the continental scale. Mankoff et al. (2021) even produced daily estimates of ice sheet mass balance from the input–output method by resampling the velocity data; however, the original temporal resolution of ice velocity measurements does not exceed 12 d. Satellite gravimetry measures fluctuations in Earth's gravitational field, which are computed using either global spherical harmonic solutions (e.g. Velicogna and Wahr, 2006) or using spatially discrete mass concentration units (e.g. Luthcke et al., 2006). Ice sheet mass changes are determined after making model-based corrections for GIA (e.g. Caron and Ivins, 2020) and for the leakage of mass trends occurring elsewhere in the climate system, especially for those arising from ocean mass variability and changes in land hydrology. The technique provides fine (monthly) temporal sampling and moderate (105 km2) spatial resolution, dating back to 2002 with the launch of the GRACE mission and the more recent launch of its follow-on GRACE-FO in 2018.
2.2 Input data
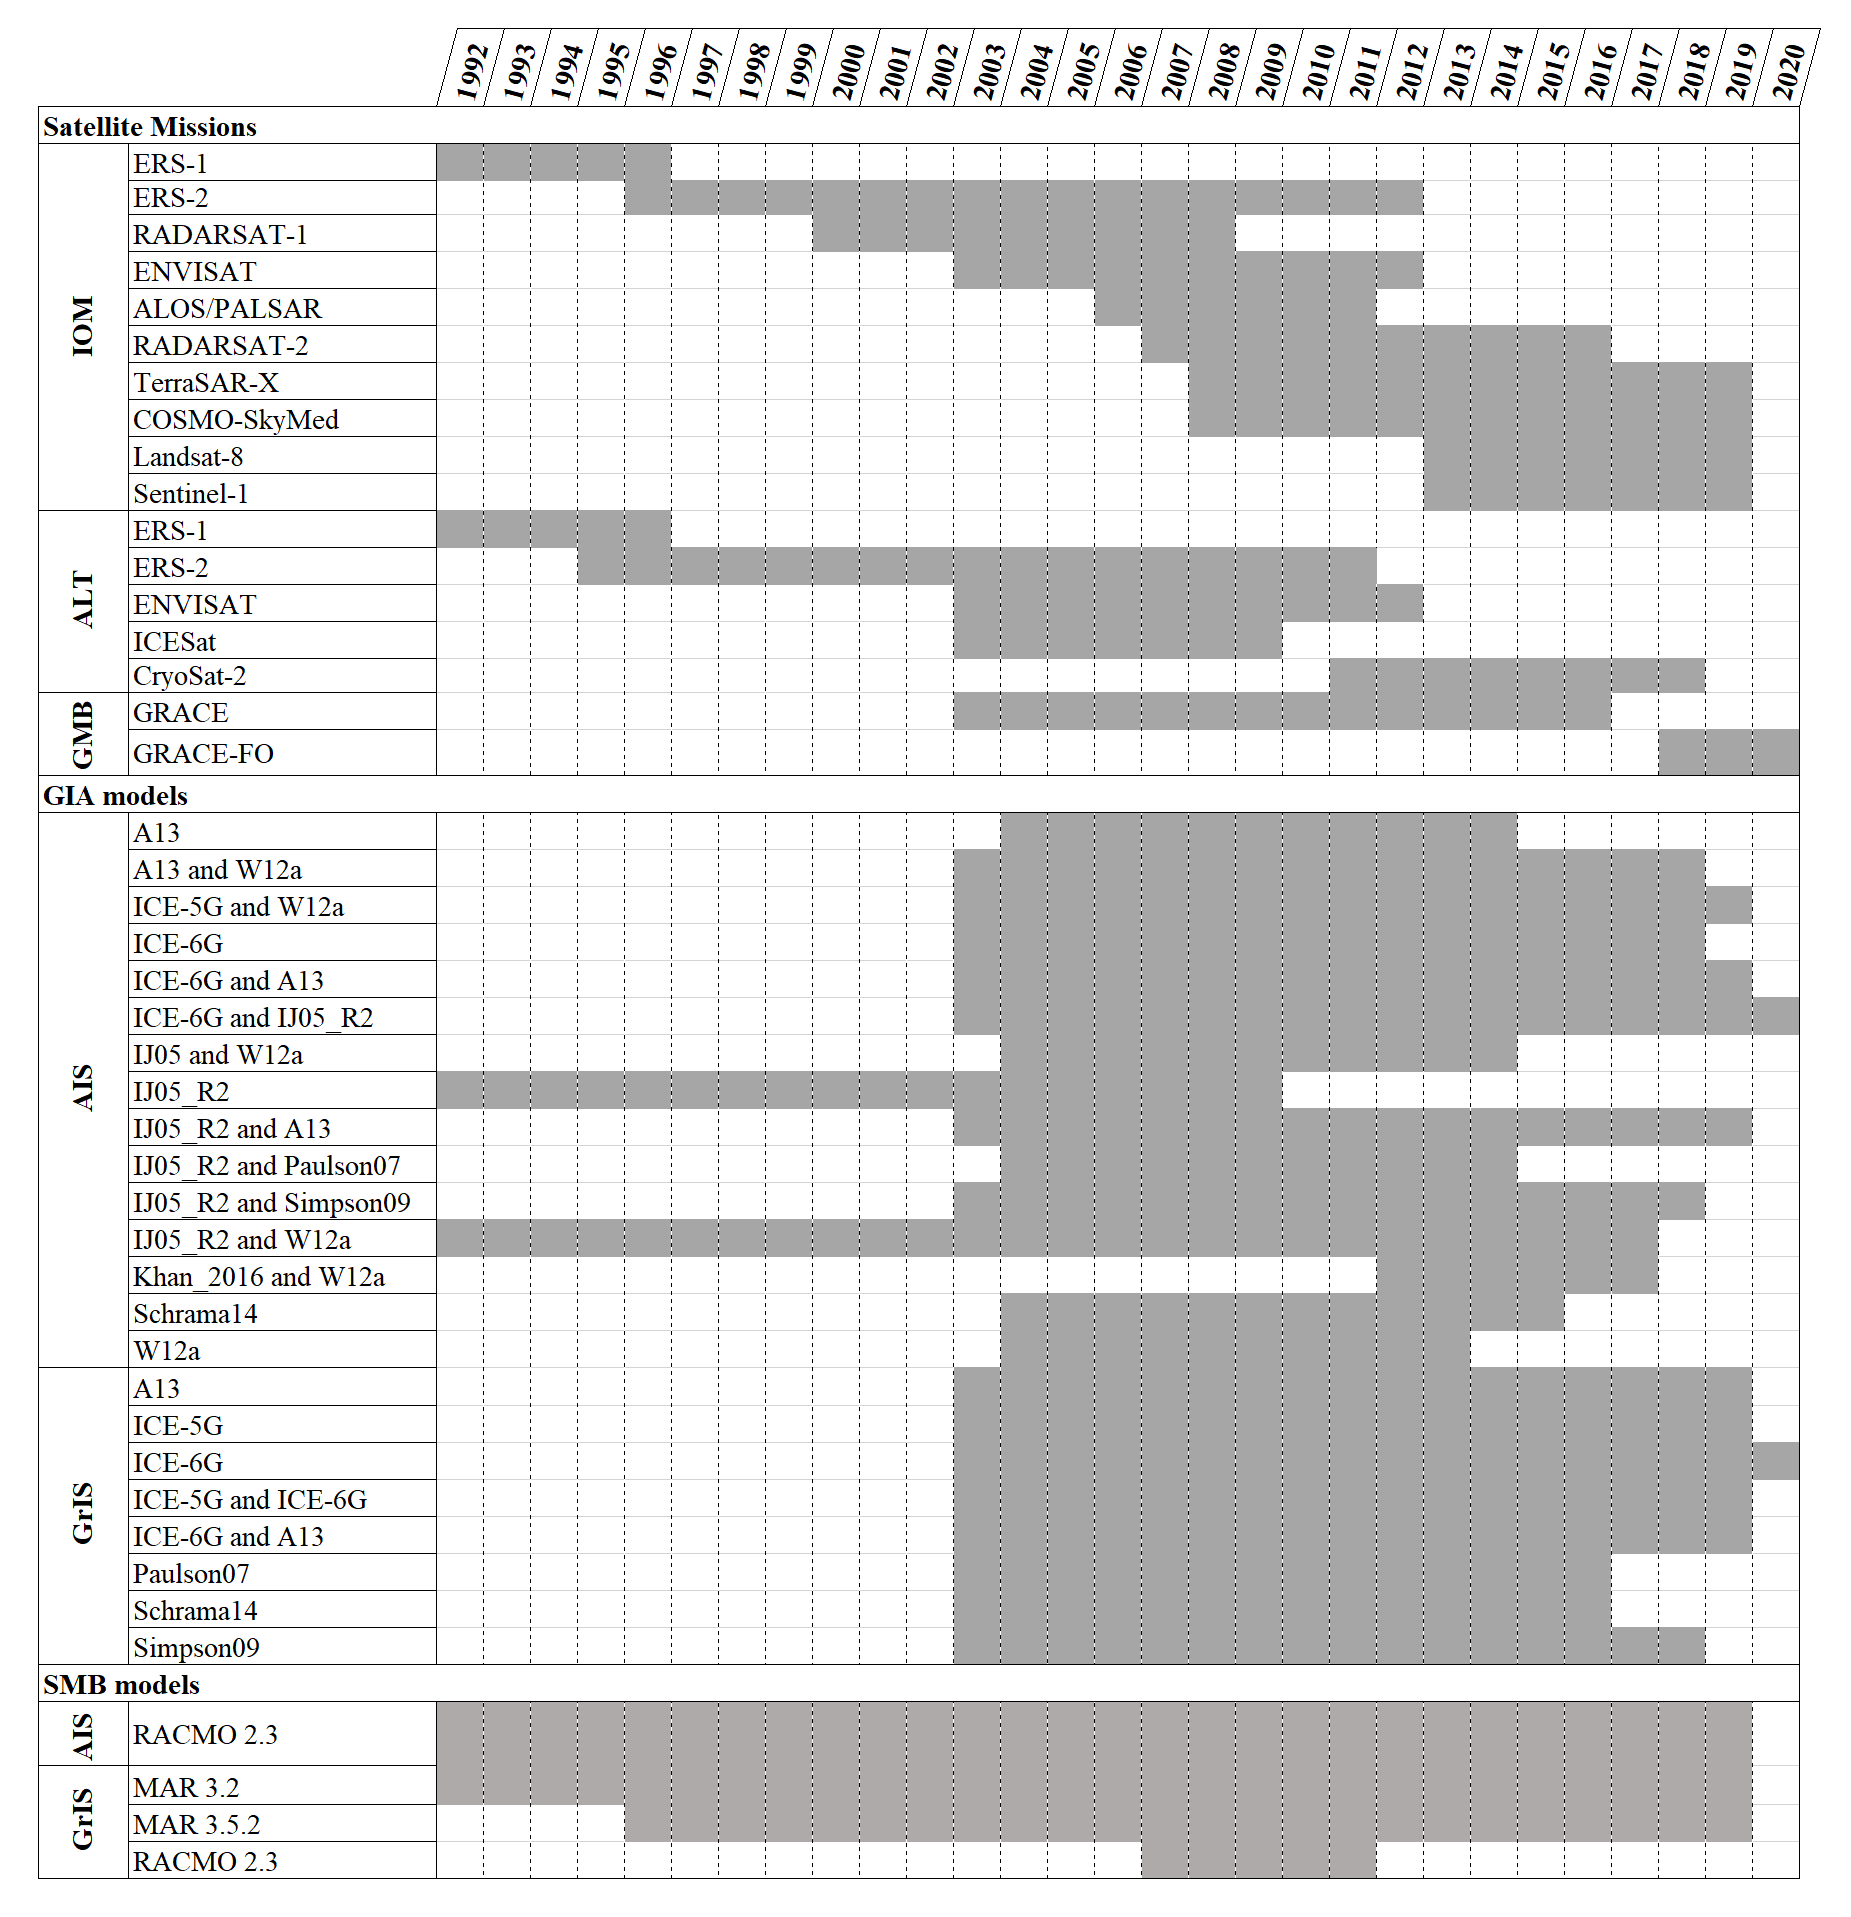
To compile our assessment of the Greenland Ice Sheet mass balance, we use 27 satellite-based estimates of ice sheet mass change, including 8 estimates based on satellite altimetry, 16 based on satellite gravimetry, and 3 based on the input–output method. Compared to the most recent IMBIE assessment, 12 of these estimates have been updated to include more recent data for Greenland. This set of updated estimates is made of two estimates from the input–output method, one altimetry estimate, and nine gravimetry estimates, including data from the new GRACE Follow-On space gravimetry mission (GRACE-FO). For our assessment of Antarctica's mass balance, we use 23 satellite-based estimates altogether, with 6 derived from altimetry, 16 from gravimetry, and 1 from the input–output method. More than half of these estimates have been extended in time, compared to IMBIE-2. These updated estimates for Antarctica include the input–output method estimate, 2 altimetry estimates, and 10 gravimetry estimates combining GRACE and GRACE-FO data. In total, this new IMBIE assessment includes data from 14 satellite missions, spanning the years 1992 to 2020 – with results from all three geodetic techniques available between 2003 and 2018 in Greenland and 2002 and 2018 in Antarctica – and, for the first time, includes data from the GRACE-FO mission launched in 2018. A wide range of GIA models have been used to correct gravimetric and volumetric mass balance estimates. The models used in this assessment are all forward models, which combine a rheology model of the solid Earth with a model of past ice mass change. In this assessment, only two SMB models have been used in the input–output method estimates included – RACMO (Regional Atmospheric Climate Model) and MAR (Modèle Atmosphérique Régional; Table 1).
Table 1Synthesis of satellite datasets, GIA, and SMB models used to derive the individual estimates of ice sheet mass balance included in this study. Details and references of the GIA and SMB models are available in Table A1.
To achieve a meaningful comparison of ice sheet mass balance estimates, we analyse mass trends using the common definitions of the Antarctica Ice Sheet, West Antarctica Ice Sheet, East Antarctica Ice Sheet, the Antarctic Peninsula Ice Sheet, and Greenland Ice Sheet boundaries (AIS, WAIS, EAIS, APIS, and GrIS, respectively). We use two ice sheet drainage basin sets, both previously used in the past IMBIE assessments (Shepherd et al., 2012; IMBIE Team, 2018, 2020) and available at http://imbie.org/imbie-3/drainage-basins/ (last access: 10 July 2022). The first drainage basin set was derived based on ICESat surface elevation data and includes 27 basins in Antarctica, covering an area of 11 885 725 km2, and 19 in Greenland, over an area of 1 703 625 km2 (Zwally et al., 2012), and is retained for consistency with the first IMBIE assessment (Shepherd et al., 2012). The second set defines 18 basins in Antarctica, covering 11 892 700 km2, and 6 in Greenland, covering 1 723 300 km2 (Rignot et al., 2011a, b). The two ice sheet delineations differ by 1.1 % and 0.1 % of total ice sheet extent for the Greenland and Antarctic ice sheets, respectively, and thus, using either of these definitions leads to a negligible difference in mass balance (IMBIE Team, 2018, 2020). IMBIE participants were free to use either of these two definitions, and we combine mass trends over GrIS, AIS, WAIS, EAIS, and APIS together, regardless of what definition was chosen. The different estimates included in this assessment are presented in Fig. 1.
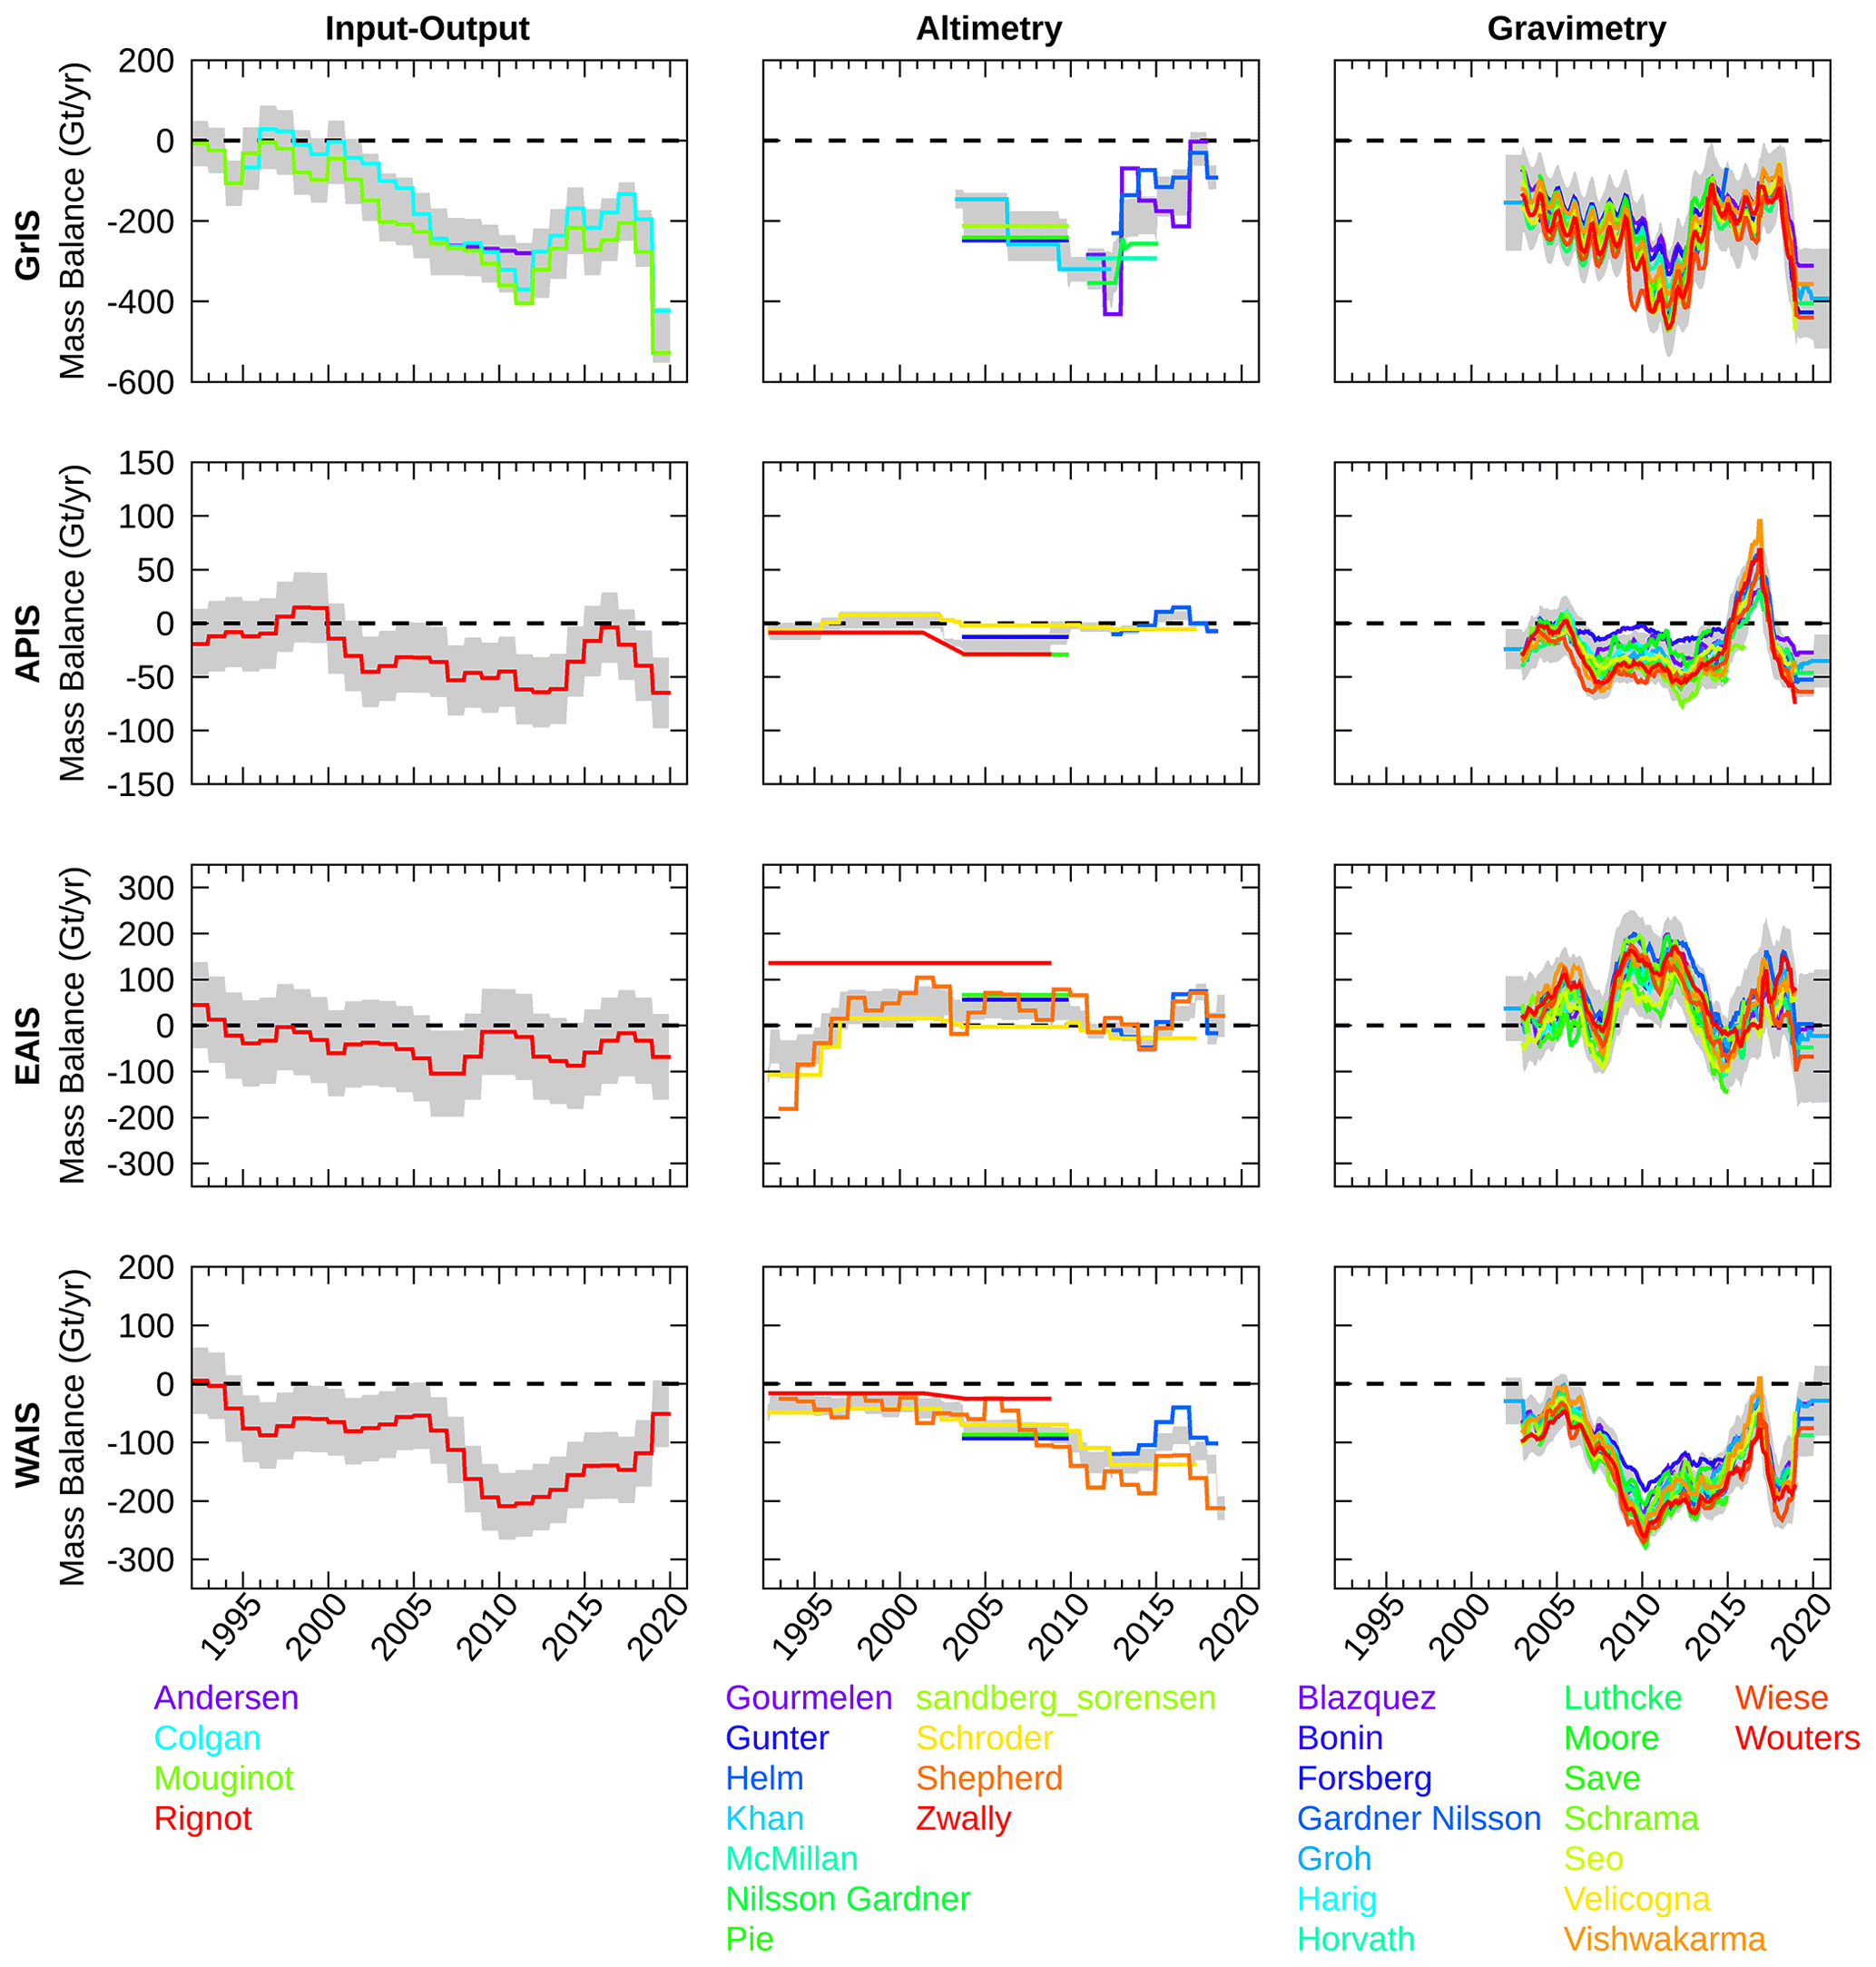
Figure 1Individual rates of ice sheet mass balance from the input–output method, altimetry, and gravimetry groups over GrIS, APIS, EAIS, and WAIS included in this study standardised following the procedure described in Sect. 3 (i). The grey shading shows the estimated uncertainty in the aggregated time series per group calculated, following the procedure described in Sect. 3 (ii).
2.3 Output data
The output data consist of a single reconciled estimate of ice sheet mass balance covering the period 1 January 1992 to 31 December 2020 for GrIS, AIS, APIS, WAIS, EAIS, and the sum of GrIS and AIS. Two comma-separated values (CSV) files are provided for each ice sheet region, where one has the data provided in gigatonnes (Gt), and the other has the data provided in the equivalent sea level contribution in millimetres (mm). These files contain the annual rates of mass balance and cumulative mass changes with their corresponding uncertainties.
IMBIE participants contributed time series of either relative mass change, ΔM(t), or of rate of mass change, , with their associated uncertainty, integrated over at least one of the ice sheet regions defined in the standard drainage basin sets. To produce a reconciled estimate of ice sheet mass change from these individual estimates, we compare and aggregate from each satellite technique. The IMBIE assessment software used to produce the dataset presented in this study is available at https://doi.org/10.5281/zenodo.7342481 (Otosaka et al., 2022). We apply a consistent processing scheme to all submitted datasets and for all ice sheet regions which consists of (i) computing for all datasets that were submitted as ΔM(t), (ii) aggregating the time series of mass trends within each class of satellite observations, (iii) combining the altimetry, gravimetry, and input–output time series to derive a single reconciled time series of mass trends, and (iv) integrating this reconciled time series of mass trends to produce the final reconciled time series of cumulative mass change. In what follows, we summarise each of these processing steps.
- i.
Computing time series of mass trends. First, we derive the time series of monthly rates of ice sheet mass change, , using a standardised approach for all datasets that were submitted as ΔM(t) to allow the aggregation of datasets within each satellite observations class as . At each epoch, we estimate by fitting a linear trend to the ΔM(t) data falling within a sliding window of 36 months, centred around the given epoch, using a weighted least-squares approach, with each point weighted by its error. The error in the derived time series is taken as the sum in quadrature of the linear model structural error, which is computed as the standard error in the linear regression se, and the mean of the errors in the nw points in the original ΔM(t) time series falling within the 36-month sliding window, as follows:
Finally, the derived time series of mass trends are truncated by half the window width at the start and end of their period.
- ii.
Aggregating time series of mass trends from similar satellite observations. We aggregate the standardised time series of mass trends within the altimetry, gravimetry, and input–output groups separately to produce three time series over each ice sheet region , where “group” refers to one of these three independent satellite techniques (i.e. altimetry, gravimetry, or the input–output method). We calculate each aggregated time series by taking the error-weighted average of the nestimates per group individual monthly rates of ice sheet mass change available from the same satellite technique group at each month, as follows:
The associated error is calculated as the sum in quadrature of the contributing individual time series errors divided by the square root of the number of estimates in the group, as follows:
- iii.
Combining the altimetry, gravimetry, and input–output time series of mass trends. We combine the altimetry, gravimetry, and input–output time series to produce a single, reconciled time series of mass trends by taking the error-weighted mean of the ngroup independent estimates for which a mass trend estimate is available at each epoch (comprised between 1 and 3), as follows:
We estimate the error in the reconciled mass trend time series at each epoch as being the sum in quadrature of the aggregated time series errors divided by the square root of the number of independent estimates available, as follows:
Finally, when summing mass trends of multiple ice sheets, the combined uncertainty is estimated as the root sum square of the uncertainties for each region as follows:
- iv.
Generating the final reconciled time series of cumulative mass change. We generate a time series of cumulative ice sheet mass change by integrating our reconciled time series of mass trends over time for each region. We estimate the cumulative errors as the root sum square of errors, divided by 12 (as our estimates are posted at monthly epochs), as follows:
Here, we discuss the potential systematic bias introduced by the inclusion of the peripheral glaciers and ice caps (GICs) in the gravimetry estimates included in our assessment, as the spatial resolution of satellite gravimetry is not sufficient to separately resolve the mass change signals of these neighbouring ice masses. To examine this further, we use the Hugonnet et al. (2021b) dataset (https://doi.org/10.6096/13, last access: 23 February 2023; Hugonnet et al., 2021a), which provides mass balance estimates of the glaciers located at the periphery of the ice sheets derived from high-resolution digital elevation models. During the overlap period of the Hugonnet et al. (2021b) study and the gravimetry record employed in this study (2002–2019), Greenland peripheral glaciers lost mass at a rate of 35.5±1.6 Gt yr−1. In Antarctica (excluding the sub-Antarctic glaciers located further than 1000 km from the ice sheet), peripheral glaciers lost mass at a rate of 11.8±3.4, 0.7±1.1, and 5.7±2.5 Gt yr−1 at APIS, EAIS, and WAIS, respectively. To test the impact of the inclusion of the peripheral glaciers in our gravimetry estimates on our reconciled ice sheet mass balance assessment, we use the peripheral glacier mass trend time series from Hugonnet et al. (2021a) to remove the contribution of the GICs on our aggregated gravimetry time series. We use consecutive 5-year rates of mass change for this analysis and their corresponding uncertainties. For 2020, which is not covered by Hugonnet et al. (2021b), we use the rate of mass change estimated over the 5-year period of 2015–2019 instead. We combine in quadrature the uncertainty in the peripheral GICs mass balance and the uncertainty in our aggregated gravimetry mass balance calculated from Eq. (3). Next, we follow the procedure described in step (iii) to recombine this modified aggregated gravimetry time series with the altimetry and input–output aggregated time series. We compare this modified reconciled estimate to our original estimate and find that removing the contribution of the GICs from the gravimetry time series results in a reduction in mass loss of 4.1 % and 3.3 % in Greenland and Antarctica, respectively, which is smaller than the uncertainty bounds of our reconciled estimate (Table A2). This simple analysis shows that the inclusion of the peripheral ice masses in the gravimetry estimates included in this study has a negligible impact on our reconciled mass balance assessment of WAIS and EAIS and only a small impact on our assessment of GrIS and APIS, with a reduction in mass loss of less than 10 Gt yr−1 and 3 Gt yr−1, respectively.
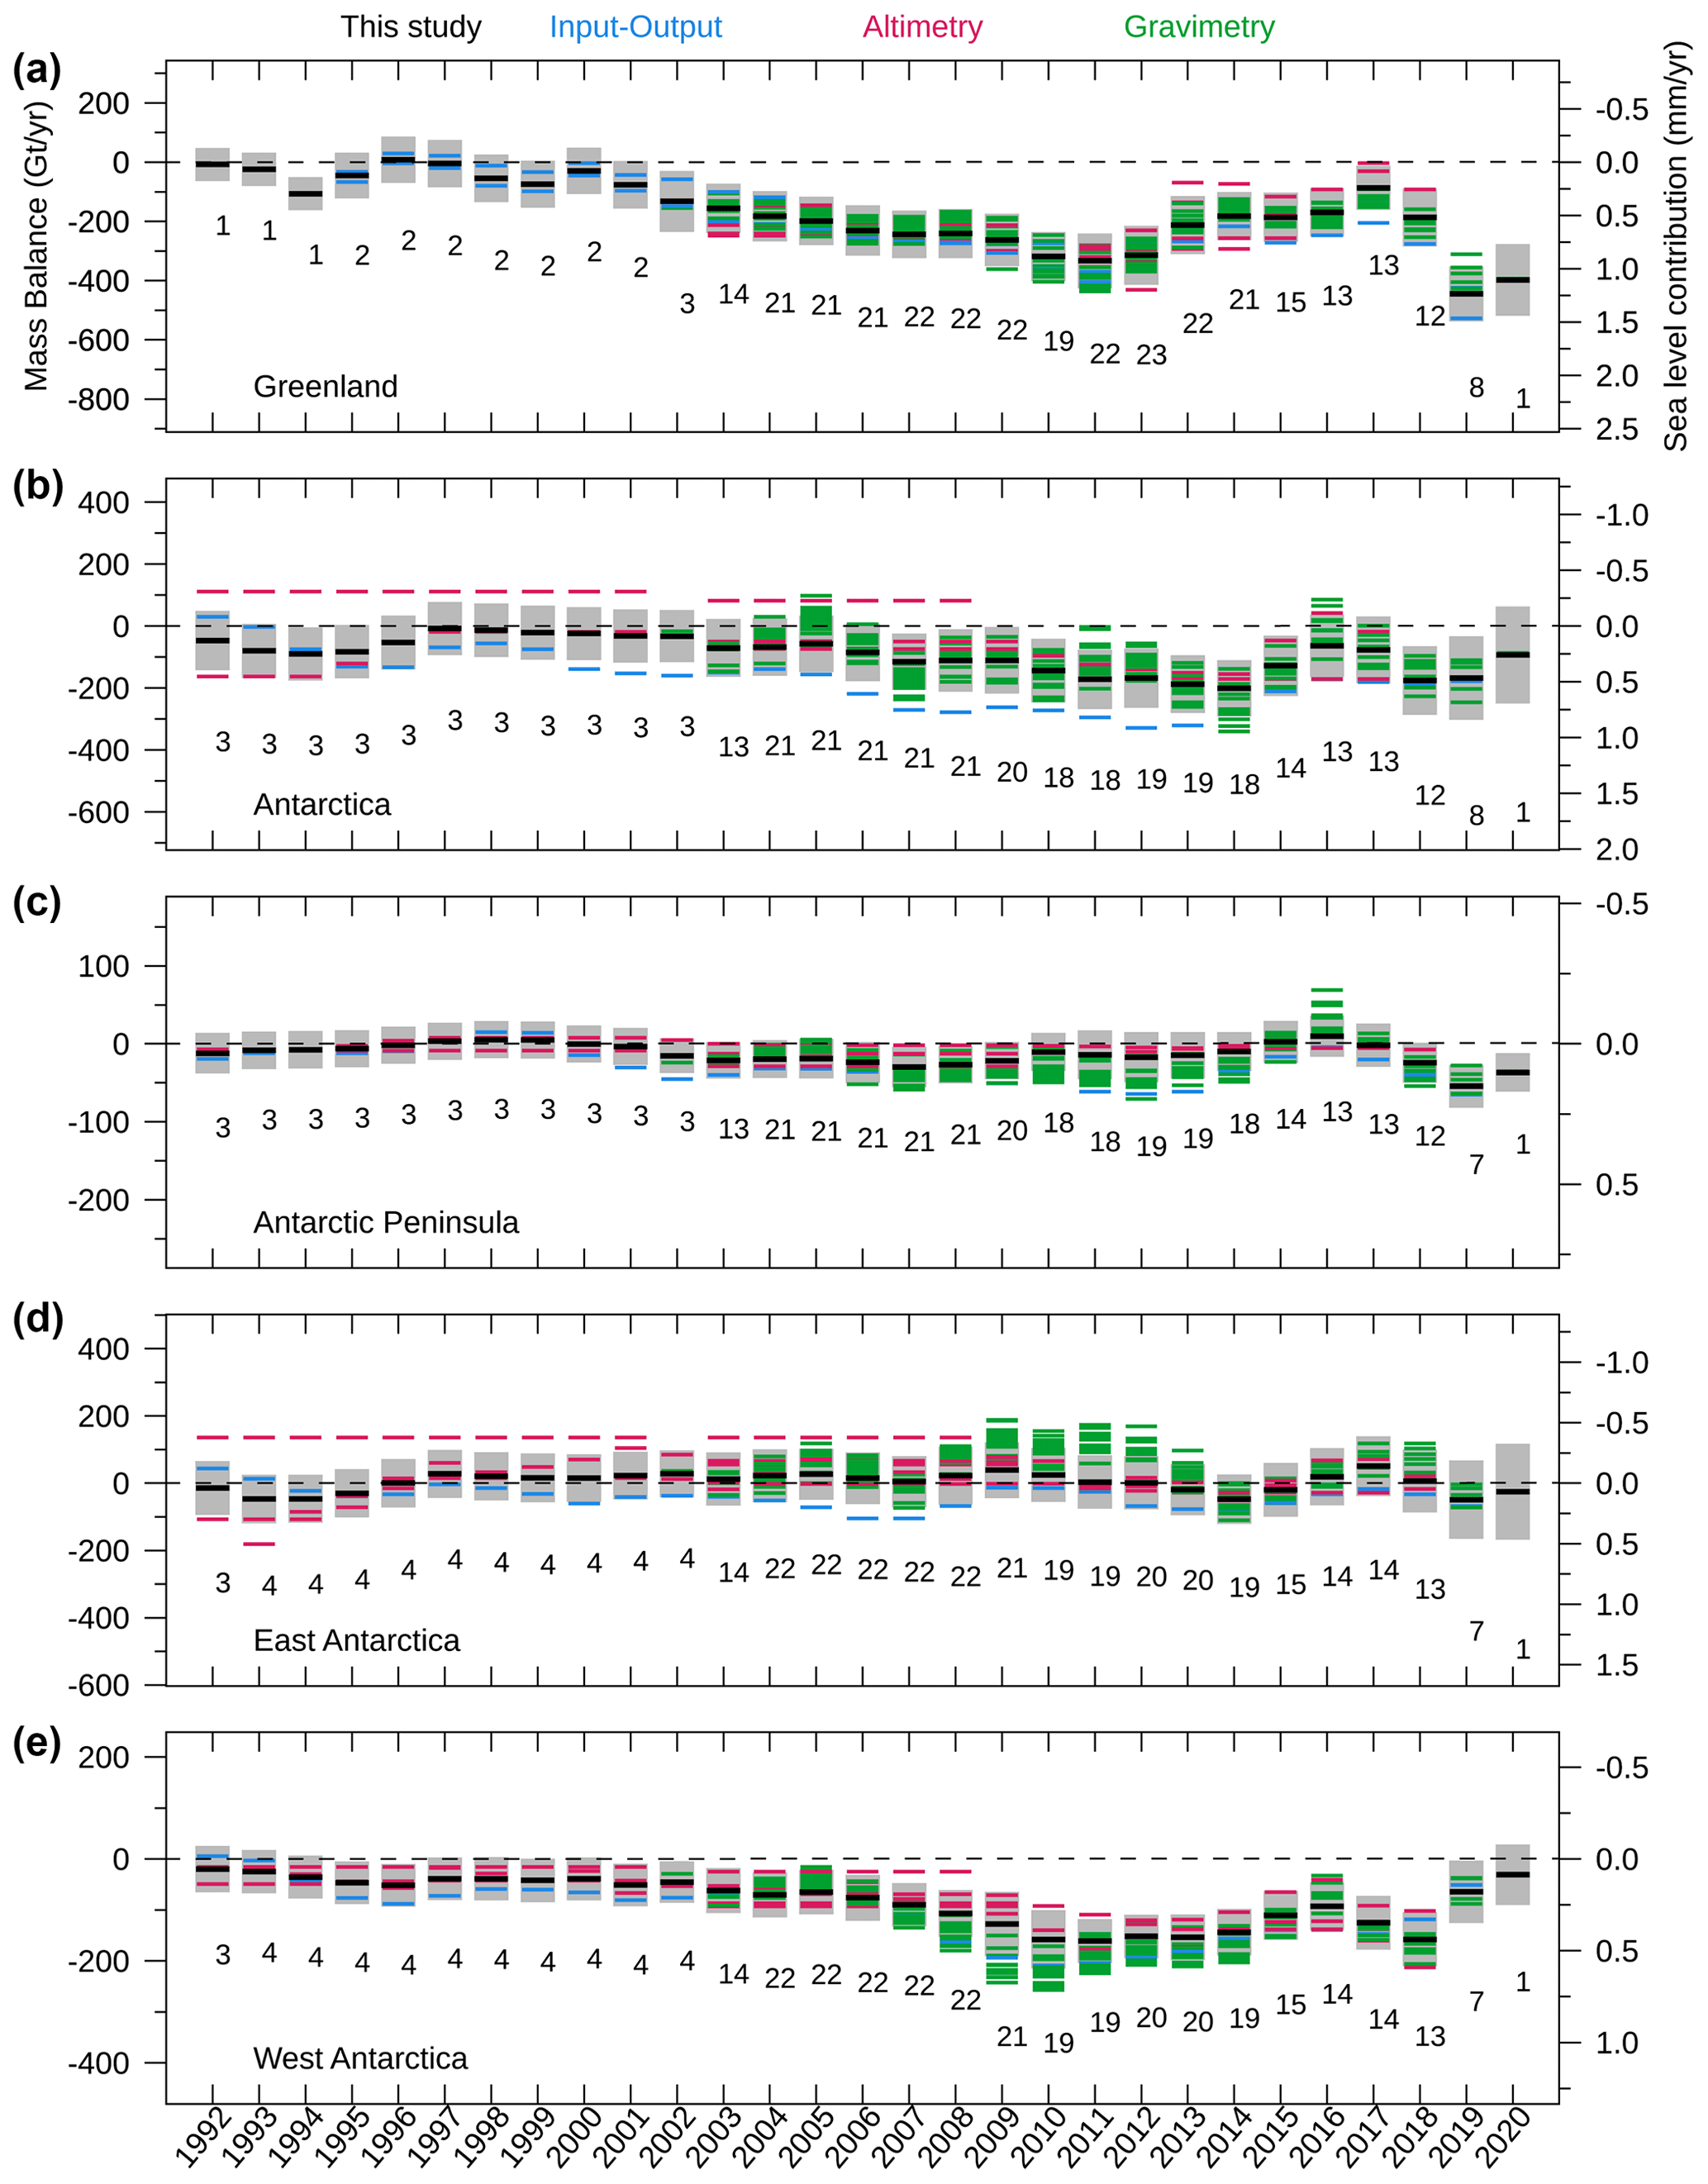
Figure 2Annual rates of mass change in (a) GrIS, (b) AIS, (c) APIS, (d) EAIS, and (e) WAIS from the altimetry, gravimetry, and input–output estimates included in this study (coloured bars) and the reconciled estimate produced from combining those estimates (thick black bars). The grey shading shows the uncertainty in our final reconciled estimate, which is calculated following the procedure described in Sect. 3 (iii). The number of individual mass balance estimates collated at each epoch is shown below each bar.
First, we compare individual estimates of ice sheet mass balance within each of the three geodetic technique experiment groups, separately, to assess the level of agreement among estimates derived using the same technique. Within each group, we compare annual rates of mass change and their standard deviation for each ice sheet region. The input–output group includes significantly fewer mass balance estimates than the other technique experiment groups, but these estimates have the advantage of providing information on the partitioning of mass trends between signals related to SMB and ice dynamics, and they also cover relatively long periods of time (Fig. 2). Ice discharge is measured from satellite observations of ice velocities combined with estimates of ice thickness at the termini of the glaciers, and SMB is derived from regional climate model outputs. To estimate the SMB anomaly in Greenland, two estimates used MAR (version 3.2 and version 3.5.2) and one used RACMO (version 2.3). In Antarctica, the input–output estimate used RACMO (version 2.3). In addition to using different SMB models, those estimates also define different reference periods to calculate the SMB anomalies. All of the mass balance estimates derived in this group were originally posted at annual resolution, and we resample them over monthly epochs to aggregate them with estimates from the other groups. We include three input–output method estimates of GrIS mass balance, all at annual resolution, that together span the period 1992 to 2020 and overlap during the period 2007 to 2011. During their common period, the annual rates of mass change determined from these three input–output datasets have a median difference of 28.5 Gt yr−1, with a standard deviation of 35 Gt yr−1. For Antarctica and its ice sheet components, we include one input–output mass balance estimate, which covers the entire 1992 to 2020 period at an annual resolution.
The altimetry group includes eight mass balance estimates for GrIS that together span the years 2003 to 2018, with four of these solutions derived from radar altimetry, two from laser altimetry, and two from a combination of both. We include six altimetry mass balance estimates for AIS, which together cover the period 1992 to 2019. In total, we include six solutions for EAIS, six for WAIS, and five for APIS. Of these, two solutions are derived from radar altimetry, one from laser altimetry, and three from a combination of both. To derive rates of surface elevation change, various methods were applied to the laser and radar altimetry data, including repeat track, plane fit, or overlapping footprint techniques. For Greenland, half of the participants corrected the altimetry time series for the GIA effect, while for Antarctica, all participants applied a GIA correction. Next, to derive mass trends from rates of surface elevation change, either a constant density or a spatially and time varying density field from a firn density model forced by a regional climate model were applied. These solutions have varying temporal resolutions, ranging from 1 month to 7.1 years, for an average effective temporal resolution of 3.0 years for Greenland and 2.6 years for Antarctica. The temporal resolution of the altimetry group is thus lower than annual, mainly due to the fact that solutions derived from laser altimetry data were all provided as constant rates spanning the duration of ICESat-1 mission, while the radar altimetry solutions have a higher temporal resolution of 0.35 years for Greenland and 0.47 years for Antarctica. As there is no overlap period during which all altimetry estimates are available, we compare solutions derived solely from radar altimetry and solutions incorporating laser altimetry data separately. In Greenland, radar altimetry solutions have a median difference of 144 Gt yr−1 and a standard deviation of 67 Gt yr−1 during their 2-year overlap period (2013 to 2014), while the median difference between laser and combination solutions is 29 Gt yr−1, with a standard deviation of 29 Gt yr−1 during their 6-year overlap (2004 to 2009). In Antarctica, the spread between laser solutions is largest at EAIS, with a standard deviation in the annual rates of 38 Gt yr−1 between 2004 and 2008, followed by WAIS and APIS, with standard deviations of 23 and 10 Gt yr−1, respectively. On the other hand, radar altimetry solutions show a larger spread at WAIS (21 Gt yr−1) than at EAIS (14 Gt yr−1) during their overlap period (2013 to 2018).
The gravimetry group has the largest number of estimates, with 16 for each ice sheet that together span the period 2002 to 2020. All gravimetry solutions were submitted as time series of cumulative mass change at a monthly resolution, resulting in a collective effective resolution of 0.08 years. All participants submitted estimates for all ice sheet regions, with 10 participants analysing spherical harmonic gravity field solutions using a wide range of approaches and 6 participants using mass concentration units (usually referred to as mascons) directly estimated from the GRACE and GRACE-FO Level-1 K-band-ranging data. Various GIA, hydrology leakage, and ocean leakage models were used to correct the gravimetry data for external signals. Overall, there is good agreement between the rates of ice sheet mass balance derived from satellite gravimetry. In Greenland, we compare the different gravimetry solutions over the period 2012 to 2014 and find that annual rates of mass have a median difference of 36 Gt yr−1, and the standard deviation is 30 Gt yr−1. In Antarctica, the different gravimetry solutions overlap over a decade, from 2004 to 2014, during which their annual rates of mass balance have a median difference of 41 Gt yr−1. When comparing over the different regions of the Antarctic continent, the difference is greatest at EAIS, with a median difference of 31 Gt yr−1 and standard deviation of 26 Gt yr−1. In the other regions, gravimetry estimates are in better agreement at APIS, with a median difference of 8 Gt yr−1 and standard deviation of 10 Gt yr−1, followed by WAIS, where the median difference between estimates reaches 19 Gt yr−1, and their standard deviation is 17 Gt yr−1.
Comparing mass balance estimates derived from similar satellite observations reveals that, in Greenland, the median difference between estimates is the largest for the altimetry group and the smallest for the input–output group. In Antarctica, the median difference between altimetry estimates is less than 38 Gt yr−1 and less than 41 Gt yr−1 for gravimetry estimates during their respective overlap periods. However, this comparison is limited by the varying temporal resolutions of the different datasets – especially for the altimetry group for which constant rates of mass change over long periods of time dampen the temporal variation in ice sheet mass changes – and by the small number of input–output estimates – in particular in Antarctica, where only one estimate is available. This limits our ability to link differences between estimates derived from the same geodetic technique to methodological differences or to the use of different geophysical corrections or auxiliary datasets.
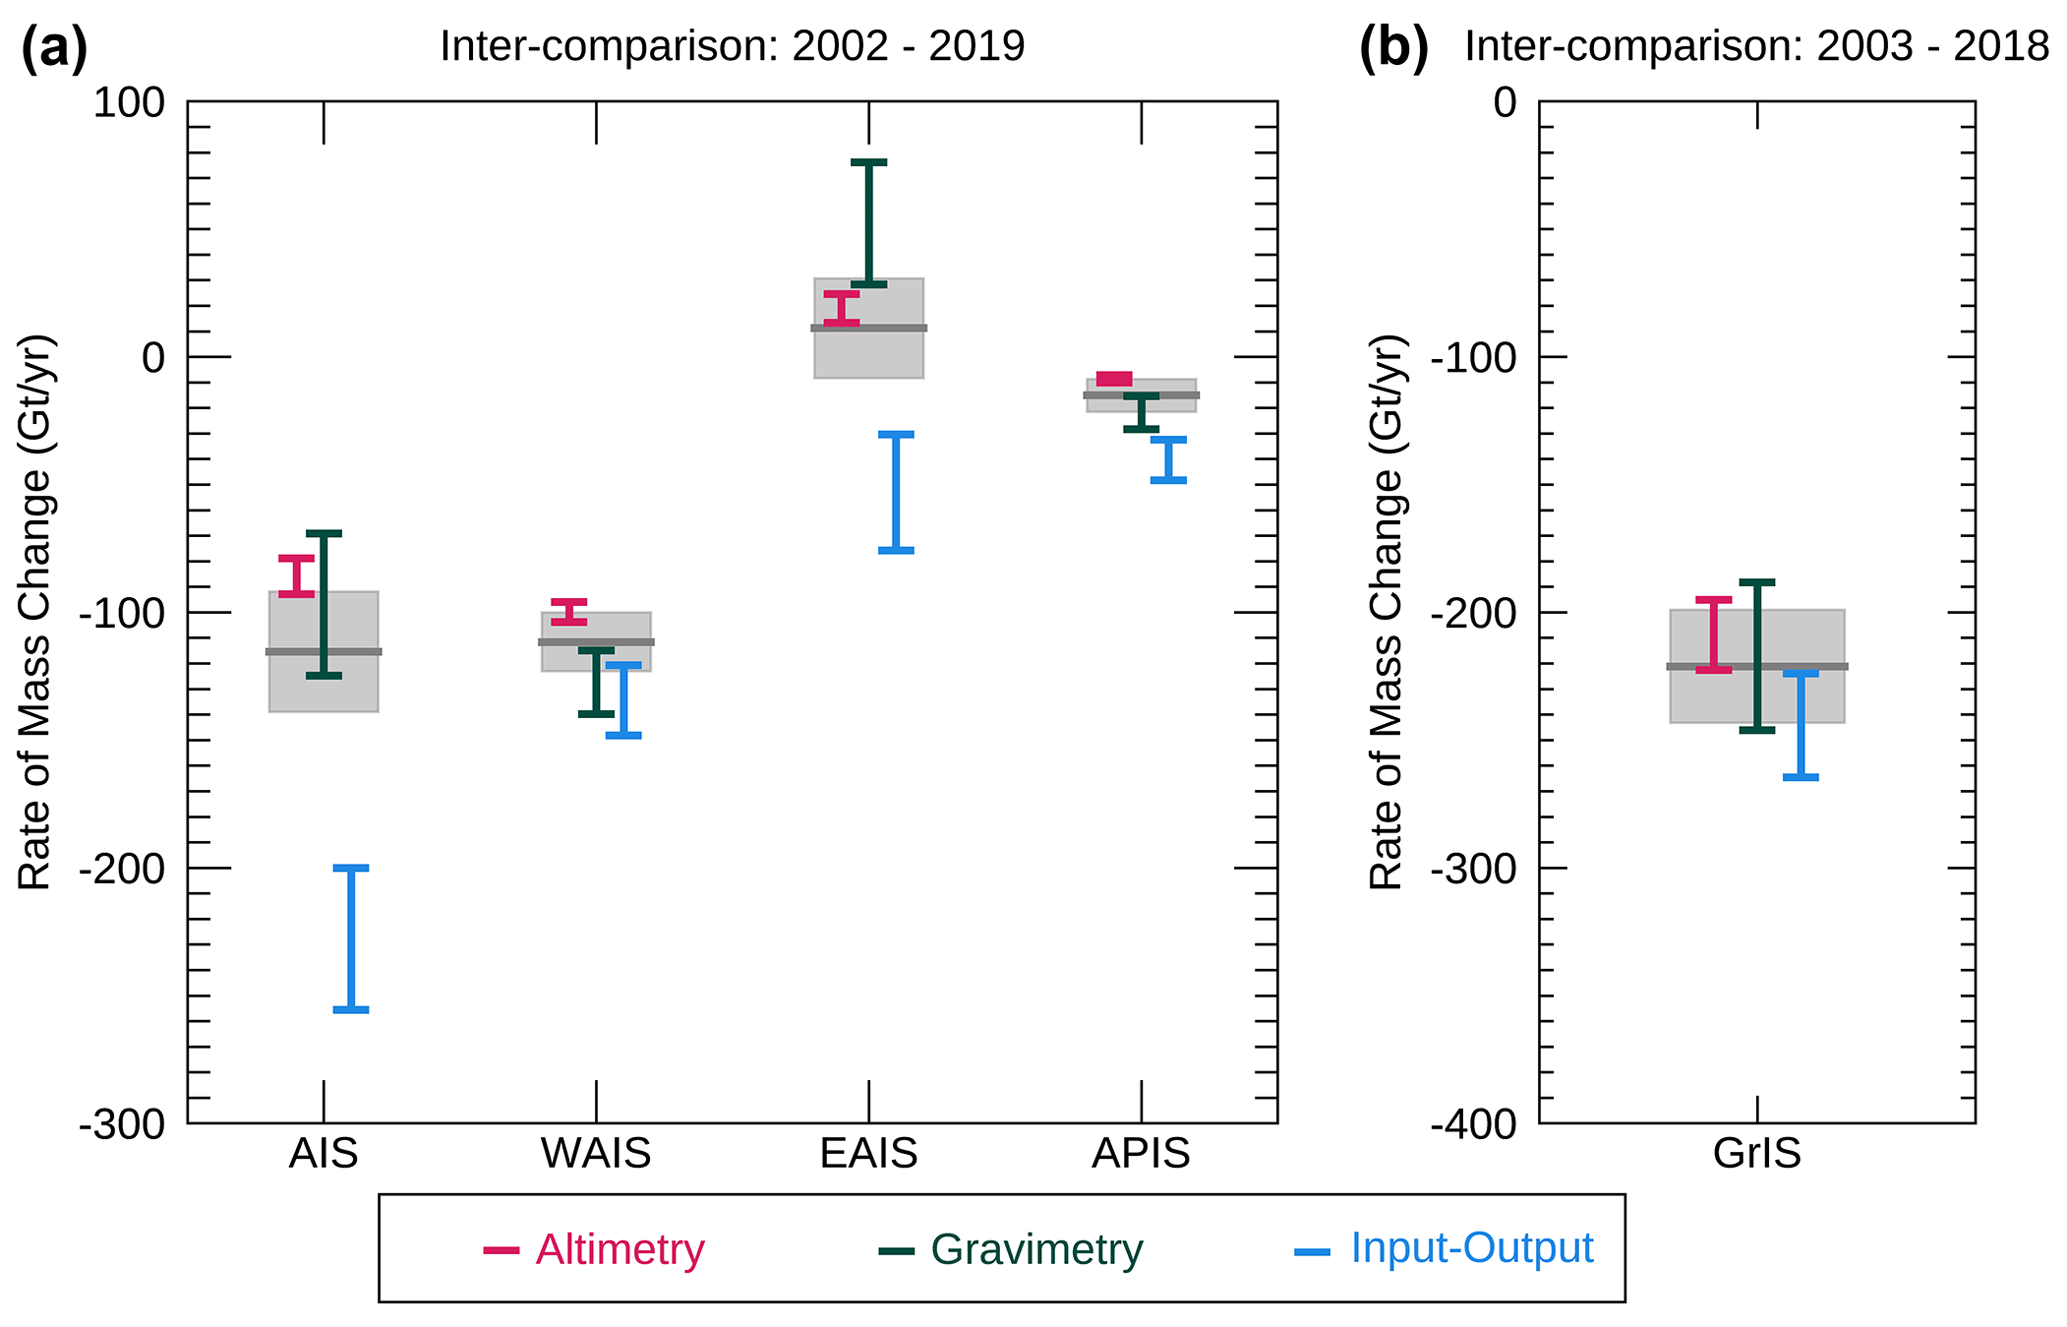
Figure 3Inter-comparison of rates of ice sheet mass balance of (a) AIS, WAIS, EAIS, and APIS over the overlap period 2002–2019 and of (b) GrIS during the overlap period 2003–2018, as derived from the altimetry, gravimetry, and input–output techniques. The coloured bars represent the rates of mass balance and uncertainties in the aggregated technique time series, as calculated in Sect. 3 (ii). The grey box represents the rate of mass balance of our final reconciled assessment, which was calculated following the procedure detailed in Sect. 3 (iii). The horizontal line in the middle of the box shows the reconciled rate of the mass balance, and the height of the box represents its associated uncertainty.
Next, we assess differences between the aggregated time series derived within each class of satellite observations during the periods when estimates from all three geodetic techniques are available – from 2003 to 2018 for Greenland and from 2002 to 2019 for Antarctica (Fig. A1). We compare rates of mass change during these overlap periods, which are 5 and 10 years longer than in the previous IMBIE assessments, respectively (Fig. 3). We compare the standard deviation in aggregated rates of mass change altimetry, gravimetry, and input–output estimates rates of mass change to the uncertainty in our reconciled mass balance estimate (computed from Eq. 5) to assess whether differences between techniques are significant compared to the uncertainty in our reconciled assessment. In Greenland, the rates of mass balance determined from altimetry, gravimetry, and the input–output method are in close agreement between 2003 and 2018, with a standard deviation of 19 Gt yr−1 and a reconciled rate of mass loss of 221±22 Gt yr−1 from all three techniques. In Antarctica, the reconciled rate of mass loss between 2003 and 2019 is 115±24 Gt yr−1, but the spread of the altimetry, gravimetry, and input–output estimates is 4 times larger than in Greenland (79 Gt yr−1). Over the different regions of Antarctica, the spread of estimates of ice sheet mass balance increases with the size of the region considered, with standard deviations of 54, 18, and 16 Gt yr−1 at EAIS, WAIS, and APIS, respectively. Across all ice sheets, the input–output estimate is the most negative and the altimetry the most positive, except at EAIS, where the gravimetry estimate is the most positive. The greatest departure occurs at EAIS, where the three geodetic techniques disagree on even the sign of the mass change, with a maximum difference of 105±33 Gt yr−1 between the rates of mass change from the input–output method and gravimetry estimates. This indicates that EAIS remains a challenging region for which to monitor mass changes, likely due to the large extent of this region, the poorly constrained GIA signal, palaeo-ice reconstruction (Bentley et al., 2014; Martín-Español et al., 2016; Small et al., 2019), and the relatively small mass imbalance in comparison to natural fluctuations in SMB in East Antarctica (Mottram et al., 2021).
When examining the aggregated time series of rate of mass change at an annual resolution, we find the highest temporal correlation between the three time series at GrIS (). In addition, the gravimetry and input–output annual rates are also well correlated at APIS and WAIS (r2=0.83). However, the altimetry mass balance time series is poorly correlated with both the aggregated gravimetry and input–output time series at APIS and EAIS (r2<0.18). The better correlation between the gravimetry and input–output time series can be explained by their finer temporal resolutions, which are sufficient to resolve annual fluctuations in ice sheet mass balance which are substantial in these regions. Overall, we find that the vast majority of individual estimates of annual rates of mass balance included in this study fall within the uncertainty bounds of our reconciled estimate, given their respective individual errors, with 96 %, 83 %, 83 %, 76 %, and 81 % of those annual rates of mass change falling within the reconciled uncertainty range at GrIS, AIS, APIS, EAIS, and WAIS, respectively.
Table 2Rates of ice sheet mass change (Gt yr−1). Rates are calculated from the first day (1 January) of the first year quoted to the last day (31 December) of the final year quoted in the table. For context, the last column gives the g.m.s.l. trend (mm yr−1), calculated from the Aviso product (https://www.aviso.altimetry.fr/msl/, last access: 12 April 2022) over the same period (as the g.m.s.l. record starts in 1993, we do not compute the fraction of sea level rise from the ice sheets for the first and last time period of the table). The percentage in parentheses is the fraction of the sea level rise driven by the ice sheets.
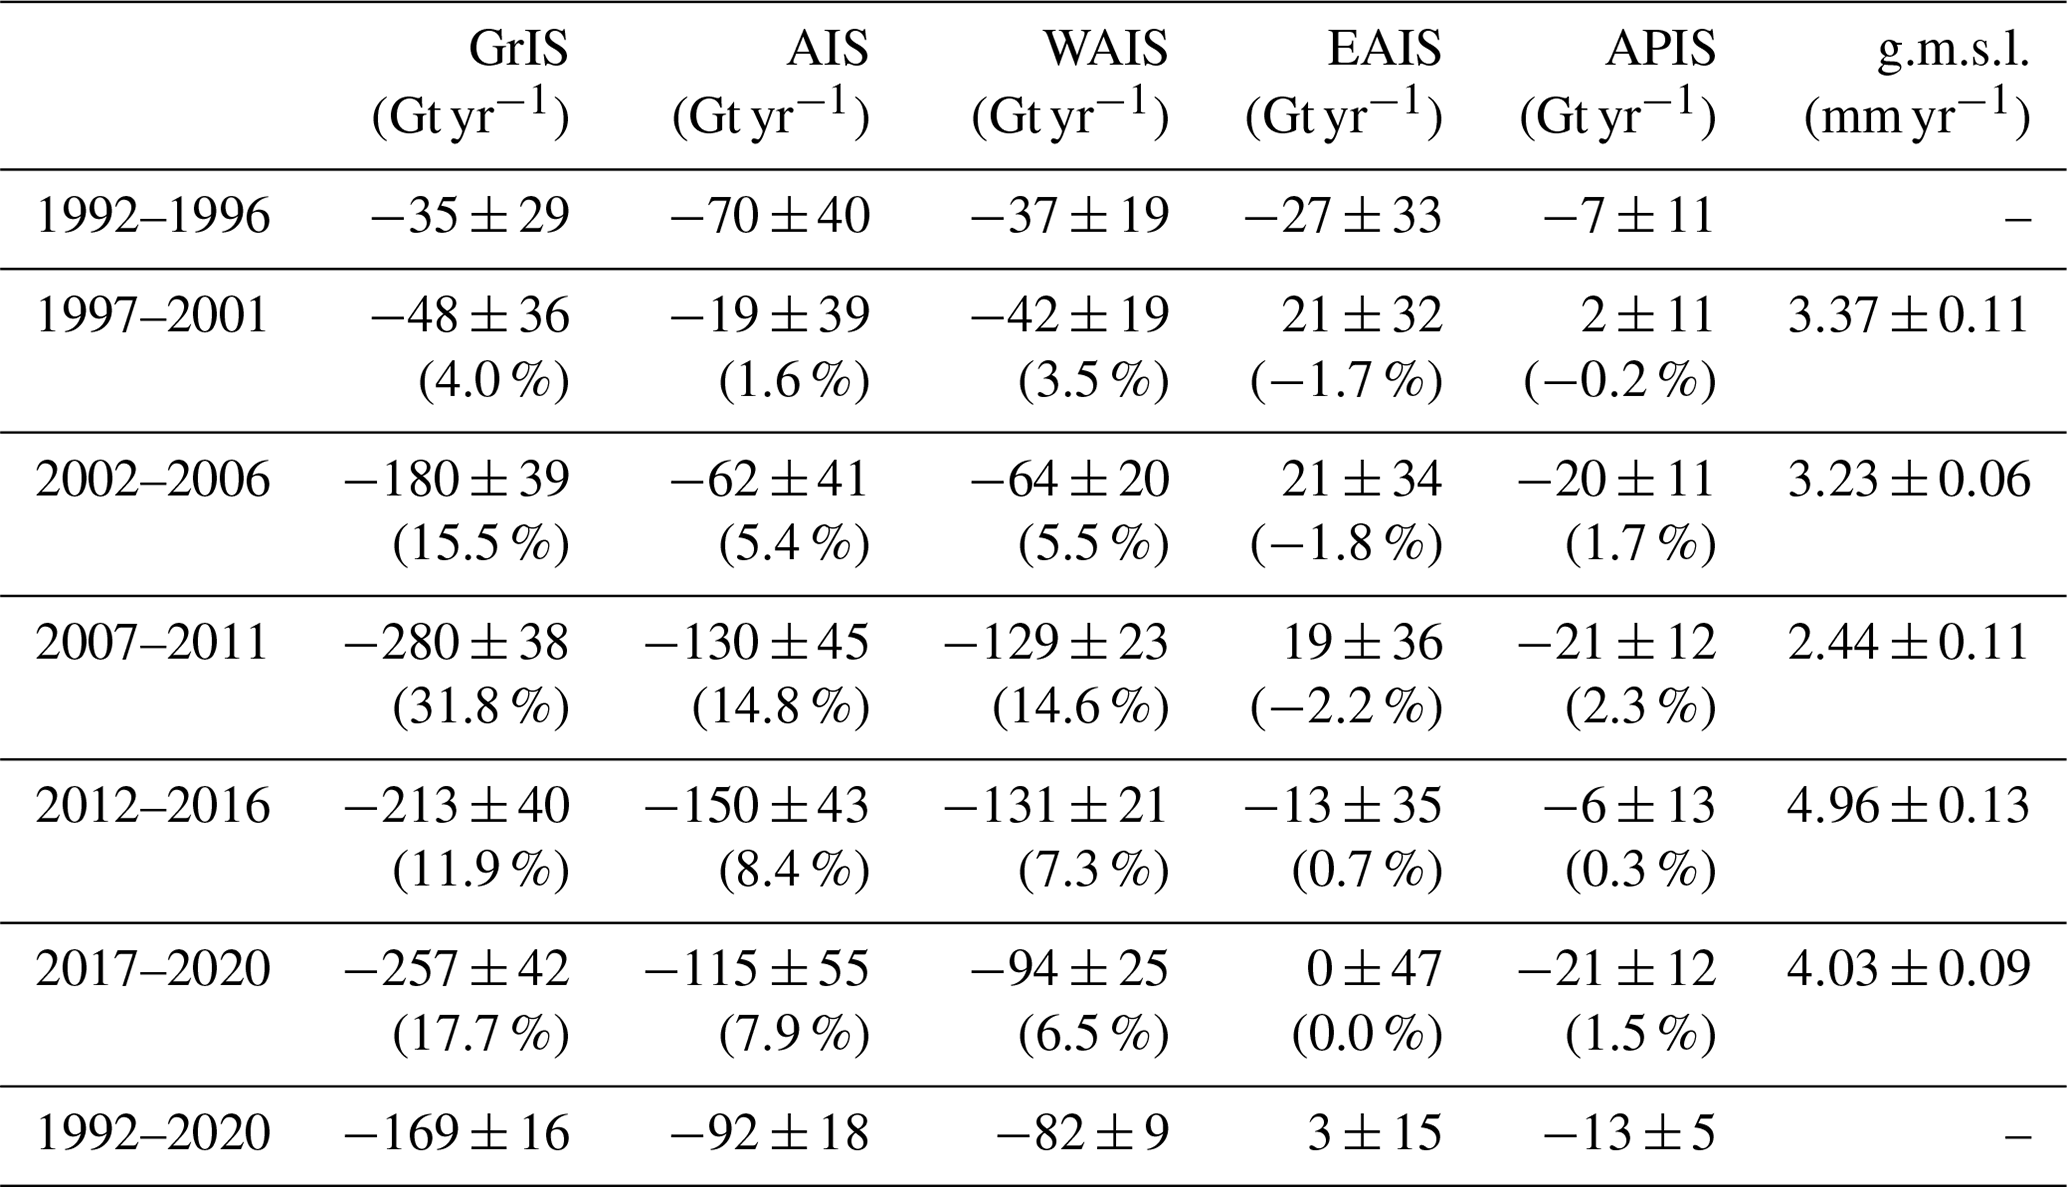
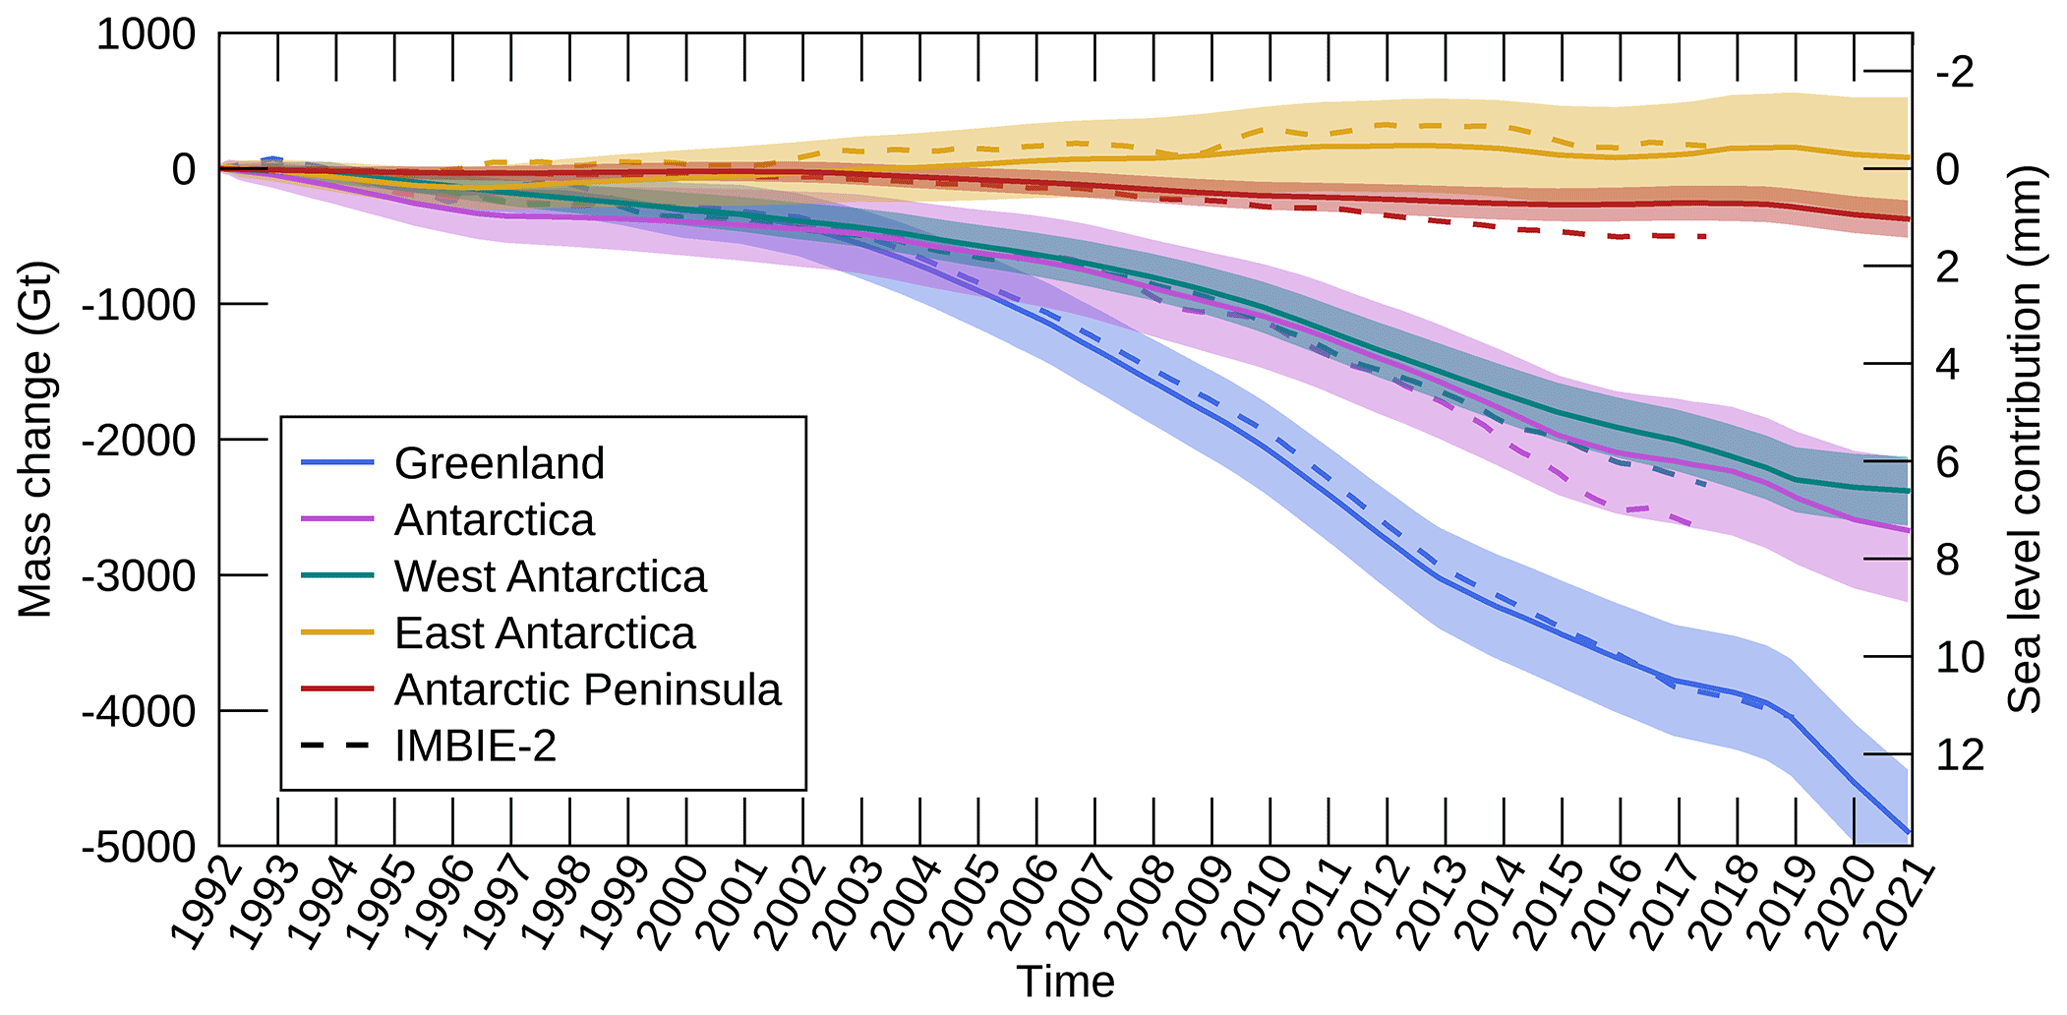
Figure 4Cumulative ice sheet mass changes. The shadings represent the associated uncertainties and are calculated following the procedure described in Sect. 3 (iv). The dashed lines show the results from our previous assessments (IMBIE-2).
We integrate the combined mass balance estimates from gravimetry, altimetry, and the input–output method (Fig. 2) to determine the cumulative mass that has been lost from Antarctica and Greenland since 1992 (Fig. 4). The Antarctic mass loss continues to be dominated by ice discharge from West Antarctica, where the signal is strongest – rising from 37±19 Gt yr−1 between 1992 and 1996 to a maximum of 131±21 Gt yr−1 between 2012 and 2016 (Table 2), before slowing slightly to 94±25 Gt yr−1 during the last 4 years of our survey between 2017 and 2020. At the Antarctic Peninsula, the increase in the losses since the early 2000s that is generally associated with ice shelf collapse (Rignot et al., 2004; Cook and Vaughan, 2010; Adusumilli et al., 2018) was masked briefly between 2012 and 2016, when the average rate of mass loss was reduced by 15 to 6±13 Gt yr−1, in part due to an extreme snowfall event in 2016 (Wang et al., 2021; Chuter et al., 2021), before returning to 21±12 Gt yr−1 between 2017 and 2020. East Antarctica remains the least certain component of Antarctic Ice Sheet mass balance, where the average 29-year mass trend is 3±15 Gt yr−1. In all, the Antarctic Ice Sheet lost 2671±530 Gt of ice between 1992 and 2020, raising the global sea level by 7.4±1.5 mm. After doubling in the mid-2000s from 62±41 to 130±45 Gt yr−1, increased Antarctic ice losses – largely driven by an acceleration in ice discharge from the Amundsen Sea sector (Mouginot et al., 2014) – have persisted to the present day. The rate of Greenland ice loss has remained highly variable during the last 5-year period of our updated assessment, ranging from 86±75 Gt yr−1 in 2017 to a new maximum of 444±93 Gt yr−1 in 2019 driven by exceptional surface melting during the summer (Tedesco and Fettweis, 2020). The majority of ice sheet losses have arisen from Greenland during our 29-year survey, with 4892±457 Gt in total at an average rate of 169±16 Gt yr−1. Combined, Antarctica and Greenland lost 7563±699 Gt of ice between 1992 and 2020, raising the global sea level by 21±2 mm.
5.1 Comparison to previous IMBIE assessment
Finally, we assess the consistency of our results with our most recent assessment of ice sheet mass balance (IMBIE-2) to evaluate the impact of incorporating updated datasets and using an updated processing scheme. During their overlapping periods – 1992 to 2017 for Antarctica and 1992 to 2018 for Greenland – the results of this study and IMBIE-2 are in agreement within their respective uncertainties, with rates of mass loss of 150.0±16 and 150±12 Gt yr−1 for GrIS, respectively, and rates of 86±19 and 103±22 Gt yr−1 for AIS, respectively. Next, comparing rates of mass balance within calendar years shows that results from this study and our previous assessment are consistent across all years for all ice sheets, except for 2 years at the start of our record (1992 and 1995) at GrIS, for which the difference between our mass balance assessments exceeds their respective uncertainty bounds. On average, the magnitude of the differences in the annual rates of mass balance is 36 Gt yr−1 at GrIS, 33 Gt yr−1 at AIS, 12 Gt yr−1 at APIS, 31 Gt yr−1 at EAIS, and 23 Gt yr−1 at WAIS. The relatively small differences between our previous and current mass balance assessments originate from a combination of our inclusion of updated datasets and the implementation of an updated processing scheme in this study. In all ice sheet regions, participant datasets have been updated compared to our previous assessment. In addition, in this study, we apply a common processing scheme to AIS and GrIS, while in our previous study the mass balance assessments were aggregated without and with inverse-error weighting, respectively.
5.2 Limitations of this study and roadmap for future improvements
In this section, we discuss the limitations of our dataset and a roadmap to improve ice sheet mass balance assessments. The inclusion of the peripheral glaciers and ice caps in the vicinity of the Greenland and Antarctic ice sheets is ambiguous in our assessment, as not all individual estimates of ice sheet mass balance included here account for those. This relates to the varying ability of satellite techniques to resolve mass balance over those small glaciated areas. Space gravimetry has a coarse spatial resolution of a few hundred kilometres, which is not sufficient to separate signals of mass change originating from the ice sheet and its peripheral glaciers. On the other hand, the altimetry estimates included in this assessment exclude the peripheral glaciers and ice caps due to the complex terrain of these glaciers and their relatively small size compared to the footprint size of traditional pulse-limited altimeters. Finally, the input–output estimates do include mass changes from these glaciers, mostly by estimating their changes in SMB. Despite covering a relatively small area (around 1/10 of the area of the ice sheets; Pfeffer et al., 2014), these glaciers contribute significantly to the global mean sea level rise, with ice losses originating from the glaciers peripheral to the Greenland and Antarctic ice sheets amounting to 36±6 and 21±5 Gt yr−1 during the period 2010–2019, respectively (Hugonnet et al., 2021b). In addition, ice losses have accelerated in the periphery of the Greenland Ice Sheet, with glacier mass loss increasing by 64 % between 2003–2009 and 2018–2021 (Khan et al., 2022). These glaciers therefore need to be accounted for without ambiguity in future IMBIE assessments to remove systematic biases between the different satellite techniques linked to their (non-)inclusion in individual mass balance estimates. Here, we performed a simple analysis to assess the potential impact of the ambiguous inclusion of these peripheral ice masses in our reconciled mass balance assessment and showed that this impact is limited thanks to the fact that we are aggregating different satellite techniques together – including some able to resolve ice sheet mass changes separately – and a different weighting has been applied to the different estimates included. However, future approaches to address this issue will require careful treatment of the leakage of mass signals between the ice sheets and their peripheral GICs within the gravimetry community, rather than being limited to a subsequent removal of the contribution of these glaciers as we have done here. This will nonetheless require robust mass balance estimates for developing and evaluating new methods. The recent inventory of Earth's glaciers from satellite photogrammetry (Hugonnet et al., 2021b), recent progress in satellite altimetry – with the development of CryoSat-2 swath radar altimetry for measuring mass changes in mountain glaciers (Foresta et al., 2016; Jakob et al., 2021) and the launch of ICESat-2 – and new community initiatives, such as GlamBIE (the Glacier Mass Balance Inter-comparison Exercise), will further contribute to this effort.
Continuing efforts to understand the remaining differences between altimetry, gravimetry, and the input–output method are critical to provide more robust observational estimates of the contribution of the ice sheets to g.m.s.l. Producing estimates with a finer temporal resolution by using data from the newest satellite missions, reprocessing the satellite record with the newest geophysical corrections, and using a better uncertainty characterisation will undoubtedly help further reconcile satellite assessments of ice sheet mass balance produced from different techniques. To achieve this, it is also important to assess the impact of SMB and GIA models. SMB processes are responsible for a large proportion of Greenland's ice losses (and, to a lesser extent, of Antarctica's ice losses; Enderlin et al., 2014; IMBIE Team, 2020), and thus pursuing the efforts of recent model inter-comparisons (Fettweis et al., 2020; Mottram et al., 2021) is not only key to improve the agreement between input–output estimates but also to partition mass trends into SMB and ice dynamics components as it provides critical information on the dominant processes at play. A model inter-comparison of GIA models would also be timely, as new approaches have been developed in recent years to determine the GIA signal (Whitehouse, 2018). New data-driven solutions that rely on present-day geodetic observations (e.g. Riva et al., 2009; Vishwakarma et al., 2022) and solutions derived from coupling a GIA model to an ice sheet mode (de Boer et al., 2017) have become available. Examining the variability in GIA solutions determined from forward models, data inversion, and coupled models will help reduce uncertainties in space gravimetry estimates of the ice sheet mass balance.
Finally, improving the spatial resolution of the IMBIE assessment by producing time series of mass changes within the individual basins of the Greenland and Antarctic ice sheets will also contribute to identifying further areas of similarities and disagreement between satellite techniques (Sutterley et al., 2014b) and will support the identification of spatial biases in satellite estimates of ice sheet mass balance. In addition, regional assessments of ice sheet mass balance could support the evaluation and calibration of ice sheet models, contributing to reducing uncertainties in future sea level rise projections (Edwards et al., 2021; Nias et al., 2019).
The aggregated Greenland and Antarctic ice sheet mass balance data and associated errors generated in this study are freely available from Natural Environment Research Council's (NERC) Polar Data Centre at https://doi.org/10.5285/77B64C55-7166-4A06-9DEF-2E400398E452 (IMBIE Team, 2021).
The code used to compute and aggregate the rates of ice sheet mass change and their errors is freely available at https://github.com/IMBIE (last access: 10 January 2023) and https://doi.org/10.5281/zenodo.7342481 (Otosaka et al., 2022).
We combine 50 estimates of ice sheet mass balance, 27 for Greenland and 23 for Antarctica, to produce a new, reconciled estimate of ice sheet mass balance, showing that the ice sheets lost 7563±699 Gt of ice between 1992 and 2020. Ice losses have accelerated at both ice sheets over this 29-year record, and the rate of ice loss is now 5 times higher in Greenland and 25 % higher in Antarctica compared to the early 1990s. Our assessment shows that the altimetry, gravimetry, and input–output method are in close agreement in Greenland, with a spread of 19 Gt yr−1 over their common time period, which represents only 10.9 % of the rate of imbalance. In Antarctica, the spread between techniques is 4 times larger than in Greenland, mostly due to large differences between estimates for the East Antarctic Ice Sheet. To further explore and interpret differences between geodetic techniques, producing altimetry estimates with a finer temporal resolution (especially during the first half of the satellite altimetry record), better GIA constraints for the gravimetry estimates, and additional estimates of ice sheet mass balance via the input–output method would improve the comparison and aggregation of ice sheet mass balance estimates. Continuously monitoring the mass balance of the ice sheets and producing annual updates of Greenland and Antarctica mass balance is critical to track their contribution to the g.m.s.l. and constrain projections of future sea level rise.
Table A1References of the datasets, methods, GIA, and SMB models employed by participants of the input–output (IOM), altimetry (ALT), and gravimetry (GMB) experiment groups.
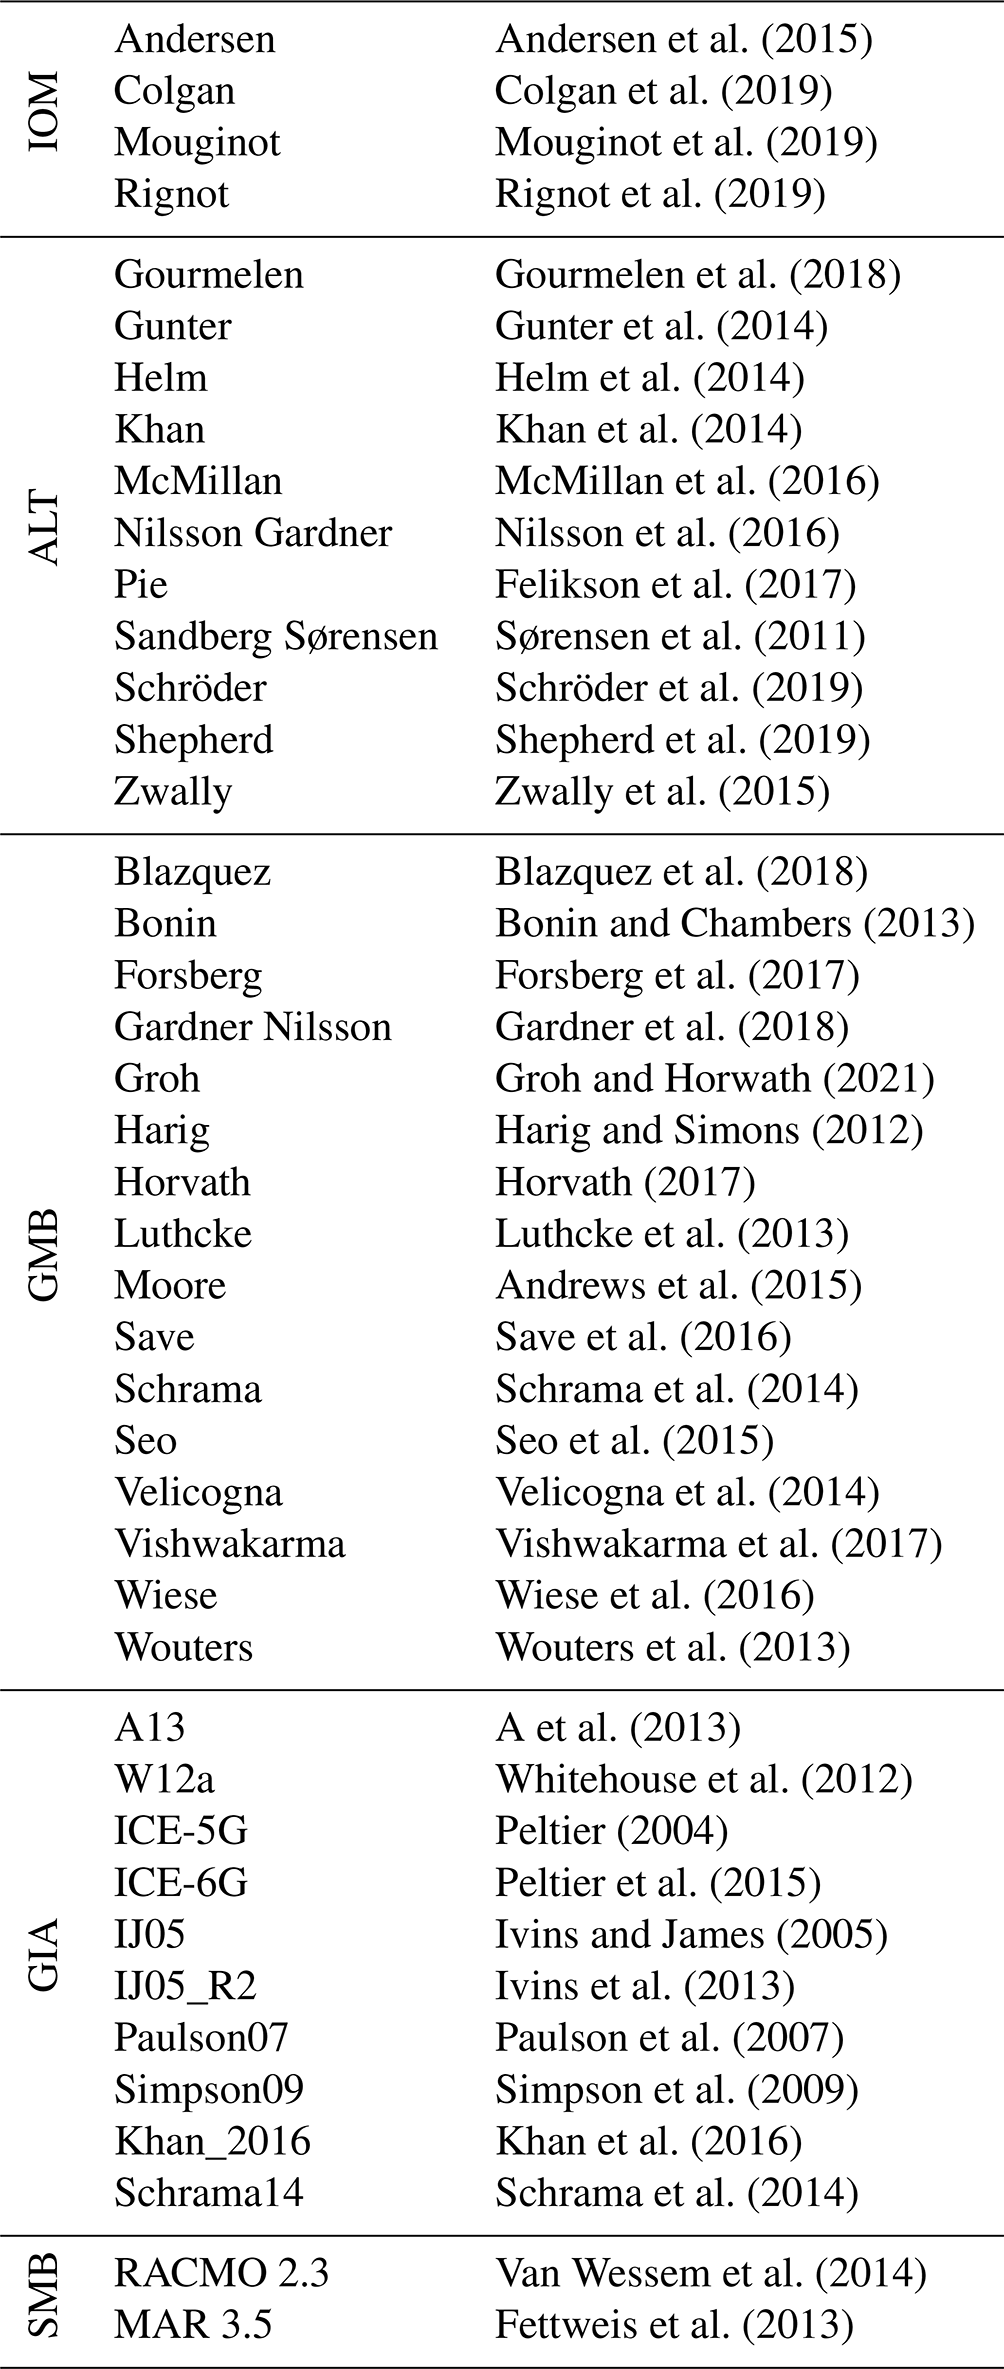
Table A2Rates of mass change (in Gt yr−1) over the gravimetry record (2002 to 2020) from our reconciled estimate and from a modified version of our reconciled estimate in which the contribution of the peripheral glaciers has been removed from the gravimetry estimates following the method described in Sect. 3.
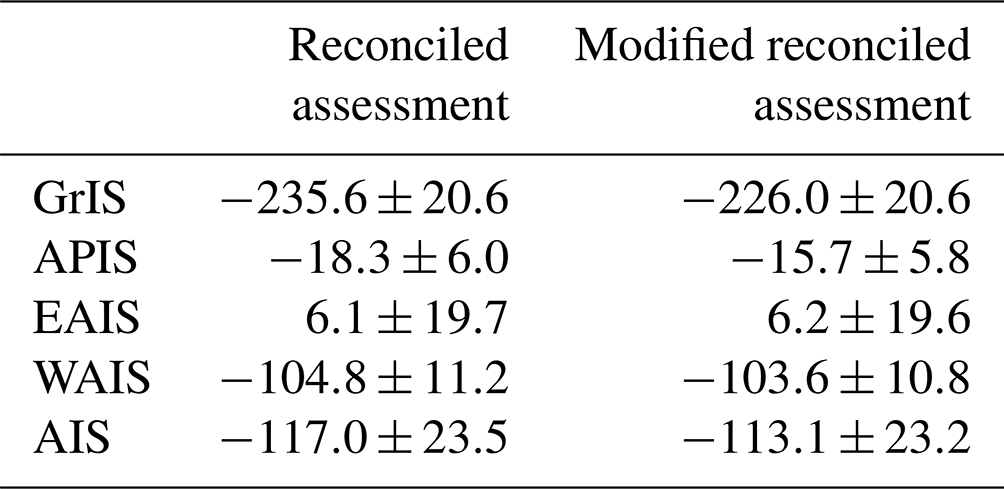
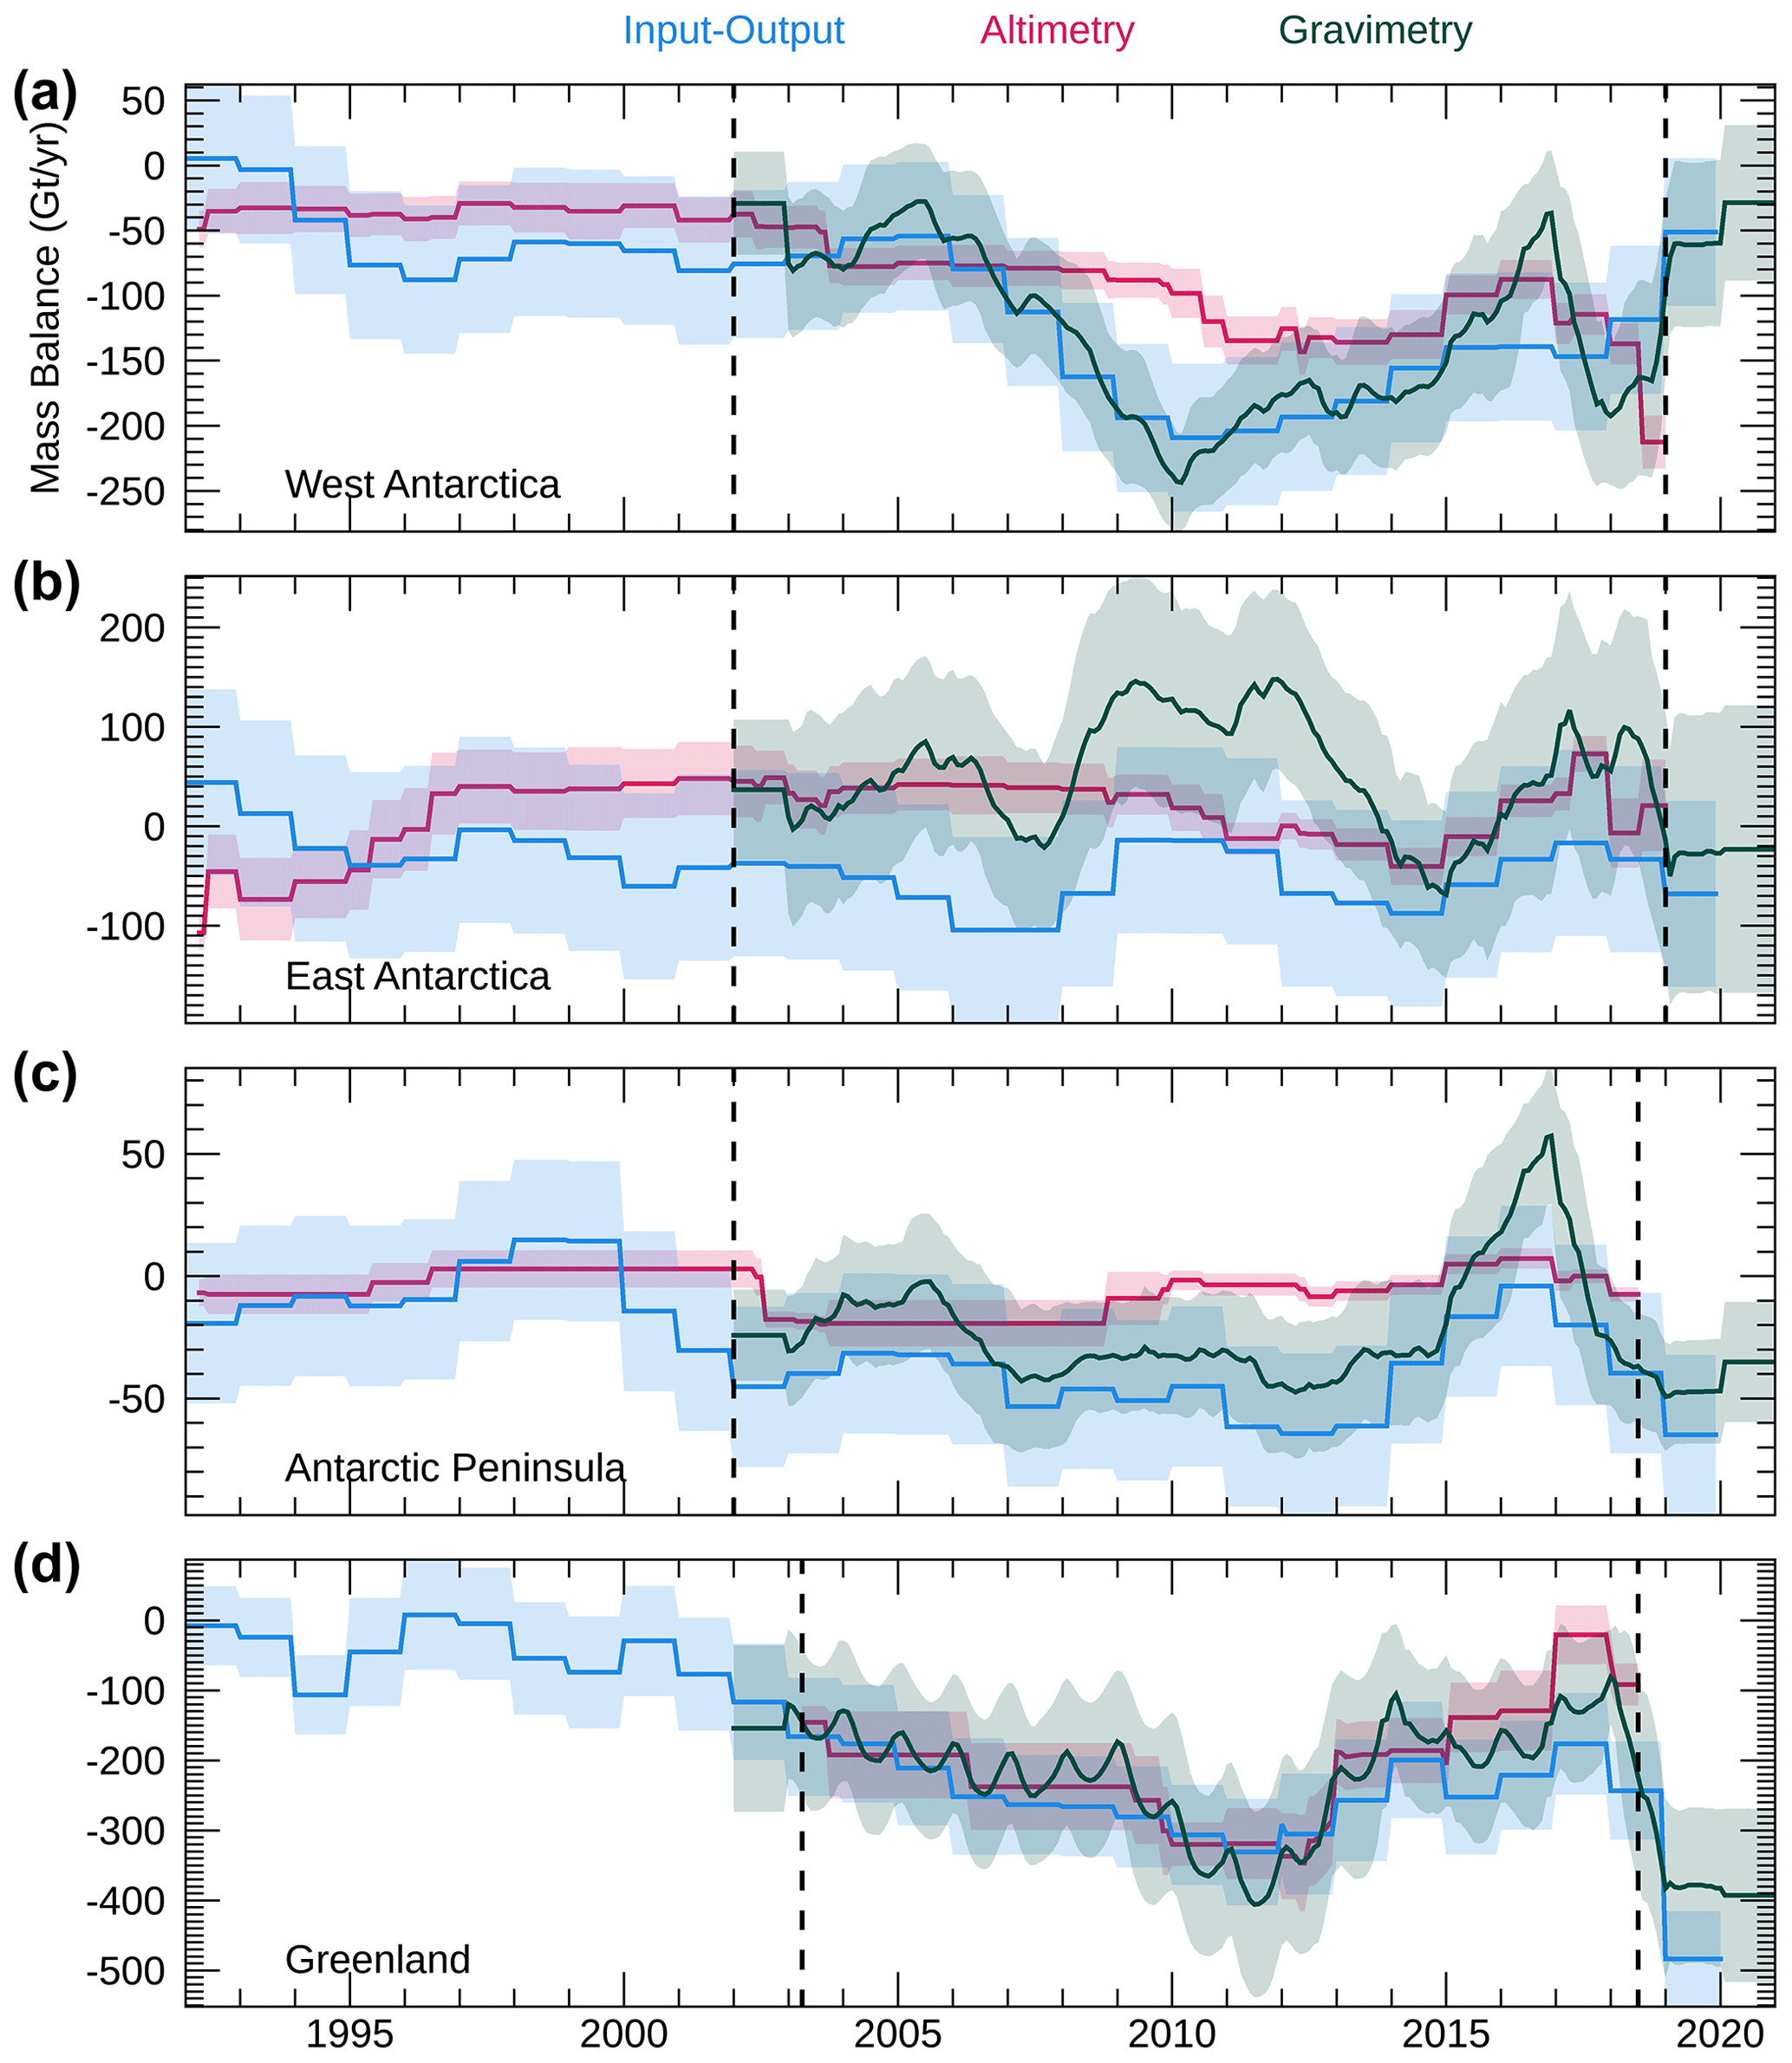
Figure A1Mass balance time series from the aggregated altimetry, gravimetry, and input–output method over (a) WAIS, (b) EAIS, (c) APIS, and (d) GrIS. The vertical dashed lines mark the overlap period of the three time series. The aggregated time series and corresponding uncertainties are calculated following the methods described in Sect. 3 (ii).
The executive committee of IMBIE (AS, ERI, NJS, INO, ChA, MRvdB, MH, IJ, MDK, GK, SN, AJP, ER, TeS, KMS, BES, LSS, IV, and PLW) designed the study. AS, LSS, AlG, LG, NG, BCG, VH, SAK, HK, MM, JN, NP, LS, and SBS contributed altimetry estimates. MH, IV, AB, RF, AlG, AnG, CH, CCL, BDL, JN, IS, HVS, KWS, EJOS, TCS, BDV, DW, and BW contributed gravimetry estimates. ER, APA, WC, JM, and BS contributed input–output estimates. MRvdB, ChA, MB, CéA, XF, HG, CK, PLL, SHM, RM, BN, and JMvW contributed SMB estimates. GA, BSL, DM, WRP, GS, and WdvW contributed GIA estimates. INO and MEP performed the mass balance data collation. INO prepared the dataset comparison, led the writing, and prepared the figures and tables. INO, AS, and ThS wrote the paper. All authors participated in the data interpretation and commented on the paper.
At least one of the (co-)authors is a member of the editorial board of Earth System Science Data. The peer-review process was guided by an independent editor, and the authors also have no other competing interests to declare.
Publisher's note: Copernicus Publications remains neutral with regard to jurisdictional claims in published maps and institutional affiliations.
This work is an outcome of the Ice Sheet Mass Balance Inter-comparison Exercise (IMBIE) supported by the ESA EOEP-5 “EO Science for Society”, the ESA “Climate Change Initiative”, and the NASA Cryosphere Program.
A portion of this research was carried out at the Jet Propulsion Laboratory, California Institute of Technology, under a contract with the National Aeronautics and Space Administration (NASA; grant no. 80NM0018D0004). Funding for Erik R. Ivins and Nicole-Jeanne Schlegel has been provided by NASA ROSES solicitation (grant no. NNH20ZDA001N-CRYO) in response to proposal 20-CRYO2020-0003. GEUS data, provided from the Programme for Monitoring of the Greenland Ice Sheet (http://www.PROMICE.dk, last access: 8 July 2021), were funded by the Danish Ministry of Climate, Energy, and Utilities. Malcolm McMillan received support of the UK NERC Centre for Polar Observation and Modelling (CPOM) and the Lancaster University UKCEH Centre of Excellence in Environmental Data Science. Peter L. Langen received support from the Aarhus University Interdisciplinary Centre for Climate Change (iClimate, Aarhus University). Noel Gourmelen used CryoSat data obtained from ESA at http://cs2eo.org (last access: 10 October 2021) and via the CryoTEMPO-EOLIS project https://cryotempo-eolis.org/ (last access: 10 October 2021). Giorgio Spada has been funded by a research grant from DIFA (Dipartimento di Fisica e Astronomia Augusto Righi) of the Alma Mater Studiorum Università di Bologna. Johan Nilsson and Alex Gardner have been supported by the ITS_LIVE project awarded through NASA MEaSUREs Program and the NASA Cryosphere program through participation in the ICESat-2 science team. Ingo Sasgen acknowledges funding by the Helmholtz Climate Initiative REKLIM (Regional Climate Change), a joint research project of the Helmholtz Association of German Research Centres (HGF). Ice velocity data for Greenland and Antarctica, provided by UC Irvine, are funded by the NASA MEaSUREs Program. BedMachine Antarctica is funded by the NASA MEaSUREs Program. BedMachine Greenland is funded by research grants from the NASA Operation IceBridge Mission. Bert Wouters has been funded by NWO VIDI (grant no. 016.Vidi.171.063).
This paper was edited by Chris DeBeer and reviewed by Anny Cazenave and Ellyn Enderlin.
A, G., Wahr, J., and Zhong, S.: Computations of the viscoelastic response of a 3-D compressible Earth to surface loading: an application to Glacial Isostatic Adjustment in Antarctica and Canada, Geophys. J. Int., 192, 557–572, https://doi.org/10.1093/gji/ggs030, 2013.
Adusumilli, S., Fricker, H. A., Siegfried, M. R., Padman, L., Paolo, F. S., and Ligtenberg, S. R. M.: Variable Basal Melt Rates of Antarctic Peninsula Ice Shelves, 1994–2016, Geophys. Res. Lett., 45, 4086–4095, https://doi.org/10.1002/2017GL076652, 2018.
Adusumilli, S., Fricker, H. A., Medley, B., Padman, L., and Siegfried, M. B.: Interannual variations in meltwater input to the Southern Ocean from Antarctic ice shelves, Nat. Geosci., 13, 616–620, https://doi.org/10.1038/s41561-020-0616-z, 2020.
Andersen, M. L., Stenseng, L., Skourup, H., Colgan, W., Khan, S. A., Kristensen, S. S., Andersen, S. B., Box, J. E., Ahlstrøm, A. P., Fettweis, X., and Forsberg, R.: Basin-scale partitioning of Greenland ice sheet mass balance components (2007–2011), Earth Planet. Sc. Lett., 409, 89–95, 2015.
Andrews, S. B., Moore, P., and King, M. A.: Mass change from GRACE: a simulated comparison of Level-1B analysis techniques, Geophys. J. Int., 200, 503–518, 2015.
Aschwanden, A., Bartholomaus, T. C., Brinkerhoff, D. J., and Truffer, M.: Brief communication: A roadmap towards credible projections of ice sheet contribution to sea level, The Cryosphere, 15, 5705–5715, https://doi.org/10.5194/tc-15-5705-2021, 2021.
Bentley, M. J., Ó Cofaigh, C., Anderson, J. B., Conway, H., Davies, B., Graham, A. G. C., Hillenbrand, C.-D., Hodgson, D. A., Jamieson, S. S. R., Larter, R. D., Mackintosh, A., Smith, J. A., Verleyen, E., Ackert, R. P., Bart, P. J., Berg, S., Brunstein, D., Canals, M., Colhoun, E. A., Crosta, X., Dickens, W. A., Domack, E., Dowdeswell, J. A., Dunbar, R., Ehrmann, W., Evans, J., Favier, V., Fink, D., Fogwill, C. J., Glasser, N. F., Gohl, K., Golledge, N. R., Goodwin, I., Gore, D. B., Greenwood, S. L., Hall, B. L., Hall, K., Hedding, D. W., Hein, A. S., Hocking, E. P., Jakobsson, M., Johnson, J. S., Jomelli, V., Jones, R. S., Klages, J. P., Kristoffersen, Y., Kuhn, G., Leventer, A., Licht, K., Lilly, K., Lindow, J., Livingstone, S. J., Massé, G., McGlone, M. S., McKay, R. M., Melles, M., Miura, H., Mulvaney, R., Nel, W., Nitsche, F. O., O'Brien, P. E., Post, A. L., Roberts, S. J., Saunders, K. M., Selkirk, P. M., Simms, A. R., Spiegel, C., Stolldorf, T. D., Sugden, D. E., van der Putten, N., van Ommen, T., Verfaillie, D., Vyverman, W., Wagner, B., White, D. A., Witus, A. E., and Zwartz, D.: A community-based geological reconstruction of Antarctic Ice Sheet deglaciation since the Last Glacial Maximum, Quaternary Sci. Rev., 100, 1–9, 2014.
Blazquez, A., Meyssignac, B., Lemoine, J., Berthier, E., Ribes, A., and Cazenave, A.: Exploring the uncertainty in GRACE estimates of the mass redistributions at the Earth surface: implications for the global water and sea level budgets, Geophys. J. Int., 215, 415–430, 2018.
Bonin, J. and Chambers, D.: Uncertainty estimates of a GRACE inversion modelling technique over Greenland using a simulation, Geophys. J. Int., 194, 212–229, 2013.
Caron, L. and Ivins, E. R.: A baseline Antarctic GIA correction for space gravimetry, Earth Planet. Sc. Lett., 531, 115957, https://doi.org/10.1016/j.epsl.2019.115957, 2020.
Chuter, S. J., Zammit-Mangion, A., Rougier, J., Dawson, G., and Bamber, J. L.: Mass evolution of the Antarctic Peninsula over the last 2 decades from a joint Bayesian inversion, The Cryosphere, 16, 1349–1367, https://doi.org/10.5194/tc-16-1349-2022, 2022.
Colgan, W., Mankoff, K. D., Kjeldsen, K. K., Bjørk, A. A., Box, J. E., Simonsen, S. B., Sørensen, L. S., Khan, S. A., Solgaard, A. M., Forsberg, R., Skourup, H., Stenseng, L., Kristensen, S. S., Hvidegaard, S. M., Citterio, M., Karlsson, N., Fettweis, X., Ahlstrøm, A. P., Andersen, S. B., van As, D., and Fausto, R. S.: Greenland ice sheet mass balance assessed by PROMICE (1995–2015), Geolog. Surv. Denmark Greenland B., 43, e2019430201-01–e2019430201-06, 2019.
Cook, A. J. and Vaughan, D. G.: Overview of areal changes of the ice shelves on the Antarctic Peninsula over the past 50 years, The Cryosphere, 4, 77–98, https://doi.org/10.5194/tc-4-77-2010, 2010.
Csatho, B. M., Schenk, A. F., van der Veen, C. J., Babonis, G., Duncan, K., Rezvanbehbahani, S., van den Broeke, M. R., Simonsen, S. B., Nagarajan, S., and van Angelen, J. H.: Laser altimetry reveals complex pattern of Greenland Ice Sheet dynamics, P. Natl. Acad. Sci. USA, 111, 18478–18424, 2014.
de Boer, B., Stocchi, P., Whitehouse, P. L., and van de Wal, R. S. W.: Current state and future perspectives on coupled ice-sheet – sea-level modelling, Quaternary Sci. Rev., 169, 13–28, https://doi.org/10.1016/j.quascirev.2017.05.013, 2017.
Edwards, T. L., Nowicki, S., Marzeion, B., Hock, R., Goelzer, H., Seroussi, H., Jourdain, N. C., Slater, D. A., Turner, F. E., Smith, C. J., McKenna, C. M., Simon, E., Abe-Ouchi, A., Gregory, J. M., Larour, E., Lipscomb, W. H., Payne, A. J., Shepherd, A., Agosta, C., Alexander, P., Albrecht, T., Anderson, B., Asay-Davis, X., Aschwanden, A., Barthel, A., Bliss, A., Calov, R., Chambers, C., Champollion, N., Choi, Y., Cullather, R., Cuzzone, J., Dumas, C., Felikson, D., Fettweis, X., Fujita, K., Galton-Fenzi, B. K., Gladstone, R., Golledge, N. R., Greve, R., Hattermann, T., Hoffman, M. J., Humbert, A., Huss, M., Huybrechts, P., Immerzeel, W., Kleiner, T., Kraaijenbrink, P., Le Clec'h, S., Lee, V., Leguy, G. R., Little, C. M., Lowry, D. P., Malles, J.-H., Martin, D. F., Maussion, F., Morlighem, M., O'Neill, J. F., Nias, I., Pattyn, F., Pelle, T., Price, S. F., Quiquet, A., Radić, V., Reese, R., Rounce, D. R., Rückamp, M., Sakai, A., Shafer, C., Schlegel, N.-J., Shannon, S., Smith, R. S., Straneo, F., Sun, S., Tarasov, L., Trusel, L. D., Van Breedam, J., van de Wal, R., van den Broeke, M., Winkelmann, R., Zekollari, H., Zhao, C., Zhang, T., and Zwinger, T.: Projected land ice contributions to twenty-first-century sea level rise, Nature, 593, 74–82, https://doi.org/10.1038/s41586-021-03302-y, 2021.
Enderlin, E. M., Howat, I. M., Jeong, S., Noh, M. J., Angelen, J. H., and Broeke, M. R.: An improved mass budget for the Greenland ice sheet, Geophys. Res. Lett., 41, 866–872, https://doi.org/10.1002/2013GL059010, 2014.
Felikson, D., Urban, T. J., Gunter, B. C., Pie, N., Pritchard, H. D., Harpold, R., and Schutz, B. E.: Comparison of Elevation Change Detection Methods From ICESat Altimetry Over the Greenland Ice Sheet, IEEE T. Geosci. Remote, 55, 5494–5505, 2017.
Fettweis, X., Franco, B., Tedesco, M., van Angelen, J. H., Lenaerts, J. T. M., van den Broeke, M. R., and Gallée, H.: Estimating the Greenland ice sheet surface mass balance contribution to future sea level rise using the regional atmospheric climate model MAR, The Cryosphere, 7, 469–489, https://doi.org/10.5194/tc-7-469-2013, 2013.
Fettweis, X., Hofer, S., Krebs-Kanzow, U., Amory, C., Aoki, T., Berends, C. J., Born, A., Box, J. E., Delhasse, A., Fujita, K., Gierz, P., Goelzer, H., Hanna, E., Hashimoto, A., Huybrechts, P., Kapsch, M.-L., King, M. D., Kittel, C., Lang, C., Langen, P. L., Lenaerts, J. T. M., Liston, G. E., Lohmann, G., Mernild, S. H., Mikolajewicz, U., Modali, K., Mottram, R. H., Niwano, M., Noël, B., Ryan, J. C., Smith, A., Streffing, J., Tedesco, M., van de Berg, W. J., van den Broeke, M., van de Wal, R. S. W., van Kampenhout, L., Wilton, D., Wouters, B., Ziemen, F., and Zolles, T.: GrSMBMIP: intercomparison of the modelled 1980–2012 surface mass balance over the Greenland Ice Sheet, The Cryosphere, 14, 3935–3958, https://doi.org/10.5194/tc-14-3935-2020, 2020.
Foresta, L., Gourmelen, N., Pálsson, F., Nienow, P., Björnsson, H., and Shepherd, A.: Surface elevation change and mass balance of Icelandic ice caps derived from swath mode CryoSat-2 altimetry, Geophys. Res. Lett., 43, 138–145, https://doi.org/10.1002/2016GL071485, 2016.
Forsberg, R., Sørensen, L., and Simonsen, S.: Greenland and Antarctica Ice Sheet Mass Changes and Effects on Global Sea Level, Surv. Geophys., 38, 89–104, 2017.
Fox-Kemper, B., Hewitt, H. T., Xiao, C., Aðalgeirsdóttir, G., Drijfhout, S. S., Edwards, T. L., Golledge, N. R., Hemer, M., Kopp, R. E., Krinner, G., Mix, A., Notz, D., Nowicki, S., Nurhati, I. S., Ruiz, L., Sallée, J.-B., Slangen, A. B. A., and Yu, Y.: Ocean, Cryosphere and Sea Level Change. In Climate Change 2021: The Physical Science Basis. Contribution of Working Group I to the Sixth Assessment Report of the Intergovernmental Panel on Climate Change, edited by: Masson-Delmotte, V., Zhai, P., Pirani, A., Connors, S. L., Péan, C., Berger, S., Caud, N., Chen, Y., Goldfarb, L., Gomis, M. I., Huang, M., Leitzell, K., Lonnoy, E., Matthews, J. B. R., Maycock, T. K., Waterfield, T., Yelekçi, O., Yu, R., and Zhou, B., Cambridge University Press, Cambridge, United Kingdom and New York, NY, USA, 1211–1362, https://doi.org/10.1017/9781009157896.011, 2021.
Gardner, A. S., Moholdt, G., Scambos, T., Fahnstock, M., Ligtenberg, S., van den Broeke, M., and Nilsson, J.: Increased West Antarctic and unchanged East Antarctic ice discharge over the last 7 years, The Cryosphere, 12, 521–547, https://doi.org/10.5194/tc-12-521-2018, 2018.
Gourmelen, N., Escorihuela, M. J., Shepherd, A., Foresta, L., Muir, A., Garcia-Mondéjar, A., Roca, M., Baker, S. G., and Drinkwater, M. R. L.: CryoSat-2 swath interferometric altimetry for mapping ice elevation and elevation change, Adv. Space Res., 62, 1226–1242, https://doi.org/10.1016/j.asr.2017.11.014, 2018.
Groh, A. and Horwath, M.: Antarctic Ice Mass Change Products from GRACE/GRACE-FO Using Tailored Sensitivity Kernels, Remote Sens., 13, 1736, https://doi.org/10.3390/rs13091736, 2021.
Gunter, B. C., Didova, O., Riva, R. E. M., Ligtenberg, S. R. M., Lenaerts, J. T. M., King, M. A., van den Broeke, M. R., and Urban, T.: Empirical estimation of present-day Antarctic glacial isostatic adjustment and ice mass change, The Cryosphere, 8, 743–760, https://doi.org/10.5194/tc-8-743-2014, 2014.
Hanna, E., Cappelen, J., Fettweis, X., Mernild, S. H., Mote, T. L., Mottram, R., Steffen, K., Ballinger, T. J., and Hall, R. J.: Greenland surface air temperature changes from 1981 to 2019 and implications for ice-sheet melt and mass-balance change, Int. J. Climatol., 41, E1336–E1352, https://doi.org/10.1002/joc.6771, 2021.
Hanson, S., Nicholls, R., Ranger, N., Hallegatte, S., Corfee-Morlot, J., Herweijer, C., and Chateau, J.: A global ranking of port cities with high exposure to climate extremes, Clim. Change, 104, 89–111, https://doi.org/10.1007/s10584-010-9977-4, 2011.
Harig, C. and Simons, F. J.: Mapping Greenland's mass loss in space and time, P. Natl. Acad. Sci. USA, 109, 19934–19937, 2012.
Helm, V., Humbert, A., and Miller, H.: Elevation and elevation change of Greenland and Antarctica derived from CryoSat-2, The Cryosphere, 8, 1539–1559, https://doi.org/10.5194/tc-8-1539-2014, 2014.
Hofer, S., Tedstone, A. J., Fettweis, X., and Bamber, J. L.: Decreasing cloud cover drives the recent mass loss on the Greenland Ice Sheet, Science, 3, e1700584–e1700584, https://doi.org/10.1126/sciadv.1700584, 2017.
Hogg, A. E., Shepherd, A., Cornford, S. L., Briggs, K. H., Gourmelen, N., Graham, J. A., Joughin, I., Mouginot, J., Nagler, T., Payne, A. J., Rignot, E., and Wuite, J.: Increased ice flow in Western Palmer Land linked to ocean melting, Geophys. Res. Lett., 44, 4159–4167, https://doi.org/10.1002/2016GL072110, 2017.
Horvath, A. G.: Retrieving Geophysical Signals from Current and Future Satellite Missions, PhD thesis, Tech. Univ. Munich, 2017.
Hugonnet, R., McNabb, R., Berthier, E., Menounos, B., Nuth, C., Girod, L., Farinotti, D., Huss, M., Dussaillant, I., Brun, F., and Kääb, A.: Accelerated global glacier mass loss in the early twenty-first century – Dataset, Theia [data set], https://doi.org/10.6096/13, 2021a.
Hugonnet, R., McNabb, R., Berthier, E., Menounos, B., Nuth, C., Girod, L., Farinotti, D., Huss, M., Dussaillant, I., Brun, F., and Kääb, A.: Accelerated global glacier mass loss in the early twenty-first century, Nature, 592, 726–731, https://doi.org/10.1038/s41586-021-03436-z, 2021b.
IMBIE Team: Mass balance of the Antarctic Ice Sheet from 1992 to 2017, Nature, 558, 219–222, https://doi.org/10.1038/s41586-018-0179-y, 2018.
IMBIE Team: Mass balance of the Greenland Ice Sheet from 1992 to 2018, Nature, 579, 233–239, https://doi.org/10.1038/s41586-019-1855-2, 2020.
IMBIE Team: Antarctic and Greenland Ice Sheet mass balance 1992–2020 for IPCC AR6 (Version 1.0), UK Polar Data Centre, Natural Environment Research Council, UK Research & Innovation [data set], https://doi.org/10.5285/77B64C55-7166-4A06-9DEF-2E400398E452, 2021.
Ivins, E. and James, T.: Antarctic glacial isostatic adjustment: A new assessment, Antarct. Sci., 17, 541–553, https://doi.org/10.1017/S0954102005002968, 2005.
Ivins, E. R., James, T. S., Wahr, J., Schrama, E. J. O., Landerer, F. W., and Simon, K. M.: Antarctic contribution to sea-level rise observed by GRACE with improved GIA correction, J. Geophys. Res.-Sol. Ea., 118, 3126–3141, https://doi.org/10.1002/jgrb.50208, 2013.
Jakob, L., Gourmelen, N., Ewart, M., and Plummer, S.: Spatially and temporally resolved ice loss in High Mountain Asia and the Gulf of Alaska observed by CryoSat-2 swath altimetry between 2010 and 2019, The Cryosphere, 15, 1845–1862, https://doi.org/10.5194/tc-15-1845-2021, 2021.
Jenkins, A., Shoosmith, D., Dutrieux, P., Jacobs, S., Kim, T. W., Lee, S. H., Ha, H. K., and Stammerjohn, S.: West Antarctic Ice Sheet retreat in the Amundsen Sea driven by decadal oceanic variability, Nat. Geosci., 11, 733–738, https://doi.org/10.1038/s41561-018-0207-4, 2018.
Joughin, I., Shapero, D., Smith, B., Dutrieux, P., and Barham, M.: Ice-shelf retreat drives recent Pine Island Glacier speedup, Science, 7, eabg3080, https://doi.org/10.1126/sciadv.abg3080, 2021.
Khan, S. A., Kjær, K. H., Bevis, M., Bamber, J. L., Wahr, J., Kjeldsen, K. K., Bjørk, A. A., Korsgaard, N. J., Stearns, L. A., van den Broeke, M. R., Liu, L., Larsen, N. K., and Muresan, I. S.: Sustained mass loss of the northeast Greenland ice sheet triggered by regional warming, Nat. Clim. Change, 4, 292–299, 2014.
Khan, S. A., Sasgen, I., Bevis, M., Dam, T. V., Bamber, J. L., Wahr, J., Willis, M., Kjær, K. H., Wouters, B., Helm, V., Csatho, B., Fleming, K. Bjørk,, A. A., Aschwanden, A., Knudsen, P., and Munneke, P. K.: Geodetic measurements reveal similarities between post-Last Glacial Maximum and present-day mass loss from the Greenland ice sheet, Sci. Adv., 2, e1600931, https://doi.org/10.1126/sciadv.1600931, 2016.
Khan, S. A., Colgan, W., Neumann, T. A., van den Broeke, M. R., Brunt, K. M., Noël, B., Bamber, J. L., Hassan, J., and Bjørk, A. A.: Accelerating Ice Loss From Peripheral Glaciers in North Greenland, Geophys. Res. Lett., 49, e2022GL098915, https://doi.org/10.1029/2022GL098915, 2022.
King, M. D., Howat, I. M., Jeong, S., Noh, M. J., Wouters, B., Noël, B., and van den Broeke, M. R.: Seasonal to decadal variability in ice discharge from the Greenland Ice Sheet, The Cryosphere, 12, 3813–3825, https://doi.org/10.5194/tc-12-3813-2018, 2018.
King, M. D., Howat, I. M., Candela, S. G., Noh, M. J., Jeong, S., Noël, B. P. Y., van den Broeke, M. R., Wouters, B., and Negrete, A.: Dynamic ice loss from the Greenland Ice Sheet driven by sustained glacier retreat, Commun. Earth Environ., 1, 1–7, https://doi.org/10.1038/s43247-020-0001-2, 2020.
Konrad, H., Gilbert, L., Cornford, S. L., Payne, A., Hogg, A., Muir, A., and Shepherd, A.: Uneven onset and pace of ice-dynamical imbalance in the Amundsen Sea Embayment, West Antarctica, Geophys. Res. Lett., 44, 910–918, https://doi.org/10.1002/2016GL070733, 2017.
Konrad, H., Shepherd, A., Gilbert, L., Hogg, A. E., McMillan, M., Muir, A., and Slater, T.: Net retreat of Antarctic glacier grounding lines, Nat. Geosci., 11, 258–262, https://doi.org/10.1038/s41561-018-0082-z, 2018.
Kulp, S. A. and Strauss, B. H.: New elevation data triple estimates of global vulnerability to sea-level rise and coastal flooding, Nat. Commun., 10, 1–12, https://doi.org/10.1038/s41467-019-12808-z, 2019.
Leeson, A. A., Shepherd, A., Briggs, K., Howat, I., Fettweis, X., Morlighem, M., and Rignot, E.: Supraglacial lakes on the Greenland ice sheet advance inland under warming climate, Nat. Clim. Change, 5, 51–55, https://doi.org/10.1038/nclimate2463, 2015.
Lemos, A., Shepherd, A., McMillan, M., and Hogg, A. E.: Seasonal Variations in the Flow of Land-Terminating Glaciers in Central-West Greenland Using Sentinel-1 Imagery, Remote Sens., 10, 1878, https://doi.org/10.3390/rs10121878, 2018.
Luthcke, S. B., Zwally, H. J., Abdalati, W., Rowlands, D. D., Ray, R. D., Nerem, R. S., Lemoine, F. G., McCarthy, J. J., and Chinn, D. S.: Recent Greenland Ice Mass Loss by Drainage System from Satellite Gravity Observations, Science, 314, 1286–1289, https://doi.org/10.1126/science.1130776, 2006.
Luthcke, S. B., Sabaka, T. J., Loomis, B. D., Arendt, A. A., McCarthy, J. J., and Camp, J.: Antarctica, Greenland and Gulf of Alaska land-ice evolution from an iterated GRACE global mascon solution, J. Glaciol., 59, 613–631, 2013.
Mankoff, K. D., Fettweis, X., Langen, P. L., Stendel, M., Kjeldsen, K. K., Karlsson, N. B., Noël, B., van den Broeke, M. R., Solgaard, A., Colgan, W., Box, J. E., Simonsen, S. B., King, M. D., Ahlstrøm, A. P., Andersen, S. B., and Fausto, R. S.: Greenland ice sheet mass balance from 1840 through next week, Earth Syst. Sci. Data, 13, 5001–5025, https://doi.org/10.5194/essd-13-5001-2021, 2021.
Martín-Español, A., King, M. A., Zammit-Mangion, A., Andrews, S. B., Moore, P., and Bamber, J. L.: An assessment of forward and inverse GIA solutions for Antarctica, J. Geophys. Res.-Sol. Ea., 121, 6947–6965, https://doi.org/10.1002/2016JB013154, 2016.
McMillan, M., Leeson, A., Shepherd, A., Briggs, K., Armitage, T. W. K., Hogg, A., Kuipers Munneke, P., van den Broeke, M., Noël, B., van de Berg, W. J., Ligtenberg, S., Horwath, M., Groh, A., Muir, A., and Gilbert, L.: A high-resolution record of Greenland mass balance, Geophys. Res. Lett., 43, 7002–7010, 2016.
Milillo, P., Rignot, E., Rizzoli, P., Scheuchl, B., Mouginot, J., Bueso-Bello, J. L., Prats-Iraola, P., and Dini, L.: Rapid glacier retreat rates observed in West Antarctica, Nat. Geosci., 15, 48–53, https://doi.org/10.1038/s41561-021-00877-z, 2022.
Moon, T., Joughin, I., Smith, B., and Howat, I.: 21st-Century Evolution of Greenland Outlet Glacier Velocities, Science, 336, 576–578, https://doi.org/10.1126/science.1219985, 2012.
Morlighem, M., Williams, C. N., Rignot, E., An, L., Arndt, J. E., Bamber, J. L., Catania, G., Chauché, N., Dowdeswell, J. A., Dorschel, B., Fenty, I., Hogan, K., Howat, I., Hubbard, A., Jakobsson, M., Jordan, T. M., Kjeldsen, K. K., Millan, R., Mayer, L., Mouginot, J., Noël, B. P. Y., O'Cofaigh, C., Palmer, S., Rysgaard, S., Seroussi, H., Siegert, M. J., Slabon, P., Straneo, F., van den Broeke, M. R., Weinrebe, W., Wood, M., and Zinglersen, K. B.: BedMachine v3: Complete Bed Topography and Ocean Bathymetry Mapping of Greenland From Multibeam Echo Sounding Combined With Mass Conservation, Geophys. Res. Lett., 44, 11051–11061, https://doi.org/10.1002/2017GL074954, 2017.
Mottram, R., Hansen, N., Kittel, C., van Wessem, J. M., Agosta, C., Amory, C., Boberg, F., van de Berg, W. J., Fettweis, X., Gossart, A., van Lipzig, N. P. M., van Meijgaard, E., Orr, A., Phillips, T., Webster, S., Simonsen, S. B., and Souverijns, N.: What is the surface mass balance of Antarctica? An intercomparison of regional climate model estimates, The Cryosphere, 15, 3751–3784, https://doi.org/10.5194/tc-15-3751-2021, 2021.
Mouginot, J., Rignot, E., and Scheuchl, B.: Sustained increase in ice discharge from the Amundsen Sea Embayment, West Antarctica, from 1973 to 2013, Geophys. Res. Lett., 41, 1576–1584, https://doi.org/10.1002/2013GL059069, 2014.
Mouginot, J., Rignot, E., Scheuchl, B., and Millan, R.: Comprehensive Annual Ice Sheet Velocity Mapping Using Landsat-8, Sentinel-1, and RADARSAT-2 Data, Remote Sens., 9, 364, https://doi.org/10.3390/rs9040364, 2017.
Mouginot, J., Rignot, E., Bjørk, A. A., van den Broeke, M., Millan, R., Morlighem, M., Noël, B., Scheuchl, B., and Wood, M.: Forty-six years of Greenland Ice Sheet mass balance from 1972 to 2018, P. Natl. Acad. Sci. USA, 116, 9239–9244, https://doi.org/10.1073/pnas.1904242116, 2019.
Nias, I. J., Cornford, S. L., Edwards, T. L., Gourmelen, N., and Payne, A. J.: Assessing Uncertainty in the Dynamical Ice Response to Ocean Warming in the Amundsen Sea Embayment, West Antarctica, Geophys. Res. Lett., 46, 11253–11260, https://doi.org/10.1029/2019GL084941, 2019.
Nilsson, J., Gardner, A., Sandberg Sørensen, L., and Forsberg, R.: Improved retrieval of land ice topography from CryoSat-2 data and its impact for volume-change estimation of the Greenland Ice Sheet, The Cryosphere, 10, 2953–2969, https://doi.org/10.5194/tc-10-2953-2016, 2016.
Otosaka, I. N., Shephard, A., Ivins, E. R., Schlegel, N.-J., Amory, C., van den Broeke, M. R., Horwath, M., Joughin, I., King, M. D., Krinner, G., Nowicki, S., Payne, A. J., Rignot, E., Scambos, T., Simon, K. M., Smith, B. E., Sørensen, L. S., Velicogna, I., Whitehouse, P. L., A, G., Agosta, C., Ahlstrøm, A. P., Blazquez, A., Colgan, W., Engdhal, M. E., Fettweis, X., Forsberg, R., Gallée, H., Gardner, A., Gilbert, L., Gourmelen, N., Groh, A., Gunter, B. C., Harig, C., Helm, V., Khan, S. A., Kittel, C., Konrad, H., Langen, P. L., Lecavalier, B. S., Liang, C.-C., Loomis, B. D., McMillan, M., Melini, D., Mernild, S. H., Mottram, R., Mouginot, J., Nilsson, J., Noël, B., Pattle, M. E., Peltier, W. R., Pie, N., Sasgen, I., Save, H. V., Seo, K.-W., Scheuchl, B., Schrama, E. J. O., Schröder, L., Simonsen, S. B., Slater, T., Spada, G., Sutterley, T. C., Vishwakarma, B. D., van Wessem, M., Wiese, D., van der Wal, W., and Wouters, B.: IMBIE software v3.0 (v3.0), Zenodo [code], https://doi.org/10.5281/zenodo.7342481, 2022.
Paolo, F. S., Fricker, H. A., and Padman, L.: Volume loss from Antarctic ice shelves is accelerating, Science, 348, 327–331, https://doi.org/10.1126/science.aaa0940, 2015.
Pattyn, F. and Morlighem, M.: The uncertain future of the Antarctic Ice Sheet, Science, 367, 1331–1335, https://doi.org/10.1126/science.aaz5487, 2020.
Paulson, A., Zhong, S., and Wahr, J.: Inference of mantle viscosity from GRACE and relative sea level data, Geophys. J. Int., 171, 497–508, https://doi.org/10.1111/j.1365-246X.2007.03556.x, 2007.
Peltier, W. R.: Global Glacial Isostasy And The Surface Of The Ice-Age Earth: The ICE-5G (VM2) Model and GRACE, Annu. Rev. Earth Planet. Sci., 32, 111–149, 2004.
Peltier, W. R., Argus, D. F., and Drummond, R.: Space geodesy constrains ice age terminal deglaciation: The global ICE-6G_C (VM5a) model, J. Geophys. Res.-Sol. Ea., 120, 450–487, 2015.
Pfeffer, W. T., Arendt, A. A., Bliss, A., Bolch, T., Cogley, J. G., Gardner, A. S., Hagen, J.-O., Hock, R., Kaser, G., Kienholz, C., Miles, E. S., Moholdt, G., Mölg, N., Paul, F., Radić, V., Rastner, P., Raup, B. H., Rich, J., and Sharp, M. J.: The Randolph Glacier Inventory: a globally complete inventory of glaciers, J. Glaciol., 60, 537–552, https://doi.org/10.3189/2014JoG13J176, 2014.
Pritchard, H. D., Arthern, R. J., Vaughan, D. G., and Edwards, L. A.: Extensive dynamic thinning on the margins of the Greenland and Antarctic ice sheets, Nature, 461, 971–975, https://doi.org/10.1038/nature08471, 2009.
Rignot, E. and Kanagaratnam, P.: Changes in the Velocity Structure of the Greenland Ice Sheet, Science, 311, 986–990, https://doi.org/10.1126/science.1121381, 2006.
Rignot, E., Casassa, G., Gogineni, P., Krabill, W., Rivera, A., and Thomas, R.: Accelerated ice discharge from the Antarctic Peninsula following the collapse of Larsen B ice shelf, Geophys. Res. Lett., 31, L18401, https://doi.org/10.1029/2004GL020697, 2004.
Rignot, E., Mouginot, J., and Scheuchl, B.: Antarctic grounding line mapping from differential satellite radar interferometry, Geophys. Res. Lett., 38, L10504, https://doi.org/10.1029/2011GL047109, 2011a.
Rignot, E., Velicogna, I., van den Broeke, M. R., Monaghan, A., and Lenaerts, J. T. M.: Acceleration of the contribution of the Greenland and Antarctic ice sheets to sea level rise, Geophys. Res. Lett., 38, L05503, https://doi.org/10.1029/2011GL046583, 2011b.
Rignot, E., Mouginot, J., Scheuchl, B., van den Broeke, M., van Wessem, M. J., and Morlighem, M.: Four decades of Antarctic Ice Sheet mass balance from 1979–2017, P. Natl. Acad. Sci. USA, 116, 1095–1103, https://doi.org/10.1073/pnas.1812883116, 2019.
Ritz, C., Edwards, T. L., Durand, G., Payne, A. J., Peyaud, V., and Hindmarsh, R. C. A.: Potential sea-level rise from Antarctic ice-sheet instability constrained by observations, Nature, 528, 115–118, https://doi.org/10.1038/nature16147, 2015.
Riva, R. E. M., Gunter, B. C., Urban, T. J., Vermeersen, B. L. A., Lindenbergh, R. C., Helsen, M. M., Bamber, J. L., van de Wal, R. S. W., van den Broeke, M. R., and Schutz, B. E.: Glacial Isostatic Adjustment over Antarctica from combined ICESat and GRACE satellite data, Earth Planet. Sc. Let., 288, 516–523, https://doi.org/10.1016/j.epsl.2009.10.013, 2009.
Sandberg Sørensen, L., Simonsen, S. B., Forsberg, R., Khvorostovsky, K., Meister, R., and Engdahl, M. E.: 25 years of elevation changes of the Greenland Ice Sheet from ERS, Envisat, and CryoSat-2 radar altimetry, Earth Planet. Sc. Lett., 495, 234–241, https://doi.org/10.1016/j.epsl.2018.05.015, 2018.
Sasgen, I., Wouters, B., Gardner, A. S., King, M. D., Tedesco, M., Landerer, F. W., Dahle, C., Save, H., and Fettweis, X.: Return to rapid ice loss in Greenland and record loss in 2019 detected by the GRACE-FO satellites, Commun. Earth Environ., 1, 1–8, https://doi.org/10.1038/s43247-020-0010-1, 2020.
Save, H., Bettadpur, S., and Tapley, B. D.: High-resolution CSR GRACE RL05 mascons, J. Geophys. Res.-Sol. Ea., 121, 7547–7569, 2016.
Schrama, E. J. O., Wouters, B., and Rietbroek, R.: A mascon approach to assess ice sheet and glacier mass balances and their uncertainties from GRACE data, J. Geophys. Res.-Sol. Ea., 119, 6048–6066, 2014.
Schröder, L., Horwath, M., Dietrich, R., Helm, V., van den Broeke, M. R., and Ligtenberg, S. R. M.: Four decades of Antarctic surface elevation changes from multi-mission satellite altimetry, The Cryosphere, 13, 427–449, https://doi.org/10.5194/tc-13-427-2019, 2019.
Selley, H. L., Hogg, A. E., Cornford, S., Dutrieux, P., Shepherd, A., Wuite, J., Floricioiu, D., Kusk, A., Nagler, T., Gilbert, L., Slater, T., and Kim, T.-W.: Widespread increase in dynamic imbalance in the Getz region of Antarctica from 1994 to 2018, Nat. Commun., 12, 1133, https://doi.org/10.1038/s41467-021-21321-1, 2021.
Seo, K. W., Wilson, C. R., Scambos, T., Kim, B. M., Waliser, D. E., Tian, B., Kim, B. H., and Eom, J.: Surface mass balance contributions to acceleration of Antarctic ice mass loss during 2003–2013, J. Geophys. Res.-Sol. Ea., 120, 3617–3627, 2015.
Shepherd, A. and Nowicki, S.: Improvements in ice-sheet sea-level projections, Nat. Clim. Change, 7, 672–674, https://doi.org/10.1038/nclimate3400, 2017.
Shepherd, A., Ivins, E. R., A, G., Barletta, V. R., Bentley, M. J., Bettadpur, S., Briggs, K. H., Bromwich, D. H., Forsberg, R., Galin, N., Horwath, M., Jacobs, S., Joughin, I., King, M. A., Jan, T. M. L., Li, J., Stefan, R. M. L., Luckman, A., Luthcke, S. B., McMillan, M., Meister, R., Milne, G., Mouginot, J., Muir, A., Nicolas, J. P., Paden, J., Payne, A. J., Pritchard, H., Rignot, E., Rott, H., Sørensen, L. S., Scambos, T. A., Scheuchl, B., Ernst, J. O. S., Smith, B., Sundal, A. V., Jan, H. v. A., Willem, J. V. D. B., Michiel, R. V. D. B., Vaughan, D. G., Velicogna, I., Wahr, J., Whitehouse, P. L., Wingham, D. J., Yi, D., Young, D., and Zwally, H. J.: A Reconciled Estimate of Ice-Sheet Mass Balance, Science, 338, 1183–1189, https://doi.org/10.1126/science.1228102, 2012.
Shepherd, A., Gilbert, L., Muir, A. S., Konrad, H., McMillan, M., Slater, T., Briggs, K. H., Sundal, A. V., Hogg, A. E., and Engdahl, M. E.: Trends in Antarctic Ice Sheet Elevation and Mass, Geophys. Res. Lett., 46, 8174–8183, https://doi.org/10.1029/2019GL082182, 2019.
Simpson, M. J. R., Milne, G. A., Huybrechts, P., and Long, A. J.: Calibrating a glaciological model of the Greenland ice sheet from the last glacial maximum to present-day using field observations of relative sea level and ice extent, Quaternary Sci. Rev., 28, 1631–1657, 2009.
Slater, T., Hogg, A. E., and Mottram, R.: Ice-sheet losses track high-end sea-level rise projections, Nat. Clim. Change, 10, 879–881, https://doi.org/10.1038/s41558-020-0893-y, 2020.
Slater, T., Shepherd, A., McMillan, M., Leeson, A., Gilbert, L., Muir, A., Munneke, P. K., Noël, B., Fettweis, X., van den Broeke, M., and Briggs, K.: Increased variability in Greenland Ice Sheet runoff from satellite observations, Nat. Commun., 12, 6069, https://doi.org/10.1038/s41467-021-26229-4, 2021.
Small, D., Bentley, M. J., Jones, R. S., Pittard, M. L., and Whitehouse, P. L.: Antarctic ice sheet palaeo-thinning rates from vertical transects of cosmogenic exposure ages, Quaternary Sci. Rev., 206, 65–80, https://doi.org/10.1016/j.quascirev.2018.12.024, 2019.
Smith, B., Fricker, H. A., Gardner, A. S., Medley, B., Nilsson, J., Paolo, F. S., Holschuh, N., Adusumilli, S., Brunt, K., Csatho, B., Harbeck, K., Markus, T., Neumann, T., Siegfried, M. R., and Zwally, H. J.: Pervasive ice sheet mass loss reflects competing ocean and atmosphere processes, Science, 368, 1239–1242, https://doi.org/10.1126/science.aaz5845, 2020.
Sørensen, L. S., Simonsen, S. B., Nielsen, K., Lucas-Picher, P., Spada, G., Adalgeirsdottir, G., Forsberg, R., and Hvidberg, C. S.: Mass balance of the Greenland ice sheet (2003–2008) from ICESat data – the impact of interpolation, sampling and firn density, The Cryosphere, 5, 173–186, https://doi.org/10.5194/tc-5-173-2011, 2011.
Stevens, C. M., Verjans, V., Lundin, J. M. D., Kahle, E. C., Horlings, A. N., Horlings, B. I., and Waddington, E. D.: The Community Firn Model (CFM) v1.0, Geosci. Model Dev., 13, 4355–4377, https://doi.org/10.5194/gmd-13-4355-2020, 2020.
Straneo, F. and Heimbach, P.: North Atlantic warming and the retreat of Greenland's outlet glaciers, Nature, 504, 36–43, https://doi.org/10.1038/nature12854, 2013.
Sutterley, T. C., Velicogna, I., Csatho, B., van den Broeke, M., Rezvan-Behbahani, S., and Babonis, G.: Evaluating Greenland glacial isostatic adjustment corrections using GRACE, altimetry and surface mass balance data, Environ. Res. Lett., 9, 014004, https://doi.org/10.1088/1748-9326/9/1/014004, 2014a.
Sutterley, T. C., Velicogna, I., Rignot, E., Mouginot, J., Flament, T., van den Broeke, M. R., van Wessem, J. M., and Reijmer, C. H.: Mass loss of the Amundsen Sea Embayment of West Antarctica from four independent techniques, Geophys. Res. Lett., 41, 8421–8428, https://doi.org/10.1002/2014GL061940, 2014b.
Tapley, B. D., Watkins, M. M., Flechtner, F., Reigber, C., Bettadpur, S., Rodell, M., Sasgen, I., Famiglietti, J. S., Landerer, F. W., Chambers, D. P., Reager, J. T., Gardner, A. S., Save, H., Ivins, E. R., Swenson, S. C., Boening, C., Dahle, C., Wiese, D. N., Dobslaw, H., Tamisiea, M. E., and Velicogna, I.: Contributions of GRACE to understanding climate change, Nat. Clim. Change, 5, 358–369, https://doi.org/10.1038/s41558-019-0456-2, 2019.
Tedesco, M. and Fettweis, X.: Unprecedented atmospheric conditions (1948–2019) drive the 2019 exceptional melting season over the Greenland ice sheet, The Cryosphere, 14, 1209–1223, https://doi.org/10.5194/tc-14-1209-2020, 2020.
Trusel, L. D., Das, S. B., Osman, M. B., Evans, M. J., Smith, B. E., Fettweis, X., McConnell, J. R., Noël, B. P. Y., and Broeke, M. R. van den: Nonlinear rise in Greenland runoff in response to post-industrial Arctic warming, Nature, 564, 104–108, https://doi.org/10.1038/s41586-018-0752-4, 2018.
Van Wessem, J. M., Reijmer, C. H., Morlighem, M., Mouginot, J., Rignot, E., Medley, B., Joughin, I., Wouters, B., Depoorter, M. A., Bamber, J. L., Lenaerts, J. T. M., Van De Berg, W. J., Van Den Broeke, M. R., and Van Meijgaard, E.: Improved representation of East Antarctic surface mass balance in a regional atmospheric climate model, J. Glaciol., 60, 761–770, 2014.
Velicogna, I. and Wahr, J.: Measurements of time-variable gravity show mass loss in Antarctica, Science, 311, 1754–1756, https://doi.org/10.1126/science.1123785, 2006.
Velicogna, I., Sutterley, T. C., and van den Broeke, M. R.: Regional acceleration in ice mass loss from Greenland and Antarctica using GRACE time-variable gravity data, Geophys. Res. Lett., 41, 8130–8137, 2014.
Velicogna, I., Mohajerani, Y., Geruo, A., Landerer, F., Mouginot, J., Noel, B., Rignot, E., Sutterley, T., van den Broeke, M., van Wessem, J. M., and Wiese, D.: Continuity of ice sheet mass loss in Greenland and Antarctica from the GRACE and GRACE Follow-Onmissions, Geophys. Res. Lett., 47, e2020GL087291, https://doi.org/10.1029/2020gl087291, 2020.
Vishwakarma, B. D., Horwath, M., Devaraju, B., Groh, A., and Sneeuw, N.: A Data-Driven Approach for Repairing the Hydrological Catchment Signal Damage Due to Filtering of GRACE Products, Water Resour. Res., 53, 9824–9844, 2017.
Vishwakarma, B. D., Ziegler, Y., Bamber, J. L., and Royston, S.: Separating GIA signal from surface mass change using GPS and GRACE data, Geophys. J. Int., 232, 537–547, https://doi.org/10.1093/gji/ggac336, 2022.
Vitousek, S., Barnard, P. L., Fletcher, C. H., Frazer, N., Erikson, L., and Storlazzi, C. D.: Doubling of coastal flooding frequency within decades due to sea-level rise, Sci. Rep., 7, 1–9, https://doi.org/10.1038/s41598-017-01362-7, 2017.
Wang, L., Davis, J. L., and Howat, I. M.: Complex Patterns of Antarctic Ice Sheet Mass Change Resolved by Time-Dependent Rate Modeling of GRACE and GRACE Follow-On Observations, Geophys. Res. Lett., 48, e2020GL090961, https://doi.org/10.1029/2020GL090961, 2021.
WCRP Global Sea Level Budget Group: Global sea-level budget 1993–present, Earth Syst. Sci. Data, 10, 1551–1590, https://doi.org/10.5194/essd-10-1551-2018, 2018.
Whitehouse, P. L.: Glacial isostatic adjustment modelling: historical perspectives, recent advances, and future directions, Earth Surf. Dynam., 6, 401–429, https://doi.org/10.5194/esurf-6-401-2018, 2018.
Whitehouse, P. L., Bentley, M. J., Milne, G. A., King, M. A., and Thomas, I. D.: A new glacial isostatic adjustment model for Antarctica: calibrated and tested using observations of relative sea-level change and present-day uplift rates, Geophys. J. Int., 190, 1464–1482, https://doi.org/10.1111/j.1365-246X.2012.05557.x, 2012.
Wiese, D. N., Landerer, F. W., and Watkins, M. M.: Quantifying and reducing leakage errors in the JPL RL05M GRACE mascon solution, Water Resour. Res., 52, 7490–7502, 2016.
Wingham, D. J., Ridout, A. J., Scharroo, R., Arthern, R. J., and Shum, C. K.: Antarctic Elevation Change from 1992 to 1996, Science, 282, 456–458, https://doi.org/10.1126/science.282.5388.456, 1998.
Wouters, B., Bamber, J. L., van den Broeke, M. R., Lenaerts, J. T. M., and Sasgen, I.: Limits in detecting acceleration of ice sheet mass loss due to climate variability, Nat. Geosci., 6, 613–616, 2013.
Zwally, H. J., Giovinetto, M. B., Beckley, M. A., and Saba, J. L.: Antarctic and Greenland Drainage Systems, GSFC Cryospheric Sciences Laboratory, https://earth.gsfc.nasa.gov/cryo/data/polar-altimetry/antarctic-and-greenland-drainage-systems (last access: 15 January 2020), 2012.
Zwally, H. J., Li, J., Robbins, J. W., Saba, J. L., Yi, D., and Brenner, A. C.: Mass gains of the Antarctic ice sheet exceed losses, J. Glaciol., 61, 1019–1036, 2015.