the Creative Commons Attribution 4.0 License.
the Creative Commons Attribution 4.0 License.
 | 05 Apr 2023
Regional data sets of high-resolution (1 and 6 km) irrigation estimates from space
Luca Brocca
Sara Modanesi
Christian Massari
Angelica Tarpanelli
Silvia Barbetta
Raphael Quast
Mariette Vreugdenhil
Vahid Freeman
Anaïs Barella-Ortiz
Pere Quintana-Seguí
David Bretreger
Espen Volden
Irrigation water use represents the primary source of freshwater consumption by humans. The amount of water withdrawals for agricultural purposes is expected to further increase in the upcoming years to face the rising world population and higher living standards. Hence, effective plans for enacting a rational management of agricultural water use are urgent, but they are limited by knowledge gaps about irrigation. Detailed information on irrigation dynamics (i.e., extents, timing, and amounts) is generally lacking worldwide, but satellite observations can be used to fill this gap.
This paper describes the first regional-scale and high-resolution (1 and 6 km) irrigation water data sets obtained from satellite observations. The products are developed over three major river basins characterized by varying irrigation extents and methodologies, as well as by different climatic conditions. The data sets are an outcome of the European Space Agency (ESA) Irrigation+ project. The irrigation amounts have been estimated through the SM-based (soil-moisture-based) inversion approach over the Ebro river basin (northeastern Spain), the Po valley (northern Italy), and the Murray–Darling basin (southeastern Australia). The satellite-derived irrigation products referring to the case studies in Europe have a spatial resolution of 1 km, and they are retrieved by exploiting Sentinel-1 soil moisture data obtained through the RT1 (first-order Radiative Transfer) model. A spatial sampling of 6 km is instead used for the Australian pilot area, since in this case the soil moisture information comes from CYGNSS (Cyclone Global Navigation Satellite System) observations. All the irrigation products are delivered with a weekly temporal aggregation. The 1 km data sets over the two European regions cover a period ranging from January 2016 to July 2020, while the irrigation estimates over the Murray–Darling basin are available for the time span April 2017–July 2020. The retrieved irrigation amounts have been compared with benchmark rates collected over selected agricultural districts. Results highlight satisfactory performances over the major part of the pilot sites falling within the two regions characterized by a semiarid climate, namely, the Ebro and the Murray–Darling basins, quantified by median values of RMSE, Pearson correlation r, and bias equal to 12.4 mm/14 d, 0.66, and −4.62 mm/14 d, respectively, for the Ebro basin and to 10.54 mm/month, 0.77, and −3.07 mm/month, respectively, for the Murray–Darling basin. The assessment of the performances over the Po valley is affected by the limited availability of in situ reference data for irrigation. The developed products are made available to the scientific community for use and further validation at https://doi.org/10.5281/zenodo.7341284 (Dari et al., 2022a).
- Article
(5590 KB) - Full-text XML
- BibTeX
- EndNote


Human activities are deeply modifying the natural hydrological cycle, as they affect water storage and relocation dynamics. Among the anthropogenic water uses, the agricultural one (mainly constituted of water applied for irrigation) prevails. More than 70 % of surface and subsurface water withdrawals worldwide are destined for irrigation practices (Foley et al., 2011; Dorigo et al., 2021). In the near future, the pressure exerted on water resources to foster irrigation is expected to be further exacerbated to face the global challenge represented by the increasing food demand due to the population growth under climate warming scenarios (Hunter et al., 2017; Ferguson et al., 2018). Hence, strategies aimed at a rational management of agricultural water are essential for several environmental, economic, and social reasons, as well as to comprehensively characterize the hydrological cycle over anthropogenic basins. Nevertheless, irrigation practices are scarcely monitored worldwide, thus creating the paradoxical situation for which the largest human intervention on the water cycle is mostly unknown.
Remote sensing technology offers unprecedented opportunities for answering the following research question: how much water is used for irrigation? More specifically, remotely sensed observations of soil moisture and evapotranspiration are particularly suitable for the development of irrigation quantification techniques, as demonstrated by a number of recent studies implementing evapotranspiration-based (see, for example, Romaguera et al., 2014; Van Eekelen et al., 2015; Peña-Arancibia et al., 2016; Brombacher et al., 2022) and soil-moisture-based (see, for example, Brocca et al., 2018; Jalilvand et al., 2019; Zaussinger et al., 2019; Dari et al., 2020, 2022c; Zappa et al., 2021; Zhang et al., 2022) approaches. Brocca et al. (2018) first proposed an irrigation quantification methodology relying on the inversion of the satellite soil moisture signal, currently known as the SM-based (soil-moisture-based) inversion approach. The feasibility of estimating irrigation rates through coarse-resolution soil moisture data from AMSR2 (Advanced Microwave Scanning Radiometer 2), ASCAT (Advanced SCATterometer), SMAP (Soil Moisture Active Passive), and SMOS (Soil Moisture and Ocean Salinity) was demonstrated, even though limitations due to the low spatial resolution of the input data sets were pointed out. Later on, the methodology was implemented by Jalilvand et al. (2019) over a semiarid region of Iran by exploiting AMSR2, ASCAT, and SMOS soil moisture data. In this study, the non-negligible contribution of evapotranspiration in properly reproducing irrigation amounts was highlighted. This result was corroborated by Dari et al. (2020), who further developed the method by implementing the guidelines provided by the FAO (Food and Agriculture Organization) paper 56 (Allen et al., 1998) within the SM-based inversion algorithm to develop a finer modeling of crop evapotranspiration. The approach was successfully applied over heavily irrigated areas located in northeastern Spain. In that case, input soil moisture data from the 1 km resolution DISPATCH (DISaggregation based on Physical And Theoretical scale CHange; Merlin et al., 2013) downscaled SMOS and SMAP products were used. Dari et al. (2022c) further studied the role of the evapotranspiration component within the SM-based inversion algorithm and introduced the interesting perspective of a configuration forced with remotely sensed data only. The SM-based inversion approach is not the only method relying on soil moisture data to estimate irrigation existing in literature. Another example is represented by the SM-delta (soil-moisture-delta) algorithm, first proposed by Zaussinger et al. (2019). The approach is based on the discrepancies between satellite and modeled soil moisture, which, over agricultural areas, can be attributed to irrigation signals. The method was later updated by Zappa et al. (2021), who added terms accounting for evapotranspiration and drainage fluxes to the algorithm. This new configuration was applied over agricultural fields in northern Germany; high-resolution (500 m) soil moisture observations from Sentinel-1 were used, and an agreement between estimated irrigation amounts and benchmark rates quantified by an average Pearson correlation equal to 0.64 was found. The SM-delta was recently applied in synthetic and real-world experiments to highlight the mutual effects of varying satellite soil moisture temporal and spatial resolutions on the accuracy of the retrieved irrigation amounts (Zappa et al., 2022). Finally, data assimilation (DA) techniques exploiting remote sensing soil moisture can also be used in irrigation quantification studies to balance modeling deficiencies and correct unrealistic assumptions. Indeed, models have recently seen improvements in irrigation parameterization (Ozdogan et. al., 2010; Lawston et al., 2015; Nie et al., 2018). However, some studies (e.g., Modanesi et al., 2021b) have highlighted that the performance of LSM (land surface model) irrigation simulations are negatively affected by simplified assumptions in model parameterizations, as well as by unrealistic/out-of-date input information (e.g., lack of dynamic crop maps). DA can reduce models' uncertainties by merging model systems with satellite observations, which can track human-induced processes. In particular, Lawston et al. (2017) suggested the use of SMAP surface soil moisture retrievals to incorporate the irrigation signal into models via DA, and more recently Jalilvand et al. (2021) exploited the potential of SMAP/Sentinel-1 retrievals (Das et al., 2019) for the same purpose. In this context, Abolafia-Rosenzweig et al. (2019) designed a particle batch smoother DA system for remote-sensing-based soil moisture assimilation into the VIC (Variable Infiltration Capacity) model (Liang et al., 1994) to estimate irrigation amounts. An alternative way to assimilate satellite observations is to directly ingest level-1 observations (i.e., brightness temperature or radar backscatter) instead of retrievals (De Lannoy and Reichle, 2016a, b; Lievens et al., 2017a, b; Modanesi et al., 2022). In particular, Modanesi et al. (2022) assimilated 1 km Sentinel-1 backscatter (γ0) observations into the Noah-MP LSM, equipped with a sprinkler irrigation scheme into the National Aeronautics and Space Administration (NASA) Land Information System (LIS) framework for the update of both surface soil moisture and vegetation states. The authors found that DA improves the bias of irrigation simulation although limitations mainly due to irrigation model parameterization still need further improvement.
The high-resolution observations of the most recent satellite technologies open unprecedented perspectives in the irrigation quantification activity. As pointed out in Peng et al. (2021), the optimal spatial resolution for monitoring agricultural practices is less than or equal to 1 km. This is particularly true in the Mediterranean area, where the nominal size of the agricultural fields makes the adoption of high-resolution data necessary (Dari et al., 2022b).
This study is aimed at presenting three regional-scale, high-resolution irrigation data sets developed through the SM-based inversion approach within the European Space Agency (ESA) Irrigation+ project (https://esairrigationplus.org/, last access: 3 April 2023). The irrigation products have been developed for two European regions, namely, the Ebro basin (Spain) and the Po valley (Italy), as well as for the Murray–Darling basin (Australia). Both data sets referring to the Mediterranean area rely on input soil moisture from the RT1 (first-order Radiative Transfer) Sentinel-1 data set (Quast et al., 2019), are delivered over a 1 km regular grid, and cover the period ranging from January 2016 to the end of July 2020. For the Australian sites, Spire's soil moisture product retrieved from NASA's CYGNSS (Cyclone Global Navigation Satellite System) satellite data (Freeman et al., 2020) has been used instead; irrigation estimates are sampled over a 6 km regular grid, and the temporal coverage is from April 2017 to July 2020. All the products are delivered with a weekly temporal aggregation. Even though an assessment of the product's performances is provided by exploiting benchmark irrigation amounts over selected sites, the authors' main goal is to make the data sets publicly available as they can be used and further validated by the scientific community. The proposed irrigation estimates represent an important step towards the implementation of an operational system for high-resolution irrigation water monitoring from satellite observations.
The irrigation products have been developed over three regions highly influenced by irrigation practices. They are the Ebro river basin (∼ 86 000 km2) in Spain; the Po valley (∼ 78 000 km2) in Italy, which includes the Po river basin and part of the Emilia-Romagna region; and the Murray–Darling basin (∼ 1 000 000 km2) in Australia. According to the Köppen–Geiger climate classification (Beck et al., 2018) provided in Fig. 1, the Ebro basin is mainly characterized by a cold semiarid climate (BSk), but in its upper part there are also areas with oceanic climate (Cfb). The Po river valley mainly falls within the humid subtropical climatic zone (Cfa), while the Murray–Darling basin is mainly subject to hot and cold semiarid climatic areas (BSh and BSk, respectively); desert climate (BWh) is also present for a minor extent.
The Ebro basin is the largest Mediterranean basin of Spain and a major Mediterranean basin in Europe. Precipitation is unevenly distributed, being higher in the mountainous regions, where it can reach 1800 mm yr−1, and lower in the central valley, with values below 500 mm yr−1. Therefore, to irrigate agricultural areas, mainly located in the central valley, there is an extensive network of dams and canals to transport water from the mountains to these regions. For instance, the total dam capacity is approximately 8000 hm3 (PHE1 2015–2021). Focusing on agriculture, the most representative herbaceous crops are alfalfa, corn, barley, wheat, and rice, while the most widespread tree crops are peach and pear trees, vineyards, and olive groves. In order to satisfy the average agricultural annual demand, quantified as 7623 hm3 yr−1, an area of almost 9660 km2 is conceded for irrigated surface over the basin.
The Po valley is part of the Po river basin, the longest river in Italy. It is a critical hotspot for studying the impact of human activities on the water cycle, considering the key role of the agricultural production and the increasing frequency of severe drought events over this area (Strosser et al., 2012; Ceppi et al., 2014; Formetta et al., 2022). The northern side of the valley has a higher water availability compared to the southern side, thanks to the presence of several Alpine reservoirs (Musolino et al., 2017). In the south, the Emilia Romagna region is poorer in storage capacity, but it is served by one of the most important Italian hydraulic systems for irrigation applications, the Canale Emiliano Romagnolo (CER, https://consorziocer.it/it/, last access: 1 December 2022). The size and spatial extent of the irrigated fields and districts in the Po valley are often not homogeneous, and agricultural plots are characterized by small extents due to complex historical processes (Massari et al., 2021). The main cultivated crops include general summer and winter crops, orchards, olive groves, and vineyards (https://sites.google.com/arpae.it/servizio-climatico-icolt/home?authuser=0, last access: 1 December 2022).
The Murray–Darling basin is often considered the food bowl of Australia, covering over 1 000 000 km2 or approximately 14 % of Australia and accounts for over two-thirds of all of Australia's irrigation water use. There has been a cap on diversions since 1995 to help manage over allocation and extraction in the basin. The basin is often subject to extreme droughts such as the Millennium Drought (2001–2009) (van Dijk et al., 2013) and more recently the 2017–2019 drought. There is typically more irrigation in the southern side of the basin, which is facilitated by major storage capacities in the region. Irrigated properties are often fragmented in nature and contain a wide range of crops that are suited to the vastly different conditions that are observed across such a large basin. Both surface water and groundwater are used across the basin with groundwater use mainly associated with major alluvial systems.
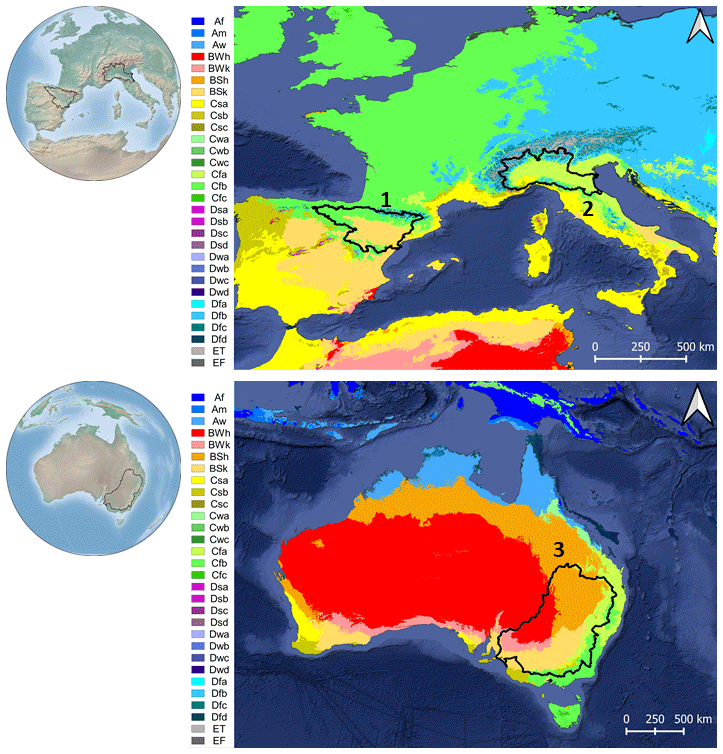
Figure 1Location of the pilot areas and their climatic characteristics according to the Köppen–Geiger classification. The Ebro basin and the Po valley are indicated by the numbers 1 and 2, respectively. The Murray–Darling basin is identified by the number 3. The predominant classes on the pilot areas are cold semiarid climate (BSk) and oceanic climate (Cfb) for the Ebro basin, humid subtropical climate (Cfa) for the Po valley, and hot and cold semiarid climates (BSh and BSk, respectively), as well as desert climate (BWh), for the Murray–Darling basin.
3.1 The SM-based inversion approach
Regional-scale irrigation products have been developed through the SM-based inversion approach (Brocca et al., 2018; Dari et al., 2020, 2022c). The method relies on the inversion of the soil moisture signal for backward estimating the total amount of water entering into the soil, which, over agricultural areas, is determined by rainfall plus irrigation. The approach is based on the soil water balance, expressed by
where Z∗ [mm] indicates the water capacity of the soil layer – calculated as the product between the depth of the soil layer and the porosity, S(t) [–] is the relative soil moisture (i.e., ranging between 0 and 1), t [d] indicates the time, i(t) is the irrigation rate [mm d−1], r(t) [mm d−1] is the rainfall rate, g(t) [mm d−1] indicates the drainage term, sr(t) [mm d−1] is the surface runoff, and e(t) [mm d−1] represents the evapotranspiration rate. Equation (1) is equivalent to the following:
with Win(t) indicating the algorithm output, i.e., the total amount of water entering into the soil. The drainage term can be linked to soil moisture according to the power-law equation g(t)= aS(t)b, in which a and b are drainage parameters (Famiglietti and Woods, 1994; Brocca et al., 2014). As demonstrated in previous studies, the sr(t) term can be neglected (Brocca et al., 2015; Jalilvand et al., 2019), since irrigation water either infiltrates or evaporates. The actual evapotranspiration term is computed as the potential rate, PET(t), limited by the available water content: ; an adjustment factor, F, ranging between 0.6 and 1.4 and aimed at accounting for uncertainties linked to the coarse resolution of the input PET rates is adopted (Modanesi et al., 2021a). Hence, Eq. (2) can be simplified as
Before running the algorithm, the noise in the soil moisture signal is reduced by computing the Soil Water Index (SWI) according to the exponential filter proposed by Albergel et al. (2008). Once the total amount of water entering into the soil is quantified, it is possible to obtain the irrigation rate by removing the rainfall from the output of Eq. (3), ; negative irrigation rates (if any) are set to zero (Jalilvand et al., 2019). In order to remove negligible irrigation amounts attributable to random errors, the results are discarded if the ratio between weekly estimated irrigation and weekly rainfall is lower than 0.2. Weekly irrigation estimates covering the time span from January 2016 to July 2020 have been produced for the Ebro basin and the Po river valley. Over the Murray–Darling basin, weekly irrigation amounts have been retrieved by considering the period from April 2017 to July 2020. A regular 1 km grid has been adopted for the Spanish and the Italian case study, while a 6 km sampling has been used for the Australian pilot basin. For each region, the irrigation amounts have been estimated over agricultural areas only. For the Ebro and Po regions, such information has been derived by the 25 m resolution Corine Land Cover data set referring to the year 2018 (CLC2018), while for the Murray–Darling basin the 300 m spatial resolution ESA CCI (Climate Change Initiative) land cover map for the year 2018 has been exploited.
The parameters a, b, Z∗, and F of Eq. (3) are calibrated by implementing the iterative procedure summarized in Fig. 2. First, the algorithm is run by masking out days with no rainfall rate during the irrigation seasons (hence, potential irrigation days). This first step involves the calibration of a, b, and Z∗ parameters that are optimized by minimizing the root-mean-square difference (RMSD) against reference rainfall rates. During this phase, implemented for each pixel, the evapotranspiration adjustment factor, F, is assumed equal to 1. Then, F is calibrated against the sum of rainfall plus irrigation over selected pilot sites where irrigation rates are known. At this point, the calibrated F value is compared with the first guess (F=1), and, in case of disagreement, the values of a, b, and Z∗ are recalibrated by repeating the first step and adopting the updated F value. In this way, the effects of adopting for rainfed agricultural areas the same F value calibrated where irrigation occurs are compensated. It is important to highlight that the calibration of a, b, and Z∗ is spatially distributed; hence, such values differ pixel by pixel. Conversely, the calibration of F can be only implemented over selected sites where irrigation rates are known and for this reason spatially aggregated time series must be used. The period 2016–2017 has been considered for the calibration procedure over the Ebro basin and the Po valley, while for the Murray–Darling catchment the time span ranging from April 2017 to the end of 2018 has been adopted. The F parameter has been calibrated over three districts in the Ebro basin, both pilot districts in the Po river valley, and three districts in the Murray–Darling basin. For each region, the areal-weighted average of the F values has been then adopted for estimating irrigation (as a fixed parameter for all the pixels). For more details on the outputs of the calibration procedure and on the irrigation data used to calibrate the F parameter, the reader is referred to Appendix A and Sect. 3.3, respectively.
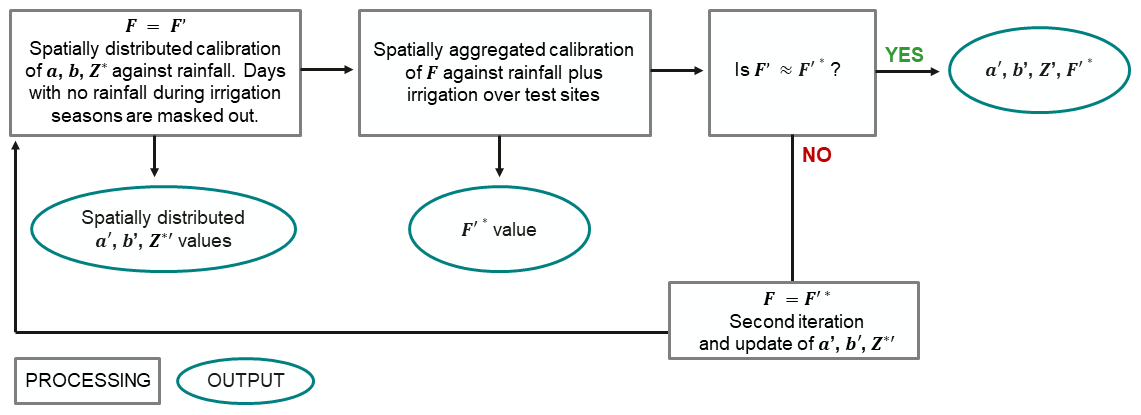
Figure 2Iterative procedure adopted to calibrate the SM-based inversion algorithm parameters , and F.
3.2 Input data sets
Input time series of soil moisture, potential evapotranspiration (PET), and rainfall are needed to run the SM-based inversion approach. For the Ebro and Po regions, the irrigation products rely on 1 km soil moisture data derived by Sentinel-1 observations. More specifically, soil moisture is obtained from incidence-angle-dependent Sentinel-1 backscatter measurements at 500 m spatial sampling (∼ 1 km spatial resolution) (Bauer-Marschallinger et al., 2019) by using a time-series-based first-order Radiative Transfer modeling approach (RT1) (Quast et al., 2019). The scattering characteristics of soil and vegetation are hereby modeled via parametric distribution functions. The retrieval is then performed via a nonlinear least-squares regression procedure that minimizes the difference between the measured and modeled backscatter time series for each pixel individually (Quast, 2021). To account for spatial variations in the soil-scattering characteristics, a temporally constant soil-scattering directionality parameter is optimized. To correct for effects induced by seasonal dynamics of vegetation, auxiliary leaf area index (LAI) time series provided by the ECMWF (European Centre for Medium-Range Weather Forecasts) ERA5-Land (European ReAnalysis v5-Land) reanalysis data set (Muñoz-Sabater et al., 2021) are used as proxy for the seasonal dynamics of the vegetation optical depth. In addition, the single-scattering albedo of the vegetation layer is optimized for each Sentinel-1 orbit individually to account for differences in the observation geometry between consecutive timestamps. The soil moisture time series is finally obtained by implying a linear relationship to the normalization factor of the bare-soil scattering distribution function. The resulting soil moisture data set therefore represents a percentage measure of the relative moisture saturation of the soil surface.
The irrigation product developed over the Murray–Darling basin relies on CYGNSS observations. The GNSS-R (GNSS reflectometry) remote sensing is a relatively new technique based on a bistatic radar system that is used to perform Earth surface scatterometry. The applications of the GNSS-R technique have been demonstrated in several studies using the data from recent spaceborne missions, such as TechDemoSat-1, CYGNSS, and Spire's GNSS-R satellites.2 The CYGNSS satellite constellation consists of eight GNSS-R satellites launched in December 2016 into a 35∘ inclination low Earth orbit. Each satellite carries a four-channel GNSS-R bistatic radar receiver tuned to receive the L1 signals transmitted by GPS (Global Positioning System) satellites (Ruf et al., 2017). The Spire soil moisture retrieval algorithm is based on a change detection method (Freeman et al., 2020). GNSS-R reflectivity measurements over land vary depending on soil water content, surface roughness, and vegetation. The vegetation and roughness changes occur on timescales longer than soil moisture changes, which makes it possible to monitor soil moisture in the presence of vegetation and surface roughness contributions. For a given geographic location, the surface roughness can be viewed as almost constant. Seasonal changes in vegetation can still affect reflection but on a much longer timescale than changes in soil moisture. Short-term fluctuations in reflectivity (dB scale) are roughly linearly related to changes in soil moisture. A relative measure of reflectivity that corresponds to variations in soil moisture levels can be calculated by scaling the normalized reflectivity between the lowest and highest reflectivity measurements (dry and wet references in each location) that correspond in each case on the vegetation wilting point and the degree of soil saturation. The obtained relative soil moisture measurements were calibrated using the concurrent SM measurements from NASA's SMAP mission. In this study, Spire's CYGNSS-based SM product retrieved from GNSS-R observations on a 6 km equidistant grid in the Murray–Darling basin has been used.
Finally, PET rates from the GLEAM (Global Land Evaporation Amsterdam Model) v3.5b product at 0.25∘ spatial resolution (Miralles et al., 2011; Martens et al., 2017) have been used to force the algorithm, while rainfall rates have been derived by the ERA5-Land data set at 9 km spatial resolution.
All the data sets used have been resampled to the adopted regular grids (1 km for Ebro and Po basins, 6 km for Murray–Darling basin) as a preprocessing step.
3.3 Benchmark irrigation amounts
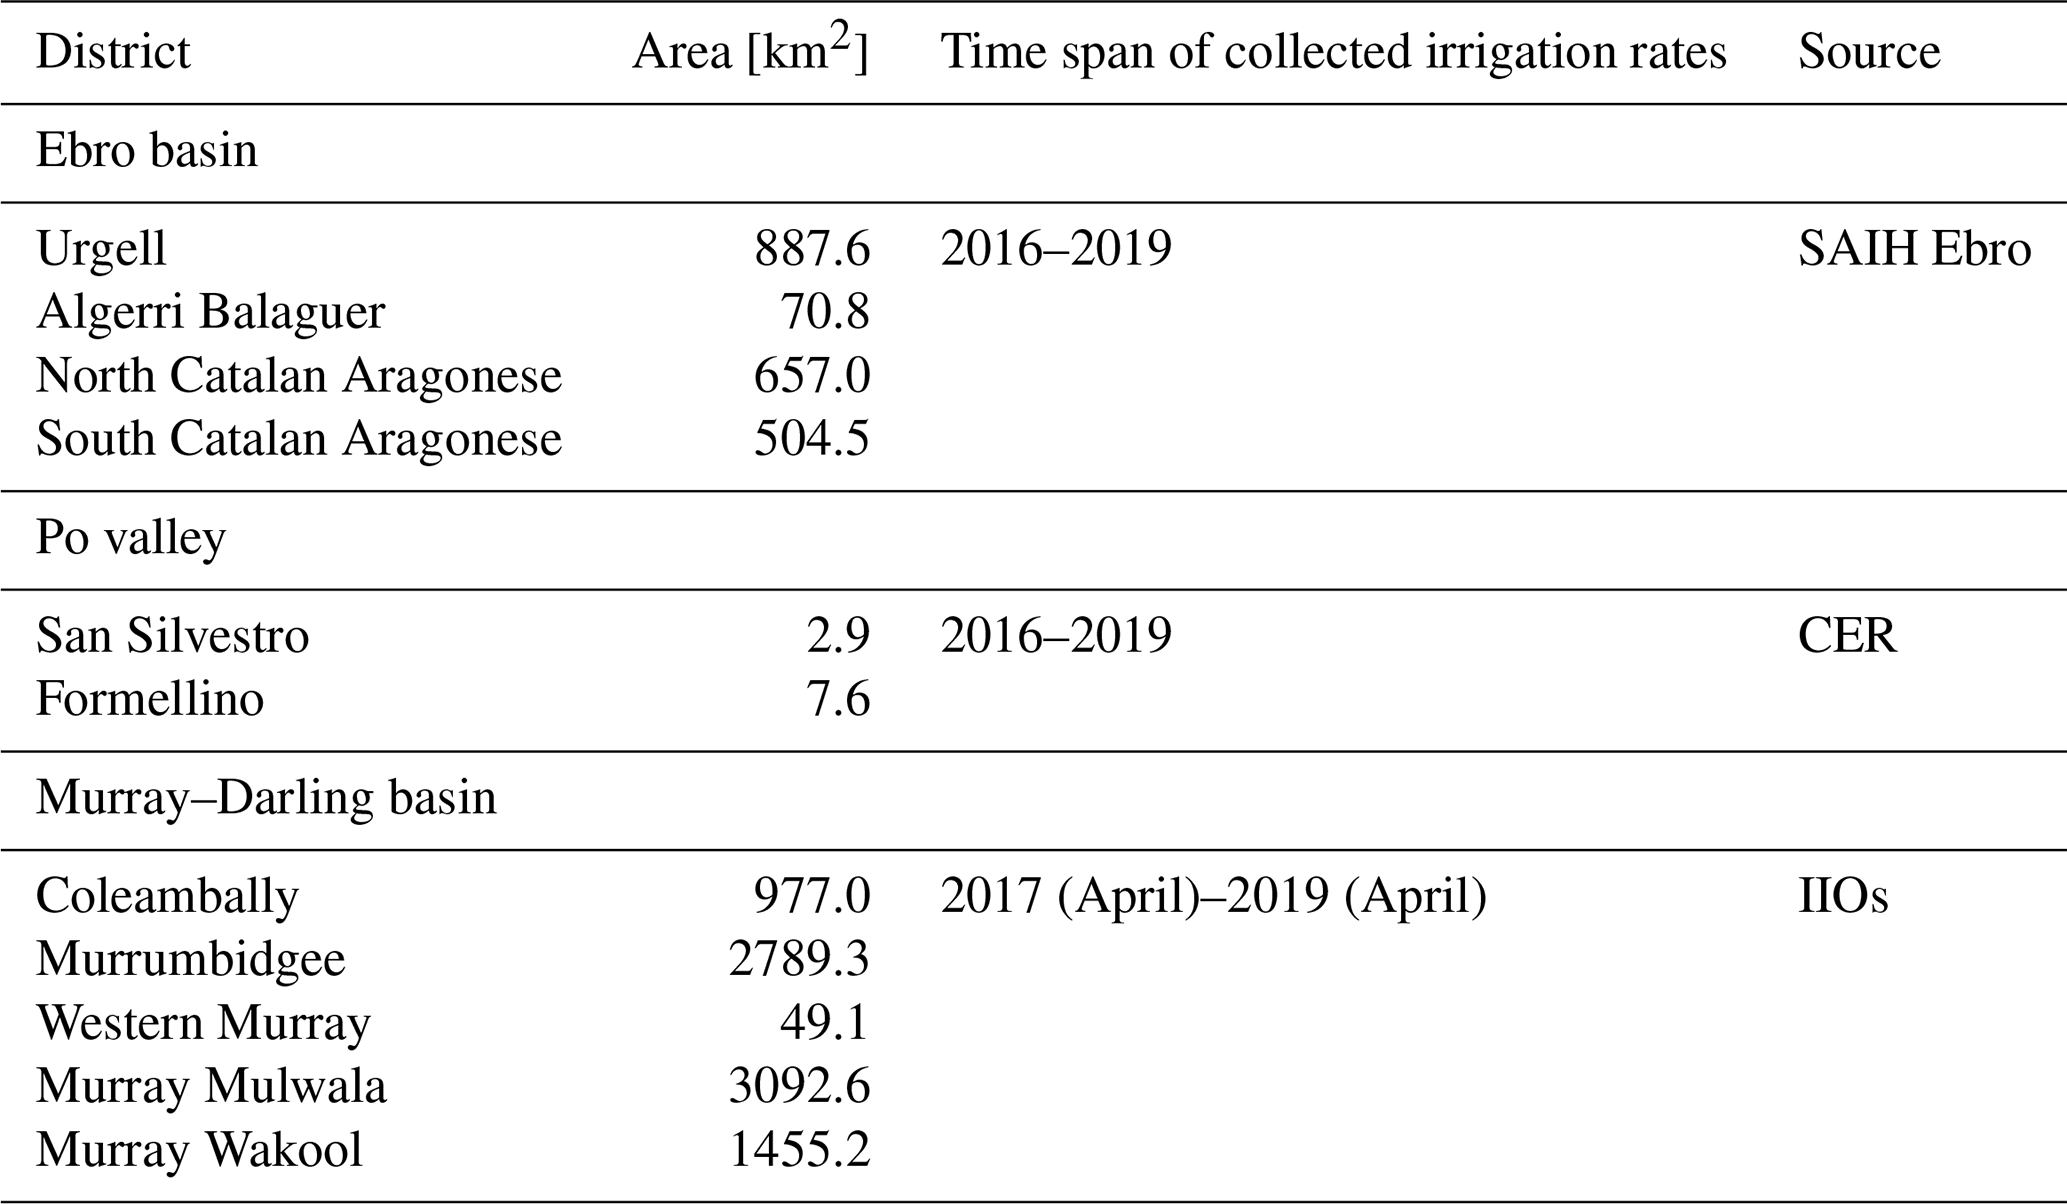
Benchmark irrigation rates over selected sites have been collected for calibration and validation purposes. Within the Ebro basin, four districts have been considered: Urgell (887.6 km2), Algerri Balaguer (70.8 km2), North Catalan and Aragonese (657.0 km2), and South Catalan and Aragonese (504.5 km2). The districts differ from each other in terms of irrigation techniques and management (Dari et al., 2021). The dense network of irrigation canals feeding the districts is monitored by the SAIH (Sistema Automático de Información Hidrológica, http://www.saihebro.com/saihebro/index.php, last access: 1 November 2022) system of the Ebro river basin, which provides data about water volumes flowing through the canals. Hence, this information has been collected at a daily temporal scale for the period 2016–2019. The Urgell district is fed by two canals, while the others receive water from one canal each. The irrigation depths in millimeters have been calculated by dividing the volumes by the areas of interest. Losses due to irrigation efficiency have been considered as described in Dari et al. (2020).
Two small districts have been considered for the Po valley: San Silvestro (2.9 km2) and Formellino (7.6 km2). They are located around the city of Faenza, in the Emilia Romagna region. For each pilot district, daily irrigation amounts (in mm) have been provided by the CER consortium for the period 2016–2019. The crops growing in the Faenza small districts are mainly pear and kiwi trees.
Data from five irrigation districts located in New South Wales have been collected for the Murray–Darling basin: Coleambally (977.0 km2), Murrumbidgee (2789.3 km2), Western Murray (49.1 km2), Murray Mulwala (3092.6 km2), and Murray Wakool (1455.2 km2). Each district is managed by an irrigation infrastructure operator (IIO), which is responsible for the production of annual reports on the irrigation water withdrawals (Bretreger et al., 2020). It is noteworthy that the Murray Mulwala and Murray Wakool districts belong to the same IIO. Monthly irrigation amounts referring to the period ranging from April 2017 to April 2019 have been considered. As in the case of the Ebro basin, the irrigation amounts in millimeters have been obtained by dividing the volumes provided in the IIO reports by the area of interest. It is noteworthy that minor portions of the Western Murray and of the Murrumbidgee districts fall outside the agricultural domain derived from the ESA CCI (Climate Change Initiative) land cover. Hence, for the abovementioned districts, the irrigation rates have been computed by considering the portion of area overlapped with the mask of agricultural pixels.
Figure 3 provides an overview on the location of all pilot irrigation districts with respect to the agricultural portions (white areas) over which the irrigation estimates have been produced. The ground-truth information on the collected irrigation rates is summarized in Table 1.
A part of the collected irrigation amounts has been used to calibrate the F parameter (see Sect. 3.1). More specifically, irrigation data referring to the Algerri Balaguer and to the North Catalan Aragonese and South Catalan Aragonese districts for the 2-year period 2016–2017 have been used to calibrate F over the Ebro basin. For the Po valley, the same temporal window has been considered (i.e., irrigation applications over both pilot districts during the time span 2016–2017 have been exploited). Finally, irrigation volumes for the period ranging from April 2017 to December 2018 and referring to the three districts, i.e., Coleambally, Murray Mulwala, and Murray Wakool, have been used for the Murray–Darling basin.
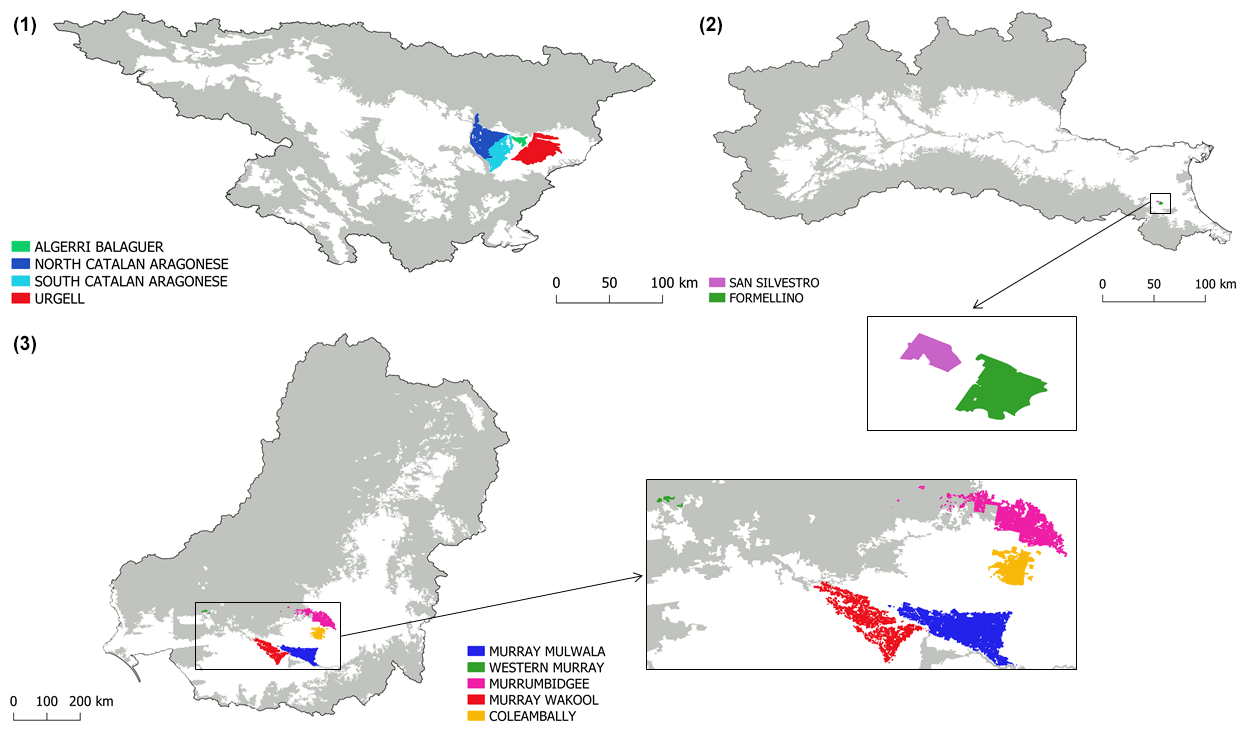
Figure 3Pilot irrigation districts whose irrigation data have been used for calibration and validation purposes: (1) the Ebro basin, (2) the Po valley, and (3) the Murray–Darling basin. For each region, the agricultural areas over which the irrigation estimates have been carried out are indicated in white.
Table 1Summary of the collected ground-truth irrigation rates.
In this section, the retrieved irrigation amounts over each pilot area are presented and discussed. Comparisons with reference irrigation rates are provided as well. Section 4.1 describes the irrigation product developed over the Ebro basin, Sect. 4.2 is dedicated to the Po valley, and Sect. 4.3 refers to the Murray–Darling basin. The retrieved irrigation estimates are compared against the benchmark amounts in terms of RMSE (root-mean-square error), Pearson correlation r, and bias. Limitations of the proposed data sets and future plans are discussed in Sect. 4.4 and 4.5, respectively.
4.1 Ebro basin, Spain
The data set of irrigation amounts retrieved through the SM-based inversion approach over the Ebro basin is developed over a 1 km regular grid and covers the period ranging from January 2016 to the end of July 2020. Figure 4 provides the maps of the cumulated irrigation estimates during the highest-intensity (May–September) irrigation seasons of 2016, 2017, 2018 and 2019. Some patterns of high irrigation rates recurring over areas known to be irrigated can be observed, as the pilot districts considered in this study (see Fig. 3), the narrow portion unfolding from west to east along the main reach of the Ebro in the middle of the basin, and the area close to the river delta.
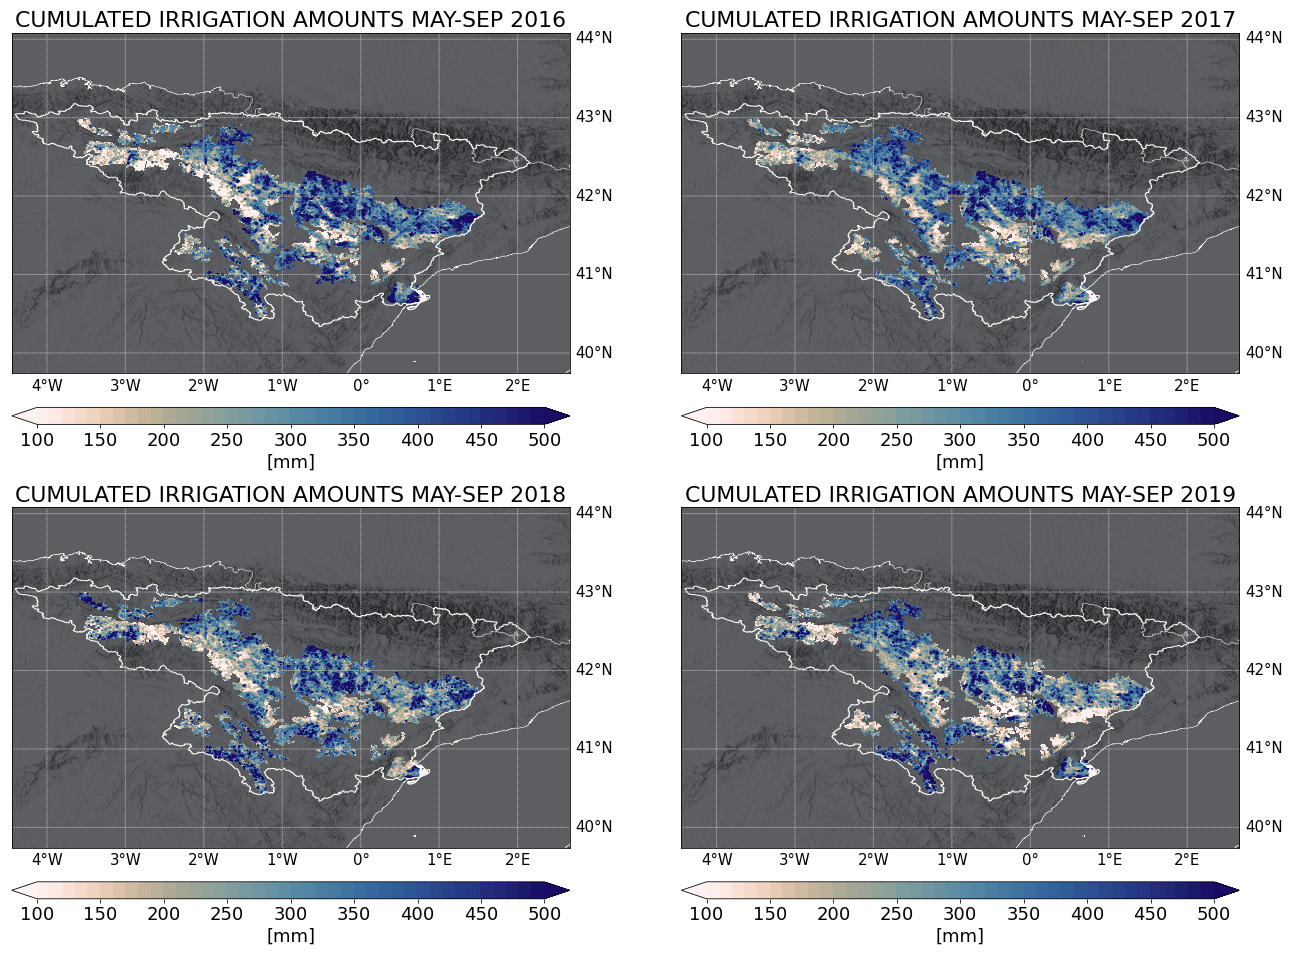
Figure 4Cumulated irrigation amounts over the Ebro basin (Spain) during the highest-intensity irrigation season (May–September) of 2016, 2017, 2018, and 2019.
Figure 5a–d show the 14 d aggregated time series of irrigation estimates (the black lines) over the pilot districts against the benchmark rates (the light grey shaded areas) for the period 2016–2019; a yearly comparison in which data referring to different districts and years is indicated by different markers and colors, respectively, is provided as well (panel e). It is noteworthy that 2016 is not considered for the Urgell district, as there is a lack of irrigation benchmarks for half of the year. The time series in panels (a)–(d) highlight that the best performances in terms of RMSE are obtained over the North Catalan and Aragonese district (RMSE = 10.08 mm/14 d), while the best results in terms of r and bias (denoted BIAS hereafter) are found for the Algerri Balaguer district (r=0.78 and BIAS = −2.23 mm/14 d). Even though a general tendency in slightly underestimating the benchmark amounts can be observed, the performances in terms of RMSE and BIAS are satisfactory, as the maximum deviation from previously mentioned minimum values is +4.58 mm/14 d for the RMSE and −6.59 mm/14 d for the BIAS; in both cases, the highest values of these two metrics refer to the Urgell district.
Along with the irrigation amounts, timing is also satisfactorily reproduced over the Algerri Balaguer (r=0.78) and the South Catalan and Aragonese (r=0.74) districts, while worst performances are observed over the remaining two districts. The results agree with previous experiments carried out over a portion of the Ebro basin enclosing the same pilot districts of this study and in which irrigation estimates were retrieved by using a combination of DISPATCH SMOS and SMAP soil moisture with evapotranspiration rates calculated through the FAO56 approach (Dari et al., 2020). Moreover, the current implementation of a soil-moisture-limited approach to compute the actual evapotranspiration brings benefits in reproducing irrigation amounts with respect to previous attempts in this regard (Dari et al., 2022c).
Panel (e) of Fig. 5 provides a long-term comparison, in which the results are yearly cumulated; each point indicates the performance of a district in a certain year. A confidence interval of ±30 % of the benchmark is shown as well; according to Massari et al. (2021), such a value matches with the upper limit of the accuracy of satellite-derived irrigation products desired by farmers. In 9 out of the 15 total cases, the relative error is lower than ±30 %. Seasonal values referring to the Algerri Balaguer and the North Catalan and Aragonese districts are outside the interval only for one out of the four considered years; underestimates lower than 30 % of the total are found over the Urgell and the South Catalan and Aragonese districts for the years 2017 and 2019.
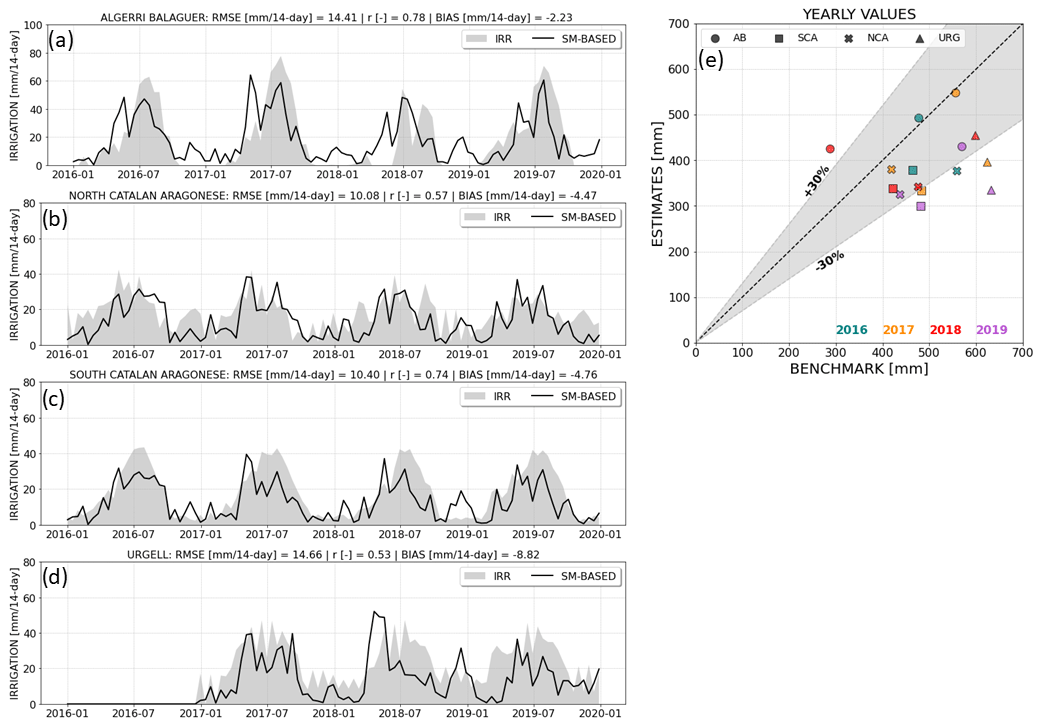
Figure 5(a–d) The 14 d aggregated time series of irrigation estimates (the black lines) over the four considered pilot districts within the Ebro basin against the benchmark rates (the light grey shaded areas). (e) Yearly comparison with data referring to different districts (AB: Algerri Balaguer, SCA: South Catalan Aragonese, NCA: North Catalan Aragonese, URG: Urgell) and years indicated through different markers and colors, respectively. The interval indicating a relative error of ±30 % is shown as well.
4.2 Po valley, Italy
Similarly to the Ebro case study, the satellite-derived irrigation data set over the Po valley is developed over a 1 km regular grid for the period ranging from January 2016 to the end of July 2020. The spatial distribution of the cumulated irrigation amounts during the highest-intensity irrigation seasons of 2016, 2017, 2018, and 2019 are provided in Fig. 6. As a difference with the Ebro case study, strong contrasts between areas with very low and very high irrigation rates are not detected here. The only exception is a portion with low irrigation amounts in the southeastern side that recurs in 2016, 2017, and 2019. This is an expected result, since while in the Ebro basin permanent rainfed and irrigated lands coexist, the Po valley landscape consists of almost evenly distributed agricultural fields. Nevertheless, crop rotation creates a complex mosaic of irrigated and non-irrigated fields at a spatial scale that can be lower than 1 km.
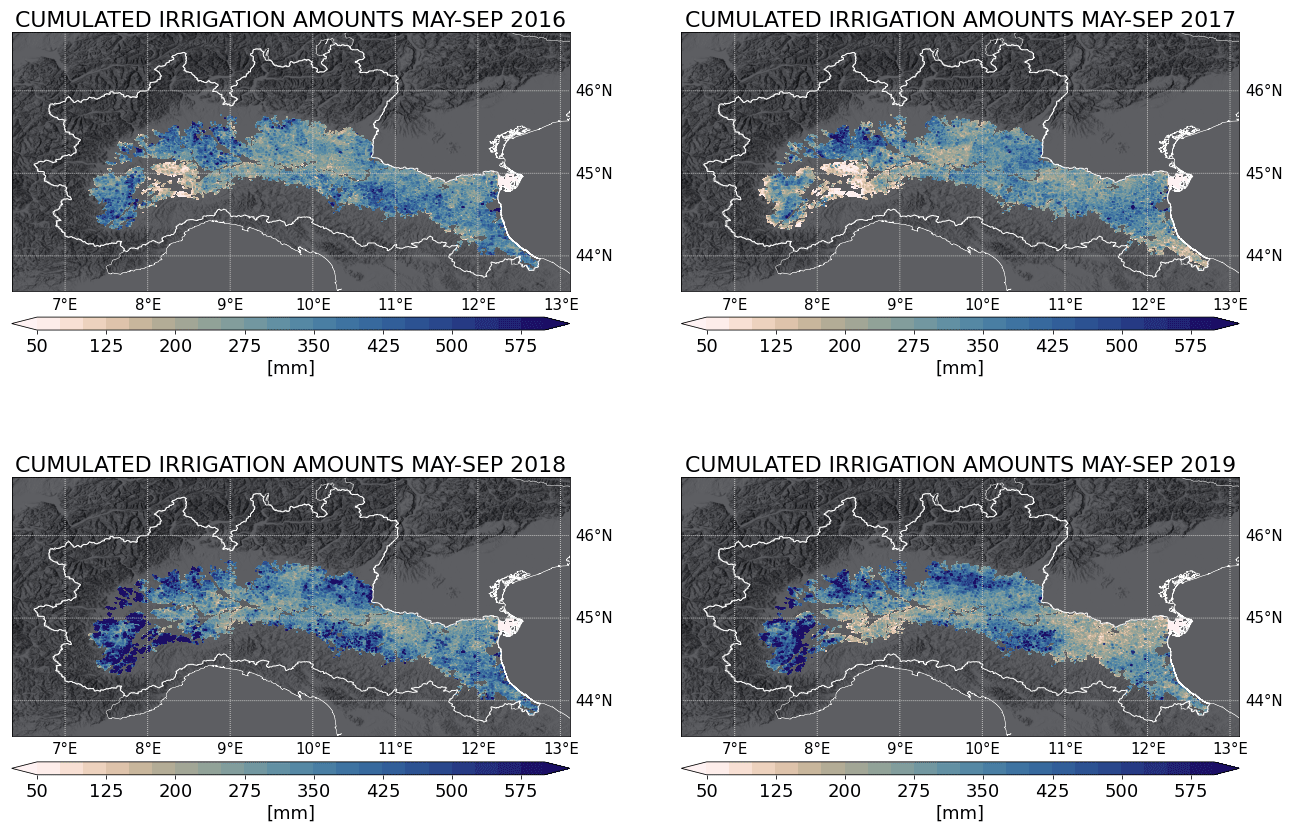
Figure 6Cumulated irrigation amounts over the Po valley (Italy) during the highest-intensity irrigation season (May–September) of 2016, 2017, 2018, and 2019.
The comparison between the proposed irrigation estimates and the benchmark rates collected over the San Silvestro and Formellino districts are provided in Fig. 7. Panels (a) and (b) show the 14 d aggregated time series, while the yearly comparison is proposed in panel (c). It is noteworthy that, as a difference with the Ebro case study, here the results during the non-irrigated season have been masked out. In fact, as shown by the time series of benchmark volumes of Fig. 5, in the Ebro basin irrigation can occur in winter as well, even though the volumes are much lower with respect to summer. This is the case, for instance, with irrigated fruit trees and greenhouses. For the pilot districts in the Po valley, the information on the irrigation season is available, and it has been exploited. Hence, the metrics are computed during irrigation periods only. It is important to underline that reference irrigation amounts in 2018 are lacking from mid-August onwards. A tendency to overestimate the benchmark can be observed, with more satisfactory performances over Formellino (RMSE = 14.86 mm/14 d and BIAS = 8.65 mm/14 d) than over San Silvestro (RMSE = 18.42 mm/14 d and BIAS = 12.36 mm/14 d). In both cases, poor performances in reproducing irrigation timing are found (r=0.31 and r=0.20 for San Silvestro and Formellino, respectively). Panel (c) of Fig. 7 shows that, even though for both districts the benchmark yearly amounts are overestimated, the relative error for the representative points of Formellino during the years 2016 and 2017 is below +30 %. It is important to highlight that the validation over the Po valley is limited by the number and size of the pilot districts. In fact, it has been possible to collect benchmark irrigation rates over just two sites, each one enclosing a very limited number of 1 km pixels of the satellite-derived irrigation data set. As a result, contamination with adjacent areas that can be non-irrigated or irrigated but with mixed techniques can influence the results. Previous studies highlighted how the irrigation method affects the capability of remotely sensed soil moisture products to detect irrigation-driven changes (see, for example, Gao et al., 2018; Dari et al., 2021). Moreover, the 1 km resolution represents the upper limit of the nominal size of agricultural fields over the Po valley; hence, the comparisons could suffer from a variability of the irrigation dynamics occurring at the subpixel scale as well.
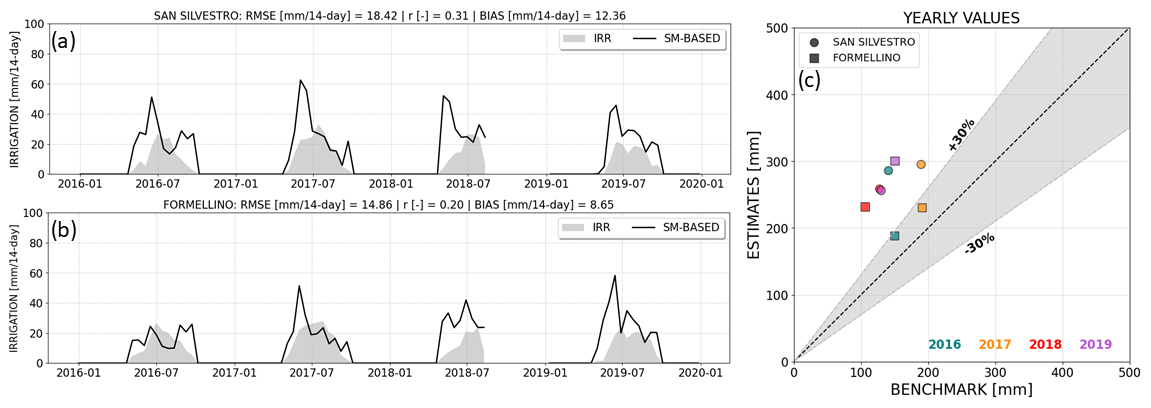
Figure 7(a–b) The 14 d aggregated time series of irrigation estimates (the black lines) over the two considered pilot districts within the Po valley against the benchmark rates (the light grey shaded areas). (c) Yearly comparison with data referring to different districts and years indicated through different markers and colors, respectively. The interval indicating a relative error of ±30 % is shown as well.
4.3 Murray–Darling basin, Australia
The irrigation data set over the Murray–Darling basin has been produced over a 6 km regular grid for the period ranging from April 2017 to July 2020. The spatial distribution of the retrieved irrigation amounts cumulated during the highest-intensity irrigation seasons (September–March) of 2017/18, 2018/19, and 2019/20 are shown in Fig. 8. Recurring patterns of high irrigation rates on the eastern and the southern sides of the domain can be observed.
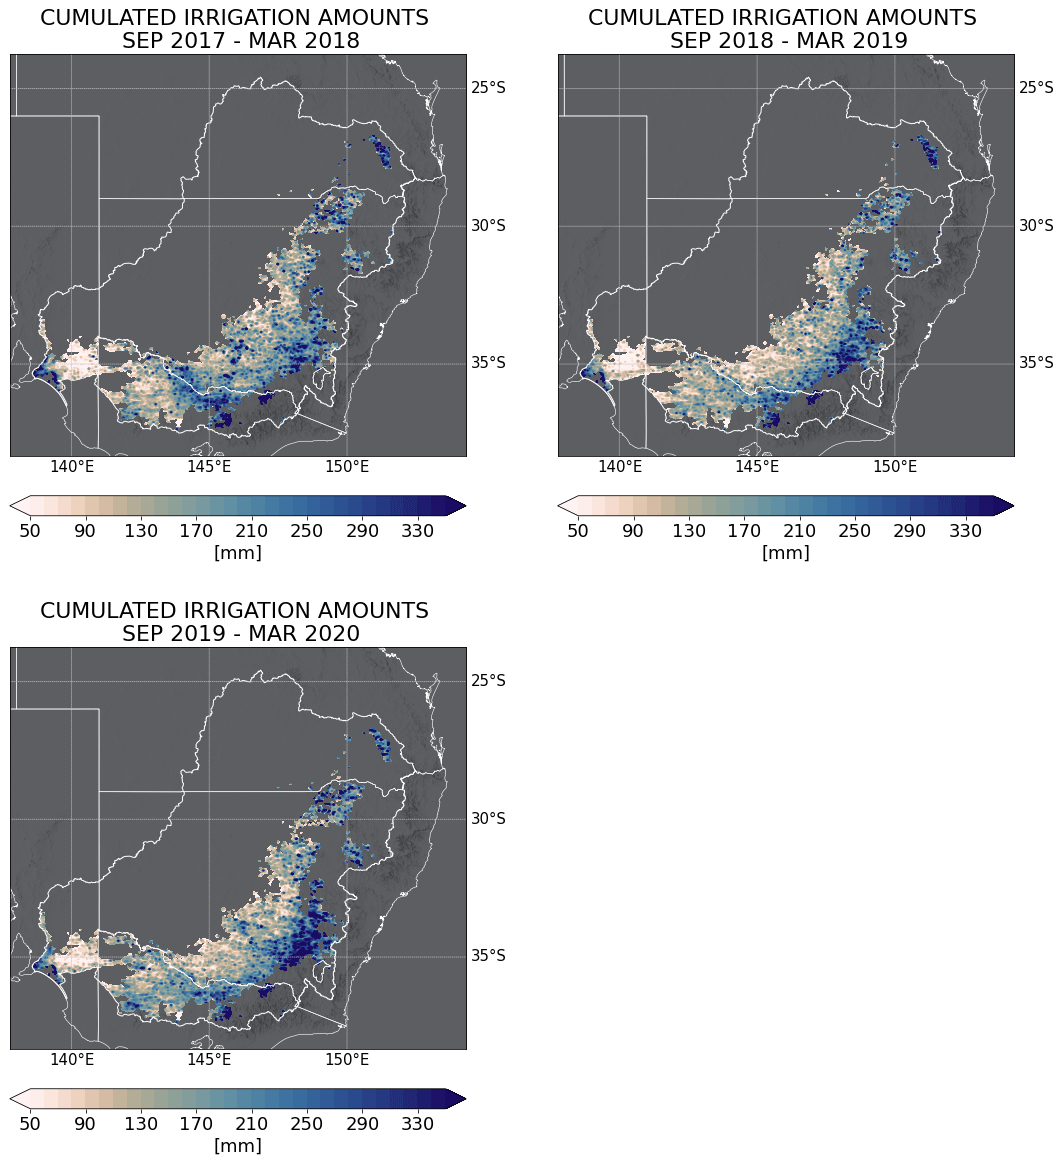
Figure 8Cumulated irrigation amounts over the Murray–Darling basin (Australia) during the highest-intensity irrigation season (September–March) of 2017/18, 2018/19, 2019/20.
Figure 9 shows the comparisons between the benchmark irrigation rates and the proposed estimates over the five pilot districts. Panels (a)–(e) show the monthly time series, while a seasonal comparison is provided in panel (f). As in the case of the Po valley, the results referring to the non-irrigated season have been masked out, and the metrics have been computed by considering irrigation periods only. Very good performances are obtained over three districts, i.e., Coleambally, Murray Mulwala, and Murrumbidgee, across which the RMSE varies between 8.65 and 10.54 mm/month, r ranges from 0.66 to 0.84, and the BIAS is between −7.26 and 3.18 mm/month. Even though the timing is properly reproduced, the SM-based inversion approach overestimates benchmark irrigation over the Murray Wakool site. Finally, unsatisfactory performances are found over the Western Murray district, where non-negligible underestimates can be observed. Over this district, the SM-based inversion algorithm returns lower estimates with respect to the other test sites, and, concurrently, benchmark rates are higher. The unsatisfactory performances over the Western Murray district could be explained by the mismatch between the site extent (which is from 20 to 60 times smaller than the areas of the other pilot districts) or by the adopted spatial resolution, which is a crucial aspect for properly detecting the irrigation signal from space (Dari et al., 2022b; Massari et al., 2021). The scatter plot provided in panel (f) of Fig. 9 summarizes the long-term comparison. It is noteworthy that, in this case, the data have been aggregated at the yearly time step by considering April as a starting month, thus including the irrigation season, which crosses two calendar years. Three representative points are very close to the 1:1 line, and the relative error results in less than or equal to ± 30 % in 5 cases out of 10.
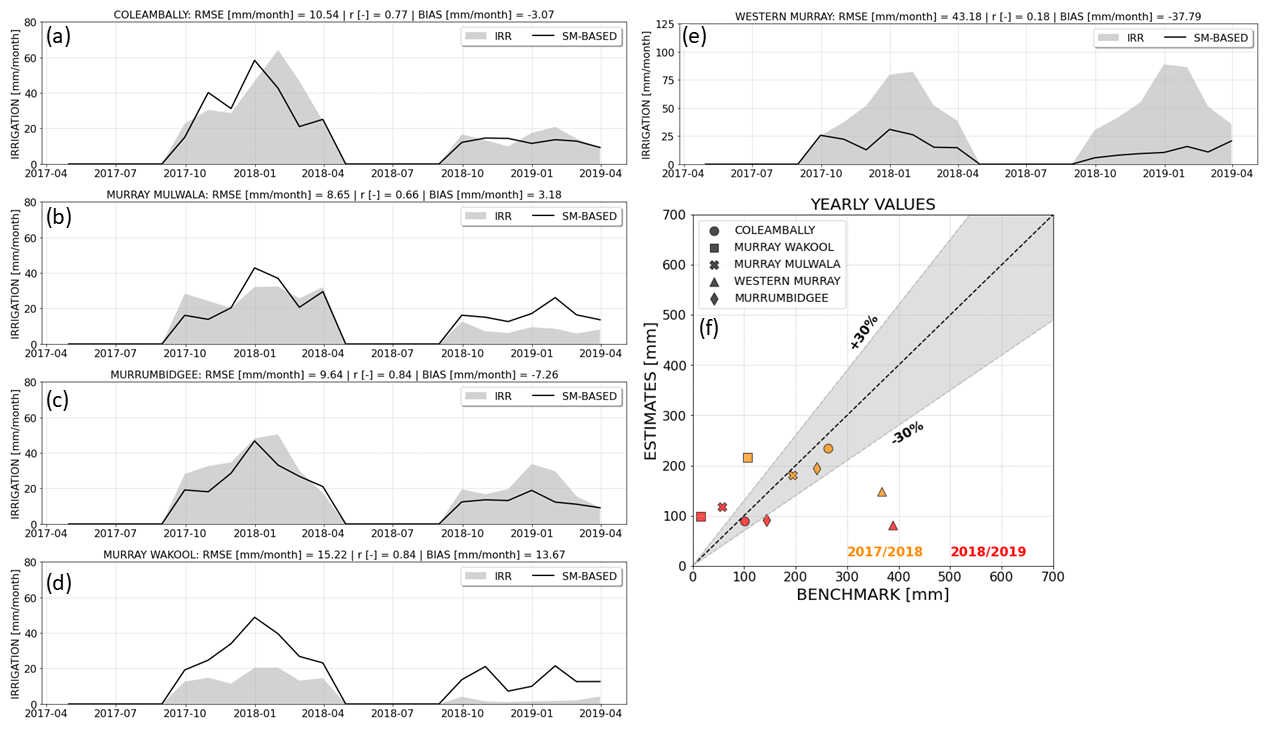
Figure 9(a–e) The 14 d aggregated time series of irrigation estimates (the black lines) over the five considered pilot districts within the Murray–Darling basin against the benchmark rates (the light grey shaded areas). (f) Yearly comparison with data referring to different districts and years indicated through different markers and colors, respectively. The interval indicating a relative error of ±30 % is shown as well.
4.4 Limitations
Two main issues may affect the developed data sets, namely, irrigation amounts wrongly retrieved over non-irrigated areas and false irrigation rates reproduced during the non-irrigated season. In principle, detailed knowledge of the actual extent of irrigated areas could allow us to estimate how much water is wrongly retrieved where irrigation is not practiced and such information could be exploited to correct the algorithm output (Jalilvand et al., 2019). Unfortunately, irrigation dynamics are highly uncertain, and the actual extent of irrigated areas is not an exception, as demonstrated by the large number of studies aimed at developing remote-sensing-based techniques to map irrigation (see, for example, Bazzi et al., 2019; Deines et al., 2019; Dari et al., 2021; Elwan et al., 2022). Moreover, the information on the irrigation extent is dynamic in time, as within the areas equipped for irrigation the actually irrigated fields may vary from year to year on the basis of economic factors, climatic conditions, and farming strategies (e.g., crop rotation). In summary, the developed data sets could benefit from integration with the spatial information of the actual extent of irrigated areas (when available) or, at least, with global maps of areas equipped for irrigation (e.g., Salmon et al., 2015; Siebert et al., 2015; Nagaraj et al., 2021).
False irrigation rates during non-irrigated seasons represent an additional issue that could affect the proposed data sets. Unlike the irrigation extent, the information on the crop watering period is generally available and more reliable. Moreover, since the irrigation schedule depends on the crop type, cropping calendars can be useful (see, for example, Portmann et al., 2008). Information on the irrigation seasons can be used to postprocess the developed products, as shown here for the Po and Murray–Darling case studies. However, an assessment of retrieved irrigation amounts through the SM-based inversion approach per month of the year has been carried out. Figure 10 provides the mean of the cumulated irrigation amounts for each month of the year covered by the developed data sets calculated over the pilot districts, i.e., where irrigation surely occurs. The highest-intensity irrigation seasons are highlighted in light green. For the selected sites within the Ebro and the Murray-Darling basins, the highest rates are retrieved when expected. The same happens for the Po valley, for which the highest peak occurs in June, but a second non-negligible peak can be observed in October as well. Such a circumstance can be attributed to false irrigation rates, as it is not corroborated by significant benchmark irrigation rates in the same period. However, over the portion of the Po valley where the considered pilot districts are located, fruit trees are irrigated even in October and November; hence, contamination with the signal coming from surrounding pixels with this feature could explain the irrigation peak in the autumn season over the Formellino and San Silvestro districts. Nevertheless, the monthly irrigation rates are never equal to zero during the winter period; this is a common issue with all three case studies, and, except for the Ebro basin, it can be considered a false irrigation, with magnitude over the Po valley higher than over the Murray–Darling basin. These potential errors can be attributed to overestimates of rainfall rates through the proposed approach occurring especially under humid climate conditions, resulting in water amounts wrongly attributed to irrigation practices.
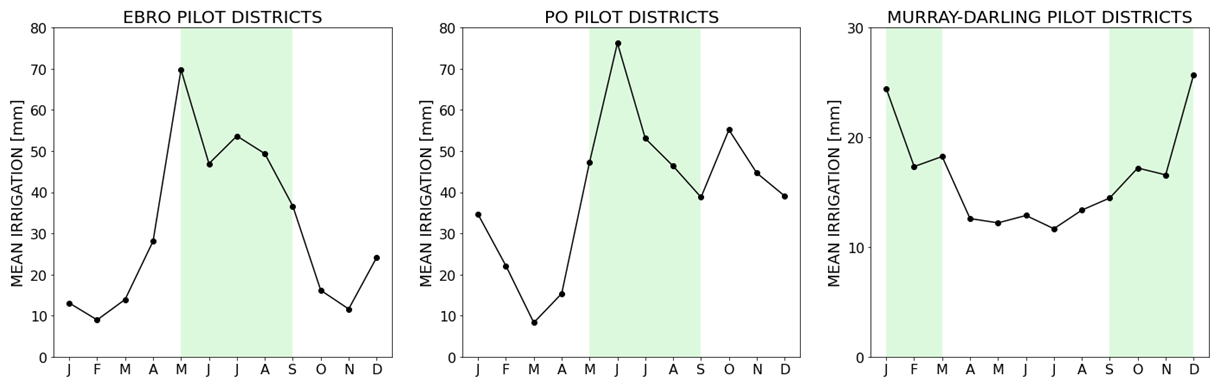
Figure 10Mean irrigation amounts retrieved per each month of the year over the pilot irrigation districts of the Ebro basin, the Po valley, and the Murray–Darling basin. Note the different y-axis range for the plot referring to the Murray–Darling case study.
4.5 Future plans
The room for enhancing the retrieved irrigation products largely relies on users' feedback, which is essential to address future developments. In the following, some of the main improvements that could be implemented in the near future are listed:
-
Temporal extension of the retrieved irrigation data sets could be implemented. Currently, the time span for which the data sets have been produced is constrained by the availability of the input data at the time of product development. For instance, the ending date common to all the data sets is due to the temporal coverage of GLEAM v3.5b.
-
Spatial extension of the retrieved irrigation data sets could be implemented. Undoubtedly, the main challenge is going through a global irrigation product. Nevertheless, the high resolution (1 km or less) required for the input data sets (at least soil moisture) and the high variability of irrigation practices worldwide makes it necessary for a gradual progression. Hence, the very imminent challenge is the extension to the country and continental scales. For instance, the development of irrigation estimates through the SM-based inversion approach over the whole Mediterranean area is a task foreseen within the ESA 4DMED-Hydrology project (https://www.4dmed-hydrology.org/#:~:text=4DMED-Hydrology aims at developing,from the ESA-Copernicus missions, last access: 3 April 2023).
-
Exploitation of high-resolution evapotranspiration input data could be implemented. Along with soil moisture, the evapotranspiration term plays a fundamental role in determining the output of the SM-based inversion approach (Dari et al., 2020). Hence, the exploitation of evapotranspiration estimates at a spatial resolution matching with the scale at which irrigation occurs is expected to bring benefits to the outcomes of the SM-based inversion approach. For this reason, the use of higher-resolution input PET rates for computing the evapotranspiration term of Eq. (3) (e.g., from a 1 km resolution version of the GLEAM data set over the Mediterranean, which will be developed within the abovementioned 4DMED-Hydrology project) is among the future perspectives of this study.
-
Integration with crop calendars and spatial information on actually irrigated areas could be implemented. As already mentioned in Sect. 4.4, the postprocessing of the developed data sets with ancillary site-specific information on irrigation extent and duration is recommended. Hence, users are encouraged to exploit such information, when available, to refine the data. In future, such procedures could be even automatized and implemented into the algorithm. This is already partly done in the calibration step, in whose first step the potential irrigation days are masked out (see Sect. 3.1).
The three irrigation data sets presented in this study are freely available at https://doi.org/10.5281/zenodo.7341284 (Dari et al., 2022a).
This study presents high-resolution irrigation products derived from satellite observations and developed over three highly human-influenced regions. The data sets, developed through the SM-based inversion approach, are one of the main outcomes of the ESA Irrigation+ project. The retrieved irrigation amounts have been validated through a comparison with benchmark rates over selected districts. For the Ebro and the Murray–Darling basins, the amount of the collected information on irrigation dynamics allows for a reliable validation, which provides satisfactory results. For the Ebro basin, median values of RMSE, r, and bias equal to 12.4 mm/14 d, 0.66, and −4.62 mm/14 d, respectively, are found. Referring to the Murray–Darling basin, the analogous values are 10.54 mm/month, 0.77, and −3.07 mm/month, respectively. Note that the two abovementioned data sets are based on different soil moisture products. The validation over the Po valley is affected by higher uncertainties due to the limited number and size of the pilot districts. However, the authors encourage the scientific community to perform deeper validation studies, as the main aim of this work is the use of the developed products. Under this perspective, limitations and suggested postprocessing strategies are highlighted in Sect. 4.4. The presented irrigation products are the first regional-scale gridded data sets retrieved from satellite observation at a spatial resolution suitable for the water resource management in agriculture. Hence, these kinds of applications are fostered, as for instance the ingestion of the developed data sets in systems providing irrigation advice or performing irrigation water accounting. Of course, the ingestion of the proposed irrigation data sets into hydrological and land surface modeling is possible as well. Users' feedback will be essential to address future implementations, with the final aim of building an operational system for high-resolution irrigation water monitoring from space.
In this section, the outcomes of the calibration procedure described in Sect. 3.1 and summarized in Fig. 2 are provided. For the parameters a, b, and Z∗, a spatially distributed calibration has been performed. The calibrated values of such parameters for the Ebro basin are shown in the maps of Fig. A1 and in the boxplots of Fig. A2. Across the whole study area, the median values of a, b, and Z∗ are equal to 18.84 mm, 3.98, and 79.82 mm, respectively. The calibrated value of the F parameter (adopted over the whole domain) is equal to 1.37.
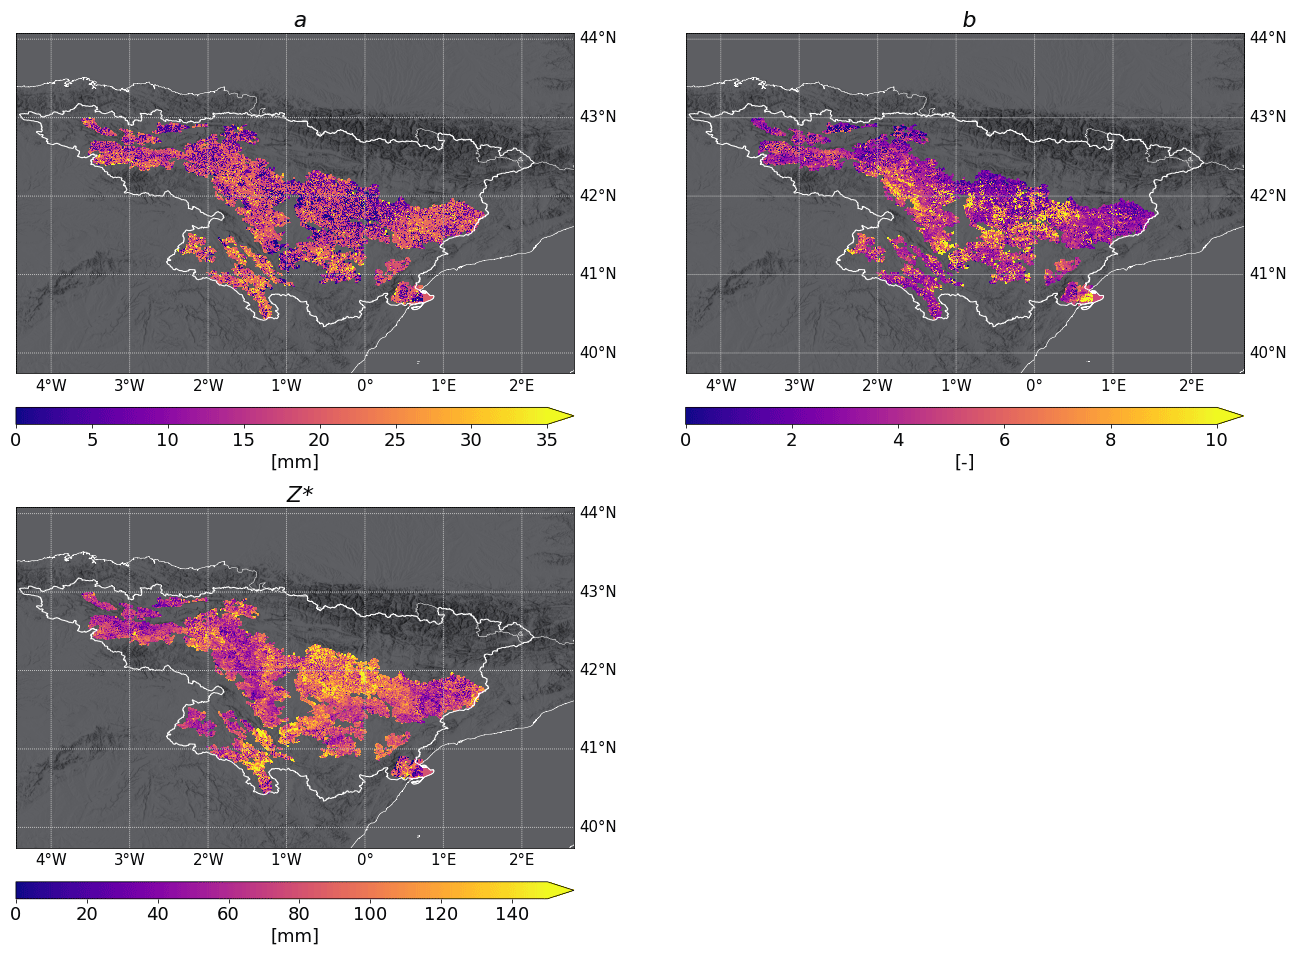
Figure A1Spatial distribution of the calibrated values of the parameters a, b, and Z∗ over the Ebro basin.
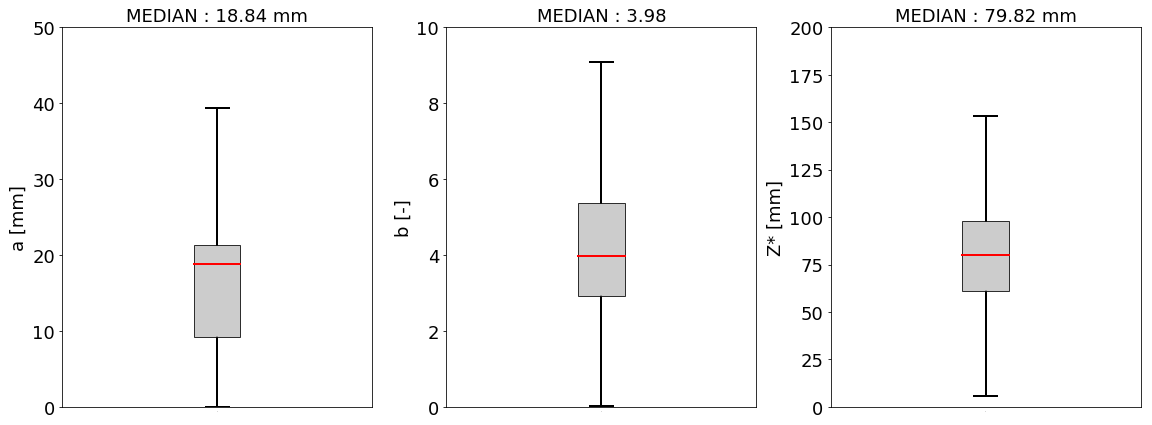
Figure A2Boxplot showing the calibrated values of the parameters a, b, and Z∗ over the Ebro basin.
The calibrated values of the parameters a, b, and Z∗ obtained over the Po valley are shown in the maps of Fig. A3 and in the boxplots of Fig. A4. The median values of a, b, and Z∗ resulting from the calibration step are equal to 7.02 mm, 1.40, and 97.63 mm, respectively. The calibrated value of the F parameter (adopted over the whole domain) is equal to 0.60.
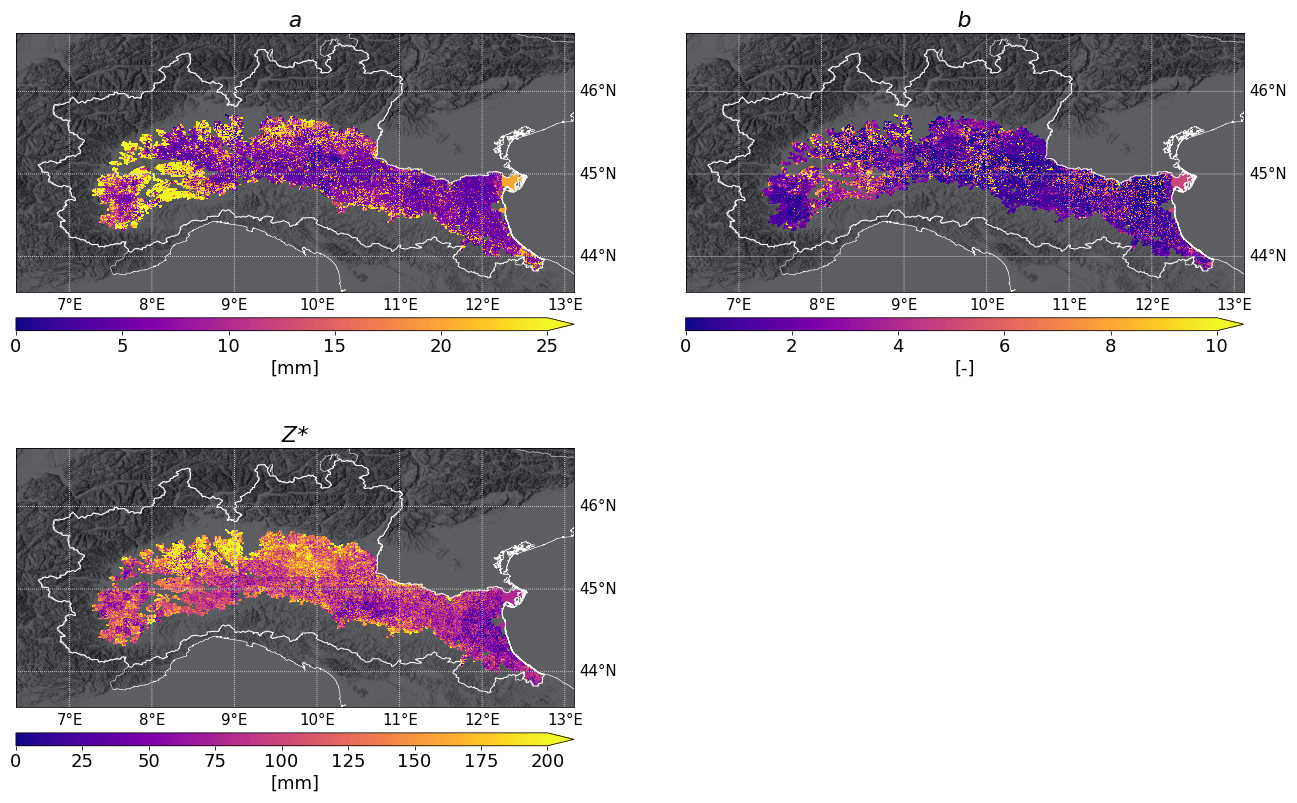
Figure A3Spatial distribution of the calibrated values of the parameters a, b, and Z∗ over the Po valley.
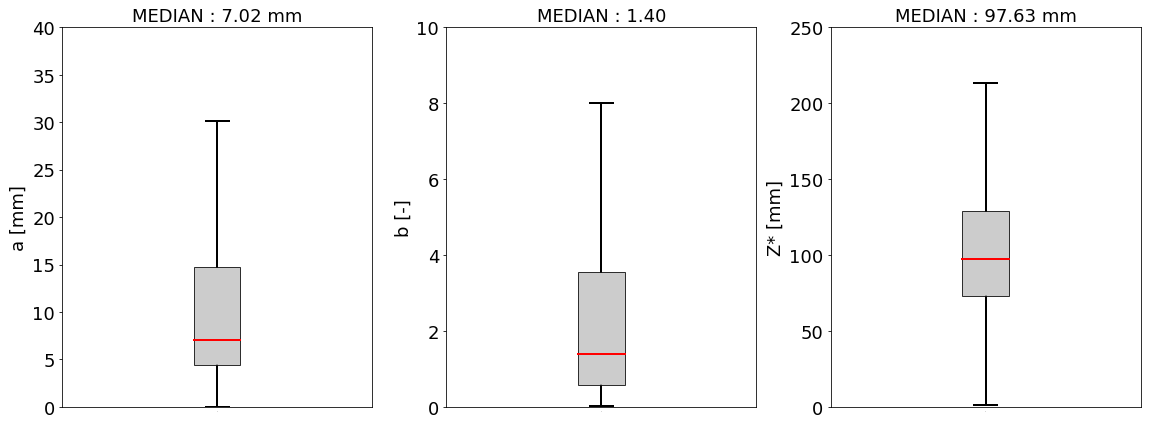
Figure A4Boxplot showing the calibrated values of the parameters a, b, and Z∗ over the Po valley.
Finally, the calibrated values of the parameters a, b, and Z∗ obtained over the Murray–Darling basin are provided in the maps of Fig. A5 and in the boxplots of Fig. A6. The median values of a, b, and Z∗ result equal to 2.32 mm, 8.27, and 50.21 mm, respectively. The calibrated value of the F parameter (adopted over the whole domain) is equal to 1.34.
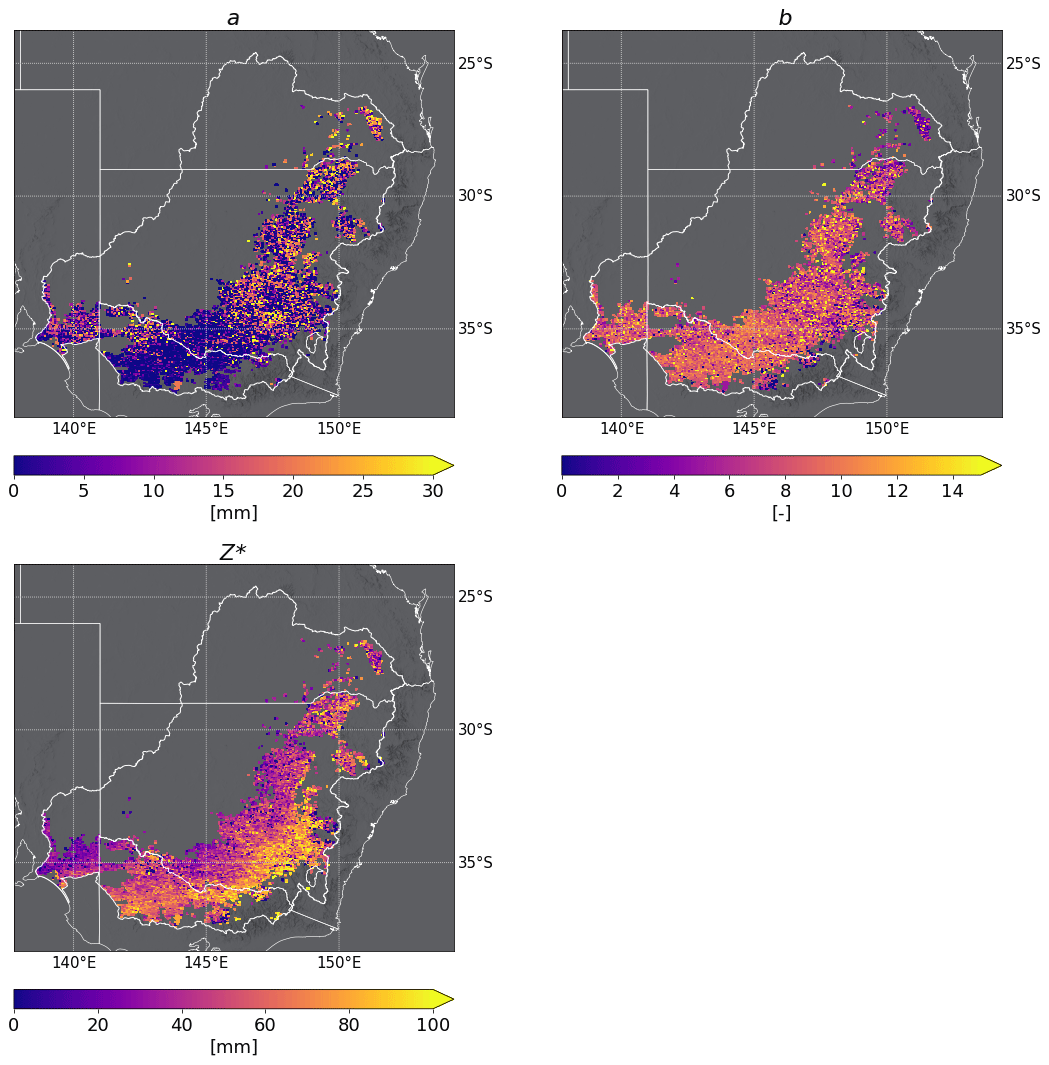
Figure A5Spatial distribution of the calibrated values of the parameters a, b, and Z∗ over the Murray–Darling basin.
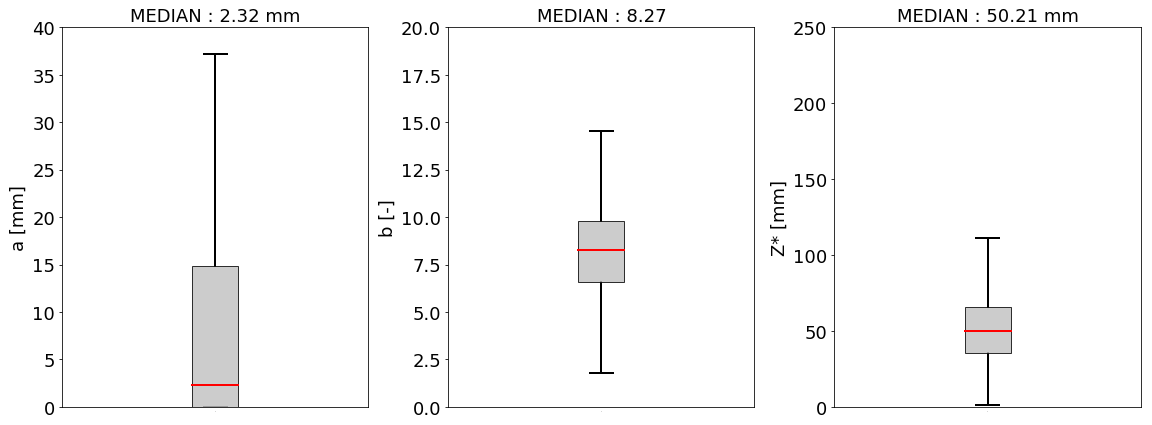
Figure A6Boxplot showing the calibrated values of the parameters a, b, and Z∗ over the Murray–Darling basin.
JD: conceptualization, methodology, software, validation, formal analysis, investigation, writing – original draft preparation, writing – review and editing, visualization. LB: conceptualization, methodology, investigation, writing – review and editing, supervision. SM: formal analysis, investigation, validation, writing – review and editing. CM: investigation, writing – review and editing, supervision. AT: writing – review and editing, supervision. AT: investigation, writing – review and editing, supervision. SB: investigation, writing – review and editing, supervision. RQ: resources, writing – review and editing. MV: resources, writing – review and editing. VF: resources, writing – review and editing. ABO: resources, writing – review and editing. PQS: investigation, resources, writing – review and editing. DB: resources, writing – review and editing. EV: writing – review and editing, supervision.
The contact author has declared that none of the authors has any competing interests.
Publisher's note: Copernicus Publications remains neutral with regard to jurisdictional claims in published maps and institutional affiliations.
The authors acknowledge the support from the European Space Agency (ESA) under the Irrigation+ project (contract n. 4000129870/20/I-NB); for further details please visit https://esairrigationplus.org/ (last access: 1 November 2022). The authors wish to thank the SAIH (Sistema Automático de Información Hidrológica) Ebro and CER (Canale Emiliano Romagnolo) for providing the irrigation benchmark values for the Ebro basin and Po valley pilot districts, respectively. The authors would like to thank the irrigation infrastructure operators (IIOs) that provided the Australian irrigation benchmark data for this study.
This research has been supported by the European Space Agency (ESA) under the Irrigation+ project (contract no. 4000129870/20/I-NB).
This paper was edited by Hao Shi and reviewed by two anonymous referees.
Abolafia-Rosenzweig, R., Livneh, B., Small, E. E., and Kumar, S. V.: Soil moisture data assimilation to estimate irrigation water use, J. Adv. Model. Earth Sy., 11, 3670–3690, https://doi.org/10.1029/2019MS001797, 2019.
Albergel, C., Rüdiger, C., Pellarin, T., Calvet, J.-C., Fritz, N., Froissard, F., Suquia, D., Petitpa, A., Piguet, B., and Martin, E.: From near-surface to root-zone soil moisture using an exponential filter: an assessment of the method based on in-situ observations and model simulations, Hydrol. Earth Syst. Sci., 12, 1323–1337, https://doi.org/10.5194/hess-12-1323-2008, 2008.
Allen, R. G., Pereira, L. S., Raes, D., and Smith, M.: Crop Evapotranspiration: Guidelines for Computing Crop Requirements, Irrigation and Drainage Paper, FAO, Rome, Italy, ISBN 92-5-104219-5, 1998.
Bauer-Marschallinger, B., Naeimi, V., Cao, S., Paulik, C., Schaufler, S., Stachl, T., Modanesi, S., Ciabatta, L., Massari, C., Brocca, L., and Wagner, W.: Towards global soil moisture monitoring with Sentinel-1: harnessing assets and overcoming obstacles, IEEE T. Geosci. Remote S., 57, 520–539, https://doi.org/10.1109/TGRS.2018.2858004, 2019.
Bazzi, H., Baghdadi, N., Ienco, D., El Hajj, M., Zribi, M., Belhouchette, H., Escorihuela, M. J., and Demarez, V.: Mapping irrigated areas using Sentinel-1 time series in Catalonia, Spain, Remote Sens.-Basel, 11, 1836, https://doi.org/10.3390/rs11151836, 2019.
Beck, H. E., Zimmermann, N. E., McVicar, T. R., Vergopolan, N., Berg, A., and Wood, E. F.: Present and future Köppen-Geiger climate classification maps at 1-km resolution, Sci. Data, 5, 180214, https://doi.org/10.1038/sdata.2018.214, 2018.
Bretreger, D., Yeo, I.-Y., Hancock, G., and Willgoose, G.: Monitoring irrigation using landsat observations and climate data over regional scales in the Murray-Darling Basin, J. Hydrol., 590, 125356, https://doi.org/10.1016/j.jhydrol.2020.125356, 2020.
Brocca, L., Ciabatta, L., Massari, C., Moramarco, T., Hahn, S., Hasenauer, S., Kidd, R., Dorigo, W., Wagner, W., and Levizzani, V.: Soil as a natural rain gauge: Estimating global rainfall from satellite soil moisture data, J. Geophys. Res., 119, 5128–5141, https://doi.org/10.1002/2014JD021489, 2014.
Brocca, L., Massari, C., Ciabatta, L., Moramarco, T., Penna, D., Zuecco, G., Pianezzola, L., Borga, M., Matgen, P., and Martínez-Fernández, J.: Rainfall estimation from in situ soil moisture observations at several sites in Europe: an evaluation of the SM2RAIN algorithm, J. Hydrol. Hydromech., 63, 201–209, https://doi.org/10.1515/johh-2015-0016, 2015.
Brocca, L., Tarpanelli, A., Filippucci, P., Dorigo, W., Zaussinger, F., Gruber, A., and Fernández-Prieto, D.: How much water is used for irrigation? A new approach exploiting coarse resolution satellite soil moisture products, Int. J. Appl. Earth Obs., 73, 752–766, https://doi.org/10.1016/j.jag.2018.08.023, 2018.
Brombacher, J., de Oliveira Silva, I. R., Degen, J., and Pelgrum, H.: A novel evapotranspiration based irrigation quantification method using the hydrological similar pixels algorithm, Agr. Water Manage., 267, 107602, https://doi.org/10.1016/j.agwat.2022.107602, 2022.
Ceppi, A., Ravazzani, G., Corbari, C., Salerno, R., Meucci, S., and Mancini, M.: Real-time drought forecasting system for irrigation management, Hydrol. Earth Syst. Sci., 18, 3353–3366, https://doi.org/10.5194/hess-18-3353-2014, 2014.
Dari, J., Brocca, L., Quintana-Seguí, P., Escorihuela, M. J., Stefan, V., and Morbidelli, R.: Exploiting high-resolution remote sensing soil moisture to estimate irrigation water amounts over a Mediterranean region, Remote Sens.-Basel, 12, 2593, https://doi.org/10.3390/rs12162593, 2020.
Dari, J., Quintana-Seguí, P., Escorihuela, M.J., Stefan, V., Brocca, L., and Morbidelli, R.: Detecting and mapping irrigated areas in a Mediterranean environment by using remote sensing soil moisture and a land surface model, J. Hydrol., 596, 126129, https://doi.org/10.1016/j.jhydrol.2021.126129, 2021.
Dari, J., Brocca, L., Modanesi, S., Massari, C., Tarpanelli, A., Barbetta, S., Quast, R., Vreugdenhil, M., Freeman, V., Barella-Ortiz, A., Quintana-Seguí, P., Bretreger, D., and Volden, E.: Regional data sets of high-resolution (1 and 6 km) irrigation estimates from space (1.0), Zenodo [data set], https://doi.org/10.5281/zenodo.7341284, 2022a.
Dari, J., Brocca, L., Quintana-Seguí, P., Casadei, S., Escorihuela, M.J., Stefan, V., and Morbidelli, R.: Double-scale analysis on the detectability of irrigation signals from remote sensing soil moisture over an area with complex topography in central Italy, Adv. Water Res., 161, 104130, https://doi.org/10.1016/j.advwatres.2022.104130, 2022b.
Dari, J., Quintana-Seguí, P., Morbidelli, R., Saltalippi, C., Flammini, A., Giugliarelli, E., Escorihuela, M. J., Stefan, V., and Brocca, L.: Irrigation estimates from space: Implementation of different approaches to model the evapotranspiration contribution within a soil-moisture-based inversion algorithm, Agr. Water Manage., 265, 107537, https://doi.org/10.1016/j.agwat.2022.107537, 2022c.
Das, N. N., Entekhabi, D., Dunbar, R. S., Chaubell, M. J., Colliander, A., Yueh, S., Jagdhuber, T., Chen, F., Crow, W., O'Neill, P. E., Walker, J. P., Berg, A., Bosch, D. D., Caldwell, T., Cosh, M. H., Collins, C. H., Lopez-Baeza, E., and Thibeault, M.: The SMAP and Copernicus Sentinel 1A/B microwave active-passive high resolution surface soil moisture product, Remote Sens. Environ., 233, 111380, https://doi.org/10.1016/j.rse.2019.111380, 2019.
Deines, J. M., Kendall, A. D., Crowley, M. A., Rapp, J., Cardille, J. A., and Hyndman, D. W.: Mapping three decades of annual irrigation across the US High Plains Aquifer using Landsat and Google Earth Engine, Remote Sens. Environ., 233, 111400, https://doi.org/10.1016/j.rse.2019.111400, 2019.
De Lannoy, G. J. M. and Reichle, R. H.: Global assimilation of multiangle and multipolarization SMOS brightness temperature observations into the GEOS-5 catchment land surface model for soil moisture estimation, J. Hydrometeorol., 17, 669–691, https://doi.org/10.1175/JHM-D-15-0037.1, 2016a.
De Lannoy, G. J. M. and Reichle, R. H.: Assimilation of SMOS brightness temperatures or soil moisture retrievals into a land surface model, Hydrol. Earth Syst. Sci., 20, 4895–4911, https://doi.org/10.5194/hess-20-4895-2016, 2016b.
Dorigo, W., Dietrich, S., Aires, F., Brocca, L., Carter, S., Cretaux, J.-F., Dunkerley, D., Enomoto, H., Forsberg, R., Güntner, A., Hegglin, M. I., Hollmann, R., Hurst, D. F., Johannessen, J. A., Kummerow, C., Lee, T., Luojus, K., Looser, U., Miralles, D. G., Pellet, V., Recknagel, T., Vargas, C. R., Schneider, U., Schoeneich, P., Schröder, M., Tapper, N., Vuglinsky, V., Wagner, W., Yu, L., Zappa, L., Zemp, M., and Aich, V.: Closing the water cycle from observations across scales: where do we stand?, B. Am. Meteorol. Soc., 102, E1897–E1935, https://doi.org/10.1175/BAMS-D-19-0316.1, 2021.
Elwan, E., Le Page, M., Jarlan, L., Baghdadi, N., Brocca, L., Modanesi, S., Dari, J., Quintana-Seguí, P., and Zribi, M.: Irrigation Mapping on Two Contrasted Climatic Contexts Using Sentinel-1 and Sentinel-2 Data, Water, 14, 804, https://doi.org/10.3390/w14050804, 2022.
Famiglietti, J. S. and Wood, E. F.: Multiscale modeling of spatially variable water and energy balance processes, Water Resour. Res., 30, 3061–3078, https://doi.org/10.1029/94WR01498, 1994.
Ferguson, C. R., Pan, M., and Oki, T.: The effect of global warming on future water availability: CMIP5 synthesis, Water Resour. Res., 54, 7791–7819, https://doi.org/10.1029/2018WR022792, 2018.
Foley, J. A., Ramankutty, N., Brauman, K. A., Cassidy, E. S., Gerber, J. S., Johnston, M., Mueller, N. D., O’Connell, C., Ray, D. K., West, P. C., Balzer, C., Bennett, E. M., Carpenter, S. R., Hill, J., Monfreda, C., Polasky, S., Rockström, J., Sheehan, J., Siebert, S., Tilman, D., and Zaks, D. P. M.: Solutions for a cultivated planet, Nature, 478, 337–342, https://doi.org/10.1038/nature10452, 2011.
Formetta, G., Tootle, G., and Therrell, M.: Regional Reconstruction of Po River Basin (Italy) Streamflow, Hydrology, 9, 163, https://doi.org/10.3390/hydrology9100163, 2022.
Freeman, V., Esterhuizen, S., Jales, P., and Masters, D.: Spire's new GNSS-R soil moisture products collected from small and innovative Earth observing satellites, Proc. SPIE 11528, Remote Sensing for Agriculture, Ecosystems, and Hydrology XXII, 115280F, 20 September 2020, https://doi.org/10.1117/12.2574124, 2020.
Gao, Q., Zribi, M., Escorihela, M. J., Baghdadi, N., and Quintana-Seguí, P.: Irrigation mapping using Sentinel-1 time series at field scale, Remote Sens.-Basel, 10, 1495, https://doi.org/10.3390/rs10091495, 2018.
Hunter, M. C., Smith, R. G., Schipanski, M. E., Atwood, L. W., and Mortensen, D. A.: Agriculture in 2050: Recalibrating targets for sustainable intensification, BioScience, 67, 386–391, https://doi.org/10.1093/biosci/bix010, 2017.
Jalilvand, E., Tajrishy, M., Hashemi, S. A. G., and Brocca, L.: Quantification of irrigation water using remote sensing of soil moisture in a semi-arid region, Remote Sens. Environ., 231, 111226, https://doi.org/10.1016/j.rse.2019.111226, 2019.
Jalilvand, E., Abolafia-Rosenzweig, R., Tajrishy, M., and Das, N. N.: Evaluation of SMAP-Sentinel1 High-Resolution Soil Moisture Data to Detect Irrigation over Agricultural Domain, IEEE J. Sel. Top. Appl., 14, 10733–10747, https://doi.org/10.1109/JSTARS.2021.3119228, 2021.
Lawston, P. M., Santanello, J. A., Zaitchik, B. F., and Rodell, M.: Impact of irrigation methods on land surface model spinup and initialization of WRF forecasts, J. Hydrometeorol., 16, 1135–1154, https://doi.org/10.1175/JHM-D-14-0203.1, 2015.
Lawston, P. M., Santanello, J. A., and Kumar, S. V.: Irrigation signals detected from SMAP soil moisture retrievals, Geophys. Res. Lett., 44, 11–860, https://doi.org/10.1002/2017GL075733, 2017.
Liang, X., Lettenmaier, D. P., Wood, E. F., and Burges, S. J.: A Simple hydrologically Based Model of Land Surface Water and Energy Fluxes for GSMs, J. Geophys. Res., 99, 14415–14428, 1994.
Lievens, H., Martens, B., Verhoest, N. E. C., Hahn, S., Reichle, R. H., and Miralles, D. G.: Assimilation of global radar backscatter and radiometer brightness temperature observations to improve soil moisture and land evaporation estimates, Remote Sens. Environ., 189, 194–210, https://doi.org/10.1016/j.rse.2016.11.022, 2017a.
Lievens, H., Reichle, R. H., Liu, Q., De Lannoy, G. J. M., Dunbar, R. S., Kim, S. B., Das, N. N., Cosh, M., Walker, J. P., and Wagner, W.: Joint Sentinel-1 and SMAP data assimilation to improve soil moisture estimates, Geophys. Res. Lett., 44, 6145–6153, https://doi.org/10.1002/2017GL073904, 2017b.
Martens, B., Miralles, D. G., Lievens, H., van der Schalie, R., de Jeu, R. A. M., Fernández-Prieto, D., Beck, H. E., Dorigo, W. A., and Verhoest, N. E. C.: GLEAM v3: satellite-based land evaporation and root-zone soil moisture, Geosci. Model Dev., 10, 1903–1925, https://doi.org/10.5194/gmd-10-1903-2017, 2017.
Massari, C., Modanesi, S., Dari, J., Gruber, A., De Lannoy, G. J. M., Girotto, M., Quintana-Seguí, P., Le Page, M., Jarlan, L., Zribi, M., Ouaadi, N., Vreugdenhil, M., Zappa, L., Dorigo, W., Wagner, W., Brombacher, J., Pelgrum, H., Jaquot, P., Freeman, V., Volden, E., Fernandez Prieto, D., Tarpanelli, A., Barbetta, S., and Brocca, L.: A review of irrigation information retrievals from space and their utility for users, Remote Sens.-Basel, 13, 4112, https://doi.org/10.3390/rs13204112, 2021.
Merlin, O., Escorihuela, M. J., Mayoral, M. A., Hagolle, O., AlBitar, A., and Kerr, Y.: Self-calibrated evaporation-based disaggregation of SMOS soil moisture: an evaluation study at 3 km and 100 m resolution in Catalunya, Spain, Remote Sens. Environ., 130, 25–38, https://doi.org/10.1016/j.rse.2012.11.008, 2013.
Miralles, D. G., Holmes, T. R. H., De Jeu, R. A. M., Gash, J. H., Meesters, A. G. C. A., and Dolman, A. J.: Global land-surface evaporation estimated from satellite-based observations, Hydrol. Earth Syst. Sci., 15, 453–469, https://doi.org/10.5194/hess-15-453-2011, 2011.
Modanesi, S., Dari, J., Massari, C., Tarpanelli, A., Barbetta, S., De Lannoy, G., Gruber, A., Lievens, H., Bechtold, M., Quast, R., Vreugdenhil, M., Zribi, M., Le Page, M., and Brocca, L.: A comparison between satellite- and model-based approaches developed in the ESA Irrigation+ project framework to estimate irrigation quantities, 2021 IEEE International Workshop on Metrology for Agriculture and Forestry (MetroAgriFor), 268–272, https://doi.org/10.1109/MetroAgriFor52389.2021.9628453, 2021a.
Modanesi, S., Massari, C., Gruber, A., Lievens, H., Tarpanelli, A., Morbidelli, R., and De Lannoy, G. J. M.: Optimizing a backscatter forward operator using Sentinel-1 data over irrigated land, Hydrol. Earth Syst. Sci., 25, 6283–6307, https://doi.org/10.5194/hess-25-6283-2021, 2021b.
Modanesi, S., Massari, C., Bechtold, M., Lievens, H., Tarpanelli, A., Brocca, L., Zappa, L., and De Lannoy, G. J. M.: Challenges and benefits of quantifying irrigation through the assimilation of Sentinel-1 backscatter observations into Noah-MP, Hydrol. Earth Syst. Sci., 26, 4685–4706, https://doi.org/10.5194/hess-26-4685-2022, 2022.
Muñoz-Sabater, J., Dutra, E., Agustí-Panareda, A., Albergel, C., Arduini, G., Balsamo, G., Boussetta, S., Choulga, M., Harrigan, S., Hersbach, H., Martens, B., Miralles, D. G., Piles, M., Rodríguez-Fernández, N. J., Zsoter, E., Buontempo, C., and Thépaut, J.-N.: ERA5-Land: a state-of-the-art global reanalysis dataset for land applications, Earth Syst. Sci. Data, 13, 4349–4383, https://doi.org/10.5194/essd-13-4349-2021, 2021.
Musolino, D., de Carli, A., and Massarutto, A.: Evaluation of socio-economic impact of drought events: the case of Po river basin, European Countryside, 9, 163–176, https://doi.org/10.1515/euco-2017-0010, 2017.
Nagaraj, D., Proust, E., Todeschini, A., Rulli, M. C., and D'Odorico, P.: A new dataset of global irrigation areas from 2001 to 2015, Adv. Water Resour., 152, 103910, https://doi.org/10.1016/j.advwatres.2021.103910, 2021.
Nie, W., Zaitchik, B. F., Rodell, M., Kumar, S. V., Anderson, M. C., and Hain, C.: Groundwater withdrawals under drought: Reconciling GRACE and Land Surface Models in the United States High Plains Aquifer, Water Resour. Res., 48, 317, https://doi.org/10.1029/2017WR022178, 2018.
Ozdogan, M., Rodell, M., Beaudoing, H. K., and Toll, D. L.: Simulating the effects of irrigation over the United States in a land surface model based on satellite derived agricultural data, J. Hydrometeorol., 11, 171–184, https://doi.org/10.1175/2009JHM1116.1, 2010.
Peña-Arancibia, J. L., Mainuddin, M., Kirby, J. M., Chiew, F. H. S., McVicar, T. R., and Vaze, J.: Assessing irrigated agriculture's surface water and groundwater consumption by combining satellite remote sensing and hydrologic modelling, Sci. Total Environ., 542, 372–382, https://doi.org/10.1016/j.scitotenv.2015.10.086, 2016.
Peng, J., Albergel, C., Balenzano, A., Brocca, L., Cartus, O., Cosh, M. H., Crow, W. T., Dabrowska-Zielinska, K., Dadson, S., Davidson, M. W. J., de Rosnay, P., Dorigo, W., Gruber, A., Hagemann, S., Hirschi, M., Kerr, Y. H., Lovergine, F., Mahecha, M. D., Marzahn, P., Mattia, F., Musial, J. P., Preuschmann, S., Reichle, R. H., Satalino, G., Silgram, M., van Bodegom, P. M., Verhoest, N. E. C., Wagner, W., Walker, J. P., Wegmüller, U., and Loew, A.: A roadmap for high-resolution satellite soil moisture applications – confronting product characteristics with user requirements, Remote Sens. Environ., 252, 112162, https://doi.org/10.1016/j.rse.2020.112162, 2021.
Portmann, F., Siebert, S., Bauer, C., and Döll, P.: Global data set of monthly growing areas of 26 irrigated crops, Version 1.0, Frankfurt Hydrol. Pap. 06, Inst. of Phys. Geogr., Univ. of Frankfurt, Frankfurt, Germany, 2008.
Quast, R.: “TUW-GEO/rt1: RT1 v1.5.1.”, Zenodo [data set], https://doi.org/10.5281/ZENODO.3745590, 2021.
Quast, R., Albergel, C., Calvet, J. C., and Wagner, W.: A Generic First-Order Radiative Transfer Modelling Approach for the Inversion of Soil and Vegetation Parameters from Scatterometer Observations, Remote Sens.-Basel, 11, 285, https://doi.org/10.3390/rs11030285, 2019.
Romaguera, M., Krol, M., Salama, M., Su, Z., and Hoekstra, A.: Application of a remote sensing method for estimating monthly blue water evapotranspiration in irrigated agriculture, Remote Sens.-Basel, 6, 10033–10050, https://doi.org/10.3390/rs61010033, 2014.
Ruf, C., Gleason, S., Ridley, A., Rose, R., and Scherrer, J.: The Nasa Cygnss Mission: Overview and Status Update, IEEE International Geoscience and Remote Sensing Symposium (IGARSS), Fort Worth, TX, USA, 2641–2643, https://doi.org/10.1109/IGARSS.2017.8127537, 2017.
Salmon, J. M., Friedl, M. A, Frolking, S., Wisser, D., and Douglas, E. M.: Global rain-fed, irrigated, and paddy croplands: a new high resolution map derived from remote sensing, crop inventories and climate data, Int. J. Appl. Earth Obs., 38, 321–334, https://doi.org/10.1016/j.jag.2015.01.014, 2015.
Siebert, S., Kummu, M., Porkka, M., Döll, P., Ramankutty, N., and Scanlon, B. R.: A global data set of the extent of irrigated land from 1900 to 2005, Hydrol. Earth Syst. Sci., 19, 1521–1545, https://doi.org/10.5194/hess-19-1521-2015, 2015.
Strosser, P., Dworak, T., Delvaux, P. A. G., Berglund, M., Schmidt, G., Mysiak, J., Kossida, M., Iacovides, I., and Ashton, V.: Gap analysis of the water scarcity and droughts policy in the EU European Commission, European Commission, Tender ENV.D.1/SER/2010/0049, 206, 2012.
van Dijk, A. I. J. M., Beck, H. E., Crosbie, R. S., de Jeu, R. A. M., Liu, Y. Y., Podger, G. M., Timbal, B., and Viney, N. R.: The Millennium Drought in southeast Australia (2001-2009): Natural and human causes and implications for water resources, ecosystems, economy, and society, Water Resour. Res., 49, 1040–1057, https://doi.org/10.1002/wrcr.20123, 2013.
Van Eekelen, M. W., Bastiaanssen, W. G. M., Jarmain, C., Jackson, B., Ferreira, F., van der Zaag, P., Saraiva Okello, A., Bosch, J., Dye, P., Bastidas-Obando, E., Dost, R. J. J., and Luxemburg, W. M. J.: A novel approach to estimate direct and indirect water withdrawals from satellite measurements: a case study from the Incomati basin, Agric. Ecosyst. Environ., 200, 126–142, https://doi.org/10.1016/j.agee.2014.10.023, 2015.
Zappa, L., Schlaffer, S., Bauer-Marschallinger, B., Nendel, C., Zimmerman, B., and Dorigo, W.: Detection and Quantification of Irrigation Water Amounts at 500 m Using Sentinel-1 Surface Soil Moisture, Remote Sens.-Basel, 13, 1727, https://doi.org/10.3390/rs13091727, 2021.
Zappa, L., Schlaffer, S., Brocca, L., Vreugdenhil, M., Nendel, C., and Dorigo, W.: How accurately can we retrieve irrigation timing and water amounts from (satellite) soil moisture?, Int. J. Appl. Earth Obs., 113, 102979, https://doi.org/10.1016/j.jag.2022.102979, 2022.
Zaussinger, F., Dorigo, W., Gruber, A., Tarpanelli, A., Filippucci, P., and Brocca, L.: Estimating irrigation water use over the contiguous United States by combining satellite and reanalysis soil moisture data, Hydrol. Earth Syst. Sci., 23, 897–923, https://doi.org/10.5194/hess-23-897-2019, 2019.
Zhang, K., Li, X., Zheng, D., Zhang, L., and Zhu, G.: Estimation of Global Irrigation Water Use by the Integration of Multiple Satellite Observations, Water Resour. Res., 58, e2021WR030031, https://doi.org/10.1029/2021WR030031, 2022.
Ministerio de Agricultura, Alimentación y Medio Ambiente, Confederación Hidrográfica del Ebro: Plan Hidrológico de la parte española de la demarcación hidrográfica del Ebro 2015–2021. v2.6 Memoria, 2015.
The Spire GNSS-R data are available through the NASA CSDAP and ESA Earthnet programs. https://earth.esa.int/eogateway/missions/spire, https://www.earthdata.nasa.gov/esds/csda/commercial-datasets (last access: 1 November 2022)