the Creative Commons Attribution 4.0 License.
the Creative Commons Attribution 4.0 License.
 | 10 Mar 2023
How to learn more about hydrological conditions and phytoplankton dynamics and diversity in the eastern English Channel and the Southern Bight of the North Sea: the Suivi Régional des Nutriments data set (1992–2021)
David Devreker
This article describes a 30-year data series produced by the SRN (“Suivi Régional des Nutriments” in French; Regional Nutrients Monitoring Programme) network managed by Ifremer. Since 1992, the SRN network has been analysing phytoplankton species and measuring physicochemical (temperature, salinity, oxygen, suspended matter, nutrients) and biological (chlorophyll a, phytoplankton abundance) parameters at 10 different stations distributed along three different transects located in the eastern English Channel and the Southern Bight of the North Sea. This geographic coverage allows for the study of three distinct ecosystems, i.e. three transects (estuary, coastal region under freshwater influence, and coastal region), as well as the investigation of coastal to offshore water gradients. The SRN collects a maximum of 184 samples per year (3687 samples spread over 10 stations during the studied period) and detects up to 291 taxa, including harmful algal bloom species (HABs), with a bi-weekly to monthly sampling frequency (depending on the location and the season). The objectives of this monitoring programme are to assess the influence of continental inputs on the marine environment and their implications for possible eutrophication processes. It also aims to estimate the effectiveness of development and management policies in the marine coastal zone by providing information on trends and/or shifts in pressure, state, and impact variables. The regular acquisition of data allows the establishment of long-term monitoring of the evolution of coastal water quality as well as the observation of the consequences of large-scale alterations mainly driven by climate change and modifications that are more related to local/regional anthropogenic activities. This paper provides an overview of the main characteristics of SRN data (descriptive statistics and data series main patterns) as well as an analysis of temporal trends and shifts. We also propose to the data user a specific numerical tool available as an R package to optimize the data pre-processing and processing steps. Users will then have easy access to statistics, trends, and anomalies as proposed in this paper. The main results of several research projects based on SRN data and dealing with hydrology, phytoplankton blooms, HABs, phenology, and niches are also highlighted, providing the readers with examples of what can be done with such a data set. We hope that this synthesis will also save data users time by allowing them to jump right into a deeper analysis based on previous conclusions and perspectives or to investigate new scientific key challenges. These data should also be used at a wider geographical scale, combined with other data sources, to define more global patterns of environmental changes in a moving world subject to strong anthropogenic pressures. Data can also be used by the remote sensing (ocean colour observation) and modelling communities to calibrate or validate products in this complex and vital coastal region. The SRN data set is publicly available: https://doi.org/10.17882/50832 (SRN – Regional Observation and Monitoring program for Phytoplankton and Hydrology in the eastern English Channel, 2022).
- Article
(2899 KB) - Full-text XML
-
Supplement
(290 KB) - BibTeX
- EndNote


Phytoplankton contribute to the biological pump that regulates the flow of carbon dioxide. This compartment is critically important as it forms the basis of marine food webs. Understanding the structure of this community is essential for any assessment of marine diversity (Garmendia et al., 2013). Hence, maintaining ecosystem goods and services is partly linked to phytoplankton dynamics. There are several thousand phytoplankton species on the planet; the vast majority are completely harmless, but a few hundred can proliferate significantly, forming red, brown, or green waters, a few dozen of which are toxic to marine fauna or humans (e.g. through shellfish consumption, a toxin bioaccumulation process). Some can cause excessive organic matter inputs, well known as foam, which is produced, for example, by the Prymnesiophyceae Phaeocystis globosa and which affects water quality (Lancelot et al., 1994). While some taxa contribute naturally to energy transfers to higher trophic levels, others are responsible for the development of toxic algal blooms that limit grazing (Nejstgaard et al., 2007). Indeed, harmful algal blooms (HABs) can reduce benthic and pelagic biodiversity and disrupt marine ecosystems (Rousseau et al., 1990). They also may lead to the degradation of seafood quality, rendering it unsuitable for human consumption (Berdalet et al., 2016). As a result, any imbalance within the community, such as favouring dinoflagellates over diatoms, will have major effects on the biodiversity of higher trophic levels (Henson et al., 2021) as well as on the quality of the ecosystem in general (Lefebvre and Devreker, 2020). Consequently, such modifications of ecosystem goods and services will lead to several socio-economic consequences.
The observation and monitoring of ecosystem quality is often accomplished by setting up networks to monitor hydrological and biological parameters, which constitute the essential foundation for the overall characterization of the aquatic ecosystem. As a result, the environmental descriptors are numerous and are linked by cause-and-effect relationships; others are directly influenced by anthropogenic activities. Their ability to rapidly respond to changes in their environment allows the evaluation of a response to different sources of pressure. Phytoplankton are regularly used as a water quality indicator for directives and conventions, e.g. the Water Framework Directive, EU WFD, 2000, the Marine Strategy Framework Directive (MSFD – 2008/56/EC), the European Commission MSFD, 2008, and the Oslo and Paris Convention, OSPAR Commission, 2013. The metrics created for their purposes frequently employ phytoplankton biomass, abundance, and composition as well as the frequency and intensity of blooms.
For a long time, the English Channel and the Southern Bight of the North Sea have been subject to intense anthropogenic pressure (fishing, tourism and leisure activities, marine aggregate extraction, maritime traffic, major port areas, degraded estuarine areas, offshore wind turbine projects, etc.) with considerable economic stakes and subject to a diverse range of users with frequently antagonistic interests. The English Channel ecoregion is an epicontinental sea that serves as a transition zone between the Atlantic and North Sea water bodies. The region has a temperate oceanic climate influenced by wet and cold atmospheric currents coming from the Atlantic or more sporadically from the North Sea. It is characterized by its mega-tidal hydrodynamic regime induced by tidal currents. These intense hydrodynamics influence the nature, distribution, and dynamics of sediments as well as the structure, distribution, dynamics, and functioning of biological compartments. In addition, a maritime zone under the impact of freshwater (ROFI: region Of freshwater influence) arises along the French shores of the eastern English Channel, mostly from the Seine River, and whose structure is maintained by contributions from other northern rivers (Somme, Canche, Authie). This structure will play an essential role in controlling the exchange of inert or living particles, organisms between the coast and the open sea (Brylinski et al., 1991).
Phytoplankton data allow us to study harmful algal blooms (HABs), particularly Phaeocystis globosa and Pseudo-nitzschia ones. Since the 1970s, increases in the intensity and duration of Phaeocystis globosa blooms in the North Sea have inspired scientific teams to launch research projects dedicated to this taxon in the context of excessive nutrient enrichment of marine waters (Admiraal and Venekamp, 1986; Cadée and Hegeman, 1986; Eberlein et al., 1985; Lancelot and Mathot, 1985; Lancelot et al., 1997; Lefebvre et al., 2011; Lefebvre and Dezécache, 2020; Rahmel et al., 1995). Phaeocystis globosa was then identified as a potentially harmful taxon (in the HAB sense), not just due to its toxicity, but also due to the huge biomass created during its blooms and its consequences. P. globosa is also likely to produce precursors of dimethyl sulfide (DMS), a gas with a sulfurous and unpleasant odour. It was reported that DMS could cause respiratory, skin, and ocular irritation in humans. It can also be found in the atmosphere and can be favourable to the formation of acid rain. At the end of its very complex, polymorphic development cycle, P. globosa appears in colonial form. These colonies are loaded with mucopolysaccharides. They will break up in response to internal factors (ageing, lysis) and/or external factors (turbulence) and provoke by emulsion the accumulation of a thick, odorous foam on the coast. The Pseudo-nitzschia complex contains species that can produce an amnesic phycotoxin based on domoic acid. During P. globosa blooms, needles formed by Pseudo-nitzschia complex cells can stick into P. globosa colonies (Sazhin et al., 2007). We believe that such a structure may irritate filter feeders. The lesions caused by these structures may promote viral and bacterial infections in fish.
Prior to 1992, French monitoring of phytoplankton populations and the associated environmental factors in the English Channel and the Southern Bight of the North Sea was done episodically via the RNO (Réseau National d'Observation) or the RNC (Réseau National de Contrôle). The Artois-Picardy Water Agency and Ifremer established the SRN (Suivi Régional des Nutriments) in 1992 in response to the need for precise monitoring of nutrient concentration variations over a longer period as well as the response of the environment to this pressure, particularly in terms of phytoplankton development. The objective of this monitoring is to evaluate the influence of continental inputs on the marine environment (nitrogen, phosphate, silicate) and their consequences for possible eutrophication processes. It also aims to estimate the efficiency of wastewater treatment plants and policies for the development and management of the coastal zone and more generally the possible elimination of such discharges. The regular acquisition of data allows the establishment of long-term monitoring of the coastal waters along three transects located off Dunkerque, off Boulogne-sur-Mer, and in the Bay of the Somme, making it possible to pretend to be able to deconvolute the effects of large-scale changes from those linked to more local anthropic activities (Lefebvre et al., 2011).
Since 1992, the SRN data set has included long-term time series on marine phytoplankton and physicochemical measurements along the eastern coast of the English Channel and the French section of the Southern Bight of the North Sea (Dunkerque). SRN data are complementary to the REPHY and REPHYTOX data sets (PHYTOBS, 2021; REPHY, 2021; REPHYTOX, 2021). Phytoplankton data cover microscopic taxonomic identifications and counts, up to the species level, and pigment measures (chlorophyll a and pheopigment). Physicochemical measurements include temperature, salinity, turbidity, suspended matter (organic, mineral), dissolved oxygen, and dissolved inorganic nutrients (ammonium, nitrite + nitrate, phosphate, silicate).
The objective of this paper is to present the SRN data set, from the sampling strategy to the data collection (including the associated quality assurance/quality control steps) and data investigation and storage. The characteristics of the different data sets as well as a general interpretation of their variability will be presented. Based on existing valorizations of the SRN data set, we will demonstrate that these data are of relevance not just for furthering understanding in marine phytoplankton ecology, but also for public policy needs such as assessment of environmental or ecological status as requested by EU directives or regional sea conventions. We also present some numerical tools based on an R package available for the scientific community and developed specifically to rapidly process such data and therefore to valorize the findings.
3.1 Sampling area and sampling stations
The English Channel has a macrotidal regime that ranges from 3 to 9 m in the Dover Strait during neap tide and spring tide, respectively. This regime produces high tidal currents that are basically parallel to the shore as well as a north-eastward tidal residual current from the English Channel to the North Sea. Along the French coast, fluvial supplies dispersed from the Bay of the Seine to Cap Gris-Nez form a coastal water mass that floats nearshore, protected from the open sea by a frontal region (Brylinski et al., 1991). Exchanges between inshore and offshore water masses, as well as particle and nutrient transport, are tide-dependent and are larger during the neap tide than during the spring tide. This may seem counterintuitive, but during the neap tide, the frontal structure between inshore and offshore waters is more sloped from the vertical, resulting in a greater surface of exchange between coastal and offshore waters. This leads to enhanced exchange possibilities between the two water masses (Brylinski et al., 1991).
Three sampling areas along an inshore–offshore transect were studied by Ifremer from 1992 to 2021 (still ongoing) within the framework of the SRN, two of which are located in the eastern English Channel and one in the Southern Bight of the North Sea (Fig. 1).
-
Boulogne-sur-Mer harbour (by the Dover Strait), a coastal zone separated from the open sea by a frontal area (station names: BL1, BL2, BL3)
-
Bay of the Somme, the second-ranked estuarine system after the Seine estuary on the French coasts of the English Channel (station names: Bif, Mimer, Atso, Mer2)
-
Dunkerque harbour, a shallow well-mixed coastal zone near the border between France and Belgium (station names: DK1, DK3, DK4)
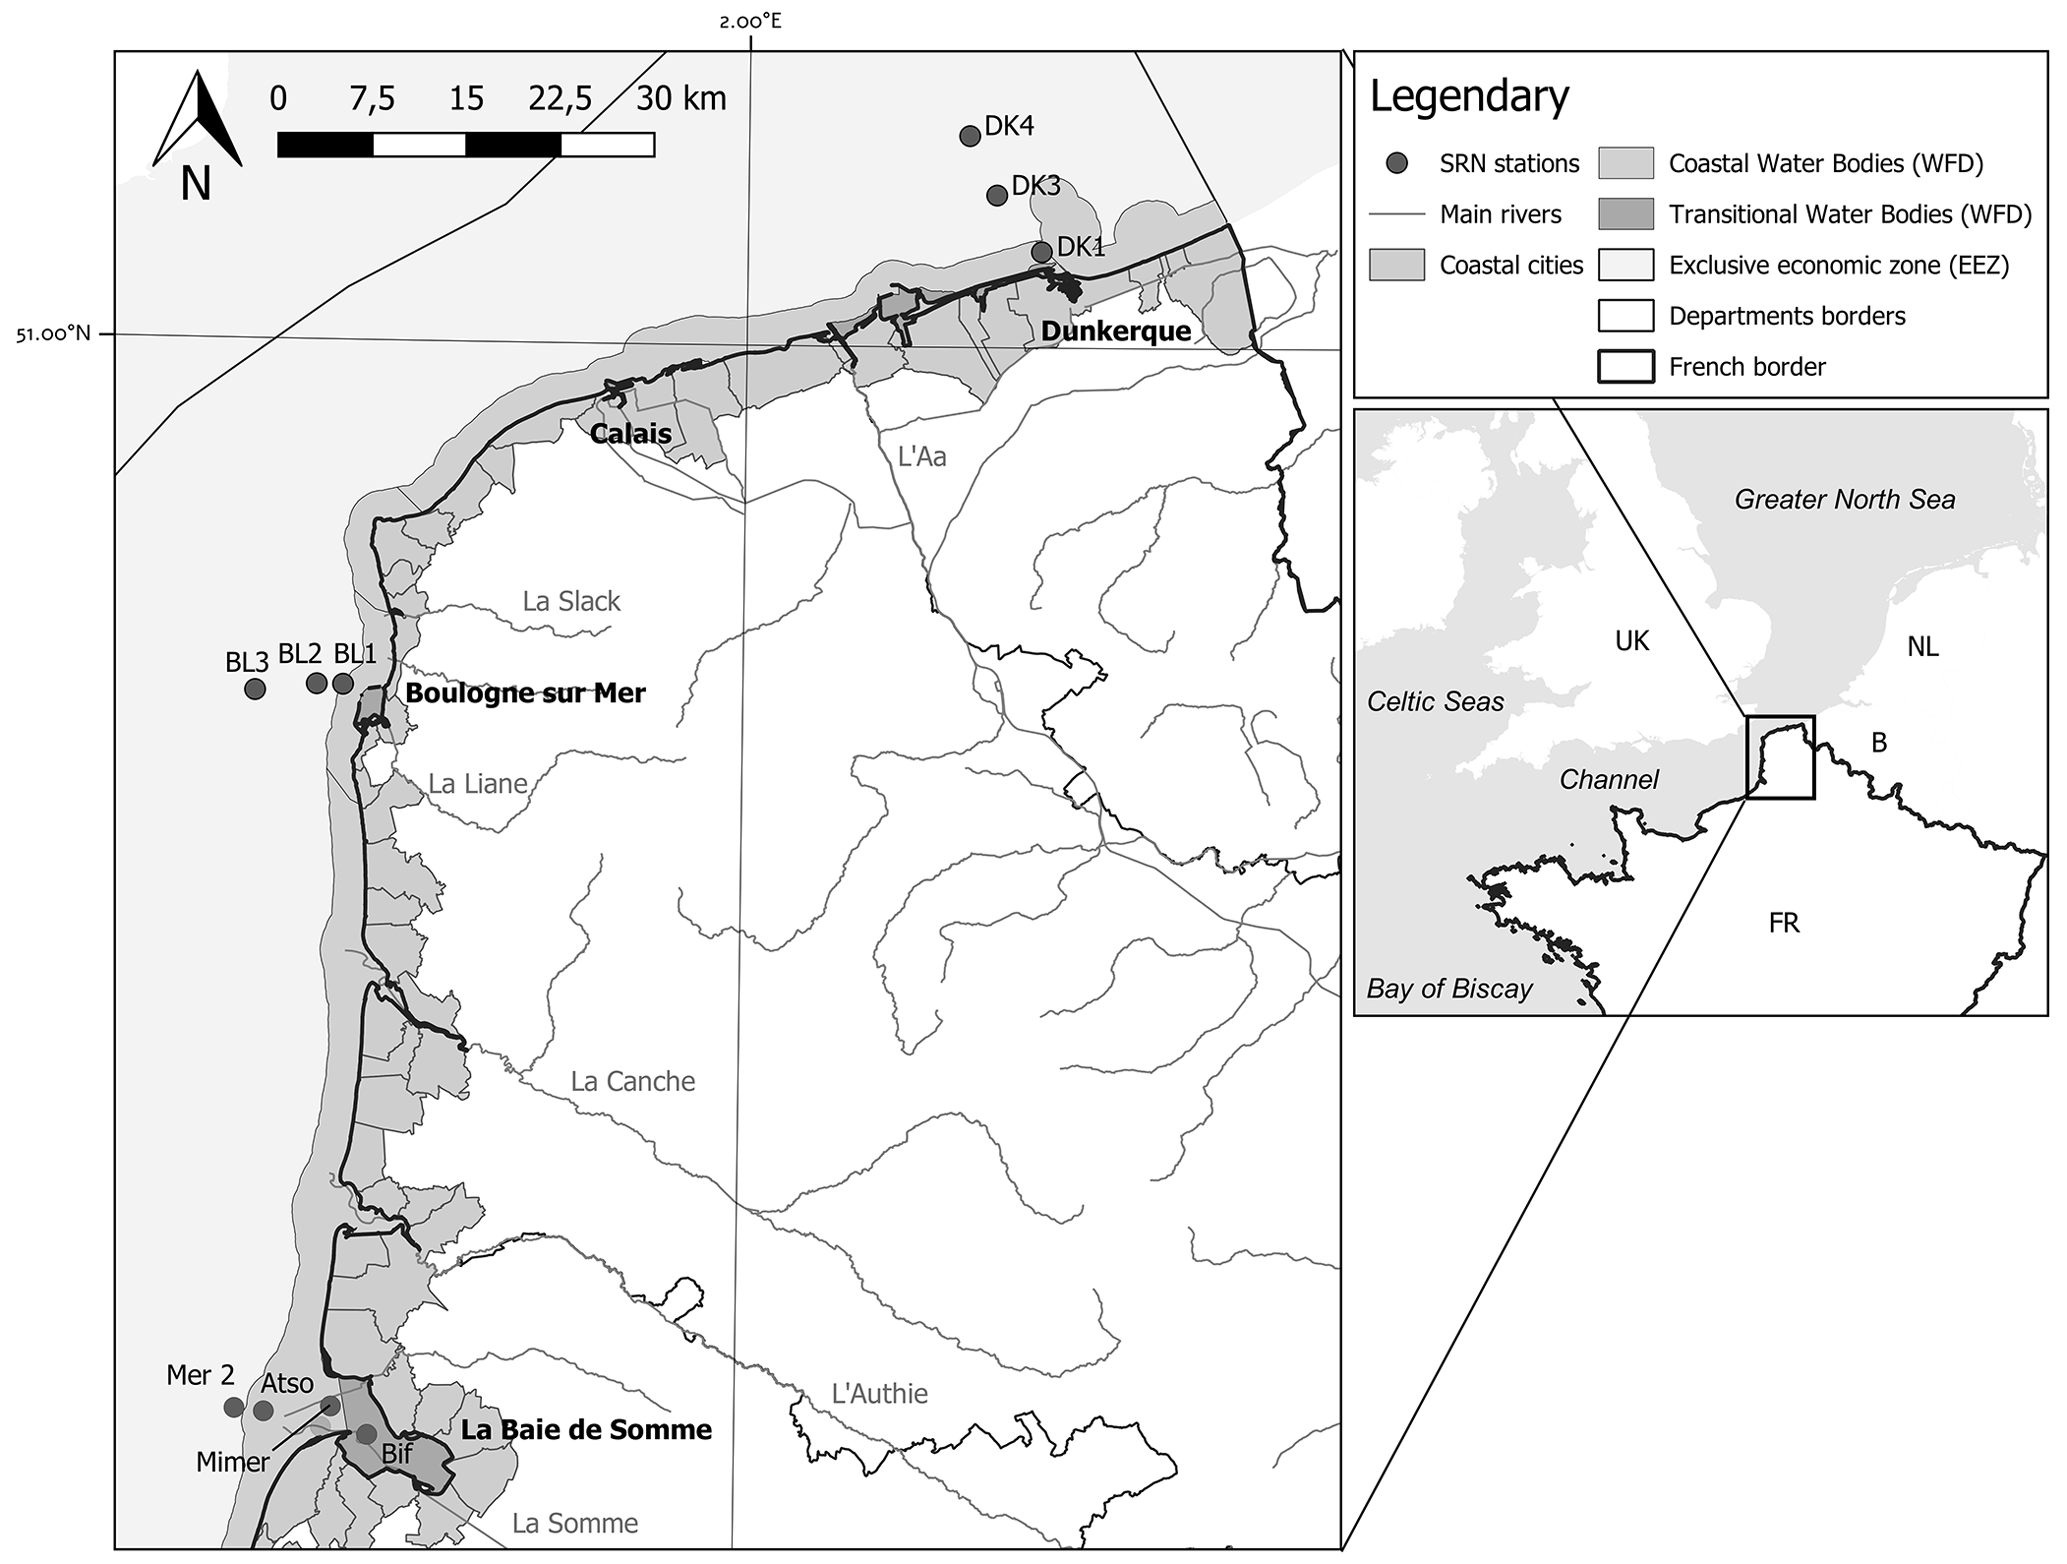
Figure 1Map representing the different transects and sampling stations (Dunkerque, Boulogne, and Bay of the Somme) of the SRN network. The boundaries of the coastal and transitional water bodies of the European Water Framework Directive and the French Economic Exclusive Zone are also indicated.
The database shows another sampling area in the Bay of the Somme, named “SRN Somme mer 1”, but the survey was stopped in 2015. Therefore, these data will not be analysed in the present article, which is related to the 1992–2021 period.
The coordinates of the sampling areas are given in the database in columns “Coordonnées passage: Coordonnées maxx” for longitude and “Coordonnées passage: Coordonnées maxy” for latitude (see the Supplement) and summarized in Table 1.
The positions of the Mimer and Bif sampling stations have slightly changed as a function of the Bay of Somme sedimentary deposition (boat accessibility), and Fig. 1 and Table 1 present the most recent locations.
Table 1Coordinates of the different sampling areas of the SRN monitoring network.

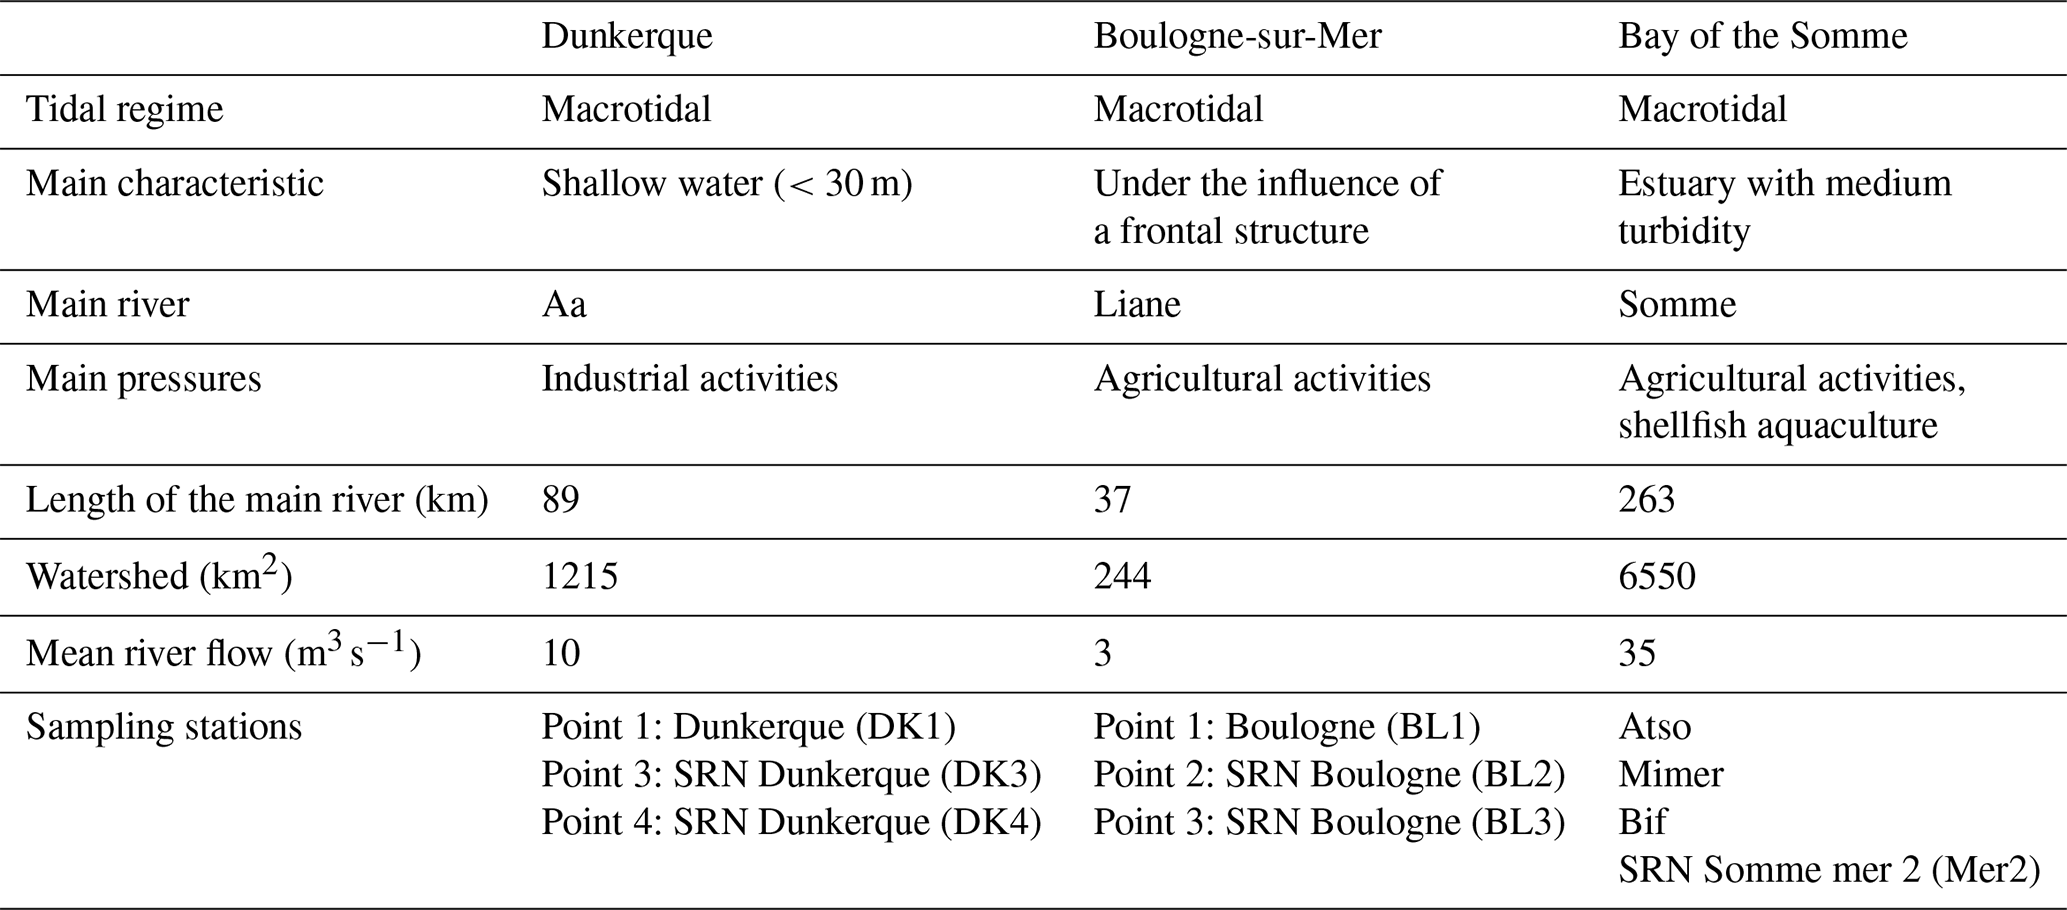
The main environmental characteristics of the areas are summarized in Table 2.
Table 2Main environmental characteristics of the three ecosystems/transects: Dunkerque, Boulogne-sur-Mer, and the Bay of the Somme.
3.2 Hydrology
From March to June, water samples were taken from the coastal stations twice a month from sub-surface waters using a 5 L Niskin bottle and once a month the rest of the year. For the intermediate and offshore stations, a monthly sampling strategy is implemented. Of course, this strategy is subject to adaptation when considering available human resources and/or meteorological conditions, leading to a total number of samples of less than 184 for some years.
Based on water samples, the approach used for chlorophyll-a, ammonia, nitrite, nitrate, phosphate, and silicate analyses is provided by Aminot and Kérouel (2004). Chlorophyll-a concentrations were estimated by spectrophotometry after filtration through glass-fibre filters and extraction with 90 % acetone.
An accurate test of nutrient limitation requires detailed measurements of algal growth under experimental nutrient addition (D'Elia et al., 1986). Nevertheless, in order to determine the potential limitation of primary production by nutrient availability when such experimental results are not available, the standard molar ratios for dissolved inorganic nitrogen (DIN = ammonium + nitrite + nitrate), phosphate, and silicate were calculated and compared according to the references of Redfield et al. (1963) and Brzezinski (1985) for the composition of the biogenic matter ().
Salinity, temperature, and oxygen concentration are measured at the same frequency (twice a month between March and June and once during the rest of the year) during probe casts. For coastal stations, surface and bottom values (∼1 m above the seabed) are kept in the data set. They are used to define bottom oxygen concentrations as requested in the WFD and MSFD for indicator calculation. For offshore stations, only surface values are considered. Our paper focuses only on surface values, but all the data are available from the DOI attached to this paper.
3.3 Phytoplankton
Phytoplankton samples have been collected along transects and were preserved with an acid lugol solution (0.25 %). Sub-samples of 10 mL were settled for 24 h in a counting chamber according to Utermöhl (1958). Cell enumerations were performed by inverted microscopy using a microscope within a month after the sample collection to prevent any significant changes in phytoplankton size and abundance. Except for Phaeocystis globosa enumeration, over 400 phytoplankton cells in each sample were counted with a 20X Plan Ph1 0.5NA objective, resulting in an error of 10 %. This species is reported as the genus Phaeocystis in the database due to national standardization. Nevertheless, for our area, Rousseau et al. (2013) confirmed that P. globosa is the relevant species. For assessment of P. globosa counts, only the total number of cells is computed. A minimum of 50 solitary cells were enumerated from several randomly chosen fields (10 to 30) with a 40X Plan Ph2 0.75NA. Abundance of cells in a colony was determined using a relationship between colony biovolume and cell number defined by Rousseau et al. (1990).
Some harmful algae are also subject to specific surveys during a given risky period. Therefore, those species are part of a pre-defined list that must be checked during enumeration. If any of these taxa are absent from a sample, their abundance is reported as 0 in the database.
Phytoplankton identification is standardized using the WoRMS (2022) database and reaches the level of the species in many cases. However, when the identification is not easy or is subject to caution, a lower taxonomic level is kept in the Quadrige2 database. Some species are also regrouped into “artificial taxa” if they are subject to strong identification confusion from analysts (this is the case for Pseudo-nitzschia or Chaetoceros, for example).
Species' richness calculations are also based on all taxonomic levels.
A further detailed description of the REPHY procedure for phytoplankton identification and enumeration is proposed in Ifremer et al. (2017). The SRN strategy is fundamentally the same.
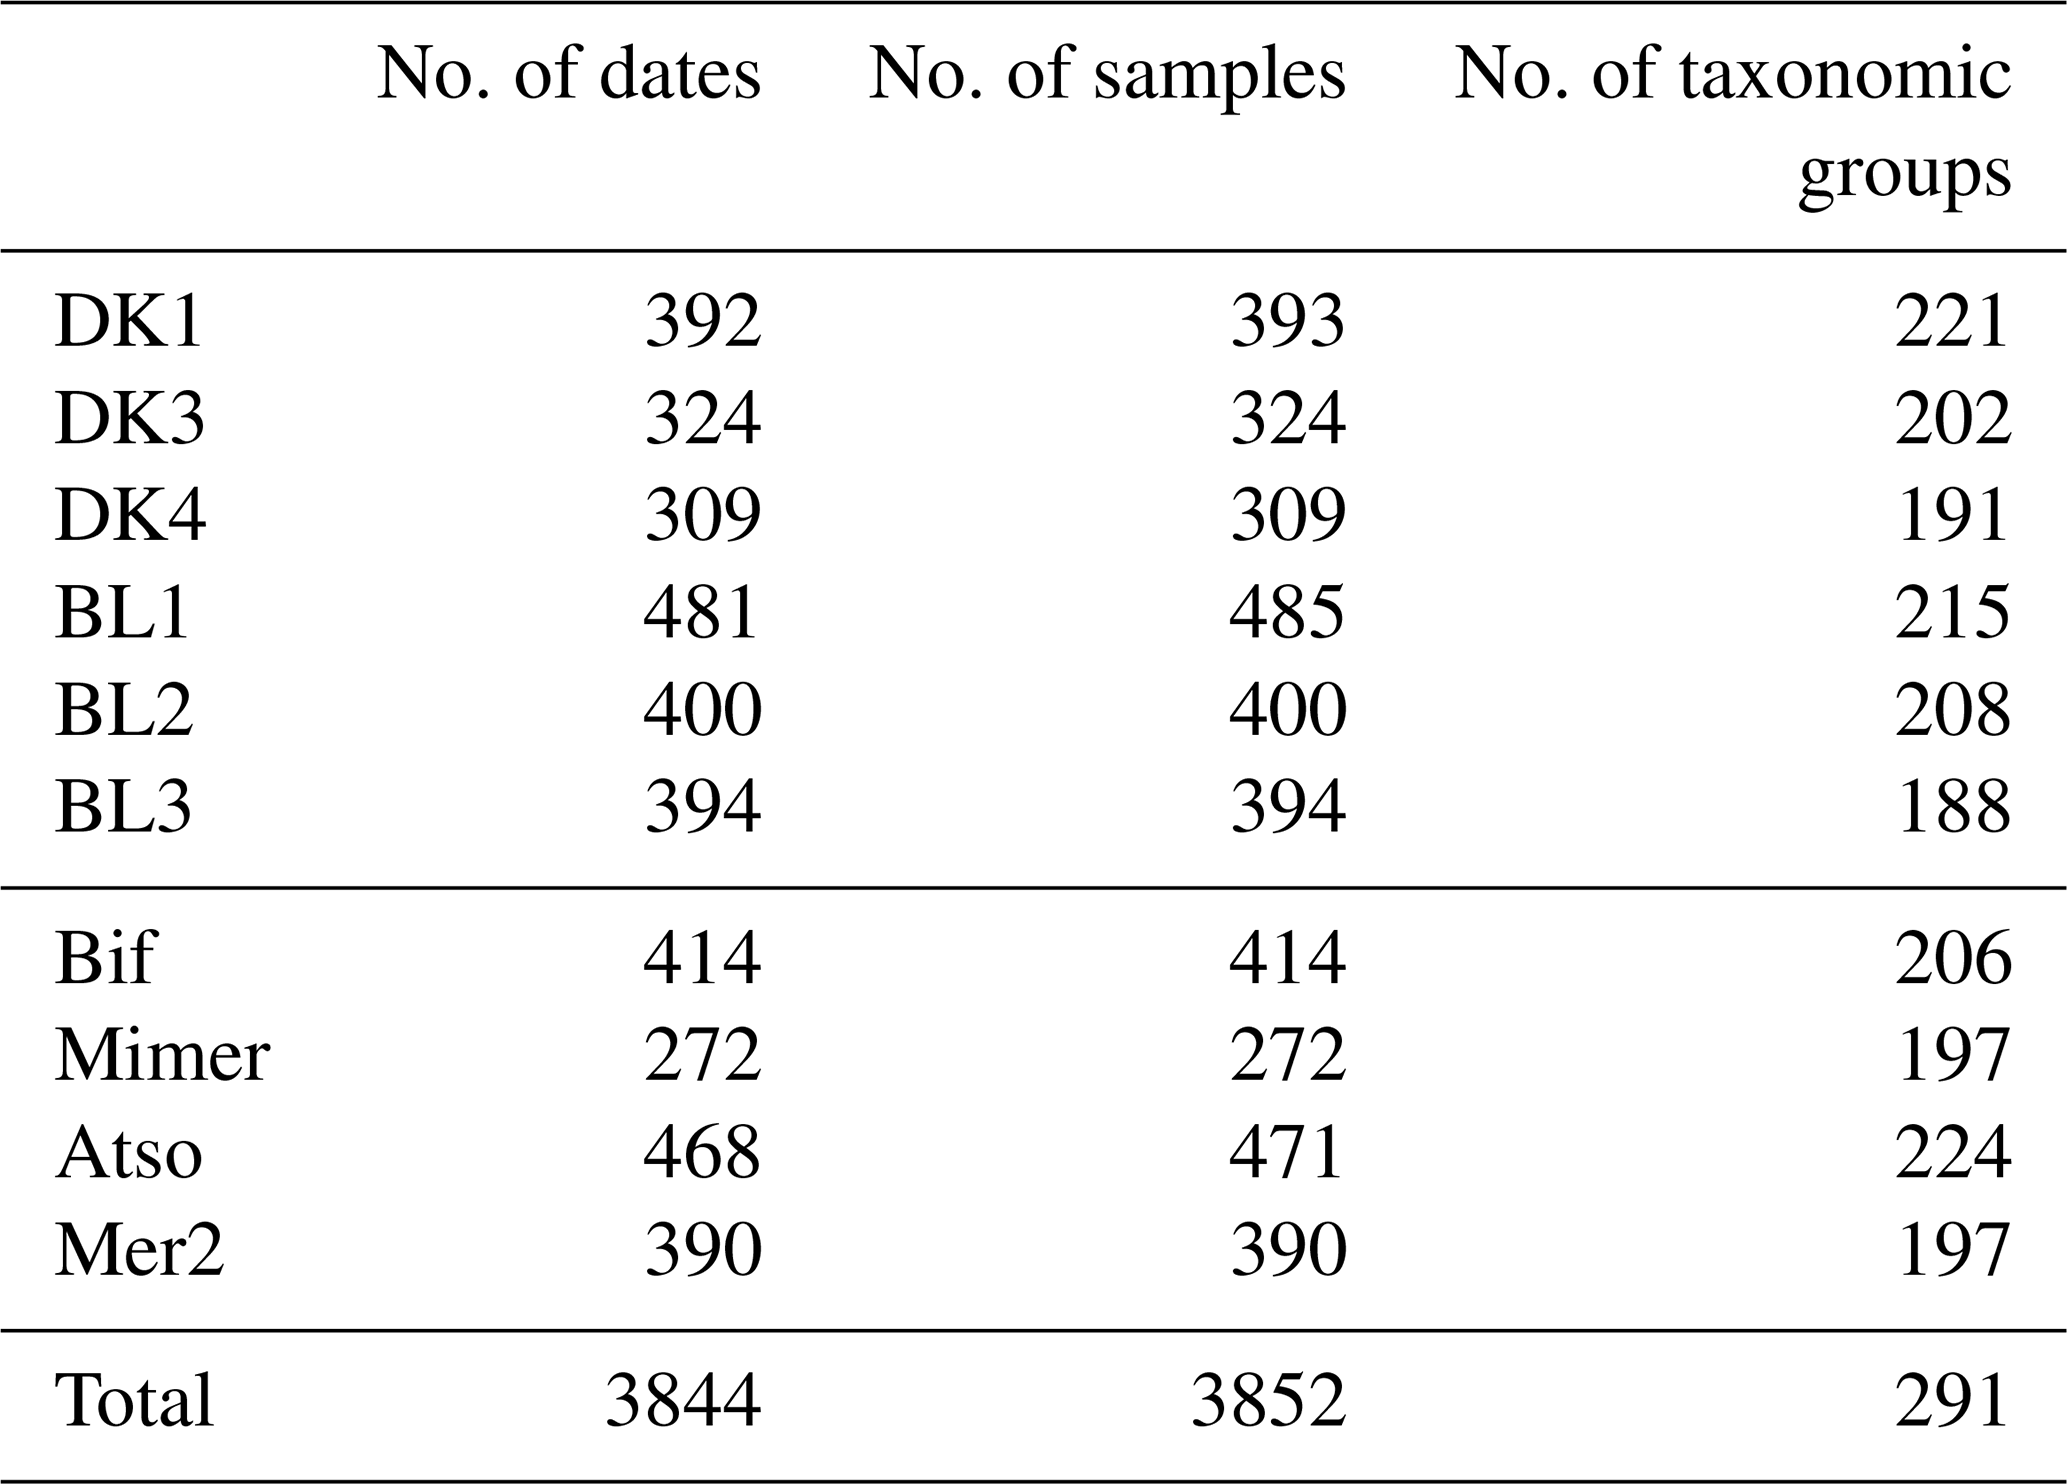
The total number of samples collected for complete determination of the phytoplankton community since the creation of the SRN is shown in Table 3.
Table 3Number of samples of phytoplankton (including replicates by date), number of dates of survey, and number of taxonomic groups (species, genera, or higher) by station between 1992 and 2021 at the different SRN stations.
To manage coastal monitoring data, Ifremer has developed the Quadrige2 information system (https://envlit.ifremer.fr/Quadrige-la-base-de-donnees, last access: 24 January 2023), which combines a database with a variety of interpretation and information product development tools. As an information system, Quadrige2 plays a crucial role in (1) storing basic monitoring data, such as the results of analyses from all monitoring networks, in a safe, optimal, supervised, and scalable manner and (2) interpreting and valuing the data. Once the data have been stored and a quality level assigned to them, they are ready for use in a wide range of applications. As a result, this system is the required link for monitoring data between data collection in the field and their availability in various formats. Quadrige2 has been approved as the national reference information system for coastal waters by the French Ministry in charge of the Environment.
The data sets presented in this article are extractions from the Quadrige2 database. The data come in two different files: one with hydrochemical parameters and chlorophyll-a concentrations, containing 57 columns and 54 578 rows, and another with phytoplankton abundance data, containing 55 columns and 98 904 rows. These data are available as a csv file with a semi-colon separator. They are American National Standards Institute (ANSI)-encoded and points are used as decimal separators.
Moreover, the database header's columns are in the French language (Quadrige2 is a French national database). The French–English translation is given in Supplement file S1. In addition, a complete description of the header is given in Ifremer (2017).
Physicochemical and phytoplankton data are being given and made available over the 1992–2021 period because the database is up to date until 2021 at the time the article is written. Because the database is updated annually, future users are likely to download a data set with additional years of data than the actual one. Former data sets (associated with the oldest DOI as found in previous articles) are still available on user demand.
The phytoplankton database contains three different kinds of cell enumeration: FLORTOT, FLORPAR, and FLORIND. In the column “Résultat : Code parameter”, FLORTOT means that all taxa contained in the samples were identified, FLORPAR means that only some dominant taxa were identified when abundance >100 000 cells L−1, and FLORIND means that only indicative HAB taxa (Dinophysis sp., Alexandrium sp., and Pseudo-nitzschia complex) were identified. For species richness indices and phytoplankton community distribution, only FLORTOT results were considered.
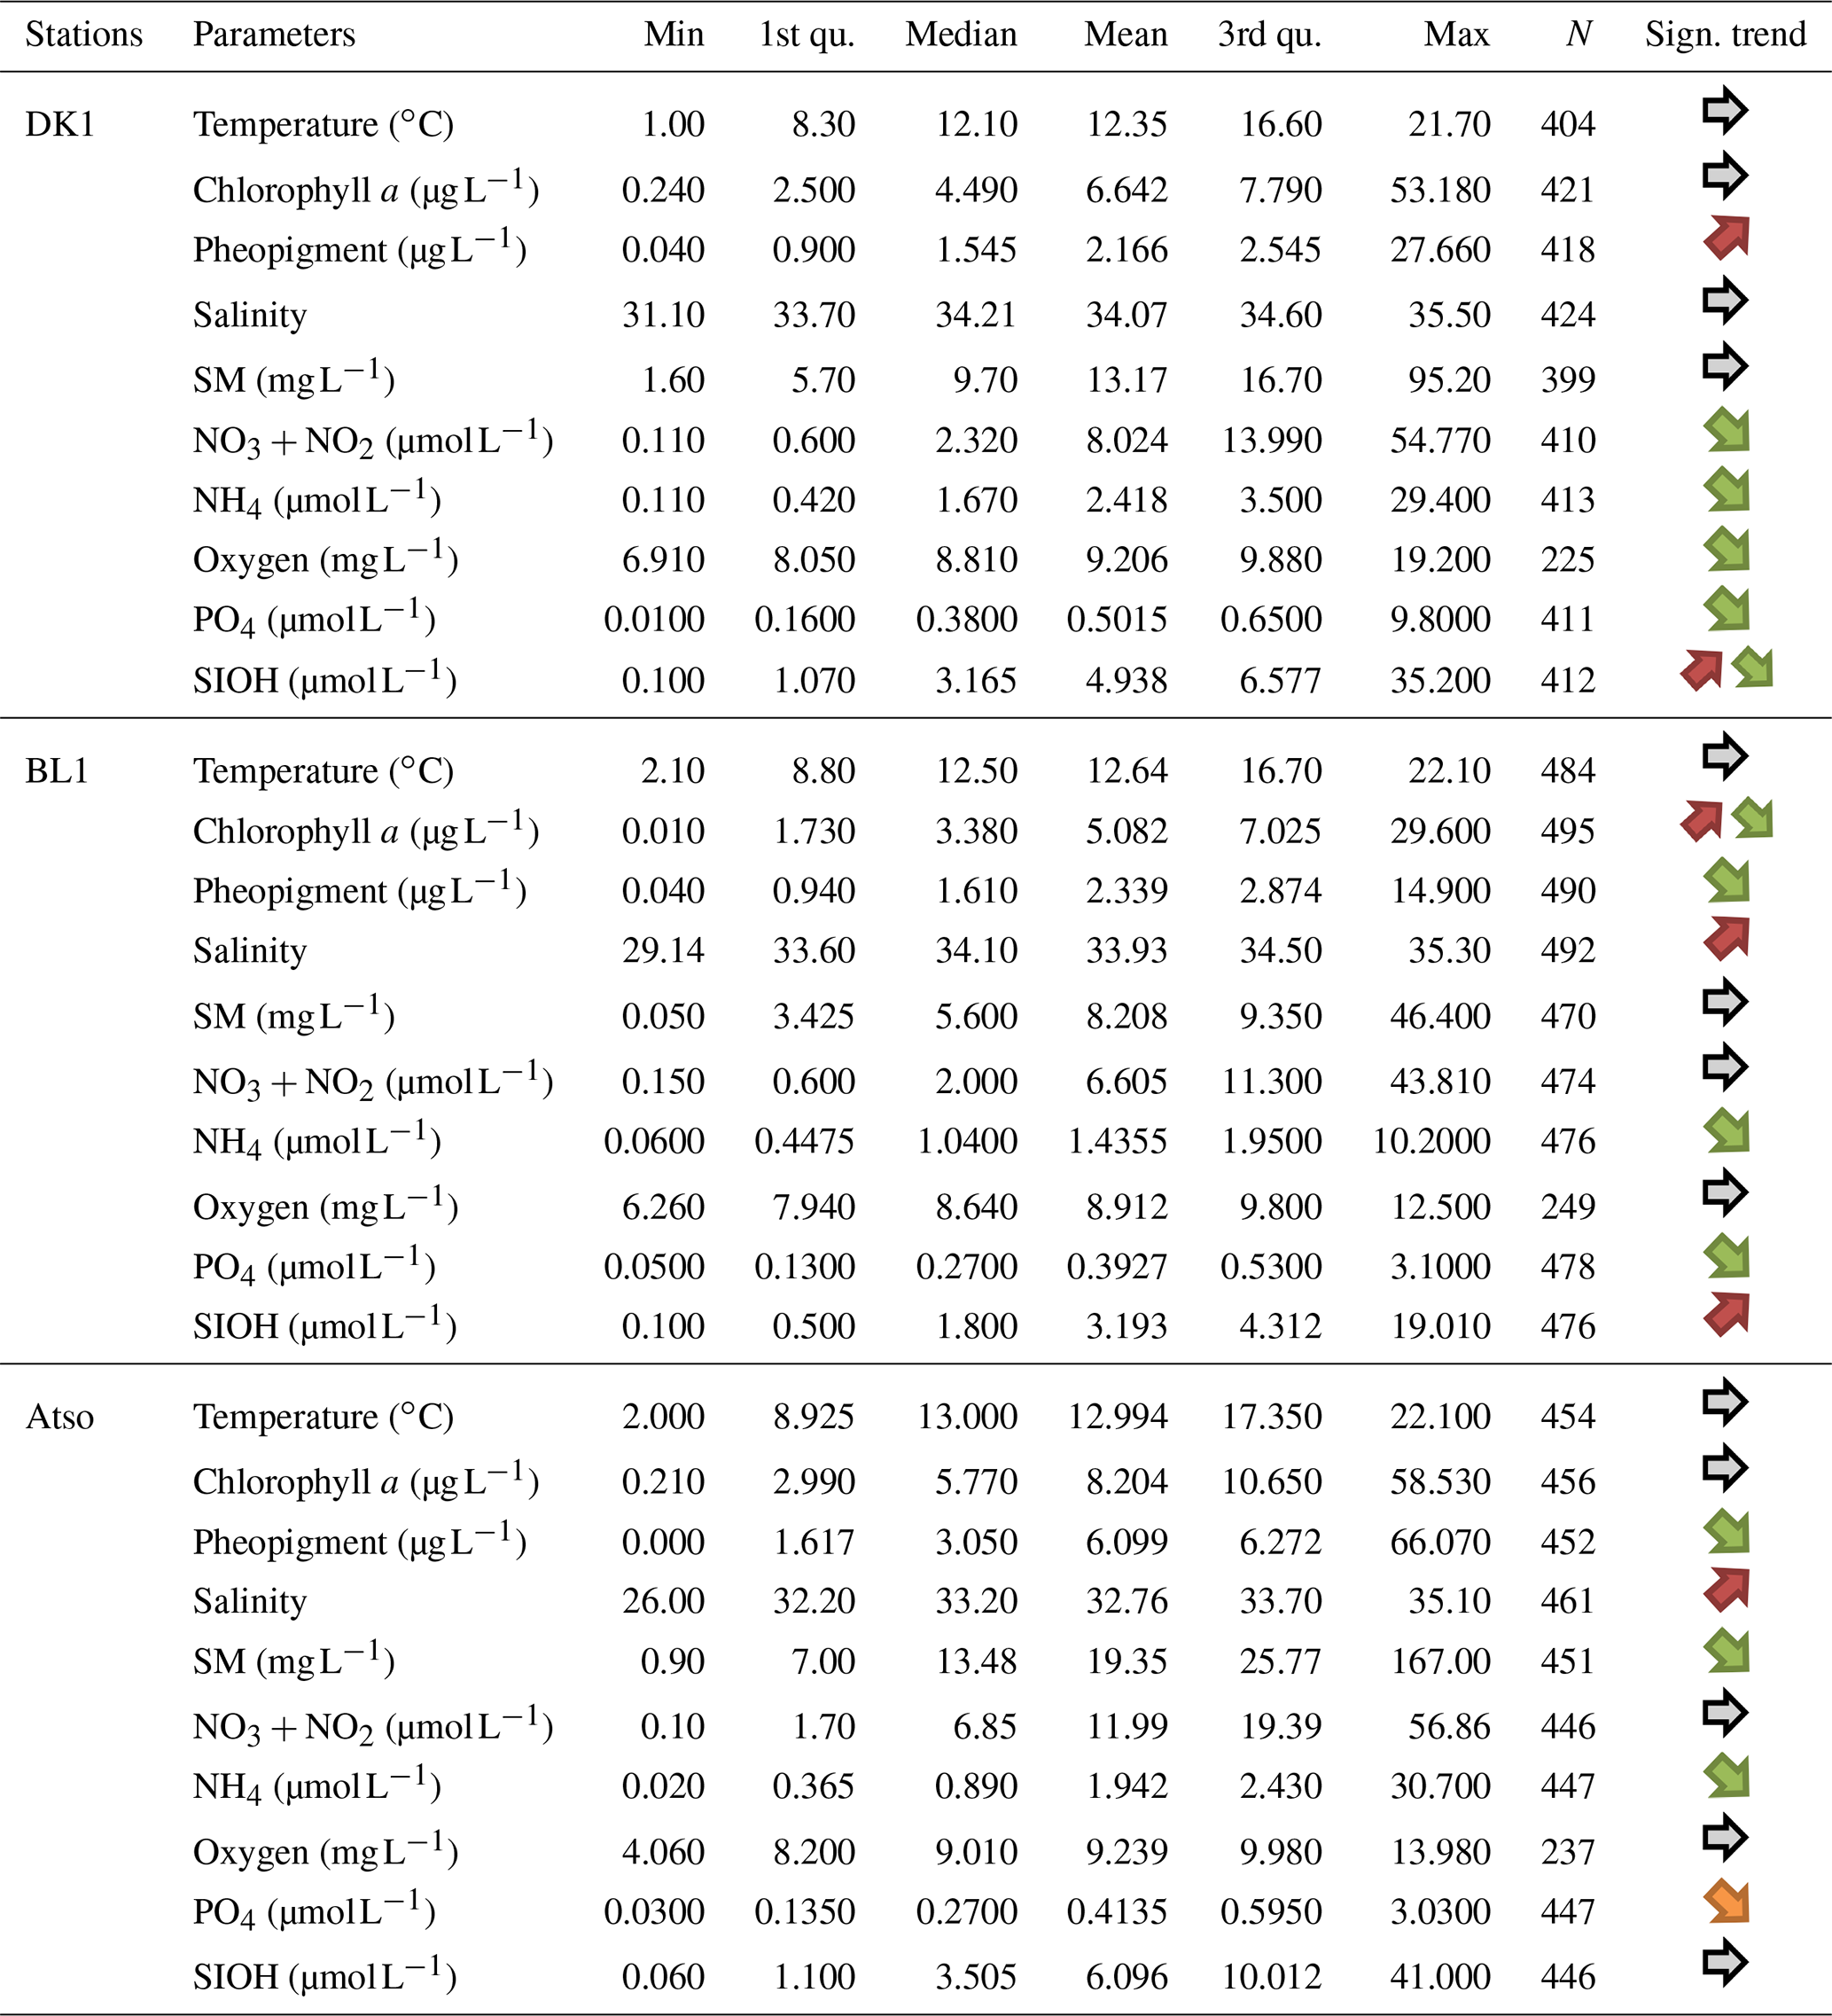
Table 4Statistical summary (minimum, first and third quantiles, mean, median, maximum, length of the data series) for the physicochemical and biological variables collected within the SRN monitoring programme in the time span 1992–2021 and for coastal stations only (DK1, BL1, Atso). Increasing or decreasing monotonous1/non-monotonous2 trends are indicated in the “Sign. trend” column (1: one orange (green) arrow for an increasing (decreasing) monotonous trend – 2: two arrows for a non-monotonous trend (shift in the time series) – a grey arrow indicates no significant trend).
5.1 Data validation
The data are collected in the field and/or laboratory and then entered into the Quadrige2 database using an application with the same name. The control entails modifying the data entered (results and metadata) to ensure that they are consistent with the benchbook (or field sheets). After this check is completed and any necessary corrections are made, the data are validated.
-
Confirmation of the technical validity of the data which correspond to the result of the analysis.
-
Data locking, so that they can no longer be edited, even by the person who entered them.
-
Data distribution: verified data may be taken and disseminated by all Quadrige2 users who have access to the database.
5.2 Data qualification
This initial round of data verification is followed by the qualifying procedure, which corresponds to
-
the search for questionable or even scientifically aberrant data,
-
the correction of data when possible, and
-
the attribution of a qualification level to the data, which is
-
good: data analyses are scientifically relevant,
-
doubtful: the data may be false (taking this into account may bias the analysis that will be made), and
-
false: the data should not be included in the analysis because they are aberrant or present a problem (e.g. bad analytical series and impossible to repeat).
-
The level of qualification corresponds to the level of confidence in the data. It determines the way in which the data are distributed (only data qualifying as “good” and “doubtful” are distributed) and how they are used in specific data processing. The qualification is broken down into two main steps.
-
An “automatic” qualification that consists in looking for “gross” and easily identifiable errors
-
An “expert” qualification, which consists in highlighting statistically aberrant data via adapted methods (time series analysis, statistical tests, etc.). Only data qualifying as “good” or “doubtful” from the previous step are used for the expert qualification.
Table 4 represents the descriptive statistics obtained for each physicochemical and biological parameter (excluding phytoplankton) and for each SRN station. For each of these series, the monotonic trend is estimated using a non-parametric method and a Mann–Kendall seasonally adjusted autocorrelated series test (Devreker and Lefebvre, 2014).
The seasonal variability of phytoplankton populations corresponds to maximum abundance in spring and then a decrease in winter. This trend can be variable depending on the sites (different hydrodynamical conditions) and the environmental characteristics encountered (luminosity, nutrient inputs, etc.). The water masses sampled appear to be poorly structured vertically, while significant coastal to offshore gradients are evident. Most of the time, the water masses are homogeneous. The few vertical temperature variations are low, even at the coast, where the mixing of freshwater and salt water is likely to create stratification. This is, in any case, negligible compared to the horizontal heterogeneity. The possibility of vertical stratification is more likely in the Bay of the Somme. Thus, the general dynamics of the eastern English Channel and Southern Bight of the North Sea ecosystem represent the classical functioning of a temperate system (Wafar et al., 1983; Gentilhomme and Lizon, 1998). The seasonal cycles of nutrients and phytoplankton biomass are well defined. Inter-annual variability is high. The homogeneity of the sampling conditions makes it possible to avoid normalizing the results of nutrient concentration by salinity for the purpose of inter-site comparison. The analysis of the results shows a monotonic decreasing trend of phosphate concentration for all the studied sites, while silicate concentrations are relatively stable (except when considering inter-annual variability). The dynamics of nitrogen and phytoplankton biomass are far more complicated to handle, and such monotonic trends are not identifiable. These results may alter the values of the stoichiometric ratios and Si:P (N: total nitrogen; P: phosphate; Si: silicate) (Redfield et al., 1963; Brzezinski, 1985). Phytoplankton growth appears to be primarily limited by P and Si (for diatoms only). This notion of limiting phytoplankton growth and its consequences for phytoplankton communities deserves particular attention in a system bordered by coastal marine regions where eutrophication problems are of great importance (Bay of the Seine and the North Sea) (Lefebvre and Devreker, 2020). Indeed, considerable changes in phytoplankton productivity, abundance, dominance, and succession have been observed in recent decades as a result of increased human stresses, particularly nutrient inputs (Billen et al., 2005; Gypens et al., 2013).
For a particular site, phytoplankton counts shows high seasonal, inter-annual, and spatial variability (Figs. 2 and 3). Maximum abundances are measured between March and June, mainly due to the presence of Phaeocystis globosa, which dominates the phytoplankton population. Diatoms and dinoflagellates make up the majority of the community over the rest of the year. Lower diversity indices also characterized the spring period (April and May) since P. globosa dominates the community (Fig. 4).

Figure 2Inter-annual variability of major phytoplankton groups (Prymnesiophyceae, Bacillariophyceae, and other phytoplankton) at the three coastal SRN stations: (a) Dunkerque (DK1), (b) Boulogne-sur-Mer (BL1), and (c) Atso in the Bay of the Somme. Vertical bars represent the relative abundances of these groups (%) and the black line the mean annual total abundance (105 cells L−1).
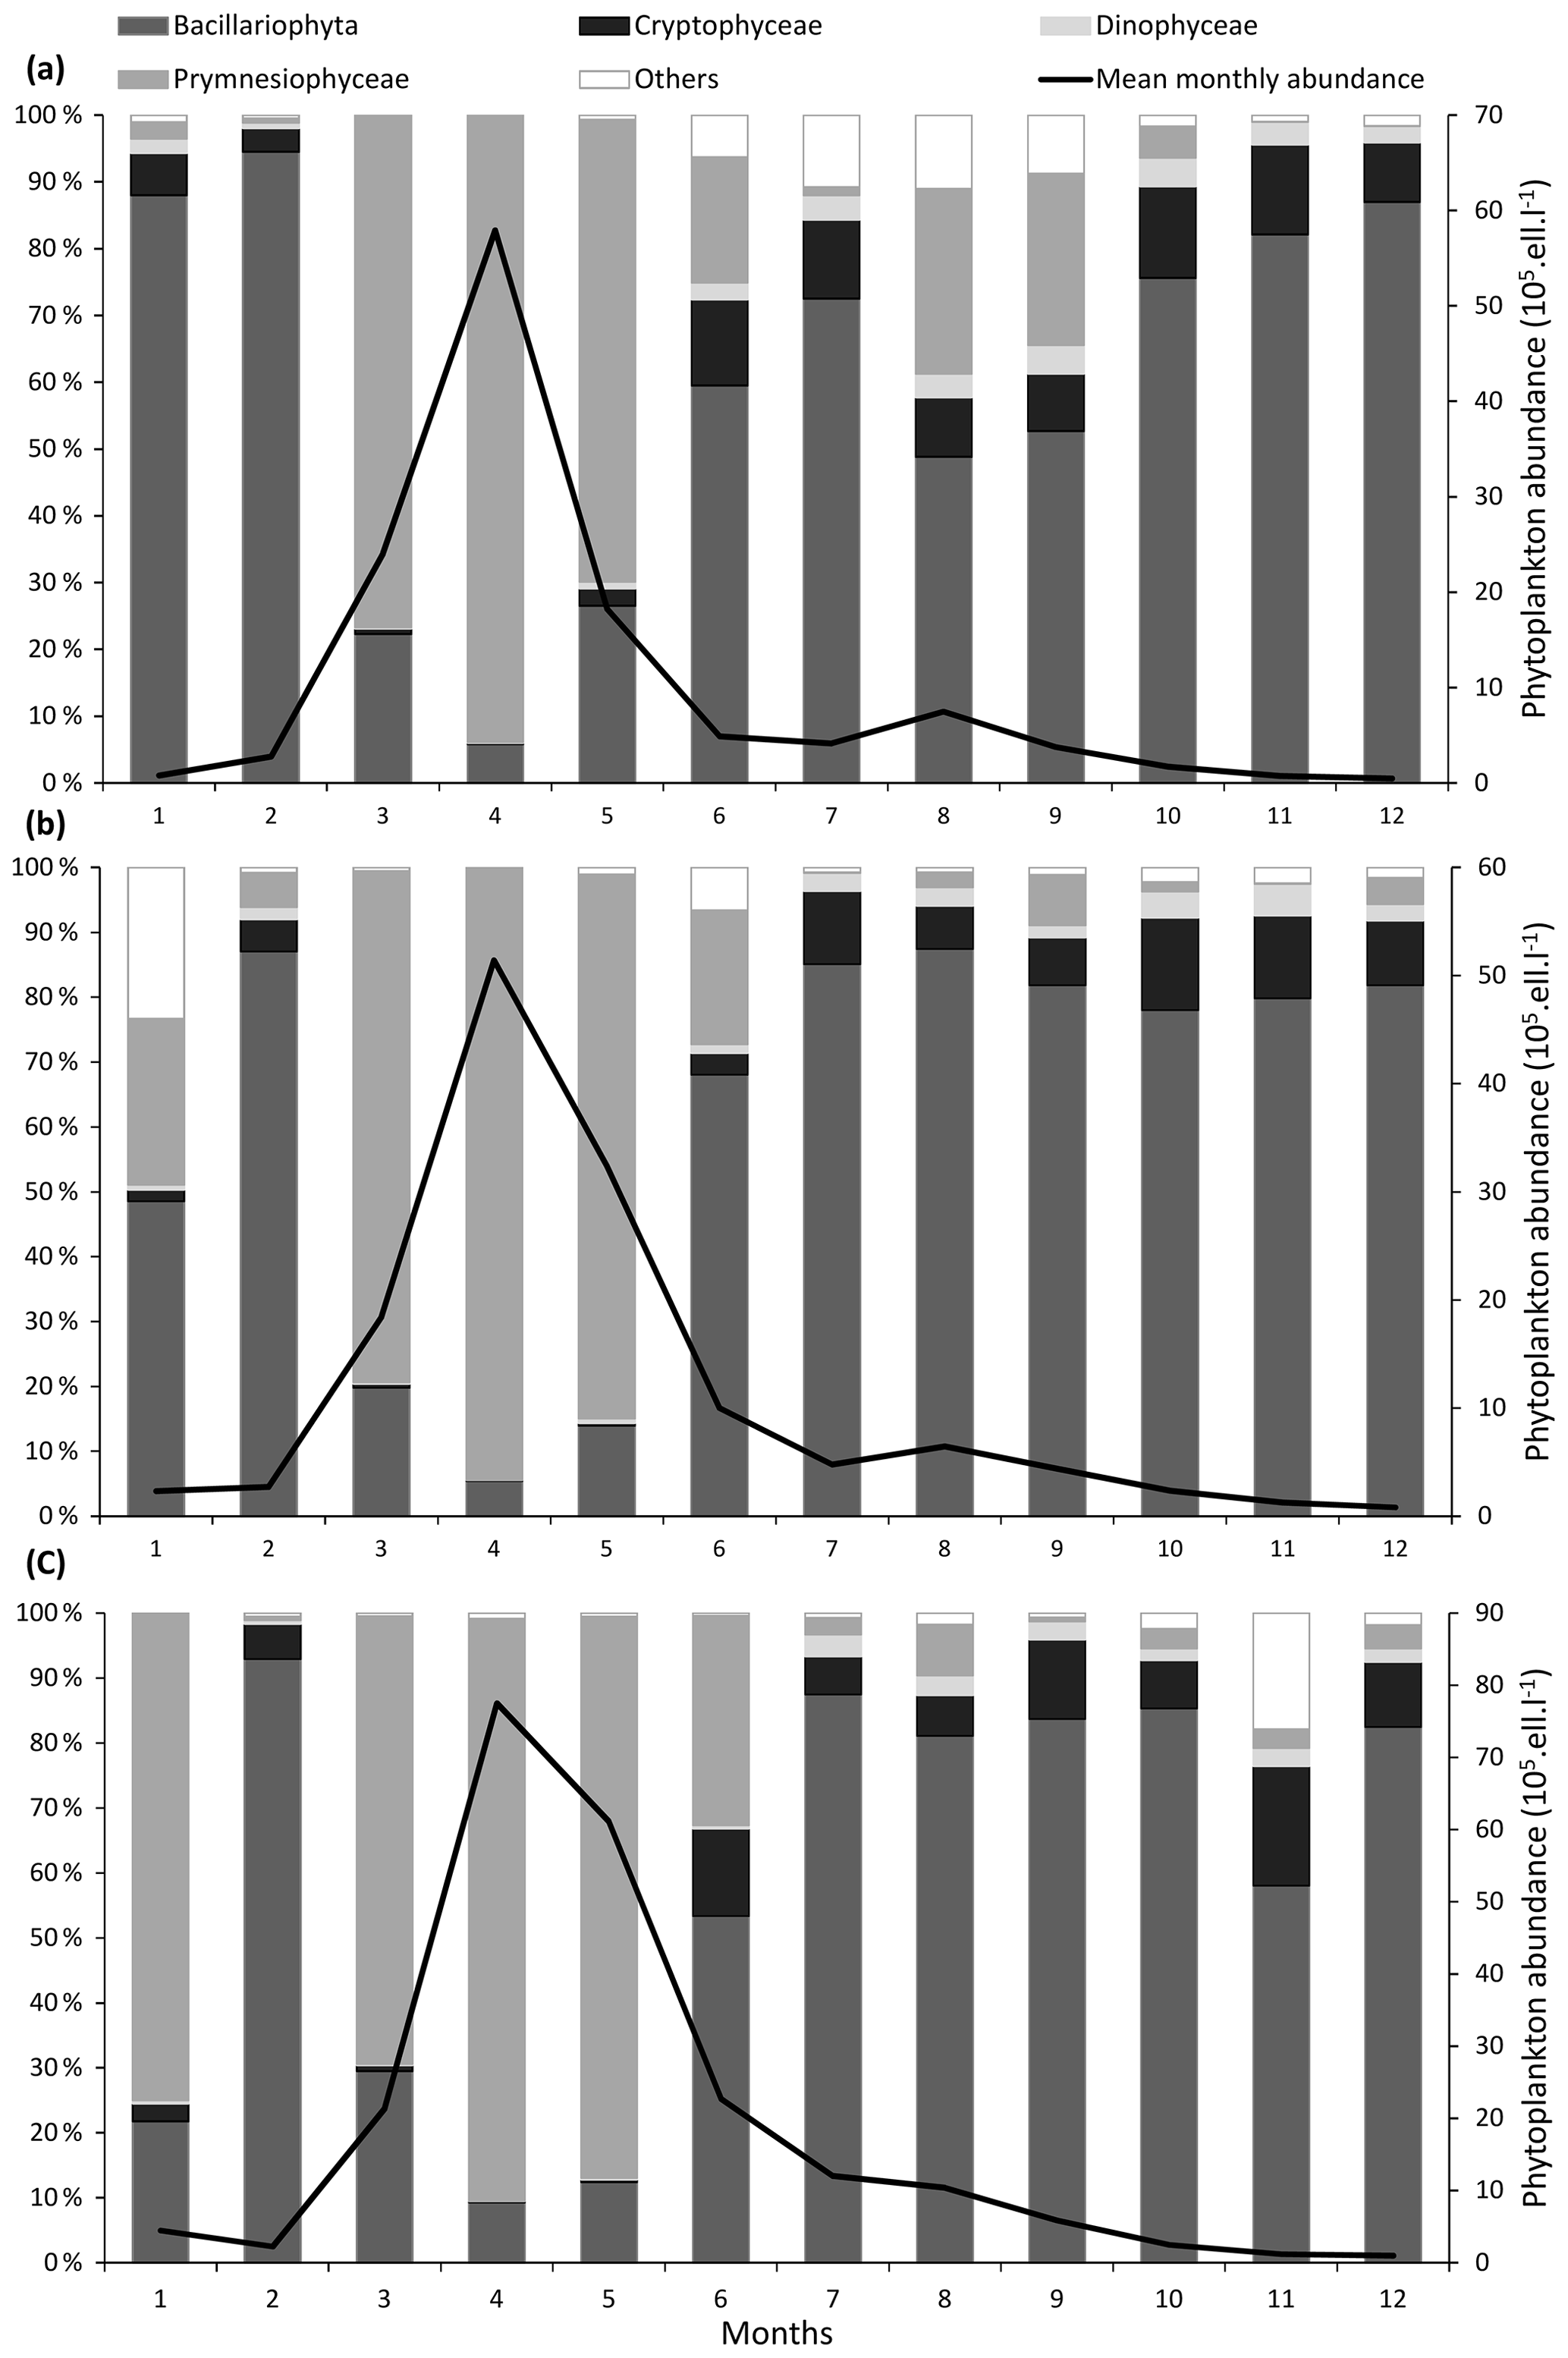
Figure 3Seasonal variability of major phytoplankton groups (Prymnesiophyceae, Bacillariophyta, Dinophyceae, Cryptophyceae, and other phytoplankton) at the three coastal SRN stations: (a) Dunkerque (DK1), (b) Boulogne-sur-Mer (BL1), and (c) Atso. Vertical bars represent the relative abundance of these groups and the black line the mean monthly total abundance.
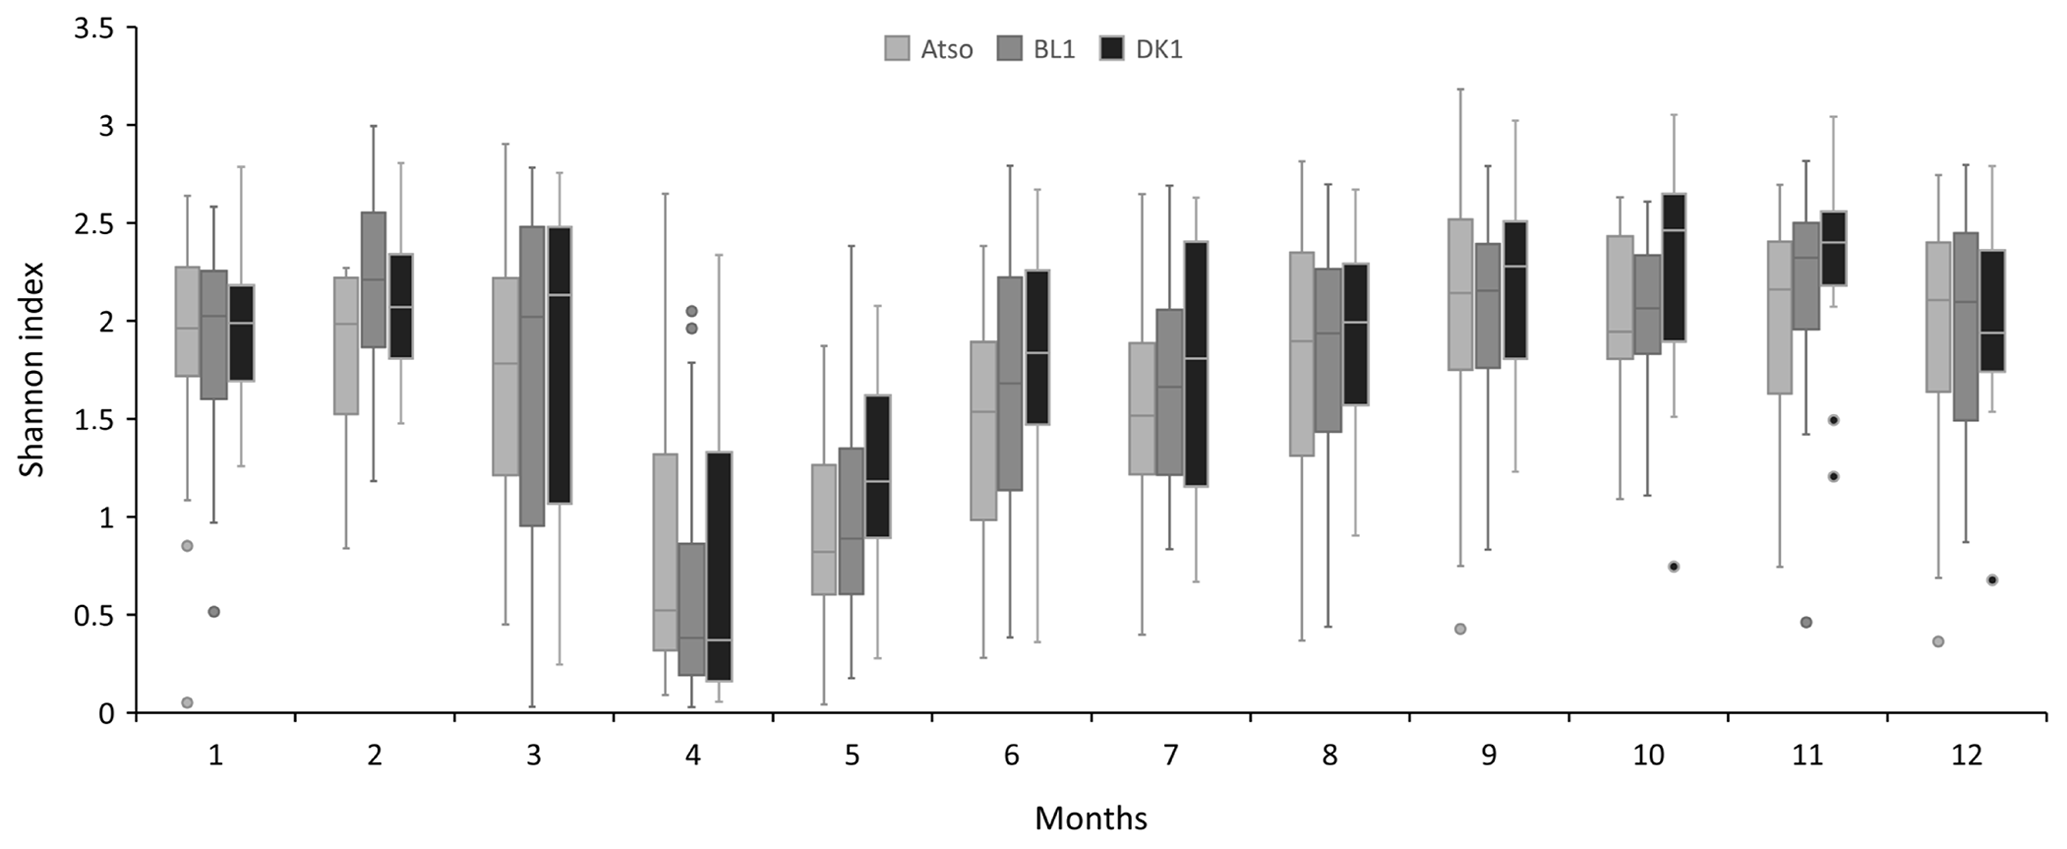
Figure 4Mean seasonal variation (monthly scale) of the Shannon entropy index at the different coastal stations (Atso, BL1, DK1).
Between March and June, the Prymnesiophyceae Phaeocystis globosa is sampled on a regular basis at all the sites, and its concentration can exceed 1×10⁶ cells L−1 (Fig. 2). During the rest of the year, some isolated cells may be detected. The Bay of Somme area had the highest concentration from 1992 to 2007, with more than 48×106 cells L−1 at its peak. Likewise, maximum concentrations on the Dunkerque and Boulogne-sur-Mer transects are high, but to a lesser extent, reaching over 29×106 and 28×106 cells L−1, respectively.
The genera Alexandrium, Dinophysis and Pseudo-nitzschia, which are potentially responsible for the production of the PSP (paralytic shellfish poison), DSP (diarrheic shellfish poison), and ASP (amnesic shellfish poison) toxins, respectively, are regularly observed from the water samples at the monitoring sites. It is worth noting that, even when the cell densities of these toxic genera exceed the alert thresholds, toxin analysis of shellfish collected from the same area affected by this bloom can be surprisingly negative. In the investigated regions, toxicity seems to be only a potential that is not expressed, maybe because of unfavourable environmental conditions.
Figure 5 depicts the seasonal variability of the data. Despite the fact that the series shows drastically varied values depending on the station, the inter-seasonal variability for each of the characteristics depicted remains constant. In fact, nutrient concentrations are at their highest in winter. Phytoplankton that consume these nutrients increase during the spring, which explains why chlorophyll-a concentrations (a proxy for phytoplankton biomass) peak, reaching their annual maximum, while oxygen concentrations decline, reaching their annual minimum. At the end of summer, chlorophyll-a concentrations begin to diminish, while nutrients begin to replenish, eventually reaching high quantities in the autumn. On the other hand, the temperature shows a classical variability of temperate marine waters, with however some extreme values close to 0 and above 20 ∘C.
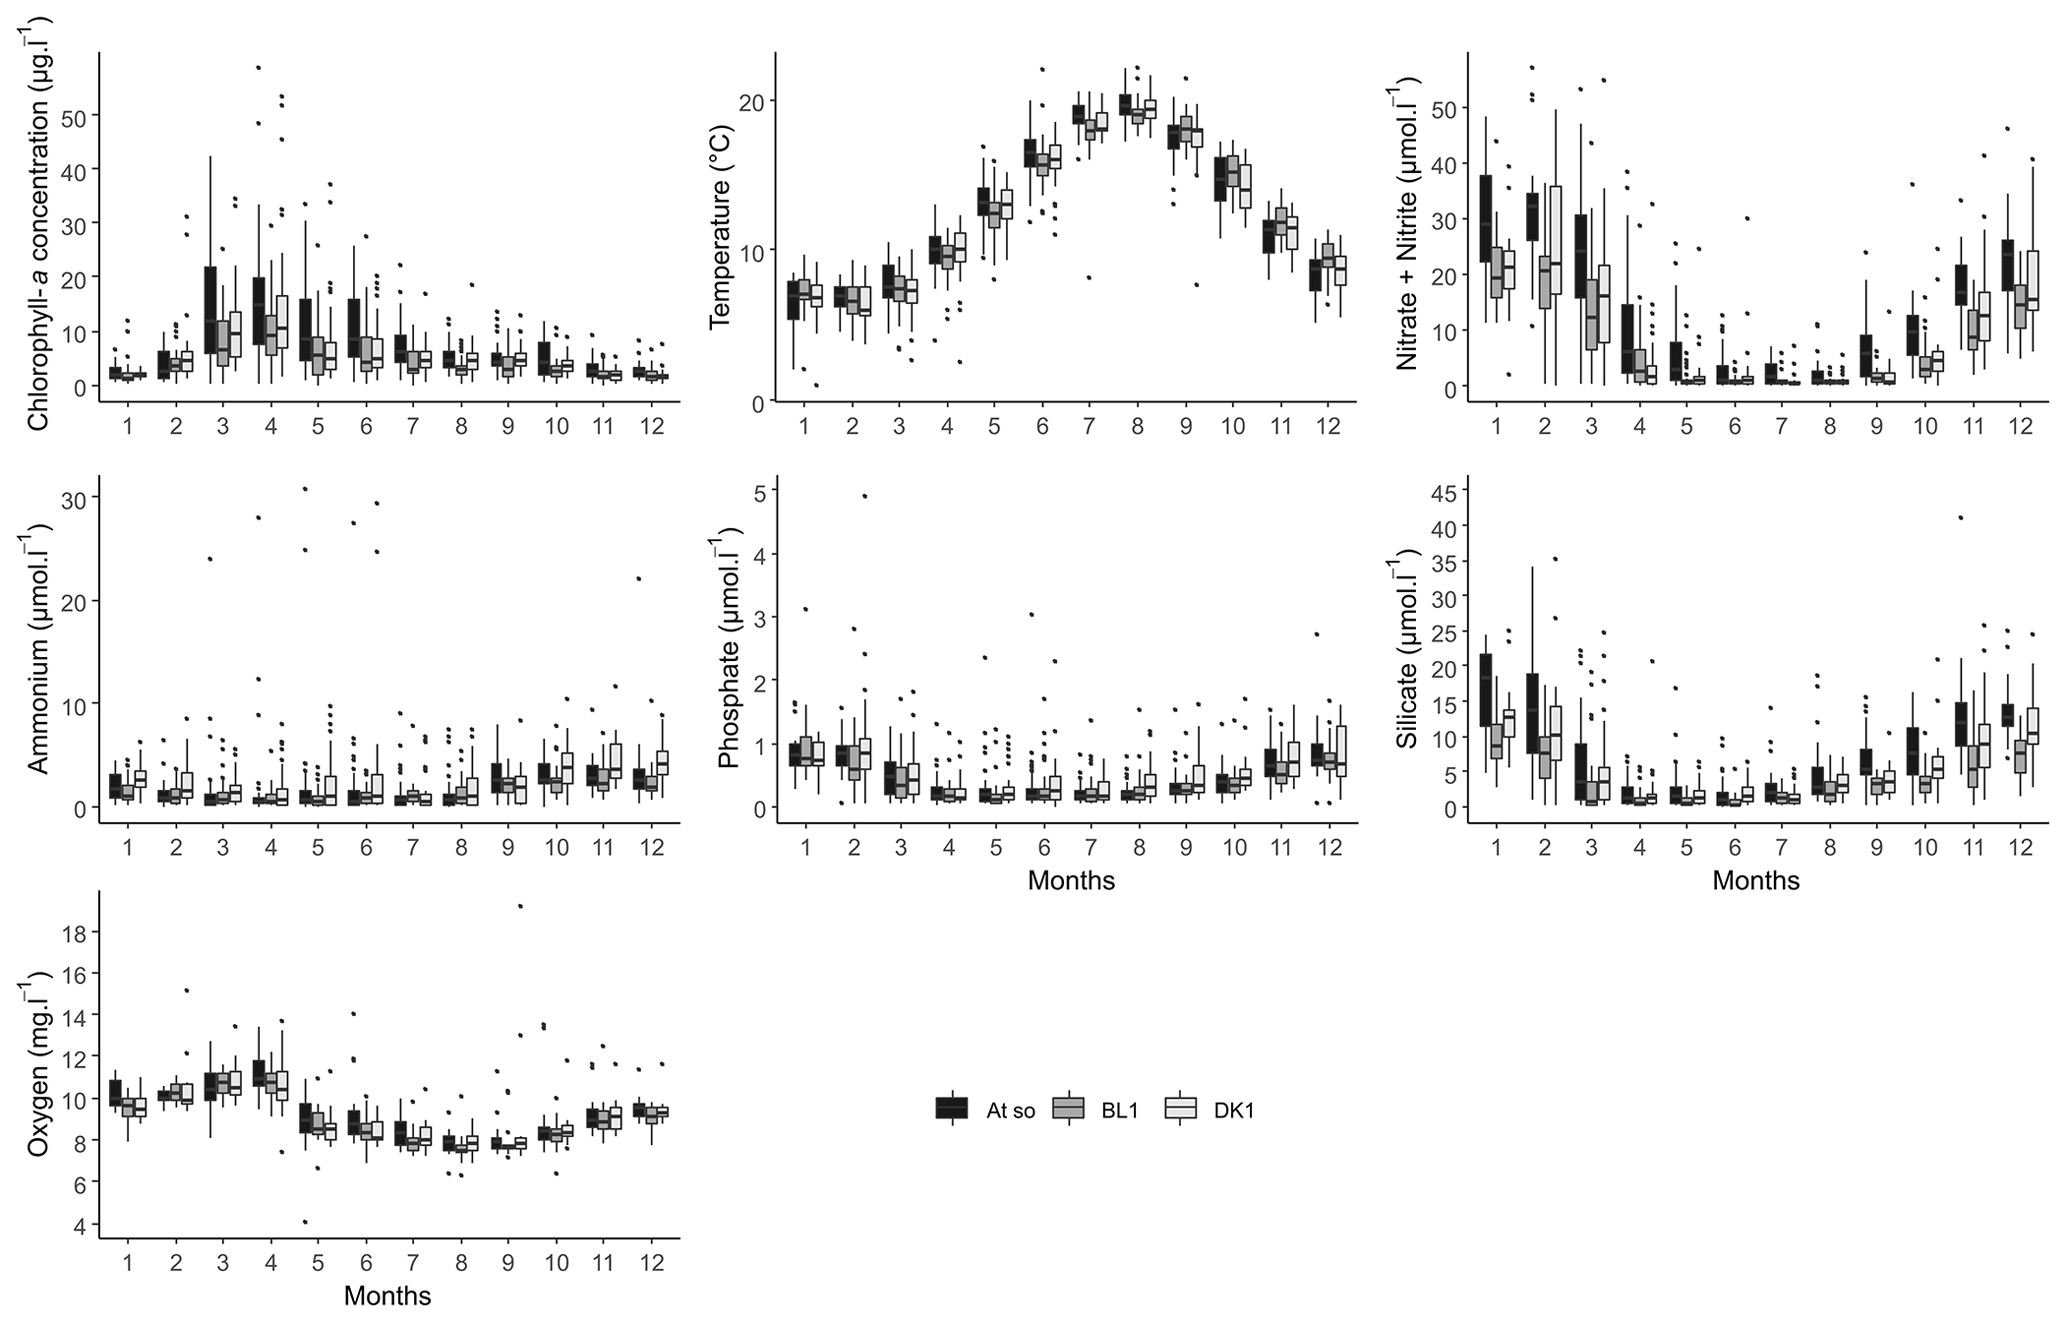
Figure 5Monthly box-and-whisker plots of the main physicochemical parameters for the three coastal stations (DK1, BL1, and Atso) of the SRN network for the period 1992–2021.
Figure 6 shows the calculated monthly-scale anomalies for temperature, chlorophyll-a concentration, and nutrients at each SRN coastal station.
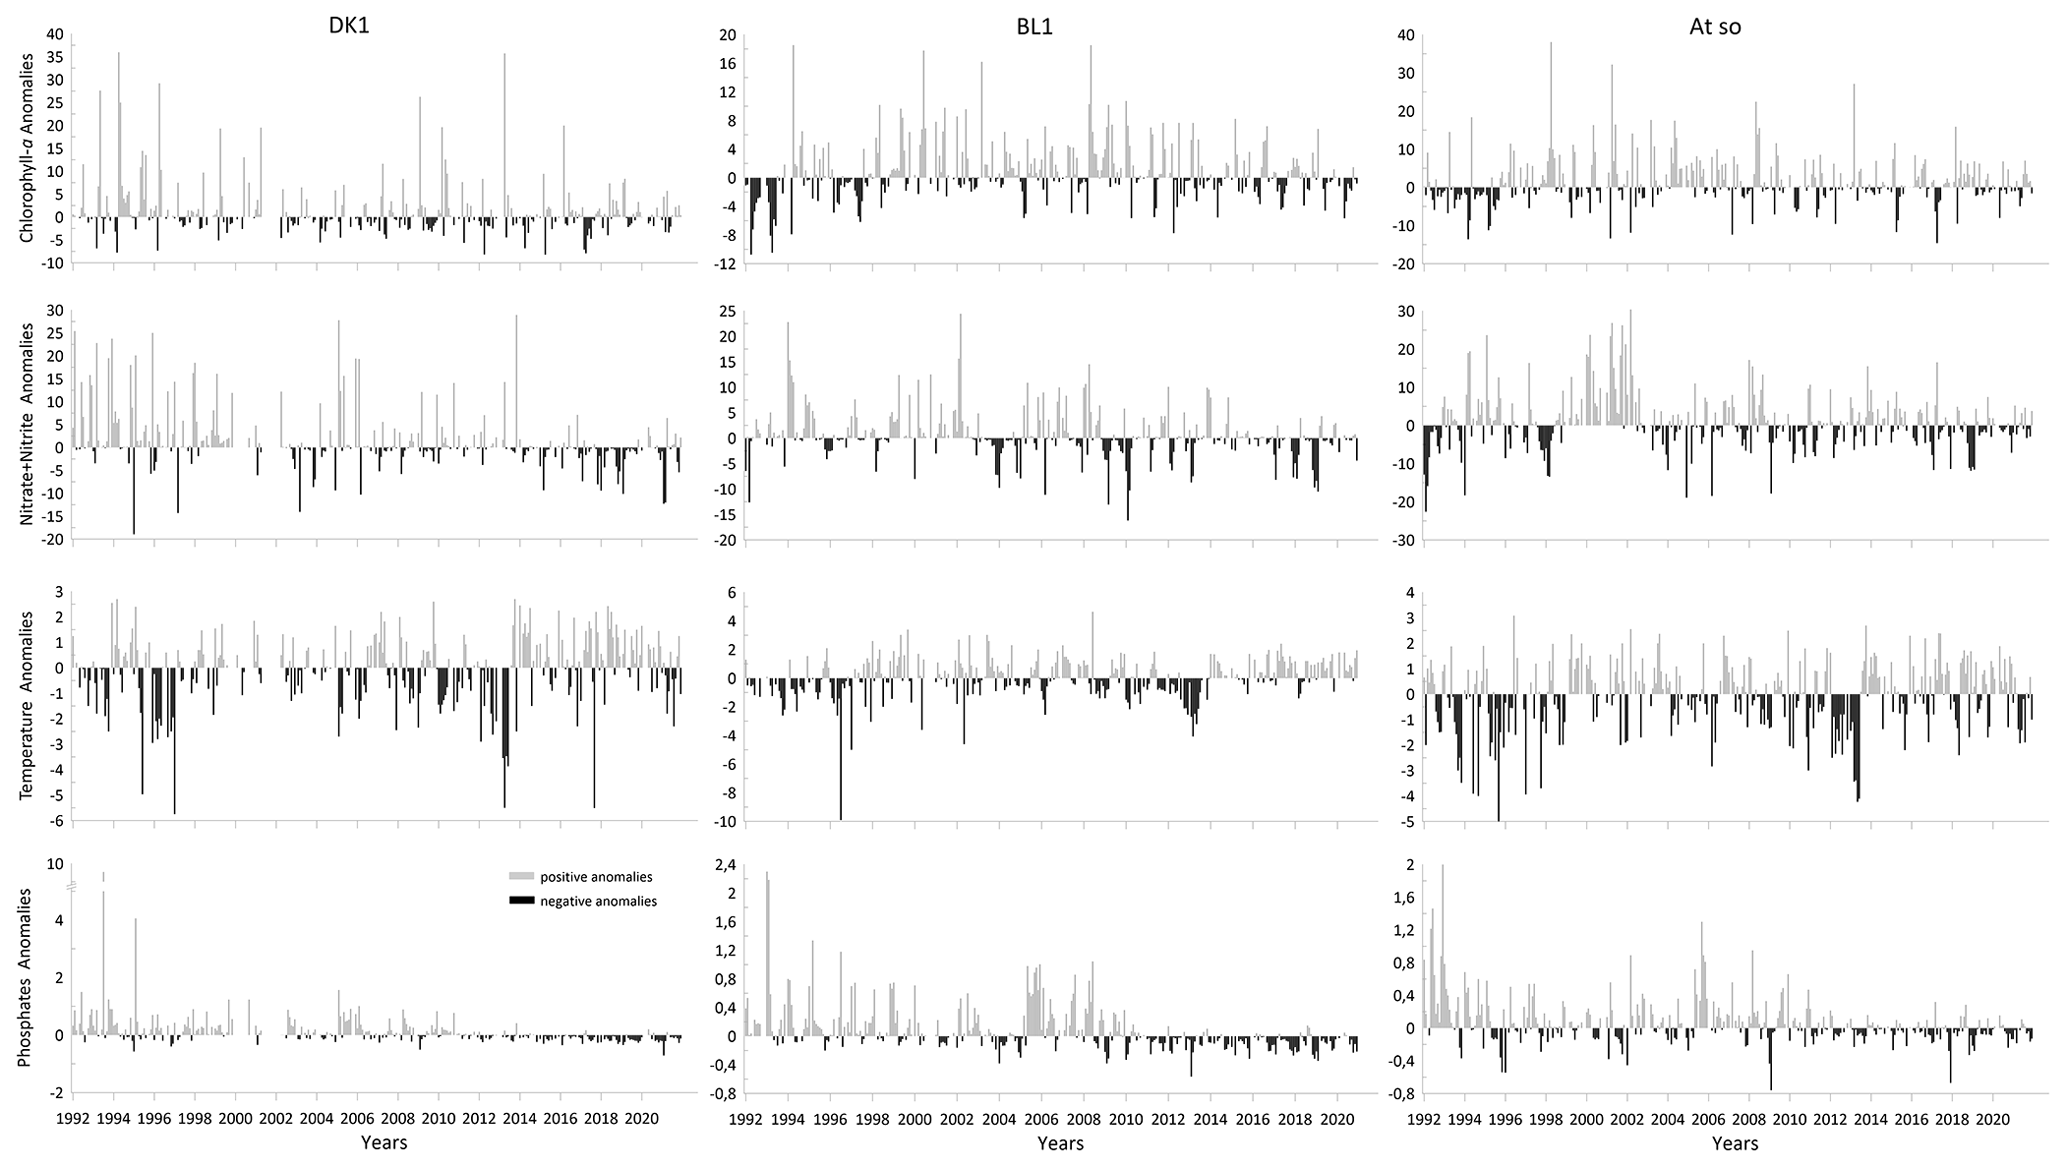
Figure 6Monthly anomalies calculated for chlorophyll-a and nitrite + nitrate concentrations, temperature, and phosphate concentration measured for the three coastal stations (DK1, BL1, and Atso) of the SRN network for the period 1992–2021.
The SRN database is publicly available via https://doi.org/10.17882/50832 (SRN – Regional Observation and Monitoring program for Phytoplankton and Hydrology in the eastern English Channel, 2022). Some other data should be considered as a complement to the SRN data set. Indeed, coastal stations of the SRN local monitoring programme are part of the REPHY national network. This network shares the same protocol and considers the same parameters. REPHYTOX is complementary to the REPHY network, as it contains phycotoxin concentrations in mussels 5 from areas where HAB phytoplankton blooms are detected. All these supplementary data are available from the following.
-
https://doi.org/10.17882/47248 (REPHY – French observation and monitoring programme for phytoplankton and hydrology in coastal waters, 2021)
-
https://doi.org/10.17882/47251 (REPHYTOX – French monitoring programme for phycotoxins in marine organisms, 2021)
Devreker and Lefebvre (2014) specifically developed a specific R package to help the SRN data users to process data and extract the best available statistics from this long-term data set. The package creates a Genuine User Interface (GUI) and is available via https://cran.r-project.org/web/packages/TTAinterfaceTrendAnalysis/index.html (last access: 24 January 2023).
The SRN data, which have been collected since 1992, represent one of the longest long-term data sets in the English Channel and the Southern Bight of the North Sea. This enables the study of phytoplankton dynamics and diversity as well as changes in particular composition in response to anthropogenic and/or climatic change. Indeed, these data have been used by scientists from several backgrounds and for a variety of research purposes. In the following paragraphs, the main outputs from these research activities will be highlighted. This review can help the scientific community interested in this SRN data set to identify topics that can be addressed or those that have not been addressed. It also allows for new topics to be discussed in more detail since the general patterns have already been identified.
Lefebvre et al. (2011) proposed a break-and-trend analysis for nutrient concentrations using a simple and intuitive analytical method called the cumulative sum method (Ibanez et al., 1993). The authors defined the characteristics and patterns of seasonal variations in chlorophyll a, nutrients, and phytoplankton. They proposed a classification of years based on whether Phaeocystis globosa is dominant or not.
According to Lefebvre et al. (2011) and Hernández-Fariñas et al. (2014), the phytoplankton community in the eastern English Channel and Southern Bight of the North Sea is dominated by Bacillariophyta, dinoflagellates, and Prymnesiophyceae, accounting for 81 % of the total abundance. Hernández-Fariñas et al. (2014) estimated that the median contribution of Phaeocystis globosa during the period between March and May (data for 1992–2014) ranges from 74 % to 90 %, with the highest concentrations found at the coast. They highlighted two main periods with different environmental characteristics regardless of the SRN transect considered: 1992–2001 and 2002–2011. The latter period can be divided into two sub-periods: 2002–2007 and 2008–2011. These results highlighted the existence of a strong temporal structuring of the community under the influence of global and local factors. Globally, the abundance of Pseudo-nitzschia increases during the studied periods, while the abundance of other Bacillariophyta such as Guinardia, Coscinodiscus, and Stellarima decreases. The dinoflagellates Amphidinium, Alexandrium, and Polykrikos mark the second great period. During the second sub-period, however, Heterocapsa, Torodinium, and Eutreptiella (Euglenoid) are widespread. Melosira and Stephanopyxis were frequent diatoms in the early years of monitoring but became rare after 2002. There are changes in the abundance of some taxonomic units. The abundance of Phaeocystis globosa has not changed significantly in the Bay of the Somme, although it has increased slightly in Dunkerque and Boulogne-sur-Mer. Between 2002 and 2007, the abundance of the Gymnodinium–Gyrodinium group of dinoflagellates increased significantly, corresponding to a 2-fold log-scale abundance increase.
More recently, Lefebvre and Dezécache (2020) highlighted a significant break in the evolution of Phaeocystis globosa and Pseudo-nitzschia complex abundance in the 2000s and different trajectories of abundances in response to changes in nutrient concentration observed over the period 1994–2018. The three contrasting SRN sites appear to respond differently depending on the intensity of the initial nutrient input pressure. While a recovery to a good ecological status is doubtful in the near future, these ecosystems appear to be in an unstable intermediate state that necessitates continuous efforts to reduce nutrient inputs, particularly nitrogen.
These considerations on the relationship between phytoplankton succession and environmental conditions inevitably lead us back to Margalef's (1978) mandala, which paved the way for phytoplankton ecology by proposing functional groups to represent the adaptation of different life forms to specific habitats. However, it seems very difficult to propose, based on these concepts, a typical pattern of phytoplankton succession in the eastern English Channel and Southern Bight of the North Sea from the SRN data. Similarly, assigning phytoplankton succession to the classical path or the route leading to the harmful blooms of Margalef's mandala is hard, as is proposing a logical transition scheme between the various strategies described. In fact, alternative routes, overlaps, and mixtures of taxa with distinct strategies do exist, and the same taxon can even display several strategies according to its morphotype, as in the case of Phaeocystis globosa.
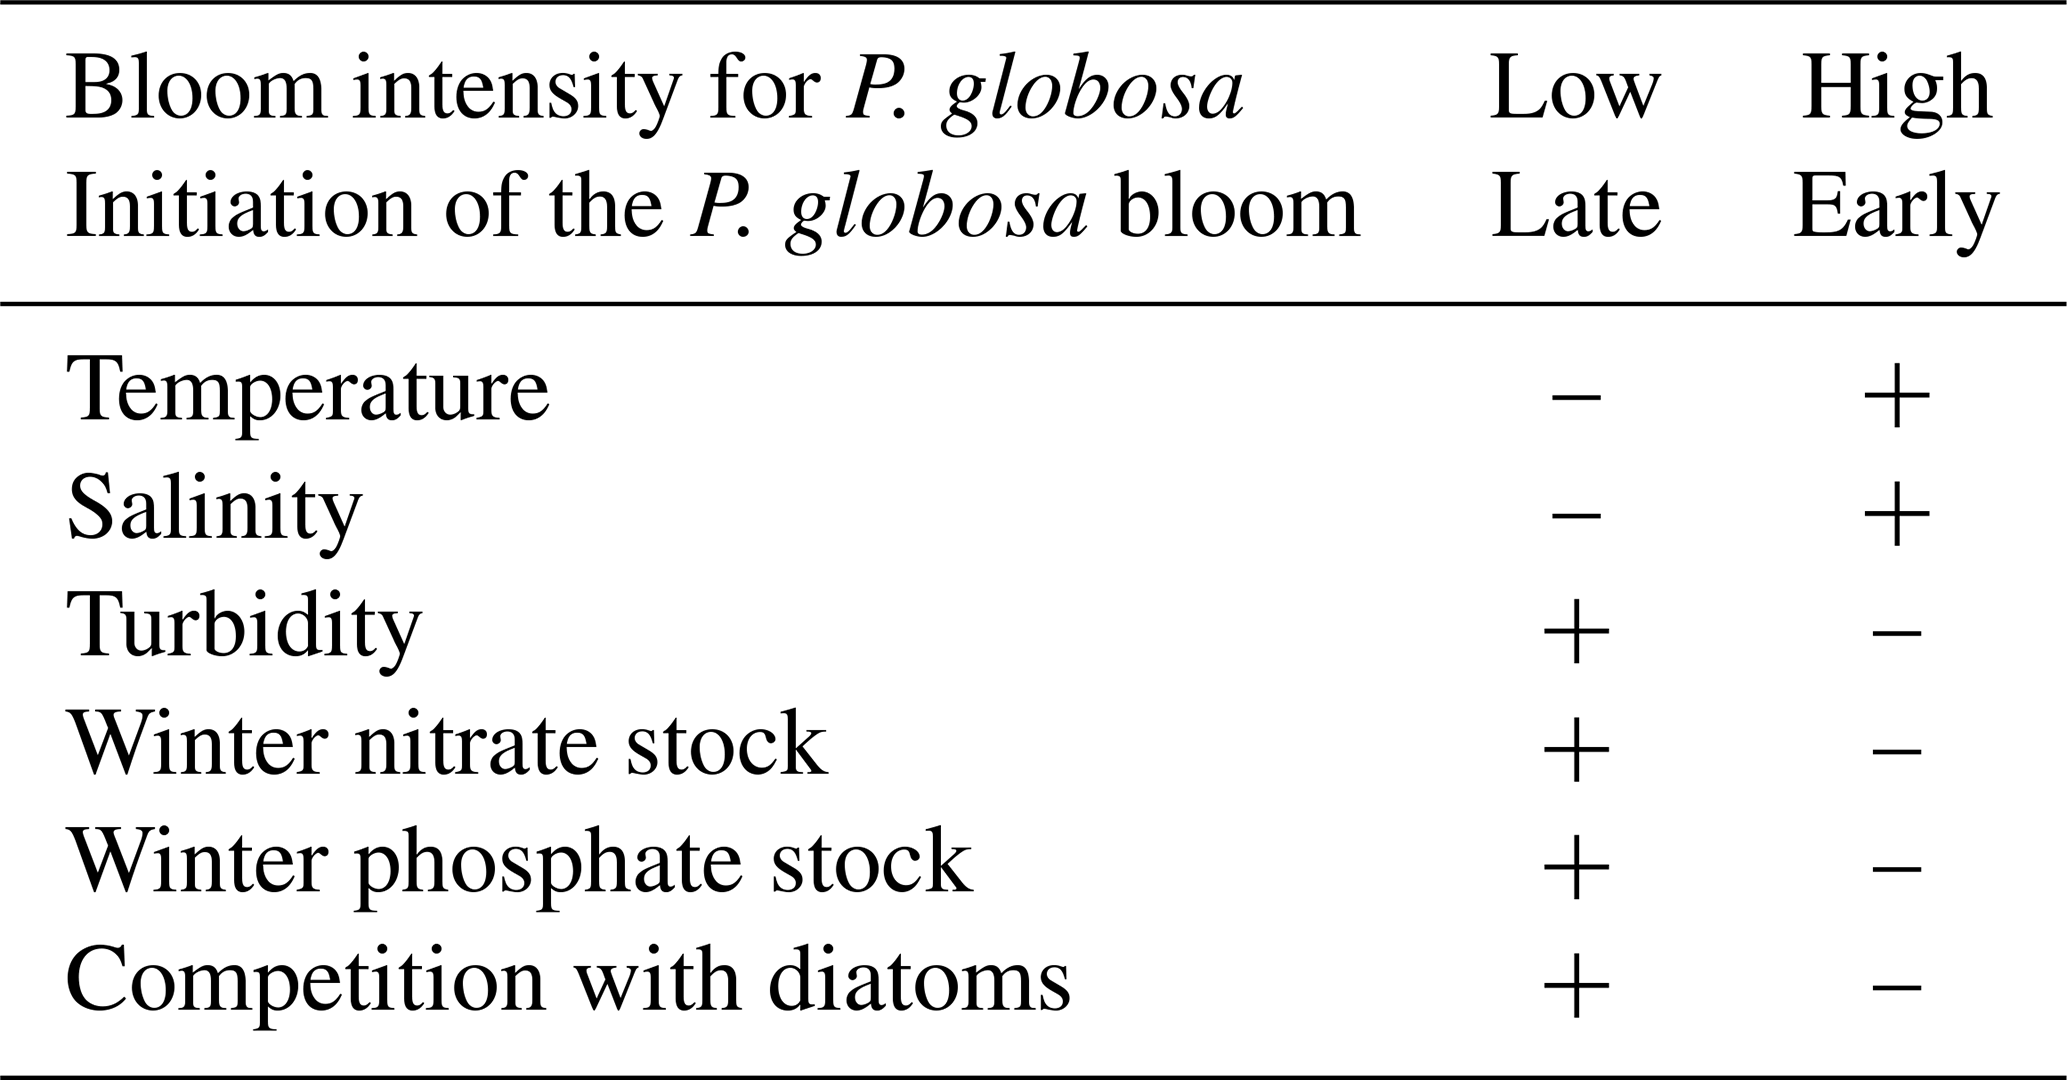
The concept of a niche is crucial in phytoplankton research because it helps in understanding the succession of taxa, their coexistence, exclusion, and the environmental conditions that control them, as well as their tolerance of environmental changes. Thus, Karasiewicz et al. (2018) used an improved version of the OMI (outlying mean index) approach to evaluate the niches of diatoms and Phaeocystis globosa. Two different situations of P. globosa bloom amplitude were defined by two different environmental trajectories and two different diatom communities, whose key features are given in Table 5. Karasiewicz and Lefebvre (2022) also developed a new method for bloom detection (based on 22 phenological variables) within a time series. A pairwise quantification of asymmetric dependencies between the phenological variables revealed the implication of different mechanisms common to and distinct between the studied taxa. A permutational multivariate analysis of variance (PERMANOVA) assisted in revealing the significance of seasonal variation in environmental and community factors. It was able to locate the harmful taxonomic niches among the rest of the community and quantify how the respective phenology influences the dynamics of the sub-niches by using methodologies such as the outlying mean index and the within outlying mean index.
Table 5Main biotic and abiotic characteristics during two contrasting situations of Phaeocystis globosa bloom intensity from SRN data in the coastal zone off Boulogne-sur-Mer (–: low value for the parameter under consideration; +: high value).
These results are comparable to those of Hernández Fariñas et al. (2015), who, based on a similar approach but extended to the Dunkerque and Bay of Somme SRN sites, concluded that light, temperature, species richness, and nutrient concentrations are the main factors controlling phytoplankton dynamics and community structure.
We also confirmed from SRN data that periods of Phaeocystis globosa dominance are generally associated with high concentrations of the Pseudo-nitzschia complex. The simultaneous presence of the P. globosa and Pseudo-nitzschia complex will cause the creation of structures resembling mini-bearings (Pseudo-nitzschia needles planted in Phaeocystis colonies) that will be passively swallowed by the fish. These structures can cause mechanical aggression of the gill and/or digestive tissues, opening the way to viral and bacterial infections. This mechanical aggressiveness will become even more crucial as new needle-shaped species or those with pointed spicules have been found in our investigations, contributing to the creation of these irritating assemblages. These are Chaetoceros sp., some Thalassiosira sp., Rhizosolenia imbricata, and R. styliformis. Furthermore, the impact of phytoplankton blooms on the pelagic compartment, and in particular on fish, needs further investigation, especially in light of the findings of Lefebvre et al. (2011), Hernández-Fariñas et al. (2014), who found an increase in the abundance of Pseudo-nitzschia sp. since the early 2000s, and Delegrange et al. (2018), who found a correlation between mortalities of farmed sea bass (Dicentrarchus labrax) and the spring phytoplankton bloom. Major blooms of P. globosa will lead to changes in viscosity (Seuront et al., 2006) that may cause behavioural changes in fish (e.g. inhibition of larval swimming activity) or metabolic changes (e.g. inhibition of gill functions). Changes in viscosity will also inevitably affect prey–predator relationships within plankton (Seuront and Vincent, 2008).
In order to facilitate the analysis and valorization of SRN data, Devreker and Lefebvre (2014) proposed the development of a user interface in R (R Core Team, 2020). This interface is available on the CRAN website as the TTAinterfaceTrendAnalysis package. It allows quick definition of the main statistical characteristics of SRN series and proposal of classical time series analyses (data regularization and aggregation, detection of anomalies, breaks and seasonal or global trends). The results are presented in the form of summary tables or graphs that are automatically saved in the user's working directory.
SRN data are used for validation of coupled hydrodynamic–biogeochemical models such as ECO-MARS 3D in addition to improving scientific knowledge about phytoplankton dynamics, biodiversity, and water quality (Ménesguen et al., 2019). Including retrieved chlorophyll a and suspended matter, SRN data are an essential source for the development and improvement of satellite water colour algorithms (Gohin et al., 2008, 2019, 2020). In terms of the latter parameter, they are the only data with such geographical and temporal coverage available in the coastal area of the eastern English Channel and the Southern Bight of the North Sea. Other data from the Coastal Observation Service (Somlit; https://www.somlit.fr/, last access: 28 April 2022) can supplement the SRN data for the Boulogne-sur-Mer coastal zone (Lheureux et al., 2021).
In the context of the implementation of the Water Framework Directive (WFD 2000/60/EC), some coastal points of the SRN integrate the so-called Monitoring and Operational Control system. The new Marine Strategy Framework Directive (MSFD) extends the WFD approach limited to the first nautical mile from the baseline (for biological parameters) to the offshore waters (Exclusive Economic Zone). Thus, the offshore stations of the SRN network also meet the diagnostic and monitoring expectations advocated by this European directive (Lefebvre and Devreker, 2020).
As part of the Oslo and Paris Convention's strategy to combat eutrophication (OSPAR, http://www.ospar.org/, last access: 24 January 2023), SRN results are used to define the eutrophication status of water bodies. The SRN data are also transmitted to the ICES working group Phytoplankton and Microbial Ecology (WG PME) in order to contribute to the drafting of the dedicated annual report (http://www.ices.dk/community/groups/Pages/WGPME.aspx, last access: 24 January 2023).
The supplement related to this article is available online at: https://doi.org/10.5194/essd-15-1077-2023-supplement.
AL led the SRN monitoring programme and also led the writing of the paper. DD collaborated in the writing of the paper.
The contact author has declared that none of the authors has any competing interests.
Publisher's note: Copernicus Publications remains neutral with regard to jurisdictional claims in published maps and institutional affiliations.
The acquisition of this data set was performed in the framework of the SRN network, created and implemented by Ifremer and the Artois Picardie Water Agency. The authors want to acknowledge Camille Blondel, Vincent Duquesne, Pascale Hébert, Fabien Lebon, Rémy Cordier, Catherine Belin, Maud Lemoine, Nadine Neaud-Masson, Antoine Huguet, Gaétane Durand and Dominique Soudant for their active contributions related to field works, samples analyzis or data management and dissemination. Other contributors such as the REPHY and REPHYTOX colleagues, crew members, students, and PhDs who have contributed to the valorization of the SRN data are also gratefully thanked.
This research has been supported by the Agence de l'Eau Artois-Picardie (grant no. 20/1000937).
This paper was edited by Giuseppe M. R. Manzella and reviewed by three anonymous referees.
Admiraal, W. and Venekamp, L. A. H.: Significance of Tintinnid grazing during blooms of Phaeocystis pouchetii (Haptophycea) in Dutch coastal waters, Neth. J. Sea Res., 20, 61–66, 1986.
Aminot, A. and Kérouel, R.: Hydrologie des écosystèmes marins: paramètres et analyses, Ifremer, 336 pages, ISBN 2-84433-133-5, 2004.
Berdalet, E., Fleming, L. E., Gowen, R., Davidson, K., Hess, P., Backer, L. C., Moore, S. K., Hoagland, P., and Enevoldsen, H.: Marine harmful algal blooms, human health and wellbeing: challenges and opportunities in the 21st century, J. Mar. Biol. Assoc. UK, 2015, 61–91, https://doi.org/10.1017/S0025315415001733, 2016.
Billen, G., Garnier, J., and Rousseau, V.: Nutrient fluxes and water quality in the drainage network of the Scheldt basin over the last 50 years, Hydrobiologia, 540, 47–67, https://doi.org/10.1007/s10750-004-7103-1, 2005.
Brzezinski, M. A.: The ration of marine diatoms: interspecific variability and the effects of some environmental variables, J. Phycol., 21, 347–357, https://doi.org/10.1111/j.0022-3646.1985.00347.x, 1985.
Brylinski, J. M., Lagadeuc, Y., Gentilhomme, V., Dupont, J. P., Lafite, R., Dupeuble, P. A., Huault, M. F., and Auger, Y.: Le “fleuve cotier”: Un phenomene hydrologique important en Manche orientale, Exemple du Pas-de-Calais, Oceanol. Ac., https://archimer.ifremer.fr/doc/00268/37874/ (last access: 24 January 2023), 1991.
Cadée, G. C. and Hegeman, J.: Seasonal and annual variation in Phaeocystis pouchetii (Haptophyceae) in the westernmost inlet of the Wadden Sea during the 1973 to 1985 period, Neth. J. Sea Res., 20, 29–36, 1986.
D'Elia, C. F., Sanders, J. G., and Boynton, W. R.: Nutrient enrichment studies in a coastal plain estuary: phytoplankton growth in large-scale, continuous cultures, Can. J. Fish. Aqua. Sci., 43, 397–406, 1986.
Delegrange, A., Lefebvre, A., Gohin, F., Courcot, L., and Vincent, D.: Pseudo-nitzschia sp. diversity and seasonality in the southern North Sea, domoic acid levels and associated phytoplankton communities, Estuar. Coast. Shelf S., 214, 194–206, https://doi.org/10.1016/j.ecss.2018.09.030, 2018.
Devreker, D. and Lefebvre, A.: TTAinterfaceTrendAnalysis: An R GUI for routine Temporal Trend Analysis and diagnostics, J. Oceanogr. Res. Data, 6, 1–18, 2014.
Eberlein, K., Leal, M. T., Hammer, K. D., and Hiekel, W.: Dissolved organic substances during a Phaeocystis pouchetii bloom in the German Bight (North Sea), Mar. Biol., 89, 311–316, 1985.
European Commission MSFD.: Directive 2008/56/EC of the European Parliament and of the Council of 17 June 2008 establishing a framework for community action in the field of marine environmental policy (Marine Strategy Framework Directive) (Text with EEA relevance), European Commission, http://data.europa.eu/eli/dir/2008/56/oj (last access: 24 January 2023), 2008.
EU WFD: Directive 2000/60/EC of the European Parliament and of the Council of 23 October 2000 establishing a framework for community action in the field of water policy, Official Journal of the European Communities, 327, 1–72, http://data.europa.eu/eli/dir/2000/60/oj (last access: 24 January 2023), 2000.
Garmendia, M., Borja, Á., Franco, J., and Revilla, M.: Phytoplankton composition indicators for the assessment of eutrophication in marine waters: Present state and challenges within the European directives, Marine Pollut. Bull., 66, 7–16, https://doi.org/10.1016/j.marpolbul.2012.10.005, 2013.
Gentilhomme, V. and Lizon, F.: Seasonal cycle of nitrogen and phytoplankton biomass in a well-mixed coastal system (Eastern English Channel), Hydrobiologia, 361, 191–199, https://doi.org/10.1023/A:1003134617808, 1998.
Gohin, F., Saulquin, B., Oger-Jeanneret, H., Lozac'h, L., Lampert, L., Lefebvre, A., Riou, P., and Bruchon, F.: Towards a better assessment of the ecological status of coastal waters using satellite-derived chlorophyll a concentrations, Remote Sens. Environ., 112, 3329–3340, https://doi.org/10.1016/j.rse.2008.02.014, 2008.
Gohin, F., Van der Zande, D., Tilstone, G., Eleveld, M. A., Lefebvre, A., Andrieux-Loyer, F., Blauw, A. N., Bryère, P., Devreker, D., Garnesson, P., Hernández Fariñas, T., Lamaury, Y., Lampert, L., Lavigne, H., Menet-Nedelec, F., Pardo, S., and Saulquin, B.: Twenty years of satellite and in situ observations of surface chlorophyll a from the northern Bay of Biscay to the eastern English Channel. Is the water quality improving?, Remote Sens. Environ., 233, 111343, https://doi.org/10.1016/j.rse.2019.111343, 2019.
Gohin, F., Bryère, P., Lefebvre, A., Sauriau, P.-G., Savoye, N., Vantrepotte, V., Bozec, Y., Cariou, T., Conan, P., Coudray, S., Courtay, G., Françoise, S., Goffart, A., Hernández Fariñas, T., Lemoine, M., Piraud, A., Raimbault, P., and Rétho, M.: Satellite and In Situ Monitoring of Chl a, Turbidity, and Total Suspended Matter in Coastal Waters: Experience of the Year 2017 along the French Coasts, J. Mar. Sci. Eng., 8, 665, https://doi.org/10.3390/jmse8090665, 2020.
Gypens, N., Delhez, E., Vanhoutte-Brunier, A., Burton, S., Thieu, V., Passy, P., Liu, Y., Callens, J., Rousseau, V., and Lancelot, C.: Modelling phytoplankton succession and nutrient transfer along the Scheldt estuary (Belgium, The Netherlands), J. Marine Syst., 128, 89–105, https://doi.org/10.1016/j.jmarsys.2012.10.006, 2013.
Henson, S. A., Cael, B. B., Allen, S. R., and Dutkiewicz, S.: Future phytoplankton diversity in a changing climate, Nat. Commun., 12, 5372, https://doi.org/10.1038/s41467-021-25699-w, 2021.
Hernández-Fariñas, T., Soudant, D., Barillé, L., Belin, C., Lefebvre, A., and Bacher, C.: Temporal changes in the phytoplankton community along the French coast of the eastern English Channel and the southern Bight of the North Sea, ICES J. Mar. Sci., 71, 821–833, https://doi.org/10.1093/icesjms/fst192, 2014.
Hernández Fariñas, T., Bacher, C., Soudant, D., Belin, C., and Barillé, L.: Assessing phytoplankton realized niches using a French National Phytoplankton Monitoring Network, Estuar. Coast. Shelf S., 159, 1–13, https://doi.org/10.1016/j.ecss.2015.03.010, 2015.
Ibanez, F., Fromentin, J. M., and Castel, J.: Application de la méthode des sommes cumulées à l'analyse des séries chronologiques en océanographie, Compte Rendu de l'Académie des Sciences Paris, 316, 745–748, 1993.
Ifremer/ODE/VIGIES. REPHY national coordination & Quadrige administration unit: Manual for using REPHY Data. Information to improve the understanding of REPHY data files available to scientists and the public, Ifremer Report ODE/VIGIES/17-16, https://archimer.ifremer.fr/doc/00409/52017/ (last access: 24 January 2023), 2017.
Karasiewicz, S. and Lefebvre, A.: Environmental Impact on Harmful Species Pseudo-nitzschia spp. and Phaeocystis globosa Phenology and Niche, J. Mar. Sci. Eng., 10, 174, https://doi.org/10.3390/jmse10020174, 2022.
Karasiewicz, S., Breton, E., Lefebvre, A., Hernández Fariñas, T., and Lefebvre, S.: Realized niche analysis of phytoplankton communities involving HAB: Phaeocystis spp. as a case study, Harmful Algae, 72, 1–13, https://doi.org/10.1016/j.hal.2017.12.005, 2018.
Lancelot, C. and Mathot, S.: Biochemical fractionation of primary production by phytoplankton in Belgian coastal waters during short- and long-term incubations with 14C-bicarbonate – II. Phaeocystis poucheti colonial population, Mar. Biol., 86, 227–232, https://doi.org/10.1007/BF00397508, 1985.
Lancelot, C., Wassman P., and Barth, H.: Ecology of Phaeocystis-dominated ecosystems, J. Marine Syst., 5, 1–4, https://doi.org/10.1016/0924-7963(94)90012-4, 1994.
Lancelot, C., Rousseau, V., Billen, G., and Van Eeckhout, D.: 4. Coastal eutrophication of the Southern Bight of the North Sea: Assessment and modelling, Bull. la Soc. R. des Sci. Liege, 66, 439–453, https://doi.org/10.1007/978-94-011-5758-2_33, 1997.
Lefebvre, A. and Devreker, D.: First Comprehensive Quantitative Multi-Parameter Assessment of the Eutrophication Status from Coastal to Marine French Waters in the English Channel, the Celtic Sea, the Bay of Biscay, and the Mediterranean Sea, J. Mar. Sci. Eng., 8, 561, https://doi.org/10.3390/jmse8080561, 2020.
Lefebvre, A. and Dezécache, C.: Trajectories of Changes in Phytoplankton Biomass, Phaeocystis globosa and Diatom (incl. Pseudo-nitzschia sp.) Abundances Related to Nutrient Pressures in the Eastern English Channel, Southern North Sea, J. Mar. Sci. Eng., 8, 401, https://doi.org/10.3390/jmse8060401, 2020.
Lefebvre, A., Guiselin, N., Barbet, F., and Artigas, F. L.: Long-term hydrological and phytoplankton monitoring (19922007) of three potentially eutrophic systems in the eastern English Channel and the Southern Bight of the North Sea, ICES J. Mar. Sci., 68, 2029–2043, https://doi.org/10.1093/icesjms/fsr149, 2011.
Lheureux, A., Savoye, N., Del Amo, Y., Goberville, E., Bozec, Y., Breton, E., Conan, P., L'Helguen, S., Mousseau, L., Raimbault, P., Rimelin-Maury, P., Seuront, L., Vuillemin, R., Caparros, J., Cariou, T., Cordier, M., Corre, A., Costes, L., Crispi, O., Crouvoisier, M., Crouvoisier, M., Derriennic, H., Devesa, J., Durozier, M., Ferreira, S., Garcia, N., Grossteffan, E., Gueux, A., Lafont, M., Lagadec, V., Lecuyer, E., Leroux, C., Macé, E., Maria, E., Mornet, L., Nowaczyk, A., Parra, M., Petit, F., and David, V.: Bi-decadal variability in physico-biogeochemical characteristics of temperate coastal ecosystems: from large-scale to local drivers, Mar. Ecol. Prog. Ser., 660, 19–35, https://doi.org/10.3354/meps13577, 2021.
Margalef, R.: Life forms of phytoplankton as survival alternatives in an unstable environment, Oceanol. Acta, 1, 493–509, 1978.
Ménesguen, A., Dussauze, M., Dumas, F., Thouvenin, B., Garnier, V., Lecornu, F., and Répécaud, M.: Ecological model of the Bay of Biscay and English Channel shelf for environmental status assessment part 1: Nutrients, phytoplankton and oxygen, Ocean Model., 133, 56–78, https://doi.org/10.1016/j.ocemod.2018.11.002, 2019.
Nejstgaard, J. C., Tang, K. W., Steinke, M., Dutz, J., Koski, M., Antajan, E., and Long, J. D.: Zooplankton grazing on Phaeocystis: A quantitative review and future challenges, Biogeochemistry, 83, 147–172, https://doi.org/10.1007/s10533-007-9098-y, 2007.
OSPAR Commission: Common Procedure for the Identification of the Eutrophication Status of the OSPAR Maritime Area. Agreement (Agreement 2013-08), 1–66, https://www.ospar.org/work-areas/hasec/eutrophication/common-procedure (last access: 24 January 2023), 2013.
PHYTOBS: PHYTOBS dataset – French National Service of Observation for Phytoplankton in coastal waters, SEANOE [data set], https://doi.org/10.17882/85178, 2021.
Rahmel, J., Bätje, M., Michaelis, H., and Noack, U.: Phaeocystis globosa and the phytoplankton succession in the East Frisian coastal waters, 49, 399–408, https://doi.org/10.1007/BF02368365, 1995.
R Core Team: R: A Language and Environment for Statistical Computing, R Foundation for Statistical Computing, Vienna, Austria, https://www.r-project.org/ (last access: 24 January 2023), 2020,
Redfield, A. C., Ketchum, B. H., and Richards, F. A.: The influence of organisms on the composition of sea-water, in: The Sea. Ideas and observations on progress in the study of the seas, vol. 2, The composition of sea-water. Comparative and descriptive oceanography, edited by: Hill, M. N., Interscience publishers, a division of Wiley & Sons, New York, London, 26–77, ISBN 9780674017283, 1963.
REPHY – French Observation and Monitoring program for Phytoplankton and Hydrology in coastal waters: REPHY dataset – French Observation and Monitoring program for Phytoplankton and Hydrology in coastal waters. Metropolitan data, SEANOE [data set], https://doi.org/10.17882/47248, 2021.
REPHYTOX – French Monitoring program for Phycotoxins in marine organisms: REPHYTOX dataset, French Monitoring program for Phycotoxins in marine organisms, Data since 1987, SEANOE [data set], https://doi.org/10.17882/47251, 2021.
Rousseau, V., Mathot, S., and Lancelot, C.: Calculating carbon biomass of Phaeocystis sp. from microscopic observations, Mar. Biol., 107, 305–314, https://doi.org/10.1002/9781119072218.ch11, 1990.
Rousseau, V., Lantoine, F., Rodriguez, F., Legall, F., Chrétiennot-Dinet, M.-J., and Lancelot, C.: Characterization of Phaeocystis globosa (Prymnesiophyceae), the blooming species in the Southern North Sea, J. Sea Res., 76, 105–113, https://doi.org/10.1016/j.seares.2012.07.011, 2013.
Sazhin, A., Artigas, L. F., Nejstgaard, J. C., and Frischer M. E.: The colonization of two Phaeocystis species (Prymnesiophyceae) by pennate diatoms and other protists: a significant contribution to colony biomass, Biogeochemistry, 83, 137–145, https://doi.org/10.1007/s10533-007-9086-2, 2007.
Seuront, L. and Vincent, D.: Increased seawater viscosity, Phaeocystis globosa spring bloom and Temora longicornis feeding and swimming behaviours, Mar. Ecol. Prog. Ser., 363, 131–145, https://doi.org/10.3354/meps07373, 2008.
Seuront, L., Vincent, D., and Mitchell, J. G.: Biologically induced modification of seawater viscosity in the Eastern English Channel during a Phaeocystis globosa spring bloom, J. Marine Syst., 61, 118–133, https://doi.org/10.1016/j.jmarsys.2005.04.010, 2006.
SRN – Regional Observation and Monitoring program for Phytoplankton and Hydrology in the eastern English Channel: SRN dataset – Regional Observation and Monitoring Program for Phytoplankton and Hydrology in the eastern English Channel, SEANOE [data set], https://doi.org/10.17882/50832, 2022.
Utermöhl, H.: Zur Vervollkommnung der quantitativen Phytoplankton-Methodik, Mitt. Int. Ver. Theor. Angew. Limnol., 9, 1–38, 1958.
Wafar, M. V. M., Le Corre, P., and Birrien, J. L.: Nutrients and primary production in permanently well-mixed temperate coastal waters, Estuar. Coast. Shelf S., 17, 431–446, https://doi.org/10.1016/0272-7714(83)90128-2, 1983.
WoRMS Editorial Board: World Register of Marine Species, https://www.marinespecies.org (last access: 24 January 2023), https://doi.org/10.14284/170, 2022.