the Creative Commons Attribution 4.0 License.
the Creative Commons Attribution 4.0 License.
 | 07 Mar 2023
Pan-Arctic soil element bioavailability estimations
Peter Stimmler
Mathias Goeckede
Bo Elberling
Susan Natali
Peter Kuhry
Nia Perron
Fabrice Lacroix
Gustaf Hugelius
Oliver Sonnentag
Jens Strauss
Christina Minions
Michael Sommer
Jörg Schaller
Arctic soils store large amounts of organic carbon and other elements, such as amorphous silicon, silicon, calcium, iron, aluminum, and phosphorous. Global warming is projected to be most pronounced in the Arctic, leading to thawing permafrost which, in turn, changes the soil element availability. To project how biogeochemical cycling in Arctic ecosystems will be affected by climate change, there is a need for data on element availability. Here, we analyzed the amorphous silicon (ASi) content as a solid fraction of the soils as well as Mehlich III extractions for the bioavailability of silicon (Si), calcium (Ca), iron (Fe), phosphorus (P), and aluminum (Al) from 574 soil samples from the circumpolar Arctic region. We show large differences in the ASi fraction and in Si, Ca, Fe, Al, and P availability among different lithologies and Arctic regions. We summarize these data in pan-Arctic maps of the ASi fraction and available Si, Ca, Fe, P, and Al concentrations, focusing on the top 100 cm of Arctic soil. Furthermore, we provide element availability values for the organic and mineral layers of the seasonally thawing active layer as well as for the uppermost permafrost layer. Our spatially explicit data on differences in the availability of elements between the different lithological classes and regions now and in the future will improve Arctic Earth system models for estimating current and future carbon and nutrient feedbacks under climate change (https://doi.org/10.17617/3.8KGQUN, Schaller and Goeckede, 2022).
- Article
(2846 KB) - Full-text XML
-
Supplement
(2776 KB) - BibTeX
- EndNote


Temperatures in the northern high-latitude region have risen more than twice as fast as the global average within the last decades (IPCC, 2021). This warming leads to the thawing of perennially frozen ground known as permafrost (Brown and Romanovsky, 2008; Romanovsky et al., 2010). Frozen conditions prevent the microbial degradation of organic matter (OM) and also limit fluvial export of soil-bound nutrients to the sea by runoff (Mann et al., 2022). Thawing of permafrost soils may, in turn, accelerate global warming by potentially releasing potent greenhouse gases (GHGs) such as carbon dioxide (CO2) and methane (CH4) through soil organic carbon mineralization (Schuur et al., 2015). The frozen ground of the Arctic boreal regions (hereafter called “Arctic” but also including subarctic regions) is the largest pool of soil organic carbon worldwide. Approximately 1014–1035 ± 194 Pg of organic carbon is stored within the upper 3 m of permafrost region soils (Hugelius et al., 2014; Mishra et al., 2021). To full depth, approximately 1460–1600 Pg of organic carbon is stored in the permafrost region (Strauss, 2021), and approximately one-third of this is in ice-rich yedoma deposits, exceeding 3 m depth (Fuchs et al., 2018; Strauss et al., 2017b). The yedoma deposits formed in unglaciated areas of the Northern Hemisphere during the glacial period, when meltwater from glacial areas and eolian processes transported fine sediment to the unglaciated lowlands (Schuur et al., 2013; Strauss, 2021; Strauss et al., 2013). Yedoma deposits are characterized by high carbon and water contents. The water is mostly bound in massive ice in ice wedges as well as segregated ice and pore ice in sediment columns (Schirrmeister et al., 2011). Thus, yedoma soils are highly vulnerable to thawing because the loss of the high ice volume leads to surface subsidence and thermokarst processes, which can accelerate thaw and remobilize deep elemental stocks.
Low temperatures in Arctic systems slow down biological and chemical processes and preserve OM for millennia (Sher et al., 2005). Due to Arctic warming, these processes are accelerated by increased nutrient and OM mobilization from the permafrost (Salmon et al., 2016). Consequently, OM may become vulnerable to respiration (Hugelius et al., 2020; Strauss et al., 2017b). The temperature and near-surface water content in Arctic soils have changed rapidly in the last decades, and further changes are expected in the future (Box et al., 2019). An important effect of Arctic warming is a deepening of the seasonally thawed active layer and related thermokarst processes, which may lead to the mobilization of nutrients from permafrost soil layers (Abbott et al., 2015). Additionally, increased temperatures in Arctic regions may accelerate weathering, potentially enhancing nutrient availability in terrestrial Arctic ecosystems as well as export to freshwater systems and, finally, to the nearshore zone and sea (Goldman et al., 2013).
As the Arctic features a soil mineral composition that is different from many other global soils (Monhonval et al., 2021), the availability (for microbes and plants) of elements in Arctic soils may differ as well. Yedoma deposits, for example, are important pools of OM in the Arctic. Because yedoma deposits include materials transported from nearby mountains, the mineral compositions of these yedoma deposits depend on the original geology of the mountains (Schirrmeister et al., 2011). Furthermore, sediments of marine origin are often rich in available calcium (Ca), phosphorus (P), and silicic acid (Si), while magmatic rocks such as granite or basalt contain large amounts of Si, iron (Fe), aluminum (Al), and P. The complex mineral composition of fluvial and marine sediments is reflected in the element availability of the soils formed from these deposits. The availability of these elements in soils is the complex product of soil genesis, nutrient release, and plant cycling. The soil properties and the vegetation type interactions in terms of Sphagno-Eriophorum vaginati potentially lead to Si accumulation in the uppermost soil layer of the moist acidic tundra, whereas interactions in terms of Dryado integrifoliae-Caricetum may lead to an accumulation of Ca in the uppermost soil layer in moist non-acidic tundra (Walker et al., 2001). Moreover, external inputs (e.g., by fluvial transport in yedoma regions) may alter soil genesis and element availability (Monhonval et al., 2021; Strauss et al., 2017a). These processes depend on physical and chemical conditions including temperature, water content, and pH. In this context, Si, Ca, Fe, Al, or P are bound in or on mineral phases and are released via enzymatic activity or weathering. Ongoing Arctic climate warming now threatens to disturb the pools that have equilibrated to conditions characteristic of the past millennia.
Nutrient availability (the easily available share of elements for potential uptake by plants within a short time span, e.g., days not months) is important to meet plants' requirements in terms of nutrition, as only optimal nutrition will result in high biomass production. The availability of elements, such as P, Fe, Ca, and Si, in soils is a known control with respect to soil OM respiration (Weil and Brady, 2017). A release of inorganic nutrients, such as P or Si, can lead to increased GHG production and potentially to further export of these elements to fresh and marine waters. In marine systems, P, Fe, Ca, and Si are well known to control carbon (C) fixation in terms of algae biomass productivity. In terrestrial systems, P availability is positively related to Si (Schaller et al., 2019) or its polymers, which mobilize from species such as amorphous silicon (ASi) (Stimmler et al., 2022). The mobilization of P by Si has been shown to occur due to competition for binding at Fe minerals (Schaller et al., 2019), which tend to strongly bind P under low-Si-availability conditions (Gérard, 2016). Contrary to Si, Ca binds P by calcium phosphate coprecipitation with calcium carbonate, at least under high-soil-pH conditions (Otsuki and Wetzel, 1972). Like P, OM also binds to Ca, Fe, and Al phases (Kaiser and Zech, 1997; Wiseman and Püttmann, 2006) but is mobilized from those phases by Si (Hömberg et al., 2020). If the Fe availability in soils is low, the binding of P may be related to Al minerals (Eriksson et al., 2015).
Despite the important role of soil elements in driving soil and ecosystem processes as well as the potential for rapid changes in the Arctic due to climate change, the spatial distribution of elemental stocks (beyond C and N) is not well understood. An ecologically based classification of soil Ca concentrations, which differentiated between a Ca-rich non-acidic tundra and a Ca-poor acidic tundra based on differences in vegetation types, was proposed by Walker et al. (2001) for the Alaskan Arctic region. This classification system was further used to estimate pan-Arctic soil OM stocks (Hugelius et al., 2014); this proved to be a useful approach, as vegetation is tightly connected to OM stocks (Quideau et al., 2001). Based on the work of Hugelius et al. (2014), Alfredsson et al. (2016) related vegetation cover to the ASi concentration to scale up Arctic ASi stocks. However, in contrast to OM stocks being clearly related to vegetation (Hugelius et al., 2014), vegetation might have an effect on mineral availability in soils (Villani et al., 2022). It is known that soils dominated by sedges may become enriched in available Si, whereas soils dominated by shrub vegetation may become enriched in available Ca (Mauclet et al., 2022). Climate-change-driven alterations in vegetation communities may also lead to changed element availabilities in Arctic soils. Moreover, other elements like P and Ca are intensively cycled by plants and, thus, the uppermost soil layer becomes enriched in the aforementioned elements (Jobbágy and Jackson, 2001). This points to the importance of biogeochemical interactions between vegetation and soil. However, this approach does not account for the inorganic element pool, which is initially dominated by the bedrock geology. Therefore, the extrapolation of circumpolar Arctic maps of element availability for P, Fe, Ca, Al, and Si based on vegetation distribution alone may be associated with high uncertainties. Much stronger drivers of element availability could be the parent material and lithology (Alloway, 2013).
In this study, we aim to map pan-Arctic soil element bioavailability (for microbes and plants) by applying a lithology-based extrapolation of plot-level sampling data on nutrient availability. We provide maps for the solid ASi fraction and the available Si, Ca, Fe, P, and Al concentrations, as these elements have direct effects on OM binding and GHG emissions from the circumpolar Arctic. In addition, these elements, once transported to marine systems, may affect primary production by diatoms and coccolithophores, as some of the nutrients are limiting for algae and, hence, limit CO2 binding due to algae biomass production. A better understanding of element availability is crucial to reduce uncertainties and allow for the reliable modeling of future scenarios on how Arctic system may respond to global warming.
2.1 General approach
Based on the Geological Map of the Arctic (Harrison et al., 2011), we estimate the bioavailability and potential mobility of Si, Ca, Fe, Al, and P as well as the solid ASi fraction in Arctic soils. We analyzed soil samples from organic, mineral, and permafrost layers from pan-Arctic sampling campaigns. We used the biologically available element concentrations for mineral Si, Ca, Fe, Al, and P as well as the solid ASi fraction of certain lithologies to compile pan-Arctic maps covering 7.6 × 10⁶ km2.
2.2 Sampling and storage
In total, we analyzed 574 Arctic soil samples from 25 locations taken over a period of 1 decade (Fig. 1). To ensure pan-Arctic coverage, we analyzed samples from Siberia (222 samples from 6 locations), North America (115 samples from 6 locations), Greenland (111 samples from 9 locations), northern Europe (13 samples from 1 location), and Svalbard (103 samples from 3 locations) (Figs. 1, S1; Table S1). We analyzed samples from the thawed near-surface organic layer (252 soil samples, mainly 0–20 cm in depth), mineral layer (208 soil samples, mainly 20–50 cm depth), and permafrost layer (104 soil samples, mainly 50–100 cm depth). The sampling design accounted for the spatial variation at single locations (several samples were taken from ∼ 1 km transects). Repeated sampling over months to decades was not possible. We split the annually thawed active layer into the upper organic layer and the mineral layer below based on the C content, except for soils where the organic layer corresponded to the active layer. The organic layer contained mainly organic matter (OM) in different mineralization states. The mineral soil layer has a variable OM content depending on which soil processes have affected this layer, and it reaches to the perennially frozen permafrost layer. We took samples using an auger or a spade and stored them frozen until analysis or as described in previous studies (Faucherre et al., 2018; Kuhry et al., 2020). Samples consisted of 5 to 50 g of frozen soil. Before analysis, the samples were freeze-dried for 48 h and ground. Freeze-drying inhibits the thermal degradation of the soil material and is standard for the Mehlich III extraction and alkaline extraction described below.
2.3 Extraction and analysis
2.3.1 Mehlich III extractions for available element concentrations
Available concentrations of Si, Ca, Fe, Al, and P were quantified using the Mehlich III method (Sims, 1989). Mehlich III extracts the silicic acid that is adsorbed to the soil particle surface as well as the free silicic acid. For Ca, Fe, Al, and P, the extract is defined as the biologically available share of the analyzed elements, in the script labeled as “available”. This fraction includes the element concentrations dissolved in the pore water and the fraction adsorbed to organic and inorganic soil particles. Microbes and plants are able to mobilize this adsorbed share of nutrients. We defined the Mehlich III extraction method to reflect these available element concentrations. Briefly, we extracted 0.5 to 5 g of freeze-dried soil using 10 mL of Mehlich III solution (0.015 M NH4F, 0.001 M EDTA, 0.25 M NH4NO3, 0.00325 M HNO3, and 0.2 M HAc) per gram of soil. The samples were shaken for 5 min at 200 rpm and centrifuged for 5 min at 10 000×g. Following this, the supernatant was filtered using a 0.2 µm cellulose acetate filter. The concentration of Si, Ca, Fe, Al, and P was measured by inductive coupled plasma optical emission spectroscopy (ICP-OES; Vista-PRO radial, Varian Medical Systems, Palo Alto, CA).
2.3.2 Alkaline extraction for the solid fraction of amorphous silicon
For the abstraction of the solid fraction of amorphous silicon (ASi), an alkaline extraction was used (DeMaster, 1981) to extract ASi from 30 mg of freeze-dried soil using 40 mL of 0.1 M Na2CO3 solution at 85 ∘C for 5 h. After 1 h, 3 h, and 5 h, the suspension was mixed, and 10 mL of the supernatant was subsampled, filtered using a 0.2 µm cellulose acetate filter, and analyzed by ICP-OES. The ASi concentration was calculated using a linear regression of the ASi concentration in solution against time, and the intersection with the y axis was used as the available concentration, as per DeMaster (1981). The Mehlich III extract was used to determine the available concentrations of the elements, and the alkaline extraction was used to determine the pool of particulate ASi in the soil. To determine the dry weight (DW) of the samples, 0.5–2 g of frozen material was freeze-dried until it reached a constant weight.
2.4 Statistics
2.4.1 Statistics and graphics
Data were analyzed using RStudio software (R Core Team, 2022). We extracted the original data (lithology, location, and geometry) from GIS polygons (shapefiles from the different regions, including Greenland, Can_USA, Ice, and N_Europa_Russia) of the Geological Map of the Arctic containing the locations. We extracted 14 lithological classes in total. We matched the soil sampling locations for which we obtained element availability data (by extraction; see above) with the GIS polygons (geology) using the ArcView GIS 3.2 extensions “Spatial Analyst” command “analysis: tabulate Areas”. The sum of areas with the same map label was extracted using the map label “shape area”. We considered only terrestrial areas. For every location, we calculated the mean available element concentrations for ASi, Si, Ca, Fe, Al, and P with bootstrapping (boot = 1000) for the organic, mineral, and permafrost layers. We calculated quantiles, the mean, and the standard error using “summarise” from the “dplyr” R package. We clustered the available element concentration data for all locations by lithological class and calculated the mean and standard error for the organic, mineral, and permafrost layers. The number of samples for each lithological class is given in Fig. 1.
2.4.2 Element concentration maps
We used the Geological Map of the Arctic (1:5 000 000 scale, in the Arctic polar region, north of latitude 60∘ N) as the basis for our maps. We calculated the weighted numeric mean concentration for each element in the first 100 cm from the soil surface using Eq. (1). The mean mass fraction (wm) of an element (X) is the sum of the products of the mass fractions in the organic layer (OL), mineral layer (ML), and permafrost layer (PL) and the thickness (d) of each layer in centimeters divided by 100 cm. We colored the represented area based on the element concentration.
3.1 Geographical and lithological representation
Our sampling locations represent 13 of the 17 (76.5 %) original geographic domains (North Asia and North America, ice, and none assigned are missing) defined by the base map (Fig. S1; Tables 1, S2) of the Arctic. The single areas and shares for the maps of Canada and/or Alaska, Greenland, and northern Europe and/or Russia are given in Table S3. Our data represent 17 periods of the Geological Map of the Arctic. The ages range between 2.6 and 2500 Myr ago. The number of samples per age code are shown in Fig S2. Our data represent 14 lithological classes of the Geological Map of the Arctic (Table S4). These 14 lithological classes represent 7.63 × 10¹² m2 of the 1.57 × 10¹³ m2 area (48.49 %) covered by the base map (including ice sheets). Sediments cover 1.03 × 10¹³ m2 of the Arctic. Our data represent sedimentary classes that incorporate 6.77 × 10¹² m2 (65.9 %) of the Arctic sediment cover (Fig. S3). In total, 3.68 × 10¹¹ m2 (49.9 %) of the 7.37 × 10¹¹ m2 of yedoma deposits was represented (Fig. S4). The 14 lithological classes can be observed in the igneous type, comprising extrusive – mafic material (class 1, n=26); the unclassified type, comprising metamorphic undivided material (class 2, n=21); and the sedimentary type, comprising carbonate (class 3, n=24; class 4, n=58; class 5, n=64), clastic – shallow marine (class 6, n=13), clastic – deltaic and nearshore (class 7, n=68), sedimentary – undivided (class 8, n=38; class 9, n=39), clastic – shallow marine (class 10, n=91; class 11, n=60), sedimentary and/or volcanic – undivided (class 12, n=21), and slope and deep water (class 13, n=43; class 14, n=8) material.
Table 1The parameters used in this study, including the areal coverage of the geographical domain, the epochs, the represented area, the lithological class, the sediments, and the yedoma deposition, according to our data. The first column lists the original parameters given by the Geological Map of the Arctic (Harrison et al., 2011) as well as the yedoma deposits (Strauss et al., 2021). The “Represented” column gives absolute numbers with respect to the chronological or lithological classes extrapolated by this study. The represented area is the share of the entire area of the Arctic for each listed parameter according to the Geological Map of the Arctic used in this study.
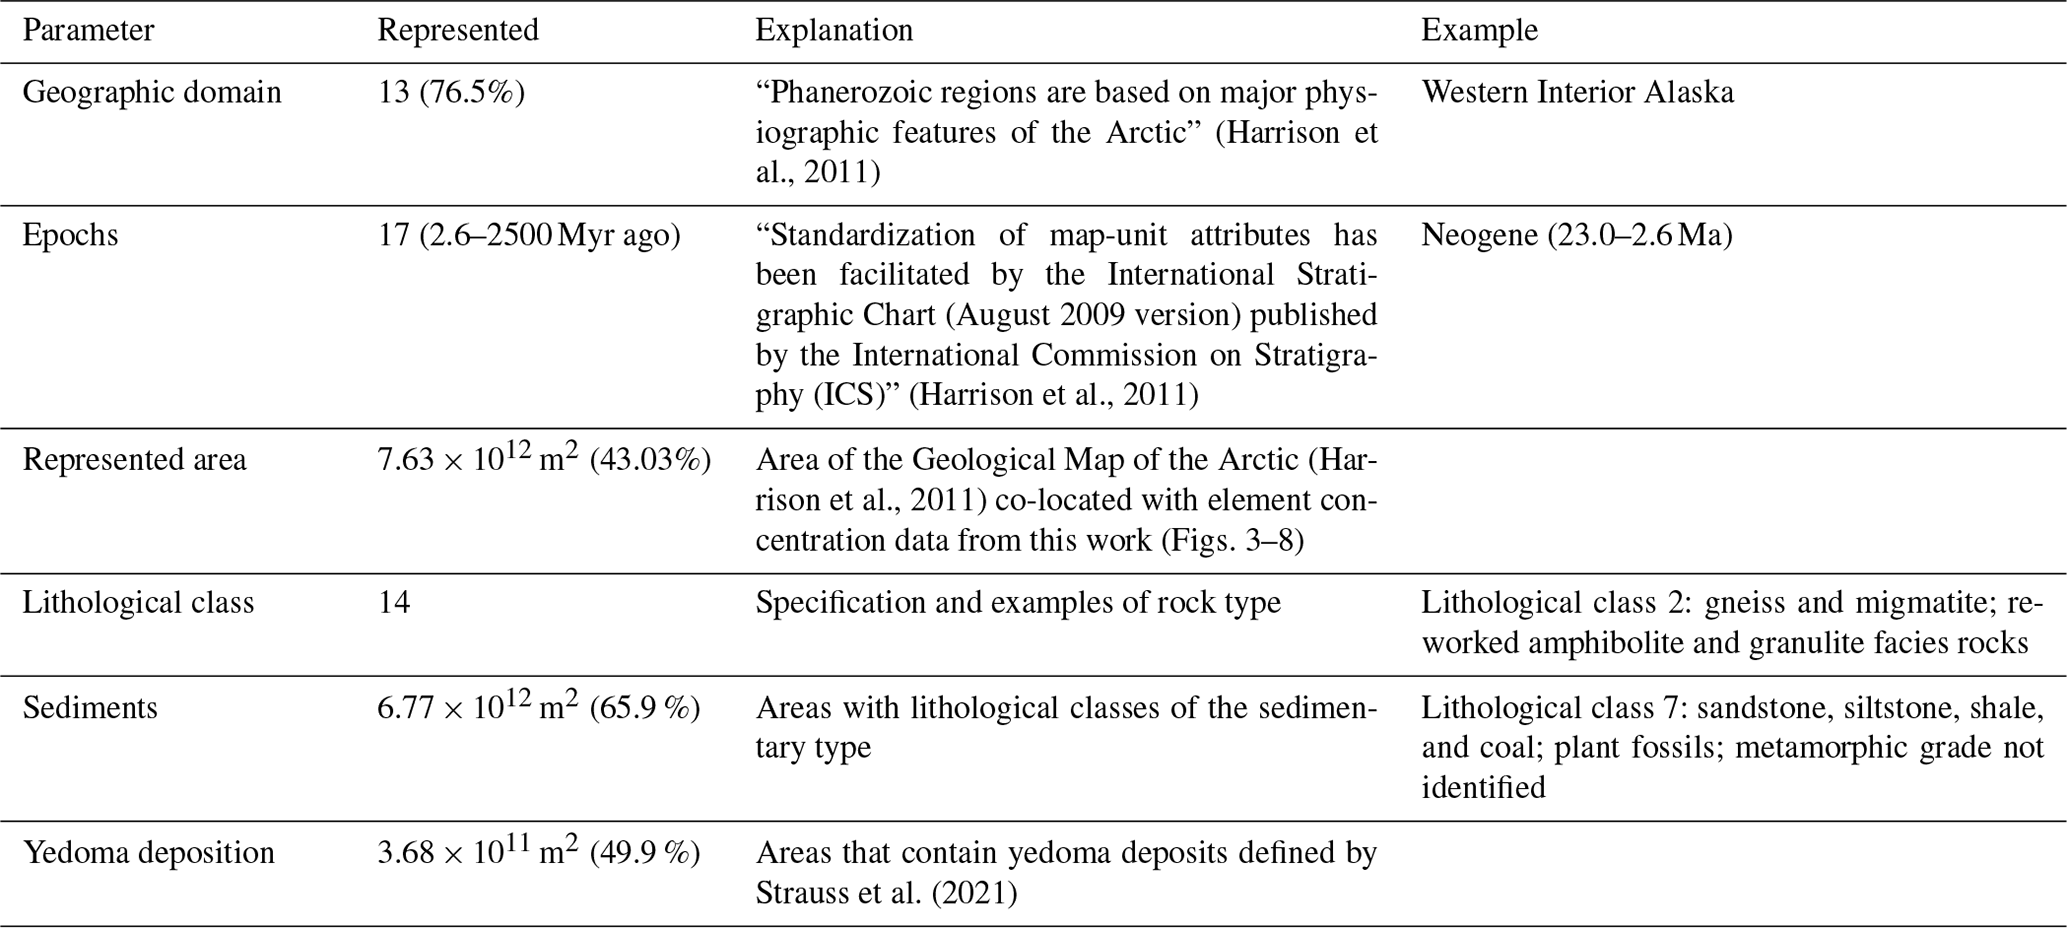
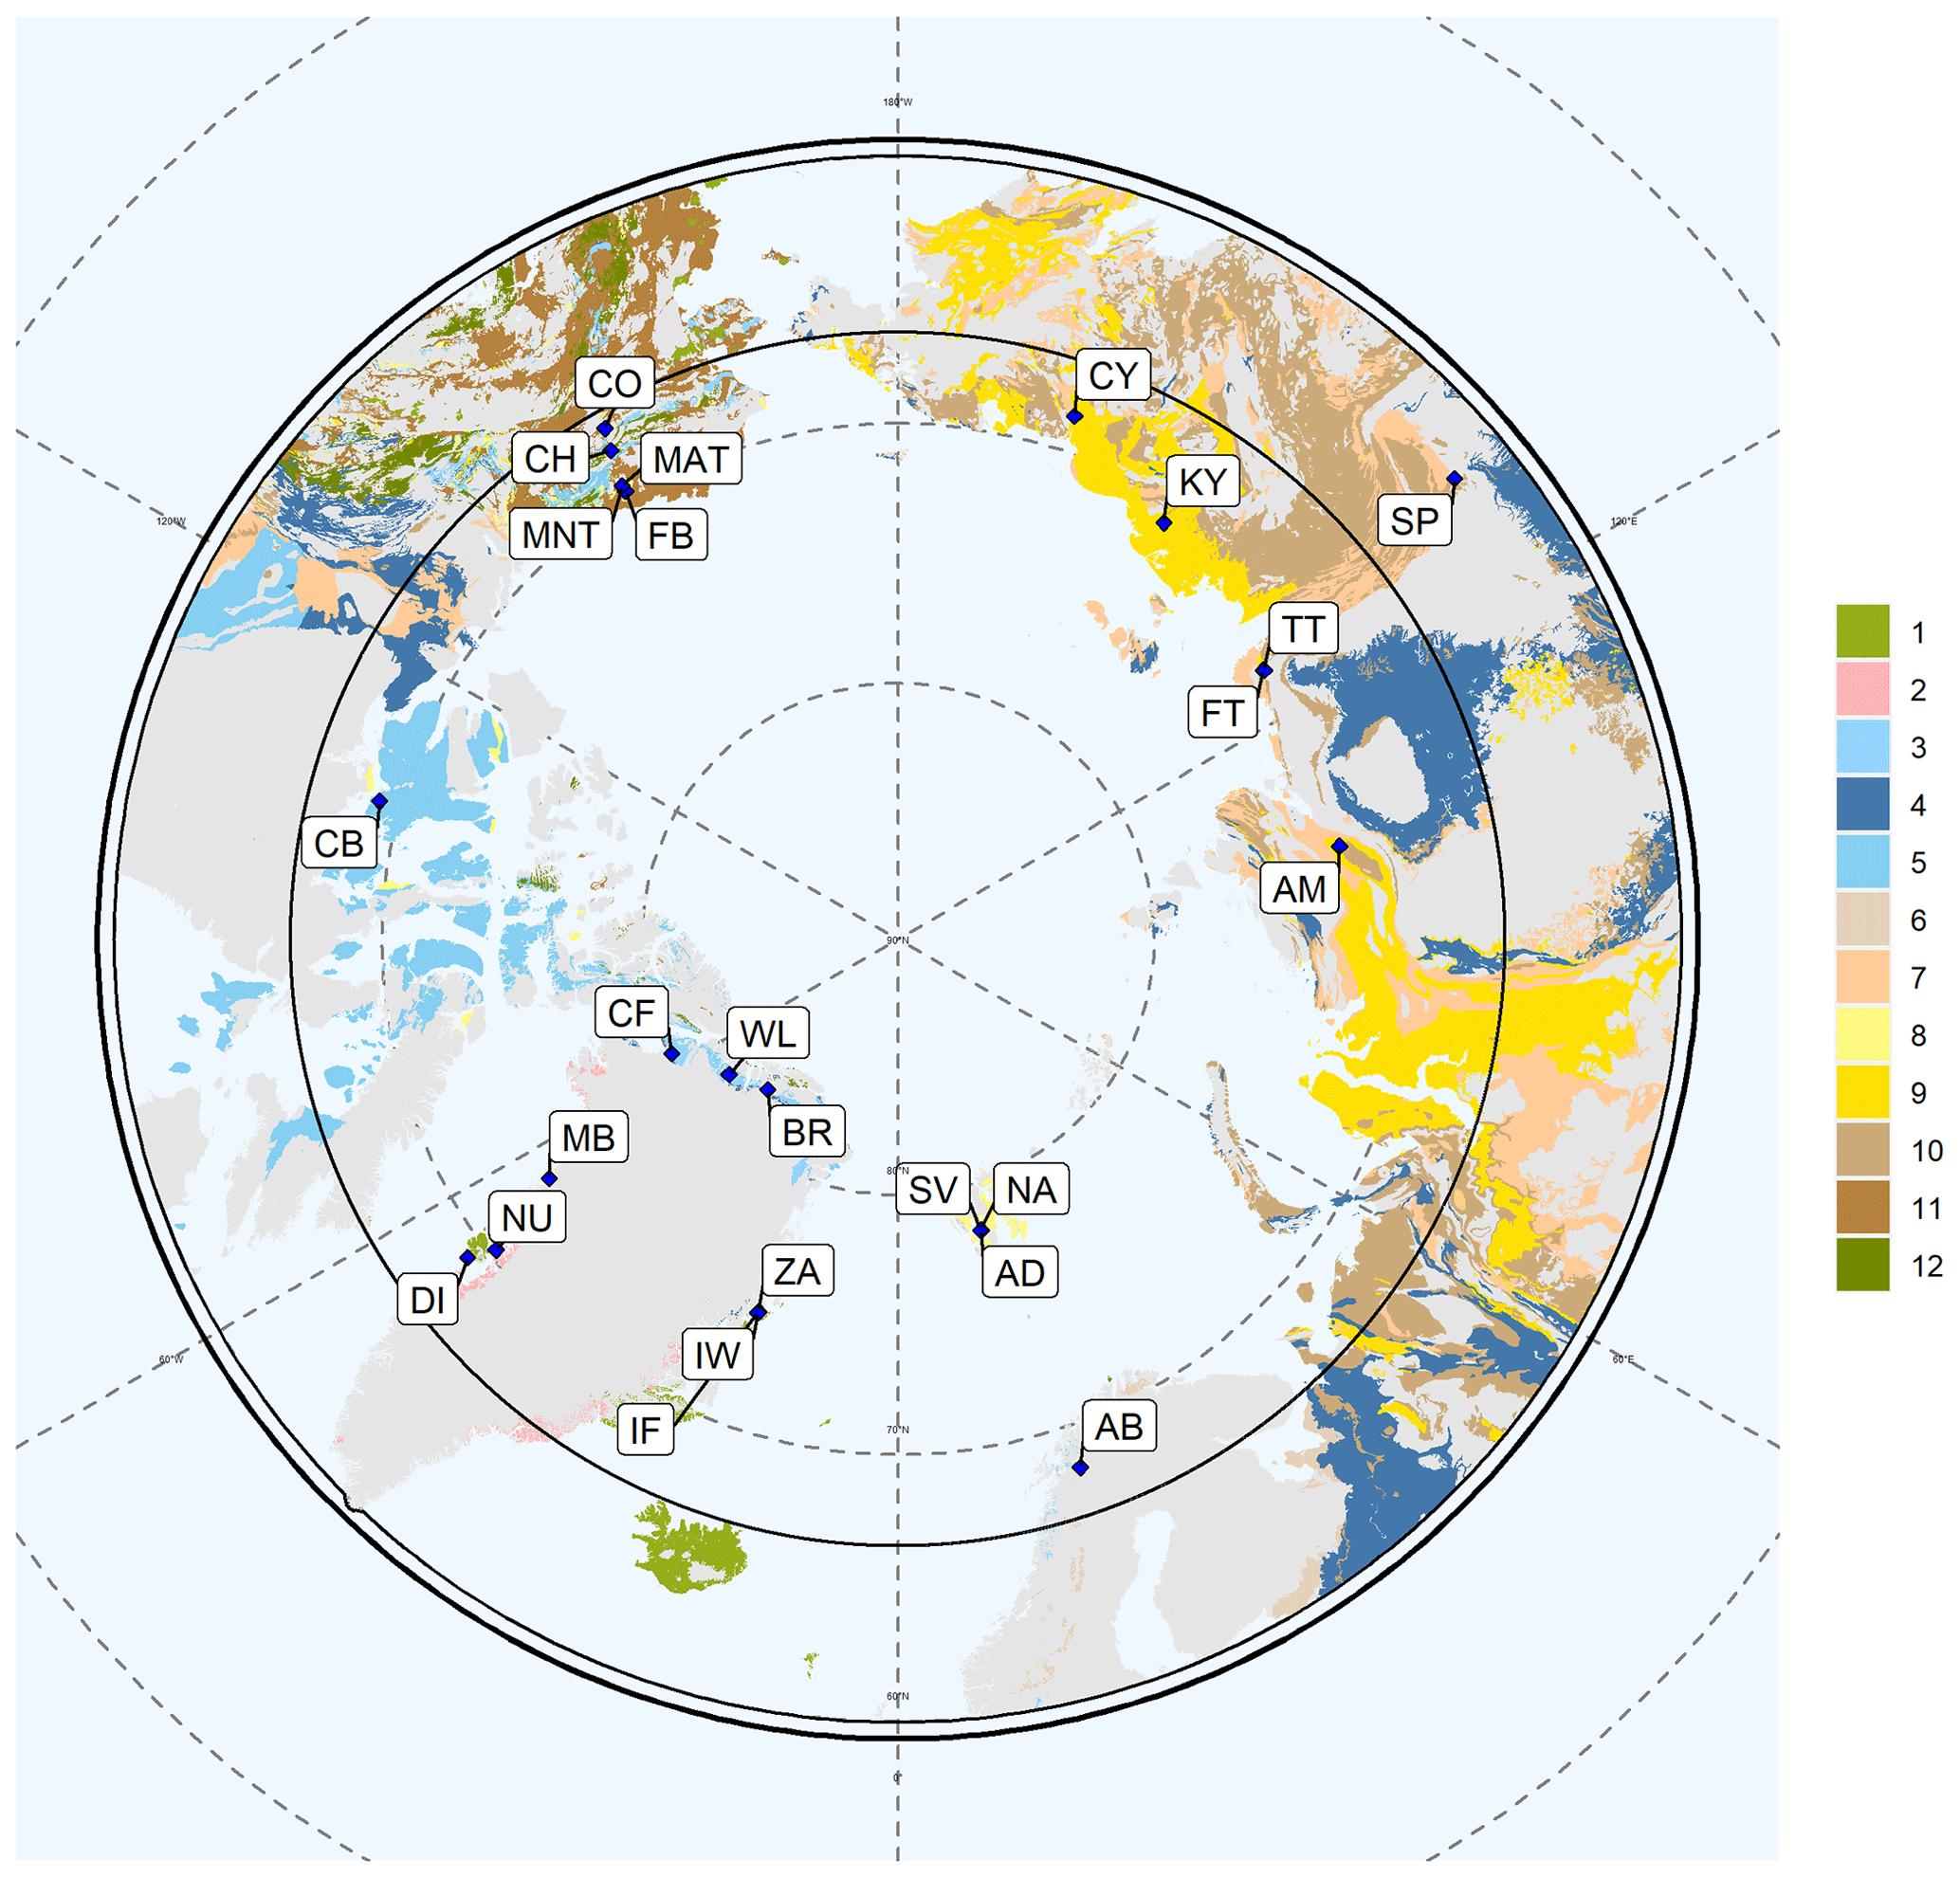
Figure 1Map of the represented lithologies. The Arctic Circle (66.6∘ N) is included as a black circle. Each color represents a bedrock lithology. “1” denotes basalt, olivine basalt, tholeiite, alkali basalt, basanite, pillow basalt, and flood basalt (n=26). “2” represents gneiss and migmatite; reworked amphibolite and granulite facies rocks (n=11). “3” shows limestone, dolostone, shale, evaporites, and chalk; carbonate reefs or metamorphosed equivalent (n=24). “4” denotes limestone, dolostone, shale, evaporites, and chalk; carbonate reefs; metamorphic grade not identified (n=58). “5” represents limestone, dolostone, shale, evaporites and, chalk; carbonate reefs (n=64). “6” shows quartz sandstone, siltstone, claystone, limestone, dolostone, conglomerate, and tillite (n=13). “7” denotes sandstone, siltstone, shale, and coal; plant fossils; metamorphic grade not identified (n=68). “8” represents sandstone, siltstone, shale, and limestone (n=38). “9” shows sandstone, siltstone, shale, and limestone; metamorphic grade not identified (n=39). “10” denotes sandstone, siltstone, and shale; marine fossils (n=91). “11” represents sandstone, siltstone, and shale; marine fossils; metamorphic grade not identified (n=60). “12” shows sedimentary and/or volcanic rock; undivided (n=21). “13” denotes shale, chert, iron formation, greywacke, turbidite, argillaceous limestone, and matrix-supported conglomerate (n=43). “14” represents shale, chert, iron formation, greywacke, turbidite, argillaceous limestone, and matrix-supported conglomerate or metamorphosed equivalent (n=8). Gray color presents areas of the base map that are not represented by our element concentration data. The location abbreviations are as follows: CH – Alaska, Chandalar; CO – Alaska, Coldfoot; FB – Alaska, Franklin Bluffs, dry; MAT – Alaska, moist acidic tundra; MNT – Alaska, moist non-acidic tundra; CB – Canada, Cambridge Bay; BR – Greenland, Brønlund; CF – Greenland, Cass Fjord; DI – Greenland, Disko; MB – Greenland, Melville Bay; NU – Greenland, Nuussuaq; WL – Greenland, Warming Land; ZA – Greenland, Zackenberg; IW – Greenland, Zackenberg, ice wedge; IF – Greenland, Zackenberg, infilling fan; AM – Russia, Ary-Mas; CY – Russia, Chersky; KY – Russia, Kytalyk; FT – Russia, Lena Delta, first terrace; TT – Russia, Lena Delta, third terrace; SP – Russia, Spasskaya; AB – Sweden, Abisko; AD – Svalbard, Adventdalen; NA – Svalbard, Adventalen; SV – Svalbard. This map is based on the Geological Map of the Arctic (Harrison et al., 2011).
3.2 Element availabilities across lithological classes at 0–1 m depth
The lithological classes differed substantially with respect to their element availabilities (Figs. 2, S5). The main findings were as follows:
-
We found a large range of ASi concentrations in the Arctic, covering values from 0.03 ± 0 mg g−1 DW ASi to 6.68 ± 1.17 mg g−1 DW ASi. The highest concentrations of ASi were found in basalt and associated rock (class 1: 6.68 ± 1.17 mg g−1 DW ASi), gneiss and associated rock (class 2: 4.11 ± 1.24 mg g−1 DW ASi), and sandstone and associated rock (class 9: 2.01 ± 0.24 mg g−1 DW ASi; class 10: 2.06 ± 0.01 mg g−1 DW ASi). ASi concentrations were the lowest in limestone (class 3: 0.03 ± 0 mg g−1 DW ASi) (Fig. 2).
-
Available Si concentrations were highest in limestone and associated rock, including shale (class 4: 5.65 ± 0.78 mg g−1 DW Si); quartz sandstone (class 6: 6.61 ± 1.83 mg g−1 DW Si); and sandstone (class 7: 5.46 ± 0.66 mg g−1 DW Si). Si concentrations were lowest in limestone and associated rock (class 3: 0.1 ± 0.02 mg g−1 DW Si) (Fig. 2). The differences in the available Si concentrations between the two classes of limestone are mainly driven by the presence of shale in one class that acts as source of silicic acid.
-
The highest available Ca concentrations were observed in limestone (which consist of CaCO3) and associated rock (class 3: 10.73 ± 2.15 mg Ca g−1 DW), sedimentary and/or volcanic rock (class 12: 8.77 ± 0.12 mg Ca g−1 DW), and sandstone and associated rock (class 8: 8.06 ± 0.36 mg Ca g−1 DW). Ca concentrations were lowest in gneiss (class 2: 0.05 ± 0.02 mg Ca g−1 DW) (Fig. 2). The data are consistent with the expectation that the highest Ca availability will be found in Ca-containing bedrock.
-
Available Fe concentrations were highest in shale and associated rock (class 13: 2.93 ± 0.45 mg g−1 DW Fe), limestone (class 4: 2.28 ± 0.32 mg g−1 DW Fe), and quartz sandstone (class 6: 2.49 ± 0.69 mg g−1 DW Fe). The lowest Fe concentrations were observed in lithological limestone and associated rock (class 3: 0.01 ± 0.001 mg g−1 DW Fe) (Fig. 2).
-
The highest available Al concentrations were observed in quartz sandstone (class 6: 2.52 ± 0.70 mg g−1 DW Al), sandstone (class 7: 1.63 ± 0.20 mg g−1 DW Al), and shale and associated rock (class 13: 1.5 ± 0.23 mg g−1 DW Al). The lowest Al concentrations were observed in limestone and associated rock (class 3: 0.02 ± 0 mg g−1 DW Al) (Fig. 2).
-
High available P concentrations were observed in limestone and associated rock (class 4: 0.31 ± 0.04 mg g−1 DW P), sandstone (class 7: 0.19 ± 0.02 mg g−1 DW P), and shale and associated rock (class 14: 0.15 ± 0.05 mg g−1 DW P). P concentrations were lowest in basalt and associated rock (class 1: 0.0116 ± 0.002 mg g−1 DW P) (Fig. 2).
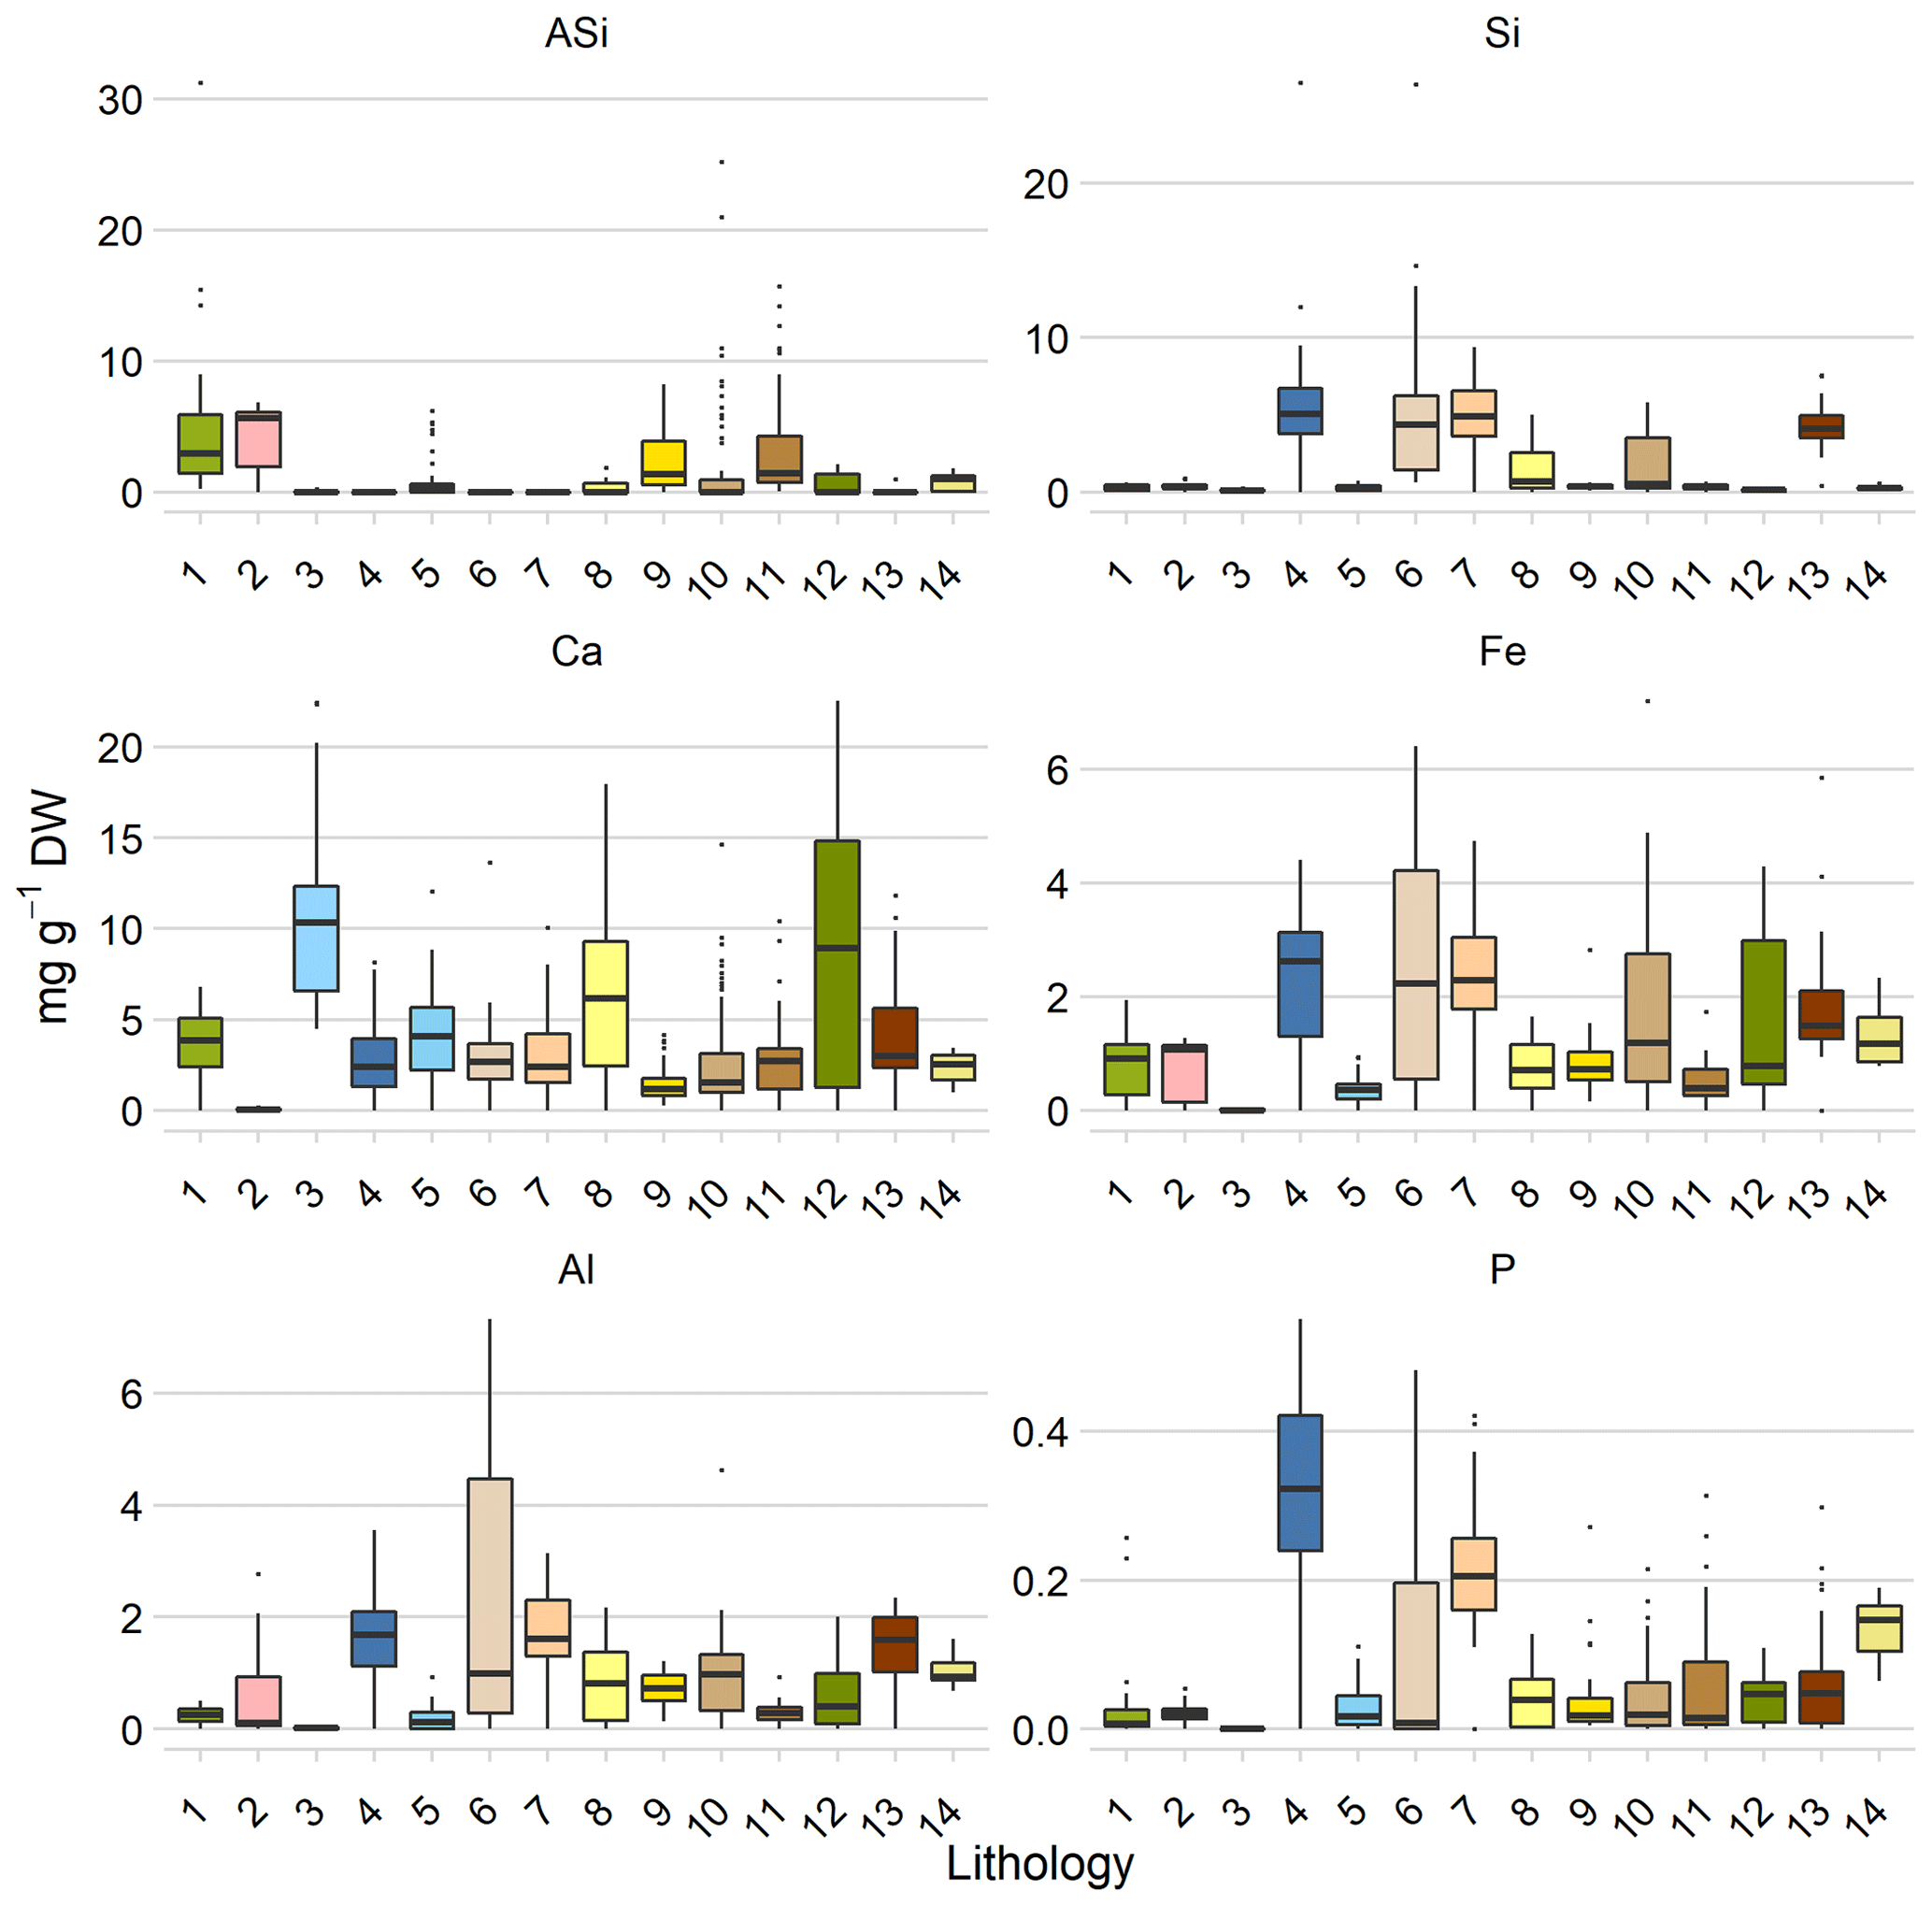
Figure 2Element concentrations related to lithology. Lithology class 1 is igneous, class 2 is metamorphic, and the other classes are either sedimentary or sedimentary and mixed. Each color represents a bedrock lithology. “1” denotes basalt, olivine basalt, tholeiite, alkali basalt, basanite, pillow basalt, and flood basalt (n=26). “2” represents gneiss and migmatite; reworked amphibolite and granulite facies rocks (n=11). “3” shows limestone, dolostone, shale, evaporites, and chalk; carbonate reefs or metamorphosed equivalent (n=24). “4” denotes limestone, dolostone, shale, evaporites, and chalk; carbonate reefs; metamorphic grade not identified (n=58). “5” represents limestone, dolostone, shale, evaporites, and chalk; carbonate reefs (n=64). “6” shows quartz sandstone, siltstone, claystone, limestone, dolostone, conglomerate, and tillite (n=13). “7” denotes sandstone, siltstone, shale, and coal; plant fossils; metamorphic grade not identified (n=68). “8” represents sandstone, siltstone, shale, and limestone (n=38). “9” shows sandstone, siltstone, shale, and limestone; metamorphic grade not identified (n=39). “10” denotes sandstone, siltstone, and shale; marine fossils (n=91). “11” represents sandstone, siltstone, and shale; marine fossils; metamorphic grade not identified (n=60). “12” shows sedimentary and/or volcanic rock; undivided (n=21). “13” denotes shale, chert, iron formation, greywacke, turbidite, argillaceous limestone, and matrix-supported conglomerate (n=43). “14” represents shale, chert, iron formation, greywacke, turbidite, argillaceous limestone, and matrix-supported conglomerate or metamorphosed equivalent (n=8). All values are given as the mean and standard error. The distribution of the lithological classes is shown in Fig. 1, and the assignment to the geographic domain is given in Table S5.
3.3 Maps of the element concentrations at 1 m depth
3.3.1 Amorphous silicon in the top 1 m
We found the highest concentrations of ASi in the Arctic North Atlantic region (Fig. 3). Here, basalt and gneiss are dominant (lithological classes 1 and 2, respectively) and contained concentrations of 4.11 ± 1.24 to 6.68 ± 1.17 mg ASi g−1 DW. Other high concentrations of ASi were found for the Brooks Range (Alaska), Chukotka and the Arctic shelf (eastern Siberia), and the West Siberian Basin. These soils contained 2.01 ± 0.24 mg ASi g−1 DW (lithological class 9). The Verkhoyansk–Kolyma region showed a lower concentration of 1.48 ± 0.16 mg ASi g−1 DW (lithological class 11). We found similar concentrations (class 5: 1.24 ± 0.14 mg ASi g−1 DW) for the Canadian Shield. We found low concentrations of 0.31 ± 0.01 mg ASi g−1 DW (lithological class 12) in western Interior Alaska and western parts of the Brooks Range, Alaska, Chukotka, and the Arctic shelf. Increasing the active layer depth will potentially release higher ASi concentrations from permafrost soils (Fig. S6) in the Canadian Shield, as the concentration in the permafrost layer is 2.80 ± 2.50 mg ASi g−1 DW (lithological class 5) compared with 1.24 ± 0.14 mg ASi g−1 DW in the current active layer (Table S4). A further increase in the ASi concentration can be expected for the Arctic North Atlantic region due to permafrost thaw, as the concentration is 8.68 ± 2.51 mg ASi g−1 DW in the permafrost layer compared with the 4.11 ± 1.24 mg ASi g−1 DW of the current active layer (lithological class 1) (Fig. S6, Table S4). However, the permafrost layer in Siberia contains lower concentrations of ASi (class 9: 0.77 ± 0.23 mg ASi g−1 DW; class 11: 1.38 ± 0.28 mg ASi g−1 DW) compared with the current active layer, which has concentrations of 2.01 ± 0.24 mg ASi g−1 DW (lithological class 9) and 1.48 ± 0.16 mg ASi g−1 DW (lithological class 11), probably leading to lower overall ASi concentrations with proceeding thaw. The variability in the ASi data is high for lithological classes 1, 2, 9, and 11.
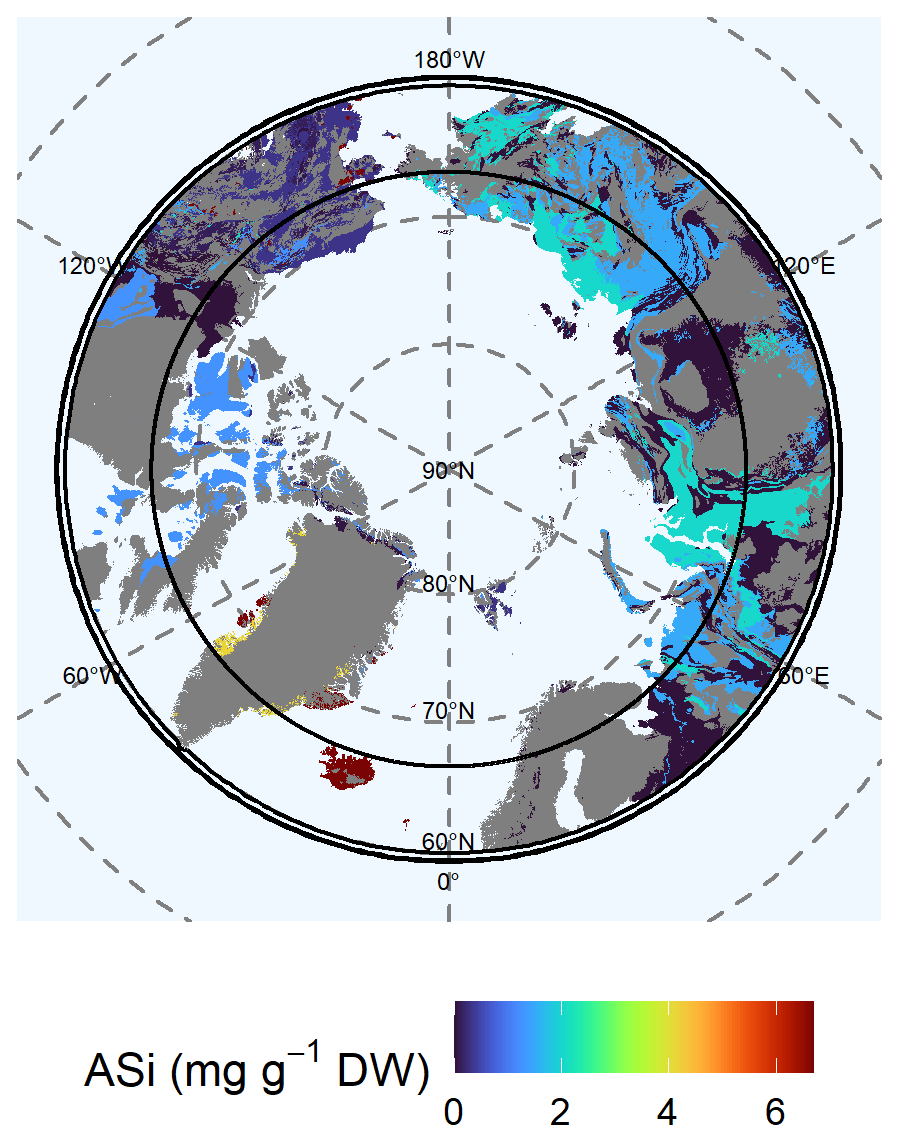
Figure 3Map of the mean concentration of amorphous silicon (ASi) in the top 100 cm of soils. For each lithological class, the mean concentration is shown. Gray shaded areas are not represented by our data.
3.3.2 Silicon at 0–1 m depth
Available (Mehlich-III-extractable) Si (Fig. 4), extracted as silicic acid, showed a different distribution than the solid fraction of ASi (Fig. 3). High available Si concentrations were generally associated with sediments. The available Si extracted via Mehlich III extraction is water-soluble Si as well as Si bound to the surface of soil particles (Schaller et al., 2021). We found high concentrations (5.65 ± 0.78 mg Si g−1 DW) for lithological class 4 in the West Siberian Basin and the West Siberian Plain. Other regions with high available Si concentrations were the East European Plain, the Ural Mountains, and the Canadian Shield. Another lithological class with high available Si concentrations (4.51 ± 0.69 mg Si g−1 DW) was class 13, located in the Innuitian region, North Greenland, and Alaska. In Alaska, lithological class 10, which has moderately high concentrations of available Si (2.06 ± 0.03 mg Si g−1 DW), is also abundant. We found low concentrations of available Si (class 9: 0.36 ± 0.05 mg Si g−1 DW) for the Brooks Range, Chukotka, the Arctic shelf, the West Siberian Basin, and the West Siberian Plain. In addition, the Verkhoyansk–Kolyma region, the East European Plain, and the Ural Mountains were poor in available Si (class 11: 0.39 ± 0.04 mg Si g−1 DW). The lowest available concentrations (class 12: 0.15 ± 0.01 mg Si g−1 DW) were observed in western Interior Alaska. An increasing thawing depth may potentially increase the available Si concentrations in the western Verkhoyansk–Kolyma region to the East European Platform, as the concentration in the permafrost layer is 6.26 ± 1.52 mg Si g−1 DW (lithological class 4) compared with the lower available Si concentration (class 4: 5.56 ± 0.78 mg Si g−1 DW) of the current active layer (Fig. S6, Table S4). The variability in the data of available Si is high for lithological classes 4, 6, and 7.
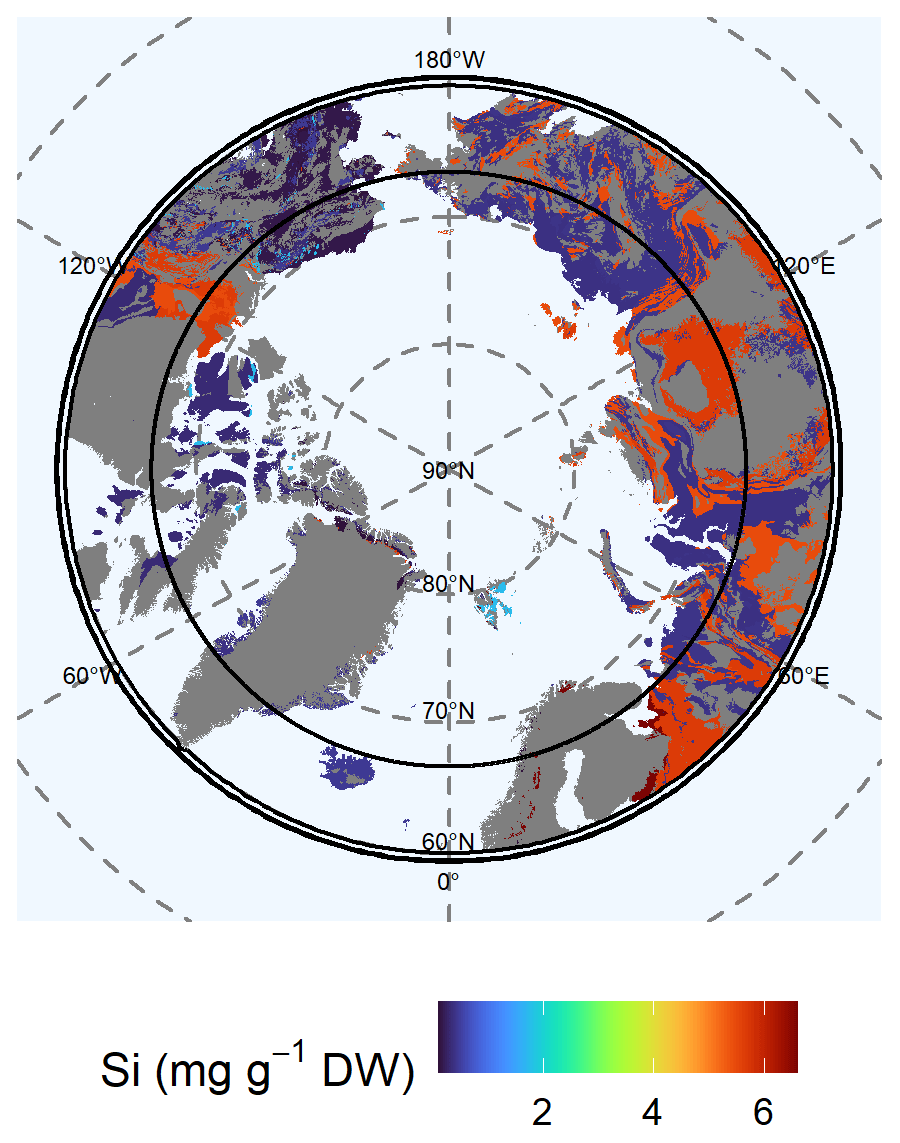
Figure 4Map of the mean concentration of available (Mehlich-III-extractable) silicon (Si) for the uppermost 100 cm of soils. For each lithological class, the mean concentration is shown. Blue colors represent low concentrations of available Si, whereas red colors represent high concentrations. Gray shaded areas are not represented by our data.
3.3.3 Calcium at 0–1 m depth
The highest available (Mehlich-III-extractable) Ca concentrations in soils were found in limestone and associated rock (class 3: 10.73 ± 2.15 mg Ca g−1 DW) in North Greenland, Alaska, and the Canadian Shield (class 5: 3.79 ± 0.45 mg Ca g−1 DW) (Fig. 5). In particular, limestone shows high solubility under the acidic conditions used in the Mehlich III extraction and, thus, presents high concentrations of available Ca. In addition, supracrustal rocks in Alaska contained very high available Ca concentrations (class 12: 8.77 ± 0.12 mg Ca g−1 DW). Mafic rocks in the Arctic North Atlantic region (class 1: 3.65 ± 0.70 mg Ca g−1 DW) contained moderate available Ca concentrations. We found moderate to low available Ca concentrations (class 11: 2.88 ± 0.32 mg Ca g−1 DW) for soils of the Verkhoyansk–Kolyma region, the East European Plain, and the Ural Mountains. Large regions of eastern and western Siberia and the Siberian Plain were poor in available Ca (class 9: 1.51 ± 0.14 mg Ca g−1 DW; class 4: 2.56 ± 0.34 mg Ca g−1 DW). The available Ca concentrations of the permafrost layer for Alaska (class 12: 10.42 ± 2.08 mg Ca g−1 DW) is higher than in the active layer (2.93 ± 0.45 mg Ca g−1 DW) (Fig. S6). In the largest part of Siberia and the Canadian Shield, the available Ca concentrations are slightly lower in the permafrost layer (class 4: 2.15 ± 0.96 mg Ca g−1 DW; class 7: 1.59 ± 0.32 mg Ca g−1 DW) than in the active layer (class 4: 2.56 ± 0.34 mg Ca g−1 DW; class 7: 1.51 ± 0.14 mg Ca g−1 DW) (Fig. S6, Table S4). The variability in the data of available Ca is high for lithological classes 1, 3, 5, and 6.
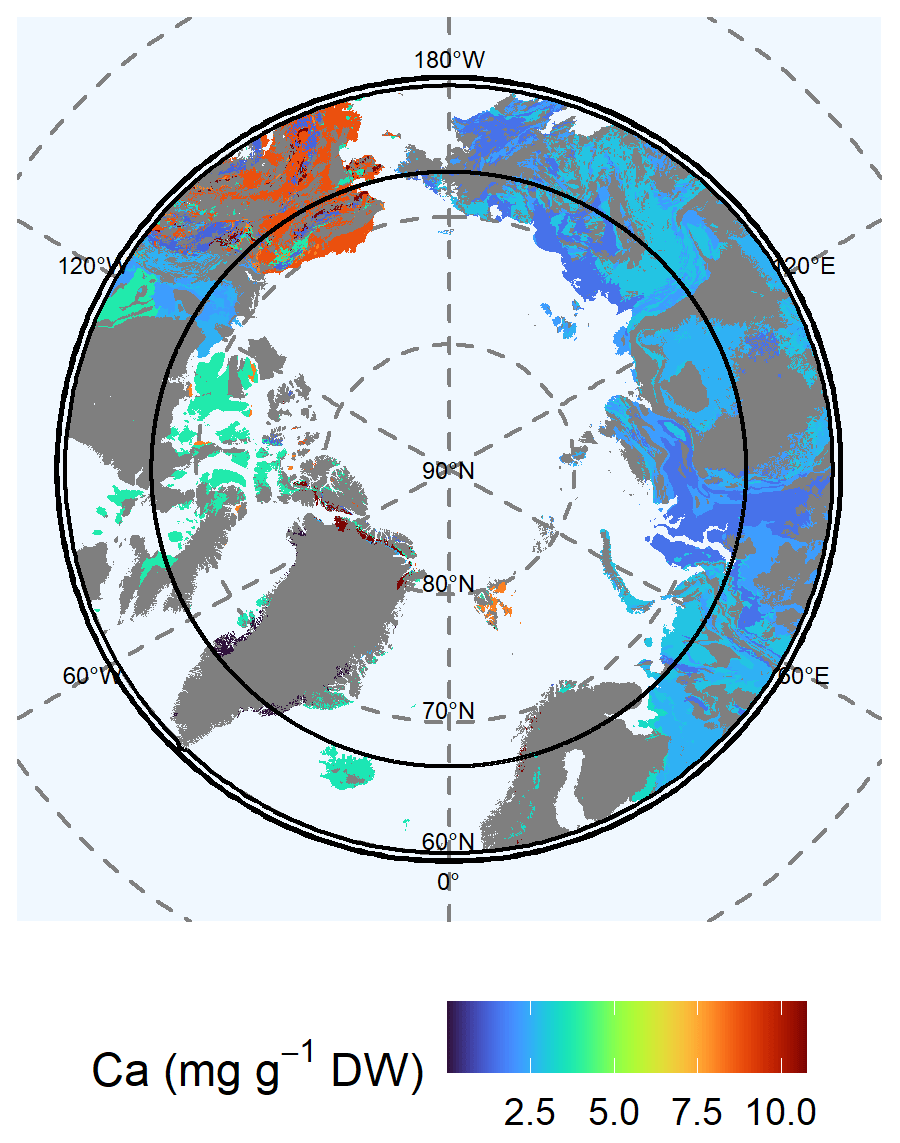
Figure 5Map of the mean concentration of available (Mehlich-III-extractable) calcium (Ca) for the uppermost 100 cm of soils. For each lithological class, the mean concentration is shown. Blue colors represent low concentrations of Ca, whereas red colors represent high concentrations. Gray shaded areas are not represented by our data.
3.3.4 Iron (Fe) at 0–1 m depth
Available (Mehlich-III-extractable) Fe concentrations were higher in the eastern Arctic than in the western Arctic (Fig. 6). We found the highest concentrations in northern Greenland (class 13: 2.93 ± 0.45 mg Fe g−1 DW). The soils of lithological class 4 in the West Siberian Basin and the Siberian and Canadian plains contained 2.28 ± 0.32 mg Fe g−1 DW. The Verkhoyansk–Kolyma region showed similar Fe concentrations (class 7: 2.21 ± 0.27 mg Fe g−1 DW). Moderate to high Fe concentration were found for igneous mafic rocks in Iceland and Greenland (class 1: 0.94 ± 0.18 mg Fe g−1 DW) and for supracrustal rocks in Alaska (class 12: 1.24 ± 0.14 mg Fe g−1 DW). The Chukotka region and western Siberia were relatively poor in Fe (class 9: 0.83 ± 0.13 mg Fe g−1 DW). Eastern Siberia and northern Europe contained even lower Fe concentrations (class 11: 0.49 ± 0.04 mg Fe g−1 DW). Available Fe concentrations in the Canadian Shield were similarly low (class 12: 0.41 ± 0.06 mg Fe g−1 DW). We expect increasing Fe concentrations for the Canadian and Greenland shields due to predicted future thaw of the permafrost layer, as the Fe concentrations in the permafrost layer (class 5: 0.61 ± 0.15 mg Fe g−1 DW) and in parts of Alaska (class 14: 1.97 ± 0.3 mg Fe g−1 DW) are higher compared with the current active layer (class 5: 0.41 ± 0.05 mg Fe g−1 DW) and other parts of Alaska (class 14: 1.08 ± 0.38 mg Fe g−1 DW) (Fig. S7, Table S4). The variability in the data of available Fe is high for lithological classes 2 and 6.
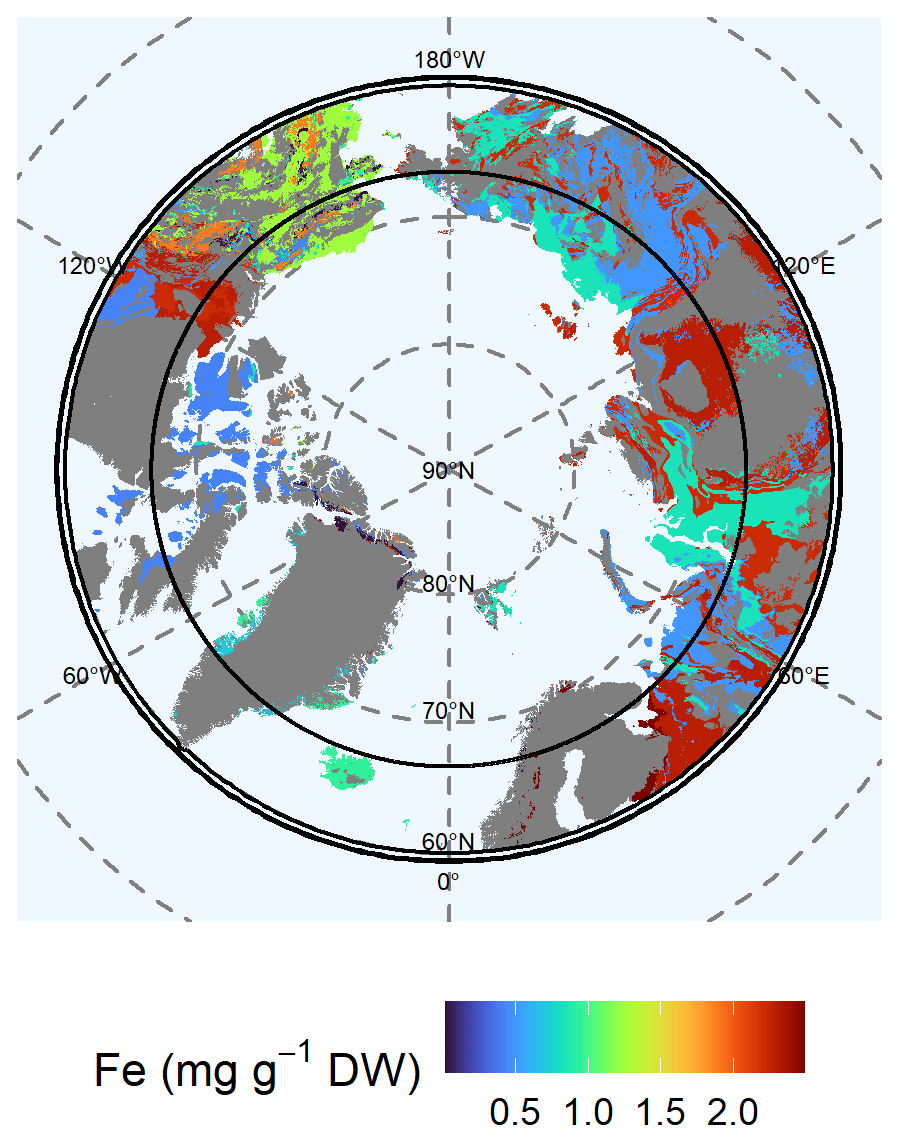
Figure 6Map of the mean concentration of available (Mehlich-III-extractable) iron (Fe) for the uppermost 100 cm of soils. For each lithological class, the mean concentration is shown. Blue colors represent low concentrations of Fe, whereas red colors represent high concentrations Gray shaded areas are not represented by our data.
3.3.5 Aluminum at 0–1 m depth
Northern Europe contained the highest concentrations of available (Mehlich-III-extractable) Al (class 6: 2.52 ± 0.7 mg Al g−1 DW) (Fig. 7). Relatively high concentrations of available Al were also distributed over Siberia and the Canadian Shield (class 7: 1.63 ± 0.02 mg Al g−1 DW; class 4: 1.57 ± 0.22 mg Al g−1 DW). Parts of Alaska contained moderate available Al concentrations (class 10: 0.94 ± 0.06 mg Al g−1 DW; class 13: 1.5 ± 0.23 mg Al g−1 DW), whereas areas represented by supracrustal rocks were poor in available Al (class 12: 0.47 ± 0.06 mg Al g−1 DW). We found relatively low concentrations (0.73 ± 0.01 mg Al g−1 DW) of available Al for Chukotka and for eastern and western Siberia in lithological class 9. The Verkhoyansk–Kolyma region and the East European Plain showed the lowest available Al concentrations (class 11: 0.26 ± 0.02 mg Al g−1 DW) as did the Canadian Shield (class 5: 0.21 ± 0.03 mg Al g−1 DW). An increasing thawing depth may increase the available Al concentration via the predicted thaw of the permafrost layer in northern Europe, as the Al concentration in the permafrost layer is 4.88 ± 1.02 mg Al g−1 DW (lithological class 6) compared with the current active layer (2.52 ± 0.7 mg Al g−1 DW; lithological class 6); moreover, across the Greenland and Canadian shields, the available Al concentration via the predicted thaw of the permafrost layer is 0.3 ± 0.07 mg Al g−1 DW (lithological class 5) compared with the current active layer (0.21 ± 0.03 mg Al g−1 DW; lithological class 5) (Fig. S7, Table S4). The variability in the data of available Al is high for lithological classes 2 and 6.
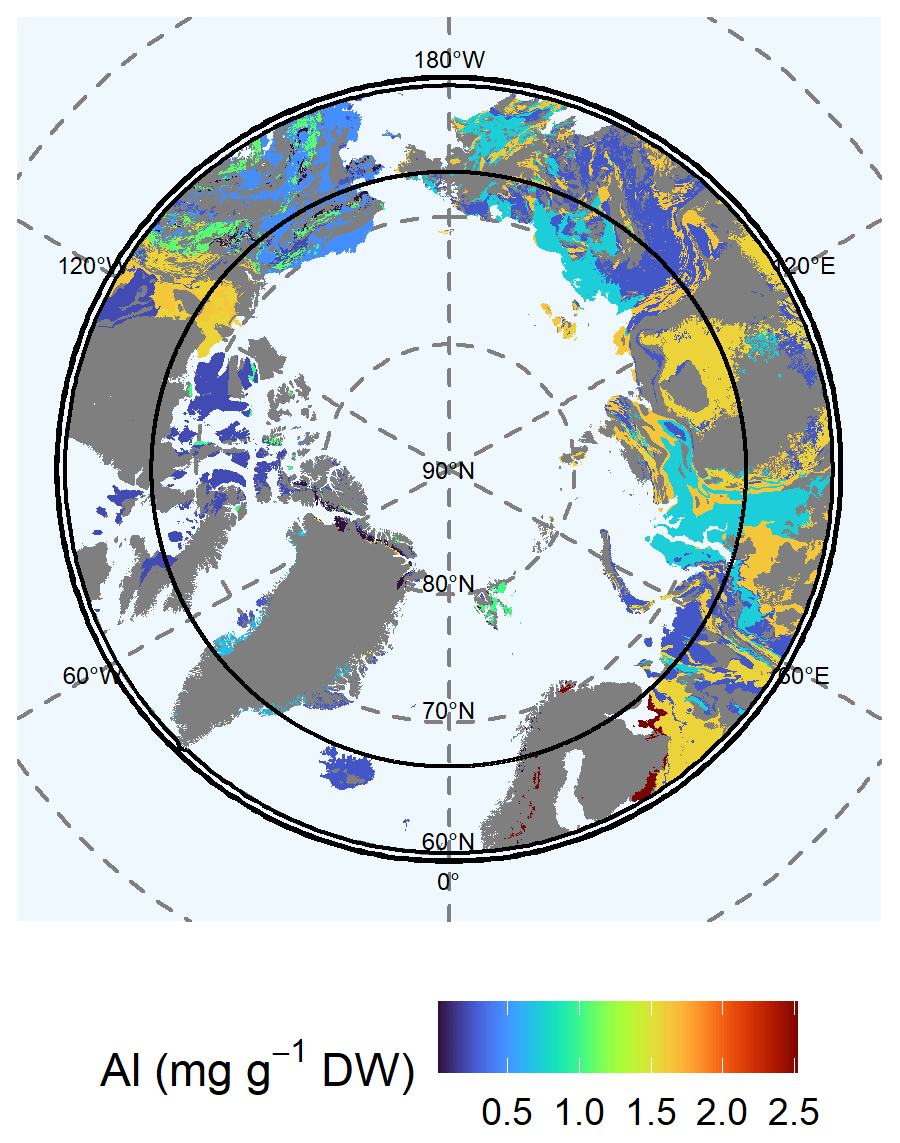
Figure 7Map of the mean concentration of available (Mehlich-III-extractable) aluminum (Al) for the uppermost 100 cm of soils. For each lithological class, the mean concentration is shown. Blue colors represent low concentrations of Al, whereas red colors represent high concentrations. Gray shaded areas are not represented by our data.
3.3.6 Phosphorous at 0–1 m depth
We found the highest available (Mehlich-III-extractable) P concentrations for the West Siberian Basin, the Canadian Shield, and the Siberian and East European plains (class 4: 0.306 ± 0.042 mg P g−1 DW) (Fig. 8). In the Chukotka region, the available P concentrations were 0.189 ± 0.023 mg P g−1 DW (lithological class 7). We found moderate available P concentrations for northern Europe (class 6: 0.123 ± 0.034 mg P g−1 DW) and Alaska (class 14: 0.153 ± 0.054 mg P g−1 DW). Wide areas of supracrustal rocks in Alaska were poor in available P (class 12: 0.024 ± 0.004 mg P g−1 DW). The Canadian Shield (class 5: 0.037 ± 0.005 mg P g−1 DW), the Verkhoyansk–Kolyma region, the East European Plain (class 11: 0.017 ± 0.002 mg P g−1 DW), and the Chukotka region (class 9: 0.030 ± 0.003 mg P g−1 DW) were also poor in P. Due to permafrost thaw, we expect increasing available P concentrations for the Canadian Shield, as the available P concentration in the permafrost layer is 0.06 ± 0.01 mg P g−1 DW (lithological class 5) compared with the current active layer concentration of 0.04 ± 0.005 mg P g−1 DW (lithological class 5) (Fig. 7, Table S4). The variability in the data of available P is high for lithological classes 4, 6, and 7.
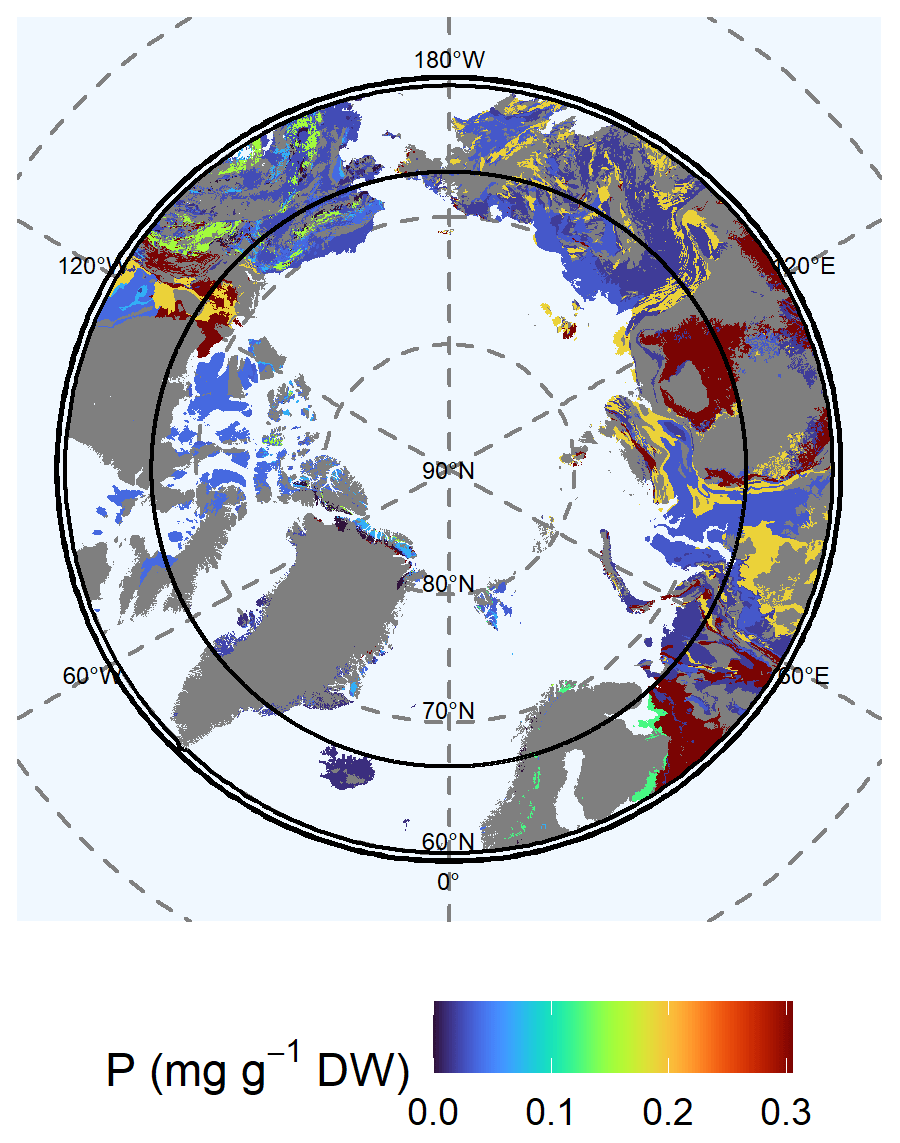
Figure 8Map of the mean concentration of available (Mehlich-III-extractable) phosphorous (P) for the uppermost 100 cm of soils. For each lithological class, the mean concentration is shown. Blue colors represent low concentrations of P, whereas red colors represent high concentrations. Gray shaded areas are not represented by our data.
4.1 Element availability in relation to lithology and geography
We found large differences in the availability of all of the analyzed elements among the different lithology classes in the Arctic. The igneous lithological type, for example, is dominated by alkaline and Ca-rich basaltic rocks from Alaska. Sedimentary rocks cover a wide range of pH values, as sediments of diverse origin can contribute to form a sedimentary rock (Schirrmeister et al., 2011). In regions with fluvial deposition (e.g., in yedoma-affected areas), the soil-forming material may differ from the underlying bedrock (Kokelj et al., 2017). Limestone sediments, for example, differ with respect to their available Fe and P contents, depending on whether their origin is biological (lithological class 4), physical, or chemical. Sandstone can also contain high available Fe concentrations, but it is mainly comprised of available Si (lithological classes 7 and 8) (Yurchenko et al., 2019). Previously, no map outlining the availability of Si, Ca, Fe, P, and Al in Arctic soils existed, and only a map of ASi stocks (but not concentrations) was available. Our maps show the element concentrations available for both plants and microbes. Furthermore, we show the potential changes in element availability due to a deepening of the active layer, element export by runoff from thawed soil, and thermokarst processes.
4.2 Relevance of element availability in a dynamic Arctic
Nutrient cycles and limitations have been identified as important for improving estimations of high-latitude ecosystem vegetation functional parameters, like gross primary production (GPP) (Chadburn et al., 2017). Therefore, the dataset presented in our study could serve as a basis to provide soil nutrient concentrations for biogeochemical models that are capable of considering nutrient limitations in permafrost ecosystems. Our maps cover nearly the half of the Arctic area. The distribution of ASi in Arctic regions was first estimated by Alfredsson et al. (2016), who presented maps of ASi stocks (not concentrations) related to vegetation cover (covering 30 soil profiles). Elements like Si and Ca are accumulated by plants, depending on the vegetation type (Jobbágy and Jackson, 2001; Mauclet et al., 2022). Therefore, the effect of the current vegetation on element availability in soils is associated with high uncertainties, as the vegetation involved in forming the soil ASi pool may be different from the current vegetation. Thus, more appropriate measures of element availability may be the parent material and lithology (Alloway, 2013). It has been shown that the geochemical element concentration in Arctic permafrost soil allows one to distinguish geologies (Reimann and Melezhik, 2001). Consequently, our lithology-based extrapolation of nutrient availability will help to reduce the current uncertainties in pan-Arctic soil element availability.
Due to deepening of the active layer, such as in the Canadian Shield and in the North Atlantic region, our data suggest higher ASi concentrations in the active layer in the future, as the ASi concentration in the permafrost layer is higher compared with the current active layer (Fig. S6). These higher ASi concentrations may increase P and OM availability (Reithmaier et al., 2017; Schaller et al., 2019) due to polysilicic acid competing for binding sites on the surface of minerals, subsequently mobilizing both P and OM (as ASi is a main source of polysilicic acid), and potentially increasing the leaching of both elements to the sea. It has also been shown that available Si leads to a release of P from minerals in Arctic soils and increases OM decomposition, thereby increasing soil GHG release (Schaller et al., 2019, 2021). Available Ca can immobilize OM via cation bridging and, thus, preserve OM from microbial decomposition (Sowers et al., 2020). Available Ca is also relevant for mineral formation because it can bind CO2 as Ca(HCO3)2 in soil with a pH higher than 7 (Dessert et al., 2003; Köhler et al., 2010). The concentration of soluble Ca in yedoma soils is mainly driven by thermokarst processes (Monhonval et al., 2022). In permafrost layers, the data presented in Fig. S6 show that Ca concentrations are lower than those in the current active layers at most locations, which is in accordance with other studies (Kokelj and Burn, 2005). Consequently, a future increase in temperatures may lead to a widespread decrease in the available Ca concentrations on average at 0–1 m depth, especially in yedoma regions. Iron minerals are important electron acceptors under anaerobic conditions, and available Fe is essential for microbial methane production (Colombo et al., 2018). After being released from rocks by weathering, Al forms amorphous aluminosilicates that crystalize slowly (Schaller et al., 2021). The Mehlich III extract contains all soluble forms of Al(OH)(H2O) that are bioavailable for organisms, with Al being toxic (Rengel, 2004). Thawing permafrost may be a source of available Al, especially across Canada, the Greenland Shield, and northern Europe. Increasing P availability, as predicted for Greenland and the Canadian Shield (Fig. 7), may, for example, increase CO2 release to the atmosphere by increasing the mineralization rates of OM (Street et al., 2018; Yang and Kane, 2021).
4.3 The importance of element interactions for nutrient availability
In permafrost layers, the mineralization of OM by microbial activity is negligible due to frozen conditions. As in temperate soils, the binding of OM in the mineral phases can prevent OM from mineralization (Dutta et al., 2006; Mueller et al., 2015). Mineral phases may bind parts of soil OM, thereby reducing the amount of OM available for microbial respiration. A large share of OM may be associated with iron and aluminum oxides/hydroxides. In particular, iron minerals may strongly bind OM, whereby a high stability of stored carbon is likely (Herndon et al., 2017). Thus, the binding between OM and the minerals is determined by the quantity of minerals that can bind OM (Wiseman and Püttmann, 2006). This would imply that a higher concentration of available Fe, Al, and Ca in Arctic soils due to permafrost thaw may lead to lower GHG emissions from Arctic soils due to the complexation of OM with those elements. Therefore, an increase in element availability and, in turn, the increased binding of OM could result in potentially lower GHG emissions in Alaska (due to a higher available Ca and available Fe concentration in the permafrost layer compared with current active layer), the Canadian Shield and Greenland (due to a higher available Fe and available Al concentration in the permafrost layer compared with the current active layer), and northern Europe (due to a higher available Al concentration in the permafrost layer compared with the current active layer) (see Sect. 3). However, lower available Ca concentrations can be expected in large parts of Siberia and the Canadian Shield, as the concentrations in the permafrost layer are lower compared with the current active layer. Available Si, however, can potentially mobilize OM from these phases under slightly acidic to alkaline conditions and under oxic to anoxic conditions due to the binding competition of silicic acid with some functional groups of organic material (Hömberg et al., 2020), thereby potentially increasing GHG emissions. An increase in Si availability upon permafrost thaw can be expected in the western Verkhoyansk–Kolyma region to the East European Platform, as the concentration in the permafrost layer is higher compared with the current active layer (see Sect. 3). Available P competes with OM for binding sites on soil minerals (Schneider et al., 2010). Increasing P concentrations due to permafrost thaw can be expected for the Canadian Shield (Sect. 3). Based on the differences in element (Si, Fe, Al, Ca, and P) available concentrations, the stability of OM differs in Arctic regions depending on the dominant mineral composition, lithology, and element availability. Furthermore, the availability of nutrients (P in this case) is modified by the mineral composition. For example, P is often strongly bound to Fe mineral phases, reducing P availability (Gérard, 2016). Silicic acid, however, is able to mobilize P from strong bonds to Fe minerals by competing for binding sites under a wide range of conditions (Schaller et al., 2019). Unlike Si, Ca binds P via calcium phosphate precipitation under alkaline conditions (Cao and Harris, 2008) or via calcium carbonate/phosphate coprecipitation (Otsuki and Wetzel, 1972). Under low-Fe-availability conditions in soils, the binding of P may be related to Al minerals (Eriksson et al., 2015). A lack of available P also leads to a reduction in the physiological activity of microbes (Walker et al., 2001), thereby potentially reducing the microbial respiration of OM. Mobile Si, in the form of silicic acid and its polymers, may potentially limit the availability of ions like Fe, Al, or Ca by precipitating those elements in the amorphous or crystalline phases (Schaller et al., 2021). Hence, the mobilization of elements like Si, Ca, Fe, and Al strongly interferes with both P and OM availability and, thus, potentially with GHG emissions. To unravel the dominant processes upon permafrost thaw or the element mobilization that is dominant in terms of OM binding or mobilization, which affects GHG emissions, future studies are urgently needed.
4.4 Transport of elements to the Arctic Ocean
With the ongoing deepening of the active layer in Arctic soils, increased leaching of elements and nutrients may occur (Mann et al., 2022; Sanders et al., 2022), and this may substantially impact marine biodiversity and ecosystem function. We have shown, for several regions of the Arctic, that there will be regional differences in element mobilization upon permafrost thaw. For example, the increased export of Fe and P, which are the main limiting nutrients for marine net primary production (NPP) (Zabel and Schulz, 2006), has already contributed to a 30 % increase in NPP in the Arctic Ocean between 1998 and 2009 (Arrigo and van Dijken, 2011). Increased available Fe concentrations at a soil depth of 0–1 m upon permafrost thaw can be expected for soils of the Canadian Shield, Greenland, and Alaska, whereas increased P mobilization may occur only in the Canadian Shield, according to the sites studied within these lithological classes. Si and Ca also have a crucial role in marine primary production. Moreover, both elements are components of the inorganic spheres of diatoms (Si) and coccolithophores (Ca), which fix CO2 in the Arctic Ocean, an important global carbon sink (Krause et al., 2018). At the Arctic Canadian coast, Si inputs have led to an increase in diatoms from 2 % to 37 % (Terhaar et al., 2021). Diatoms and coccolithophores are the basis of the marine food chain; therefore, shifts in their populations may have widespread implications for the marine ecosystem (Daniels et al., 2018). Permafrost thaw is likely to accelerate inputs of available Si and Ca to Arctic waters. Increased Si availability in soils can be expected in the western Verkhoyansk–Kolyma region to the East European Platform, as the concentration in the permafrost layer is higher compared with the current active layer (see Sect. 3). Calcium mobilization may increase or decrease depending on the Arctic region. Increased Ca mobilization can be expected for Alaska, whereas a slight decrease in Ca mobilization may occur in large parts of Siberia and the Canadian Shield (see Sect. 3). Yedoma deposits readily leach soluble ions, including Si and Ca, as a result of thaw degradation (Strauss et al., 2017b). Alaskan soils store huge amounts of available Ca in the mineral layer (see above) that could be transported to the Beringia Sea with increasing soil degradation, thereby promoting the growth of coccolithophores. In Siberia, the Lena River could transport large amounts of available Si to the Laptev Sea, increasing the growth of diatoms. The same could happen on the East European Plain. In the same way, P concentrations in these regions of the Arctic Sea could also rise, as P concentrations in the permafrost layer of the Canadian Shield are higher compared with the current active layer (see Sect. 3). During transport to the ocean, the elements may be bound to soil particles, potentially inhibiting further transport, or may interact with other elements (see the previous paragraph), also potentially affecting further transport. In summary, in many areas of the Arctic with high available Si, Ca, and P storage, there could be increased inputs to Arctic waters, with permafrost thaw potentially increasing CO2 fixation by marine primary production.
4.5 Limitations of data and statistics
Despite the sample number of our study being quite high and reflecting a broad range of pan-Arctic regions, this study still has some limitations. The density of data points is not homogeneous over the whole area, and the sample number is low in some remote areas. To reduce potential uncertainties and variance in the presented data on available element concentrations, we carried out bootstrapping for the single layers within the lithological classes. Our data do not give total element pools, rather biologically available concentrations.
The element availability data from all single locations, soil profiles, transects, and lithologies as well as bootstrap data for locations and lithologies can be can be downloaded via the Edmond open-access MPG repository: https://doi.org/10.17617/3.8KGQUN (Schaller and Goeckede, 2022). During review process, the data were made available from https://edmond.mpdl.mpg.de/privateurl.xhtml?token=8cbb0bd8-790f-4719-8cd1-a3df4ff99477 (last access: 1 March 2023) to allow for corrections based on reviewer comments (Schaller and Goeckede, 2022). The repository contains a readme file (“Read me.docx”). In this file, all necessary information can be found, including all of the column descriptions need to use the data.
The element availability information from all single locations, soil profiles, transects, and lithologies is labeled (location_samples.txt) and contains the following parameters: the Geological Map of the Arctic; the individual ID of the polygon; the official name of the sampling site; the internal study name of the soil sample; the soil horizon; the coordinates of sampling sites; the concentration of alkaline-extractable amorphous silicon (ASi); the Mehlich-III-extractable Si, Ca, Fe, Al, and P; the thickness of the layer; the original depth from which soil was taken; the size of the polygon that contains the sampling site; the age code; the scientific name of the age during which the bedrock was formed; the scientific name of the eon during which the bedrock was formed; the scientific name of the era during which the bedrock was formed; the scientific name of the period during which the bedrock was formed; the maximal and minimal age of the bedrock; if lithogenesis was of the supracrustal, sedimentary, or igneous type; the most common rock types in the cluster group of the setting; the code of the metamorphic type; the code of the domain region; the name of the tectonic and geographic domain; and the name of the region within the geographic domain.
In the “location_bootstrap.txt” file, the bootstrapped means of concentration of alkaline extractable Si, Mehlich-III-extractable Si, Ca, Fe, Al, and P for the organic, mineral, and permafrost layers of the single locations are given in milligrams per gram dry weight (mg g−1 DW).
In the “lithology_bootstrap.txt” file, the element concentrations for the first 1 m, including the organic, mineral, and permafrost layers, are given as a bootstrapped mean and the standard deviation for alkaline-extractable Si as well as Mehlich-III-extractable Si, Ca, Fe, Al, and P.
In this work, we identified large differences in the concentrations of available Si, Ca, Fe, Al, and P as well as the solid ASi fraction among different Arctic regions. With the future projected warming of the Arctic and the associated thaw of permafrost soils due to deepening of the active layer, the available concentration of the elements will change. Depending on the dominance or limitation of certain elements, biogeochemical processes such as OM mineralization may increase or decrease. Moreover, not only may microbial processes such as OM respiration be affected by changes in Si, Ca, Fe, P, and Al availability but processes such as primary production (CO2 fixation by plants) in terrestrial systems might also be impacted. This could stabilize soil OM but may also trigger elevated biomass production by plants due to an increased nutrient supply. In addition, marine systems will receive higher loads of leached elements, which could increase algae biomass production due to increased nutrient transport to the sea. Our spatially explicit data product, including the differences in element availability among the different lithological classes and regions, will help improve models of Arctic biogeochemical cycles for estimating future carbon feedback under predicted climate change.
The supplement related to this article is available online at: https://doi.org/10.5194/essd-15-1059-2023-supplement.
JSc And MG designed the study. MG, BE, SN, PK, NP, GH, OS, and CM sampled the soils. PS did the analysis and processed the data. PS and JSc wrote the first draft of the manuscript with input from MG and JSt. All co-authors commented on the manuscript and agreed upon the final version of the paper.
The contact author has declared that none of the authors has any competing interests.
Publisher’s note: Copernicus Publications remains neutral with regard to jurisdictional claims in published maps and institutional affiliations.
We thank Lidia Völker (ZALF) for help with data extraction from the GIS polygons.
The work was funded by the German Research Foundation (DFG; grant no. SCHA 1822/12-1 to Jörg Schaller). The work of Jens Strauss was embedded into the “Changing Arctic Ocean” (CAO) program (CACOON project; grant no. 03F0806A, BMBF). This work was also supported by the National Science Foundation (NSF; grant no. NSF-1417700 to Susan Natali).
This paper was edited by Attila Demény and reviewed by two anonymous referees.
Abbott, B. W., Jones, J. B., Godsey, S. E., Larouche, J. R., and Bowden, W. B.: Patterns and persistence of hydrologic carbon and nutrient export from collapsing upland permafrost, Biogeosciences, 12, 3725–3740, https://doi.org/10.5194/bg-12-3725-2015, 2015.
Alfredsson, H., Clymans, W., Hugelius, G., Kuhry, P., and Conley, D. J.: Estimated storage of amorphous silica in soils of the circum-Arctic tundra region, Global Biogeochem. Cy., 30, 479–500, https://doi.org/10.1002/2015GB005344, 2016.
Alloway, B. J.: Bioavailability of Elements in Soil, in: Essentials of Medical Geology, edited by: Selinus, O., Springer, Dordrecht, 351–373, https://doi.org/10.1007/978-94-007-4375-5_15, 2013.
Arrigo, K. R. and van Dijken, G. L.: Secular trends in Arctic Ocean net primary production, J. Geophys. Res., 116, C09011, https://doi.org/10.1029/2011JC007151, 2011.
Box, J. E., Colgan, W. T., Christensen, T. R., Schmidt, N. M., Lund, M., Parmentier, F.-J. W., Brown, R., Bhatt, U. S., Euskirchen, E. S., Romanovsky, V. E., Walsh, J. E., Overland, J. E., Wang, M., Corell, R. W., Meier, W. N., Wouters, B., Mernild, S., Mård, J., Pawlak, J., and Olsen, M. S.: Key indicators of Arctic climate change: 1971–2017, Environ. Res. Lett., 14, 45010, https://doi.org/10.1088/1748-9326/aafc1b, 2019.
Brown, J. and Romanovsky, V. E.: Report from the International Permafrost Association: state of permafrost in the first decade of the 21st century, Permafrost Periglac. Process., 19, 255–260, https://doi.org/10.1002/ppp.618, 2008.
Cao, X. and Harris, W.: Carbonate and magnesium interactive effect on calcium phosphate precipitation, Environ. Sci. Technol., 42, 436–442, https://doi.org/10.1021/es0716709, 2008.
Chadburn, S. E., Krinner, G., Porada, P., Bartsch, A., Beer, C., Belelli Marchesini, L., Boike, J., Ekici, A., Elberling, B., Friborg, T., Hugelius, G., Johansson, M., Kuhry, P., Kutzbach, L., Langer, M., Lund, M., Parmentier, F.-J. W., Peng, S., Van Huissteden, K., Wang, T., Westermann, S., Zhu, D., and Burke, E. J.: Carbon stocks and fluxes in the high latitudes: using site-level data to evaluate Earth system models, Biogeosciences, 14, 5143–5169, https://doi.org/10.5194/bg-14-5143-2017, 2017.
Colombo, N., Salerno, F., Gruber, S., Freppaz, M., Williams, M., Fratianni, S., and Giardino, M.: Review: Impacts of permafrost degradation on inorganic chemistry of surface fresh water, Global Planet. Change, 162, 69–83, https://doi.org/10.1016/j.gloplacha.2017.11.017, 2018.
Daniels, C. J., Poulton, A. J., Balch, W. M., Marañón, E., Adey, T., Bowler, B. C., Cermeño, P., Charalampopoulou, A., Crawford, D. W., Drapeau, D., Feng, Y., Fernández, A., Fernández, E., Fragoso, G. M., González, N., Graziano, L. M., Heslop, R., Holligan, P. M., Hopkins, J., Huete-Ortega, M., Hutchins, D. A., Lam, P. J., Lipsen, M. S., López-Sandoval, D. C., Loucaides, S., Marchetti, A., Mayers, K. M. J., Rees, A. P., Sobrino, C., Tynan, E., and Tyrrell, T.: A global compilation of coccolithophore calcification rates, Earth Syst. Sci. Data, 10, 1859–1876, https://doi.org/10.5194/essd-10-1859-2018, 2018.
DeMaster, D. J.: The supply and accumulation of silica in the marine environment, Geochim. Cosmochim. Ac., 45, 1715–1732, 1981.
Dessert, C., Dupré, B., Gaillardet, J., François, L. M., and Allègre, C. J.: Basalt weathering laws and the impact of basalt weathering on the global carbon cycle, Chem. Geol., 202, 257–273, https://doi.org/10.1016/j.chemgeo.2002.10.001, 2003.
Dutta, Schuur, E. A. G., Neff., and Zimov, S. A.: Potential carbon release from permafrost soils of Northeastern Siberia, Glob. Change Biol., 12, 2336–2351, https://doi.org/10.1111/j.1365-2486.2006.01259.x, 2006.
Eriksson, A. K., Gustafsson, J. P., and Hesterberg, D.: Phosphorus speciation of clay fractions from long-term fertility experiments in Sweden, Geoderma, 241–242, 68–74, https://doi.org/10.1016/j.geoderma.2014.10.023, 2015.
Faucherre, S., Jørgensen, C. J., Blok, D., Weiss, N., Siewert, M. B., Bang-Andreasen, T., Hugelius, G., Kuhry, P., and Elberling, B.: Short and Long-Term Controls on Active Layer and Permafrost Carbon Turnover Across the Arctic, J. Geophys. Res.-Biogeo., 123, 372–390, https://doi.org/10.1002/2017JG004069, 2018.
Fuchs, M., Grosse, G., Strauss, J., Günther, F., Grigoriev, M., Maximov, G. M., and Hugelius, G.: Carbon and nitrogen pools in thermokarst-affected permafrost landscapes in Arctic Siberia, Biogeosciences, 15, 953–971, https://doi.org/10.5194/bg-15-953-2018, 2018.
Gérard, F.: Clay minerals, iron/aluminum oxides, and their contribution to phosphate sorption in soils – A myth revisited, Geoderma, 262, 213–226, https://doi.org/10.1016/j.geoderma.2015.08.036, 2016.
Goldman, C. R., Kumagai, M., Robarts, R. D., and Goldman, C. R. (Eds.): Climatic Change and Global Warming of Inland Waters: Impacts and Mitigation for Ecosystems and Societies, John Wiley & Sons Inc, Chichester, West Sussex, UK, ISBN 978-1-119-96866-5, 2013.
Harrison, J. C., St-Onge, M. R., Petrov, O. V., Strelnikov, S. I., Lopatin, B. G., Wilson, F. H., Tella, S., Paul, D., Lynds, T., Shokalsky, S. P., Hults, C. K., Bergman, S., Jepsen, H. F., and Solli, A.: Geological map of the Arctic, Geological Survey of Canada, “A” Series Map 2159A, 9 sheets; 1 DVD, https://doi.org/10.4095/287868, 2011.
Herndon, E., AlBashaireh, A., Singer, D., Roy Chowdhury, T., Gu, B., and Graham, D.: Influence of iron redox cycling on organo-mineral associations in Arctic tundra soil, Geochim. Cosmochim. Ac., 207, 210–231, https://doi.org/10.1016/j.gca.2017.02.034, 2017.
Hömberg, A., Obst, M., Knorr, K.-H., Kalbitz, K., and Schaller, J.: Increased silicon concentration in fen peat leads to a release of iron and phosphate and changes in the composition of dissolved organic matter, Geoderma, 374, 114422, https://doi.org/10.1016/j.geoderma.2020.114422, 2020.
Hugelius, G., Strauss, J., Zubrzycki, S., Harden, J. W., Schuur, E. A. G., Ping, C.-L., Schirrmeister, L., Grosse, G., Michaelson, G. J., Koven, C. D., O'Donnell, J. A., Elberling, B., Mishra, U., Camill, P., Yu, Z., Palmtag, J., and Kuhry, P.: Estimated stocks of circumpolar permafrost carbon with quantified uncertainty ranges and identified data gaps, Biogeosciences, 11, 6573–6593, https://doi.org/10.5194/bg-11-6573-2014, 2014.
Hugelius, G., Loisel, J., Chadburn, S., Jackson, R. B., Jones, M., MacDonald, G., Marushchak, M., Olefeldt, D., Packalen, M., Siewert, M. B., Treat, C., Turetsky, M., Voigt, C., and Yu, Z.: Large stocks of peatland carbon and nitrogen are vulnerable to permafrost thaw, P. Natl. Acad. Sci. USA, 117, 20438–20446, https://doi.org/10.1073/pnas.1916387117, 2020.
IPCC: Climate Change 2021: The Physical Science Basis. Contribution of Working Group I to the Sixth Assessment Report of the Intergovernmental Panel on Climate Change, Climate Change, 236 pp., 2021.
Jobbágy, E. and Jackson, R. B.: The distribution of soil nutrients with depth: Global patterns and the imprint of plants, Biogeochemistry, 53, 51–77, https://doi.org/10.1023/A:1010760720215, 2001.
Kaiser, K. and Zech, W.: Competitive Sorption of Dissolved Organic Matter Fractions to Soils and Related Mineral Phases, Soil Sci. Soc. Am. J., 61, 64–69, https://doi.org/10.2136/sssaj1997.03615995006100010011x, 1997.
Köhler, P., Hartmann, J., and Wolf-Gladrow, D. A.: Geoengineering potential of artificially enhanced silicate weathering of olivine, P. Natl. Acad. Sci. USA, 107, 20228–20233, https://doi.org/10.1073/pnas.1000545107, 2010.
Kokelj, S. V. and Burn, C. R.: Geochemistry of the active layer and near-surface permafrost, Mackenzie delta region, Northwest Territories, Canada, Can. J. Earth Sci., 42, 37–48, https://doi.org/10.1139/e04-089, 2005.
Kokelj, S. V., Lantz, T. C., Tunnicliffe, J., Segal, R., and Lacelle, D.: Climate-driven thaw of permafrost preserved glacial landscapes, northwestern Canada, Geology, 45, 371–374, https://doi.org/10.1130/G38626.1, 2017.
Krause, J. W., Duarte, C. M., Marquez, I. A., Assmy, P., Fernández-Méndez, M., Wiedmann, I., Wassmann, P., Kristiansen, S., and Agustí, S.: Biogenic silica production and diatom dynamics in the Svalbard region during spring, Biogeosciences, 15, 6503–6517, https://doi.org/10.5194/bg-15-6503-2018, 2018.
Kuhry, P., Bárta, J., Blok, D., Elberling, B., Faucherre, S., Hugelius, G., Jørgensen, C. J., Richter, A., Šantrůčková, H., and Weiss, N.: Lability classification of soil organic matter in the northern permafrost region, Biogeosciences, 17, 361–379, https://doi.org/10.5194/bg-17-361-2020, 2020.
Mann, P. J., Strauss, J., Palmtag, J., Dowdy, K., Ogneva, O., Fuchs, M., Bedington, M., Torres, R., Polimene, L., Overduin, P., Mollenhauer, G., Grosse, G., Rachold, V., Sobczak, W. V., Spencer, R. G. M., and Juhls, B.: Degrading permafrost river catchments and their impact on Arctic Ocean nearshore processes, AMBIO, 51, 439–455, https://doi.org/10.1007/s13280-021-01666-z, 2022.
Mauclet, E., Agnan, Y., Hirst, C., Monhonval, A., Pereira, B., Vandeuren, A., Villani, M., Ledman, J., Taylor, M., Jasinski, B. L., Schuur, E. A. G., and Opfergelt, S.: Changing sub-Arctic tundra vegetation upon permafrost degradation: impact on foliar mineral element cycling, Biogeosciences, 19, 2333–2351, https://doi.org/10.5194/bg-19-2333-2022, 2022.
Mishra, U., Hugelius, G., Shelef, E., Yang, Y., Strauss, J., Lupachev, A., Harden, J. W., Jastrow, J. D., Ping, C.-L., Riley, W. J., Schuur, E. A. G., Matamala, R., Siewert, M., Nave, L. E., Koven, C. D., Fuchs, M., Palmtag, J., Kuhry, P., Treat, C. C., Zubrzycki, S., Hoffman, F. M., Elberling, B., Camill, P., Veremeeva, A., and Orr, A.: Spatial heterogeneity and environmental predictors of permafrost region soil organic carbon stocks, Science Advances, 7, eaaz5236, https://doi.org/10.1126/sciadv.aaz5236, 2021.
Monhonval, A., Mauclet, E., Pereira, B., Vandeuren, A., Strauss, J., Grosse, G., Schirrmeister, L., Fuchs, M., Kuhry, P., and Opfergelt, S.: Mineral Element Stocks in the Yedoma Domain: A Novel Method Applied to Ice-Rich Permafrost Regions, Front. Earth Sci., 9, 703304, https://doi.org/10.3389/feart.2021.703304, 2021.
Monhonval, A., Strauss, J., Thomas, M., Hirst, C., Titeux, H., Louis, J., Gilliot, A., Du Bois d'Aische, E., Pereira, B., Vandeuren, A., Grosse, G., Schirrmeister, L., Jongejans, L. L., Ulrich, M., and Opfergelt, S.: Thermokarst processes increase the supply of stabilizing surfaces and elements (Fe, Mn, Al, and Ca) for mineral–organic carbon interactions, Permafrost Periglac., 33, 452–469, https://doi.org/10.1002/ppp.2162, 2022.
Mueller, C. W., Rethemeyer, J., Kao-Kniffin, J., Löppmann, S., Hinkel, K. M., and Bockheim, G. J.: Large amounts of labile organic carbon in permafrost soils of northern Alaska, Glob. Change Biol., 21, 2804–2817, https://doi.org/10.1111/gcb.12876, 2015.
Otsuki, A. and Wetzel, R.: Corprecipitation of phosphate with carbonates in a marl lake, Limnol. Oceanogr., 17, 763–767, https://doi.org/10.4319/lo.1972.17.5.0763, 1972.
Quideau, S. A., Chadwick, O. A., Trumbore, S. E., Johnson-Maynard, J. L., Graham, R. C., and Anderson, M. A.: Vegetation control on soil organic matter dynamics, Org. Geochem., 32, 247–252, https://doi.org/10.1016/S0146-6380(00)00171-6, 2001.
R Core Team: R: A language and environment for statistical, R Foundation for Statistical Computing, Vienna, Austria, http://www.r-project.org/index.html (last access: 1 October 2022), 2020.
Reimann, C. and Melezhik, V.: Metallogenic provinces, geochemical provinces and regional geology – what causes large-scale patterns in low density geochemical maps of the C-horizon of podzols in Arctic Europe?, Appl. Geochem., 16, 963–983, 2001.
Reithmaier, G.-M. S., Knorr, K.-H., Arnhold, S., Planer-Friedrich, B., and Schaller, J.: Enhanced silicon availability leads to increased methane production, nutrient and toxicant mobility in peatlands, Scientific Reports, 7, 8728, https://doi.org/10.1038/s41598-017-09130-3, 2017.
Rengel, Z.: Aluminium cycling in the soil-plant-animal-human continuum, Biometals, 17, 669–689, https://doi.org/10.1007/s10534-004-1201-4, 2004.
Romanovsky, V. E., Drozdov, D. S., Oberman, N. G., Malkova, G. V., Kholodov, A. L., Marchenko, S. S., Moskalenko, N. G., Sergeev, D. O., Ukraintseva, N. G., Abramov, A. A., Gilichinsky, D. A., and Vasiliev, A. A.: Thermal state of permafrost in Russia, Permafrost Periglac., 21, 136–155, https://doi.org/10.1002/ppp.683, 2010.
Salmon, V. G., Soucy, P., Mauritz, M., Celis, G., Natali, S. M., Mack, M. C., and Schuur, E. A. G.: Nitrogen availability increases in a tundra ecosystem during five years of experimental permafrost thaw, Glob. Change Biol., 22, 1927–1941, https://doi.org/10.1111/gcb.13204, 2016.
Sanders, T., Fiencke, C., Fuchs, M., Haugk, C., Juhls, B., Mollenhauer, G., Ogneva, O., Overduin, P., Palmtag, J., Povazhniy, V., Strauss, J., Tuerena, R., Zell, N., and Dähnke, K.: Seasonal nitrogen fluxes of the Lena River Delta, Ambio, 51, 423–438, https://doi.org/10.1007/s13280-021-01665-0, 2022.
Schaller, J. and Goeckede, M.: Pan-Arctic soil element availability estimations, 637, EDMOND open-access MPG repository [data set], https://doi.org/10.17617/3.8KGQUN, 2022.
Schaller, J., Faucherre, S., Joss, H., Obst, M., Goeckede, M., Planer-Friedrich, B., Peiffer, S., Gilfedder, B., and Elberling, B.: Silicon increases the phosphorus availability of Arctic soils, Scientific Reports, 9, 449, https://doi.org/10.1038/s41598-018-37104-6, 2019.
Schaller, J., Puppe, D., Kaczorek, D., Ellerbrock, R., and Sommer, M.: Silicon Cycling in Soils Revisited, MDPI Plants, 10, 295, https://doi.org/10.3390/plants10020295, 2021.
Schirrmeister, L., Kunitsky, V., Grosse, G., Wetterich, S., Meyer, H., Schwamborn, G., Babiy, O., Derevyagin, A., and Siegert, C.: Sedimentary characteristics and origin of the Late Pleistocene Ice Complex on north-east Siberian Arctic coastal lowlands and islands – A review, Quatern. Int., 241, 3–25, https://doi.org/10.1016/j.quaint.2010.04.004, 2011.
Schneider, M., Scheel, T., Mikutta, R., van Hees, P., Kaiser, K., and Kalbitz, K.: Sorptive stabilization of organic matter by amorphous Al hydroxide, Geochim. Cosmochim. Ac., 74, 1606–1619, https://doi.org/10.1016/j.gca.2009.12.017, 2010.
Schuur, E. A. G., Abbott, B. W., Bowden, W. B., Brovkin, V., Camill, P., Canadell, J. G., Chanton, J. P., Chapin, F. S., Christensen, T. R., Ciais, P., Crosby, B. T., Czimczik, C. I., Grosse, G., Harden, J., Hayes, D. J., Hugelius, G., Jastrow, J. D., Jones, J. B., Kleinen, T., Koven, C. D., Krinner, G., Kuhry, P., Lawrence, D. M., McGuire, A. D., Natali, S. M., O'Donnell, J. A., Ping, C. L., Riley, W. J., Rinke, A., Romanovsky, V. E., Sannel, A. B. K., Schädel, C., Schaefer, K., Sky, J., Subin, Z. M., Tarnocai, C., Turetsky, M. R., Waldrop, M. P., Walter Anthony, K. M., Wickland, K. P., Wilson, C. J., and Zimov, S. A.: Expert assessment of vulnerability of permafrost carbon to climate change, Climatic Change, 119, 359–374, https://doi.org/10.1007/s10584-013-0730-7, 2013.
Schuur, E. A. G., McGuire, A. D., Schädel, C., Grosse, G., Harden, J. W., Hayes, D. J., Hugelius, G., Koven, C. D., Kuhry, P., Lawrence, D. M., Natali, S. M., Olefeldt, D., Romanovsky, V. E., Schaefer, K., Turetsky, M. R., Treat, C. C., and Vonk, J. E.: Climate change and the permafrost carbon feedback, Nature, 520, 171–179, https://doi.org/10.1038/nature14338, 2015.
Sher, A. V., Kuzmina, S. A., Kuznetsova, T. V., and Sulerzhitsky, L. D.: New insights into the Weichselian environment and climate of the East Siberian Arctic, derived from fossil insects, plants, and mammals, Quaternary Sci. Rev., 24, 533–569, https://doi.org/10.1016/j.quascirev.2004.09.007, 2005.
Sims, J. T.: Comparison of mehlich 1 and mehlich 3 extractants for P, K, Ca, Mg, Mn, Cu and Zn in atlantic coastal plain soils, Commun. Soil Sci. Plan., 20, 1707–1726, https://doi.org/10.1080/00103628909368178, 1989.
Sowers, T. D., Wani, R. P., Coward, E. K., Fischel, M. H. H., Betts, A. R., Douglas, T. A., Duckworth, O. W., and Sparks, D. L.: Spatially Resolved Organomineral Interactions across a Permafrost Chronosequence, Environ. Sci. Technol., 54, 2951–2960, https://doi.org/10.1021/acs.est.9b06558, 2020.
Stimmler, P., Priemé, A., Elberling, B., Goeckede, M., and Schaller, J.: Arctic soil respiration and microbial community structure driven by silicon and calcium, Sci. Total Environ., 838, 156152, https://doi.org/10.1016/j.scitotenv.2022.156152, 2022.
Strauss, J. (Ed.): Permafrost: Recarbonizing global soils – A technical manual of recommended management practices, Food and Agriculture Organization of the United Nations, Rome, https://doi.org/10.4060/cb6378en, 2021.
Strauss, J., Schirrmeister, L., Grosse, G., Wetterich, S., Ulrich, M., Herzschuh, U., and Hubberten, H.-W.: The deep permafrost carbon pool of the Yedoma region in Siberia and Alaska, Geophys. Res. Lett., 40, 6165–6170, https://doi.org/10.1002/2013GL058088, 2013.
Strauss, J., Schirrmeister, L., Grosse, G., Fortier, D., Hugelius, G., Knoblauch, C., Romanovsky, V., Schädel, C., Schneider von Deimling, T., Schuur, E. A., Shmelev, D., Ulrich, M., and Veremeeva, A.: Deep Yedoma permafrost: A synthesis of depositional characteristics and carbon vulnerability, Earth-Sci. Rev., 172, 75–86, https://doi.org/10.1016/j.earscirev.2017.07.007, 2017a.
Strauss, J., Schirrmeister, L., Grosse, G., Fortier, D., Hugelius, G., Knoblauch, C., Romanovsky, V., Schädel, C., Schneider von Deimling, T., Schuur, E. A., Shmelev, D., Ulrich, M., and Veremeeva, A.: Deep Yedoma permafrost: A synthesis of depositional characteristics and carbon vulnerability, Earth-Sci. Rev., 172, 75–86, https://doi.org/10.1016/j.earscirev.2017.07.007, 2017b.
Strauss, J., Laboor, S., Schirrmeister, L., Fedorov, A. N., Fortier, D., Froese, D., Fuchs, M., Günther, F., Grigoriev, M., Harden, J., Hugelius, G., Jongejans, L. L., Kanevskiy, M., Kholodov, A., Kunitsky, V., Kraev, G., Lozhkin, A., Rivkina, E., Shur, Y., Siegert, C., Spektor, V., Streletskaya, I., Ulrich, M., Vartanyan, S., Veremeeva, A., Anthony, K. W., Wetterich, S., Zimov, N., and Grosse, G.: Circum-Arctic Map of the Yedoma Permafrost Domain, Front. Earth Sci., 9, 758360, https://doi.org/10.3389/feart.2021.758360, 2021.
Street, L. E., Mielke, N., and Woodin, S. J.: Phosphorus Availability Determines the Response of Tundra Ecosystem Carbon Stocks to Nitrogen Enrichment, Ecosystems, 21, 1155–1167, https://doi.org/10.1007/s10021-017-0209-x, 2018.
Terhaar, J., Lauerwald, R., Regnier, P., Gruber, N., and Bopp, L.: Around one third of current Arctic Ocean primary production sustained by rivers and coastal erosion, Nat. Commun., 12, 169, https://doi.org/10.1038/s41467-020-20470-z, 2021.
Villani, M., Mauclet, E., Agnan, Y., Druel, A., Jasinski, B., Taylor, M., Schuur, E. A., and Opfergelt, S.: Mineral element recycling in topsoil following permafrost degradation and a vegetation shift in sub-Arctic tundra, Geoderma, 421, 115915, https://doi.org/10.1016/j.geoderma.2022.115915, 2022.
Walker, D., Bockheim, J., Chapin III, F., Eugster, W., Nelson, F., and Ping, C.: Calcium-rich tundra, wildlife, and the “Mammoth Steppe”, Quaternary Sci. Rev., 20, 149–163, https://doi.org/10.1016/S0277-3791(00)00126-8, 2001.
Weil, R. R. and Brady, N. C.: The nature and properties of soils, Fifteenth edition, global edition, Pearson, Harlow, England, London, New York, Boston, San Francisco, 1104 pp., ISBN 978-1-292-16224-9, 2017.
Wiseman, C. and Püttmann, W.: Interactions between mineral phases in the preservation of soil organic matter, Geoderma, 134, 109–118, https://doi.org/10.1016/j.geoderma.2005.09.001, 2006.
Yang, D. and Kane, D. L. (Eds.): Arctic Hydrology, Permafrost and Ecosystems, Springer eBook Collection, Springer International Publishing, Imprint Springer, Cham, 914 pp., ISBN 978-3030509286, 2021.
Yurchenko, A. Y., Potapova, A. S., Bumagina, V. A., Vilesov, A. P., Chertina, K. N., Balushkina, N. S., Kalmykov, G. A., and Khotylev, O. V.: Morphological and Lithogenetic Classification of the Carbonate Rocks of the Abalak–Bazhenov Complex, Moscow Univ. Geol. Bull., 74, 372–379, https://doi.org/10.3103/S0145875219040136, 2019.
Zabel, M. and Schulz, H. D. (Eds.): Marine Geochemistry, 2nd revised, updated and extended edition, SpringerLink Bücher, Springer Berlin Heidelberg, Berlin, Heidelberg, 574 pp., ISBN 3-540-32143-8, 2006.