the Creative Commons Attribution 4.0 License.
the Creative Commons Attribution 4.0 License.
Emissions of greenhouse gases from energy use in agriculture, forestry and fisheries: 1970–2019
Alessandro Flammini
Xueyao Pan
Francesco Nicola Tubiello
Sally Yue Qiu
Leonardo Rocha Souza
Roberta Quadrelli
Stefania Bracco
Philippe Benoit
Ralph Sims
Fossil-fuel-based energy use in agriculture leads to CO2 and non-CO2 emissions. We focus on emissions generated within the farm gate and from fisheries, providing information relative to the period 1970–2019, for both energy use, as input activity data and the associated greenhouse gas (GHG) emissions. Country-level information is generated from United Nations Statistics Division (UNSD) and International Energy Agency (IEA) data on energy in agriculture (including forestry and fisheries), relative to use of gas/diesel oil, motor gasoline, liquefied petroleum gas (LPG), natural gas, fuel oil and coal. Electricity used within the farm gate is also quantified, while recognizing that the associated emissions are generated elsewhere. We find that, in 2019, annual emissions from energy use in agriculture were about 523 million tonnes (Mt CO2eq yr−1), while when including electricity they were 1029 Mt CO2eq yr−1, having increased 7 % from 1990. The largest emission increase from on-farm fuel combustion was from LPG (32 %), whereas significant decreases were observed for coal (−55 %), natural gas (−50 %), motor gasoline (−42 %) and fuel oil (−37 %). Conversely, the use of electricity and the associated indirect emissions increased 3-fold over the 1990–2019 period, thus becoming the largest emission source from energy use in agriculture since 2005. Overall, the global trends were a result of counterbalancing effects: marked decreases in developed countries in 2019 compared to 1990 (−273 Mt CO2eq yr−1) were masked by slightly larger increases in developing and emerging economies (+339 Mt CO2eq yr−1). The information used in this work is available as open data at https://doi.org/10.5281/zenodo.5153241 (Tubiello and Pan, 2021). The relevant Food and Agriculture Organization Corporate Statistical Database (FAOSTAT) (FAO, 2021b) on emissions is maintained and updated annually by FAO.
- Article
(798 KB) - Full-text XML
- BibTeX
- EndNote
Agricultural production more than doubled over the period 1990–2019, with additional increases of more than 50 % expected by 2050, to meet projected increases in food demand (FAO, 2018; Calicioglu et al., 2019). Historically, productivity increases were achieved through transitions from traditional, extensive agri-food systems to modern, intensive production systems, characterized by greater energy use within the farm (Sims and Flammini, 2014; Smil, 2008). Direct on-farm energy inputs include fuel to power tractors and other agricultural field machinery, irrigation pumps and heat to warm greenhouses and animal shelters. Other uses beyond the farm may include power for forestry machinery and fishing vessels (Dubois et al., 2017). On-farm energy use is a significant component of agricultural production and growth (Sims and Flammini, 2014; Utz, 2011); however, it often attracts less attention in food-related emissions analysis relevant to national determined contributions (Tubiello et al., 2021) as the on-farm energy use emissions are reported instead under the “energy” sector of the national greenhouse gas (GHG) inventories. In fact, countries regularly submit to the UN Framework Convention on Climate Change (UNFCCC), containing only non-CO2 emissions from crop and livestock biophysical processes, for instance, enteric fermentation in ruminants or nitrous oxide from fertilizers on cropland (IPCC, 2006; Tubiello, 2019). Within the UNFCCC context, emissions from agriculture are currently about 5 Gt CO2eq yr−1, having increased by roughly 50 % since 1961 (Tubiello, 2019). They are dominated by livestock processes and are fairly equally split between CH4 and N2O components, in single gas units corresponding to annual emissions in 2019 of 140 Mt CH4 and 7.7 Mt N2O, respectively (FAO, 2021b; Tubiello et al., 2021).
Energy use in agriculture, forestry and fisheries deserves more attention than paid in current reporting and associated studies, because it is an important food production component deserving analysis in its own right alongside the biophysical crop and livestock processes mentioned above. Additionally, it offers significant opportunities for on-farm mitigation actions directly focused on CO2 (Dyer et al., 2014).
Information on energy consumption in different agricultural operations is available from the literature; albeit, there is a lack of consistent global data with country detail provided over relevant time series. Available information indicates that in-farm energy demand in Organisation for Economic Co-operation and Development (OECD) countries is mainly for crop cultivation, harvesting, heating protected crops in greenhouses, crop drying and storage, water pumping and livestock housing (OECD, 2008). On-farm use in high-GDP (gross domestic product) countries (20 GJ ha−1) is almost double that of the use in low-GDP countries (11 GJ ha−1) (FAO, 2011). Fossil fuel energy inputs have reduced labor inputs, or around 152 MJ for every man hour of labor inputs in high-GDP countries and 4 MJ in low-GDP countries (Sims and Flammini, 2014).
Smil (2008) and FAO (2011) estimated global direct and indirect energy use in agriculture in the early 2000s using available literature and global estimates at 17 EJ, of which 5 EJ go to power machinery; 4 EJ to animal husbandry, aquaculture and fisheries; 2 EJ to manufacture and maintain agricultural machinery; 5 EJ to extract, synthesize and distribute fertilizers; 0.5 EJ to manufacture pesticides and herbicides; and 0.3 to manufacture irrigation systems. Direct energy use in agriculture was a bit more than half this total, about 9 EJ. In addition to these amounts, energy use in agriculture includes electricity from the grid, decentralized renewable sources including bioenergy, conventional technologies, mechanical and thermal energy and biodiesel/biofuels.
As opposed to GHG emission estimates from global analysis (top-down analysis), this paper focuses on quantifying the GHG emissions that arise from the combustion of fossil fuels for energy use in agriculture, forestry and fisheries (i.e., capture fishing and aquaculture) with a “bottom-up” approach, i.e., using official statistical data reported by countries to the UN Statistics Division. It also provides an overview of total emissions and key trends at the global, regional and country levels.
The dataset and the related analysis in this paper refers to a single “agriculture” sector, which covers the three agricultural subsectors: agriculture, forestry and fisheries. Some additional disaggregated information is provided for fishing alone.
As detailed in the methods section, our quantification focuses mostly on farm and fishing activities, assuming that emissions associated with energy used in forestry is negligible – i.e., it is limited to energy use for farm operations, for aquaculture and for powering fishing vessels. We include additional estimates of the emissions associated with the off-site generation of electricity used on the farm, tracking results both separately for electricity and on-site fossil fuel use, as well as in the aggregate. The analysis does not include all other indirect energy uses that are typically addressed in life-cycle analyses, such as embedded energy for manufacturing of agriculture machinery (FAO, 2011, 2018; Sims et al., 2015).
Data on energy use in agriculture (including forestry and fisheries), by fuel type, over the annual time series (1970–2019), were available from the United Nations Statistics Division (UNSD) and International Energy Agency (IEA). These agencies regularly collect energy data from member countries, including for use in agriculture, forestry and fishing. Biofuels, renewables and other energy carriers derived from biomass were analyzed but not considered for calculating GHG emissions, since they were assumed to be carbon neutral (IPCC, 2006). In particular, UNSD energy consumption data were used to estimate GHG emission from agriculture as a whole, while IEA data were used to provide a breakdown for GHG from fisheries for information purposes. UNSD data are publicly available through the UNDATA portal, while access to IEA data is restricted, and the latter were kindly made available by IEA for this analysis. Energy use data from the UNSD Energy Statistics Database (UNSD, 2021) included the following fuels, over the period 1970–2019: diesel oil; motor gasoline; liquefied petroleum gas (LPG); natural gas, including liquefied natural gas (LNG); fuel oil; hard coal. Energy use data from the IEA energy statistics included diesel oil and fuel oil used in fisheries.
2.1 Gap filling
The energy use data sourced from UNSD were gap filled for both improving the quality of available time series by country and generating data for missing countries. The original set had several missing data points especially for Africa (FAO, 2021b). First, a simple linear gap-filling method was applied to estimate data points missing within intervals with data points, over the time period 1970–2019. Conversely, gap filling of values for carrying backward and forward values without an available interval was performed by applying subregional trends. Finally, time series for countries with no data were generated with a multivariate approach, i.e., by computing the subregional energy use in agriculture divided by the subregional total energy use and applying the coefficient to the time series of national total energy use, which was available in the UNSD database without major gaps. We validated our gap-filling method by performing random substitutions of existing values and computing the associated error, which was on average below 5 %.
2.2 Emissions estimates
The activity data on energy use described in previous sections served as input for estimates of GHG emissions, made following the Tier 1 method of the guidelines of the Intergovernmental Panel on Climate Change (IPCC, 2006). In particular, we used default fuel-specific CO2 emission factors for off-road mobile combustion sources (e.g., tractors, harvesters and other mobile machinery) (Table 1) and stationary combustion sources (i.e., irrigation pumps, space heating), within the following formula:
where Ei are the emissions (in t CO2 yr−1) for energy carrier i, computed by multiplying the amount of fossil fuel type ADi (GJ yr−1) by the relevant emission factor EFi (t CO2 GJ−1). The default emission factors applied to relevant fuel categories were those for stationary combustion in the residential and agriculture/forestry/fishing farms categories, assumed by IPCC to be used for power generation (heat and/or electricity) (Table 2). Fuels reported in metric tons were converted to GJ by assuming a net calorific value of 43.0 GJ t−1 for diesel, 44.3 GJ t−1 for gasoline, 47.3 GJ t−1 for LPG, 44.2 Gg t−1 for natural gas liquids, 40.4 GJ t−1 for fuel oil, 25.8 for coal1 (IPCC, 2006).
Table 1Fuel-specific emission factors for agriculture off-road mobile combustion sources and machinery applied (IPCC, 2006).

* Four-stroke gasoline engine.
Table 2Fuel-specific emission factors for stationary combustion in the residential and agriculture/forestry/fishing/fishing farms categories applied (IPCC, 2006).

* Kilogram of greenhouse gas per TJ on a net calorific basis.
Finally, country-specific grid emission factors needed to estimate CO2 emissions from electricity used were taken from IEA (2014) and imputed from 2013 to 2019. They were complemented with CH4 and N2O country-specific grid emission factors estimated by the authors on the basis of the default emission factors for stationary combustion in the energy industries, according to IPCC (2006). As our calculations (not shown) indicated, CH4 and N2O emissions, calculated as a proportion of CO2 emissions, are only a minor share (<5 %) of total GHG emissions from electricity.
Emissions from fisheries were estimated as a separate item (until 2018), using dedicated IEA data, and for information purposes only; i.e., they were assumed to represent additional information, since energy used in agriculture (including forestry and fisheries) is already included in the UNSD energy statistics. Fisheries statistics from IEA were limited to OECD countries. Only diesel and fuel oil for powering fishing vessels and aquaculture were reported under fisheries, since these two fuels represent the bulk of energy used in the sector (followed by heat).
Uncertainties were derived by applying ranges for GHG emission factors provided by IPCC 2006 to fuels considered and an error of 5 % for emissions associated with electricity consumption (calculated based on the global energy mix for electricity generation in the IEA database).
2.3 Limitations and uncertainty
There are limitations and uncertainties associated with the estimates presented herein. First, we note that the input data on energy refer to use in agriculture (including forestry and fisheries) without further breakdown. While we refer often to the associated emissions as generated within the farm gate, they include components of unknown relative magnitude that are in fact generated through forestry and fishery activities. For the latter, we have provided a partial and incomplete breakdown in the database, using IEA fishery data. Second, the underlying data on energy use have significant geographical gaps, especially in Africa, as well as temporal gaps, particularly before 1990. Out of 233 countries and territories, 51 were imputed in the energy emissions Food and Agriculture Organization Corporate Statistical Database (FAOSTAT). However, these are all small countries and their total share of global GHG emissions from energy use in agriculture is less than 1 %. As mentioned above, the error associated with activity data gap filling was on average below 5 %. The uncertainty in the original energy consumption data is much smaller for some countries than for others, depending on whether the activity data are collected using specific surveys, where a sense of the uncertainty can be measured, or whether national statistical offices use proxies and/or assumptions. The uncertainty also varies by product, depending on what administrative data may be available for them (sales, taxes, etc.), or even on whether they are traded in the formal or informal sector (or not traded at all). According to the default uncertainty for activity dataset by IPCC energy guidelines, the uncertainty is measured mainly from two aspects (IPCC, 2001): (1) the adequacy of the statistical coverage of all source categories and (2) the adequacy of the scope of all fuels (both traded and non-traded). In our case, using the level of uncertainty for stationary non-energy intensive industries and “well-developed statistical systems” (such as energy statistics), an uncertainty of ±5 % can be assumed for activity data (IPCC, 2006, volume 2, chap. 2, Table 2.6). Uncertainty in activity data was then combined with uncertainty in fuel emission factors (−7 % to 16 %), computed by taking the IPCC lower and upper values of emissions factors by fuel, weighted by their average world use. The resulting overall uncertainty was obtained by applying the IPCC (2006) default error propagation method, resulting in the range −9 % to +17 %.
Our estimates indicated that world-total GHG emissions from energy use in agriculture including electricity were above 1 billion tonnes in 2019 (1029 Mt CO2eq yr−1; 7 % greater than in 1990). The average annual increase was 0.2 % over the period 1990–2019 and was consistent with the overall growth in agricultural emissions within the farm gate. Almost half of the estimated emissions (496 Mt CO2eq yr−1) arose from combustion of fossil fuels for power generation of electricity used on the farm. The most important energy sources after electricity were gas/diesel oil and coal, while motor gasoline, typically associated with field machinery and irrigation in developing countries, contributed a mere 5 % of the total (Fig. 1). Emissions from electricity grew rapidly over the study period (mean annual growth rates of more than 6 %), overtaking gas diesel oil and motor gasoline as the main emission source by roughly the year 2012. This, together with an increase of LPG use, suggests a global transition towards cleaner on-farm energy use, considering grid electricity is typically associated with lower emissions per energy compared to single fossil fuel sources.
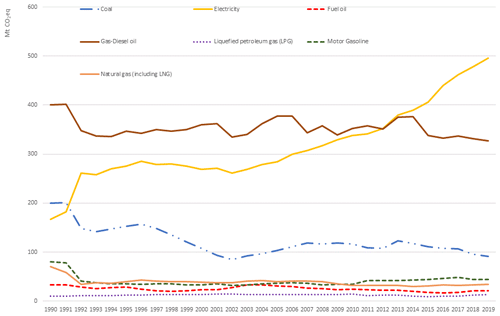
Figure 1Global GHG emissions from energy use in agriculture from 1990 to 2019 by energy carrier (Mt CO2eq). Source: FAOSTAT, based on data from IEA and UNSD (2021).
At the same time, use and hence emissions from natural gas, fuel oil and coal were rather constant over the period 1990–2019, about 38, 123 and 25 Mt CO2eq yr−1 on average. While data for on farm energy use were rich in coverage, trends in emissions from use of diesel oil and fuel oil in fishing vessels were limited by data paucity. Within such limitations, we find a small, decreasing share of emissions from fishing vessels compared to world-total energy use in agriculture, with a total contribution in 2018 (the breakdown of energy used in fisheries is available only until 2018) of about 27 Mt CO2eq (3 %).
In terms of total emissions, the top 15 countries (out of 199 countries covered by the dataset) are responsible for 54 % of global GHG emissions in 2019. No country from Africa or Oceania were among the top 10 GHG emitters. As these are typically densely populated countries, an analysis of GHG emission per person (done on the basis of population data also available in FAOSTAT) led to the same result. Of the 10 top emitters, three are from Asia, two from North America, two from Europe and three from Latin America. However, in terms of GHG emission from energy use in agriculture per person, no Asian country appears in the top 10.
China and India were the largest emitters in 2019 in absolute terms. Although gas/diesel oil was responsible for the most GHG emissions in Asia, in China and India, most of the on-farm emissions from on-farm energy use originate from coal (50 % and 88 % respectively).
3.1 Regional distributions and trends
Our results indicate that on-farm energy use is an important and increasing component of GHG emissions in agriculture, corresponding to 892 Mt CO2eq yr−1 out of 6604 Mt CO2eq yr−1 on-farm emissions in 1990 and 962 out of 7214 Mt CO2eq yr−1 in 2019. Emissions declined in Annex I countries over the period 1990–2019, especially energy from coal (−88 %) and fuel oil (−77 %). Such a decline was more than counterbalanced by increases in energy use in non-Annex I (NAI) parties, with significant increases in emissions from electricity (3-fold increases since 1990) (Figs. 2 and 3).
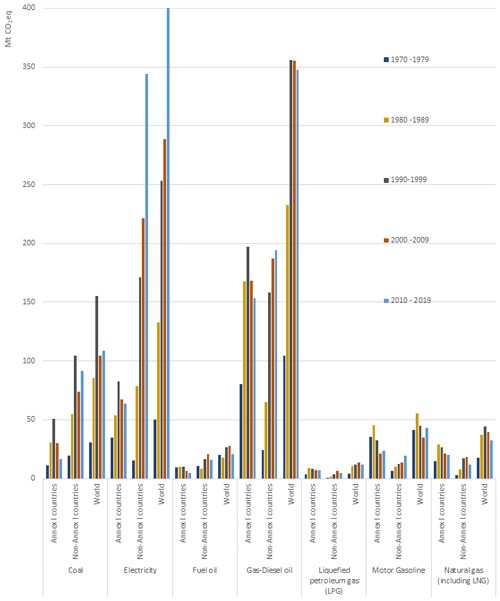
Figure 2GHG emission trends from 1990 to 2019 for Annex I and non-Annex I countries by energy carrier (Mt CO2eq). Source: FAOSTAT, 2021.
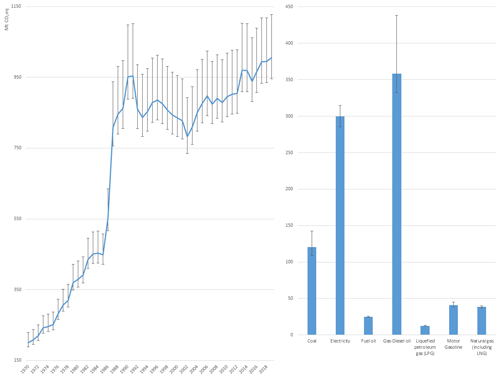
Figure 3Trend in global GHG emissions (from 1990 to 2019) and global GHG emissions from energy use in agriculture by energy source (average 1990–2019) with uncertainty ranges. Source: FAOSTAT, based on data from IEA and UNSD (2021).
Asia and Europe were the largest emitters among FAO regions, although with starkly different trends over 1990–2019. Indeed, while emissions in Europe decreased over the whole period, from 730 in 1970 to 410 Mt CO2eq yr−1 in 1990 and further decreased to 145 Mt CO2eq yr−1 in 2019, emissions in Asia nearly doubled over 1990 to 2019, from 380 to 629 Mt CO2eq yr−1, while they were 453 Mt CO2eq yr−1 in 1970. Africa was a significant emission source in 2019, having more than doubled since 1990, from 18 to 48 Mt CO2eq yr−1. Emissions increased more than 55 % in Latin America but only 18 % in North America. The smallest contributor to global emissions was Oceania, despite increases by nearly 55 % from 1990 (Fig. 4). The top emitting countries in 2019 in terms of energy use in agriculture were China (233 Mt CO2eq yr−1), followed by India (212 Mt CO2eq yr−1) and the US (79 Mt CO2eq yr−1). The top 10 emitting countries were responsible for nearly two-thirds of the world total (Fig. 4).
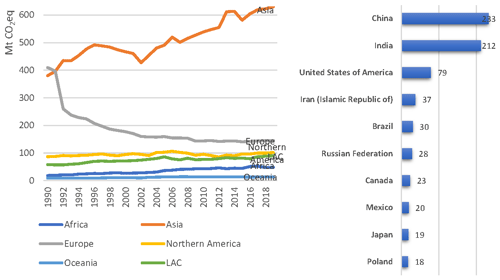
Figure 4GHG emissions from energy use in agriculture from 1990 to 2019, by region (left) and top 10 emitting countries in 2019 (right) (Mt CO2eq). Source: FAOSTAT, based on data from IEA and UNSD (2021).
Emissions from mobile combustion in agriculture (typically tractors or other field machinery) represent a large share in most continents. In 2019, gas/diesel oil burning was the largest CO2 on-farm emission source in all the continents: 55 % in Asia, 48 % in Africa, North America (57 %), Oceania (88 %) and Latin America (76 %). The second-largest emitter is motor gas in Africa (21 %), Oceania (7 %) and North America (23 %), coal in Asia (31 %), natural gas (13 %) in Europe and fuel oil (9 %) in Latin America.
In countries dominated by fisheries as the main agricultural subsector, the results are significantly different, with diesel oil and fuel oil as the main sources of GHG emissions. For example, in the Faroe Islands, gas diesel oil generated 75 % of CO2 emissions, followed by fuel oil (18 %) and electricity (7 %). Greenland had 63 % CO2 emissions from gas/diesel oil, followed by fuel oil (20 %) and motor gasoline (17 %).
3.2 Indicators
We developed indicators by cropland area and by agricultural production value to help disentangle effects of country agricultural size, both in terms of area and economy. We defined GHG emission intensity per unit of cropland as the total GHG emissions from energy use in agriculture divided by total cropland area of a country. Likewise, energy GHG intensity per production value was computed by dividing total GHG from national energy use in agriculture by total agricultural value added. (Fig. 5). Data for the denominators of both indicators were taken from FAOSTAT (FAO, 2021a, b).
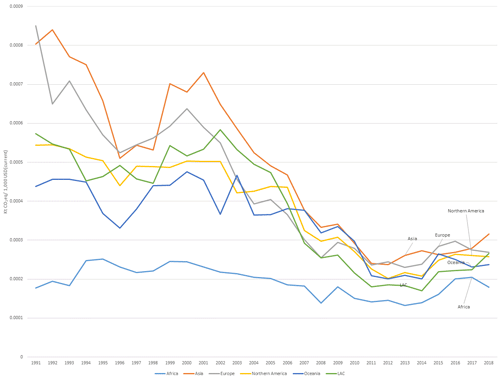
Figure 5GHG emission from energy use in agriculture per gross agriculture production value in 1991–2018 (Kt CO2eq/current USD 1000). Source: FAOSTAT, based on data from IEA and UNSD (2021).
Our results indicate that energy GHG emissions per unit cropland have been fluctuating but have been substantially stable over the last two decades. Nonetheless, significant differences can be noted among regions (Fig. 6). While Europe has significantly decreased its energy-related GHG emission intensity in agriculture (−57 %) in the period 1990–2018, Africa, Central America and Asia have increased it substantially (+88 %, +51 % and +44 %, respectively). This means that more GHG emissions are associated with the cultivation of one unit of cropland in these regions. In absolute terms, the lowest energy intensity per unit of cropland in 2018 was achieved in Africa (0.16 t CO2eq ha−1), followed by Oceania (0.38 t CO2eq ha−1), South America (0.42 t CO2eq ha−1) and Europe (0.48 t CO2eq ha−1). A clear diverging trend can be noticed between Annex I and non-Annex I countries, with the former significantly decreasing the energy-related agricultural emissions intensity and the latter significantly increasing them (Fig. 6).
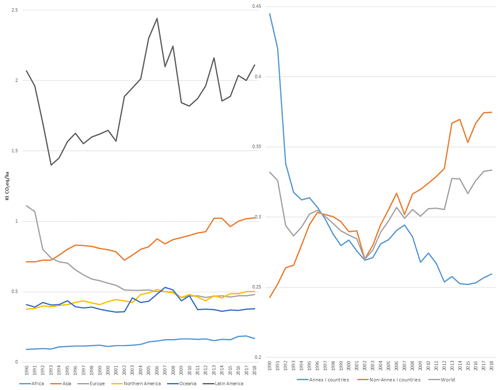
Figure 6GHG emission from energy use in agriculture per unit of cropland by continent (left) and by Annex I and non-Annex I countries (right) for 1990–2018 (Kt CO2eq ha−1). Source: FAOSTAT, based on data from IEA and UNSD (2021).
In terms of energy-related GHG emissions to agricultural value added, the picture is substantially different, with Europe having significantly improved its energy intensity since 1990 (−68 %), followed by Asia (−61 %), Latin America and the Caribbean (−54 %), North America (−53 %) and Oceania (−45 %), while Africa's intensity remained substantially stable over the last two decades.
This picture is significantly different when analyzing energy-related emission per capita (Fig. 7). Per capita, the emission intensity is lowest in most African countries and India, while it is high in Canada, Australia and Argentina, among others.
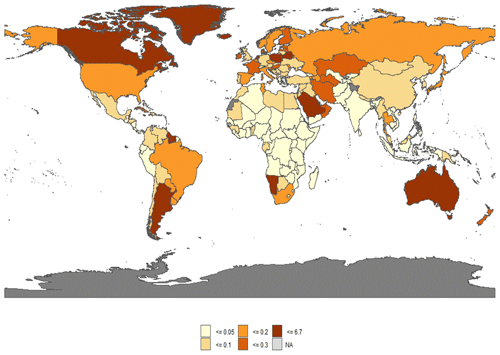
Figure 7GHG emission from energy used in agriculture per capita in 2019 (t CO2eq per person). Source: emissions data from FAOSTAT, 2021. Population data from the World Bank (https://data.worldbank.org/indicator/SP.POP.TOTL, last access: July 2021), complemented with United Nations Department of Economic and Social Affairs (UN DESA) population data for Falkland Islands, Guadeloupe, French Guiana, Martinique, Niue, Réunion, Romania, State of Palestine and Democratic Republic of the Congo.
In 2019, high levels of GHG emissions per capita (from energy used in agriculture) were estimated for the Faroe Islands, Greenland and Iceland. In those territories, emissions from gas/diesel oil take up more than two-thirds of the total. Fishing is one of the factors most responsible for contributing to the high per capita emission from energy use in agriculture in the Faroe Islands, as fishing vessels take almost one-third of energy use at national level. Fishing is also the primary industry in Iceland. For Greenland, fishing is the second-largest industry by employment. Though Greenland has the highest ratio of using renewable energy (70 %), fishing remains a sector depending on traditional fossil fuels.
Emissions from energy use in agriculture are only about one-fifth of the total in CO2eq generated from crop and livestock production (Tubiello et al., 2021); however, they represent an important contribution in terms of CO2 gas, with the other process emitting CO2 on the farm being the drainage of organic soils. They are therefore of great importance to GHG mitigation in agriculture. In terms of comparing these results with the existing literature, we note that our approach covers only 7.2 of the 8–10 EJ usually estimated for total fuel consumption within the farm gate (Arizpe et al., 2011; FAO, 2011; Smil, 2008). Additionally, our estimates of energy use in fisheries is admittedly incomplete (0.3 EJ) compared to amounts reported in other studies (Buhaug et al., 2009; FAO, 2011). The reason is that we focused only on electricity and on the most relevant fuels consumed in agriculture but not all. Specifically for fisheries, the relatively low coverage is also due to the fact that still few countries report disaggregated energy consumption statistics for fisheries alone.
Electricity generation and gas/diesel oil used in agriculture were the two most important emissions sources, responsible for roughly 40 % of the total on average during the period 1990–2019. Electricity is used for different agriculture purposes: irrigation, processes that require heat or mechanical power, such as drying or milling. LPG, natural gas and heavy fuel oil are typically used for heat generation and, in some rare cases, for motive power. Apart from some sharp variation of their total consumption in agriculture between consecutive years, mainly at the beginning of the 1990s, probably due to reporting issues of important consumer countries such as India and the dissolution of the USSR, their emissions remained relatively stable. Compared to other emissions, coal and fuel oil emissions decreased over the last few years, while agricultural production still increased. This can be explained by updated energy use structure – the increased uptake of cleaner energy carriers such as electricity and LPG over fuel oil and coal for heating. China, for example, one of the major emitting countries, decreased emissions from fuel oil use by 48 %, while increased emissions due to diesel use by around 59 % and emissions due to electricity use by over 170 % over the same period (1990–2019). Regardless, there is still a long way to go to decrease emissions in the agricultural sector in China, due to its still very high reliance on coal as a heat source.
Unlike other regions, Europe's emissions went down significantly, partly because less energy was consumed by primary production in absolute terms. Also, Europe has gradually moved from high-GHG-emitting energy carriers, such as coal and fuel oil, towards cleaner ones, such as natural gas and electricity. This is confirmed by the additional analysis done using the energy-related GHG intensity indicators. This analysis shows how Europe has been steadily decreasing its agricultural GHG intensity (both in terms of unit of cropland and of unit of agricultural production value), thus providing a good example for other regions.
The GHG emission data presented herein cover the period 1970–2019, at the country level, with regional and global aggregates. Significant gaps in some countries and regions, especially Africa, imply that specific regional estimates may be systematically underestimated. Additionally, statistics on energy consumption and emissions from fisheries are highly uncertain and likely underestimates, considering that significant amounts of fuel consumed by small vessels, constituting a majority of the global fishing fleet, are not typically reported in official statistics.
Data on energy use in agriculture and associated emissions used in this work are available as open data under https://doi.org/10.5281/zenodo.5153241 (Tubiello and Pan, 2021). A thorough description of the dataset and metadata information are available through FAOSTAT at https://www.fao.org/faostat/en/#data/GN. The relevant FAOSTAT (FAO, 2021b) database is maintained and updated annually by FAO.
This paper provides details of a new dataset added to the existing section of FAOSTAT, which contains information about emissions due to agricultural activities and which was just opened publicly online (July 2021). It also provides an analysis of energy-related GHG intensity in agriculture, per unit of cropland and per unit of agricultural production value, which has not been published yet. It complements the analysis with selected GHG emission intensity indicators, which are derived directly from FAOSTAT. The calculation makes use of official statistics as reported by countries to the UN, applying IPCC Tier 1 default emission factors for fuels and IEA country-specific emission factors for electricity generation (considering the national energy mix) and relies on official energy consumption in agriculture data reported by countries to the UNSD and the IEA. In addition to the above, the share of emissions on fisheries' energy use is estimated and reported separately as a subset. These estimated emission shares provide references to their relevance compared with total emissions but should be used with relevant uncertainties taken into consideration.
AF and FNT conceptualized the paper and the methodology, AF and SB prepared the original draft, FNT and XP edited the paper, XP, SB and AF supported data analysis and visualization, RQ and LRS provided resources for the analysis, and RQ, and LRS, SYQ, PB and RS reviewed the final draft of the paper.
At least one of the (co-)authors is a member of the editorial board of Earth System Science Data. The peer-review process was guided by an independent editor, and the authors also have no other competing interests to declare.
Publisher's note: Copernicus Publications remains neutral with regard to jurisdictional claims in published maps and institutional affiliations.
This paper was edited by Bo Zheng and reviewed by two anonymous referees.
Arizpe, N., Giampietro, M., and Ramos-Martin, J.: Food Security and Fossil Energy Dependence: An International Comparison of the Use of Fossil Energy in Agriculture (1991–2003), Crit. Rev. Plant Sci., 30, 45–63, https://doi.org/10.1080/07352689.2011.554352, 2011.
Buhaug, Ø., Corbett, J. J., Endresen, O., Eyring, V., Faber, J., Hanayama, S., Lee, D., Lindstad, H., Mjelde, A., Palsson, C., and Wanquing, W.: Second IMO greenhouse gas study, International Maritime Organization, London, 2009.
Calicioglu, O., Flammini, A., Bracco, S., Bellù, L., and Sims, R.: The Future Challenges of Food and Agriculture: An Integrated Analysis of Trends and Solutions, Sustainability, 11, 222, https://doi.org/10.3390/su11010222, 2019.
Dubois, O., Flammini, A., Kojakovic, A., Maltsoglou, I., Puri, M., and Rincon, L.: Energy access: food and agriculture, no. 115062, pp. 1–15, The World Bank, 2017.
Dyer, J. A., Desjardins, R. L., and McConkey, B. G.: The fossil energy use and CO2 emissions budget for Canadian agriculture, in: Sustainable Energy Solutions in Agriculture, Chapter 4, Taylor and Francis/CRC Press, Boca Raton, 77–96, ISBN 9780429227493, 2014.
FAO: Energy-smart food for people and climate, Food and Agriculture Organinzation of United Nations (FAO), http://www.fao.org/3/i2454e/i2454e00.pdf (last access: February 2022), 2011.
FAO: Energy Smart Agriculture, E-Agric, http://www.fao.org/e-agriculture/blog/energy-smart-agriculture (last access: July 2021), 2018.
FAO: FAOSTAT Production Indices, FAO [data set], http://www.fao.org/faostat/en/#data/QI (last access: August 2021), 2021a.
FAO: FAOSTAT Emissions – Agriculture, Energy Use, FAO [data set], https://www.fao.org/faostat/en/#data/GN (last access: August 2021), 2021b.
International Energy Agency (IEA): CO2 Emissions from Fuel Combustion 2014, IEA, Paris, https://doi.org/10.1787/co2_fuel-2014-en (last access: May 2021), 2014.
IPCC: Good Practice Guidance and Uncertainty Management in National Greenhouse Gas Inventories, http://www.ipcc-nggip.iges.or.jp/public/gp/english/ (last access: August 2021), 2001.
IPCC: 2006 Guidelines for National Greenhouse Gas Inventories (NGHGI), the Institute for Global Environmental Strategies (IGES), Hayama, Japan on behalf of the IPCC, https://www.ipcc-nggip.iges.or.jp/public/2006gl/ (last access: August 2021), 2006.
OECD: Environmental performance of agriculture in OECD countries since 1990, Chapter 1, Section 1.4 Energy, https://www.oecd.org/greengrowth/sustainable-agriculture/44254899.pdf (last access: February 2022), 2008.
Sims, R. E. and Flammini, A.: Energy-smart food–technologies, practices and policies, in: Sustainable energy solutions in agriculture, CRC Press, 163–210, 2014.
Sims, R. E., Flammini A., Puri, M., and Bracco, S.: Opportunities for agri-food chains to become energy-smart, p. 212, FAO and USAID, ISBN 978-92-5-108959-0, https://www.fao.org/publications/card/en/c/0ca1c73e-18ab-4dba-81b0-f8e480c37113/ (last access: February 2022), 2015.
Smil, V.: Energy in nature and society: general energetics of complex systems, MIT press, ISBN 9780262195652, 2007.
Tubiello, F. and Pan, X.: Emissions from energy used in agriculture (on-farm), Zenodo [data set], https://doi.org/10.5281/zenodo.5153241, 2021.
Tubiello, F. N.: Greenhouse Gas Emissions Due to Agriculture, in: Encyclopedia of Food Security and Sustainability, vol. 1, edited by: Ferranti, P., Berry, E. M., and Anderson, J. R., Elsevier, 196–205, ISBN 9780128126875, 2019.
Tubiello, F. N., Rosenzweig, C., Conchedda, G., Karl, K., Gütschow, J., Xueyao, P., Obli-Laryea, G., Wanner, N., Qiu, S. Y., Barros, J. D., Flammini, A., Mencos-Contreras, E., Souza, L., Quadrelli, R., Heiðarsdóttir, H. H., Benoit, P., Hayek, M., and Sandalow, D.: Greenhouse gas emissions from food systems: building the evidence base, Environ. Res. Lett., 16, 065007, https://doi.org/10.1088/1748-9326/ac018e, 2021.
UNSD: Energy Statistics Database, in: DATA.UN.org, http://data.un.org/Explorer.aspx?d=EDATA, last access: December 2021.
Utz, V.: Modern Energy Services for Modern Agriculture: A Review of Smallholder Farming in Developing Countries, GIZ-HERA – Poverty-oriented Basic Energy Services, https://energypedia.info/images/f/fd/Energy_Services_for_Modern_Agriculture.pdf (last access: July 2021), 2011.
We assumed that coal used in agriculture is mostly “bituminous coal.”


