the Creative Commons Attribution 4.0 License.
the Creative Commons Attribution 4.0 License.
 | 11 Jan 2022
A new local meteoric water line for Inuvik (NT, Canada)
Sebastian Wetterich
Joel McAlister
Hanno Meyer
The paper presents a new local meteoric water line (LMWL) of stable oxygen and hydrogen isotopes in precipitation from Inuvik in the western Canadian Arctic. Data were obtained over 37 months between August 2015 and August 2018 resulting in 134 measurements of the isotopic composition of both types of precipitation, snow and rain. For 33 months of the sampling period each month is represented at least two times from different years. The new LMWL from Inuvik is characterized by a slope of 7.39 and an intercept of −6.70 and fills a data gap in the western Arctic, where isotopic composition data of precipitation are scarce and stem predominantly from before the year 1990. Regional studies of meteorology, hydrology, environmental geochemistry and paleoclimate will likely benefit from the new Inuvik LMWL. Data are available on the PANGAEA repository under https://doi.org/10.1594/PANGAEA.935027 (Fritz et al., 2021).
- Article
(2531 KB) - Full-text XML
- BibTeX
- EndNote


The global annual average relationship between hydrogen (δ2H or δD) and oxygen (δ18O) isotope ratios in natural meteoric waters is captured by the global meteoric water line (GMWL) that was developed by assembling numerous local annual mean records worldwide (Craig, 1961) and is expressed by Eq. (1):
The GMWL is widely used as baseline in environmental geochemistry, meteorology, hydrology and hydrogeology to trace the water cycle before and after recharge and to use isotopic fractionation processes in the water pathway to infer source characteristics and transport mechanisms. The relationship of δ18O and δ2H in meteoric waters is controlled by mass-dependent fractionation of oxygen and hydrogen isotopes between evaporation from ocean seawater and condensation from vapour, which strongly depends on altitude, latitude, seasonality and continentality of a given location (e.g. Clark, 2013; Dansgaard, 1964; Gat, 1996).
A meteoric water line calculated for a given area is called local meteoric water line (LMWL) with emphasis on the spatial variability in isotopic compositions of meteoric waters as investigated by Rozanski et al. (1993) by comparing the δ18O–δ2H relationships of monthly-scale samples at selected sites of the Global Network of Isotopes in Precipitation (GNIP) (IAEA/WMO, 2020). Thus, an LMWL represents the covariation in oxygen and hydrogen stable isotope ratios for a distinct area and observation period and has practical utility as a hydrologic framework and benchmark for evaluating hydroclimatic processes such as in isotope-enabled climate models (e.g. Werner et al., 2016). As a simplified, intuitive and site-specific representation of the average isotopic relationship in meteoric waters, coupled with information about the seasonal range of isotope composition in precipitation, an LMWL offers a reference for interpreting the isotope ratios measured in terrestrial waters and ice.
An LMWL can deviate from the GMWL both in slope and intercept of the linear regression in a δ18O–δ2H co-isotope plot. Such deviation largely results from differences in humidity (e.g. Putman et al., 2019) that are represented by the second-order parameter deuterium excess (d; Dansgaard, 1964), expressed by Eq. (2):
Deuterium excess is an indicator for non-equilibrium fractionation processes that might occur during phase transitions of water. It has been established as a function of relative humidity in the moisture source regions. The statistical linear relationship of δ2H to δ18O varies both temporally and spatially, and the variation in the slope may hold information about the seasonal climatology of the site (Craig, 1961; Rozanski et al., 1993).
A correlation between air temperature (T) and precipitation δ18O was recognized and can be used to study surface air temperature change over time (Merlivat and Jouzel, 1979) using preserved ancient meteoric water such as in glacial ice (e.g. Dansgaard, 1964; Jouzel et al., 2003) or in permafrost-bound ground ice (e.g. Meyer et al., 2015; Opel et al., 2018; Wetterich et al., 2021) to reconstruct paleoclimate. Such studies benefit from known modern hydroclimatic conditions as expressed in LMWLs (e.g. Porter et al., 2019; Porter and Opel, 2020).
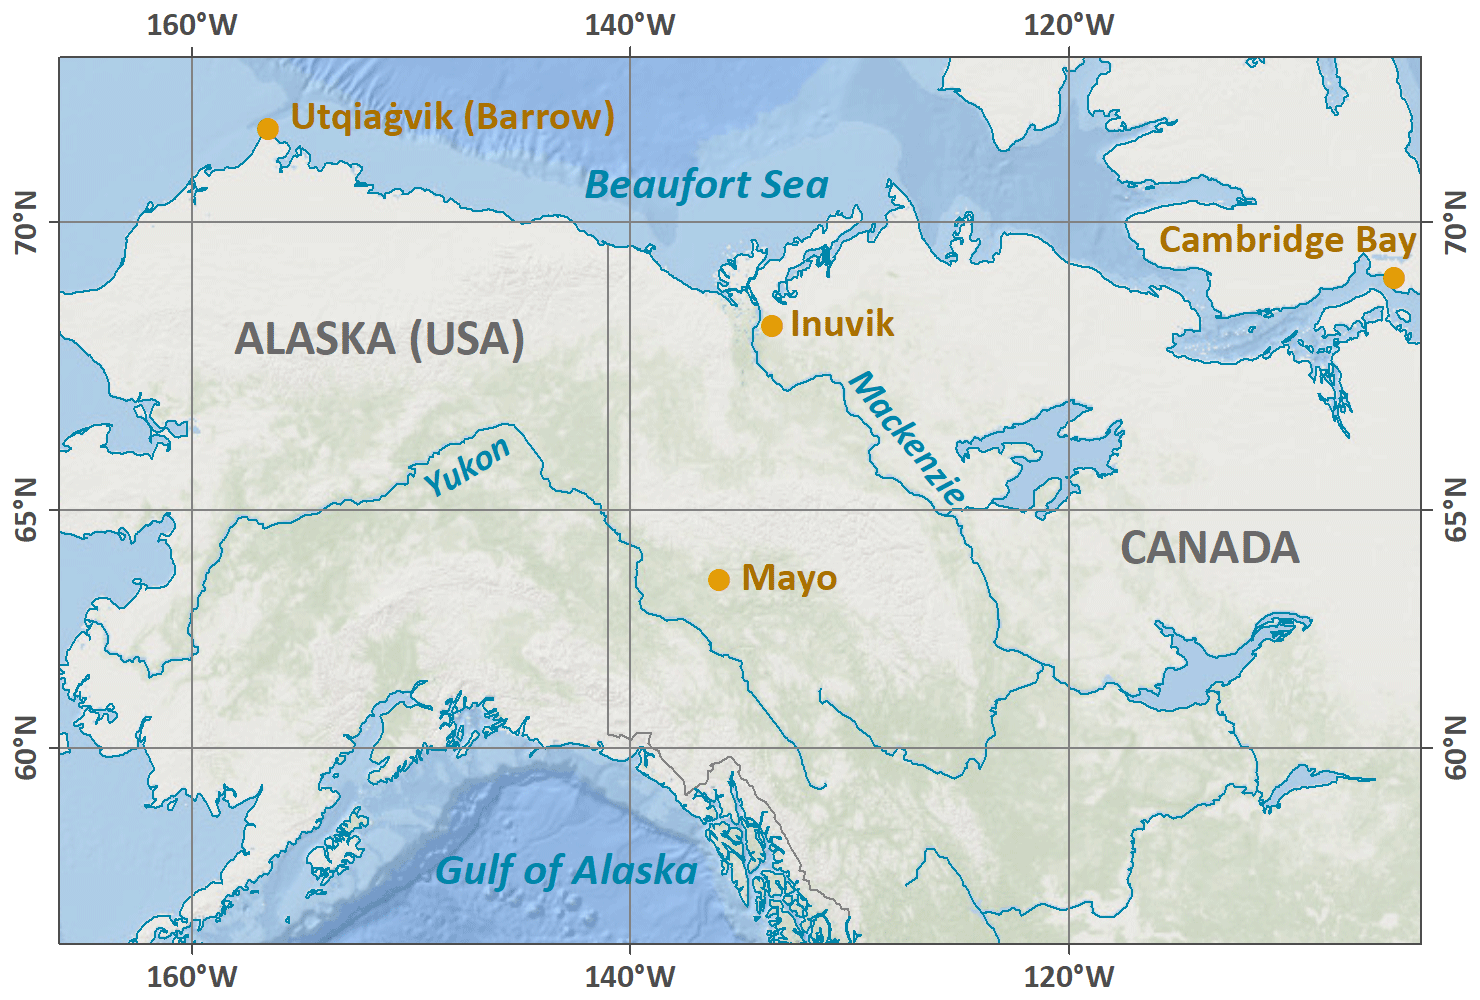
Figure 1Map with WMO stations in the western Arctic, where GNIP data and LMWLs exist (i.e. Inuvik, Utqiaġvik (Barrow), Mayo and Cambridge Bay). Map by Sebastian Laboor (Alfred Wegener Institute, AWI, Potsdam, Germany).
Although increasingly used, LMWLs from remote areas are rare, especially in the Arctic, as it requires long-term and regular sampling, analysing, and data processing (Putman et al., 2019). For example, in the western Arctic where extensive paleoclimatic research on (buried) glacial ice (e.g. Lacelle et al., 2007; Fritz et al., 2011; Coulombe et al., 2019), permafrost ground ice (e.g. Meyer et al., 2010; Fritz et al., 2011, 2012; St-Jean et al., 2011; Holland et al., 2020) and permafrost hydrology (e.g. Utting et al., 2012, 2013; Kokelj et al., 2015) takes place, the respective reference LMWLs to compare isotopic records with are based on scarce data covering only small periods of data acquisition before the year 1990 at only a few locations (Fig. 1). The present data collection aims (1) to update and extend the previous Inuvik LMWL and, thus, (2) to improve the regional framework for meteorological, hydrological and paleoclimate applications of precipitation stable isotopes of modern and past environments. Special emphasis is given to the central role of Inuvik for research in the western Canadian Arctic.
Inuvik (68.3∘ N, 133.5∘ W; Fig. 1) is located at the east channel of the Mackenzie River delta in the Northwest Territories (NT) in Canada. The current World Meteorological Organization (WMO) station (number: 719570) in Inuvik is located at the international airport at an elevation of 68 m above sea level (m a.s.l.).
The regular sampling of meteoric water for subsequent stable isotope analysis was conducted between August 2015 and August 2018 at the Aurora Research Institute (Western Arctic Research Centre, 191 Mackenzie Road, Inuvik, NT X0E 0T0, Canada) in the town of Inuvik.
A precipitation gauge was constructed as a PVC funnel with 30 cm diameter on top and fitting into a vertical PVC pipe with a diameter of 10 cm. A 250 mL HDPE bottle is located behind the sleeve in the vertical PVC tubes, directly under the funnel, which collects the water. The funnel and a 250 mL collection bottle fit tightly together to avoid secondary evaporation. The collection bottle can be taken out or replaced through the sleeve. Threaded rods in the inside of the PVC pipes run into the ground for stabilization. Ropes and stakes stabilize the rain gauge against wind.
The rain gauge collection bottle was regularly checked and carefully emptied after every rain or snowfall event. Sampled precipitation was transferred into 15 or 30 mL narrow-neck LDPE bottles, depending on the amount of water aiming at no remaining air in the bottle. Snow was scraped out from the funnel of the precipitation gauge after each snow event. The snow was placed into a larger (250 mL) bottle and melted. The meltwater was then poured into a LDPE sample bottle. Samples were stored dark and cool at the Western Arctic Research Centre (ARI) in Inuvik at + 4 ∘C prior to analysis. Storage duration and sample container material might have an effect on the isotopic composition and thus on data quality and comparability. In a storage test study by Spangenberg (2012) over 659 d, the potential isotopic variations in LDPE bottles (10 and 50 mL), which are similar to the LDPE sample bottles used in our study (15, 30 mL), range from about 0.5 ‰ to 1.0 ‰ in δ18O and from about 1.9 ‰ to 3.0 ‰ in δ2H and show no trend over time. In our study the maximum period between sampling and analysis was less than 12 months (< 365 d). This maximum period was defined between the precipitation sampling on site in Inuvik and the sample pick-up, transport and subsequent analysis every summer. This means that our samples never reached the storage duration tested in the experimental study by Spangenberg (2012), which was 659 d. Given the minor effects of the LDPE material on the isotopic composition on monthly timescales, the container material we used (Kautex narrow-neck LDPE) provides some practical advantages for sampling in high latitudes. Those are (1) that the material is flexible to ensure complete filling without remaining air in the headspace, (2) that the material does not break upon freezing or mechanical stress, and (3) that complete and very tight closure of the lid avoids exchange with ambient air and sample loss due to evaporation. This ensures that neither evaporation nor other substantial fractionation processes altered the isotopic composition significantly.
The oxygen (δ18O) and hydrogen (δ2H) stable isotope compositions of precipitation were measured in the Stable Isotope Facility of the Alfred Wegener Institute in Potsdam (Germany), using a Finnigan MAT Delta-S mass spectrometer (1σ< 0.1 ‰ for δ18O, 1σ< 0.8 ‰ for δ2H; Meyer et al., 2000). Values are given as per mil (‰) difference from the Vienna Standard Mean Ocean Water (VSMOW) standard. A total of 135 samples were obtained and analysed from the monitoring period between August 2015 and August 2018 of which 134 samples were considered in this study. One sample from February 2016 was excluded from the data set and from interpretation due to its highly unusual isotopic composition (δ18O of −21.04 ‰, δ2H of −186.1 ‰, d of −17.8 ‰). We consider two possible explanations, which are (1) an incorrectly labelled date on the sample bottle or (2) sublimation and according kinetic fractionation of the snow sample. As the February 2016 sample was the only one in the entire sample set showing such anomalous values, while being stored and processed as all other samples, we decided to note the values for completeness but to exclude them from interpretation due to the untraceable origin of these erroneous values.
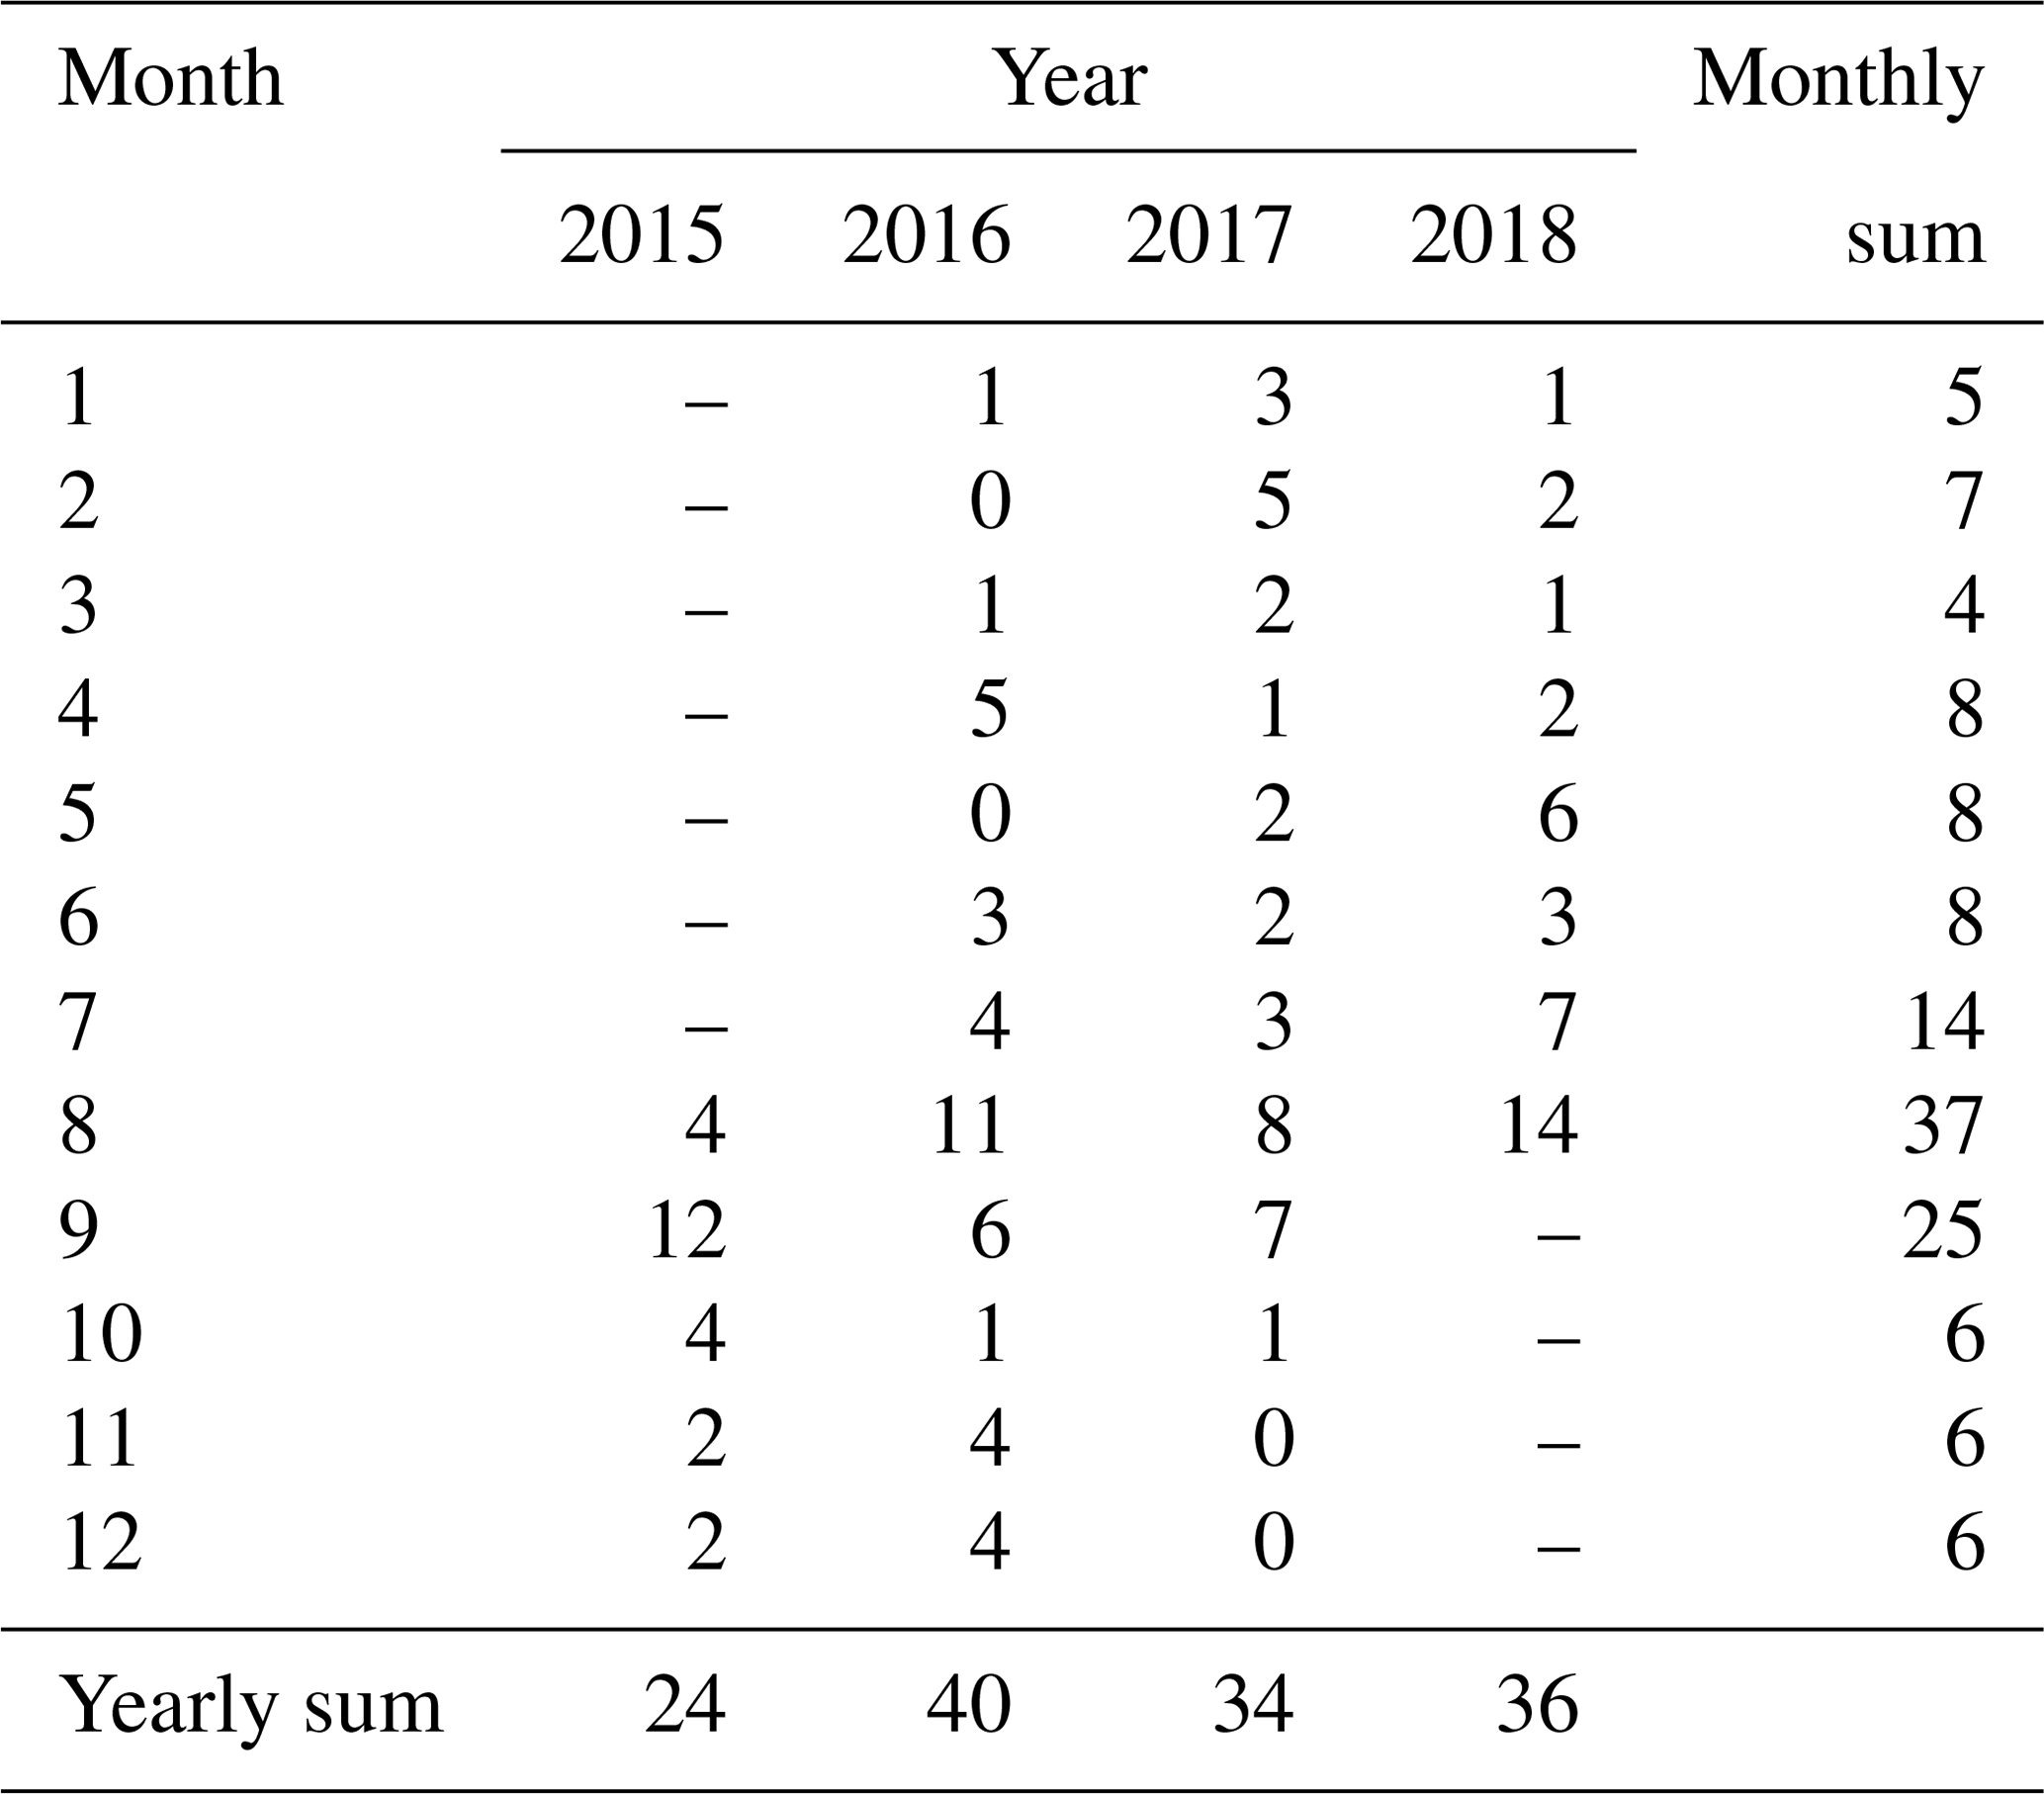
The total of 134 valid data points represent 33 months of the entire monitoring period of 37 months (Table 1). The 4 months without data during the observation period are February and May in 2016 and November and December in 2017. Consequently, each month in the data set is represented at least two times from different years. Eight months of the year(s) are represented at least three times from different years. The sample number per month varies between 0 and up to 14 samples (e.g. August 2018; Table 1).
The currently available GNIP data set for Inuvik precipitation originates from the 1980s. Data acquisition took place between 1986 and 1989. During this 4-year period, only 14 monthly observations of both δ2H and δ18O are available. The month of June is not represented in the previous Inuvik LMWL data set at all. All remaining months are represented at least once, while December, January and February are represented twice.
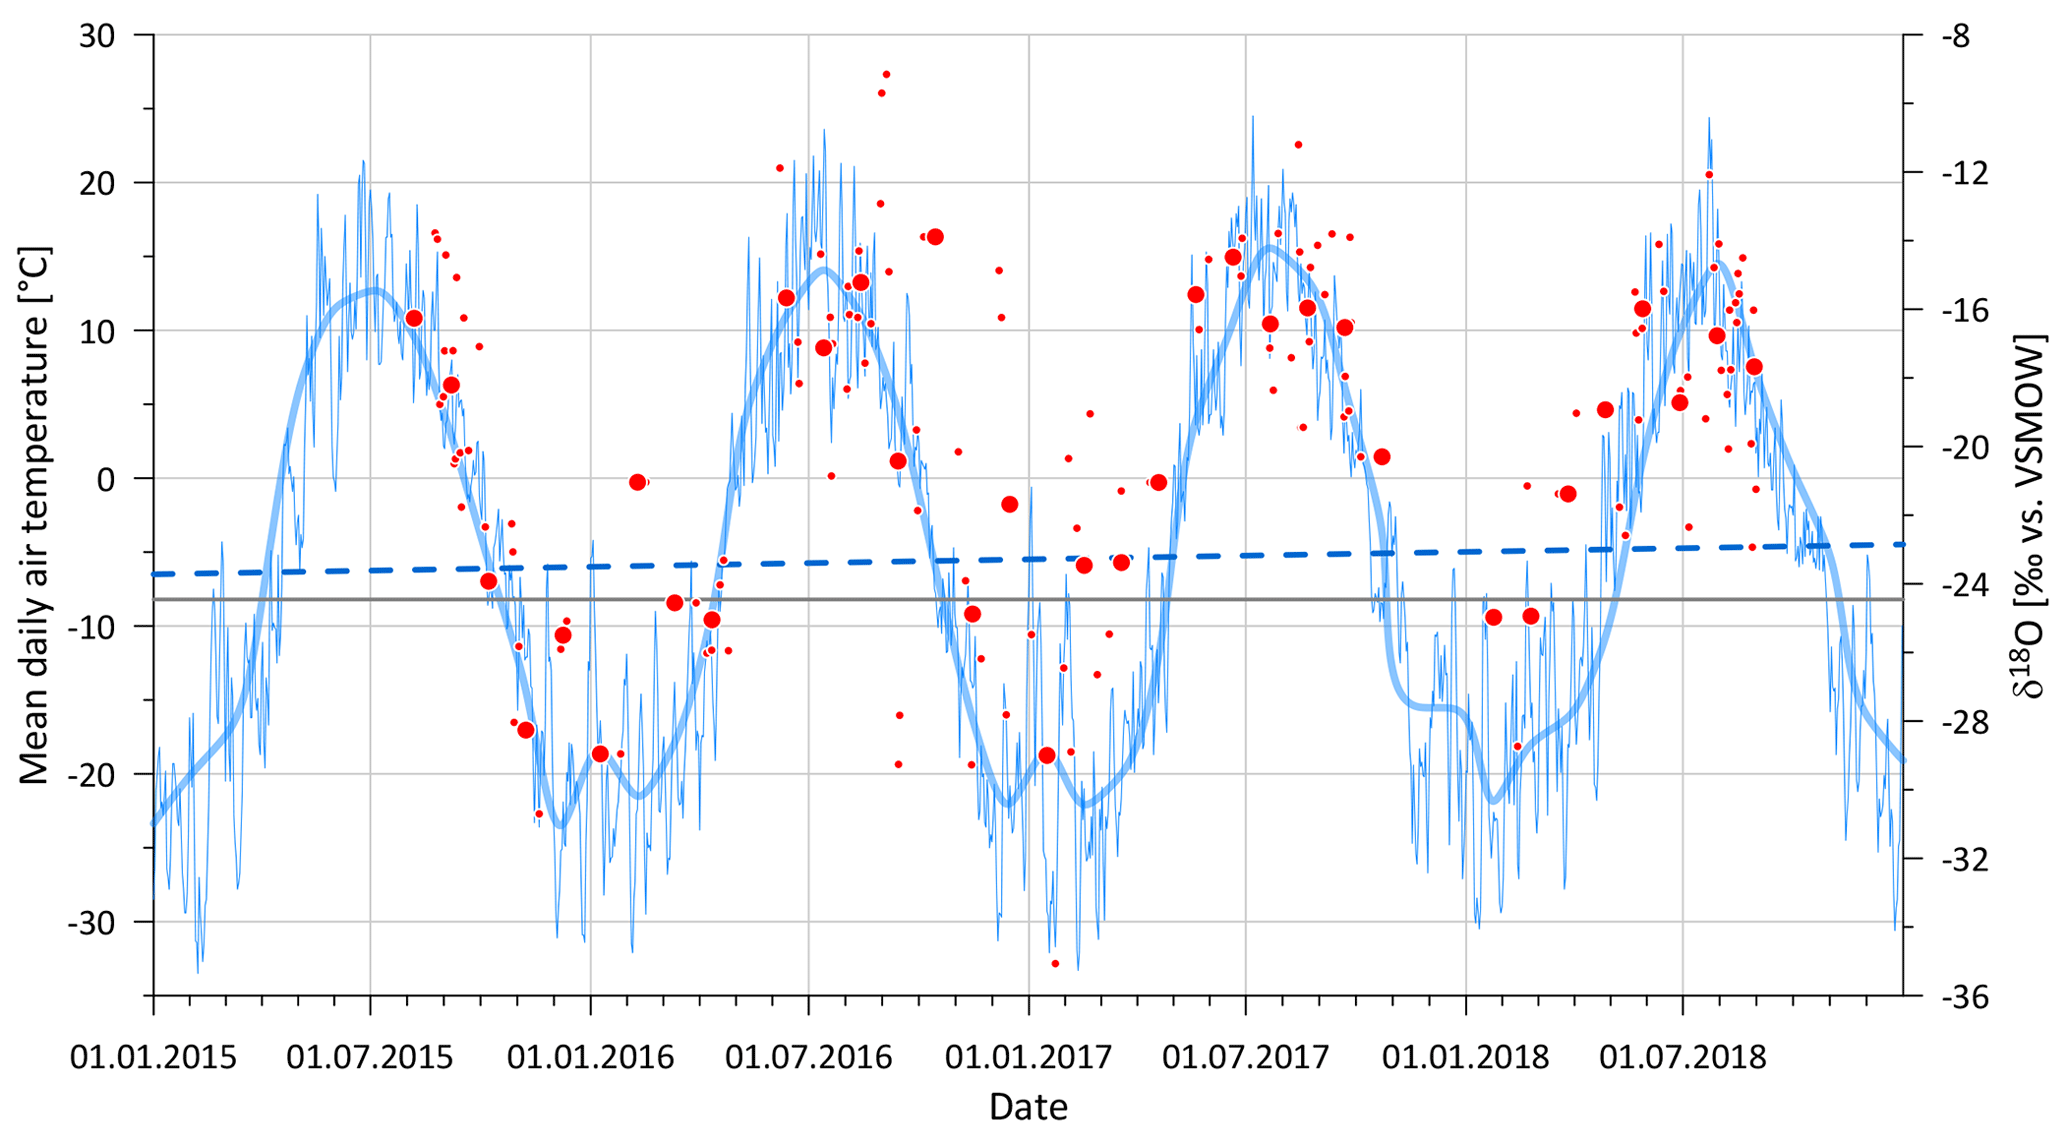
Figure 2Air temperatures from Inuvik (NT, Canada) together with δ18O values in precipitation during the sampling period from August 2015 to August 2018. Thin blue line shows mean daily air temperatures and the thick blue line shows monthly averages. Small red dots show all δ18O data points. Large red dots show δ18O monthly averages. Grey line illustrates long-term average of air temperatures (1981–2010). Blue dashed line illustrates air temperature trend from 2015 to 2018.
Table 2Basic statistics of stable water isotope data based on monthly means.

The GNIP data (IAEA/WMO, 2020) provide monthly means of stable isotopes in precipitation. In order to keep comparability, we also present monthly means of the Inuvik LMWL, although the entire database is freely available at PANGAEA (Fritz et al., 2021).
Original data are available on PANGAEA under https://doi.org/10.1594/PANGAEA.935027 (Fritz et al., 2021).
5.1 Climate and stable isotope data during the observation period
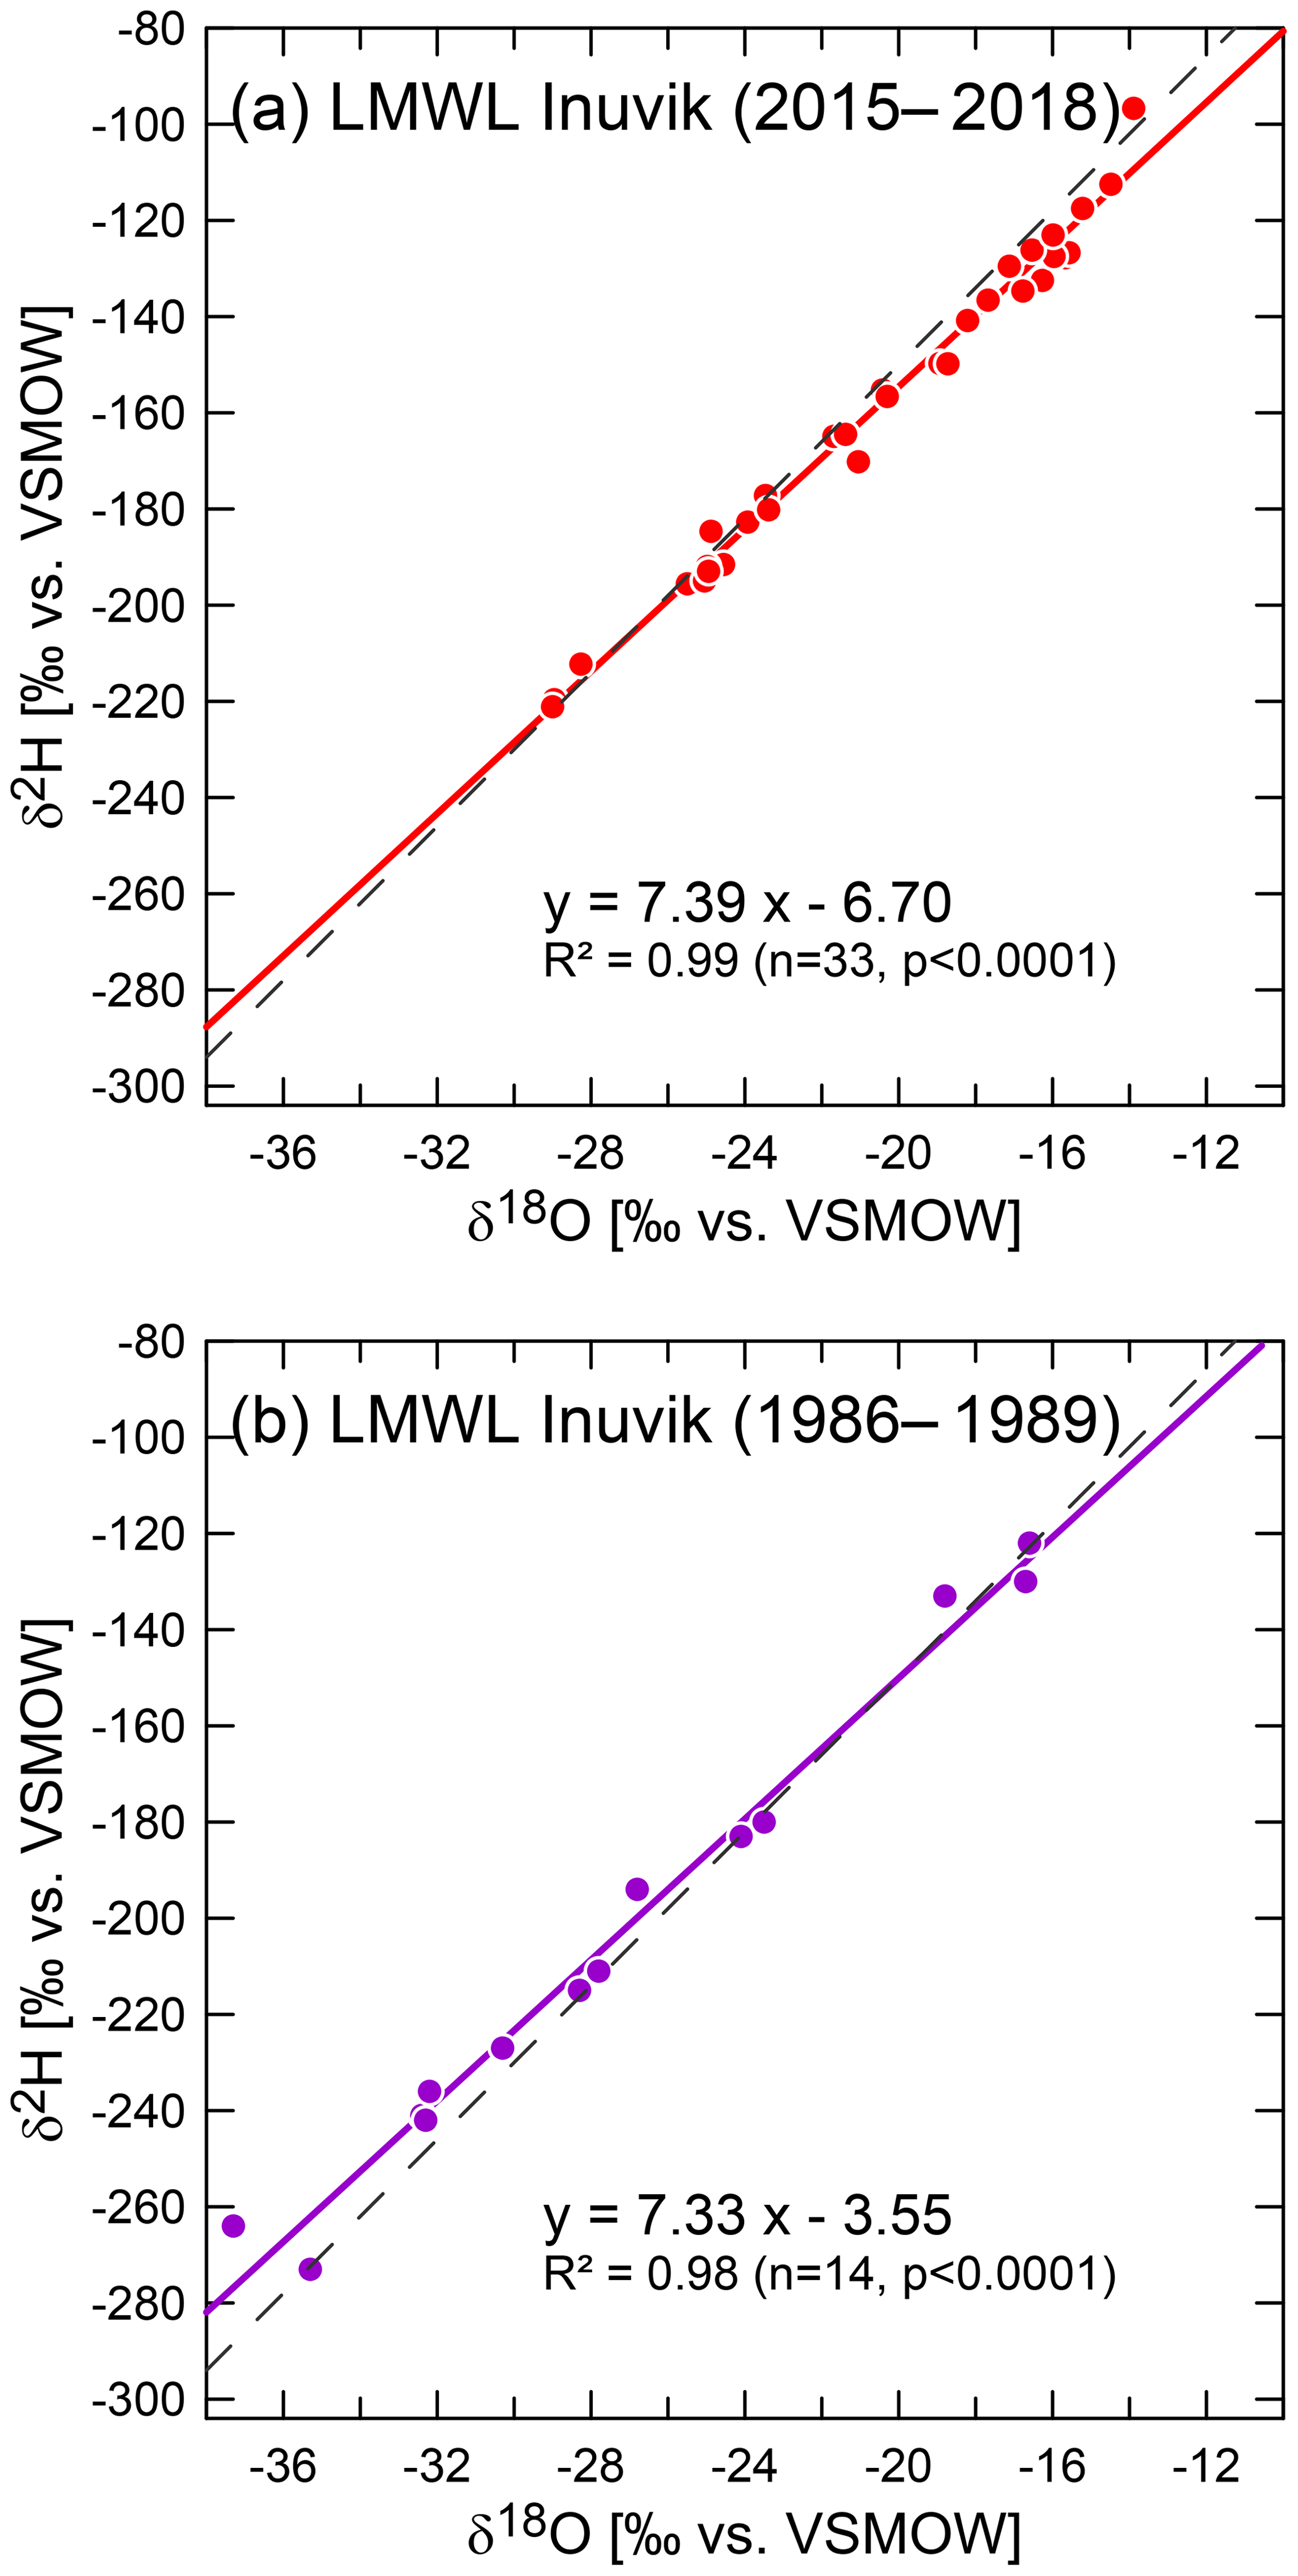
Figure 3Co-isotope plots of δ18O and δ2H of precipitation for Inuvik (NT, Canada). (a) New (n= 34, 2015–2018) local meteoric water line. (b) Old (n= 14, 1986–1989) local meteoric water line. Dashed line represents the global meteoric water line.
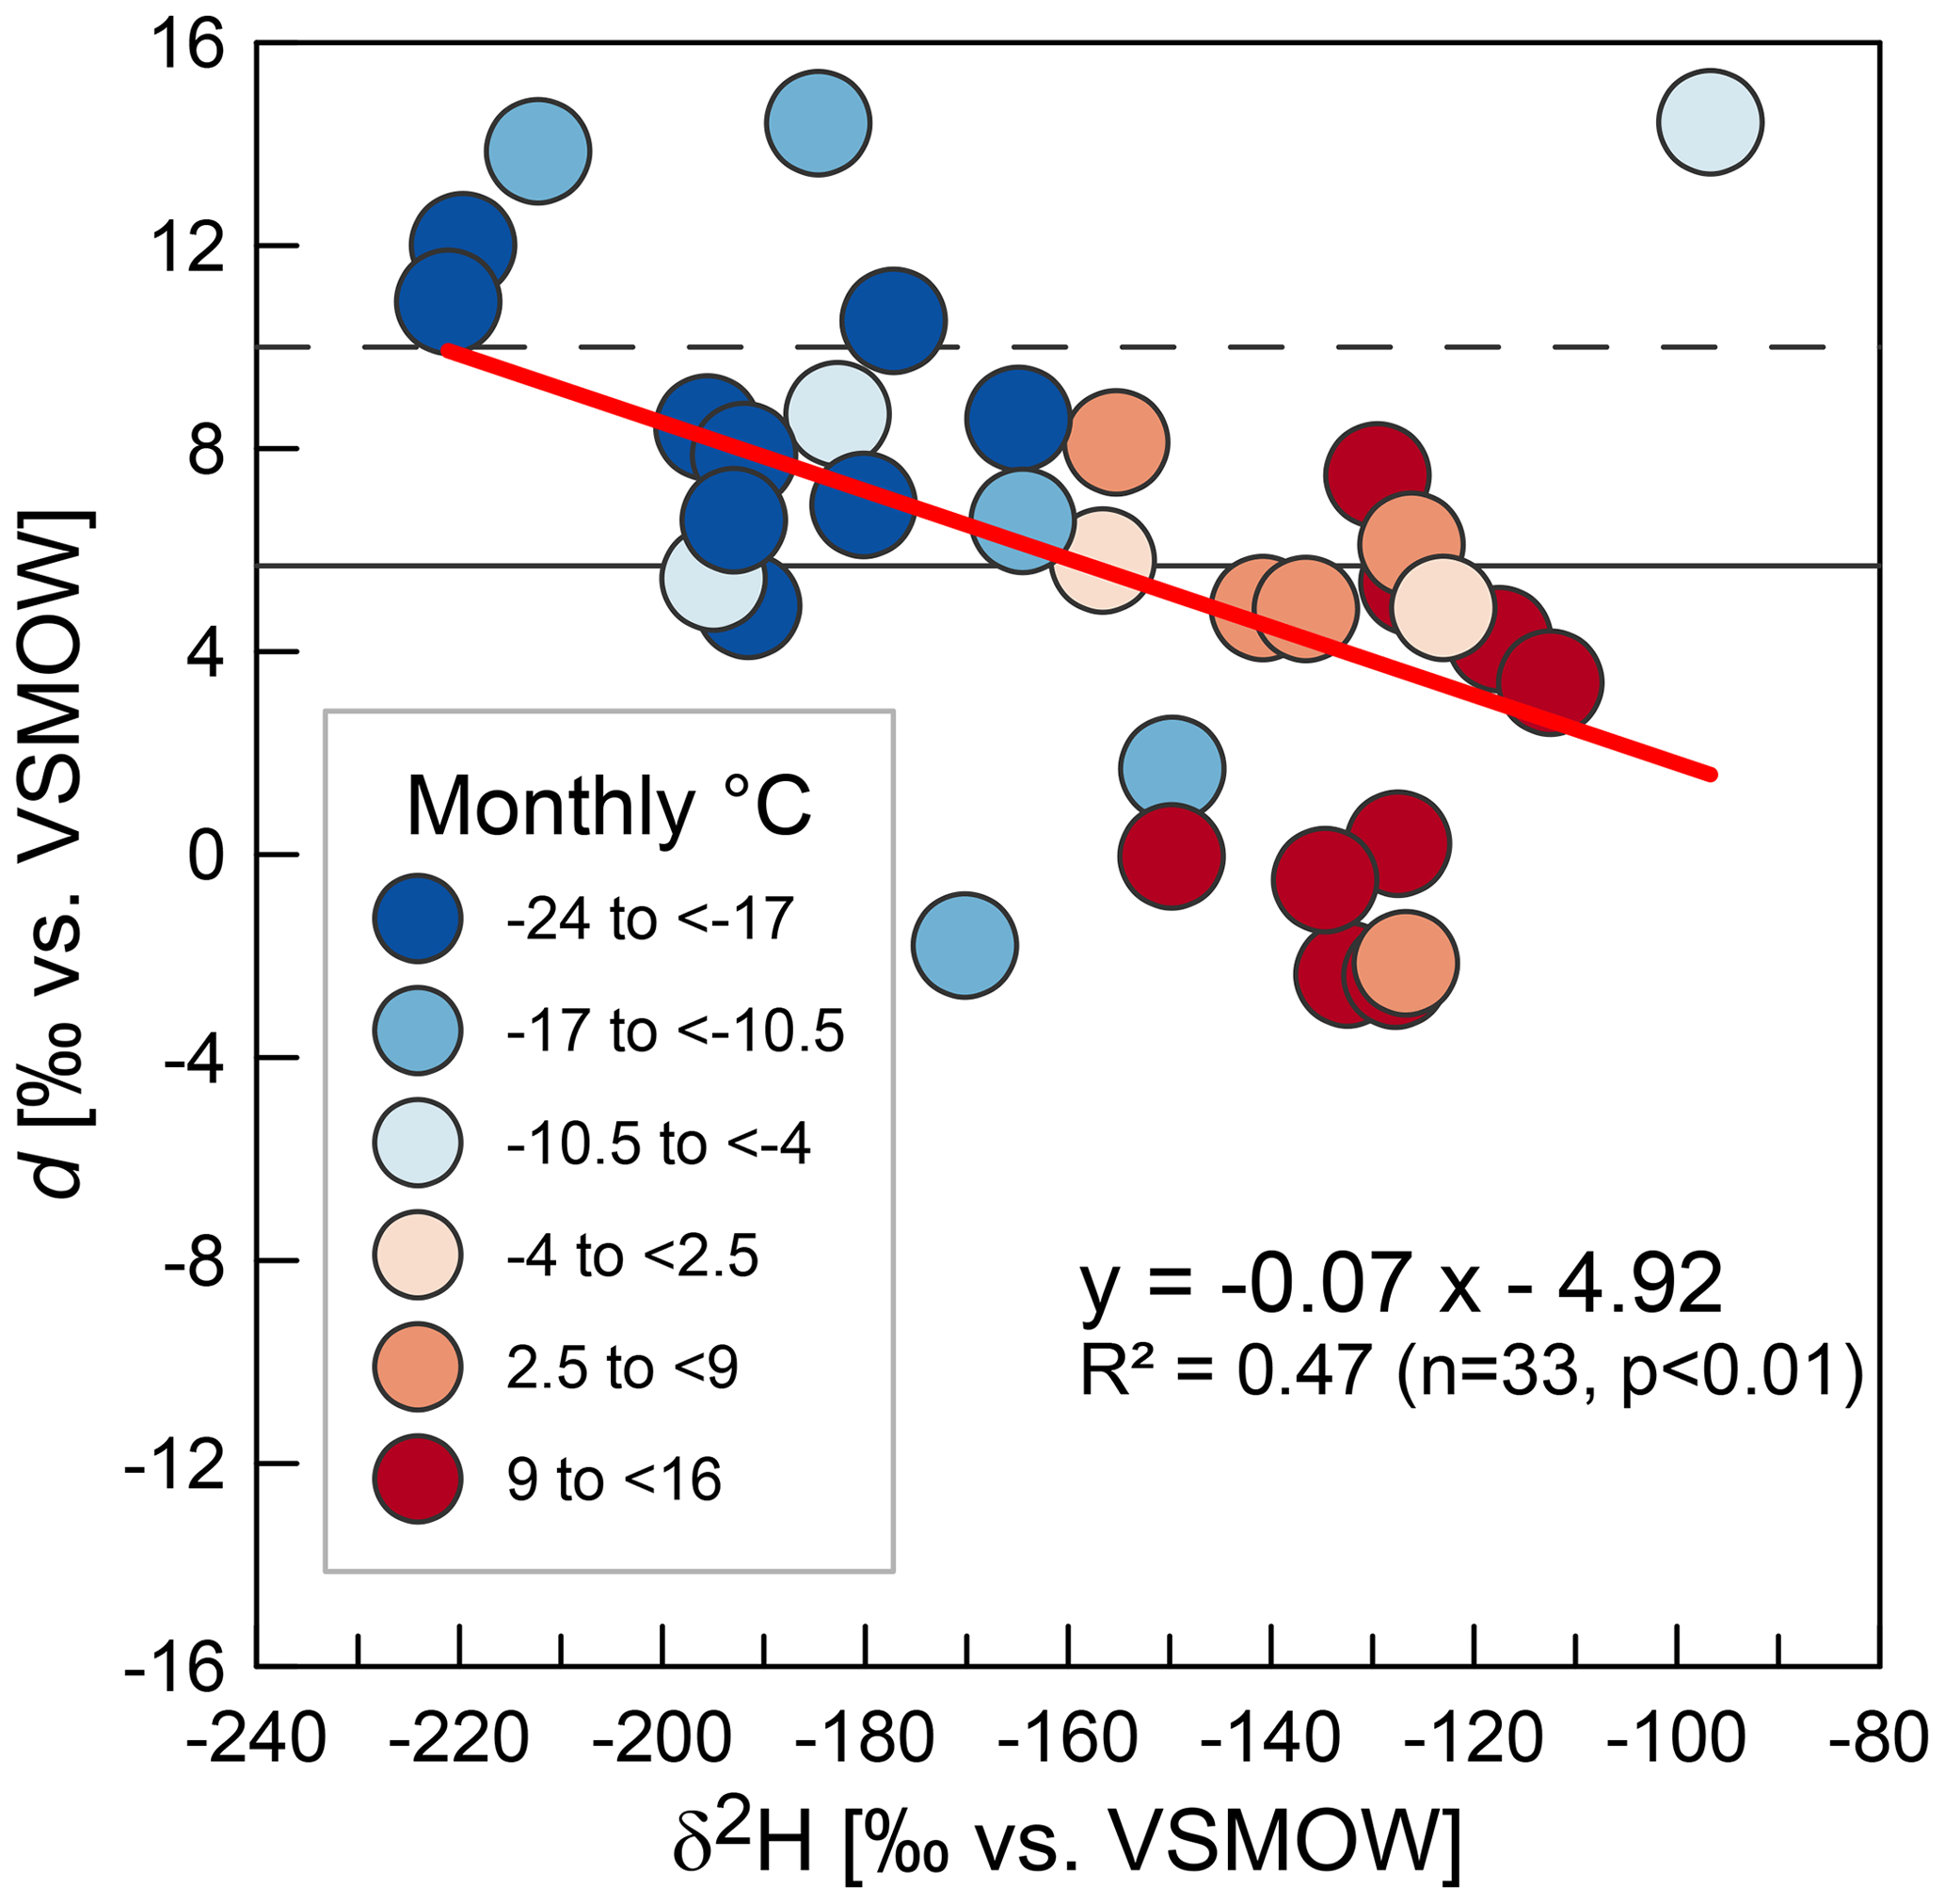
Figure 4Relationship between hydrogen isotope ratios (δ2H) and deuterium excess d (monthly means). The solid horizontal line indicates mean d from Inuvik (this study), whereas the dashed line indicates global average d. Bubble colour indicates air temperature ranges (monthly mean) at the time of sampling. Red line represents the linear trend.
The meteorological monitoring data for the observation period are available from the WMO station (number: 719570) in Inuvik (Environment and Climate Change Canada, 2021a; Fig. 2). The long-term average annual air temperature is −8.2 ∘C, and the annual air temperature amplitude amounts to 41 ∘C with coldest mean temperatures in January and warmest mean temperatures in July (1981–2010; Environment and Climate Change Canada, 2021b). The mean annual precipitation sums up to 241 mm and snow depth reaches up to 159 cm. During the observation period, the average annual air temperature was −5.5 ∘C with an increasing trend towards today (Fig. 2). The maximum temperature amplitude between 2015 and 2018 was 58 ∘C. The stable isotope composition of meteoric water expressed as monthly means varies over about 15 ‰ between −29.0 ‰ and −13.9 ‰ in δ18O (mean of −20.5 ‰) and over about 124 ‰ between −221 ‰ and −97 ‰ in δ2H (mean of −158 ‰). Deuterium excess ranges from −2.4 ‰ to 14.4 ‰ (mean of 5.7 ‰ , Table 2). The seasonal pattern in air temperatures is largely delineated by the stable isotope composition of precipitation with lower δ18O and δ2H values representing lower air temperatures (Fig. 2).
5.2 The new local meteoric water line from Inuvik
The LMWL representing Inuvik precipitation between August 2015 and August 2018 is shown in Fig. 3a in comparison to the previous LMWL covering 1986 to 1989 (Fig. 3b). Further LMWLs from the western Arctic that are from Utqiaġvik (Barrow), Mayo and Cambridge Bay are summarized in Table 3. The slope of the new Inuvik LMWL is 7.39 and the intercept is −6.70. In comparison, the previous Inuvik LMWL shows values of 7.33 for the slope and −3.55 for the intercept (Fig. 3) underlining the long-term local singularity of stable isotope composition in meteoric water. The relationship between δ2H and d in the Inuvik precipitation isotopic composition is expressed by Eq. (3):
with a moderate correlation of R2= 0.47 (Fig. 4). In general, low δ2H values, which are largely explained by low air temperatures, are associated with higher d values (e.g. Porter et al., 2016). The mean annual d for Inuvik is 5.7 ‰ compared to the global average of 10 ‰. The greatest difference between the new Inuvik LMWL and the previous Inuvik LMWL is associated with d values. The data set from between 1986 and 1989 contains only positive d values that range between 3.6 and 34.4, with a mean of 14.9. In contrast, our d data from between 2015 and 2018 contain a considerable number of negative values (Fig. 4), and they have a smaller range and a much lower average (Table 2). Unpaired t tests for different parameters between new and old Inuvik LMWL data sets confirm that the new and the old LMWLs from Inuvik are statistically different from each other (δ18O: t(45) = 4.23, p<.001; δ2H: t(45) = 3.80, p<.001; deuterium excess: , p<.00001; critical t value: 1.68). Other regional LMWL statistics differ distinctly from Inuvik (Table 3) emphasizing regional peculiarities.

The slight deviation of the new Inuvik LMWL slope when compared to that of the GMWL might either reflect regionally specific isotopic fractionation in equilibrium of distinct ranges in temperature and/or isotopic composition. It might further point to seasonal precipitation that is characterized by non-equilibrium processes (Putman et al., 2019). The latter might affect the new Inuvik LMWL as snow from mixed-phase cloud processes controlled by Rayleigh distillation is likely to contribute to the annual Inuvik precipitation. This is seen in high d values of cold-season precipitation (Fig. 4) and in a slope below the GMWL slope of 8 (Fig. 3). Moreover, low d values during warm-season precipitation might be indicative of a contribution of recycled moisture from continental sources (compare Bonne et al., 2020). The wide ranges over about 15 ‰ in δ18O and about 124 ‰ in δ2H of monthly means of the new Inuvik data set and the substantially greater sample size if compared to the old Inuvik LMWL enable a well-defined new LMWL. Putman et al. (2019) applied data quality criteria for LMWL calculations requiring time series that include at least three samples in each 3-month meteorological season to represent seasonality, while the length of the observation period depends on the timescale of the process of interest. In this context, the new Inuvik LMWL is regarded as valid representation of the isotopic composition of regional precipitation.
MF designed the study and analysed the data. HM conceptualized the sampling device and analysed the samples at the Stable Isotope Facility at the AWI. MF and SW wrote the paper with contributions from HM and JM.
The contact author has declared that neither they nor their co-authors have any competing interests.
Publisher’s note: Copernicus Publications remains neutral with regard to jurisdictional claims in published maps and institutional affiliations.
We greatly acknowledge the support of the Western Arctic Research Centre (ARI, Inuvik) for collecting the samples. AWI staff members Hugues Lantuit, George Tanski, Jennifer Krutzke, Niklaas Schmidt, Mikaela Weiner and Günther (Molo) Stoof are thanked for technical support in the field and in the laboratory. We thank Trevor Porter, István Fórizs, and one anonymous referee for their constructive comments and suggestions.
This research has been supported by the Nunataryuk project, which is funded by the European Commission (Horizon 2020 Framework Programme, (grant no. 773421)).
This paper was edited by Attila Demény and reviewed by Trevor Porter, István Fórizs, and one anonymous referee.
Bonne, J.-L., Meyer, H., Behrens, M., Boike, J., Kipfstuhl, S., Rabe, B., Schmidt, T., Schönicke, L., Steen-Larsen, H. C., and Werner, M.: Moisture origin as a driver of temporal variabilities of the water vapour isotopic composition in the Lena River Delta, Siberia, Atmos. Chem. Phys., 20, 10493–10511, https://doi.org/10.5194/acp-20-10493-2020, 2020.
Coulombe, S., Fortier, D., Lacelle, D., Kanevskiy, M., and Shur, Y.: Origin, burial and preservation of late Pleistocene-age glacier ice in Arctic permafrost (Bylot Island, NU, Canada), The Cryosphere, 13, 97–111, https://doi.org/10.5194/tc-13-97-2019, 2019.
Clark, I.: Environmental Isotopes in Hydrogeology, Boca Raton, Florida, CRC Press, ISBN 978-1-4822-4291-1, 2013.
Craig, H.: Isotopic variations in meteoric waters, Science, 133, 1702–1703, https://doi.org/10.1126/science.133.3465.1702, 1961.
Dansgaard, W.: Stable isotopes in precipitation, Tellus, 16, 436–468, https://doi.org/10.3402/tellusa.v16i4.8993, 1964.
Environment and Climate Change Canada, Historical data [data set], available at: https://climate.weather.gc.ca/historical_data/search_historic_data_e.html (last access: 4 August 2021), 2021a.
Environment and Climate Change Canada, Climate normal and averages [data set], available at: https://climate.weather.gc.ca/climate_normals/results_1981_2010_e.html?stnID=1669&autofwd=1#station-metadata (last access: 4 August 2021), 2021b.
Fritz, M., Wetterich, S., Meyer, H., Schirrmeister, L., Lantuit, H., and Pollard, W. H.: Origin and characteristics of massive ground ice on Herschel Island (western Canadian Arctic) as revealed by stable water isotope and hydrochemical signatures, Permafrost Periglac., 22, 26–38, https://doi.org/10.1002/ppp.714, 2011.
Fritz, M., Wetterich, S., Schirrmeister, L., Meyer, H., Lantuit, H., Preusser, F., and Pollard, W. H.: Eastern Beringia and beyond: late Wisconsinan and Holocene landscape dynamics along the Yukon Coastal Plain, Canada, Palaeogeogr. Palaeocl., 319–320, 28–45, https://doi.org/10.1016/j.palaeo.2011.12.015, 2012.
Fritz, M., Wetterich, S., McAlister, J., and Meyer, H.: Stable oxygen (δ18O) and hydrogen (δD) isotopes in precipitation from Inuvik in the western Canadian Arctic (2015–2018), PANGAEA [data set], https://doi.org/10.1594/PANGAEA.935027, 2021.
Gat, J. R.: Oxygen and hydrogen isotopes in the hydrologic cycle, Annu. Rev. Earth Pl. Sc., 24, 225–262, https://doi.org/10.1146/annurev.earth.24.1.225, 1996.
Holland, K. M., Porter, T. J., Froese, D. G., Kokelj, S. V., and Buchanan, C. A.: Ice-wedge evidence of Holocene winter warming in the Canadian Arctic, Geophys. Res. Lett., 47, e2020GL087942, https://doi.org/10.1029/2020gl087942, 2020.
IAEA/WMO: Global Network of Isotopes in Precipitation, The GNIP Database [data set], available at: https://nucleus.iaea.org/wiser (last access: 4 July 2021), 2020.
Jouzel, J., Vimeux, F., Caillon, N., Delaygue, G., Hoffmann, G., Masson-Delmotte, V., and Parrenin, F.: Magnitude of isotope/temperature scaling for interpretation of central Antarctic ice cores, J. Geophys. Res.-Atmos., 108, 4361, https://doi.org/10.1029/2002JD002677, 2003.
Kokelj, S. V., Tunnicliffe, J., Lacelle, D., Lantz, T. C., Chin, K. S., and Fraser, R.: Increased precipitation drives mega slump development and destabilization of ice-rich permafrost terrain, northwestern Canada, Global Planet. Change, 129, 56–68, https://doi.org/10.1016/j.gloplacha.2015.02.008, 2015.
Lacelle, D., Lauriol, B., Clark, I. D., Cardyn, R., and Zdanowicz, C.: Nature and origin of a Pleistocene-age massive ground-ice body exposed in the Chapman Lake moraine complex, central Yukon Territory, Canada, Quaternary Res., 68, 249–260, https://doi.org/10.1016/j.yqres.2007.05.002, 2007.
Merlivat, L. and Jouzel, J.: Global climatic interpretation of the deuterium-oxygen 18 relationship for precipitation, J. Geophys. Res., 84, 5029, https://doi.org/10.1029/jc084ic08p05029, 1979.
Meyer, H., Schönicke, L., Wand, U., Hubberten, H. W., and Friedrichsen, H.: Isotope studies of hydrogen and oxygen in ground ice – Experiences with the equilibration technique, Isot. Environ. Health S., 36, 133–149, https://doi.org/10.1080/10256010008032939, 2000.
Meyer, H., Schirrmeister, L., Yoshikawa, K., Opel, T., Wetterich, S., Hubberten, H.-W., and Brown, J.: Permafrost evidence for severe winter cooling during the Younger Dryas in northern Alaska, Geophys. Res. Lett., 37, L03501, https://doi.org/10.1029/2009gl041013, 2010.
Meyer, H., Opel, T., Laepple, T., Dereviagin, A. Y., Hoffmann, K., and Werner, M.: Long-term winter warming trend in the Siberian Arctic during the mid- to late Holocene, Nat. Geosci., 8, 122–125, https://doi.org/10.1038/ngeo2349, 2015.
Opel, T., Meyer, H., Wetterich, S., Laepple, T., Dereviagin, A., and Murton, J.: Ice wedges as archives of winter paleoclimate: A review, Permafrost Periglac., 29, 199–209, https://doi.org/10.1002/ppp.1980, 2018.
Porter, T. J. and Opel, T.: Recent advances in paleoclimatological studies of Arctic wedge- and pore-ice stable-water isotope records, Permafrost Periglac., 31, 429–441, https://doi.org/10.1002/ppp.2052, 2020.
Porter, T. J., Froese, D. G., Feakins, S. J., Bindeman, I. N., Mahony, M. E., Pautler, B. G., Reichart, G.-J., Sanborn, P. T., Simpson, M. J., and Weijers, J. W. H.: Multiple water isotope proxy reconstruction of extremely low last glacial temperatures in Eastern Beringia (Western Arctic), Quaternary Sci. Rev., 137, 113–125, https://doi.org/10.1016/j.quascirev.2016.02.006, 2016.
Porter, T. J., Schoenemann, S. W., Davies, L. J., Steig, E. J., Bandara, S., and Froese, D. G.: Recent summer warming in northwestern Canada exceeds the Holocene thermal maximum, Nat. Commun., 10, 1631, https://doi.org/10.1038/s41467-019-09622-y, 2019.
Putman, A. L., Fiorella, R. P., Bowen, G. J., and Cai, Z.: A global perspective on local meteoric water lines: Meta-analytic insight into fundamental controls and practical constraints, Water Resour. Res., 55, 6896–6910, https://doi.org/10.1029/2019WR025181, 2019.
Rozanski, K., Araguas-Araguas, L., and Gonfiantini, R.: Isotopic patterns in modern global precipitation, in: Climate change in continental isotopic record, edited by: Swart, P. K., Lohwan, K. L., McKenzie, J. A., and Savin, S., Geophys. Monog. Ser., Washington, DC, 78, 1–37, https://doi.org/10.1029/GM078p0001, 1993.
Spangenberg, J. E.: Caution on the storage of waters and aqueous solutions in plastic containers for hydrogen and oxygen stable isotope analysis, Rapid Communications in Mass Spectrometry, 26, 2627–2636, https://doi.org/10.1002/rcm.6386, 2012.
St-Jean, M., Lauriol, B., Clark, I. D., Lacelle, D., and Zdanowicz, C.: Investigation of ice-wedge infilling processes using stable oxygen and hydrogen isotopes, crystallography and occluded gases (O2, N2, Ar), Permafrost Periglac., 22, 49–64, https://doi.org/10.1002/ppp.680, 2011.
Utting, N., Clark, I., Lauriol, B., Wieser, M., and Aeschbach-Hertig, W.: Origin and Flow Dynamics of Perennial Groundwater in Continuous Permafrost Terrain using Isotopes and Noble Gases: Case Study of the Fishing Branch River, Northern Yukon, Canada, Permafrost Periglac., 23, 91–106, https://doi.org/10.1002/ppp.1732, 2012.
Utting, N., Lauriol, B., Mochnacz, N., Aeschbach-Hertig, W., and Clark, I.: Noble gas and isotope geochemistry in western Canadian Arctic watersheds: tracing groundwater recharge in permafrost terrain, Hydrogeol. J., 21, 79–91, https://doi.org/10.1007/s10040-012-0913-8, 2013.
Werner, M., Haese, B., Xu, X., Zhang, X., Butzin, M., and Lohmann, G.: Glacial–interglacial changes in H218O, HDO and deuterium excess – results from the fully coupled ECHAM5/MPI-OM Earth system model, Geosci. Model Dev., 9, 647–670, https://doi.org/10.5194/gmd-9-647-2016, 2016.
Wetterich, S., Meyer, H., Fritz, M., Mollenhauer, G., Rethemeyer, J., Kizyakov, A., Schirrmeister, L., and Opel, T.: Northeast Siberian permafrost ice-wedge stable isotopes depict pronounced Last Glacial Maximum winter cooling, Geophys. Res. Lett., 48, e2020GL092087, https://doi.org/10.1029/2020GL092087, 2021.