the Creative Commons Attribution 4.0 License.
the Creative Commons Attribution 4.0 License.
 | 23 Nov 2022
Historical nitrogen fertilizer use in China from 1952 to 2018
Jing Liu
Giri Kattel
China ranks in the highest position for nitrogen (N) fertilizer consumption in the world. Although N fertilizer use has greatly contributed to the China's food production, this has also caused an unprecedented alteration in the biogeochemical cycles and endangered terrestrial and aquatic ecosystems. Existing use of N fertilizers in China, as shown by digital maps, is usually coarse in resolution and intermittently covered with a biased gridded dataset. Here, we have reconstructed a historical, annual N fertilizer use dataset in China and resampled it to 5 km×5 km resolution, covering the period from 1952 to 2018 by integrating improved cropland maps. Results showed that most of the N input was directly applied as N-only fertilizer, while the contribution from compound fertilizers has ranged between 16 % and 24 % since 1980. The national total N fertilizer input increased from 0.06 Tg N yr−1 (0.05 g N m−2 yr−1) in 1952 to 31.15 Tg N yr−1 (18.83 g N m−2 yr−1) in 2014 and then decreased to 28.31 Tg N yr−1 (17.06 g N m−2 yr−1) in 2018. Despite the total N input decreasing by 9.1 % (2.84 Tg N yr−1) from 2014 to 2018, the N input from compound fertilizers has increased by 6 % (0.43 Tg N yr−1) during the corresponding period. The previous Food and Agriculture Organization (FAO) data-based N fertilizer products in China overestimated N use in low cropland coverage areas but underestimated N use in high cropland coverage areas. However, our newly reconstructed data have not only corrected the existing biases and improved the spatial distribution but have also shown that vegetable and other crops (e.g., orchards), but not grain crops, are the most intensively fertilized crops in China, implying the importance of quantifying greenhouse gas (GHG) emissions from these croplands. We argue that the reconstructed, spatially explicit N fertilizer use data in this study are expected to contribute to better understanding of biogeochemical cycles, including the simulations of GHG emissions and food production in China. The spatially explicit N fertilizer use and the crop-specific N fertilizer use datasets are available via an open data repository (https://doi.org/10.6084/m9.figshare.21371469.v1; Yu, 2022).
- Article
(11337 KB) - Full-text XML
-
Supplement
(2457 KB) - BibTeX
- EndNote


The birth of the Haber–Bosch technique has converted an enormous amount of unreactive nitrogen (N) to reactive forms, greatly alleviating N limitation in the agricultural production (Galloway et al., 2004; Sutton and Bleeker, 2013; Erisman et al., 2008; Lu and Tian, 2017). However, the excessive N fertilizer use in crops has become a global issue, as this has caused an unprecedented alteration of terrestrial and aquatic ecosystems. Since the introduction of synthetic N fertilizers in China in the early 1910s, its use has markedly increased, along with population growth and agricultural intensification. Today, China ranks highest in producing and using the reactive N for food and fiber production (Naughton, 2006; FAOSTAT database, 2018). About 30 % of global N fertilizers were applied in China's cropland in 2017 alone, which accounted for about 9 % of the global cropland areas (FAOSTAT database, 2018; Yu et al., 2021). Despite such a high intensity of N fertilizer use, the crop yields in China were lower compared to the global average (Wang et al., 2020b; FAOSTAT database, 2018). A former study reported an increase in N fertilizer use by over 2.7-fold from 1977 to 2005, while the marginal contribution of N fertilizers to food production was declining, e.g., the large increment of N fertilizer use helped enhance grain yields by only 98 % (Ju et al., 2009). Both field-based and modeling studies evidenced the widespread overuse of N fertilizers in China, and it has been advocated that reducing N fertilizer use would not be adversely affecting the crop production (Zhu and Chen, 2002; Ju et al., 2009; Tian et al., 2012; Huang et al., 2008). Reduced N fertilizer use has implications for minimal food production costs and higher environmental benefits, including the reduced waterborne pollution and greenhouse gas (GHG) emissions (Kahrl et al., 2010).
One of the direct benefits of reducing N fertilizer use in cropland has been reported as the reduction in the N2O emission – a GHG with global warming potential as high as 298 times greater than that of CO2 over a 100-year time horizon (Myhre et al., 2013). China is currently the largest N2O emitter worldwide, for which agriculture alone has contributed 64 % (Shang et al., 2019; Zhou et al., 2014), implying the potential of N2O emission reduction via the optimization of N fertilizer use in cropland (Tian et al., 2012). Moreover, reduced N fertilizer use in cropland also helps alleviate soil acidification and eutrophication, further benefitting the terrestrial and aquatic environments (Strokal et al., 2016). A better understanding of the spatiotemporal distribution of N fertilizer use in China's cropland will help locate the hot spot of N surplus and eventually contribute to its management, including its efficient use and optimization. However, N fertilizer use in China has greatly varied spatially and temporally, with disparity in the dataset in capturing historical N fertilizer use. Most existing spatiotemporal datasets depicting N fertilizer use in the croplands of China are irregular and relatively coarse. For example, N fertilizer use datasets are available in both international and national archives. The International Fertilizer Association (IFA) and the Food and Agricultural Organization (FAO) have archived the amount of annual N fertilizer consumption at a national level since 1961, while the National Statistical Bureau of China has archived the amount of annual N fertilizer use at both national and provincial levels since 1987. Some attempts were made to spatialize the national-level N fertilizer use, but the products were still relatively low in spatial resolution (e.g., 0.5∘ for Lu and Tian, 2017). Many process-based modeling studies simulated the impacts of N fertilizer use on biogeochemical cycles in China using the low-resolution N fertilizer dataset, which greatly impaired the reliability of the estimations (Tian et al., 2012; Wang et al., 2020a). There is an urgent need for a long-term, spatially explicit N fertilizer dataset to serve the quantification of national and global GHG budgets and to benefit data analyses and the environment protection, including reduced water pollution and improved land-based ecosystem functions.
In this study, we have reconstructed the annual N fertilizer use in China's cropland using various statistical records, reports, and gridded images at 5 km×5 km resolution, covering the period from 1952 to 2018. We aimed to (1) develop a continuous dataset depicting the N fertilizer use in cropland in China and (2) examine the historical distributions and shifts in N fertilizer use cropland in China. Our focus is on the chemical, rather than organic, N fertilizer use, and the term “N fertilizers” we have adopted here is to refer exclusively to synthetic N fertilizers.
2.1 Reconstruction of the national and provincial N fertilizer use
This study focuses on N fertilizer use in the mainland China, while Taiwan, Hong Kong, and Macau were excluded due to no data availability. The dataset we have adopted here for synthetic N fertilizer use in the cropland of China was from N-only fertilizers and N-mixed fertilizers (or compound fertilizers; see Eq. 1).
where Ntot indicates the total N use in China's cropland, Nonly indicates the N fertilizer use from N-only fertilizers, and Nmix indicates N-mixed fertilizer use. We have adopted two different phrases and units to differentiate the N fertilizer use at national level, i.e., N fertilizer input (Tg N yr−1), and crop field level, i.e., N fertilizer use rate (g N per unit of land per year).
We first reconstructed the total N fertilizer input in China's cropland at a national level. The national fertilizer inputs were provided by both the FAO (https://www.fao.org/faostat, last access: 1 July 2022) and the National Bureau of Statistics of China (Chinese Statistical Yearbook – CSY, also available from https://data.stats.gov.cn, last access: 1 July 2022). Specifically, the FAO data provide the total N input in China from 1960 to 2018. While, in comparison, the CSY data describe total fertilizer use (including N, phosphate, and potassium fertilizers such as ammonium phosphate) covering the period from 1952 to 2018, and the N-only fertilizers (e.g., ammonia, ammonium nitrate) from 1987 to 2018. The national total N fertilizer input of the period 1960 to 2018 was directly obtained from the FAO, while the ratio of N fertilizers to the total fertilizers was used to derive the total N fertilizer use from 1952 to 1959.
Second, we compiled the N fertilizer used in each province in China. For the period 1987–2018, N fertilizer use was directly derived from the CSY database. For the period 1952 to 1986, when the provincial data were unavailable, the reconstructed national N fertilizer use was allocated to each province based on the provincial N proportions derived in 1987.
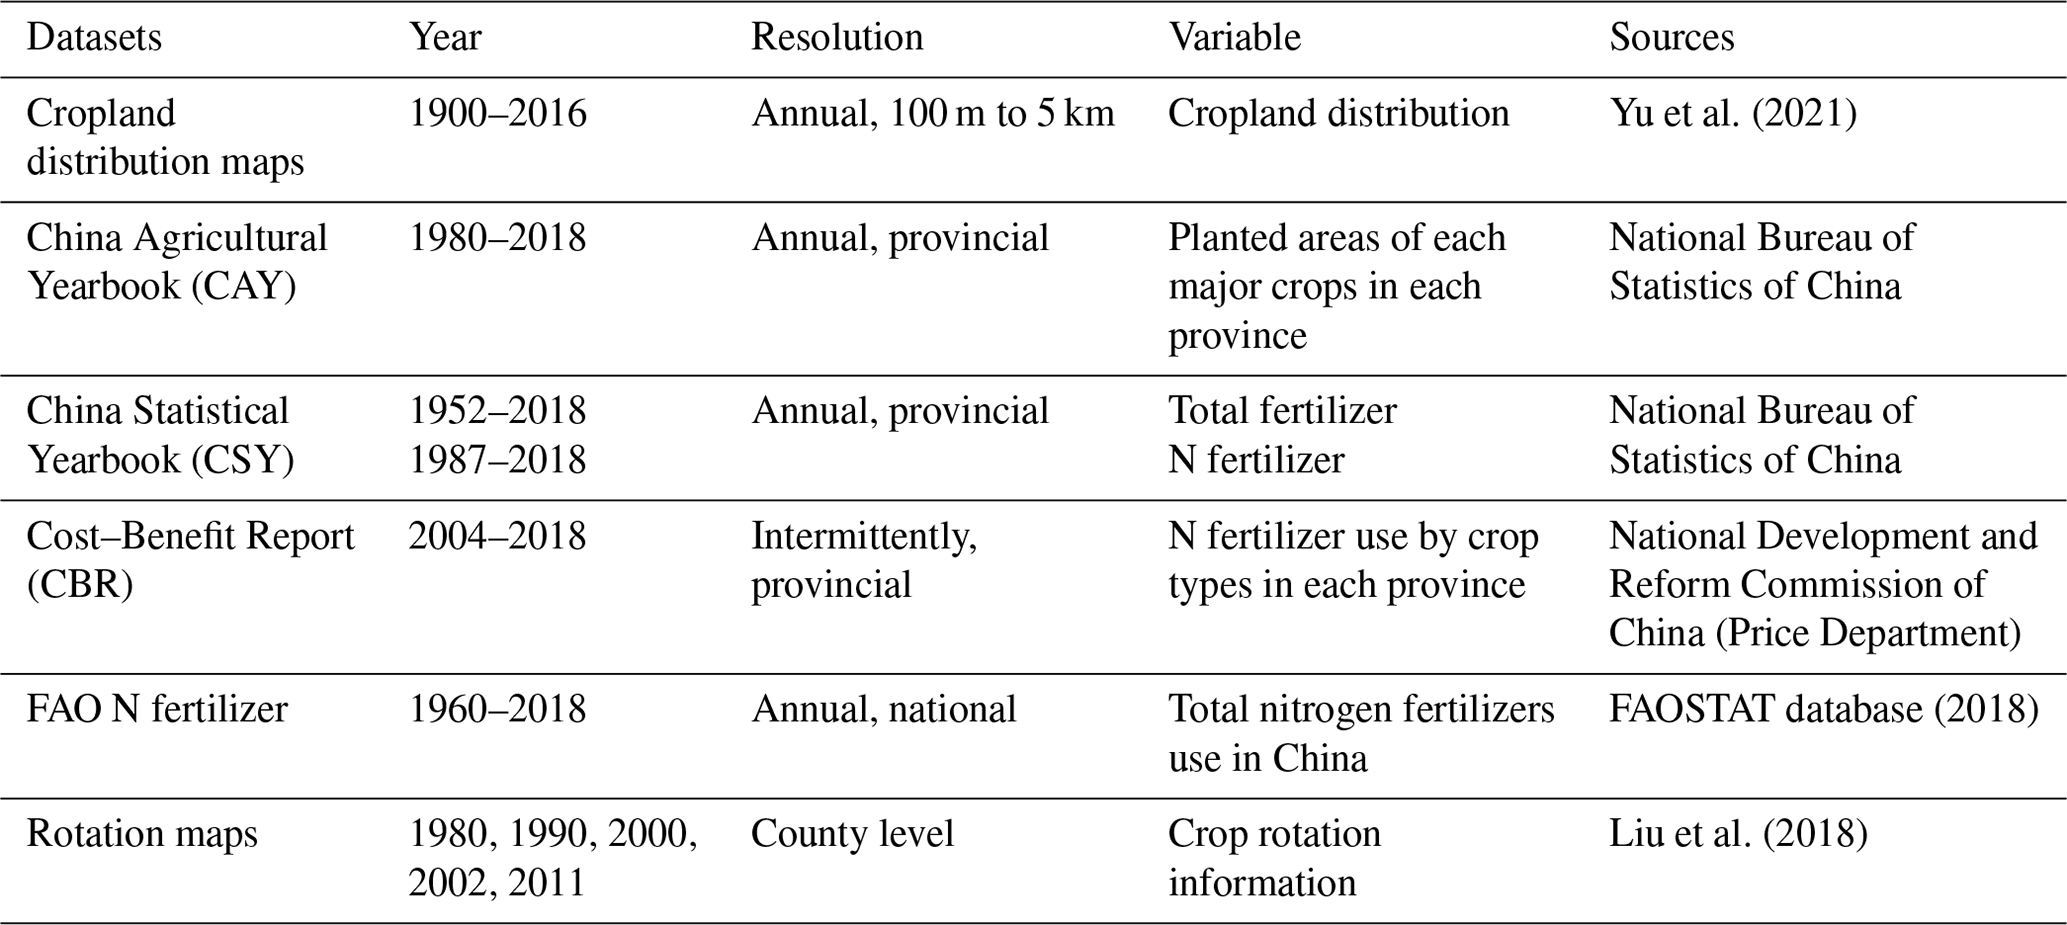
Table 1Datasets used for nitrogen (N) fertilizer use reconstruction.
2.2 Reconstruction of the crop-specific N fertilizer use rate in each province
We examined the major crops planted in China and grouped them into 10 types, including early rice, mid-season rice, late rice, wheat, corn, soybean, oil seeds, cotton, vegetable, and other crops. Specifically, other crops include barley, sorghum, sugarcane, tobacco, and fruits (e.g., apples, pears, and citrus). The N fertilizer use rate for each major crop type (except other crops) was intermittently reported in the Cost–Benefit Report of the National Agricultural Products (CBR) covering the period 2004–2018 (Table 1; CBR data can be obtained from https://data.cnki.net/trade/Yearbook/Single/N2021120200?zcode=Z009, last access: 29 September 2022). The CBR data provide officially released fertilizer use information summarized from thousands of samples collected in each province in China. First, we created an empty table to record the N fertilizer use rate for each province with all 10 types included. Second, the N use rate of the table was allocated using data obtained from CBR when available. Third, if a crop type was never planted in the province, the N use rate was set to 0. Fourth, we checked and gap-filled the missing N fertilizer use rates in the province. For a crop type with the N use rate intermittently reported, we linearly interpolated the rate using the two nearest data reported before and after the year (see Eq. 2). While, for crop types that have been planted in the province but the N fertilizer use was never reported, two fertilizer use scenarios were considered. In the first scenario, we assumed that the N fertilizer use rate of the crop in the province was the same as the average rate at a national level (see Eq. 3). While, for the second scenario, we assumed that the N fertilizer use rate of the crop in the province was the average of the rates adopted in nearby provinces (see Eq. 4).
where Ratei indicates the N fertilizer use rate of a crop type in year i, while j and k indicate the nearest data reported in years j and k before and after the year i. Ratep,i indicates the N fertilizer use rate of a crop type in province p in year i, q indicates province q with the rate available in CBR, n indicates total number of province with N fertilizer rates available in CBR, and m indicates the total number of nearby province with N fertilizer rates available in CBR.
For the period from 1981 to 2004, the N fertilizer use rates were calculated from the N inputs and the planted areas of each crop type in each province. While, for the period from 1952 to 1980, when provincial, crop-type-specific N fertilizer use data were unavailable, we proportionally adjusted the N fertilizer use rate of each crop type based on the ratio of N fertilizer use in the year and the amount used in 1981 (see Eq. 5). This is assuming that the change in N fertilizer use rate of a crop is proportional to the change in the total N fertilizer use in the province.
where Ratep,1981 indicates the N fertilizer use rate of a crop type in province p in 1981, indicates the total N fertilizer input for province p in year i, and indicates the total N fertilizer input for province p in year 1981.
As pointed out in the Sect. 2.1, the total N input includes two components, i.e., N from compound fertilizer and N-only fertilizer. Unfortunately, the CSY database documented the use of compound fertilizer in major crop types, but the N ratio was not specified. Since the N ratio varied between 16 % and 33.33 % in compound fertilizer, according to the major fertilizer used in China (http://fgw.kaifeng.gov.cn/info/2107, last access: 1 July 2022), we assumed two extreme scenarios where the N ratio was either 16 % or 33.33 % for compound fertilizer being applied to each major crop.
Table 2The eight scenarios considered in reconstructing nitrogen (N) fertilizer use in China.
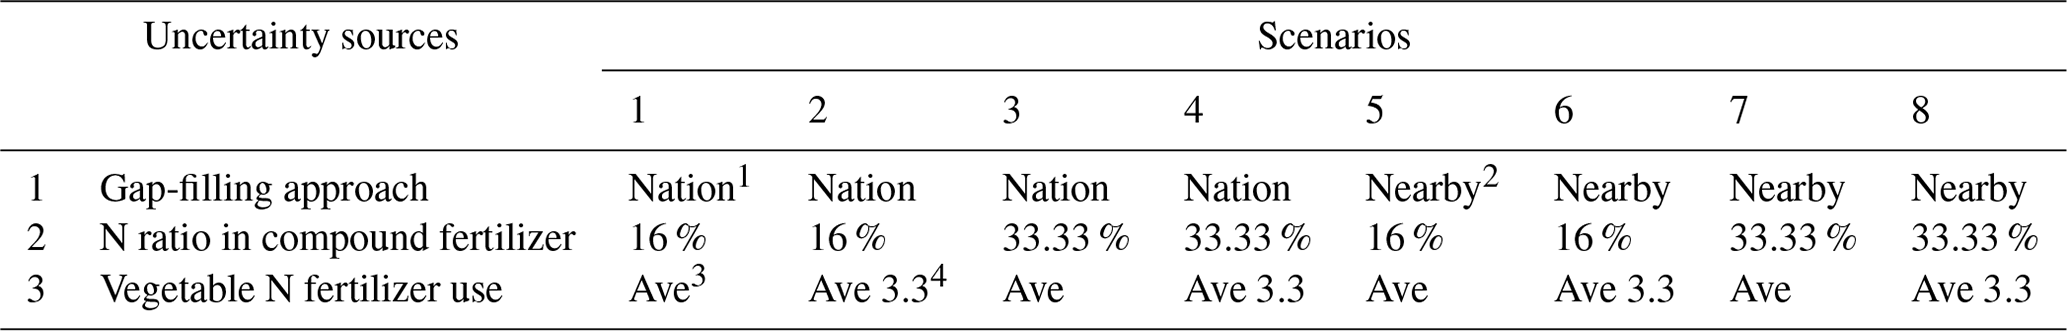
1 The N fertilizer rate of the missing crop type(s) was derived from the national average. 2 The N fertilizer rate of the missing crop type(s) was derived from the nearby province. 3 The vegetable N fertilizer use rate was assumed to be the average of other nine major crops. 4 The vegetable N fertilizer use rate was assumed to be 3.3 times that of the average rate of the other nine major crops.
In addition, N fertilizer use in vegetables was also highly uncertain. Specifically, various vegetables were planted in China, while the N fertilizer use rates were missing for the most of the vegetables. However, the vegetables received much higher N fertilizers (71.9 g N m−2) than non-vegetable crops, according to a published study (Huang et al., 2017). In general, the total fertilizer applied in vegetable was about 3.3 times higher than the recommended application rate (Huang et al., 2017). Therefore, two additional scenarios were considered in the reconstruction of the N fertilizer use in vegetables. In the first scenario, we assumed that the N fertilizer use rate in vegetables was the same as the average of all other major crop types. In the second scenario, we assumed the N fertilizer use rate in vegetables was 3.3 times of the average rate of other major crop types. Therefore, we considered three uncertainty sources in this study (Table 2).
After the gap-filling of the 9 of the 10 major crop types (except for other crops), the total N inputs were calculated by multiplying the rates and the areas of each crop type in each province. The provincial residue N inputs (the difference in the total N inputs calculated and the total N inputs derived from the FAO and the CSY) were allocated to other crops, and the N fertilizer rates were calculated by dividing the residue N inputs by the planting areas obtained from the China Agricultural Yearbook (CAY; Table 1).
where Other_Ratep,i indicates the N fertilizer use rate of other crops in province p in year i, Ntot,i indicates the total N input in year i, Rate indicates the N fertilizer use rate of crop type t in province q in year i, Area indicates the planted area of crop type t in province q in year i, and Areap,i indicates the planted area of other crops in province p in year i.
2.3 Approach for spatializing N fertilizer use
Before the N fertilizer use rate could be allocated spatially, a crop type map is required. Here we reconstructed crop rotation maps from 1952 to 2018, using the model we previously developed (Yu and Lu, 2018; Yu et al., 2019, 2022; see Fig. S1 in the Supplement for the details). The reconstruction of the annual crop rotation map can be divided into two periods, namely the periods before and after 1980. For the period of 1980–2018, county-level crop rotation maps in 1980, 1990, 2000, 2002, and 2011 were used (Table 1; Liu et al., 2018). More specifically, when allocating a crop type in a province for a year from 1980, the cropland grid cell located in a county was given priority to be assigned to the crop type identified from the nearest year rotation map. Due to the lack of data, the crop rotation map in 1980 was used for the period before 1980.

Based on the 100 m crop rotation maps developed in the previous step, we link the crop type and the N fertilizer use rate developed for each crop type in each province. Specifically, we spatialized the N fertilizer use rate for each year using the 100 m crop type maps. For grids with multiple crops cultivated in a year, the fertilizer use rate was the total N fertilizer use of all crops (i.e., total N fertilizer applied in a grid cell in a year). The 100 m resolution N fertilizer use rate maps were then resampled to 5 km×5 km for a comparison and analyses. In this study, we considered three uncertainty sources, and the uncertainties in the N fertilizer maps were derived from the eight scenarios listed in Table 2. The methodology flowchart is shown in Fig. 1.
3.1 National nitrogen fertilizer use for crop production in China
The compiled national total N fertilizer use increased from 0.06 Tg N yr−1 in 1952 to the peak of 31.15 Tg N yr−1 in 2014 and then decreased to 28.31 Tg N yr−1 in 2018. The majority of the N input was directly applied as N-only fertilizer (e.g., urea and ammonium carbonate), while the contribution from compound fertilizer (e.g., ammonium phosphate) increased from 16 % in 1980 to 24 % in the 2010s. Despite the total N input decrease by 9.1 % (2.84 Tg N yr−1) from 2014 to 2018, the N input from compound fertilizer increased by 6 % (0.43 Tg N yr−1) during the corresponding period (Fig. 2).
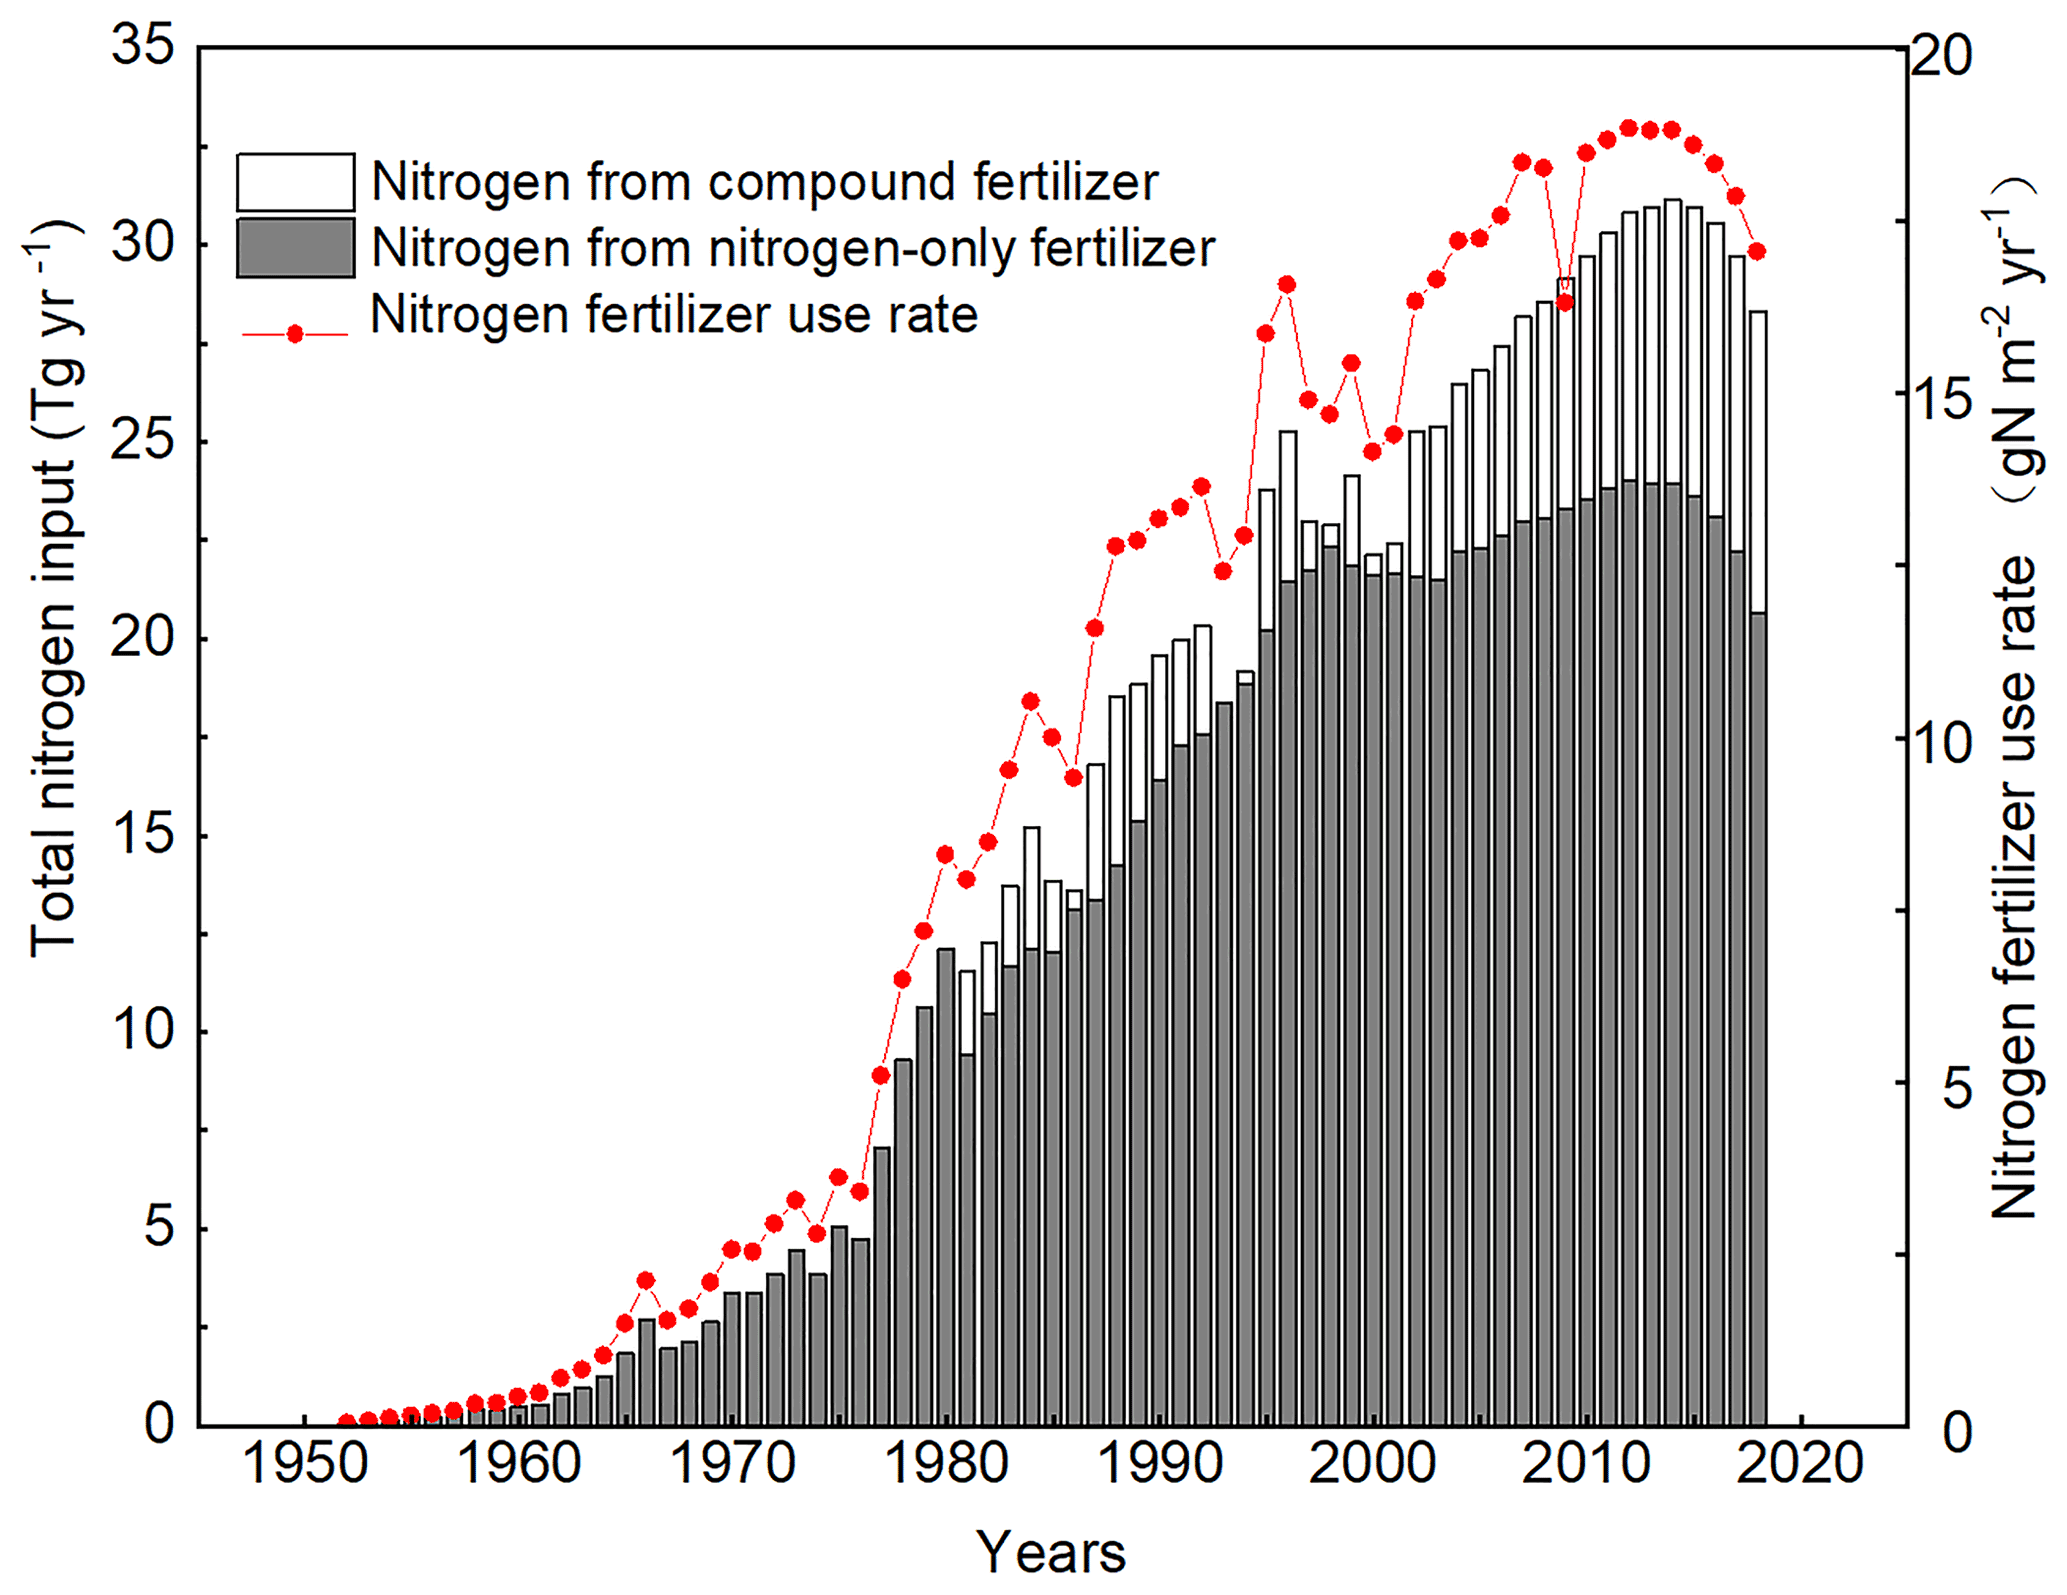
Figure 2Total nitrogen fertilizer input and the average nitrogen fertilizer use rate in China's cropland from 1952 to 2018.
The rising N fertilizer input was consistent with the N fertilizer use rates (per square meter of cropland), which increased from 0.05 g N m−2 yr−1 in 1952 to 18.83 g N m−2 yr−1 in 2014 and then decreased by 9.4 % in 2014 to 17.06 g N m−2 yr−1 in 2018 (Fig. 2).
3.2 Nitrogen fertilizer use by crop type in China
We examined the N fertilizer use in each of the major crop types planted in China since 1952 (Fig. 3 is the average of different scenarios; the different scenarios are shown in Figs. S2 and 3). The N fertilizer use rates were very low in 1950s and increased to 10–25 g N m−2 yr−1 in most crop types (Fig. 3). Among all the crop types, soybean received the lowest N inputs with the rate below 5 g N m−2 (Fig. 3). In comparison, extremely high N fertilizer use was observed in other crops (55–70 g N m−2 yr−1 in the 2010s; Fig. 3). Besides, vegetables received a substantial amount of N fertilizer – as high as 26 g N m−2 yr−1 in the 2010s – and then it slightly decreased to 24 g N m−2 yr−1 in 2018 (Fig. 3). The N fertilizer use rate for rice (i.e., early rice, mid-season rice, and late rice) increased from the 1950s then leveled off in the mid-1990s, and the N fertilizer use rates for wheat, soybean, corn, oil seeds, cotton, and vegetables all kept increasing until the 2010s (Fig. 3).

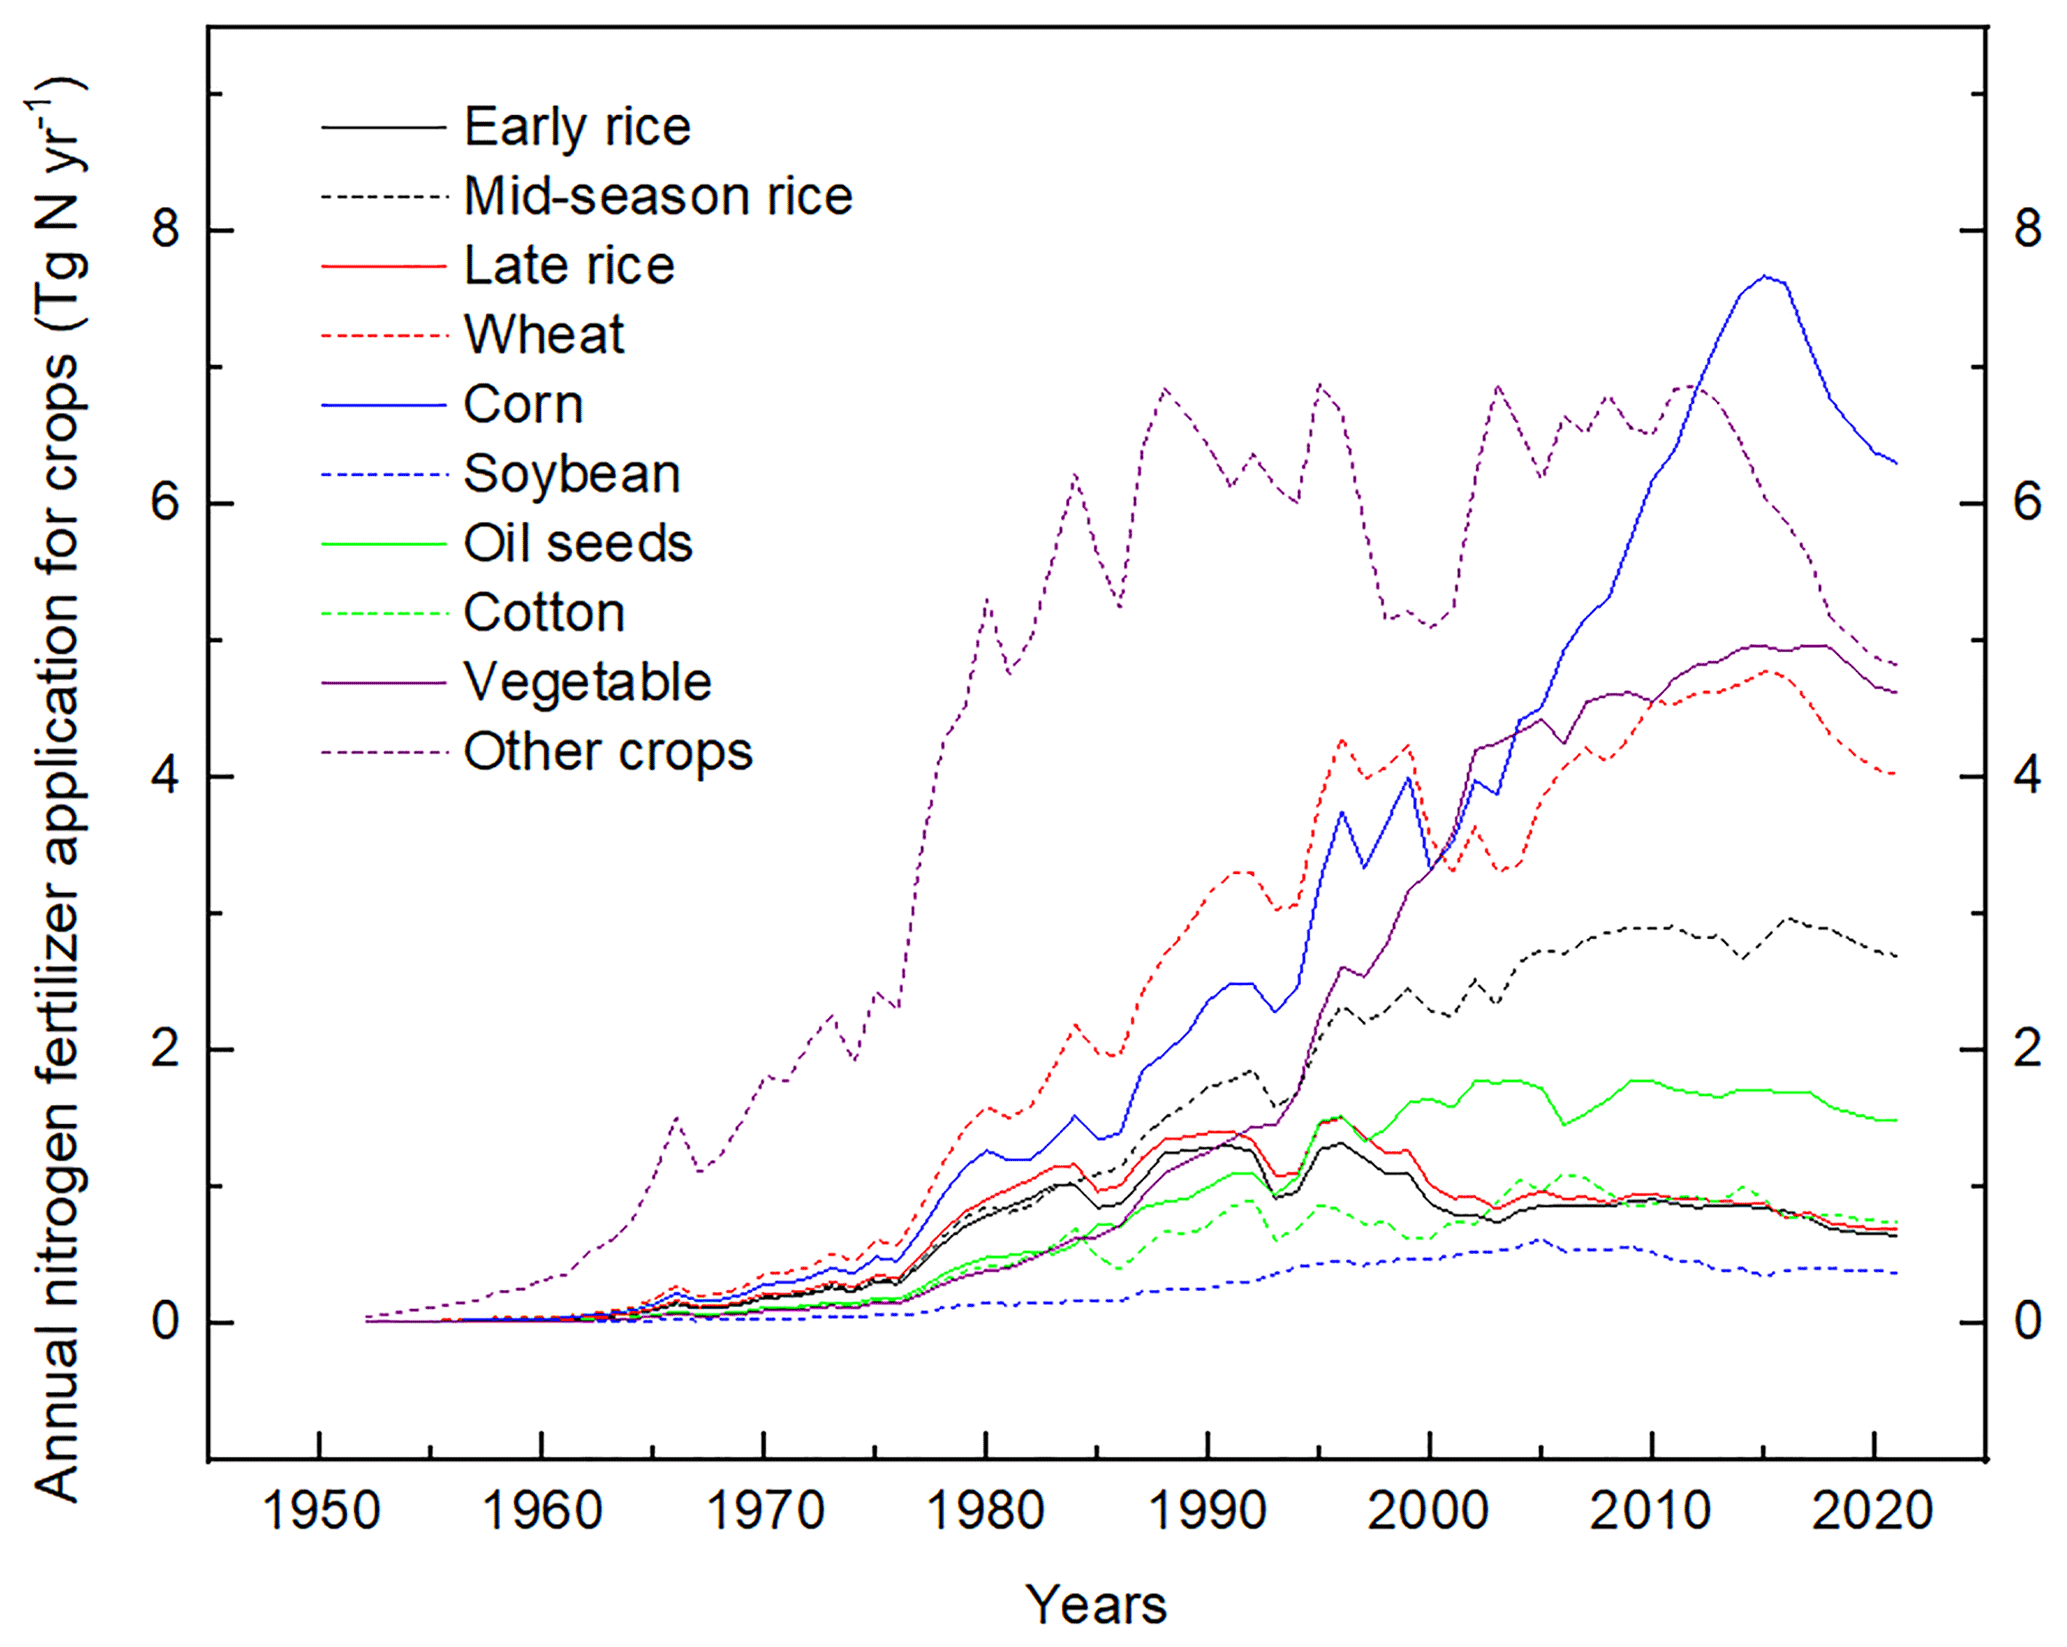
Corn is the only monocrop receiving N fertilizers of approximately 7 Tg N yr−1 in the 2010s (Fig. 4 is the average of different scenarios; the different scenarios are shown in Figs. S4 and 5). Among all the crop types, soybean received the least amount of N input, which was about 0.1–0.2 Tg N yr−1. The total N fertilizer used in soybean and oil seeds increased from the 1950s and then leveled off in the mid-1990s, and the N input for vegetables, mid-season rice, late rice, and wheat all kept increasing until the 2010s (Fig. 4). In comparison, the N fertilizer use in cotton and other crops leveled off in the 1990s, while the N input for early rice and late rice did not decline until the 1990s (Fig. 4).
3.3 Spatial distribution of nitrogen fertilizer use in China
Our reconstructed maps show that the N fertilizer use in 1952 was generally lower than 1 g N m−2 yr−1 (Fig. 5a), while the N fertilizer use increased to 4–8 g N m−2 yr−1 in 1980 and >16 g N m−2 yr−1 in 2000 in traditional agricultural plains, including the Sichuan Plain and the North China Plain (Fig. 5b). The higher N fertilizer use areas further expanded from 2000 to 2018 in the North China Plain, Northeast China Plain, and the northwestern region (Fig. 5d). In comparison, the uncertainties in the N fertilizer use rate were generally lower than 0.5 g N m−2 yr−1 in most of the area in China, but it kept increasing from 1952 to 2018 in the northern, eastern, and northwestern regions (Fig. 5g–h). Relatively higher uncertainties (>4 g N m−2 yr−1) were found in the North China Plain in 2018 (Fig. 5h).
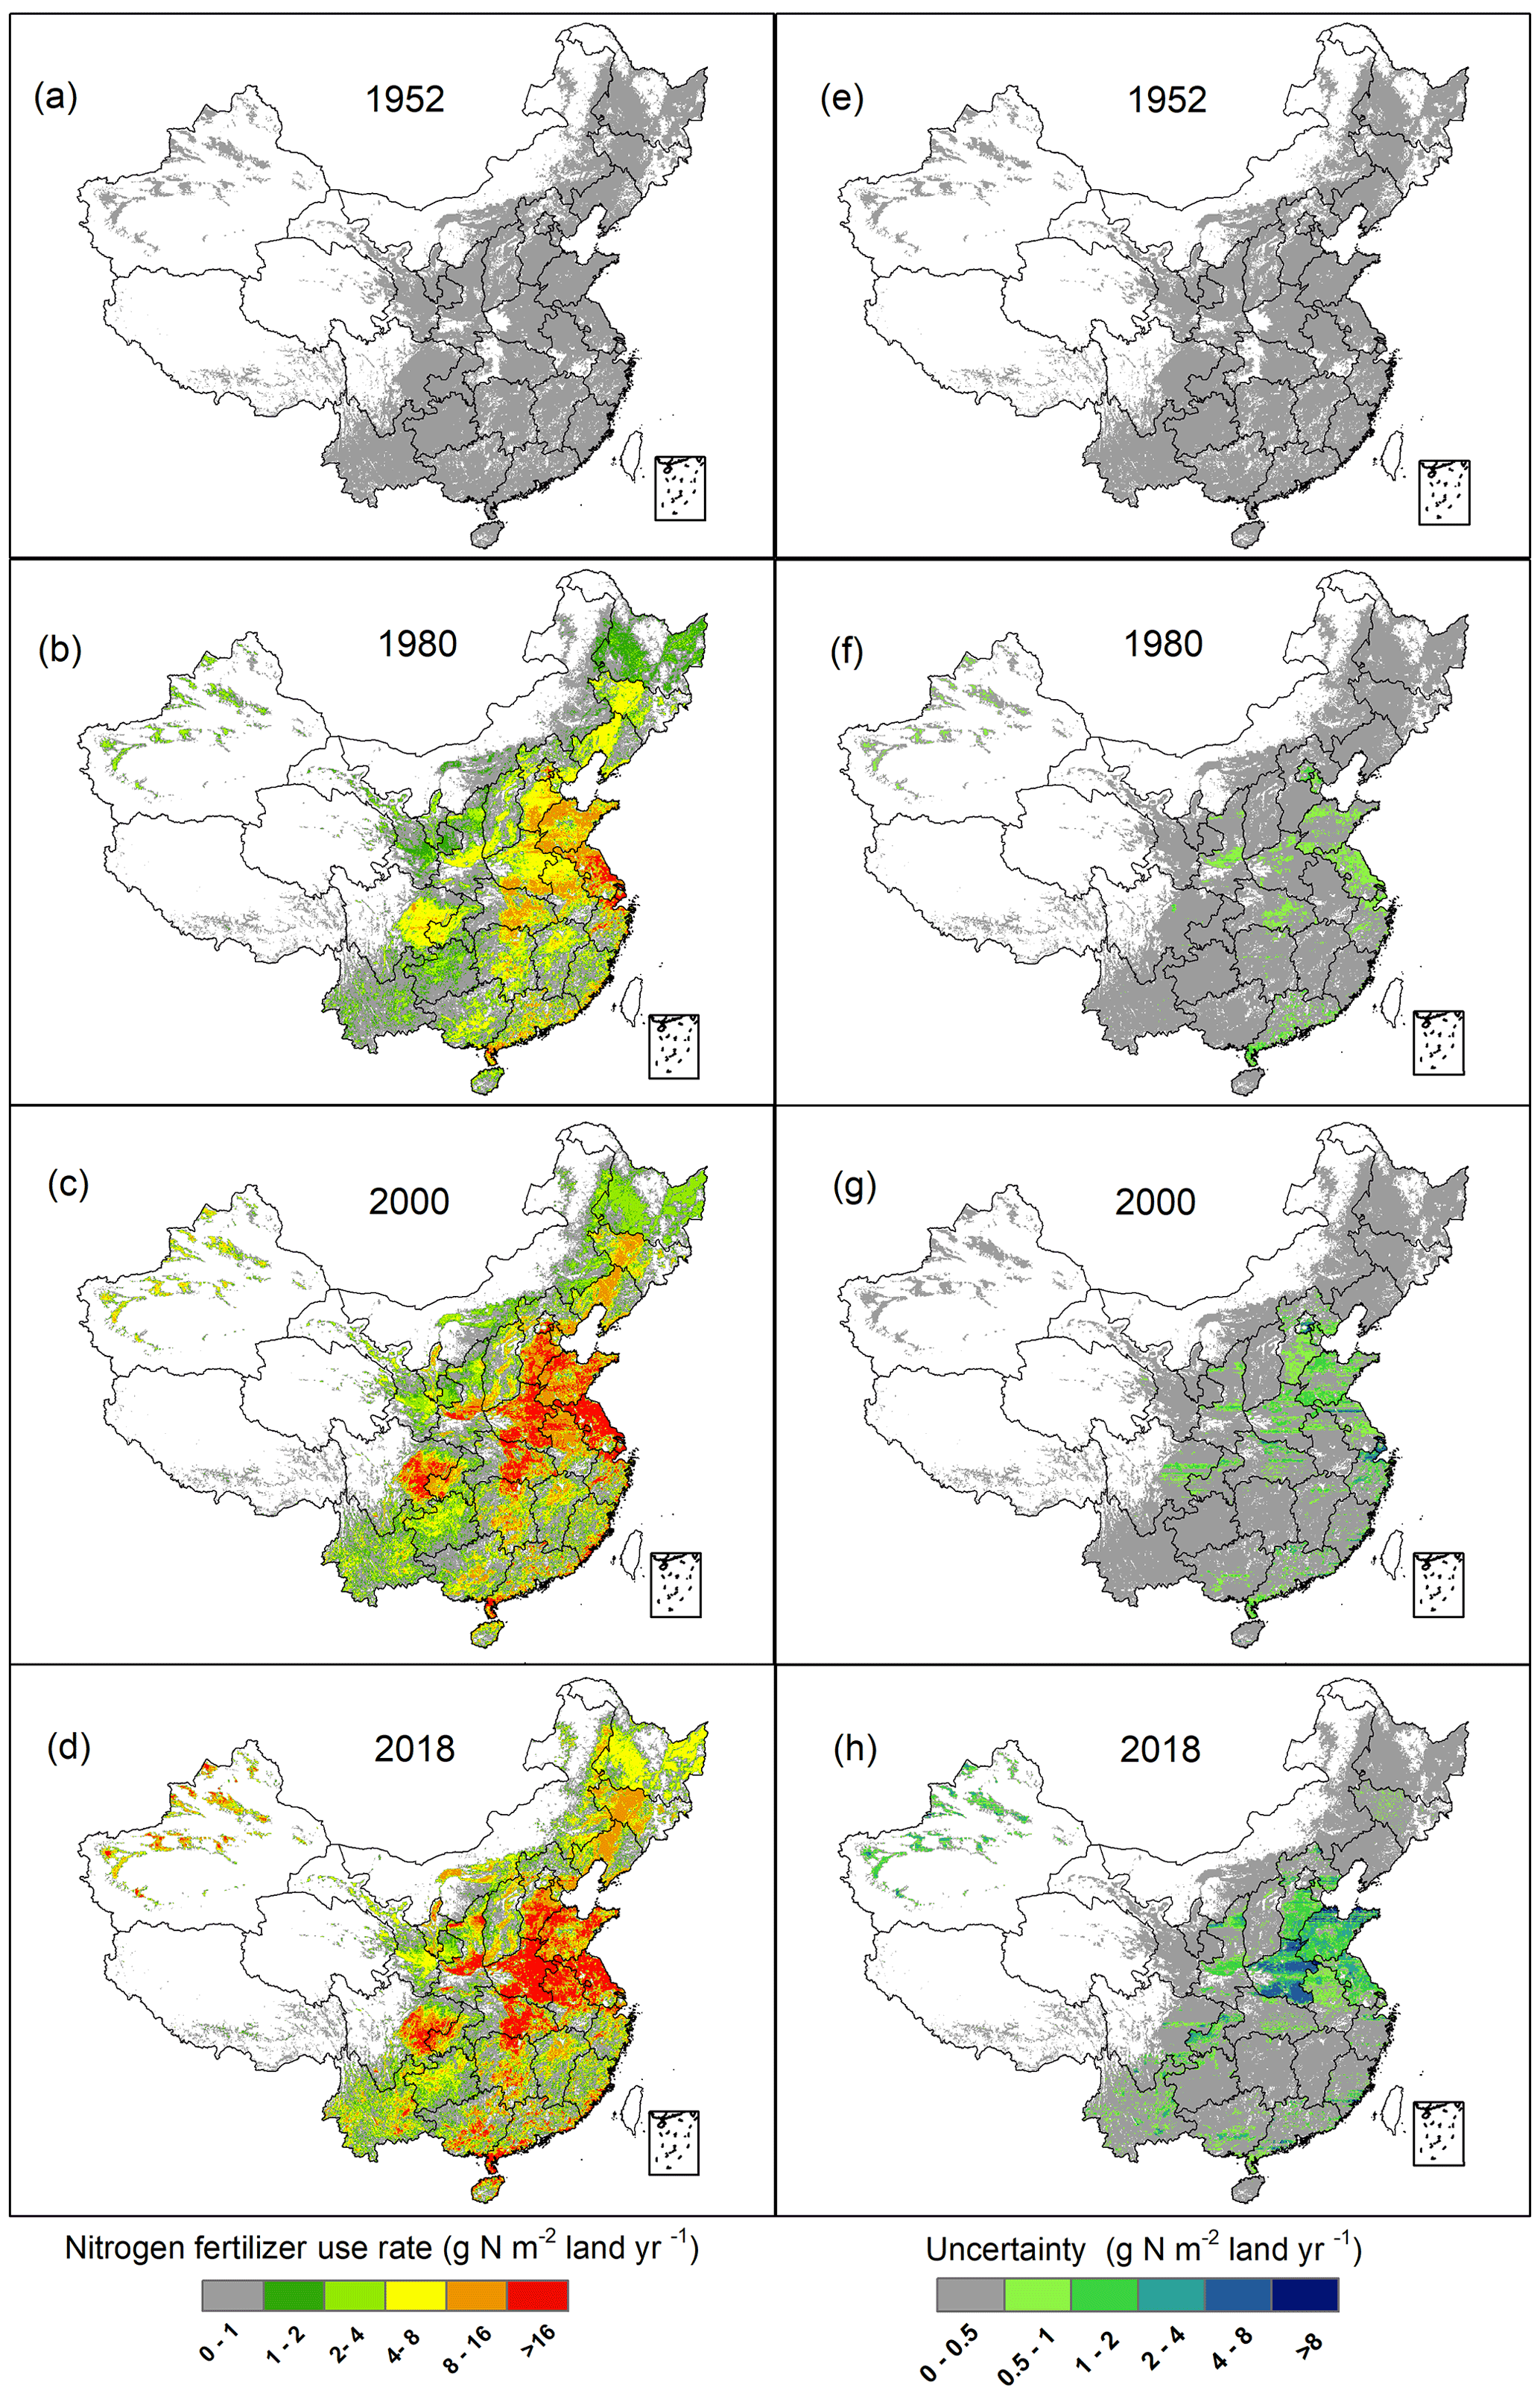
Figure 5Spatial distribution of the rates (a–d) and the uncertainties (e–h) of nitrogen fertilizer use during different periods in China. The four panels from the top to the bottom indicate the rates (a, c) and the uncertainties (b, d) in 1952, 1980, 2000, and 2018, respectively; the value in the scale bar indicates the N fertilizer use rate per square meter of land.
We also showed the N fertilizer use rates in each of the major crop types in 2018 (Fig. 6). Generally, the N fertilizer use was much higher in double-crop areas than in monocrop areas (Fig. 6k vs. Fig. 6a–j). Moreover, early rice was seldom cultivated as monocrop in China (Fig. 6a), which, instead, was often planted with other crops in a year (part of the areas in Fig. 6k). For monocrop areas, the N fertilizer use was found to be highest in corn (Fig. 6e), while the lowest N uses were detected in early rice and late rice (Fig. 6a and c).
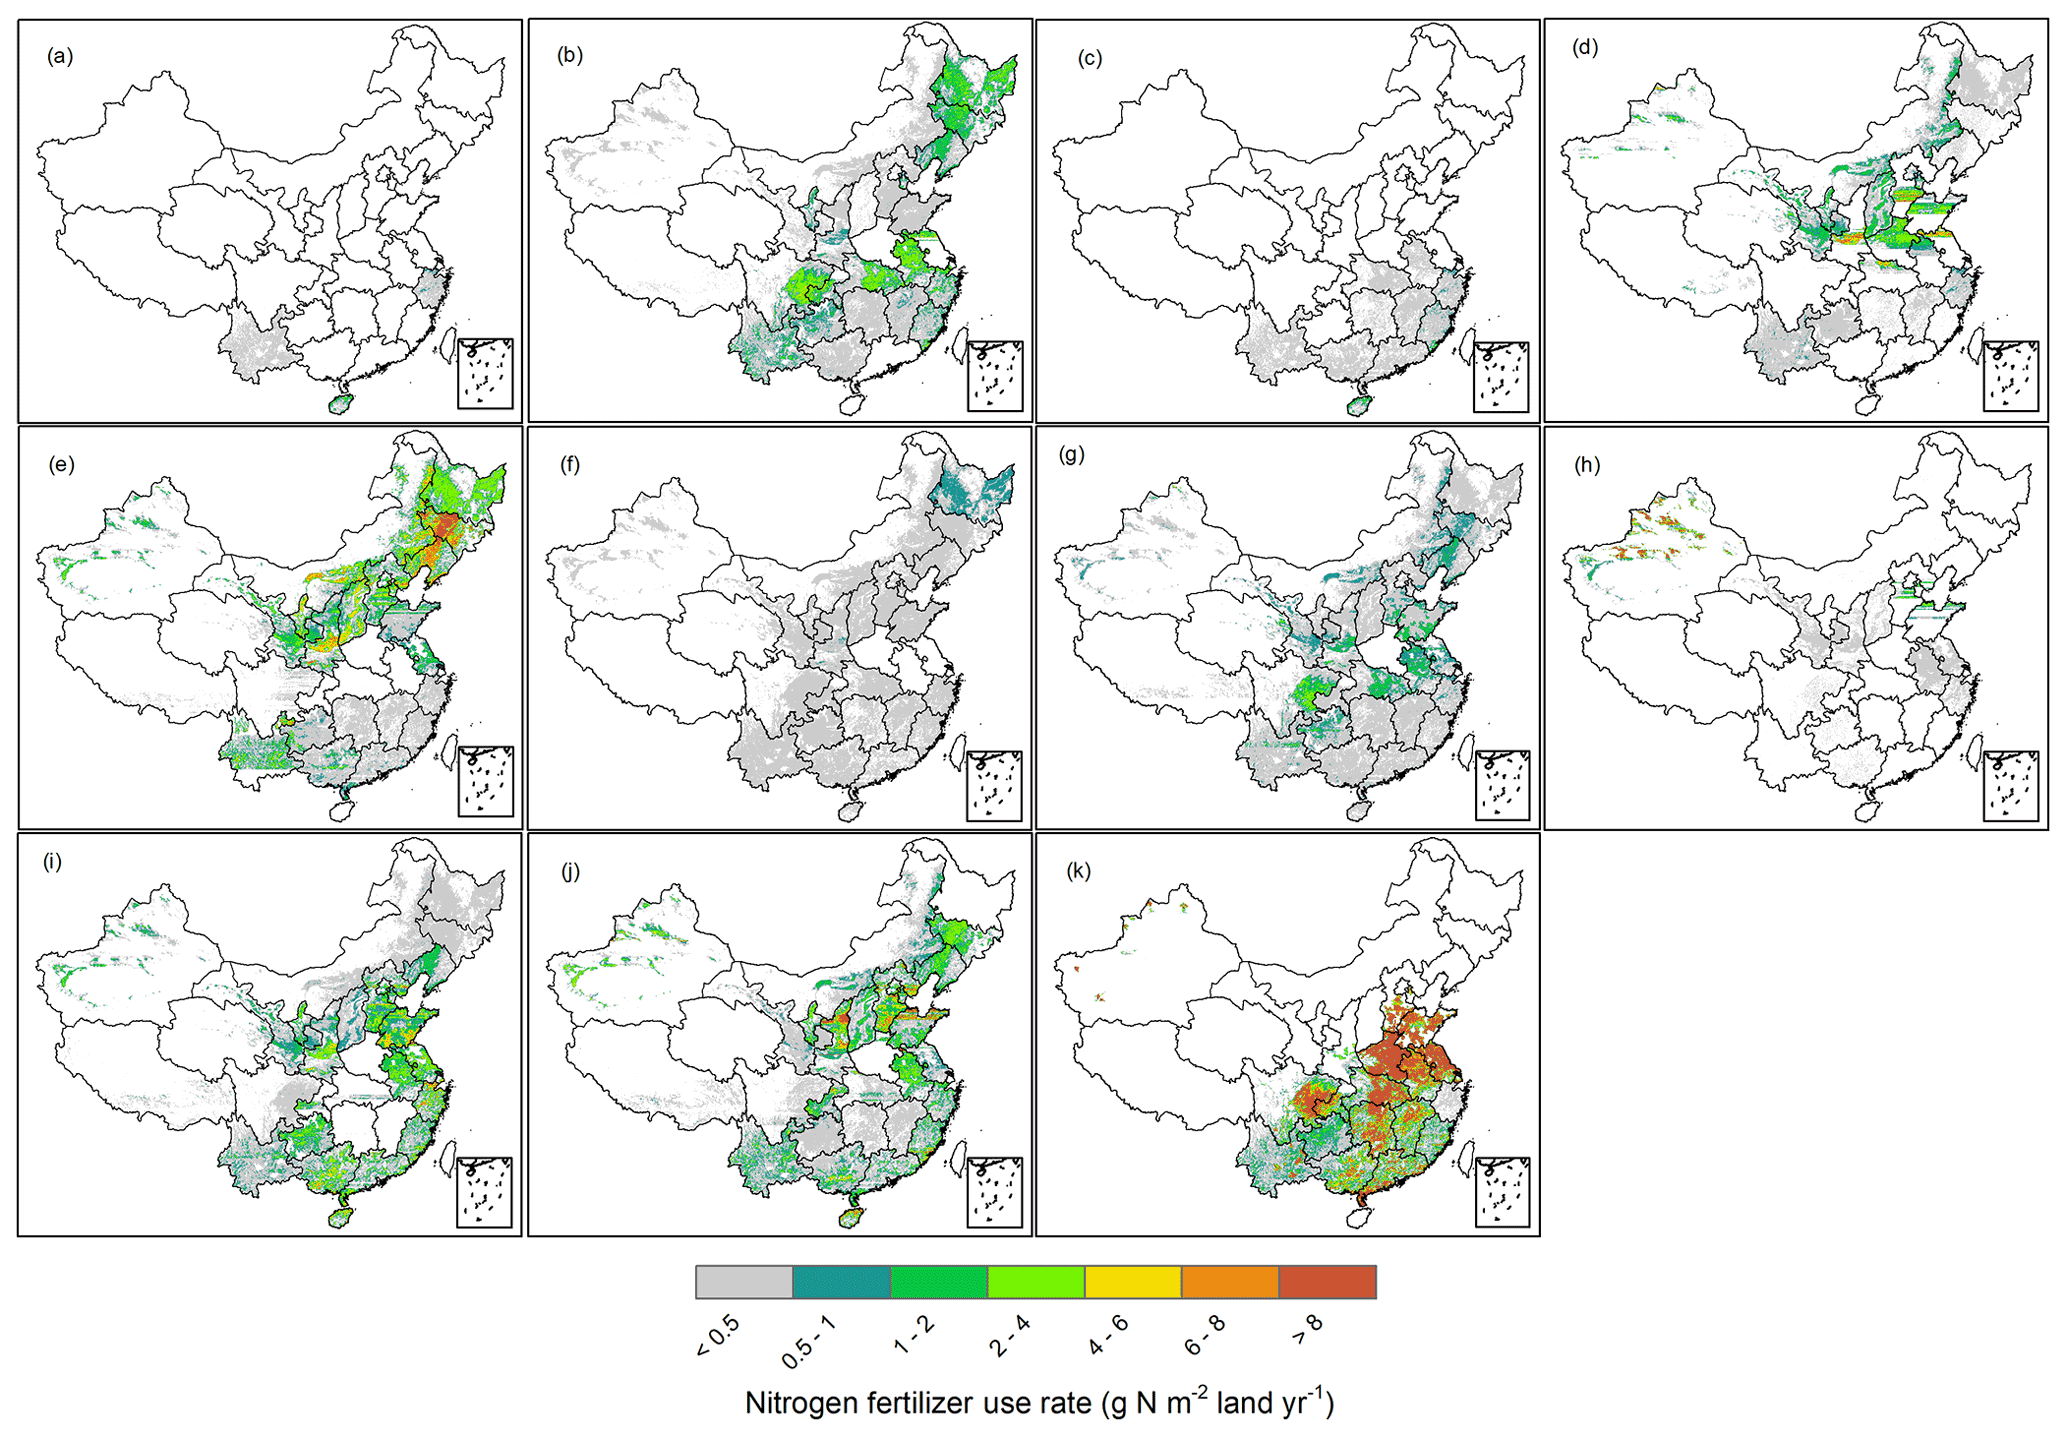
Figure 6Spatial distribution of nitrogen fertilizer use rate by crop species in 2018. Panels (a)–(h) indicate the fertilizer use rate in early rice, mid-season rice, late rice, wheat, corn, soybean, oil seeds, cotton, vegetables, other crops, and double crops, respectively; the value in the scale bar indicates the N fertilizer use rate per square meter of land.
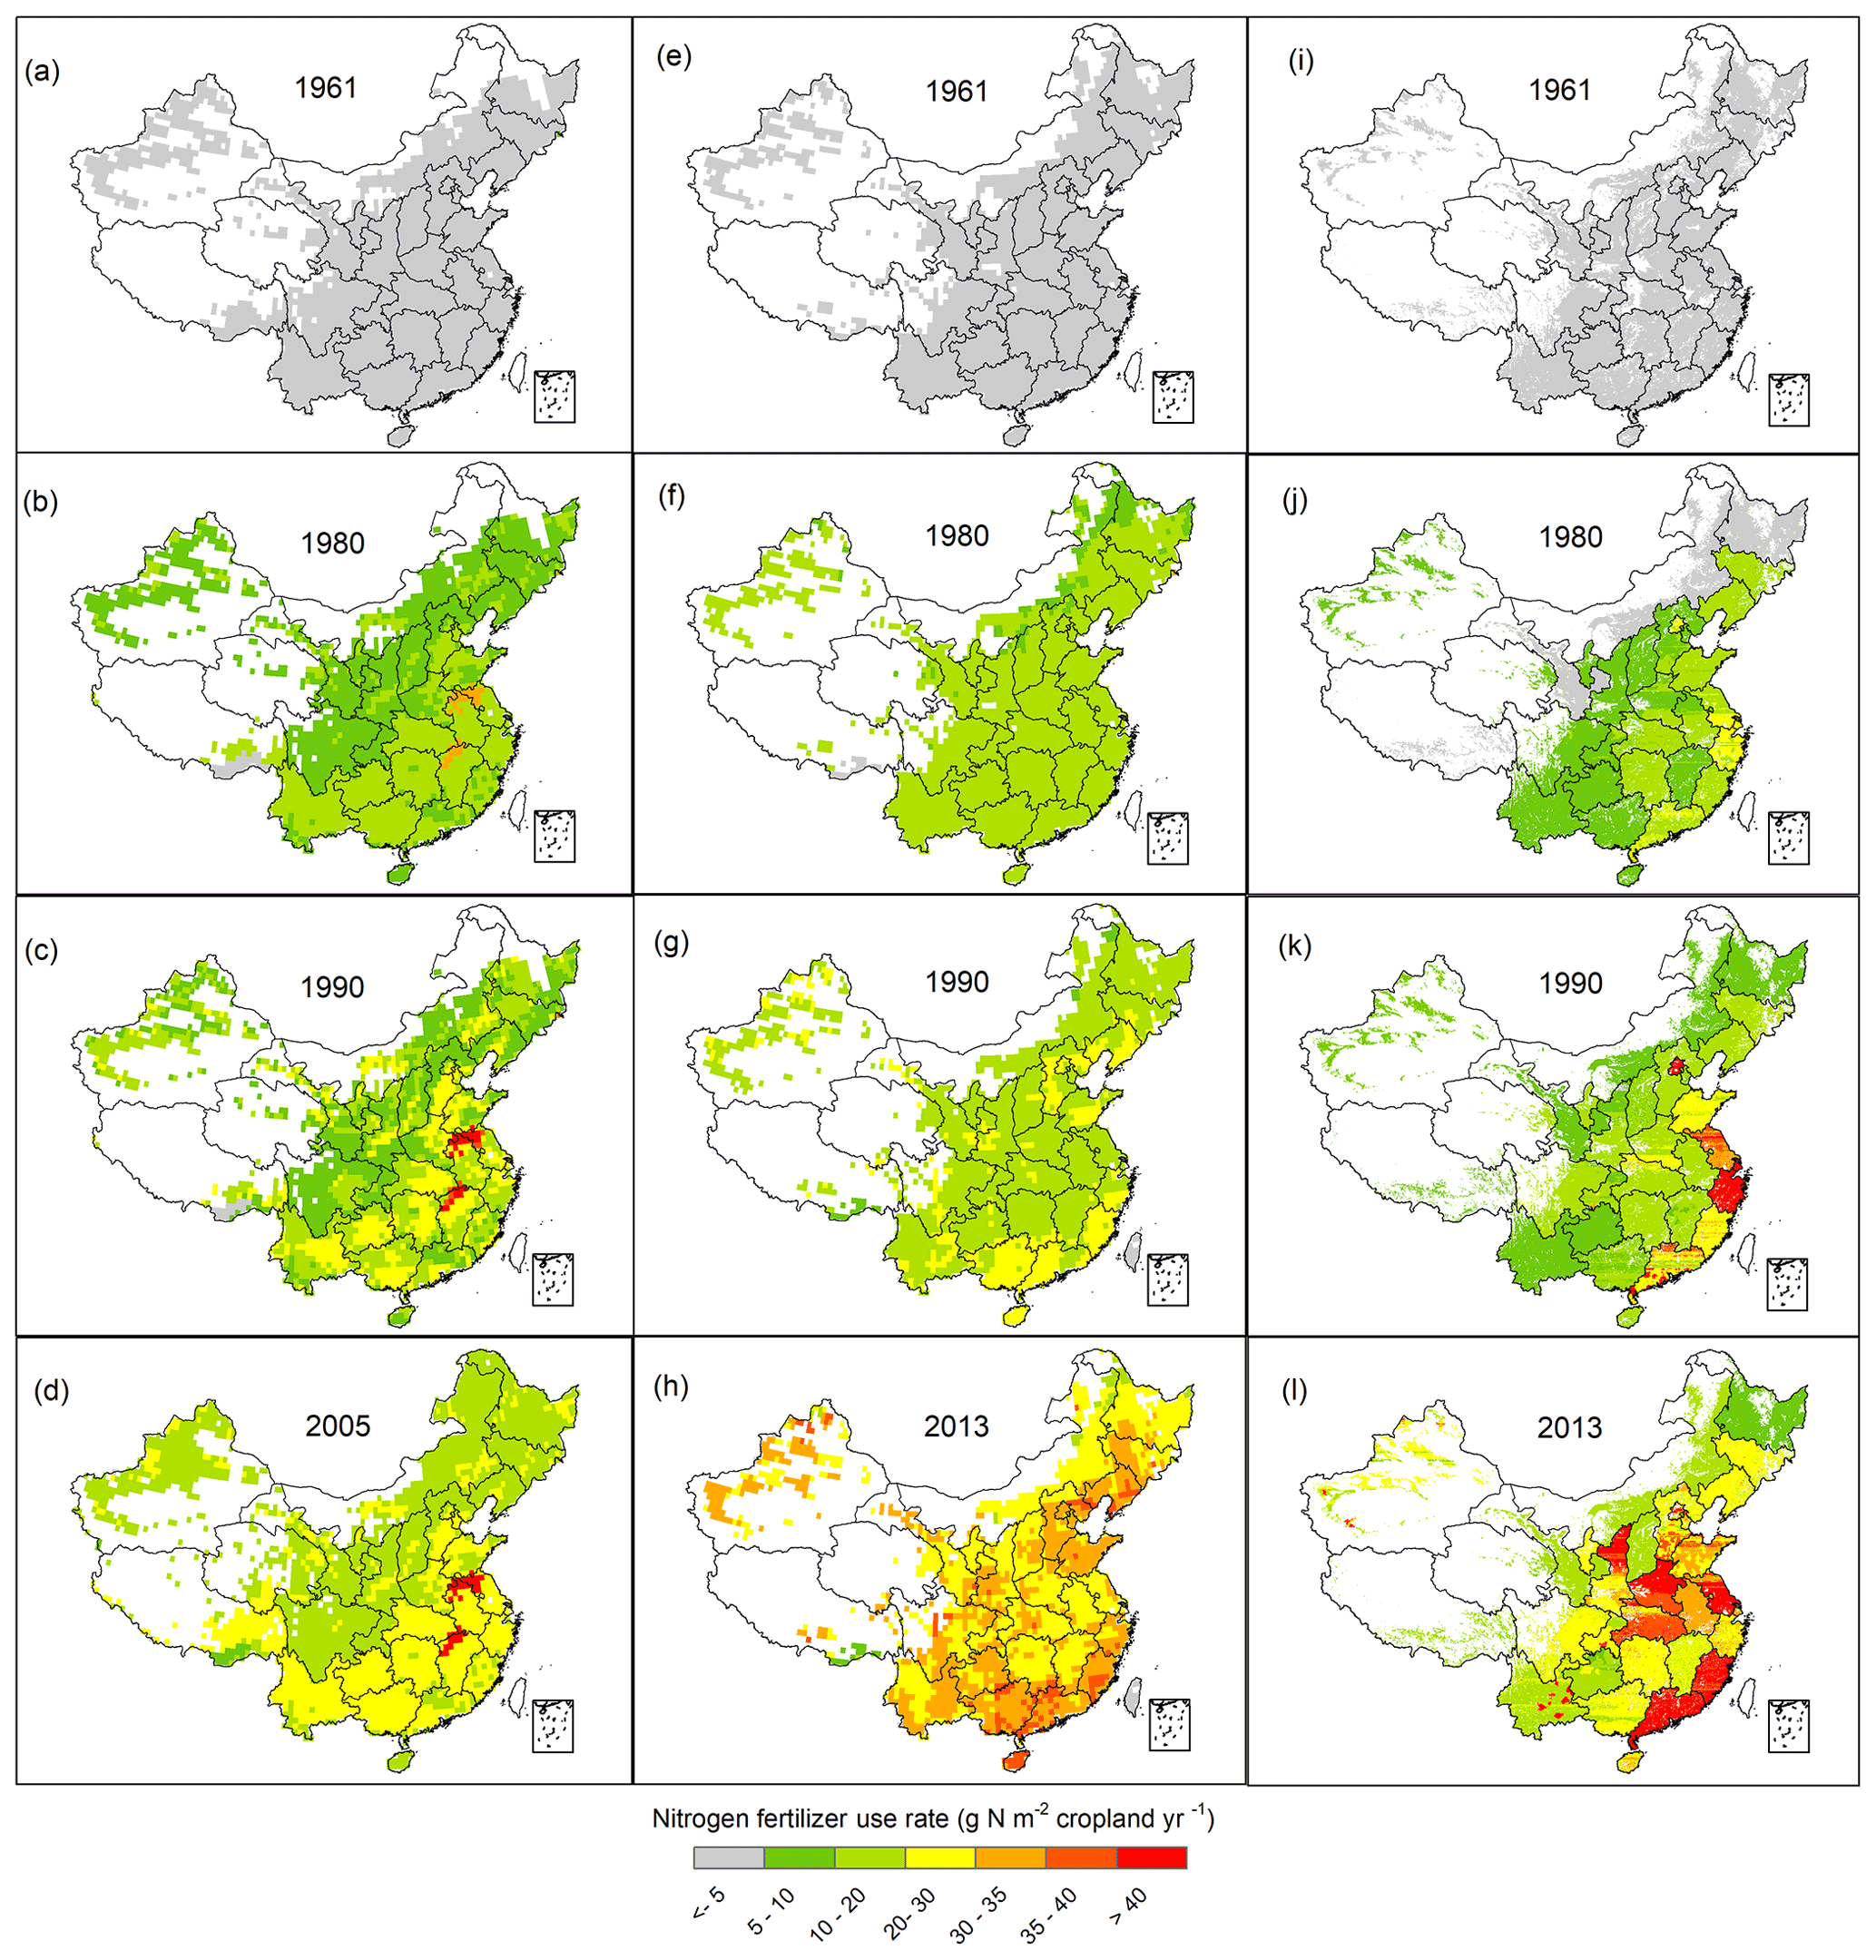
Figure 7Distribution of nitrogen fertilizer use in (a–c) 1961, (d–f) 1980, (g–i) 1990, and (j–l) 2005 or 2013. The left column shows data from Nishina et al. (2017), the central column shows data from Lu and Tian (2017), and the right column shows data from this study. The values indicate N fertilizer use rates per square meter of cropland for each grid cell.
3.4 Comparison of newly reconstructed data and other data
We compared the reconstructed N fertilizer use rate maps with the existing datasets. Specifically, the existing datasets describe N fertilizer use in two ways. The first one depicts the N fertilizer use rate per square meter of cropland for each pixel (g N m−2 of cropland per year). We compared our reconstructed data with the datasets published by Nishina et al. (2017) and Lu and Tian (2017) in 1961, 1980, 1990, and 2005 or 2013 (Fig. 7). The N fertilizer use in croplands (g N m−2 cropland yr−1) of Nishina et al. (2017) was calculated by dividing the total N use maps (i.e., sum of NH and NO fertilizers) by the cropland coverage maps obtained from the Land-Use Harmonization (LUH v1; https://luh.umd.edu/data.shtml, last access: 1 July 2022). For the year 1961, all of the three datasets showed very low N fertilizer use (Fig. 7a, e, and i). For 1980, our reconstructed data on N fertilizer use rates were generally lower than the datasets in Nishina et al. (2017) and Lu and Tian (2017) for most areas of China, except for the east and coastal provinces (Fig. 7b, f, and j). For the year 1990, our reconstructed N fertilizer rates were generally higher than the other two datasets in the east of China (Fig. 7c, g, k). For 2010, the N fertilizer use rates in raised to 20–35 and >20 g N m−2 yr−1 in most of the study area derived from Lu and Tian (2017) and our study, respectively (Fig. 7h, l). Specifically, the N fertilizer use rates were lower in Lu and Tian (2017) than in our reconstructed data in most of the northern and eastern provinces in 2013 (provinces dominated by red color in Fig. 8l).
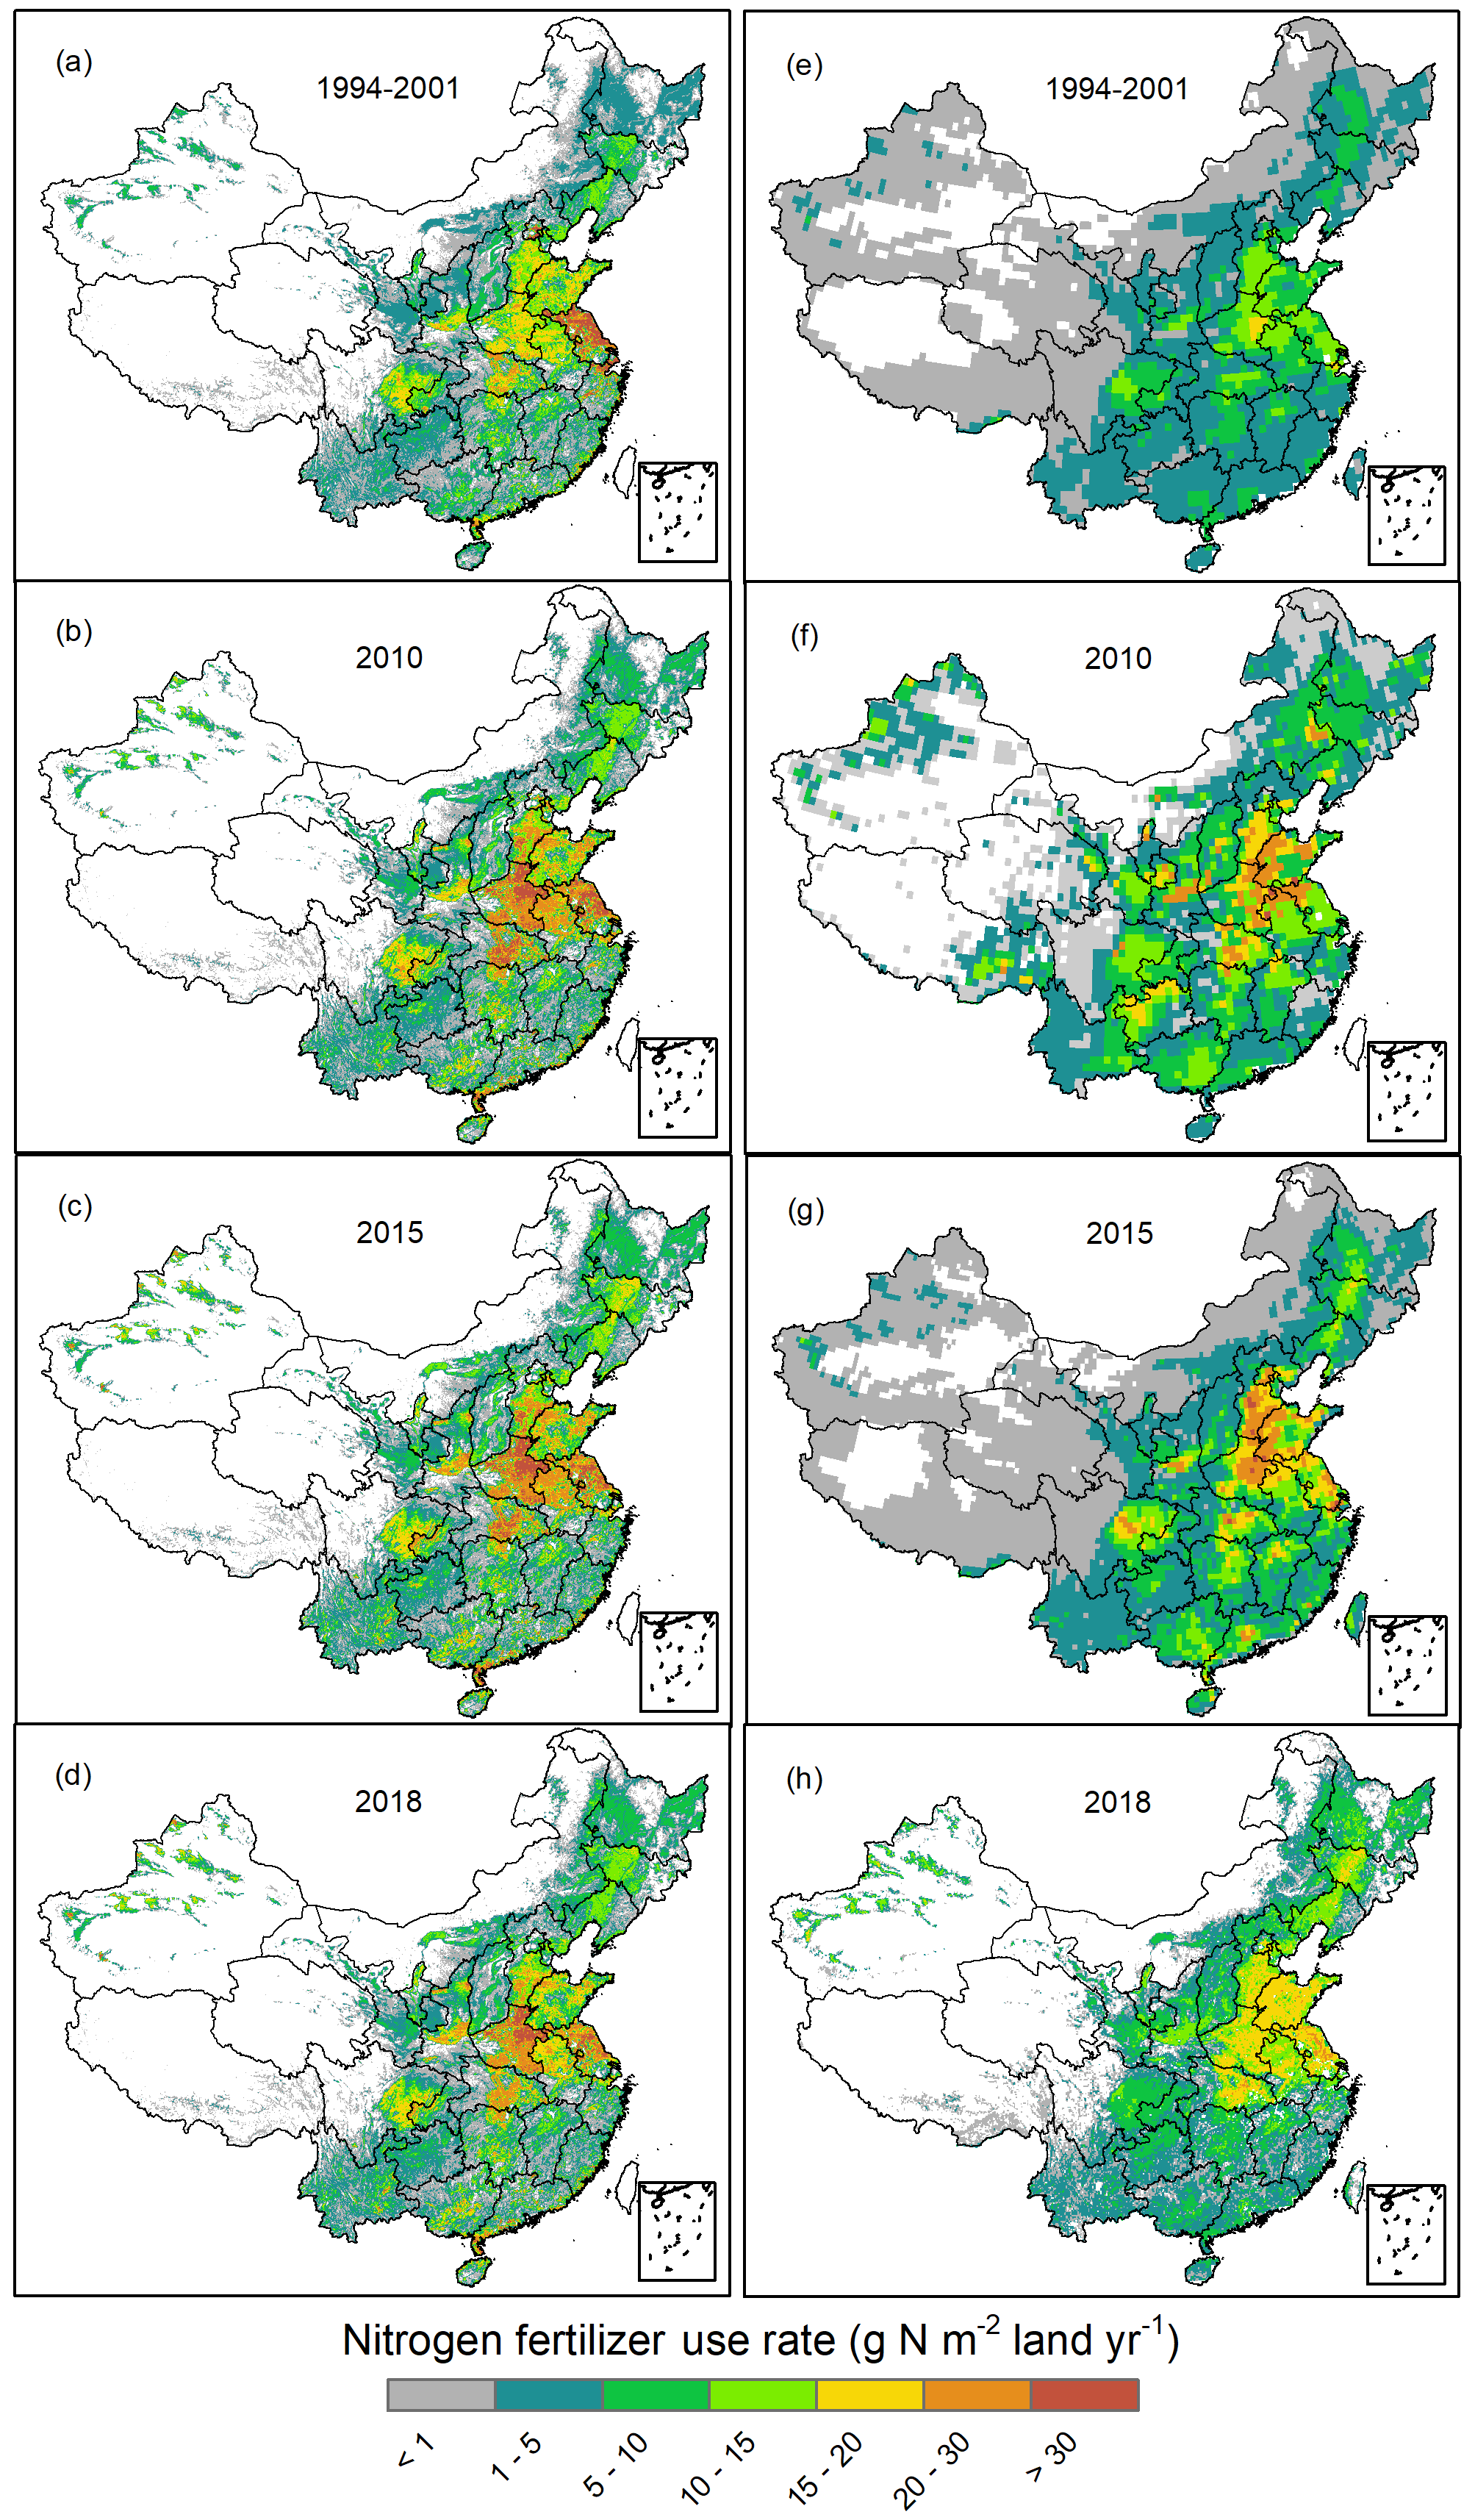
Figure 8Comparisons of the nitrogen fertilizer use in different studies. The most recent year with data from both this study and other studies available was used in the comparison. Panels (a)–(d) show this study. Panels (e)–(h) show data from Potter et al. (2010), Nishina et al. (2017), Houlton et al. (2019), and Tian et al. (2022). The value indicates the N fertilizer use rate per square meter of land.
In the second approach, we used N fertilizer use rates per square meter of land (g N m−2 of land per year) for a comparison between our reconstructed data and other four studies by Potter et al. (2010), Nishina et al. (2017), Houlton et al. (2019), and Tian et al. (2022; Fig. 8). Overall, we found similar patterns between our reconstructed data and the other four datasets. Generally, the other four datasets overestimated the China's cropland distribution in low-coverage areas, especially in the northern and northwestern regions (gray area in Fig. 8e–h). Besides, N fertilizer use rates in our reconstructed data were higher than in Potter et al. (2010) during the period 1994–2001 in traditionally cultivated plains (e.g., the Sichuan Plain, the North China Plain, and the Northeast China Plain; Fig. 8a and e). Similar patterns were also found between our reconstructed map and Nishina et al. (2017)'s map in 2010, for which N fertilizer use was more concentrated in the traditionally cultivated plains (Fig. 8b and f). When compared with the Houlton et al. (2019) dataset, our reconstructed data showed a higher N fertilizer use in 2015 in the northwestern region and the North China Plain but lower N fertilizer use in the southwestern region (Fig. 8c and g). In comparison, the reconstructed N fertilizer use was generally higher than in Tian et al. (2022) across the entire study area (Fig. 8d and h).
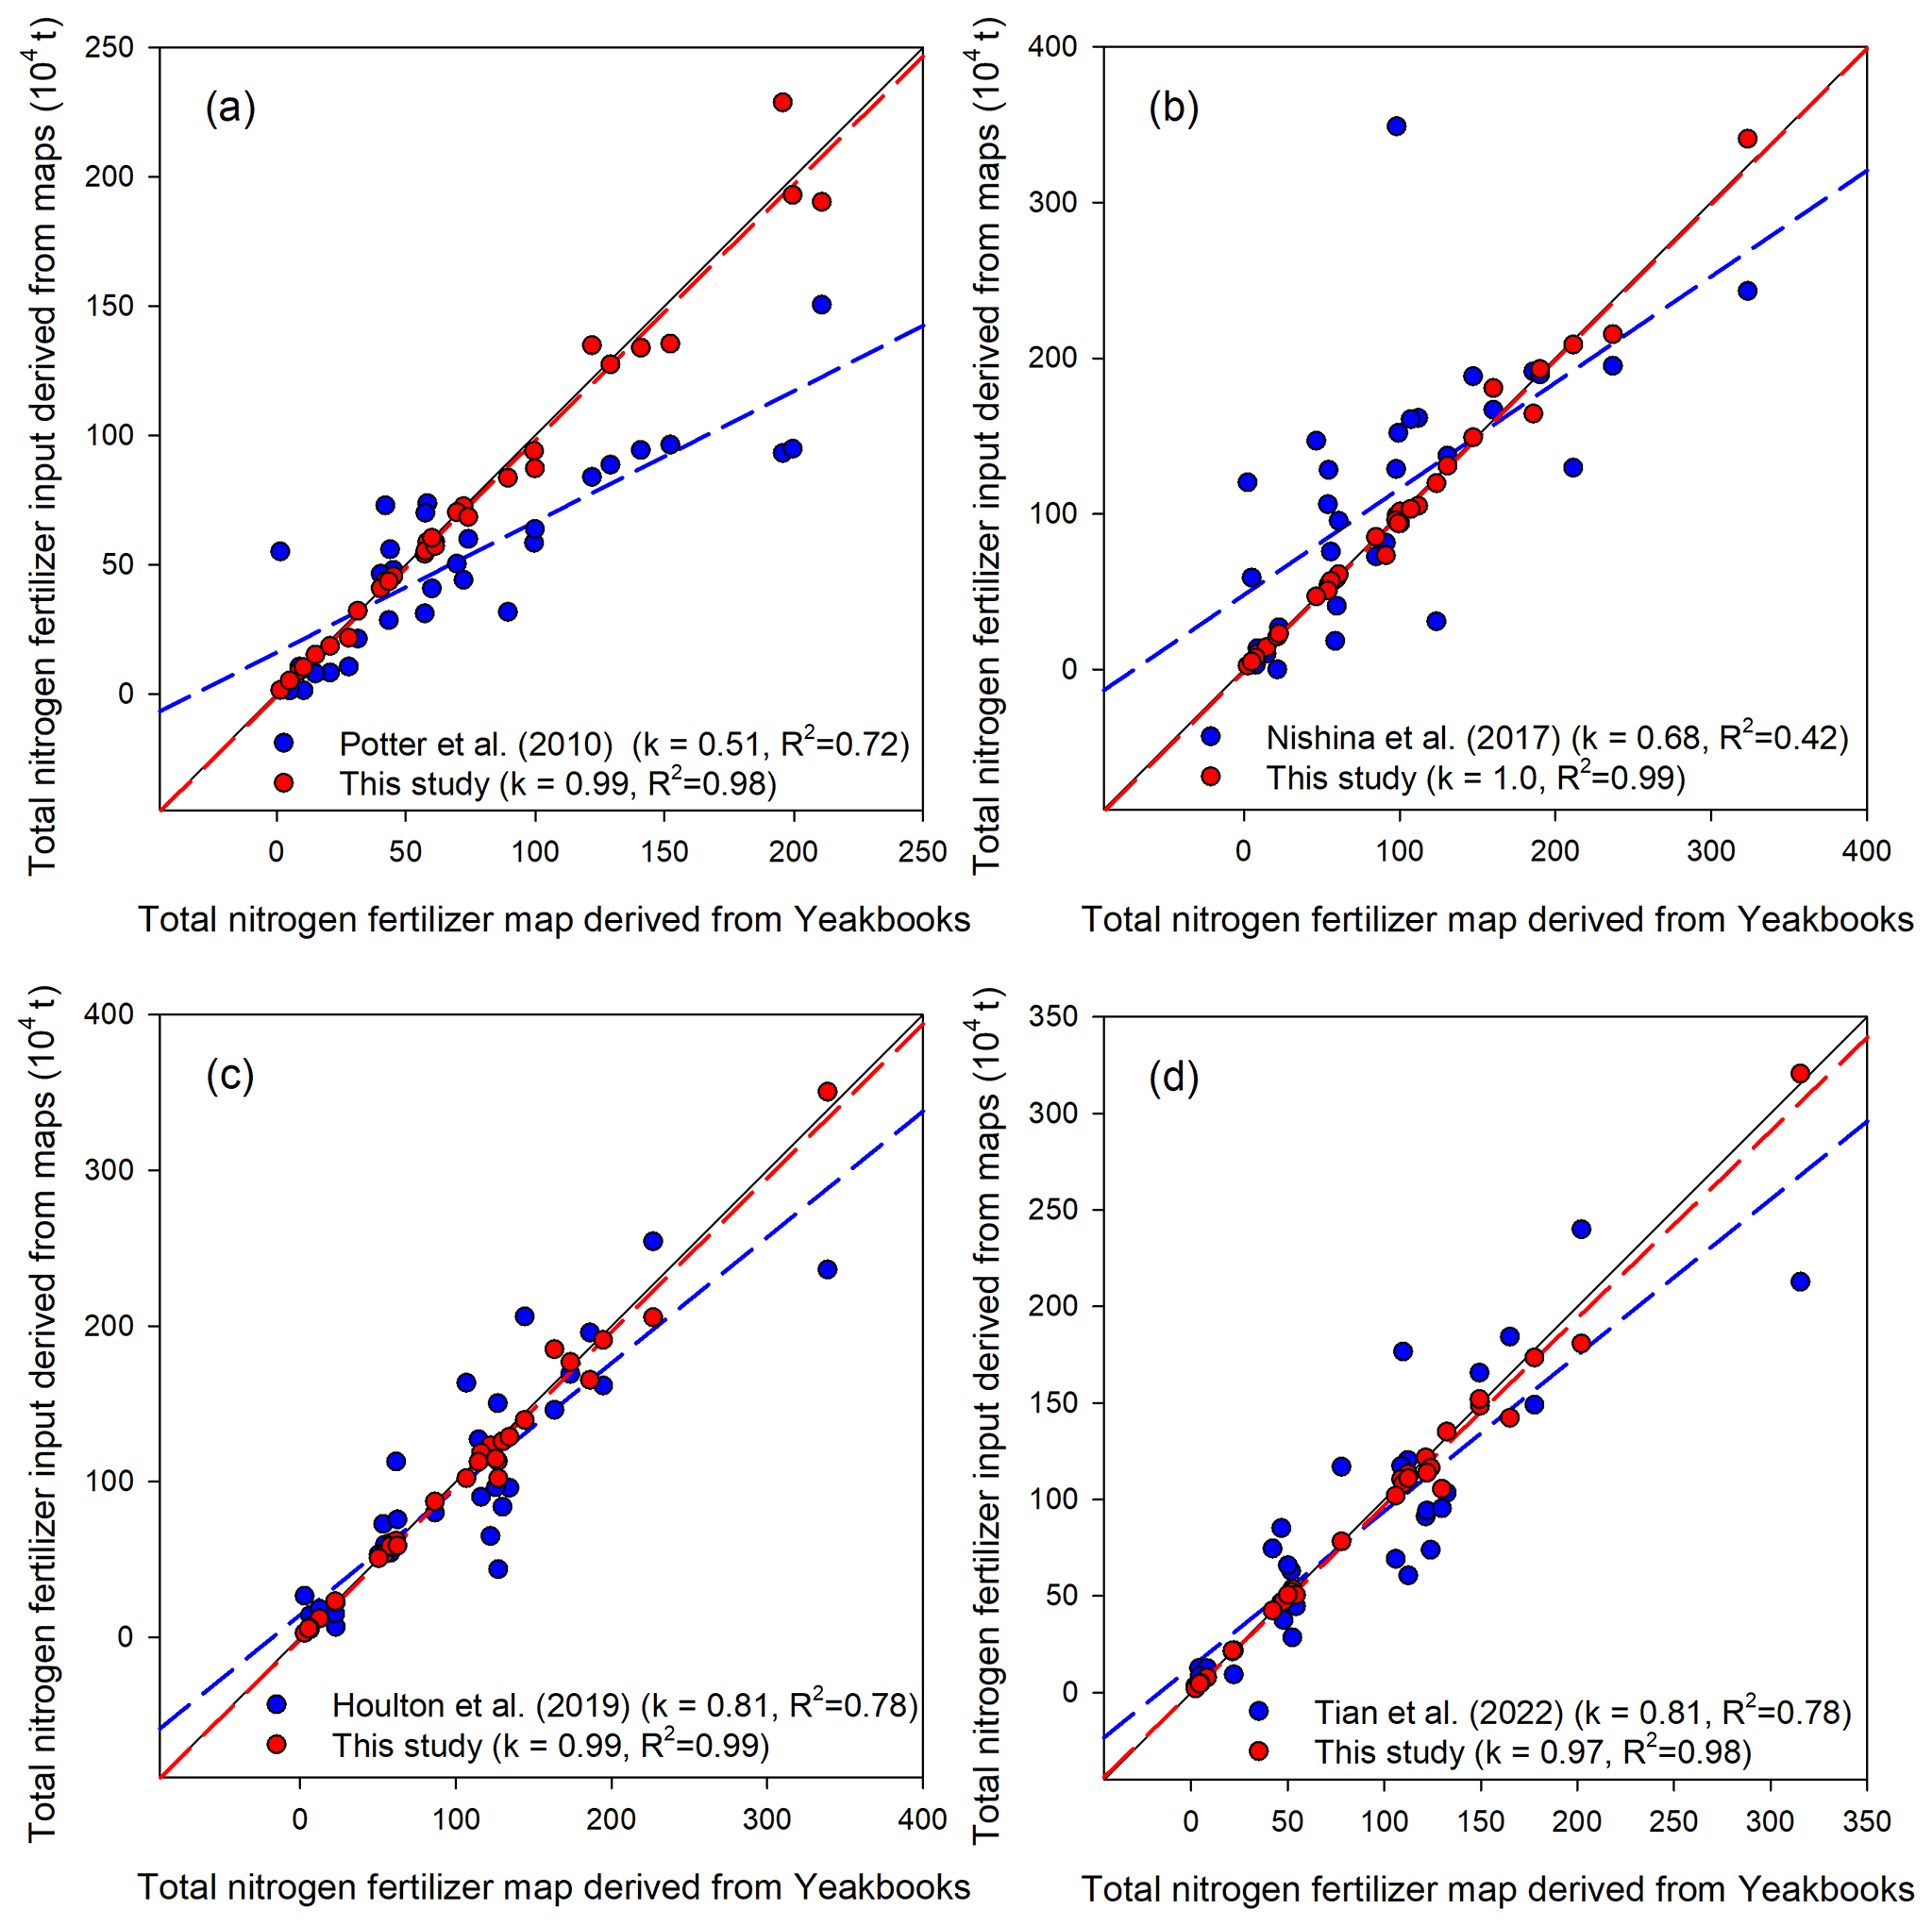
Figure 9Comparisons of the total nitrogen fertilizer input in each province in China derived from different nitrogen fertilizer data products. The x axes indicate the nitrogen fertilizer input obtained from the Chinese Statistical Yearbook; the black solid line indicates the 1:1 line, and the red and blue lines indicate the linear regressions of the provincial nitrogen fertilizer input derived from this study and other studies. Panels (a)–(d) show comparisons in the period/years of 1994–2001, 2010, 2015, and 2018, respectively. Data of other studies were derived from the nitrogen fertilizer maps of Potter et al. (2010), Nishina et al. (2017), Houlton et al. (2019), and Tian et al. (2022), respectively.
We also compared the total N fertilizer input at the provincial level derived from different studies in the periods/years of 1994–2001, 2010, 2015, and 2018 (Fig. 9). Generally, we found that the provincial N fertilizer use derived from our maps is closer to the statistical results than data derived from other products, as supported by higher R2 (Fig. 9). This indicates that our reconstructed maps are more advantaged than the existing data products in depicting the provincial nitrogen fertilizer use in China.
The N fertilizer use maps and the crop-specific N fertilizer use maps reconstructed in this study are publicly available at https://doi.org/10.6084/m9.figshare.21371469.v1 (Yu, 2022).
5.1 Temporal changes in the nitrogen fertilizer use
The temporal changes in the N fertilizer use in China's cropland during the study period (1952–2018) are unprecedented. The total N fertilizer input has increased by approximately 52 times from 0.6 Tg N yr−1 in 1952 to the peak of 31.15 Tg N yr−1 in 2014. Together with population growth, the cropland expansion and the N management in crop fields contributed to this sharp increase in N fertilizer use in China's cropland over time. Our study found a 39.3 % (41.1 Mha) increase in the area of planted crops from the 1950s to the 2010s (data derived from Chinese Statistical Yearbook), and a 98-fold increase in N fertilizer use, from 0.19 g N m−2 yr−1 in the 1950s to 18.38 g N m−2 yr−1 in the 2010s, suggesting a marked transformation of the China's environment.
The tremendous amount of N input in the soil has greatly altered the biogeochemical cycles and endangered terrestrial and aquatic ecosystems in China (Guo et al., 2010; Domagalski et al., 2007; Yang, 2001; Liu et al., 2014). Former studies claimed that there is a climate benefit potential from N fertilizer use on soil carbon storage enhancement (Tian et al., 2011; Melillo et al., 2010). Yet, such benefits could be completely counteracted or even exceeded by the boosted N2O production (Zaehle et al., 2011; Liu and Greaver, 2009). Lately, China has made greater efforts to reduce N fertilizer use in croplands. For instance, the Ministry of Agriculture of China's “One control, two minus, three basic” policy for the “Fertilizer Use Zero-Growth Action Plan by 2020” greatly limited or even reduced the N fertilizer use (The Ministry of Agriculture of China, 2015, http://www.moa.gov.cn/nybgb/2015/san/201711/t20171129_5923401.htm, last access: 1 July 2021). Our study clearly identified the effect of this policy, in that we found the total N fertilizer input decreased by 9.1 % (2.84 Tg N yr−1) from 2014 to 2018 (Fig. 2). Our results also revealed that the reduction in the national N fertilizer use in cropland since 2014 was due to the smaller planted crop area and the better N management in crop fields. In our study, the crop planted area in China decreased by 2.3 % (3.4 Mha) from 2015 to 2018 (http://www.stats.gov.cn/, last access: 1 July 2022), which consequently helped to reduce the N fertilizer input in croplands by 0.63 Tg N yr−1. The better N management (i.e., improved N fertilizer use) in croplands was a significant factor for the reduction in national N input, as evidenced by the 9.4 % reduction in the N fertilizer use rates from 2014 to 2018 in China's cropland that we identified in our study (Fig. 2).
The dynamics of N fertilizers present in China's cropland is complex due to the nature of different fertilizers, their use, and management practices. The decrease in the N fertilizer input since 2014 in our study was caused by the reduction in N-only fertilizers, while the N of the compound fertilizers has been increasing from 1993 to 2018 (Fig. 2). It has been reported that, because of the varying energy consumptions during production and application processes, some N present in compound fertilizers may increase (Chen et al., 2020; McLaughlin, 2000; Gellings and Parmenter, 2004). Besides, fertilizers respond differently to environmental factors and are therefore varied in emission potential (Bouwman et al., 2002; Shcherbak et al., 2014). Thus, the shift in the use of N fertilizer types might potentially affect the N2O emission both during the production processes and during the field application, implying that this shift in fertilizer use habit can impact on the GHG budget of China, which should be examined.
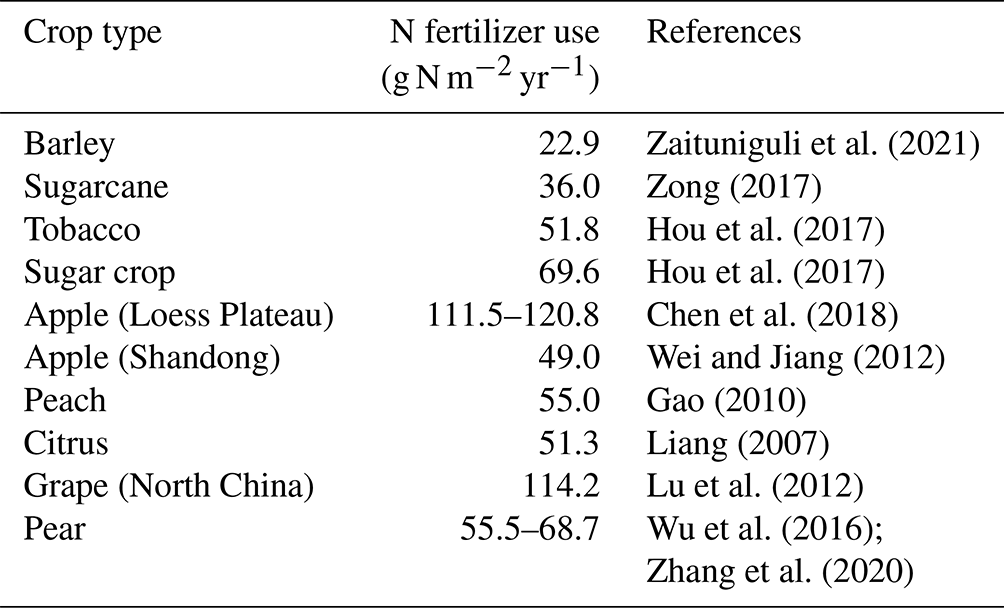
Table 3Nitrogen (N) fertilizer use rates in minor crops reported in China.
5.2 Nitrogen fertilizer use by crop type
Surprisingly, we found that the most intensively fertilized crop was not a grain crop but vegetables and other crops in China (Fig. 3). Some surveys documented that fertilizers received by vegetables could be 3.3 times higher than grain crops, suggesting that vegetables and other crops would play different roles in GHG emissions than the grain crops do (Huang et al., 2017; Hou et al., 2017). In our study, the major component of other crops was orchards, which accounted for 10 % of the total planted area in China (according to the data obtained from http://www.stats.gov.cn/, last access: 10 August 2022) and indicated higher rates of N fertilizer use. We found about a 2–5-fold rate of N fertilizer use in orchards in China than in grain crops (Table 3). In our study, we found that the highest N fertilizer use (111.5–120.8 g N m−2 yr−1) was in the apple orchard in the Loess Plateau (Table 3), suggesting that the orchards in dryland areas of China not only demand a higher amount of water but also the increased use of N fertilizers. However, irrigation and higher N fertilizer use may together amplify the GHG emissions, as nitrification and denitrification processes might potentially be boosted (Trost et al., 2013). Given the large acreage of orchards and the exponential rise in N2O in response to N input increases (Bouwman et al., 2002; Shcherbak et al., 2014), it can be anticipated that the N2O emission introduced by high N use in other crops might be an essential contributor to China's GHG budget. Many of the previous estimations have focused on GHG emissions from grain crops such as corn, rice, and wheat (Shcherbak et al., 2014; Ju et al., 2009; Huang and Tang, 2010), while our study implies that GHG emissions could be even larger from non-grain crops as intensive N fertilizer use was identified in vegetables and other crops (Figs. 3 and 4).
Despite finding that the national average fertilizer use rates in grain crops (e.g., corn, rice, and wheat) were reasonable, ranging from 12 to 20 g N m−2 yr−1 in the 2010s in China (Fig. 3), the rates varied greatly among provinces. This clearly indicates the spatial non-uniformity in N fertilizer use in grain crops and location-specific implications for soils and the environment in China. For example, N-only fertilizer use in corn was as low as 2.2–7.3 g N m−2 yr−1 in the Northeast China Plain in 2018, which is known to have fertile soils (e.g., Jilin and Heilongjiang, according to CSY data), while it was as high as 15.3–16.7 g N m−2 yr−1 in less fertile soils in the northwestern region in 2018 (e.g., Shannxi and Gansu, according to CSY data). This is consistent with a previous study, which revealed that 20 %–40 % of the grain crops were over-fertilized in China, based on national survey data collected from 2002 to 2005 (Yan et al., 2017). Although the overuse of N fertilizer in grain crops has been widely reported in China (Wu et al., 2018; Zhang et al., 2015; Ren et al., 2021), our study indicates that the overuse might be more intensive in the production of vegetables and fruit, particularly in drier regions where the demand for water and fertilizers is high. A former study also suggested that the vegetables and fruit had a 2.4–6.2 times higher N fertilizer demand in China (38.8–55.5 g N m−2 yr−1) than in Europe and the U.S. (9.6–16.5 g N m−2 yr−1), resulting in a much lower N fertilizer use efficiency in these crops (one-half to one-third of that in the U.S.; Wu et al., 2016). Since vegetables and orchard areas account for 20 % of the total planted area in China (CAY data in 2018), such high N fertilizer use rates, together with the water use, imply a large potential of economic and environmental benefits from optimizing fertilizer use in these non-grain crops.
5.3 Spatial trends in nitrogen fertilizer use
In China, which is a large country with varying geographic and climatic features, the N fertilizer use rates in crops are largely dependent on the types of the crop and the location in which the crops are grown. In addition, how the cropland is being managed also plays a greater role in N fertilizer use rates. Previous studies revealed that the optimal level of the N fertilizer use rates for crops was at around 15–20 g N m−2 yr−1 in China (Zhu and Chen, 2002; Ju et al., 2004, 2009). In our study, the N fertilizer use rates maps revealed some of the widespread, over-fertilized cropland regions in China (Fig. 7l). Surprisingly, the most over-fertilized provinces, which are majorly distributed in central and southeastern China, received more than 2-fold of the suggested optimal N fertilizer use rates (Fig. 7l). The N fertilizer use rates have become an important driver directly determining the estimations of the crop productions and the GHG emissions accounting in different parts of the world (Tian et al., 2018). Hence, the reconstructed N fertilizer use data in our study are potentially useful to improve the accounting of the GHG budget in China, especially the N2O emissions. In a previous study, we found that the widely used, FAO-based global land use and land cover data (e.g., HYDE and LUH2) overestimated the cropland distribution in low-coverage areas but underestimated the cropland percentage in high-coverage areas (Yu et al., 2021, 2022). This might explain the differences in the N fertilizer use rates between our reconstructed data and other products, such as Potter et al. (2010), which were released previously. When we presented the FAO-based cropland maps (Fig. 8e, h) to the N fertilizer use product of Potter et al. (2010) and Tian et al. (2022) with overestimated low-coverage croplands in China, the maps clearly reflected diluted, low N fertilizer use rates in more intensively cultivated plains. Recently, the international modeling community has initiated a global N2O Model Intercomparison Project (NMIP) to quantify the N2O gas emissions from the land surface using 10 state-of-the-art terrestrial biosphere models (Tian et al., 2018), where the HYDE cropland and HYDE-based N fertilizer use data were selected as the forcing data in simulation of underrated/overrated N2O emissions in high/low cropland coverage areas (Lu and Tian, 2017; Tian et al., 2018; Wang et al., 2020a). We consider that our reconstructed N fertilizer use data will be vital for quantifying the N2O gas emissions from China's croplands in future and substantially help mitigate global warming.
We would like to reiterate that the provincial N fertilizer use rates reported in the Cost–Benefit Report of the National Agricultural Products (CBR) were the most important reference we adopted while reconstructing the N fertilizer use maps in this study. Nonetheless, for each province, there were cases where a few crop types were always thinly planted but missed the reporting of the N fertilizer use rates. For those missing crop types reported in each province, we filled the gap by assuming the N fertilizer use rates to be close to the nearby province or equal to the national average (see the method section). However, the N fertilizer use rates might greatly differ from our assumptions because farmers' habits largely varied. Besides, the N fertilizer input contributed from compound fertilizers was not directly available, which also introduced uncertainty in the total N fertilizers applied for each crop. Thus, we could have improved the N fertilizer use maps if we had obtained more detailed surveying data. The distribution of the crop types which missed reporting at the sub-county levels and in some years increased uncertainty in the reconstruction further. We derived the crop rotation information from national surveys of 2341 counties carried out in 1980, 1990, 2000, 2002, and 2011 (Liu et al., 2018). As these data were not sufficient, we assumed that the crop types planted between surveyed years were relatively stable, and the information of the nearest year was used as substitution. Therefore, there might have been higher uncertainties in the N fertilizer use rates reconstruction in non-surveyed years. Despite such limitations, our reconstructed data, developed from improved gridded maps and crop-specific statistical information, are advantageous in depicting the N fertilizer use and estimating the GHG (N2O emission) budgets in China's croplands.
The supplement related to this article is available online at: https://doi.org/10.5194/essd-14-5179-2022-supplement.
ZY designed the work. JL collected the data and performed the data entry. ZY analyzed the data and wrote the paper. GRK provided comments to improve the paper.
The contact author has declared that none of the authors has any competing interests.
Publisher's note: Copernicus Publications remains neutral with regard to jurisdictional claims in published maps and institutional affiliations.
We greatly acknowledge the data entry assistance from Yanli Dong. We thank Kazuya Nishina and the two anonymous reviewers, for their constructive suggestions that improved the paper. Zhen Yu acknowledges support from the Jiangsu Distinguished Professor program of the People's Government of Jiangsu Province.
This research has been supported by the National Natural Science Foundation of China (grant no. 32001166), the Natural Science Foundation of Jiangsu Higher Education Institution of China (grant no. 20KJB170013), and the Startup Foundation for Introducing Talent of NUIST (grant no. 2019r059).
This paper was edited by Hao Shi and reviewed by Kazuya Nishina and two anonymous referees.
Bouwman, A. F., Boumans, L. J. M., and Batjes, N. H.: Modeling global annual N2O and NO emissions from fertilized fields, Global Biogeochem. Cy., 16, 1080, https://doi.org/10.1029/2001gb001812, 2002.
Chen, C. X., Liu, Z. J., Chen, Z. J., Huo, B. Q., and Zhou, J. B.: Evaluation the situation of fertilization and soil fertility in new and old Apple orchards of Loess Plateau, Chinese J. Soil Sci., 49, 1144–1149, 2018.
Chen, Y., Zhang, X., Yang, X., Lv, Y., Wu, J., Lin, L., Zhang, Y., Wang, G., Xiao, Y., Zhu, X., Yu, X., and Peng, H.: Emergy evaluation and economic analysis of compound fertilizer production: A case study from China, J. Clean. Prod., 260, 121095, https://doi.org/10.1016/j.jclepro.2020.121095, 2020.
Domagalski, J., Lin, C., Luo, Y., Kang, J., Wang, S., Brown, L. R., and Munn, M. D.: Eutrophication study at the Panjiakou-Daheiting Reservoir system, northern Hebei Province, People's Republic of China: Chlorophyll-a model and sources of phosphorus and nitrogen, Agr. Water Manage., 94, 43–53, https://doi.org/10.1016/j.agwat.2007.08.002, 2007.
Erisman, J. W., Sutton, M. A., Galloway, J., Klimont, Z., and Winiwarter, W.: How a century of ammonia synthesis changed the world, Nat. Geosci., 1, 636–639, https://doi.org/10.1038/ngeo325, 2008.
FAOSTAT (Food and Agriculture Organization Corporate Statistical Database): FAO online database, http://faostat.fao.org (last access: 25 May 2022), 2018.
Galloway, J. N., Dentener, F. J., Capone, D. G., Boyer, E. W., Howarth, R. W., Seitzinger, S. P., Asner, G. P., Cleveland, C. C., Green, P. A., Holland, E. A., Karl, D. M., Michaels, A. F., Porter, J. H., Townsend, A. R., and Vörösmarty, C. J.: Nitrogen cycles: Past, present, and future, Biogeochemistry, 70, 153–226, https://doi.org/10.1007/s10533-004-0370-0, 2004.
Gao, M.: Studies on Current Situation of Fertilization and Optimization of Fertilization Model of Peach or Chard at Mountainous Area in Mid-Shandong, Shandong Agricultural University, 2010.
Gellings, C. and Parmenter, K.: Energy efficiency in fertilizer production and use, in: Knowledge for Sustainable Development, edited by: Gellings, B., Encyclopedia of Life Support Systems (EOLSS), EOLLS Publishers, Oxford, UK, 2004.
Guo, J. H., Liu, X. J., Zhang, Y., Shen, J. L., Han, W. X., Zhang, W. F., Christie, P., Goulding, K. W. T., Vitousek, P. M., and Zhang, F. S.: Significant acidification in major chinese croplands, Science, 327, 1008–1010, https://doi.org/10.1126/science.1182570, 2010.
Hou, M.-Y., Li, Z., Wang, Z.-W., Yang, D.-L., Wang, L.-L., Xiu, W.-M., and Zhao, J.-N.: Estimation of fertilizer usage from main crops in China, J. Agric. Resour. Environ., 34, 360–367, 2017.
Houlton, B. Z., Almaraz, M., Aneja, V., Austin, A. T., Bai, E., Cassman, K. G., Compton, J. E., Davidson, E. A., Erisman, J. W., Galloway, J. N., Gu, B., Yao, G., Martinelli, L. A., Scow, K., Schlesinger, W. H., Tomich, T. P., Wang, C., and Zhang, X.: A World of Cobenefits: Solving the Global Nitrogen Challenge, Earth's future, 7, 865–872, https://doi.org/10.1029/2019EF001222, 2019.
Huang, J., Hu, R., Cao, J., and Rozelle, S.: Training programs and in-the-field guidance to reduce China's overuse of fertilizer without hurting profitability, J. Soil water Conserv., 63, 165A–167A, https://doi.org/10.2489/63.5.165a, 2008.
Huang, S., Tang, J., Li, C., Zhang, H., and Yuan, S.: Reducing potential of chemical fertilizers and scientific fertilization countermeasure in vegetable production in China, J. Plant Nutr. Fertil., 23, 1480–1493, 2017.
Huang, Y. and Tang, Y.: An estimate of greenhouse gas (N2O and CO2) mitigation potential under various scenarios of nitrogen use efficiency in Chinese croplands, Glob. Chang. Biol., 16, 2958–2970, https://doi.org/10.1111/j.1365-2486.2010.02187.x, 2010.
Ju, X., Liu, X., Zhang, F., and Roelcke, M.: Nitrogen fertilization, soil nitrate accumulation, and policy recommendations in several agricultural regions of China, AMBIO, 33, 300–305, https://doi.org/10.1579/0044-7447-33.6.300, 2004.
Ju, X. T., Xing, G. X., Chen, X. P., Zhang, S. L., Zhang, L. J., Liu, X. J., Cui, Z. L., Yin, B., Christie, P., Zhu, Z. L., and Zhang, F. S.: Reducing environmental risk by improving N management in intensive Chinese agricultural systems, P. Natl. Acad. Sci. USA, 106, 3041–3046, https://doi.org/10.1073/pnas.0813417106, 2009.
Kahrl, F., Li, Y., Su, Y., Tennigkeit, T., Wilkes, A., and Xu, J.: Greenhouse gas emissions from nitrogen fertilizer use in China, Environ. Sci. Policy, 13, 688–694, https://doi.org/10.1016/j.envsci.2010.07.006, 2010.
Liang, S.: Studies on NPK fertilization status and the potential of reducing application rate in major citrus planting regions of China, Huazhong Agricultural University, 2017.
Liu, J., Kuang, W., Zhang, Z., Xu, X., Qin, Y., Ning, J., Zhou, W., Zhang, S., Li, R., Yan, C., Wu, S., Shi, X., Jiang, N., Yu, D., Pan, X., and Chi, W.: Spatiotemporal characteristics, patterns, and causes of land-use changes in China since the late 1980s, J. Geogr. Sci., 24, 195–210, https://doi.org/10.1007/s11442-014-1082-6, 2014.
Liu, L. and Greaver, T. L.: A review of nitrogen enrichment effects on three biogenic GHGs: The CO2 sink may be largely offset by stimulated N2O and CH4 emission, Ecol. Lett., 12, 1103–1117, https://doi.org/10.1111/j.1461-0248.2009.01351.x, 2009.
Liu, Z., Yang, P., Wu, W., and You, L.: Spatiotemporal changes of cropping structure in China during 1980–2011, J. Geogr. Sci., 28, 1659–1671, https://doi.org/10.1007/s11442-018-1535-4, 2018.
Lu, C. and Tian, H.: Global nitrogen and phosphorus fertilizer use for agriculture production in the past half century: shifted hot spots and nutrient imbalance, Earth Syst. Sci. Data, 9, 181–192, https://doi.org/10.5194/essd-9-181-2017, 2017.
Lu, S., Yan, Z., Chen, Q., and Zhang, F.: Evaluation of conventional nitrogen and phosphorus fertilization and potential environmental risk in intensive orchards of north China, J. Plant Nutr., 35, 1509–1525, 2012.
McLaughlin, N. B.: Comparison of energy inputs for inorganic fertilizer and manure based corn production, Can. Biosyst. Eng./Le Genie des Biosyst. au Canada, 42, 2000.
Melillo, J. M., Kicklighter, D. W., Tian, H., and Butler, S.: Fertilizing Change: Carbon-Nitrogen Interactions and Carbon Storage in Land Ecosystems, in: Handbook of Climate Change and Agroecosystems: Impact, Adaptation and Mitigation, edited by: Hillel, D. and Rosenzweig, C., Imperial College Press, London, England, https://doi.org/10.1142/9781848166561_0003, 2010.
Myhre, G., Shindell, D., Breon, F.-M., Collins, W., Fuglestvedt, J., Huang, J., and Zhang, H.: Anthropogenic and natural radiative forcing, in: Climate Change 2013 the Physical Science Basis: Working Group I Contribution to the Fifth Assessment Report of the Intergovernmental Panel on Climate Change, Cambridge University Press, Cambridge, United Kingdom and New York, NY, USA, https://doi.org/10.1017/CBO9781107415324.018, 2013.
Naughton, B. J.: The Chinese economy: Transitions and growth, MIT press, London, England, ISBN 13 978-0262640640, 2006.
Nishina, K., Ito, A., Hanasaki, N., and Hayashi, S.: Reconstruction of spatially detailed global map of and application in synthetic nitrogen fertilizer, Earth Syst. Sci. Data, 9, 149–162, https://doi.org/10.5194/essd-9-149-2017, 2017.
Potter, P., Ramankutty, N., Bennett, E. M., and Donner, S. D.: Characterizing the spatial patterns of global fertilizer application and manure production, Earth Interact., 14, 1–22, https://doi.org/10.1175/2009EI288.1, 2010.
Ren, C., Jin, S., Wu, Y., Zhang, B., Kanter, D., Wu, B., Xi, X., Zhang, X., Chen, D., Xu, J., and Gu, B.: Fertilizer overuse in Chinese smallholders due to lack of fixed inputs, J. Environ. Manage., 293, 112913, https://doi.org/10.1016/j.jenvman.2021.112913, 2021.
Shang, Z., Zhou, F., Smith, P., Saikawa, E., Ciais, P., Chang, J., Tian, H., Del Grosso, S. J., Ito, A., Chen, M., Wang, Q., Bo, Y., Cui, X., Castaldi, S., Juszczak, R., Kasimir, Å., Magliulo, V., Medinets, S., Medinets, V., Rees, R. M., Wohlfahrt, G., and Sabbatini, S.: Weakened growth of cropland-N2O emissions in China associated with nationwide policy interventions, Glob. Chang. Biol., 25, 3706–3719, https://doi.org/10.1111/gcb.14741, 2019.
Shcherbak, I., Millar, N., and Robertson, G. P.: Global metaanalysis of the nonlinear response of soil nitrous oxide (N2O) emissions to fertilizer nitrogen, P. Natl. Acad. Sci. USA, 111, 9199–9204, https://doi.org/10.1073/pnas.1322434111, 2014.
Strokal, M., Ma, L., Bai, Z., Luan, S., Kroeze, C., Oenema, O., Velthof, G., and Zhang, F.: Alarming nutrient pollution of Chinese rivers as a result of agricultural transitions, Environ. Res. Lett., 11, 024014, https://doi.org/10.1088/1748-9326/11/2/024014, 2016.
Sutton, M. A. and Bleeker, A.: Environmental science: The shape of nitrogen to come, Nature, 494, 435–437, https://doi.org/10.1038/nature11954, 2013.
The Ministry of Agriculture of China: “One control, two minus, three basic” governance rural pollution: http://www.chinanews.com/gn/2015/03-20/7146411.shtml (last access: 20 October 2022), 2015.
Tian, H., Melillo, J., Lu, C., Kicklighter, D., Liu, M., Ren, W., Xu, X., Chen, G., Zhang, C., Pan, S., Liu, J., and Running, S.: China's terrestrial carbon balance: Contributions from multiple global change factors, Global Biogeochem. Cy., 25, GB1007, https://doi.org/10.1029/2010GB003838, 2011.
Tian, H., Lu, C., Melillo, J., Ren, W., Huang, Y., Xu, X., Liu, M., Zhang, C., Chen, G., Pan, S., Liu, J., and Reilly, J.: Food benefit and climate warming potential of nitrogen fertilizer uses in China, Environ. Res. Lett., 7, 044020, https://doi.org/10.1088/1748-9326/7/4/044020, 2012.
Tian, H., Yang, J., Lu, C., Xu, R., Canadell, J. G., Jackson, R. B., Arneth, A., Chang, J., Chen, G., Ciais, P., Gerber, S., Ito, A., Huang, Y., Joos, F., Lienert, S., Messina, P., Olin, S., Pan, S., Peng, C., Saikawa, E., Thompson, R. L., Vuichard, N., Winiwarter, W., Zaehle, S., Zhang, B., Zhang, K., and Zhu, Q.: The global N2O model intercomparison project, B. Am. Meteorol. Soc., 99, 1231–1251, https://doi.org/10.1175/BAMS-D-17-0212.1, 2018.
Tian, H., Bian, Z., Shi, H., Qin, X., Pan, N., Lu, C., Pan, S., Tubiello, F. N., Chang, J., Conchedda, G., Liu, J., Mueller, N., Nishina, K., Xu, R., Yang, J., You, L., and Zhang, B.: History of anthropogenic Nitrogen inputs (HaNi) to the terrestrial biosphere: a 5 arcmin resolution annual dataset from 1860 to 2019, Earth Syst. Sci. Data, 14, 4551–4568, https://doi.org/10.5194/essd-14-4551-2022, 2022.
Trost, B., Prochnow, A., Drastig, K., Meyer-Aurich, A., Ellmer, F., and Baumecker, M.: Irrigation, soil organic carbon and N2O emissions. A review, Agronomy for Sustainable Development, 33, 733–749, https://doi.org/10.1007/s13593-013-0134-0, 2013.
Wang, Q., Zhou, F., Shang, Z., Ciais, P., Winiwarter, W., Jackson, R. B., Tubiello, F. N., Janssens-Maenhout, G., Tian, H., Cui, X., Canadell, J. G., Piao, S., and Tao, S.: Data-driven estimates of global nitrous oxide emissions from croplands, Natl. Sci. Rev., 7, 441–452, https://doi.org/10.1093/nsr/nwz087, 2020a.
Wang, S., Zhang, X., Wang, C., Zhang, X., Reis, S., Xu, J., and Gu, B.: A high-resolution map of reactive nitrogen inputs to China, Sci. Data, 7, 1–7, https://doi.org/10.1038/s41597-020-00718-5, 2020b.
Wei, S. and Jiang, Y.: Investigation on Fertilization Status in Apple Orchards of Shandong Province, Shandong Agric. Sci., 44, 77–79, 2012.
Wu, L., Zhang, W., Chen, X., Gui, Z., Fan, M., Chen, Q., and Zhang, F.: Nitrogen fertilizer input and nitrogen use efficiency in Chinese farmland, Soil Fertil. Sci. China, 4, 76–83, 2016.
Wu, Y., Xi, X., Tang, X., Luo, D., Gu, B., Lam, S. K., Vitousek, P. M., and Chen, D.: Policy distortions, farm size, and the overuse of agricultural chemicals in China, P. Natl. Acad. Sci. USA, 115, 7010–7015, 2018.
Yan, X., Jin, J. Y., and Liang, M. Z.: Fertilizer use efficiencies and yield-increasing rates of grain crops in China, Soils, 49, 1067–1077, 2017.
Yang, J. Q.: Measures for pollution remedy and ecological protection in Dianchi Lake, J. Hydraul. Eng., 5, 17–21, 2001.
Yu, Z.: Nitrogen fertilizer use in China from 1952 to 2018, figshare [data set], https://doi.org/10.6084/m9.figshare.21371469.v1, 2022.
Yu, Z. and Lu, C.: Historical cropland expansion and abandonment in the continental U.S. during 1850 to 2016, Glob. Ecol. Biogeogr., 27, 322–333, https://doi.org/10.1111/geb.12697, 2018.
Yu, Z., Lu, C., Tian, H., and Canadell, J. G.: Largely underestimated carbon emission from land use and land cover change in the conterminous US, Glob. Change Biol., 25, 3741–3752, https://doi.org/10.1111/gcb.14768, 2019.
Yu, Z., Jin, X., Miao, L., and Yang, X.: A historical reconstruction of cropland in China from 1900 to 2016, Earth Syst. Sci. Data, 13, 3203–3218, https://doi.org/10.5194/essd-13-3203-2021, 2021.
Yu, Z., Ciais, P., Piao, S., Houghton, R. A., Lu, C., Tian, H., Agathokleous, E., Kattel, G. R., Sitch, S., Goll, D., Yue, X., Walker, A., Friedlingstein, P., Jain, A. K., Liu, S., and Zhou, G.: Forest expansion dominates China's land carbon sink since 1980, Nat. Commun, 13, 1–12, https://doi.org/10.1038/s41467-022-32961-2, 2022.
Zaehle, S., Ciais, P., Friend, A. D., and Prieur, V.: Carbon benefits of anthropogenic reactive nitrogen offset by nitrous oxide emissions, Nat. Geosci., 4, 601–605, https://doi.org/10.1038/ngeo1207, 2011.
Zaituniguli, K., Tuerxun, T., Tu, Z., and Aikebaier, Y.: Effects of Different Fertilizers on Photosynthetic Characteristics and Yield of Sorghum Leaves in Arid Areas, Acta Agric. Boreali-Sinica, 36, 127–134, 2021.
Zhang, L., Zhang, H., and He, X.: Investigation and analysis on nutrient status of soil and leaves in pear orchards of Chongqing, Soil Fertil. Sci. China, 2, 107–115, 2020.
Zhang, S., Gao, P., Tong, Y., Norse, D., Lu, Y., and Powlson, D.: Overcoming nitrogen fertilizer over-use through technical and advisory approaches: A case study from Shaanxi Province, northwest China, Agr. Ecosyst. Environ., 209, 89–99, https://doi.org/10.1016/j.agee.2015.03.002, 2015.
Zhou, F., Shang, Z., Ciais, P., Tao, S., Piao, S., Raymond, P., He, C., Li, B., Wang, R., Wang, X., Peng, S., Zeng, Z., Chen, H., Ying, N., Hou, X., and Xu, P.: A new high-resolution N2O emission inventory for China in 2008, Environ. Sci. Technol., 48, 8538–8547, https://doi.org/10.1021/es5018027, 2014.
Zhu, Z. L. and Chen, D. L.: Nitrogen fertilizer use in China – Contributions to food production, impacts on the environment and best management strategies, Nutr. Cycl. Agroecosys., 63, 117–127, https://doi.org/10.1023/A:1021107026067, 2002.
Zong, H.: Studies and comparisons of the Nitrogen fertilizer use efficiency in sugercane industry in China and Autralia, World Agric., 453, 185–193, 2017.