the Creative Commons Attribution 4.0 License.
the Creative Commons Attribution 4.0 License.
 | 04 Jan 2022
Vertical profiles of leaf photosynthesis and leaf traits and soil nutrients in two tropical rainforests in French Guiana before and after a 3-year nitrogen and phosphorus addition experiment
Lore T. Verryckt
Sara Vicca
Leandro Van Langenhove
Clément Stahl
Dolores Asensio
Ifigenia Urbina
Romà Ogaya
Joan Llusià
Oriol Grau
Guille Peguero
Albert Gargallo-Garriga
Elodie A. Courtois
Olga Margalef
Miguel Portillo-Estrada
Philippe Ciais
Michael Obersteiner
Lucia Fuchslueger
Laynara F. Lugli
Pere-Roc Fernandez-Garberí
Helena Vallicrosa
Melanie Verlinden
Christian Ranits
Pieter Vermeir
Sabrina Coste
Erik Verbruggen
Laëtitia Bréchet
Jordi Sardans
Jérôme Chave
Josep Peñuelas
Ivan A. Janssens
Terrestrial biosphere models typically use the biochemical model of Farquhar, von Caemmerer, and Berry (1980) to simulate photosynthesis, which requires accurate values of photosynthetic capacity of different biomes. However, data on tropical forests are sparse and highly variable due to the high species diversity, and it is still highly uncertain how these tropical forests respond to nutrient limitation in terms of C uptake. Tropical forests often grow on soils low in phosphorus (P) and are, in general, assumed to be P rather than nitrogen (N) limited. However, the relevance of P as a control of photosynthetic capacity is still debated. Here, we provide a comprehensive dataset of vertical profiles of photosynthetic capacity and important leaf traits, including leaf N and P concentrations, from two 3-year, large-scale nutrient addition experiments conducted in two tropical rainforests in French Guiana. These data present a unique source of information to further improve model representations of the roles of N, P, and other leaf nutrients in photosynthesis in tropical forests. To further facilitate the use of our data in syntheses and model studies, we provide an elaborate list of ancillary data, including important soil properties and nutrients, along with the leaf data. As environmental drivers are key to improve our understanding of carbon (C) and nutrient cycle interactions, this comprehensive dataset will aid to further enhance our understanding of how nutrient availability interacts with C uptake in tropical forests. The data are available at https://doi.org/10.5281/zenodo.5638236 (Verryckt, 2021).
- Article
(3012 KB) - Full-text XML
- BibTeX
- EndNote


Tropical forests play a significant role in the global carbon (C) cycle, contributing more than one-third of global terrestrial gross primary productivity (GPP) (Beer et al., 2010; Malhi, 2010). To obtain accurate estimations of the global C budgets, a thorough understanding of the functioning of these tropical forests is thus important. It is still highly uncertain how these tropical forests, and in particular lowland tropical forests, respond to nutrient limitation and to global change in terms of C uptake (Fleischer et al., 2019; Wieder et al., 2015).
Leaf photosynthetic capacity is the primary driver of C uptake, and its accurate representation in terrestrial biosphere models (TBMs) is essential for robust projections of C stocks and fluxes under global change scenarios. Photosynthesis in C3 species is typically represented in nearly every major large-scale TBM by the Farquhar, von Caemmerer, and Berry (FvCB) model of photosynthesis (Farquhar et al., 1980; von Caemmerer and Farquhar, 1981).
The FvCB model determines photosynthesis (A) by the most limiting of two processes: Rubisco activity and electron transport. Empirical studies to determine the key parameters of these two processes (i.e., the maximum rate of carboxylation, Vcmax, and the maximum electron transport rate, Jmax) and to test empirically their limitations on the leaf and canopy scale are necessary for obtaining the data required for parameterizing the FvCB model (Medlyn et al., 2015). Plant trait databases, now widely available, offer an excellent opportunity for parameterizing models. However, data on tropical forests are sparse and highly variable due to the huge species diversity (Rogers, 2014).
Moreover, empirical studies on leaf photosynthesis and leaf traits in tropical forests have mainly focused on upper-canopy leaves (i.e., Bahar et al., 2016; Berry and Goldsmith, 2020; Rowland et al., 2015) as a trade-off to cover a broader set of tree species in these highly diverse tropical forests. Subsequently, light and leaf nitrogen (N) profiles are used to upscale leaf- to canopy-level photosynthesis, as is also common practice in temperate and boreal forests (Bonan, 2015). However, the leaf N gradient is shallower than the light gradient (Bonan, 2015), and accumulating evidence suggests a regulating role of phosphorus (P) for photosynthesis in tropical trees growing on low-P soils (Walker et al., 2014; Mo et al., 2019; Norby et al., 2017; Bahar et al., 2016). Consequently, vertical variation in leaf traits within the canopy of tropical forests is often not accounted for in a proper way by TBMs.
Environmental drivers are key to improve our understanding of C and nutrient cycle interactions and our ability to model them. Climate data are often directly available at high spatial resolution and at the global scale from databases such as WorldClim (Ruiz-Benito et al., 2020), while observations of soil properties and soil nutrient availability are often missing (Vicca et al., 2018). Soil variables have been shown to be strong predictors of leaf traits in higher plants (Maire et al., 2015). Comprehensive soil data, including soil properties such as texture and pH, as well as important nutrients, are needed to further enhance our understanding of how and why nutrient availability interacts with C uptake in tropical ecosystems and their responses to global environmental change (Vicca et al., 2018).
As most tropical forests are growing on highly weathered soils and contain N-fixing plants and free-living organisms, the widely accepted ecological paradigm states that they tend to be limited by P rather than by N (Wright et al., 2018; Walker and Syers, 1976). Nutrient addition experiments are a great asset to offset possible nutrient limitations and to see how the system reacts (Vitousek and Howarth, 1991). Long-term nutrient addition experiments are important to study the role of leaf nutrients in key role processes such as photosynthesis. However, in tropical forests only a few large-scale nutrient addition experiments have been carried out, and the results are ambiguous (Wright et al., 2018, 2019).
Here, we provide photosynthesis data and a set of leaf traits collected at multiple canopy levels at two forest sites in French Guiana, as well as data on responses to two 3-year, large-scale N and P nutrient addition experiments. Given the importance of ancillary data such as environmental data and soil properties for model and synthesis studies (Vicca et al., 2018), we also provide an extensive dataset of environmental data, including pre-treatment soil properties and nutrients.
2.1 Study site description
The data were collected in French Guiana, South America, at two old-growth, lowland tropical rainforest sites: Paracou and Nouragues (Fig. 1a, b). The climate in French Guyana is tropical wet, characterized by a wet and a dry season due to the north–south movement of the Intertropical Convergence Zone (ITCZ) (Bonal et al., 2008). From December to July, the ITCZ brings heavy rains, which peak in May when monthly rainfall typically exceeds 600 mm. The dry season, with <100 mm rainfall each month, lasts from August to November, with an additional short, dry period in March. Mean annual air temperature is near 26 ∘C for both sites (Bongers et al., 2001; Gourlet-Fleury et al., 2004).
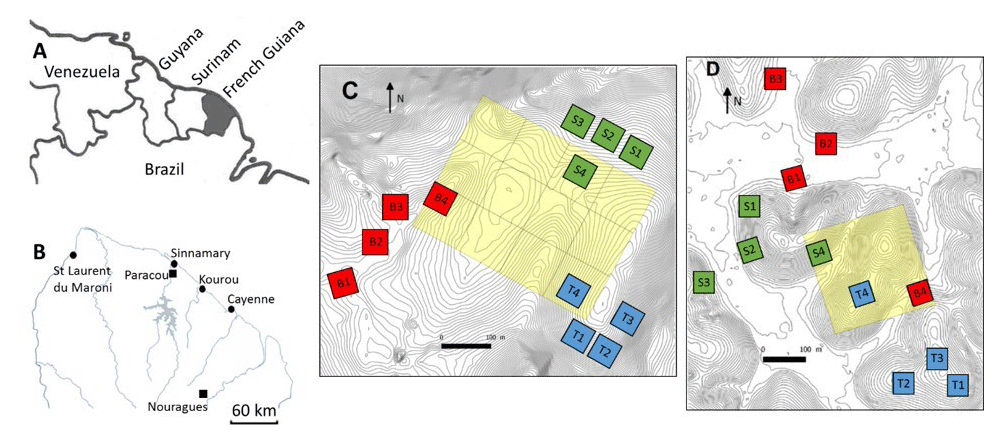
Figure 1Situational map: (a) northeastern part of South America, (b) northern French Guiana with its main cities (circles) and the experimental sites of Paracou and Nouragues (closed squares), (c) the twelve 50×50 m plots of this study at Nouragues–Inselberg, and (d) the twelve 50×50 m plots of this study at Paracou. Adapted from Ferry et al. (2010) and Courtois et al. (2018). Plots are marked by a letter describing the topography (B = bottom, S = slope, T = top) and a number describing the nutrient addition treatment (N, NP, P, 4= control).
The first study site was situated at the Paracou Research Station (5∘16′ N, 52∘54′ W) (Fig. 1b, d) and is characterized by an average annual rainfall of 3100 mm yr−1 (2004–2015) (Aguilos et al., 2019). The average density of trees with a diameter at breast height (DBH) >10 cm is ca. 620 trees per hectare, and tree species richness averages ca. 160 species per hectare (Bonal et al., 2008). The mean canopy height was 35 m, with emergent trees exceeding 40 m. The second study site, the Nouragues Research Station (4∘02′ N, 52∘41′ W) (Fig. 1b, c), is located 120 km south of Cayenne. Here we sampled at two locations, near the Inselberg station (Petit Plateau) and near the Pararé station (COPAS). The Nouragues forest receives approximately 3000 mm rain yr−1, and tree density (DBH >10 cm) averages ca. 535 trees per hectare (Bongers et al., 2001). Tree species richness ranges between 180 and 200 species per hectare. The canopy height varies between 30 and 40 m, with emergent trees reaching 60 m (Van Der Meer et al., 1998).
The soils at Paracou are derived from the Bonidoro series, characterized by schist and sandstones and locally crossed by veins of pegmatite, aplite, and quartzite (Gourlet-Fleury et al., 2004; Epron et al., 2006), whereas the soils of Nouragues have a weathered granite parent material of the Caraibe series (van der Meer and Bongers, 1996; Bongers et al., 2001). According to the USDA texture classification chart, the soils at Paracou range from loamy sand to sandy loam and at Nouragues from sandy loam to silty clay (Van Langenhove et al., 2019). These old and highly weathered soils at both sites are characterized as nutrient-poor Acrisols (FAO, 1998) and are, compared to the generally younger, nutrient-richer soils of western Amazonia, particularly low in P concentration (Table 1) (Hammond, 2005; Grau et al., 2017).
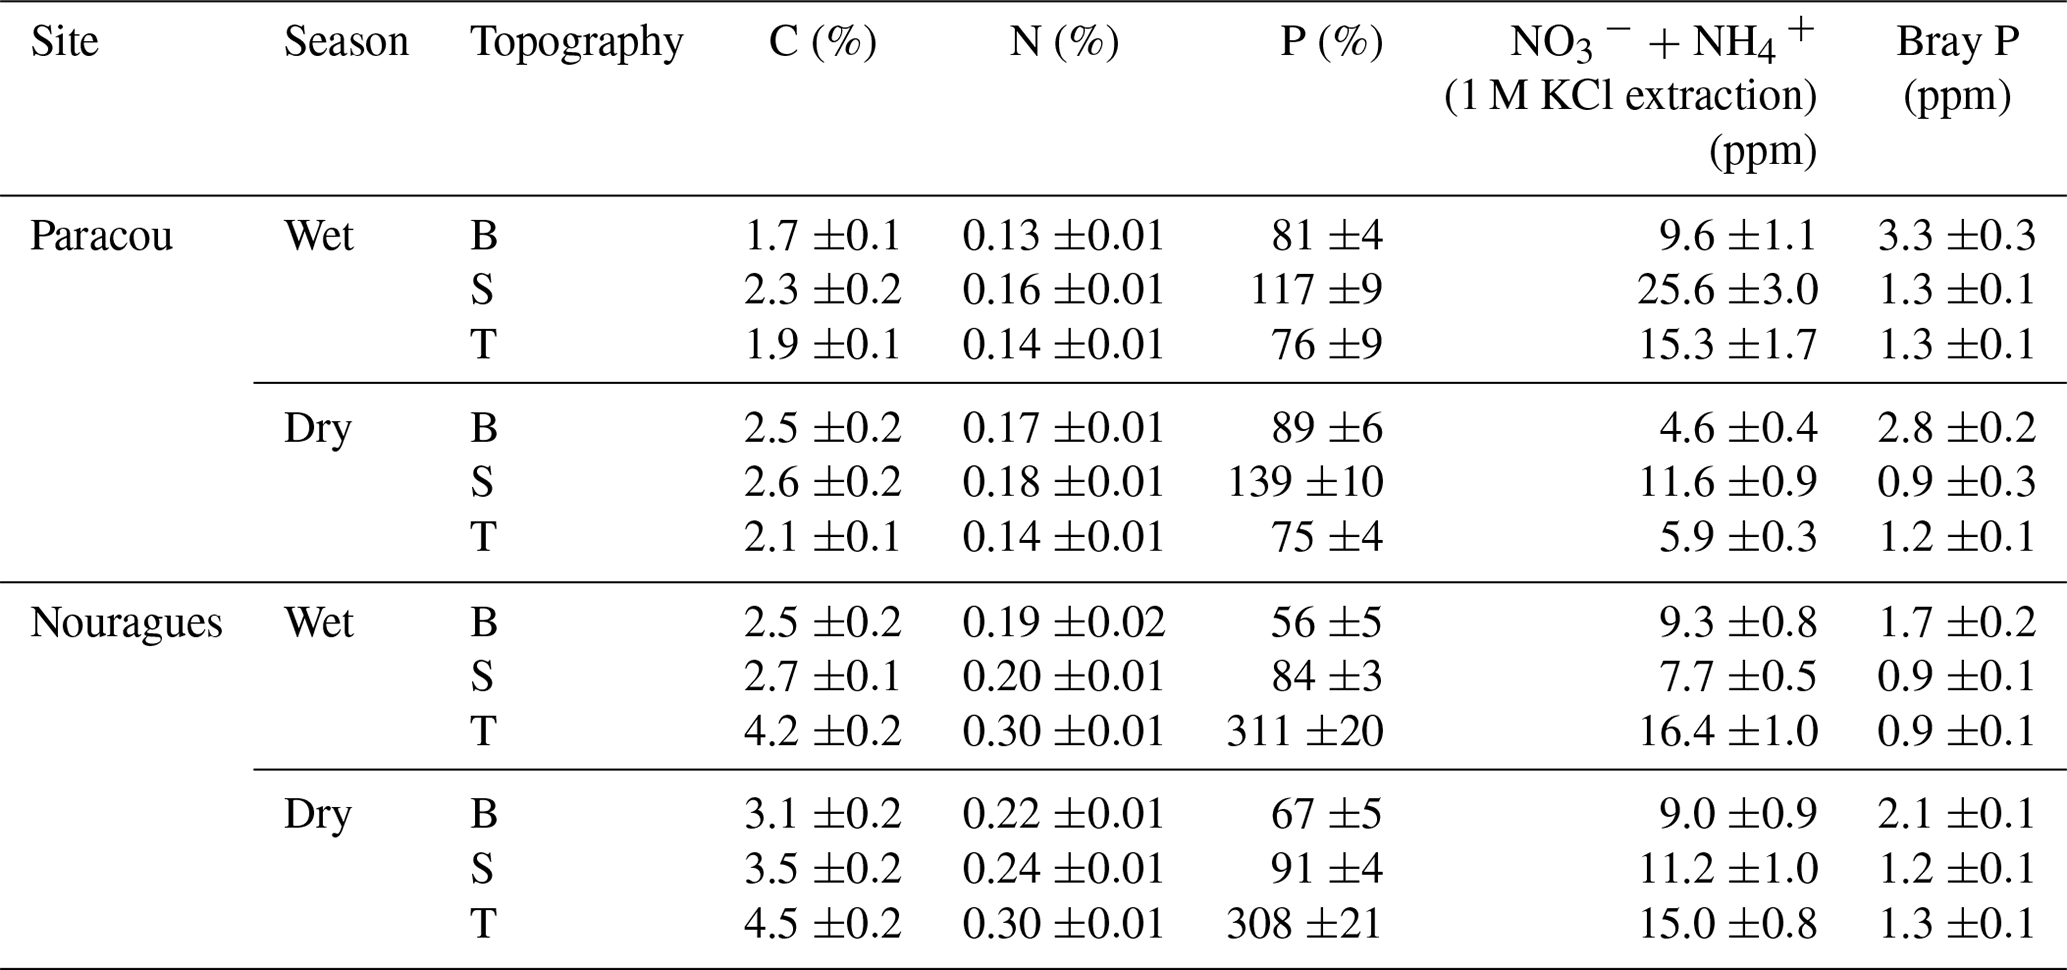
Table 1Surface soil (0–15 cm) total and available nutrient concentrations measured in 2015 in the three landscape positions (topography: B = bottom, S = slope, T = top) and separated by season. Standard errors are shown (n = 20).
At both forest sites, an instrumentation tower is in place at which meteorological measurements and measurements of ecosystem net CO2 exchange with the eddy covariance technique have been carried out on a continuous basis since 2003 in Paracou (Bonal et al., 2008) and since 2014 at Nouragues. The monthly rainfall data measured at the instrumentation towers of Paracou and Nouragues are shown in the dataset.
2.2 Nutrient addition experiment
2.2.1 Setup
In 2015, we set up twelve 50×50 m plots, in three blocks of four plots, along a toposequence at Paracou and Nouragues, resulting in a total of 24 plots. These blocks were located at distinct landscapes: (1) bottom, i.e., just above the creek running through the valley, (2) slope, i.e., the intermediate section of the elevation, and (3) top, i.e., where the slope evens out and becomes the hilltop (Courtois et al., 2018). The valley bottoms and hilltops differ by ca. 20–50 m in elevation over horizontal distances of 200–400 m (Van Langenhove et al., 2019), with maximum altitudes of ca. 70 and 120 m for Paracou and Nouragues, respectively (Courtois et al., 2018).
In October 2016, a field nutrient addition experiment at both sites was initiated and is ongoing to this day. In each block, one plot served as a control plot, and the remaining three plots received one of three nutrient addition treatments (, or +NP). Fertilizer was applied twice per year by hand-broadcasting commercial urea ((NH2)2CO) and/or triple superphosphate (Ca(H2PO4)2) at a rate of 125 kg N ha−1 yr−1 (+N treatment), 50 kg P ha−1 yr−1 (+P treatment), or both amounts together (+NP treatment). These application rates are identical to those in the ongoing nutrient addition experiment in Barro Colorado Nature Monument in Panama, which was initiated in 1998 (Wright et al., 2011), and the Amazon Fertilization Experiment (AFEX) near Manaus in Brazil, initiated in 2017 (Lugli et al., 2021), to enable future comparison of our results. In Paracou, these rates of nutrient addition represent, respectively, 130 % and 250 % of yearly N and P input through litterfall and atmospheric deposition combined (Van Langenhove et al., 2020b).
Leaf and soil sampling took place before (in 2015) and after a 3-year period (in 2019) of the nutrient addition experiment. To avoid border effects of the nutrient addition, these measurements were conducted in the central 20×20 m area within the larger 50×50 m plots.
2.2.2 Fertilizer composition
Within the nutrient addition experiment, N was added as commercial urea ((NH2)2CO) and P as triple superphosphate (Ca(H2PO4)2). The chemical composition of the applied fertilizers was analyzed to know the exact composition. Samples of both fertilizers were dried at 70 ∘C for 48 h, after which they were ground. Total N of the fertilizers was determined by dry combustion using a Skalar Primacs (Skalar Holding, The Netherlands). P2O5 and MgO in mineral acid were determined by an iCAP 7400 radial optical emission spectrometer (Thermo Fisher Scientific, Germany). The ground samples were analyzed with an iCAP 7400 radial optical emission spectrometer (Thermo Fisher Scientific, Germany) to determine the potassium (K), calcium (Ca), and magnesium (Mg) concentrations, as well as the heavy metal concentrations: arsenic (As), cadmium (Cd), chromium (Cr), copper (Cu), iron (Fe), nickel (Ni), lead (Pb), zinc (Zn), and molybdenum (Mo).
3.1 Sampling design
In 2015, we sampled soil to a depth of 30 cm, according to a five-on-dice sampling pattern within the 20×20 m plots (Fig. 2). At each sampling point, we sampled bulk density at a depth of 0–15 and 15–30 cm using an auger with a 15 cm long cylindrical head (8 cm diameter). Additionally, we took three soil cores with a gouge auger (30 cm length, 5 cm diameter). These three cores were split into two depths (0–15 and 15–30 cm), pooled together per depth, and used for gravimetric soil water content determination, soil particle size distribution analysis, and chemical analysis after sieving (<2 mm). We divided the soil into a “surface” layer (0–15 cm) and a “deeper” layer (15–30 cm) instead of sampling by generic horizon because the upper horizon at both sites varies between 0–15 and 0–20 cm depth, while the next horizon often extends to 50 cm depth and beyond (Van Langenhove et al., 2020c; Guitet et al., 2016; Bongers et al., 2001). In 2019, after 3 years of nutrient addition, the soil sampling was repeated. However, these data have not been processed yet and will be made available through publication as soon as possible.
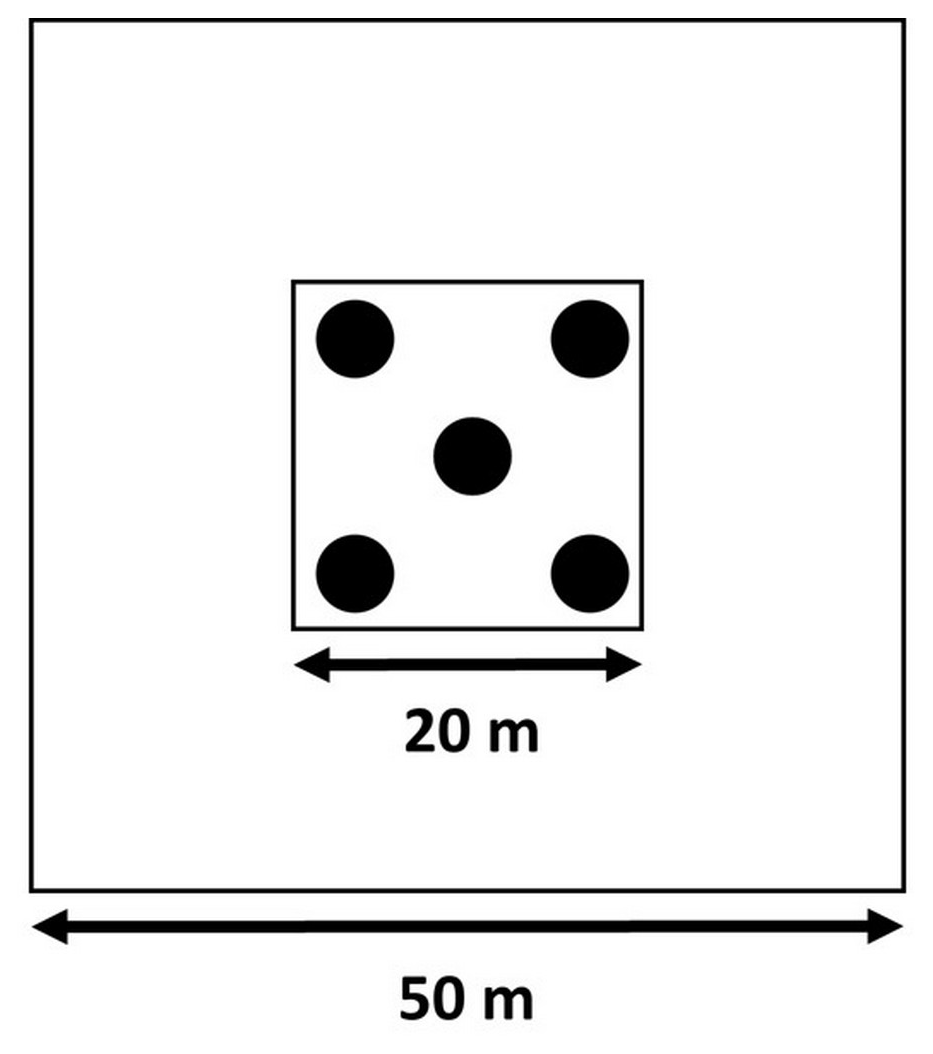
Figure 2Soil sampling design according to a five-on-dice pattern, performed in the central 20×20 m area within each of the 50×50 m plots.
3.2 Soil physical properties
3.2.1 Bulk density
We sampled soil bulk density in the wet season of 2015. In each plot, we took five cores at two depths, and these samples were sieved through a 2 mm sieve. We collected the soil fraction, the roots, and the stones, which were dried and weighed separately at 105 ∘C for 24 h. In our database, we report two measures of bulk density: inclusive bulk density is the weight of the dried soil core divided by its volume (i.e., the volume of the auger, 754 cm3), whereas exclusive bulk density is calculated by dividing the total weight of the soil fraction (excluding roots and stones) by the volume of the entire core (i.e., 754 cm3).
3.2.2 Soil particle size distribution
The particle size distribution at plot level was analyzed only in the wet season of 2015, assuming it would not change with seasonality. Therefore, we mixed by hand the five samples per plot that were sieved (<2 mm) after extraction using a gouge auger and analyzed these mixed samples as one composite sample per depth and per plot. We determined the soil particle size distribution using sedimentation with the hydrometer method (Gee and Bauder, 1986) after soil organic matter oxidation with H2O2, as described in protocol 1.3.5 “Soil texture” in the Supporting information S1 “Site characteristics and data management” in Halbritter et al. (2020). Soil particles were dispersed with sodium hexametaphosphate, and the quantity of sand, silt, and clay was determined using a hydrometer.
3.2.3 Soil moisture
The gravimetric soil water content (%) was determined in both the wet and the dry season of 2015. We weighed roughly 10 g of fresh soil, which was then dried at 70 ∘C to constant mass and weighed to obtain the dry mass. The gravimetric water content is calculated as the mass of water (i.e., the difference in mass weight of fresh and dried soil) per mass of dry soil.
3.3 Soil nutrients
3.3.1 Chemical analyses: concentrations and availability
Freshly sieved soil was used for the measurement of pH and the extraction of inorganic N (Ni) and inorganic P (Pi). We measured the soil pH using a pH meter (HI 2210-01, Hanna Instruments, USA) after adding 1 M KCl to the soil in a 1:2.5 w:v ratio and shaking it for 1 h. The same solution was passed through a 42 µm filter, and the filtrate's concentration of NH and NO was determined colorimetrically (SAN continuous flow analyzer, Skalar Inc., The Netherlands). The Pi was extracted with the Olsen P bicarbonate extraction (Olsen et al., 1954) and measured on an iCAP 6300 Duo ICP optical emission spectrometer (Thermo Fisher Scientific, Germany).
Sieved soil samples were dried at 60 ∘C to constant mass and were then ground in a ZM 200 ball mill (Retsch GmbH, Haan, Germany). We extracted Pi from previously dried soil with the Bray P acid fluoride extraction (Bray and Kurtz, 1945), followed by analysis on an iCAP 6300 Duo ICP optical emission spectrometer (Thermo Fisher Scientific, Germany). Water-soluble molybdate (MoO) and phosphate (PO) were determined through resin extraction from previously dried (60 ∘C) soil (Wurzburger et al., 2012). The soil samples were mixed with water in a 1:6 ratio, and five 2 cm2 strips of anion exchange membrane (VWR Chemicals, USA) were added (Van Langenhove et al., 2019; Wurzburger et al., 2012). After stirring this mixture 24 h, the strips were rinsed and eluted with 10 % HNO3. The concentrations of water-soluble MoO and PO were analyzed with an iCAP 6300 Duo ICP optical emission spectrometer (Thermo Fisher Scientific, Germany).
Additionally, we analyzed total macro- and micronutrient concentrations in previously dried soil. Soil C and N concentrations were determined by dry combustion with a Flash 2000 elemental analyzer (Thermo Fisher Scientific, Germany), and total soil C and N were analyzed by EA-IRMS (EA1110, CE Instruments, Milan, Italy), coupled to a Finnigan MAT DELTAplus IRMS (Thermo Fisher Scientific, Germany). The concentrations of P, K, Ca, Mg, sulfur (S), manganese (Mn), sodium (Na), vanadium (V), strontium (Sr), As, Cd, Cr, Cu, Fe, Ni, Pb, Zn, and Mo were obtained by acid digestion in an ultraWAVE digestor (Milestone, Italy), followed by ICP-MS (7500ce model, Agilent Technologies, Tokyo, Japan) analysis.
3.3.2 PRS probes
We used Plant Root Simulator (PRS®) probes (Western Ag Innovations Inc., Saskatoon, CA) to provide proxies for plant available ions in soil solution (Van Langenhove et al., 2020a; Halbritter et al., 2020). These PRS probes are ion exchange resin membranes (IEMs; approximately 5.5×1.6 cm or 17.5 cm2 including both sides of the IEM) held in plastic supports that were vertically inserted into soil with minimal disturbance (Hangs et al., 2004). In each plot, we installed five root exclusion cylinders (RECs) following a five-on-a-dice design to study soil nutrient dynamics in the absence of the root system (Van Langenhove et al., 2020a). RECs were PVC collars inserted 20 cm into the soil to sever all near-surface roots and mycorrhizal fungal hyphae, and they were installed prior to the first soil nutrient measurements in May 2015.
In both the wet (May) and dry (October) season of 2015, we installed four anion and four cation probes, which formed one sample, into each REC. After a period of 2 weeks, the PRS™ probes were removed from the soil, washed with distilled water and shipped to the manufacturer for analysis of the following nutrients: P, K, Ca, Mg, S, Mn, Cd, Cu, Fe, Pb, Zn, nitrate (NO3), ammonium (NH4), boron (B), and aluminum (Al). In situ burial of the PRS™ probes provide a dynamic measure of nutrient flux or nutrient supply rate to an ion sink (Gibson et al., 1985; Casals et al., 1995). The results are thus expressed as the amount of nutrient adsorbed per surface area of IEM during the duration of burial (Qian and Schoenau, 2002). In our study it was expressed as micrograms of nutrient per 10 cm−2 (µ g 10 cm−2) for 2 weeks.
4.1 Tree selection
In each 20×20 m plot at Paracou and Nouragues, we selected five mature trees, of which three were top-canopy species likely dominating the functioning of the plot, and two trees were sub-canopy species. Additionally, we selected 12 trees at the COPAS site near the Pararé station at Nouragues. At Paracou we selected in each 50×50 m plot four species of saplings, defined as a tree <2 m in height, with at least 10 individuals per plot. This resulted in seven sapling species being selected in total and 40 individuals being selected per plot. Overall, we selected 131 trees belonging to 76 different tree species differing in relative abundance (Fig. 3, Table 2).
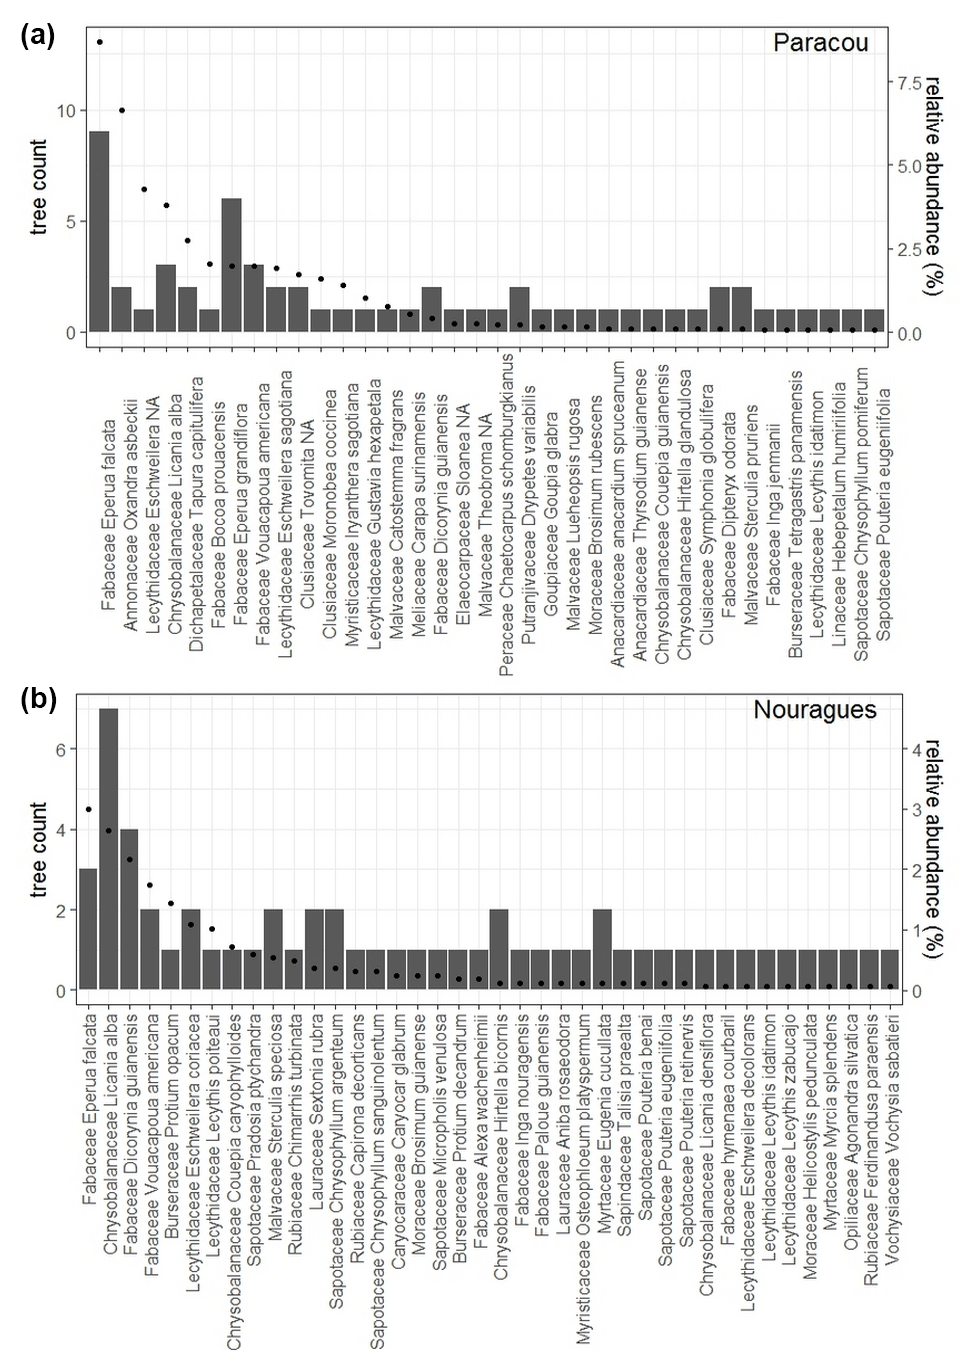
Figure 3Number of mature trees we sampled per species (bars) and the relative abundance for each species (dots) are shown for (a) Paracou and (b) Nouragues. Relative abundance was calculated as the percent composition of each species relative to the total number of that species with all 50×50 m plots at Paracou or Nouragues.
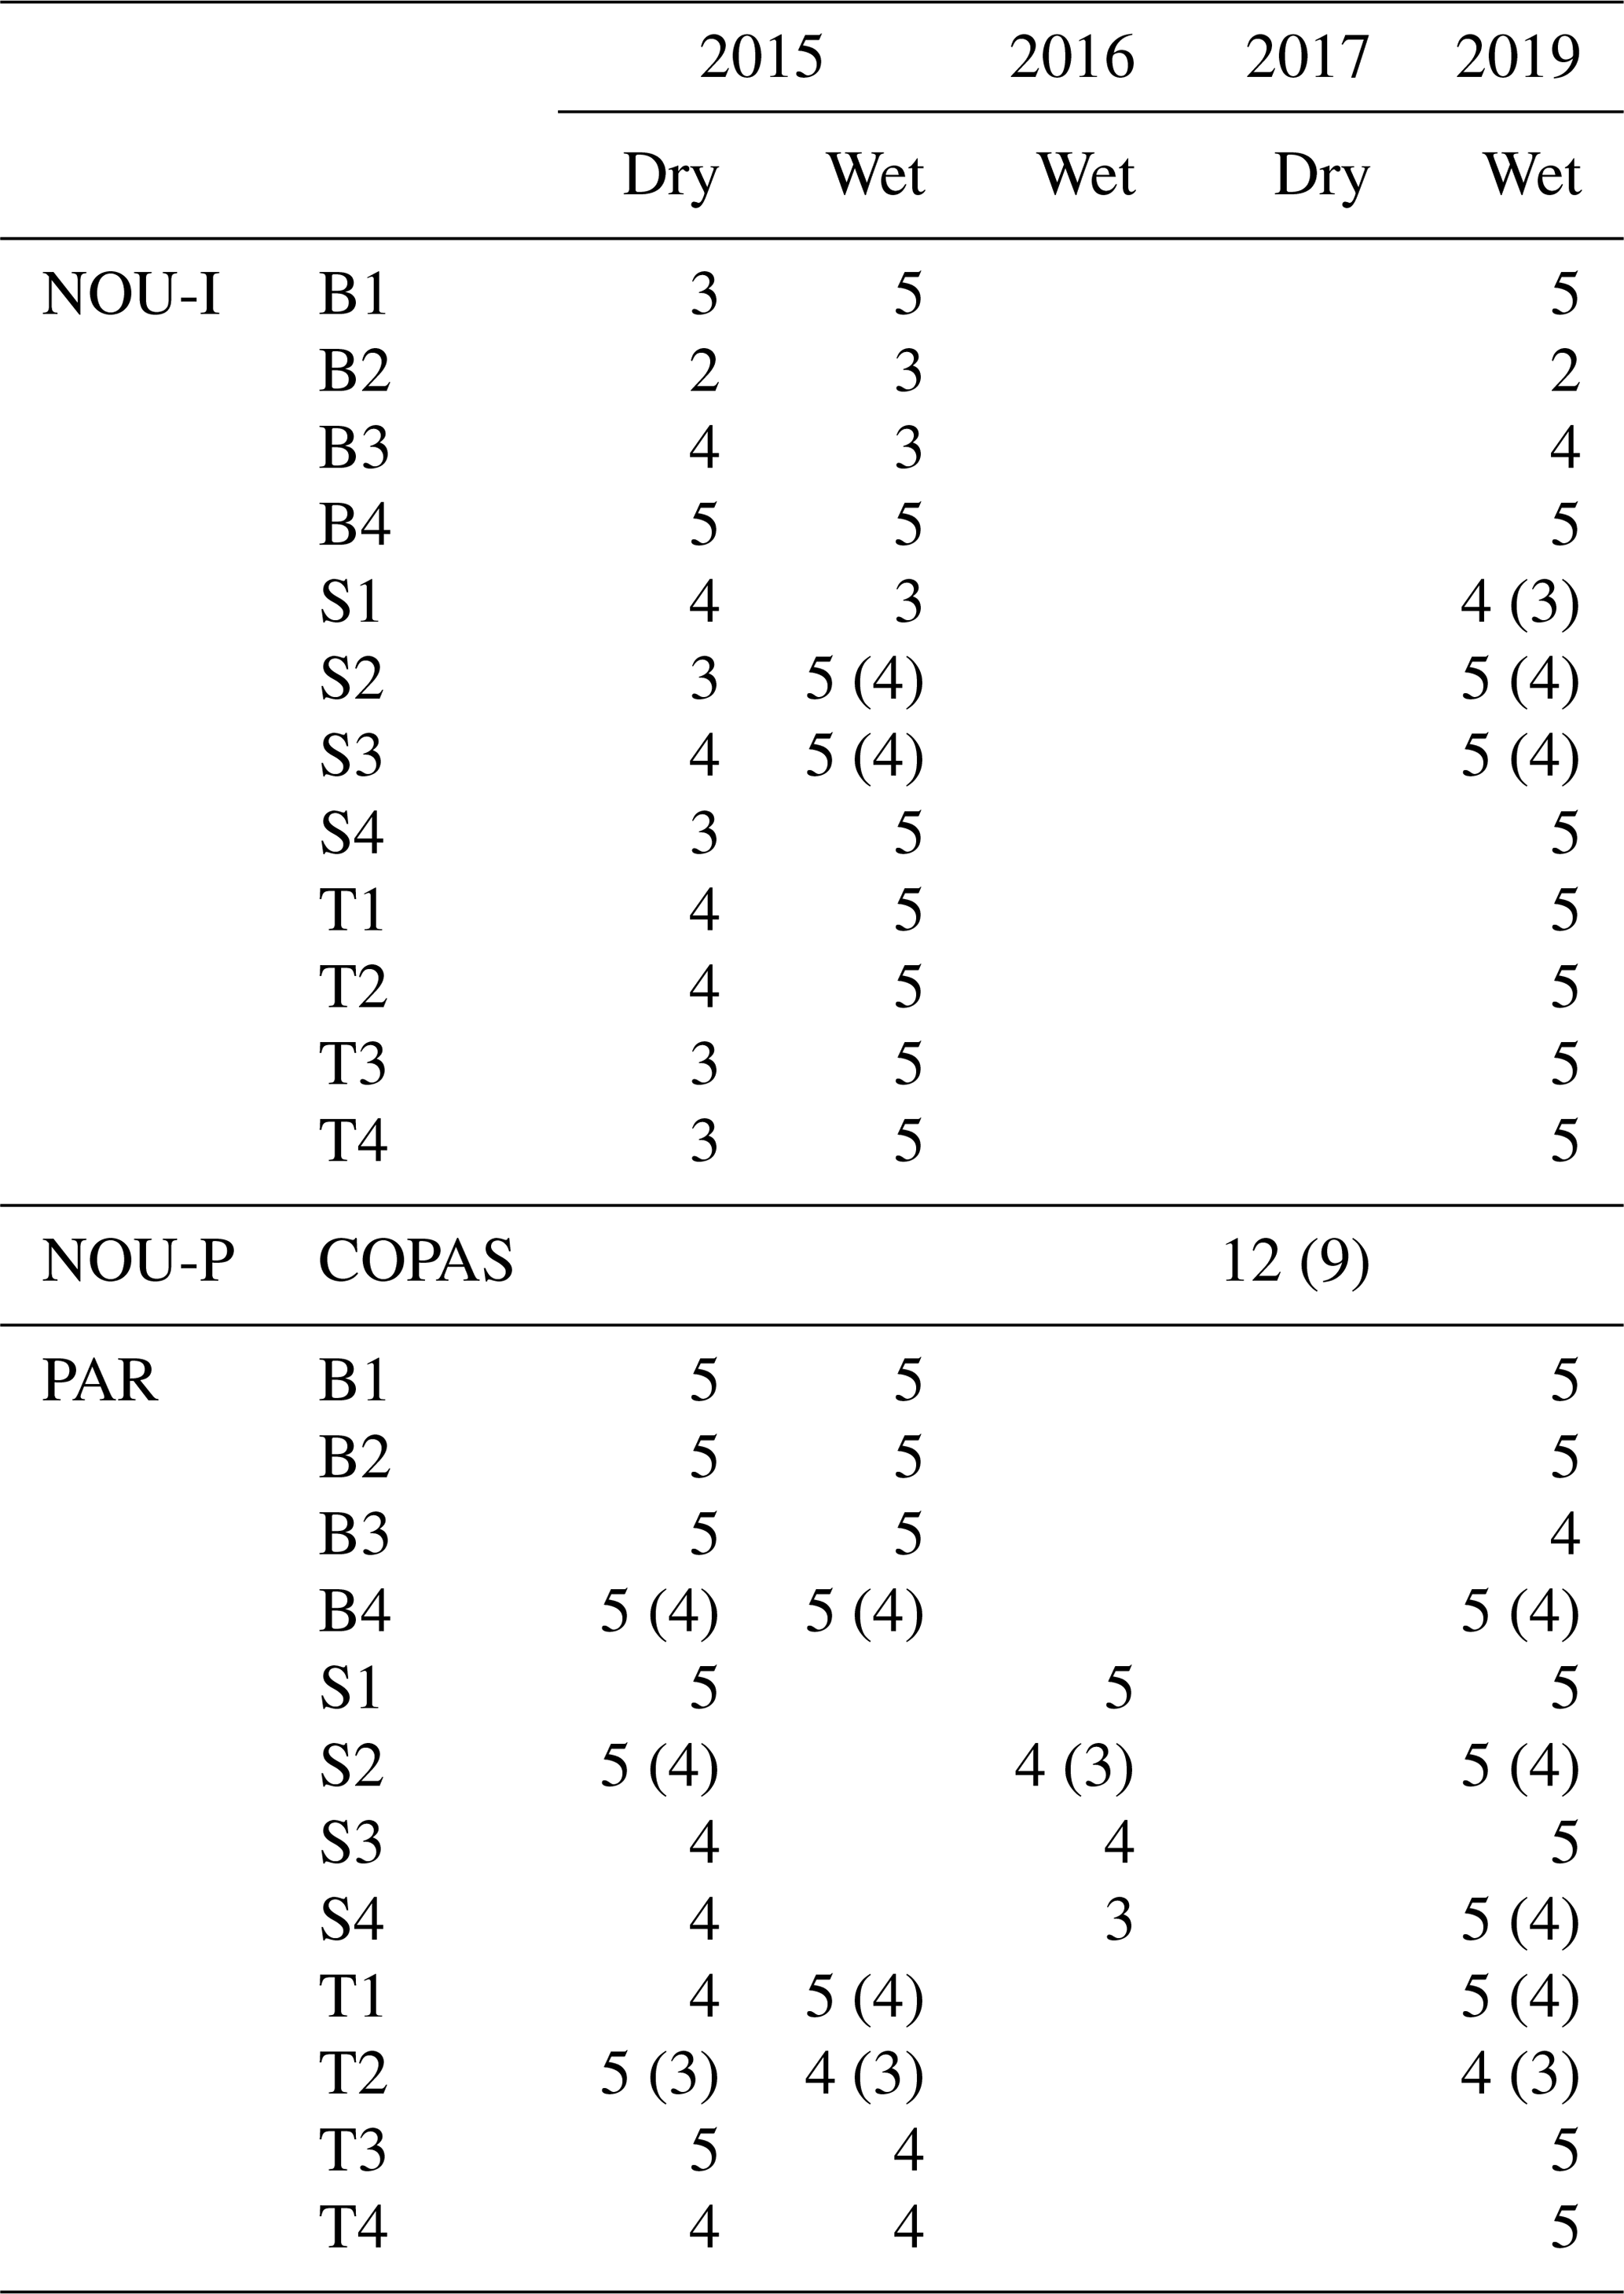
Table 2Overview of the amount of mature trees and species measured in each plot at Nouragues–Inselberg (NOU-I), Nouragues–Pararé (NOU-P) and Paracou (PAR). Values between brackets indicate the amount of different species measured per plot in case this differed from the amount of trees measured per plot. Names of plots are marked by a letter describing the topography (B = bottom, S = slope, T = top) and a number describing the nutrient addition treatment (1 N, 2 NP, 3 P, 4 = control), in agreement with Fig. 1c and d.
4.2 Photosynthesis
4.2.1 Leaf gas exchange
We measured leaf gas exchange measurements using a set of infrared gas analyzers (IRGAs) incorporated into a portable photosynthesis system (LI-6400XT, LI-COR, Lincoln, NE, USA). A leaf was clamped within a chamber with controlled microenvironmental conditions during the measurements, and the device measures the concentration changes of water vapor (H2O) and carbon dioxide (CO2) between incoming and outgoing air. The relative humidity inside the chamber (67.9 % ±0.06) was kept as close to ambient as possible during the measurements, and the airflow rate was set at 500 µmol s−1. The chamber block temperature was controlled to minimize variation in leaf temperature and was set at 30.1±0.9 ∘C.
Pre-treatment measurements of the mature trees were carried out in both the wet (May–June) and dry season (October–November) of 2015 except for the wet season measurements of the plots at Paracou situated at the slope which were measured in June 2016 due to practical constraints. After 3 years of nutrient addition, we repeated the leaf gas exchange measurements of the mature trees in the wet season (May–June) of 2019. We measured leaf gas exchange of leaves collected at two different canopy heights, estimated relative to the top of the canopy: sunlit upper-canopy foliage and shaded lower-canopy foliage.
Branch excision prior to measuring leaf gas exchange was necessary to reach the canopy leaves. The excised branches (ca. 2 m long) were cut by a tree climber and immediately recut under water to restore hydraulic conductivity (Domingues et al., 2010; Dusenge et al., 2015; Rowland et al., 2015; Verryckt et al., 2020b). Photosynthesis measurements of the saplings were carried out on leaves still attached to the trees and were performed in August 2016 (pre-treatment) and August 2017 (1 year of nutrient addition). All photosynthesis measurements were conducted between 09:00 and 16:00 (local time).
4.2.2 Photosynthetic CO2 response curves
Photosynthetic CO2 response curves (Fig. 4) were established by measuring net photosynthetic rates An at different CO2 concentrations by controlling the reference CO2 concentrations while maintaining a constant temperature and photosynthetic photon flux density (PPFD). The An-Ci (Ci, the CO2 concentration of the leaf intercellular spaces) measurements began at the ambient CO2 concentration of 400 ppm. Once a steady state of photosynthesis was reached, the CO2 concentration was reduced stepwise to 50 ppm, then returned to 400 ppm, and thereafter increased to 2000 ppm to obtain a total of 10–14 measurements per leaf. We measured An-Ci curves for one to three leaves per canopy level, resulting in a total of 1708 curves measured (Table 3). The methods used here are described in protocol 2.1.3 “Leaf-scale photosynthesis” in the Supporting information S2 “Carbon and nutrient cycling” in Halbritter et al. (2020). Additionally, we measured leaf dark respiration (Rd) by taking five consecutive measurements on one leaf per branch level after keeping the branch in complete darkness for 30 min.
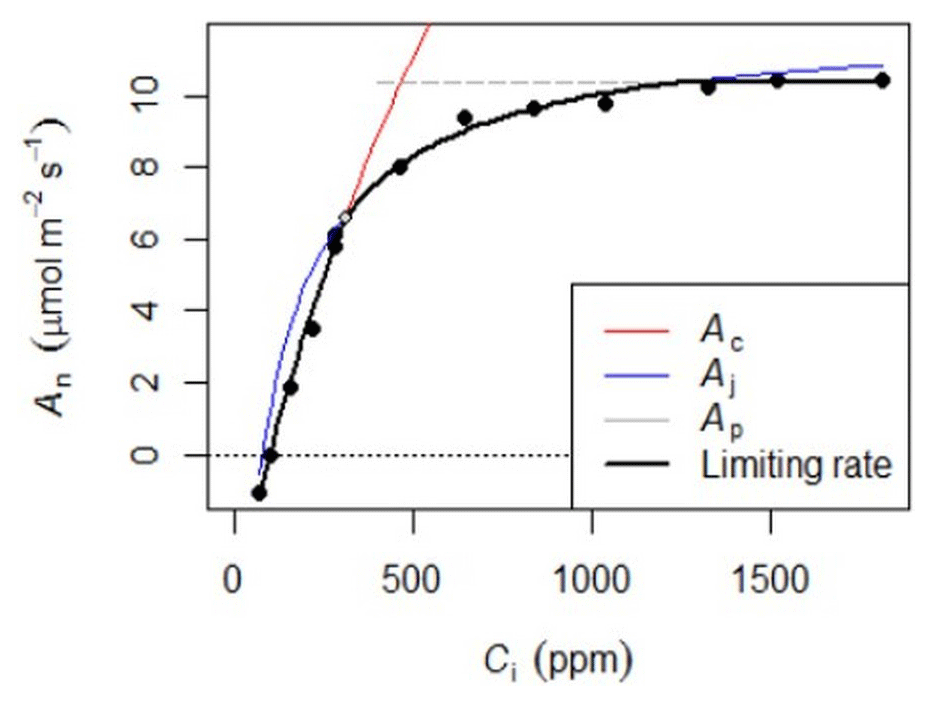
Figure 4Example of the An-Ci response. Net photosynthesis (An) at any given Ci is the minimum of three potential limitations: rubisco (Ac), RuBp (Aj), or TPU (Ap).
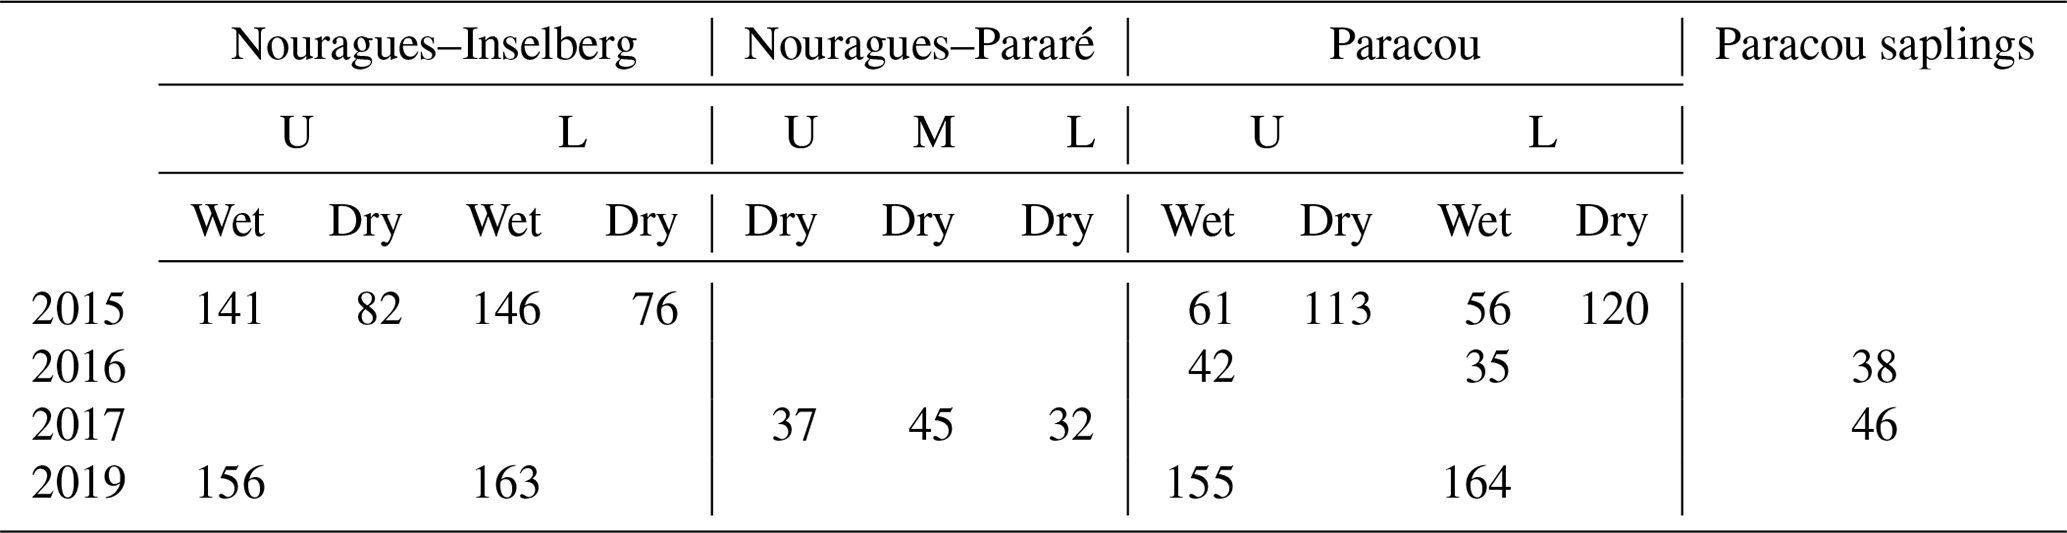
Table 3Overview of the number of An-Ci curves measured in this study. Measurements were carried out in the wet and dry season at different canopy levels (U = sunlit upper-canopy leaves; L = shaded lower-canopy leaves; M = middle-canopy leaves) and at different field sites (Nouragues–Inselberg, Nouragues–Pararé, Paracou). The measurements carried out on saplings instead of on mature canopy trees are mentioned separately. Pre-treatment measurements were carried out in 2015 and 2016, whereas post-treatment measurements (after 1 and 3 years of nutrient addition) were carried out in 2017 and 2019.
The An-Ci curves were carried out at a saturating PPFD level of 500 and 1300 µmol m−2 s−1 for shaded lower-canopy and sunlit upper-canopy leaves, respectively. Verryckt et al. (2020a) showed that 500 µmol m−2 s−1 is below light saturation, and a PPFD level of 800 µmol m−2 s−1 would have been optimal for shaded lower-canopy leaves. Increasing the PPFD level would, however, only result in a small increase in net photosynthesis.
The An-Ci curves present An at any given Ci as the minimum of three potential limitations: rubisco (Vcmax), ribulose 1,5-bisphosphate (Jmax), or triose phosphate use (TPU). These curves were fitted with the FvCB model using the fitaci function from the “Plantecophys” package (Duursma, 2015) in R 3.3.3 (R Core Team, 2019) to obtain the biochemical parameters Vcmax, Jmax, and, when possible, TPU.
4.2.3 Light-saturated photosynthesis (Asat) of saplings
Light-saturated photosynthesis (Asat) and the stomatal conductance (gs) were measured, separately from the An-Ci curves, for the saplings at the Paracou plots situated at the valley bottoms and hilltops. We used the methods described in protocol 2.1.3 “Leaf-scale photosynthesis” and protocol 5.7 “Stomatal conductance” in the Supporting information, respectively, S2 “Carbon and nutrient cycling” and S5 “Stress physiology” in Halbritter et al. (2020). The CO2 concentration was maintained at 400 ppm, and the PPFD was set at 500 µmol m−2 s−1. In 2016, Asat and gs were measured on one leaf per individual and for three to five individuals per species. This resulted in a total of 159 measurements. In 2017, after 1 year of nutrient addition, these measurements were repeated on the same individuals when they survived and on additional saplings, resulting in 195 measurements in total.
4.3 Leaf traits
All leaves used for gas exchange were collected, and, for the mature trees, leaf chlorophyll was estimated by averaging five chlorophyll content measurements from each leaf with a CCM-200 portable chlorophyll meter (Opti-Sciences, Tyngsborough, MA, USA), thereby avoiding major veins and areas of obvious visual damage or disease. A unitless chlorophyll content index (CCI) value was calculated from the ratio of optical absorbance at 655 nm to that at 940 nm. Then, the leaves were scanned to obtain the leaf area, dried for at least 48 h, and weighed. Leaf area was measured with the leaf area meter LI-3100C (LI-COR, Lincoln, NE, USA), which, together with the leaf dry mass, was used to calculate the specific leaf area (SLA). After grinding the dried leaves, leaf nutrient concentrations were determined in accordance with protocol 2.1.6 “Foliar nutrient stoichiometry and resorption” in the Supporting information S2 “Carbon and nutrient cycling” in Halbritter et al. (2020). Leaf C and N concentrations of 10 mg subsamples were determined by dry combustion using a Flash 2000 elemental analyzer (Thermo Fisher Scientific, Germany). Leaf P concentration of 0.1 g subsamples was determined by an acid digestion method (Walinga et al., 1989) on a Skalar SAN continuous flow analyzer and was thereafter analyzed on an iCAP 7400 radial optical emission spectrometer (Thermo Fisher Scientific, Germany) to determine the concentration of leaf K, Ca, Mg, and Mn. Samples were ashed, digested with nitric acid (HNO3), and filtered prior to analysis.
In the wet season of 2015, we also analyzed leaf S, Na, V, Sr, As, Cd, Cr, Cu, Fe, Pb, Zn, and Mo on a model 7500ce ICP-MS spectrometer (Agilent Technologies, Tokyo, Japan) after digestion with HNO3.
For saplings, total phenolic concentration of the leaves was measured using an improved Folin–Ciocalteu assay (Singleton and Rossi, 1965; Marigo, 1973), and total leaf tannin concentration of the leaves was determined with the butanol–HCl method (Porter et al., 1985) modified as in Makkar and Goodchild (1996). The extracts for both phenol and tannin concentrations were determined using a Helios Alpha spectrophotometer (Thermo Spectronic, Cambridge, UK) at 760 and 550 nm, respectively. Both methods are described in detail in Peñuelas et al. (2010).
4.4 Ancillary data
The vertical structure of a tropical rainforest is complex and multi-layered, resulting in great variation in light availability within the canopy (Yoda, 1974). We assessed the light environment of each studied tree by visually estimating the canopy light exposure or Dawkins' crown illumination index (Dawkins, 1958). This index describes a tree's light environment based on a five-point scale ranging from (1) no direct light for suppressed trees to (5) crown fully illuminated for emergent trees (Fig. 5).
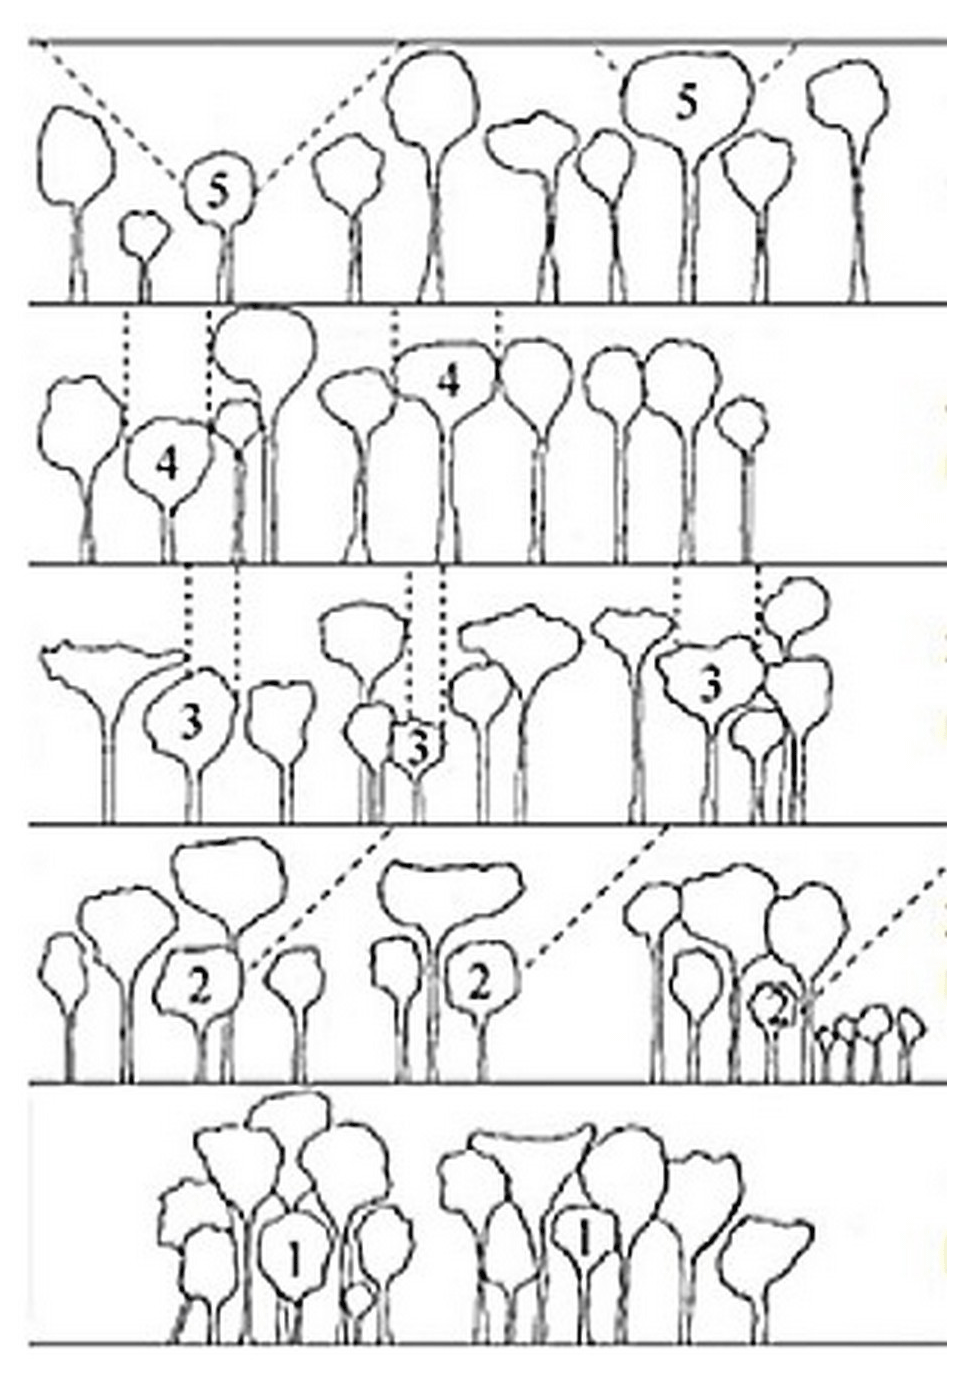
Figure 5Classification of the Dawkins' crown illumination index (adapted from Dawkins, 1958): (1) no direct light, (2) low lateral light, (3) some vertical light (10 %–90 % of the vertical projection of the crown exposed to vertical illumination), (4) crown completely exposed to vertical light but lateral light blocked within some or all of the 90∘ inverted cone encompassing the crown, and (5) crown fully exposed to vertical and lateral illumination.
Sampling height of the mature trees was measured with a Forestry Pro rangefinder (Nikon, Tokyo, Japan) by tree climbers situated at sampling height pointing towards the soil. For saplings, we measured the total height of the tree using a measuring tape, and additionally we measured the diameter at 10 and at 50 cm above surface level. On top of each sapling, we measured leaf area index (LAI) with the LAI-2000 (LI-COR, Lincoln, NE, USA) during periods of overcast sky.
Herbivory rates, i.e., foliar damage by herbivores, of the saplings was estimated as punctual herbivory (%) according to Pirk and Farji-Brener (2012). We visually assessed the missing area of the leaf and assigned each leaf to the following categories: 0 %, 0.1 %–5 %, 5.1 %–25 %, 25.1 %–50 %, and 50.1 %–100 % area consumed. We calculated the percentage of foliar damage per sapling by multiplying the number of leaves of each category by the mid-point foliar damage of each category (i.e., 0 %, 2.5 %, 15 %, 37.5 %, and 75 % respectively) and dividing this result by the total number of leaves per sapling. To test the accuracy of this method, we photographed 106 leaves we visually assessed and compared visual estimations of herbivory in the field using ImageJ. In 90 % of the cases categories were well assigned.
TBMs use plant functional types (PFTs) to represent broad groupings of plant species that share similar characteristics (e.g., growth form) and roles (e.g., photosynthetic pathway) in ecosystem functions (Rogers et al., 2017). Although all TBMs share this approach, they differ from each other in how narrow or broad the PFTs are defined. Depending on the TBM, tropical rainforests belong to “broadleaf evergreen tropical tree”, “tropical tree”, “rainforest”, “evergreen broadleaf tree”, or “broadleaf tree” (Fig. 6a). Although our mean values of photosynthetic capacity of sunlit upper-canopy leaves are in line with those of other tropical rainforest sites (Fig. 6b), many TBMs use estimates for Vcmax that are much higher than the estimates from leaf-level measurements (Fig. 6a). Only three TBMs (Orchidee, O-CN, and Bethy), which have adopted detailed PFTs, are within the range of our measurements. Some TBMs might obtain more accurate estimates of the global C budget by dividing the adopted PFTs into more detailed PFTs. Hybrid, for example, uses the classification “rainforest”, which includes both temperate and tropical rainforest, leading to much higher Vcmax values. This is also true for the PFT “evergreen broadleaf tree” used in CTEM and BIOME-BGC, as well as the PFT “broadleaf tree” used in “JULES”.
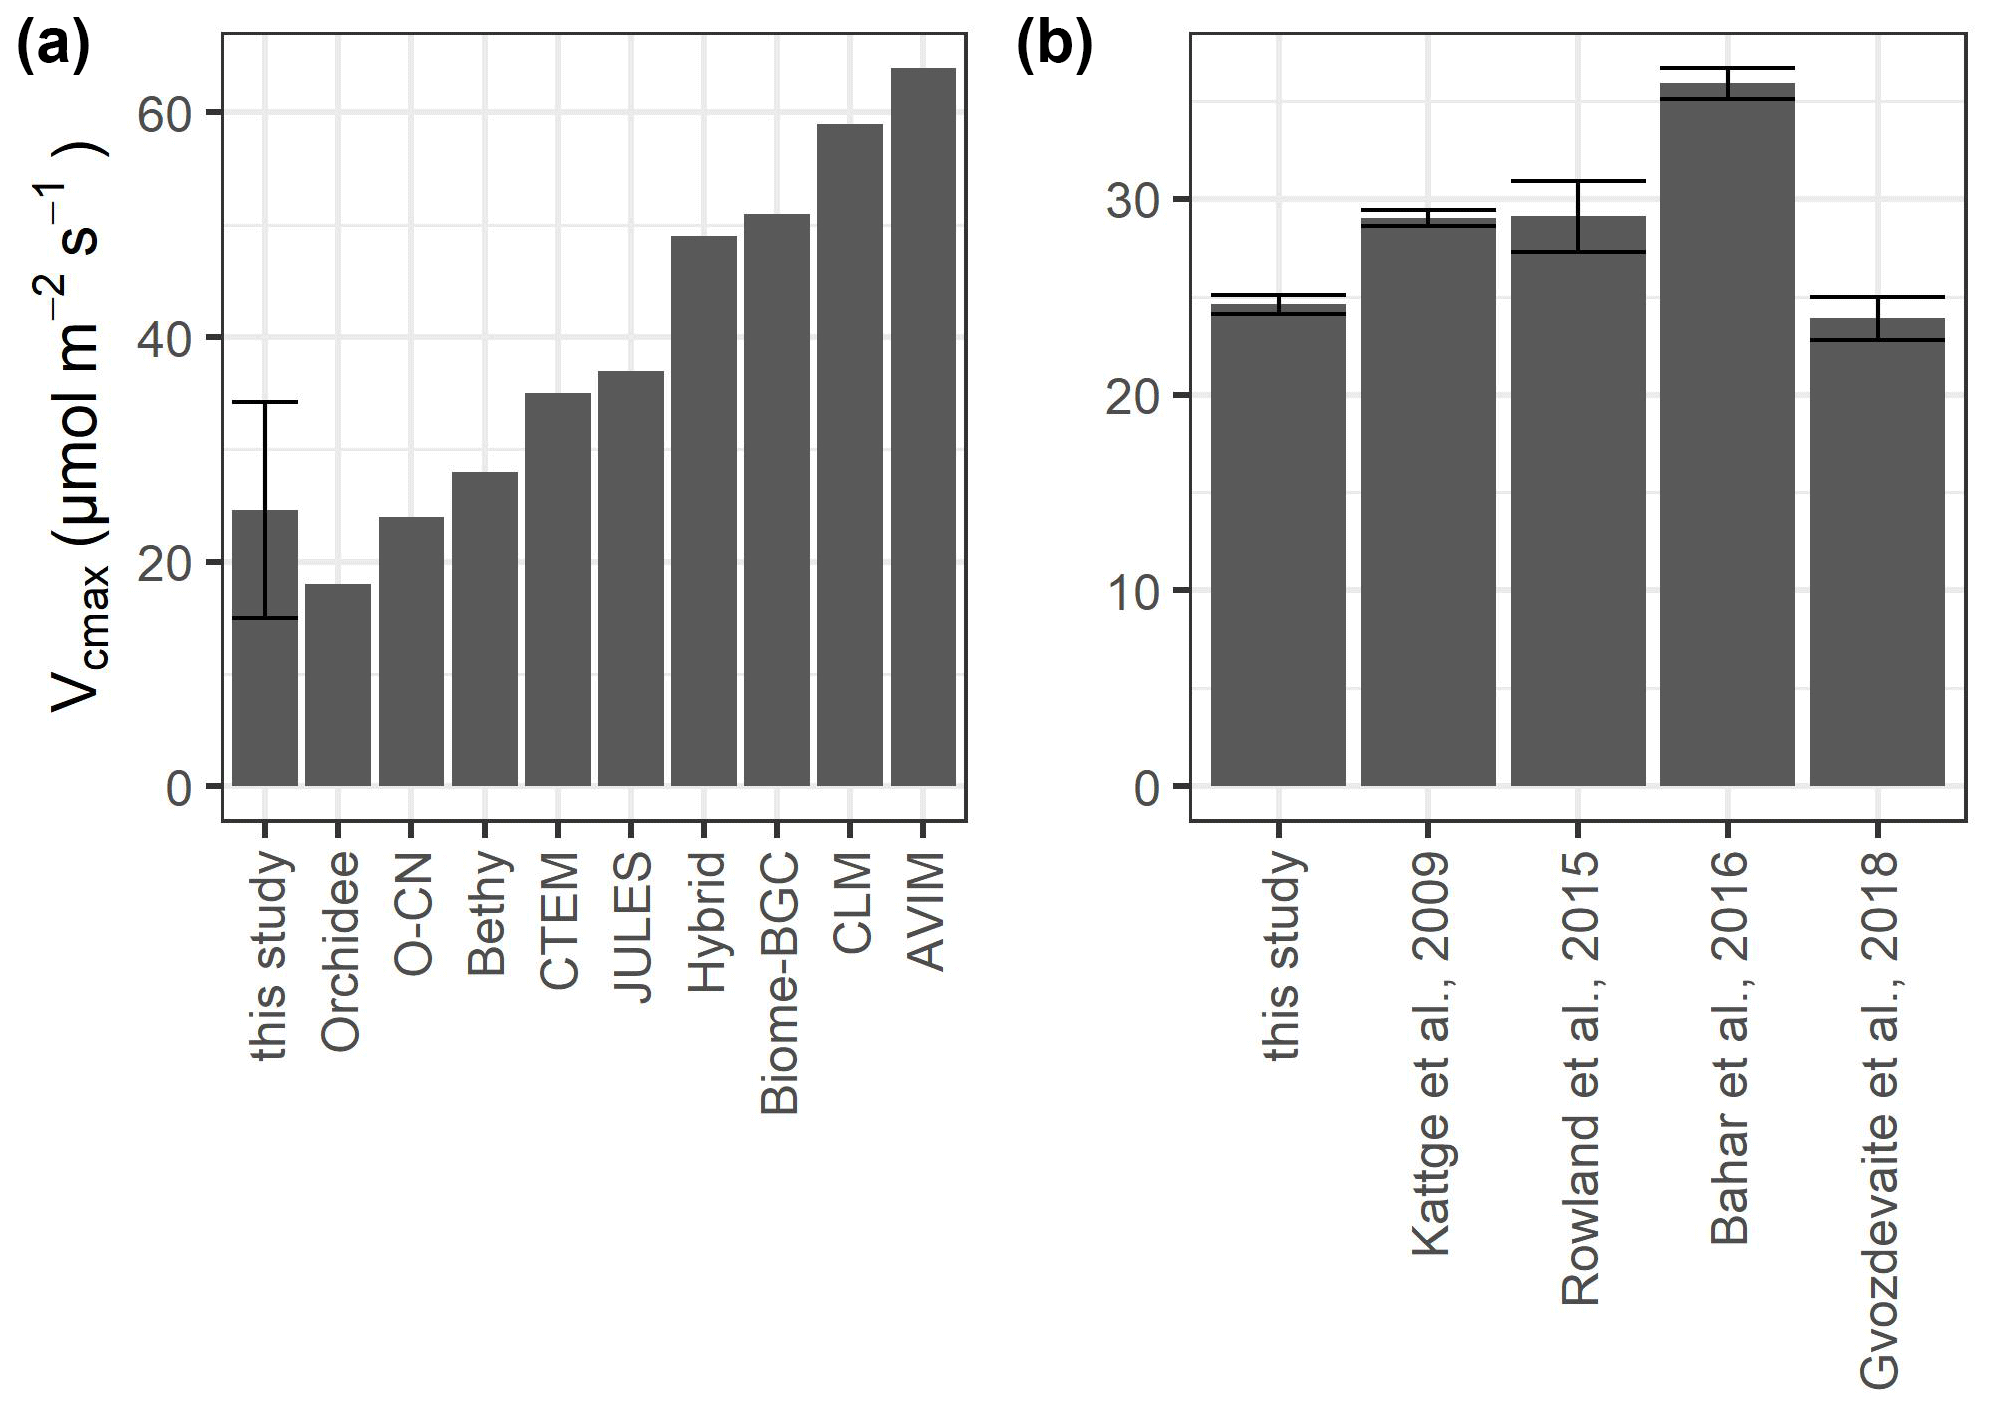
Figure 6Values of Vcmax at 25 ∘C for sunlit upper-canopy leaves measured in this study compared to (a) different model estimates and (b) other lowland tropical sites growing on nutrient-poor oxisols. The values for the models were adopted from Rogers (2014) for the plant functional types “broadleaf evergreen tropical tree” (Orchidee, O-CN, CLM, AVIM), “tropical tree (oxisol)” (Bethy), “rainforest” (Hybrid), “evergreen broadleaf tree” (Biome-BGC, CTEM), and “broadleaf tree” (Jules). We did not include IBIS, which was also mentioned in Rogers (2014), as the source of the data is unclear. Error bars in (a) show the standard deviation and in (b) the standard error.
Fieldwork in the tropical rainforest is challenging because of its remoteness and extremely moist and warm climate. While Paracou is only a 45 min drive from a major city, Kourou, Nouragues can only be reached by helicopter (30 min from Cayenne, the capital of French Guiana) or a combination of car (2 h from Cayenne) and motorized canoe (4–6 h from Regina to Nouragues). Carrying out fieldwork in such a remote location requires adequate logistical planning and funding as both people and material need to be transported to this remote site and stay there for prolonged periods. Proper planning and coordination with the whole team was required to get the fieldwork finished within a limited timeframe.
The combination of high temperature and humidity poses an additional hurdle as this generally makes physical exertion harder than in temperate climates and, most importantly, decreases the longevity of most if not all electronic devices. Indeed, we suffered from several Li-6400XT malfunctions, as well as defects of laptops, freezers, and drying ovens. However, these defects did not reduce the reliability of our data, but it required extra precautions and increased expenses. We tested, for example, the Li-6400XT devices each morning, and the devices were regularly cross-calibrated. Malfunctions of these devices led to troubleshooting and extra testing before new measurements were carried out, which can be very time consuming and did have an impact on the amount of data that could be gathered. Laptops and other electronic devices were best stored overnight in a waterproof bag/barrel, whereas regularly moving them in and out of air-conditioned rooms increased malfunctions. Additionally, access to power was limited, and a portable generator was often required to carry out all photosynthesis measurements.
The tropical soil is hard, making it very labor intensive to take soil cores and posing several other problems. Soil corers deformed as they are not developed for tropical soil types, and the installation of PRS probes without breaking them was very challenging. Another challenge is reaching upper-canopy leaves up to >50 m height above ground level, which required technical tree climbing skills and equipment from experienced tree climbers.
High species diversity and stand structural complexity of tropical forests are a major challenge to understand the ecosystem functioning of tropical forests and force researchers either to study some abundant species following them in time or to take into account the high diversity limiting the number of replicates per species.
This photosynthesis–soil database is provided as an excel workbook and is freely available at https://doi.org/10.5281/zenodo.5638236 (Verryckt, 2021). Photosynthetic CO2 response curves are presented as raw An-Ci files which can be analyzed by any user of the database, but Vcmax and Jmax values, fitted using the “Plantecophys” package (Duursma, 2015) in R, can also be found in the database in addition to the leaf traits. The soil database of 2015, including bulk density, soil particle size distribution, soil moisture, and nutrients, and the fertilizer composition are shown in separate sheets.
Publicly accessible and usable datasets from experimental sites are needed to greatly enhance the power of data synthesis, as well as model development and evaluation (Vicca et al., 2018; Halbritter et al., 2020). We provide vertical profiles of photosynthetic capacity data and important leaf traits from two 3-year large-scale nutrient addition experiments conducted in two tropical rainforests in French Guiana. Our dataset is extremely valuable to the modeling and tropical ecology community as we present a valuable source of information to further improve model representations of the roles of leaf nutrients in photosynthesis in tropical forests. We present raw An-Ci curves, which allows the curves to be fit under the same assumptions as curves collected at other sites, avoiding bias in the method of analysis. In addition, we provide Vcmax and Jmax values making these values immediately available to the modeling community. We provide leaf-level photosynthesis data at several heights within the canopy from mature trees and saplings allowing us to study differences in sunlit and shaded leaves. Ancillary data such as herbivory and leaf phenol concentration can be of great value as additional data to other studies on these topics. A large set of soil properties and nutrient availabilities in the soils underlying the studied trees were made available as these data are highly relevant to understand how and why nutrient availability interacts with C uptake in tropical forests.
LTV, LVL, CS, DA, IU, RO, JL, OG, GP, AGG, EAC, OM, PC, MO, LF, LFL, PRFG, HV, MV, CR, EV, LB, and IAJ contributed to the field work and collected the data. PRFG, MPE, and PV carried out the majority of the lab analysis. SC provided insight in French Guianese plant physiology. JS, JC, JP, and IAJ provided the project funding. The manuscript was drafted by LTV, IAJ, and SV and was further revised by all co-authors.
The contact author has declared that neither they nor their co-authors have any competing interests.
Publisher’s note: Copernicus Publications remains neutral with regard to jurisdictional claims in published maps and institutional affiliations.
We thank the staff of the Nouragues Ecological Research Station, managed by USR mixte LEEISA (CNRS; Cayenne), and the Paracou station, managed by UMR EcoFoG (CIRAD, INRA; Kourou).
We are grateful to Valentine Alt, Samuel Counil, Jocelyn Cazal, Gonzalo Carrillo, Jean-Loup Touchard, Anthony Percevaux, Benjamin Leudet, and Stefan van Beveren for climbing the trees to collect the selected branches.
Lore T. Verryckt is funded by a PhD fellowship from the Research Foundation Flanders (FWO). This project was funded by the European Research Council Synergy Grant ERC-2013-SyG-610028 IMBALANCE-P. The research stations of Paracou and Nouragues received support from “Investissement d’Avenir” grants managed by Agence Nationale de la Recherche (CEBA: ANR-10-LABX-25-01, AnaEE-France: ANR-11-INBS-0001).
This paper was edited by Jens Klump and reviewed by Kazimierz Becek and one anonymous referee.
Aguilos, M., Stahl, C., Burban, B., Hérault, B., Courtois, E., Coste, S., Wagner, F., Ziegler, C., Takagi, K., and Bonal, D.: Interannual and Seasonal Variations in Ecosystem Transpiration and Water Use Efficiency in a Tropical Rainforest, Forests, 10, 14, https://doi.org/10.3390/f10010014, 2019.
Bahar, N. H., Ishida, F. Y., Weerasinghe, L. K., Guerrieri, R., O'Sullivan, O. S., Bloomfield, K. J., Asner, G. P., Martin, R. E., Lloyd, J., Malhi, Y., Phillips, O. L., Meir, P., Salinas, N., Cosio, E. G., Domingues, T. F., Quesada, C. A., Sinca, F., Escudero Vega, A., Zuloaga Ccorimanya, P. P., Del Aguila-Pasquel, J., Quispe Huaypar, K., Cuba Torres, I., Butron Loayza, R., Pelaez Tapia, Y., Huaman Ovalle, J., Long, B. M., Evans, J. R., and Atkin, O. K.: Leaf-level photosynthetic capacity in lowland Amazonian and high-elevation Andean tropical moist forests of Peru, New Phytol., 214, 1002–1018, https://doi.org/10.1111/nph.14079, 2016.
Beer, C., Reichstein, M., Tomelleri, E., Ciais, P., Jung, M., Carvalhais, N., Rödenbeck, C., Altaf Arain, M., Baldocchi, D., Bonan, G. B., Bondeau, A., Cescatti, A., Lasslop, G., Lindroth, A., Lomas, M., Luyssaert, S., Margolis, H., Oleson, K. W., Roupsard, O., Veenendaal, E., Viovy, N., Williams, C., Woodward, F. I., and Papale, D.: Terrestrial Gross Carbon Dioxide Uptake – global distribution and variation with climate, Science, 329, 834–838, https://doi.org/10.1126/science.1184984, 2010.
Berry, Z. C. and Goldsmith, G. R.: Diffuse light and wetting differentially affect tropical tree leaf photosynthesis, New Phytol., 225, 143–153, https://doi.org/10.1111/nph.16121, 2020.
Bonal, D., Bosc, A., Ponton, S., Goret, J.-Y., Burban, B., Gross, P., Bonnefond, J.-M., Elbers, J. A. N., Longdoz, B., Epron, D., Guehl, J.-M., and Granier, A.: Impact of severe dry season on net ecosystem exchange in the Neotropical rainforest of French Guiana, Glob. Change Biol., 14, 1917–1933, https://doi.org/10.1111/j.1365-2486.2008.01610.x, 2008.
Bonan, G.: Ecological Climatology: Concepts and Applications, 3 ed., Cambridge University Press, Cambridge, 2015.
Bongers, F., Charles-Dominique, P., Forget, P.-M., and Théry, M.: Nouragues: Dynamics and Plant-Animal Interactions in a Neotropical Rainforest, Kluwer Academic Publishers, Dordrecht, The Netherlands, 2001.
Bray, R. H. and Kurtz, L. T.: Determination of total, organic and available forms of phosphorus in soils, Soil Sci., 59, 39–46, 1945.
Casals, P., Romanyà, J., Cortina, J., Fons, J., Bode, M., and Vallejo, V. R.: Nitrogen supply rate in Scots pine (Pinus sylvestris L.) forests of contrasting slope aspect, Plant Soil, 168, 67–73, 1995.
Courtois, E. A., Stahl, C., Van den Berge, J., Bréchet, L., Van Langenhove, L., Richter, A., Urbina, I., Soong, J. L., Peñuelas, J., and Janssens, I. A.: Spatial Variation of Soil CO2, CH4 and N2O Fluxes Across Topographical Positions in Tropical Forests of the Guiana Shield, Ecosystems, 21, 1445–1458, https://doi.org/10.1007/s10021-018-0232-6, 2018.
Dawkins, H. C.: The management of tropical high forest with special reference to Uganda, Tropical Forestry Paper 34, Imperial Forestry Institute, Oxford, UK, 1958.
Domingues, T. F., Meir, P., Feldpausch, T. R., Saiz, G., Veenendaal, E. M., Schrodt, F., Bird, M., Djagbletey, G., Hien, F., Compaore, H., Diallo, A., Grace, J., and Lloyd, J.: Co-limitation of photosynthetic capacity by nitrogen and phosphorus in West Africa woodlands, Plant Cell Environ., 33, 959–980, https://doi.org/10.1111/j.1365-3040.2010.02119.x, 2010.
Dusenge, M. E., Walling, G., Gårdesten, J., Nyronzima, F., Adolfsson, L., Nsabimana, D., and Uddling, J.: Photosynthetic capacity of tropical montane tree species in relation to leaf nutrients, successional strategy and growth temperature, Oecologia, 117, 1183–1194, https://doi.org/10.1007/s00442-015-3260-3, 2015.
Duursma, R. A.: Plantecophys – An R Package for Analysing and Modelling Leaf Gas Exchange Data, PLOS ONE, 10, e0143346, https://doi.org/10.1371/journal.pone.0143346, 2015.
Epron, D., Bosc, A., Bonal, D., and Freycon, V.: Spatial variation of soil respiration across a topographic gradient in a tropical rain forest in French Guiana, J. Trop. Ecol., 22, 565–574, https://doi.org/10.1017/s0266467406003415, 2006.
Farquhar, G. D., Caemmerer, S., and Berry, J. A.: A biochemical model of photosynthetic CO2 assimilation in leaves of C3 species, Planta, 149, 78–90, https://doi.org/10.1007/BF00386231, 1980.
Ferry, B., Morneau, F., Bontemps, J.-D., Blanc, L., and Freycon, V.: Higher treefall rates on slopes and waterlogged soils result in lower stand biomass and productivity in a tropical rain forest, J. Ecol., 98, 106–116, https://doi.org/10.1111/j.1365-2745.2009.01604.x, 2010.
Fleischer, K., Rammig, A., De Kauwe, M. G., Walker, A. P., Domingues, T. F., Fuchslueger, L., Garcia, S., Goll, D. S., Grandis, A., Jiang, M., Haverd, V., Hofhansl, F., Holm, J. A., Kruijt, B., Leung, F., Medlyn, B. E., Mercado, L. M., Norby, R. J., Pak, B., von Randow, C., Quesada, C. A., Schaap, K. J., Valverde-Barrantes, O. J., Wang, Y.-P., Yang, X., Zaehle, S., Zhu, Q., and Lapola, D. M.: Amazon forest response to CO2 fertilization dependent on plant phosphorus acquisition, Nat. Geosci., 12, 736–741, https://doi.org/10.1038/s41561-019-0404-9, 2019.
Food and Agriculture Organization of the United Nations (FAO): World reference base for soil resources, World Soil Resources Report No. 84, International Society of Soil Science, ISRIC., 88 pp., 1998.
Gee, G. W. and Bauder, J. W.: Particle-size analysis, in: Methods of Soil Analysis Part 1: Physical and Mineralogical Methods, edited by: Kute, A., American Society of Agronomy and Soil Science Society of America, Madison, Wisconsin, USA, 1986.
Gibson, D. J., Colquhoun, I. A., and Greig-Smith, P.: New method for measuring nutrient supply rates in soils using ion-exchange resins, in: Ecological interactions in soils: Plants, microbes, and animals, Special publications series of the British Ecological Society, Blackwell, Oxford, UK, 6, 73–79, 1985.
Gourlet-Fleury, S., Guehl, J.-M., and Laroussinie, O.: Ecology and management of a neotropical rainforest: lessons drawn from Paracou, a long-term experimental research site in French Guiana, Elsevier, Paris, 336 pp., 2004.
Grau, O., Penuelas, J., Ferry, B., Freycon, V., Blanc, L., Desprez, M., Baraloto, C., Chave, J., Descroix, L., Dourdain, A., Guitet, S., Janssens, I. A., Sardans, J., and Herault, B.: Nutrient-cycling mechanisms other than the direct absorption from soil may control forest structure and dynamics in poor Amazonian soils, Sci. Rep., 7, 45017, https://doi.org/10.1038/srep45017, 2017.
Guitet, S., Freycon, V., Brunaux, O., Pélissier, R., Sabatier, D., and Couteron, P.: Geomorphic control of rain-forest floristic composition in French Guiana: more than a soil filtering effect?, J. Trop. Ecol., 32, 22–40, https://doi.org/10.1017/S0266467415000620, 2016.
Gvozdevaite, A., Oliveras, I., Domingues, T. F., Peprah, T., Boakye, M., Afriyie, L., da Silva Peixoto, K., de Farias, J., Almeida de Oliveira, E., Almeida Farias, C. C., Dos Santos Prestes, N. C. C., Neyret, M., Moore, S., Schwantes Marimon, B., Marimon Junior, B. H., Adu-Bredu, S., and Malhi, Y.: Leaf-level photosynthetic capacity dynamics in relation to soil and foliar nutrients along forest-savanna boundaries in Ghana and Brazil, Tree Physiol., 38, 1912-–1925, https://doi.org/10.1093/treephys/tpy117, 2018.
Halbritter, A. H., De Boeck, H. J., Eycott, A. E., Reinsch, S., Robinson, D. A., Vicca, S., Berauer, B., Christiansen, C. T., Estiarte, M., Grünzweig, J. M., Gya, R., Hansen, K., Jentsch, A., Lee, H., Linder, S., Marshall, J., Peñuelas, J., Kappel Schmidt, I., Stuart-Haëntjens, E., Wilfahrt, P., Group, the CLimMani Working, and Vandvik, V.: The handbook for standardized field and laboratory measurements in terrestrial climate change experiments and observational studies (ClimEx), M. Ecol. Evol., 11, 22–37, https://doi.org/10.1111/2041-210X.13331, 2020.
Hammond, D.: Tropical Forests of the Guiana Shield: Ancient Forests in a Modern World, CABI Publishing, Cambridge, UK, 2005.
Hangs, R. D., Greer, K. J., and Sulewski, C. A.: The effect of interspecific competition on conifer seedling growth and nitrogen availability measured using ion-exchange membranes, C. J. Forest Res., 34, 754–761, 2004.
Kattge, J., Knorr, W., Raddatz, T., and Wirth, C.: Quantifying photosynthetic capacity and its relationship to leaf nitrogen content for global-scale terrestrial biosphere models, Glob. Change Biol., 15, 976-–991, https://doi.org/10.1111/j.1365-2486.2008.01744.x, 2009.
Lugli, L. F., Rosa, J. S., Andersen, K. M., Di Ponzio, R., Almeida, R. V., Pires, M., Cordeiro, A. L., Cunha, H. F. V., Martins, N. P., Assis, R. L., Moraes, A. C. M., Souza, S. T., Aragão, L. E. O. C., Camargo, J. L., Fuchslueger, L., Schaap, K. J., Valverde-Barrantes, O. J., Meir, P., Quesada, C. A., Mercado, L. M., and Hartley, I. P.: Rapid responses of root traits and productivity to phosphorus and cation additions in a tropical lowland forest in Amazonia, New Phytol., 230, 116–128, https://doi.org/10.1111/nph.17154, 2021.
Maire, V., Wright, I. J., Prentice, I. C., Batjes, N. H., Bhaskar, R., van Bodegom, P. M., Cornwell, W. K., Ellsworth, D., Niinemets, Ü., Ordonez, A., Reich, P. B., and Santiago, L. S.: Global effects of soil and climate on leaf photosynthetic traits and rates, Global Ecol. Biogeogr., 24, 706–717, https://doi.org/10.1111/geb.12296, 2015.
Makkar, H. P. S.: Quantification of Tannins in Tree and Shrub Foliage: a laboratory manual, Springer, Dordrecht, 102 pp., https://doi.org/10.1007/978-94-017-0273-7, 2000.
Malhi, Y.: The carbon balance of tropical forest regions, 1990–2005, Curr. Opin. Env. Sust., 2, 237–244, https://doi.org/10.1016/j.cosust.2010.08.002, 2010.
Marigo, G.: Sur une méthode de fractionnement et d'estimation des composés phénoliques chez les végétaux, Analusis, 2, 106–110, 1973.
Medlyn, B. E., Zaehle, S., De Kauwe, M. G., Walker, A. P., Dietze, M. C., Hanson, P. J., Hickler, T., Jain, A. K., Luo, Y., Parton, W., Prentice, I. C., Thornton, P. E., Wang, S., Wang, Y.-P., Weng, E., Iversen, C. M., McCarthy, H. R., Warren, J. M., Oren, R., and Norby, R. J.: Using ecosystem experiments to improve vegetation models, Nat. Clim. Change, 5, 528–534, https://doi.org/10.1038/nclimate2621, 2015.
Mo, Q., Li, Z., Sayer, E. J., Lambers, H., Li, Y., Zou, B., Tang, J., Heskel, M., Ding, Y., and Wang, F.: Foliar phosphorus fractions reveal how tropical plants maintain photosynthetic rates despite low soil phosphorus availability, Funct. Ecol., 33, 503–513, https://doi.org/10.1111/1365-2435.13252, 2019.
Norby, R. J., Gu, L., Haworth, I. C., Jensen, A. M., Turner, B. L., Walker, A. P., Warren, J. M., Weston, D. J., Xu, C., and Winter, K.: Informing models through empirical relationships between foliar phosphorus, nitrogen and photosynthesis across diverse woody species in tropical forests of Panama, New Phytol., 215, 1425–1437, https://doi.org/10.1111/nph.14319, 2017.
Olsen, S. R., Cole, C. V., and Watanabe, F. S.: Estimation of available phosphorus in soils by extraction with sodium bicarbonate, Circular/United States Department of Agriculture; no. 939, United States Department of Agriculture, Washington, USA, 1954.
Peñuelas, J., Sardans, J., Llusia, J., Owen, S. M., Silva, J., and Niinemets, Ü.: Higher Allocation to Low Cost Chemical Defenses in Invasive Species of Hawaii, J. Chem. Ecol., 36, 1255–1270, https://doi.org/10.1007/s10886-010-9862-7, 2010.
Pirk, G. I. and Farji-Brener, A. G.: Foliar herbivory and its effects on plant growth in native and exotic species in the Patagonian steppe, Ecol. Res., 27, 903–912, https://doi.org/10.1007/s11284-012-0968-y, 2012.
Porter, L. J., Hrstich, L. N., and Chan, B. G.: The conversion of procyanidins and prodelphinidins to cyanidin and delphinidin, Phytochemistry, 25, 223–230, https://doi.org/10.1016/S0031-9422(00)94533-3, 1985.
Qian, P. and Schoenau, J. J.: Practical applications of ion exchange resins in agricultural and environmental soil research, Can. J. Soil Sci., 82, 9–21, 2002.
R Core Team: R: A Language and Environment for Statistical Computing, R Foundation for Statistical Computing, Vienna, Austria, 2019.
Rogers, A.: The use and misuse of Vcmax in Earth System Models, Photosynthesis Research, 119, 15–29, https://doi.org/10.1007/s11120-013-9818-1, 2014.
Rogers, A., Medlyn, B. E., Dukes, J. S., Bonan, G., von Caemmerer, S., Dietze, M. C., Kattge, J., Leakey, A. D. B., Mercado, L. M., Niinemets, Ü., Prentice, I. C., Serbin, S. P., Sitch, S., Way, D. A., and Zaehle, S.: A roadmap for improving the representation of photosynthesis in Earth system models, New Phytol., 213, 22–-42. https://doi.org/10.1111/nph.14283, 2017.
Rowland, L., Lobo-do-Vale, R. L., Christoffersen, B. O., Melem, E. A., Kruijt, B., Vasconcelos, S. S., Domingues, T., Binks, O. J., Oliveira, A. A., Metcalfe, D., da Costa, A. C., Mencuccini, M., and Meir, P.: After more than a decade of soil moisture deficit, tropical rainforest trees maintain photosynthetic capacity, despite increased leaf respiration, Glob. Change Biol., 21, 4662–4672, https://doi.org/10.1111/gcb.13035, 2015.
Ruiz-Benito, P., Vacchiano, G., Lines, E. R., Reyer, C. P. O., Ratcliffe, S., Morin, X., Hartig, F., Mäkelä, A., Yousefpour, R., Chaves, J. E., Palacios-Orueta, A., Benito-Garzón, M., Morales-Molino, C., Camarero, J. J., Jump, A. S., Kattge, J., Lehtonen, A., Ibrom, A., Owen, H. J. F., and Zavala, M. A.: Available and missing data to model impact of climate change on European forests, Ecol. Model., 416, 108870, https://doi.org/10.1016/j.ecolmodel.2019.108870, 2020.
Singleton, V. L. and Rossi, J. A.: Colorimetry of Total Phenolics with Phosphomolybdic-Phosphotungstic Acid Reagents, Am. J. Enol. Viticult., 16, 144–158, 1965.
van der Meer, P. J. and Bongers, F.: Patterns of Tree-Fall and Branch-Fall in a Tropical Rain Forest in French Guiana, J. Ecol., 84, 19–29, https://doi.org/10.2307/2261696, 1996.
Van Der Meer, P. J., Sterck, F. J., and Bongers, F.: Tree seedling performance in canopy gaps in a tropical rain forest at Nouragues, French Guiana, J. Trop. Ecol., 14, 119–137, https://doi.org/10.1017/S026646749800011X, 1998.
Van Langenhove, L., Depaepe, T., Vicca, S., van den Berge, J., Stahl, C., Courtois, E., Weedon, J., Urbina, I., Grau, O., Asensio, D., Peñuelas, J., Boeckx, P., Richter, A., Van Der Straeten, D., and Janssens, I. A.: Regulation of nitrogen fixation from free-living organisms in soil and leaf litter of two tropical forests of the Guiana shield, Plant Soil, 450, 93–110, https://doi.org/10.1007/s11104-019-04012-1, 2019.
Van Langenhove, L., Janssens, I. A., Verryckt, L., Brechet, L., Hartley, I. P., Stahl, C., Courtois, E., Urbina, I., Grau, O., Sardans, J., Peguero, G., Gargallo-Garriga, A., Peñuelas, J., and Vicca, S.: Rapid root assimilation of added phosphorus in a lowland tropical rainforest of French Guiana, Soil Biol. Biochem., 140, 107646, https://doi.org/10.1016/j.soilbio.2019.107646, 2020a.
Van Langenhove, L., Verryckt, L. T., Bréchet, L., Courtois, E. A., Stahl, C., Hofhansl, F., Bauters, M., Sardans, J., Boeckx, P., Fransen, E., Peñuelas, J., and Janssens, I. A.: Atmospheric deposition of elements and its relevance for nutrient budgets of tropical forests, Biogeochemistry, 149, 175–193, https://doi.org/10.1007/s10533-020-00673-8, 2020b.
Van Langenhove, L., Verryckt, L. T., Stahl, C., Courtois, E. A., Urbina, I., Grau, O., Asensio, D., Peguero, G., Margalef, O., Freycon, V., Peñuelas, J., and Janssens, I. A.: Soil nutrient variation along a shallow catena in Paracou, French Guiana, Soil Res., 59, 130–145, https://doi.org/10.1071/SR20023, 2020c.
Verryckt, L. T.: Vertical profiles of leaf photosynthesis and leaf traits, and soil nutrients in two tropical rainforests in French Guiana before and after a three-year nitrogen and phosphorus addition experiment, Zenodo [data set], https://doi.org/10.5281/zenodo.5638236, 2021.
Verryckt, L. T., Ellsworth, D. S., Vicca, S., Van Langenhove, L., Peñuelas, J., Ciais, P., Posada, J. M., Stahl, C., Coste, S., Courtois, E. A., Obersteiner, M., Chave, J., and Janssens, I. A.: Can light-saturated photosynthesis in lowland tropical forests be estimated by one light level?, Biotropica, 52, 1183–1193, https://doi.org/10.1111/btp.12817, 2020a.
Verryckt, L. T., Van Langenhove, L., Ciais, P., Courtois, E. A., Vicca, S., Peñuelas, J., Stahl, C., Coste, S., Ellsworth, D. S., Posada, J. M., Obersteiner, M., Chave, J., and Janssens, I. A.: Coping with branch excision when measuring leaf net photosynthetic rates in a lowland tropical forest, Biotropica, 52, 608–615, https://doi.org/10.1111/btp.12774, 2020b.
Vicca, S., Stocker, B. D., Reed, S., Wieder, W. R., Bahn, M., Fay, P. A., Janssens, I. A., Lambers, H., Peñuelas, J., Piao, S., Rebel, K. T., Sardans, J., Sigurdsson, B. D., Van Sundert, K., Wang, Y.-P., Zaehle, S., and Ciais, P.: Using research networks to create the comprehensive datasets needed to assess nutrient availability as a key determinant of terrestrial carbon cycling, Environ. Res. Lett., 13, 125006, https://doi.org/10.1088/1748-9326/aaeae7, 2018.
Vitousek, P. M. and Howarth, R. W.: Nitrogen limitation on land and in the sea: How can it occur?, Biogeochemistry, 13, 87–115, https://doi.org/10.1007/BF00002772, 1991.
von Caemmerer, S. and Farquhar, G. D.: Some relationships between the biochemistry of photosynthesis and the gas exchange of leaves, Planta, 153, 376–387, https://doi.org/10.1007/BF00384257, 1981.
Walinga, I., van der Lee, J. J., Houba, V. J. G., van Vark, W., and Novozamsky, I.: Plant analysis Manual, in: Kluwer Academic Publishers, Agricultural University, Wageningen, The Netherlands, 1989.
Walker, T. W. and Syers, J. K.: The fate of phosphorus during pedogenesis, Geoderma, 15, 1–19, https://doi.org/10.1016/0016-7061(76)90066-5, 1976.
Walker, A. P., Beckerman, A. P., Gu, L., Kattge, J., Cernusak, L. A., Domingues, T. F., Scales, J. C., Wohlfahrt, G., Wullschleger, S. D., and Woodward, F. I.: The relationship of leaf photosynthetic traits – Vcmax and Jmax – to leaf nitrogen, leaf phosphorus, and specific leaf area: a meta-analysis and modeling study, Ecol. Evol., 4, 3218–3235, https://doi.org/10.1002/ece3.1173, 2014.
Wieder, W. R., Cleveland, C. C., Smith, W. K., and Todd-Brown, K.: Future productivity and carbon storage limited by terrestrial nutrient availability, Nat. Geosci., 8, 441–444, https://doi.org/10.1038/ngeo2413, 2015.
Wright, S. J.: Plant responses to nutrient addition experiments conducted in tropical forests, Ecol. Monogr., 89, e01382, https://doi.org/10.1002/ecm.1382, 2019.
Wright, S. J., Yavitt, J. B., Wurzburger, N., Turner, B. L., Tanner, E. V. J., Sayer, E. J., Santiago, L. S., Kaspari, M., Hedin, L. O., Harms, K. E., Garcia, M. N., and Corre, M. D.: Potassium, phosphorus, or nitrogen limit root allocation, tree growth, or litter production in a lowland tropical forest, Ecology, 92, 1616–1625, https://doi.org/10.1890/10-1558.1, 2011.
Wright, S. J., Turner, B. L., Yavitt, J. B., Harms, K. E., Kaspari, M., Tanner, E. V. J., Bujan, J., Griffin, E. A., Mayor, J. R., Pasquini, S. C., Sheldrake, M., and Garcia, M. N.: Plant responses to fertilization experiments in lowland, species-rich, tropical forests, Ecology, 99, 1129–1138, https://doi.org/10.1002/ecy.2193, 2018.
Wurzburger, N., Bellenger, J. P., Kraepiel, A. M. L., and Hedin, L. O.: Molybdenum and Phosphorus Interact to Constrain Asymbiotic Nitrogen Fixation in Tropical Forests, PLOS ONE, 7, e33710, https://doi.org/10.1371/journal.pone.0033710, 2012.
Yoda, K.: Three-dimensional distribution of light intensity in a tropical rain forest of West Malaysia, Japanese Journal of Ecology, 24, 247–254, https://doi.org/10.18960/seitai.24.4_247, 1974.
- Abstract
- Introduction
- Sampling sites
- Data and methods: soil sampling
- Data and methods: leaf sampling
- Vcmax of sunlit upper-canopy leaves
- Challenges of fieldwork in the tropics
- Data availability
- Summary
- Author contributions
- Competing interests
- Disclaimer
- Acknowledgements
- Financial support
- Review statement
- References