the Creative Commons Attribution 4.0 License.
the Creative Commons Attribution 4.0 License.
 | 08 Nov 2022
The HYPERMAQ dataset: bio-optical properties of moderately to extremely turbid waters
Héloïse Lavigne
Ana Dogliotti
David Doxaran
Fang Shen
Alexandre Castagna
Matthew Beck
Quinten Vanhellemont
Xuerong Sun
Juan Ignacio Gossn
Pannimpullath Remanan Renosh
Koen Sabbe
Dieter Vansteenwegen
Kevin Ruddick
Because of the large diversity of case 2 waters ranging from extremely absorbing to extremely scattering waters and the complexity of light transfer due to external terrestrial inputs, retrieving main biogeochemical parameters such as chlorophyll-a or suspended particulate matter concentration in these waters is still challenging. By providing optical and biogeochemical parameters for 180 sampling stations with turbidity and chlorophyll-a concentration ranging from 1 to 700 FNU and from 0.9 to 180 mg m−3 respectively, the HYPERMAQ dataset will contribute to a better description of marine optics in optically complex water bodies and can help the scientific community to develop algorithms. The HYPERMAQ dataset provides biogeochemical parameters (i.e. turbidity, pigment and chlorophyll-a concentration, suspended particulate matter), apparent optical properties (i.e. water reflectance from above water measurements) and inherent optical properties (i.e. absorption and attenuation coefficients) from six different study areas. These study areas include large estuaries (i.e. the Rio de la Plata in Argentina, the Yangtze estuary in China, and the Gironde estuary in France), inland (i.e. the Spuikom in Belgium and Chascomùs lake in Argentina), and coastal waters (Belgium). The dataset is available from Lavigne et al. (2022) at https://doi.org/10.1594/PANGAEA.944313.
- Article
(2885 KB) - Full-text XML
- BibTeX
- EndNote


In marine optics, certain water properties such as the concentration of chlorophyll-a (Chl-a hereafter) or suspended particulate matter (SPM hereafter) are inferred from water-leaving reflectance allowing a powerful satellite-based monitoring. However, although algorithms are well matured in clear case 1 waters (Morel and Prieur, 1975; Morel and Maritorena, 2001), it is not the case in optically complex case 2 waters, where apparent optical properties (AOPs) and inherent optical properties (IOPs) are influenced not only by Chl-a but also by terrestrial optically active substances such as suspended sediments and colored dissolved organic matter (CDOM) that do not covary with Chl-a. Given the complexity of light transfer in these waters and the large diversity of case 2 waters, algorithm definition is much more challenging (Odermatt et al., 2012) and requires datasets covering the extreme variability of case 2 water conditions. Hence, additional data obtained in optically complex waters are valuable to the scientific community as they will help to better understand marine optics in such waters and to design ocean color algorithms.
The present dataset (Lavigne et al., 2022; https://doi.org/10.1594/PANGAEA.944313) has been collected as part of the HYPERMAQ project. During this project, different types of optically complex waters with turbidity ranging from moderate to extreme (1 to 700 FNU) and Chl-a ranging from low to very high (0.9 to 180 mg m−3) have been sampled in various locations around the world. Their main optical and biogeochemical parameters are shared in this dataset, including measurements of water-leaving reflectance, turbidity, non-water light absorption, and attenuation coefficients, as well as SPM, Chl-a, and other pigment composition. In the next sections, study areas, sampling methodology, and final HYPERMAQ datasets are described.
Contrary to case 1 waters, optical properties of case 2 waters are impacted by terrestrial inputs of sediments and CDOM with concentrations ranging from low to extreme values. Hence, in these waters, the retrieval of water properties from bio-optical algorithms is extremely complex. As case-2 waters are generally highly connected to land–ocean interaction and human activities (estuaries, coastal and inland waters), it becomes critical to collect enough in situ data to help for the development of specific algorithms. Given the large diversity of case 2 waters, Hieronymi et al. (2016) defined four main groups: case 2 scattering (C2S), case 2 extremely scattering (C2SX), case 2 absorbing (C2A), and case-2 extremely absorbing (C2AX), suggesting that specific efforts in algorithm development should be given to each group. For instance, Hieronymi et al. (2017) proposed a multi-neural networks algorithm for case 2 waters atmospheric correction, but the algorithm was mostly trained and validated with synthetic datasets. In this context, the HYPERMAQ dataset provides bio-optical data from C2S and C2SX waters by sampling a very large diversity of waters affected by additional sediments inputs (see sample sites in Fig. 1). Sample sites allow one to obtain a large range in SPM and turbidity (1 to 700 FNU) by sampling Belgian coastal waters which are extremely turbid locally close to the coast and less turbid further offshore. In addition, three estuaries known to be extremely turbid have been sampled (the Gironde (France), the Yangtze (China), and the Rio de la Plata (Argantina) estuaries). Since they are affected by tides, a gradient of turbidity could be sampled along the day with diverse influences of oceanic waters. These three estuaries, located on different continents, carry suspended particles with their own mineral properties, thus enriching the database. Finally, two terrestrial lagoons were sampled. One with low to moderate concentrations in suspended sediments (Spuikom in Belgium) and one with extreme concentrations of both algae and non-algal suspended particles (Chascomùs in Argentina). This large diversity of sampled sites should then help to improve our knowledge of case 2 moderately to extremely scattering waters. A detailed description of each site is provided below.
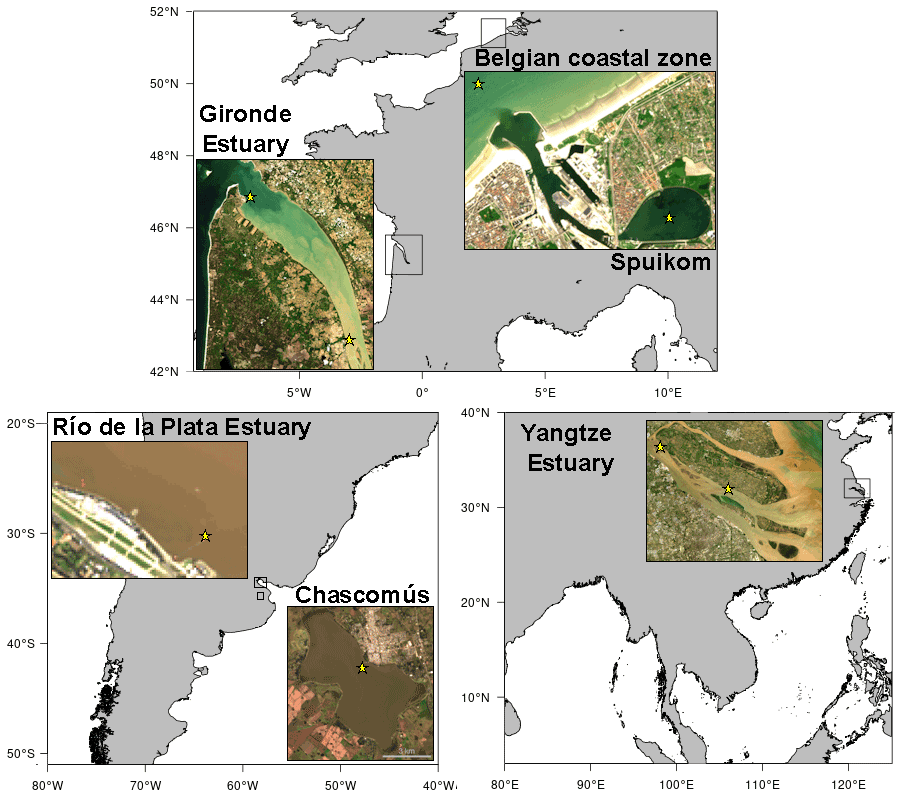
Figure 1Locations of the study areas. Satellite images come from Landsat 8 OLI (Yangtze: image taken on 29 April 2021, Chascomùs: image taken on 10 May 2017, Rio de la Plata: image taken on 13 August 2014) and Sentinel 2B MSI (Belgian coastal zone: image taken on 30 May 2021, Gironde: image taken on 3 May 2021).
2.1 Belgian coastal waters
The Belgian coastal waters (latitudes: 51.27 to 51.59∘ N; longitudes: 2.50 to 3.15∘ E) have been sampled in April and July 2018 from the RV Simon Stevin (Table 1). Belgian coastal waters are dominated by Atlantic waters which enter from the English Channel (Lacroix et al., 2004) and experience very strong along shore tidal currents which cause sediment resuspension leading to high turbidity. SPM concentrations range from less than 1 g m−3 in offshore and deeper waters to more than 100 g m−3 in very shallow waters. Phytoplankton blooms, characterized by high Chl-a concentration (more than 10 mg m−3), develop in spring from March to May. During summer, the biomass remains rather high (5 to 10 mg m−3) compared to winter when phytoplankton growth is mostly limited by light (Lancelot et al., 2005). The blooming season is mostly dominated by two taxa: diatoms in early spring and summer and Phaeocystis globosa in April–May (Muylaert et al., 2006).

2.2 Spuikom lagoon
The Spuikom lagoon (latitude: 51.23∘ N, longitude: 2.95∘ E) is an artificial basin that is connected to Ostend harbor (Belgium) by a lock system. The Spuikom has a surface area of 0.82 km2 and an average depth of 1.5 m. In the past, it has been used as a flushing basin to flush sediments from the harbor channel. Today it is used for leisure and commercial activities like sailing and shellfish farming. The Spuikom can experience events of phytoplankton blooms, of high turbidity (when strong winds cause the resuspension of bottom sediments), and of clear waters, which allow the development of microphytobenthic biofilms and macroalgae in the bottom (Castagna et al., 2022). The system was sampled during the growth season of 2018 (April and July, Table 1). Measurements were performed from inflatable boats provided by Ghent University and VLIZ (Flanders Marine Institute) (Zeekat).
2.3 Gironde estuary
The Gironde estuary, southwest France, is a good example of sediment-dominated case 2 waters influenced by river inputs. The Gironde estuary has been sampled between 17–20 September 2018 in two locations: Pauillac (latitude: 45.1975∘ N, longitude: −0.7422∘ E), close to the maximum turbidity zone and Le Verdon (latitude: 45.5438∘ N, longitude: −1.042∘ E), close to the river mouth. In the Gironde estuary, the origin of the particles is twofold: inputs from rivers Garonne and Dordogne, and erosion of recently settled sediments by tidal currents (Castaing and Allen, 1981). The suspended matter is a mixture of organic and mineral composites, where the organic fraction represents less than 2 % of the total material (Doxaran et al., 2002). The mineral fraction is composed of micas (63 %) and quartz (25 %), while clay phases contain four minerals: montmorillonite (30 %), illite and interstratified minerals (40 %), kaolinite (15 %), and chlorite and interstratified minerals (15 %). Chl-a and CDOM concentrations are low, with Chl-a ranging from 1 to 3 mg m−3 (Irigoien and Castel, 1997), and dissolved organic carbon (DOC) ranging from 1 to 7 mgC L−1 (Abril et al., 1999; Castaing and Allen, 1981). The Gironde estuary has well-developed turbidity maximum zones, with both tidal asymmetry and density residual circulation involved in their formation (Castaing and Allen, 1981). It is characterized by SPM concentrations ranging from 10 to 1000 g m−3 within surface waters (Doxaran et al., 2009a).
2.4 Chascomús lake
Chascomús lake, located in the Pampa Plain in the Buenos Aires province in Argentina (latitude: −35.5828∘ N, longitude: −58.0202∘ E), with a surface area of ∼ 30 km2, is a highly turbid, shallow lagoon (average depth of ∼ 1.9 m), permanently mixed due to intense and persistent winds (Torremorell et al., 2007). Total suspended matter varies widely from 66.3 to 614 g m−3 with a mean value of 227.3 ± 133.7 g m−3 (Diovisalvi et al., 2014) and on average the inorganic content represented ∼ 65 %. Nephelometric turbidity also widely ranged from 76.46 to 509.74 NTU, with a mean value of 209.18 ± 112.76 NTU. Turbidity was highly correlated to SPM while no significant correlation with Chl-a was found (Pérez et al., 2011). Total Chl-a concentration ranged from 50.6 to 856.3 mg m−3 (mean = 328.5 ± 173.4 mg m−3) during the 2005–2009 sampled period (Diovisalvi et al., 2014). The lake is characterized by high primary production (Torremorell et al., 2009) and a rich and diverse phytoplankton community, mostly composed of cyanobacteria. In terms of biovolume, cyanobacteria contribute 50 % to total phytoplankton biovolume and 75 % to total C in the water column (Diovisalvi et al., 2010). Despite the high CDOM absorption (aCDOM, mean m−1), absorption by particulate fraction (ap) has a prominent role in light absorption, for which both phytoplankton pigments (aphy) and non-pigmented particles (aNAP) contribute similarly to total particulate absorption (Pérez et al., 2011). Both SPM (especially the inorganic part) and Chl-a (less pronounced) show seasonal variation with increasing values in spring and summer (mid-September to mid-March), while the dissolved fraction did not show a significant seasonal difference (Pérez et al., 2011). The HYPERMAQ field campaign in Chascomús lake took place on 9–10 April 2018. Radiometric, in-water measurements and samples were collected at the end of a 164 m long pier.
2.5 Río de la Plata
The Río de la Plata is a large and shallow funnel shaped estuary with high values of SPM, ranging from 100 to 300 g m−3 (Framiñan and Brown, 1996) and reaching 940 g m−3 in the maximum turbidity zone (Dogliotti et al., 2014). Turbidity values widely vary between 2 and 680 FNU (Dogliotti et al., 2016). SPM, turbidity and Chl-a spatial distribution, and temporal variability is highly variable. In the upper estuary, a freshwater with tidal regime area, turbidity increases from January to April/May (with higher values along the southern Argentinian coast compared to the northern Uruguayan coast), and decreases from June to September (Dogliotti et al., 2016). In turn, Chl-a also show high spatial variability, in the upper estuary higher values are generally found in the northern part (Uruguay) compared to the southern part (Argentina). In particular, high Chl-a have been recorded during spring–summer months related to cyanobacteria blooms both along the Uruguay (Aubriot et al., 2020) and Argentine (Dogliotti et al., 2021) coasts, when Chl-a values as high as 13.6 and 153 mg m−3 have been recorded, respectively. Measurements in the Rio de la Plata were performed from a fixed 500 m long pontoon at the Palermo Pescadores Club in Buenos Aires (latitude: −34.5609∘ N, longitude: −58.3988∘ E) on 4 and 5 April 2018.
2.6 Yangtze estuary
The Yangtze estuary is located on the east coast of China and close to East China Sea (Fig. 1). Influenced by the Yangtze River, the largest river in China and the third largest in the world due to its enormous runoff, which discharges an annual average of 9 × 10¹¹ m3 of freshwater and 4 × 10⁸ t of sediment into the estuary from 1950s to 2000 (Chen et al., 2003), the Yangtze estuary is an extremely turbid area (Shen et al., 2010a). Taking 2009 as an example, the annually averaged SPM in surface waters varied from 58 g m−3 at the upstream limit of the estuary to about 600 g m−3 at the mouth area, and fell again to 57 g m−3 at the seaward limit of fresh water diffusion (Li et al., 2012). Due to the different river discharges, the SPM of the Yangtze estuary exhibits seasonal variations (Shen et al., 2013), with SPM in the upper estuary (lower estuary) during flood season significantly higher (lower) than that during the dry season. Over the past 37 years, SPM in the Yangtze estuary demonstrated an overall declining pattern (Luo et al., 2022), with SPM in the inner estuary responding most promptly (40.3 % reduction) after the operation of Three Gorges Dam. Chl-a also shows seasonal variations in the Yangtze estuary, ranging from 0.03 to 3.10 mg m−3 and from 0.88 to 31.5 mg m−3 during spring and summer seasons of 2008, respectively (Shen et al., 2010b). In addition, the Yangtze estuary is an area with frequent outbreaks of algal blooms, with diatoms being the most frequently reported group (Shen et al., 2019; Zhu et al., 2019).
Two hydrological stations in Chongming Island, Shanghai, China, namely Chongxi (longitude: 121.193∘ E, latitude: 31.759∘ N) and Baozhen (longitude: 121.609∘ E, latitude: 31.520∘ N) have been sampled from 30 May to 8 June in 2018 (Table 1).
The dataset contains measurements of the turbidity and, if available, concomitant SPM, absorption and attenuation coefficients, and Chl-a, and reflectance measurements are also included (Lavigne et al., 2022; https://doi.org/10.1594/PANGAEA.944313). An overview of the dataset, with the number of observations after quality control for each site and parameter, is provided in Table 2. The measurement methodology for each parameter is described below.
Table 2Number of observations for each sampling site.
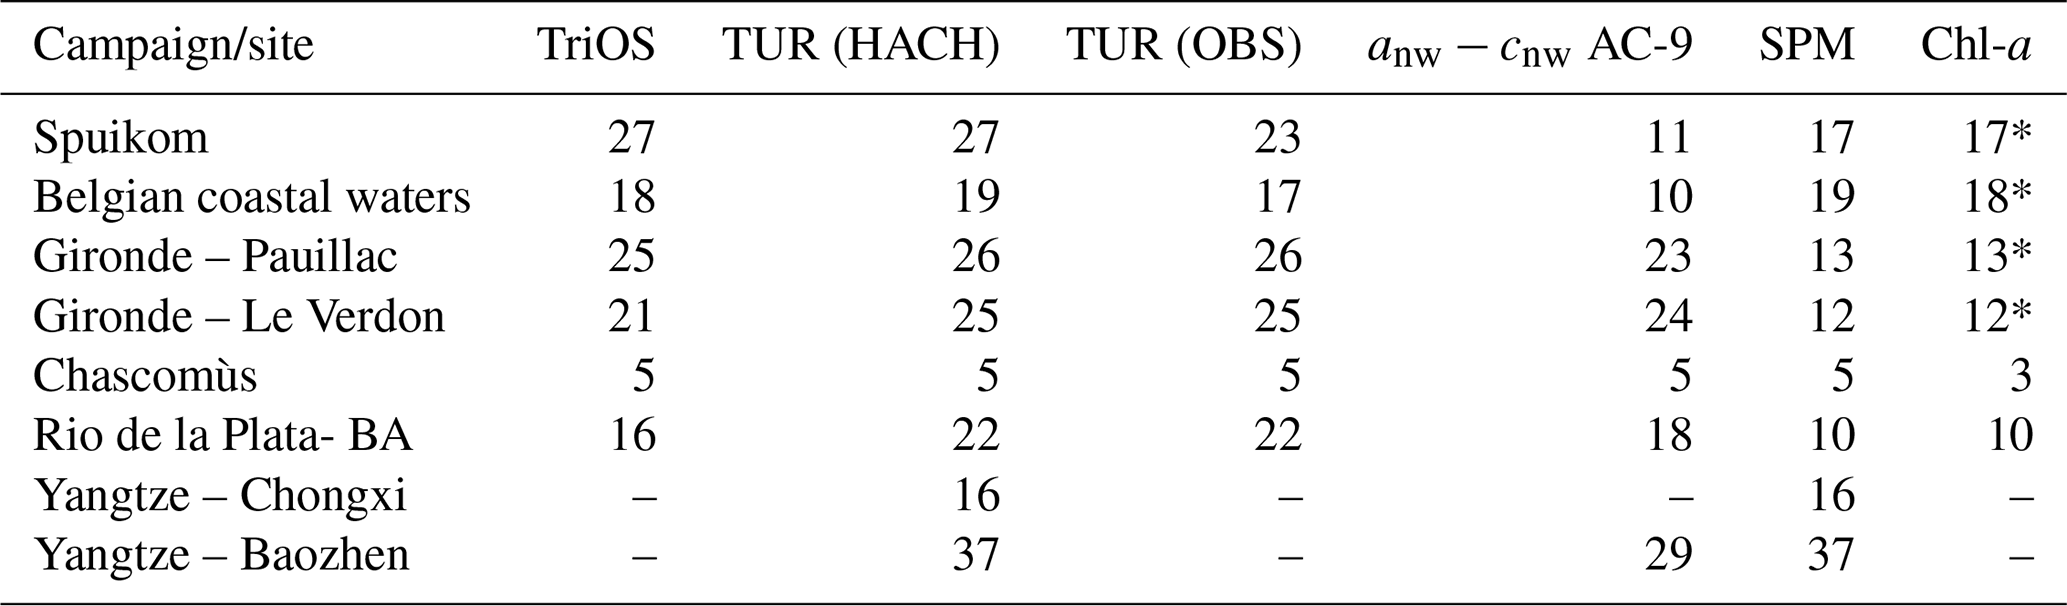
* Also includes pigment concentrations from HPLC (high-performance liquid chromatography).
3.1 Water-leaving reflectance
Above-water reflectance was determined using three TriOS/RAMSES hyperspectral spectroradiometers, two spectroradiometers measure radiance and one measures irradiance. The same TriOS instruments from the Royal Belgium Institute of Natural Sciences (RBINS) were used for all campaigns except the ones which occurred in Argentina, where only instruments from IAFE (Instistuto de Astronomía y FísicadelEspacio) institute were available. The spectrometers measure in the 350–950 nm range with a sampling interval of 3.3 nm and effective spectral resolution of 10 nm. The instruments were mounted on a frame and placed in the bow of the vessels (Belgian coastal zone and Spuikom) or fixed to a rail when measurements were made from pontoons (Gironde, Chascomús, and Rio de la Plata). Zenith angles of the sea- and sky-viewing radiance sensors were set to 40∘. Prior to each measurement, the azimuth angle of the sensors was adjusted to obtain a relative azimuth angle with respect to the sun of 90∘, either left or right to get the best unobstructed view of the water and minimize structure perturbation when measuring from pontoons. Simultaneous upwelling water radiance (Lu), downwelling sky radiance (Lsky), and downwelling irradiance (Ed) were collected every 10 s for 10 min. Data were acquired using MSDA-XE software and radiometrically calibrated using the latest calibration update from annual laboratory calibration. Water reflectance (ρw) was calculated following
where ρsky is the air–sea interface reflection coefficient which is calculated based, when available, on wind speed as in Ruddick et al. (2006) or set to a fixed value of 0.0256 when measured in estuaries from fixed pontoon considering that surface waves are fetch-limited and not related to wind speed. The data processing, including quality control, are described in Ruddick et al. (2006).
3.2 Turbidity
Turbidity was measured with two handheld HACH 2100P/Q ISO turbidimeters from RBINS and IAFE institutions. In the HYPERMAQ dataset, turbidity data measured with the instrument from IAFE were provided by default as they cover the most of the campaigns. However, when turbidity data from IAFE instrument were not available (Belgian coastal waters, April 2018 and Spuikom April 2018), the values obtained with the instrument of the RBINS were used. Figure 2 shows the good consistency of both instruments (r2=0.99). Water samples were collected from the surface with a bucket or from subsurface with a NISKIN bottle for measurements in coastal waters. A 10 mL vial was filled and turbidity was determined in formazin nephelometric unit (FNU) with the ratio of light scattered at 90∘ compared to the transmitted light at 860 nm. Turbidity was recorded in triplicates and the median value was used. Turbidimeters were controlled with standards STABCAL stabilized formazin turbidity of 0.1, 20, 100, and 800 FNU before and after each campaign.

Figure 2Comparison of simultaneous measurements of turbidity made from two different HACH instruments (r2=0.99).
In water, turbidity was also measured with an OBS501 (OBS hereafter) using a CR200 data logger. Turbidity measurements are derived from back-scattering with a field-of-view ranging from 125 to 170∘ and 90∘ side-scattering of a signal emitted at 850 nm, and data are provided in formazin backscatter unit (FBU) and in formazin nephelometric unit (FNU), respectively. When deployed from a pier, OBS was continuously recording data at subsurface throughout the whole day and values corresponding to specific stations were extracted from the time series in a time window of 10 min centered on the timing of the radiometric measurement and water sampling. When deployed from a boat, the OBS was maintained at subsurface (1 m depth) for at least 5 min. Then, from a visual check, leading and trailing data of each time series were removed and the central values were averaged to obtain a final value.
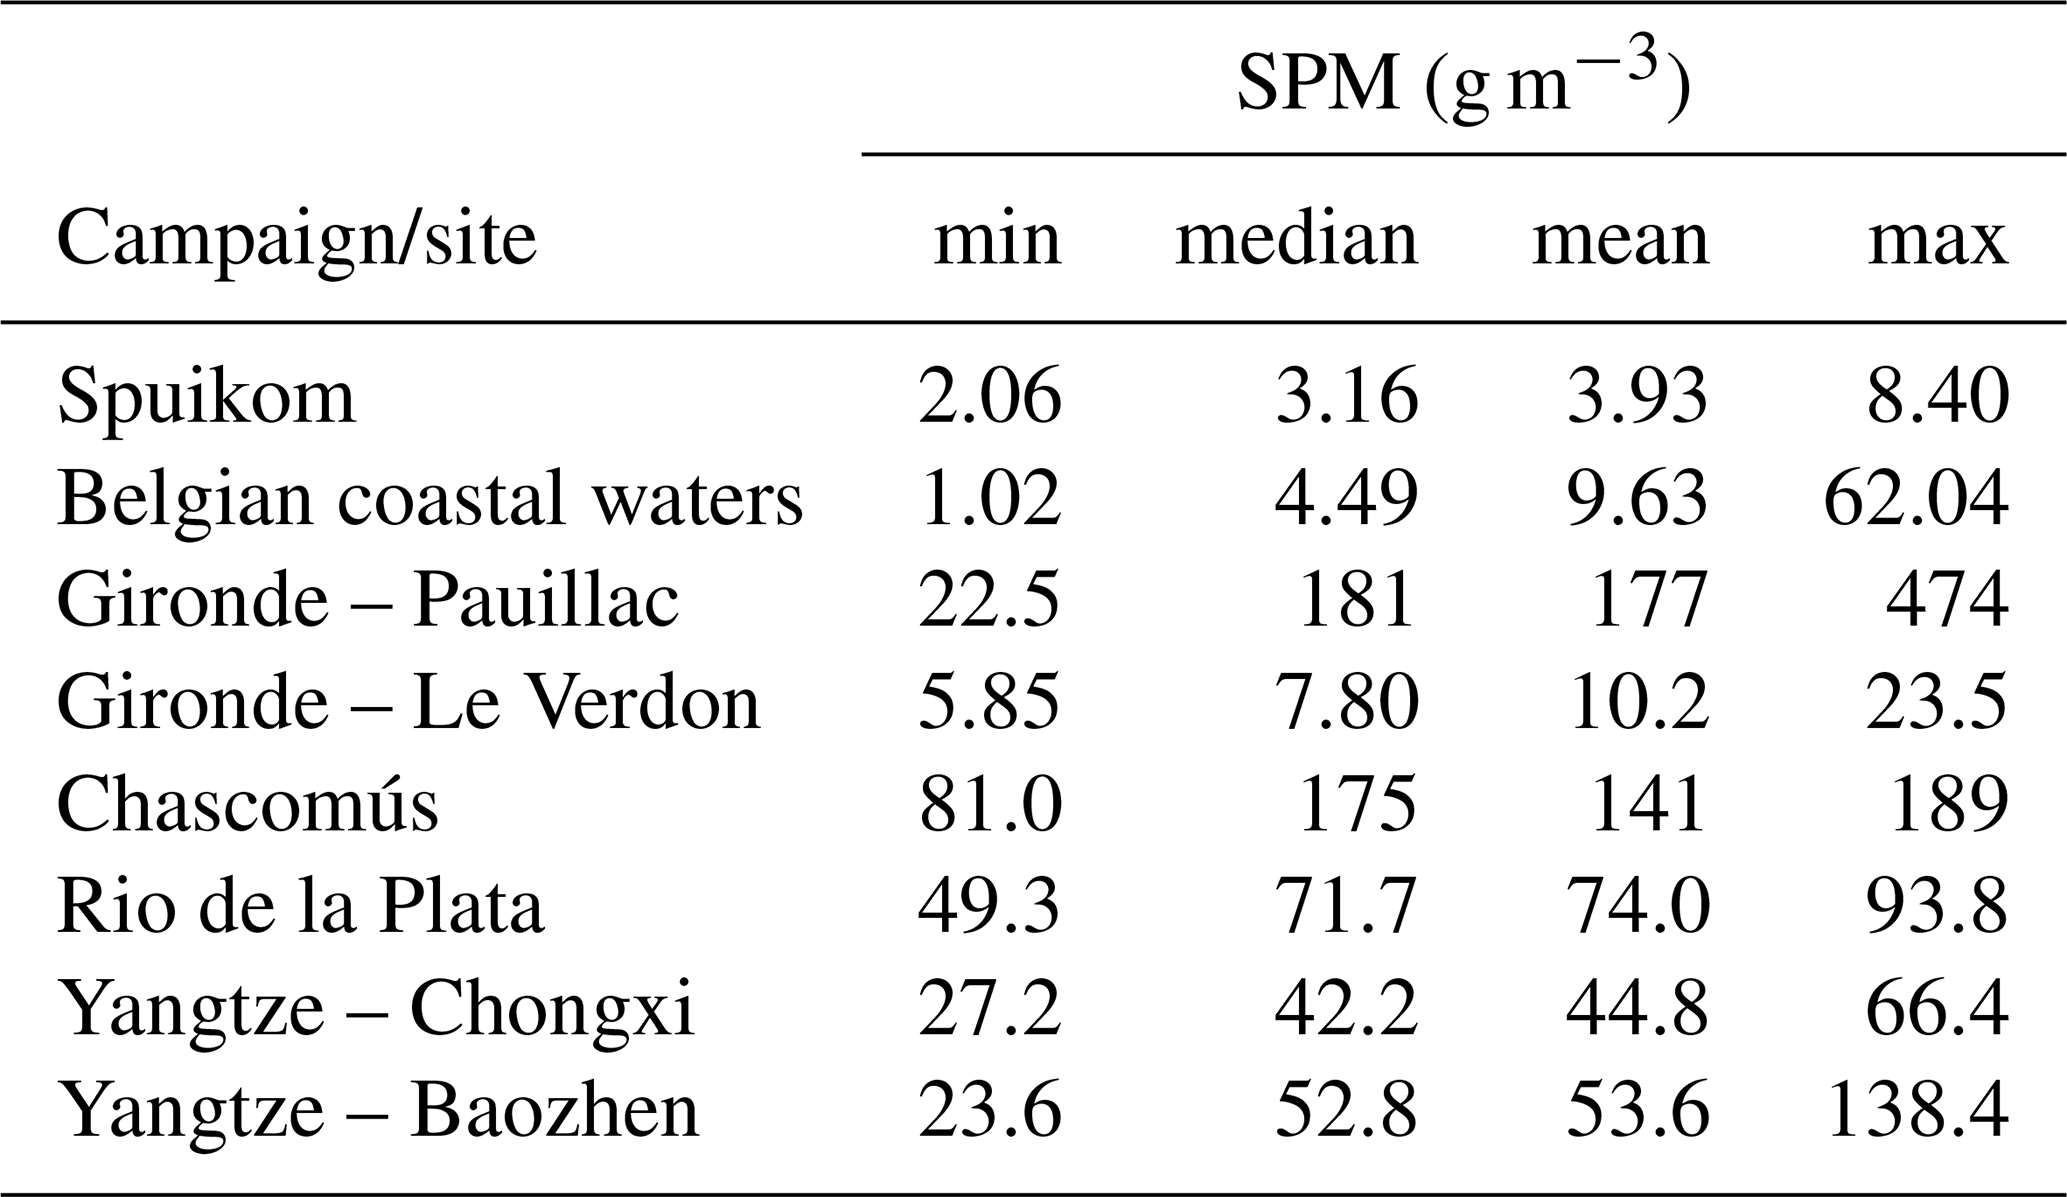
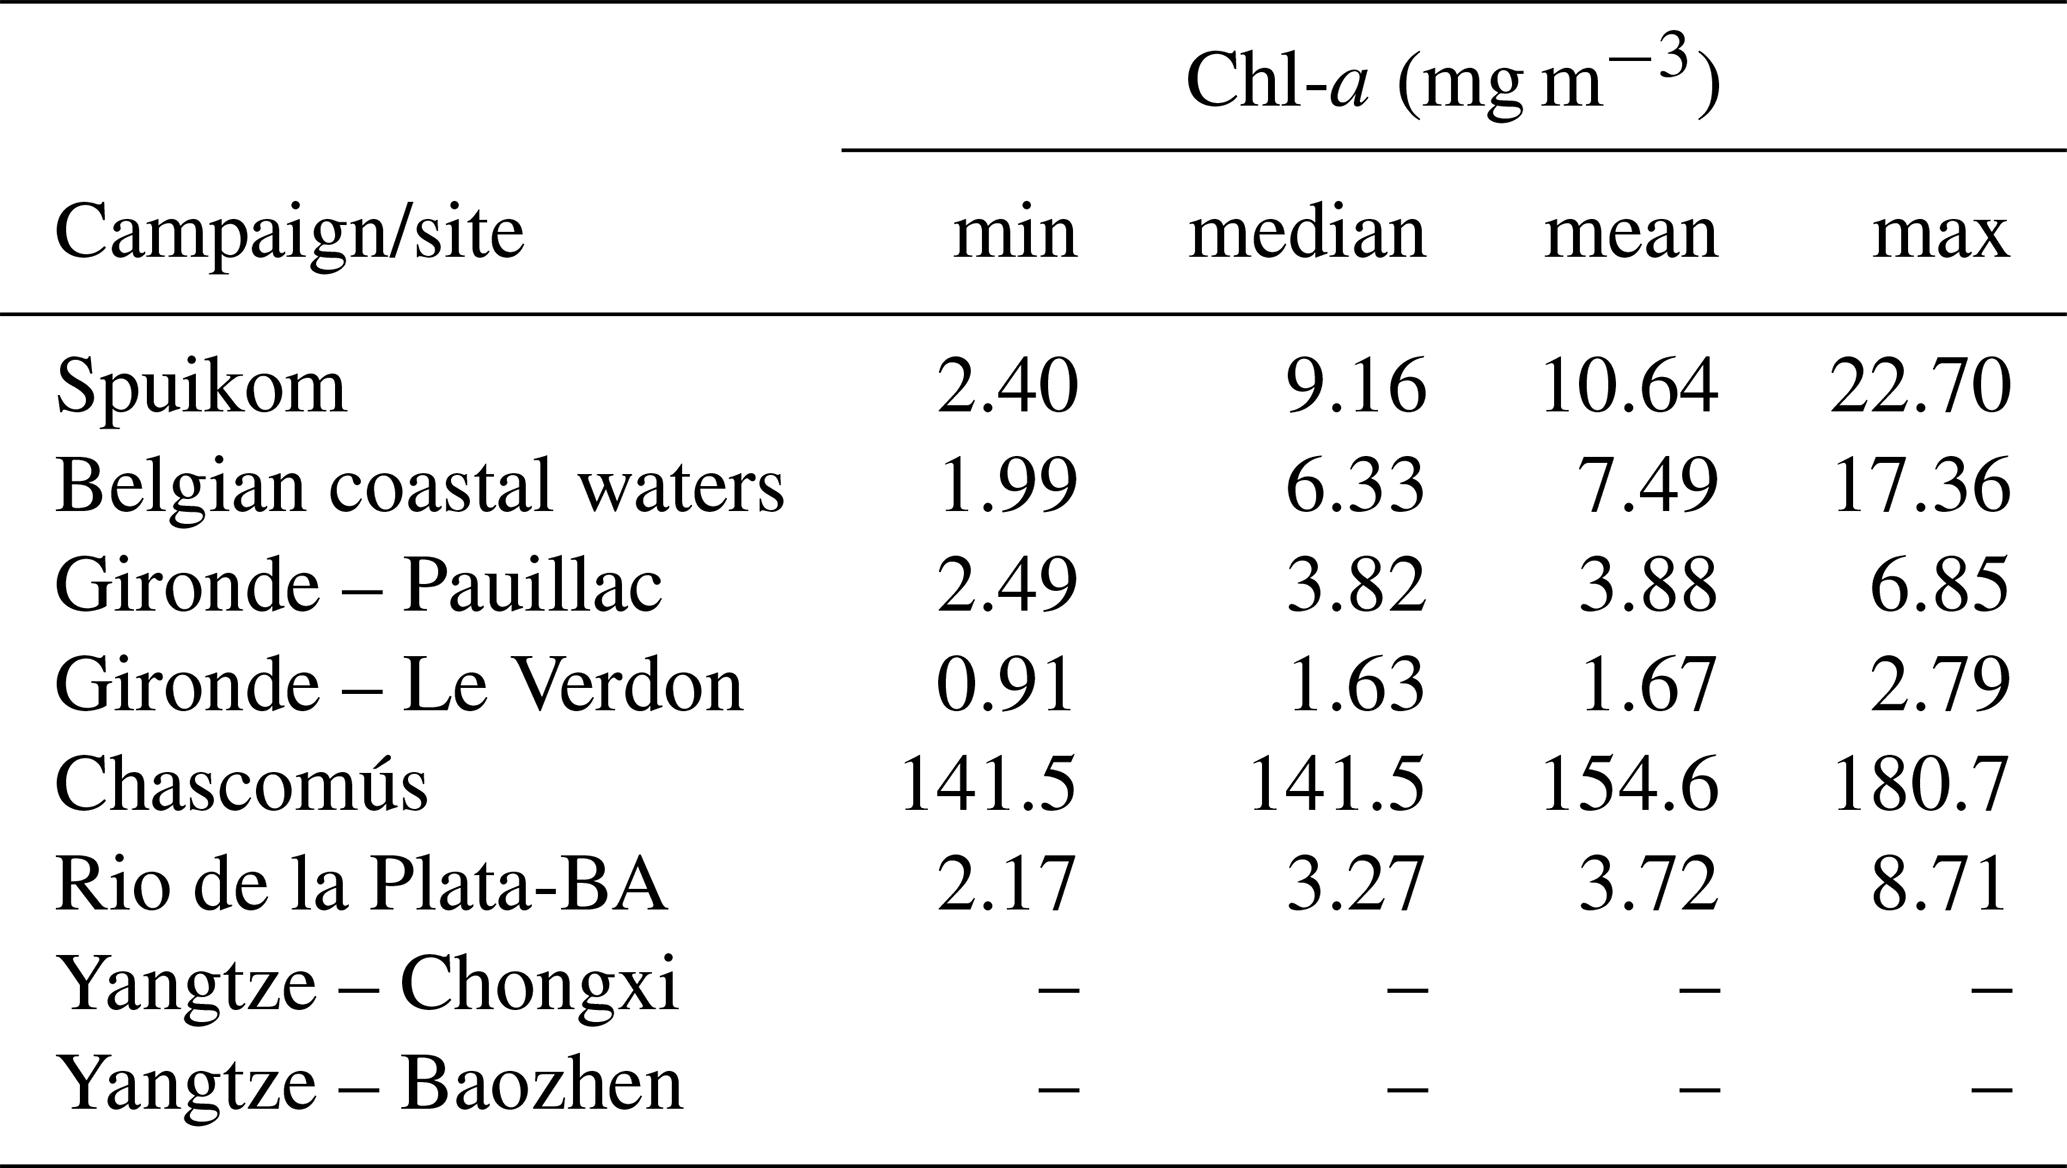
Table 4Distribution of Chl-a concentration (mg m−3) in each sampling site.
3.3 In situ absorption, beam attenuation, and scattering coefficients
The underwater absorption and attenuation meter (AC-9, WETLabs, Inc.) used was modified to cover the visible and near-infrared (NIR; 700 to 900 nm) spectral regions. It was designed with three visible (centered at 440, 555, and 630 nm) and six NIR (centered at 715, 730, 750, 767, 820, and 870 nm) spectral channels, and a short pathlength (10 cm) appropriate for turbid coastal waters. At the sampling sites, the AC-9 sensor was either deployed within the water column using an electrical water pump (SBE, SeaBird, Inc.) or used as a bench photometer passing the water samples right after collection through the tubes by gravimetry. The AC-9 data recorded just below the water surface were averaged over the last minute of acquisition to obtain the mean attenuation and absorption spectra for each station. Temperature and salinity corrections were applied as recommended by the manufacturer. As in Doxaran et al. (2007), the residual scattering effects on absorption measurements were corrected by applying the “proportional” method using 870 nm as the reference wavelength. The scattering coefficient was calculated as the difference between the measured beam attenuation coefficient, cnw, corrected for temperature and salinity effects, and the absorption coefficient, anw, corrected for temperature, salinity, and scattering effects. Those attenuation and absorption coefficients were referenced to pure water (non-water, subscript “nw”), so that the scattering coefficient obtained by difference corresponds to the scattering coefficient of marine particulates, bp in m−1. Small bubbles can contribute to the measured attenuation and scattering, but in turbid systems particles dominate the signal. One of the main issues encountered when sampling highly turbid waters was the saturation of the measured absorption and/or attenuation coefficients, which sometimes occurred at short visible wavelengths and even in near-infrared bands in the case of extremely turbid waters. This saturation was easily detected and the corresponding spectra were systematically removed from the dataset.
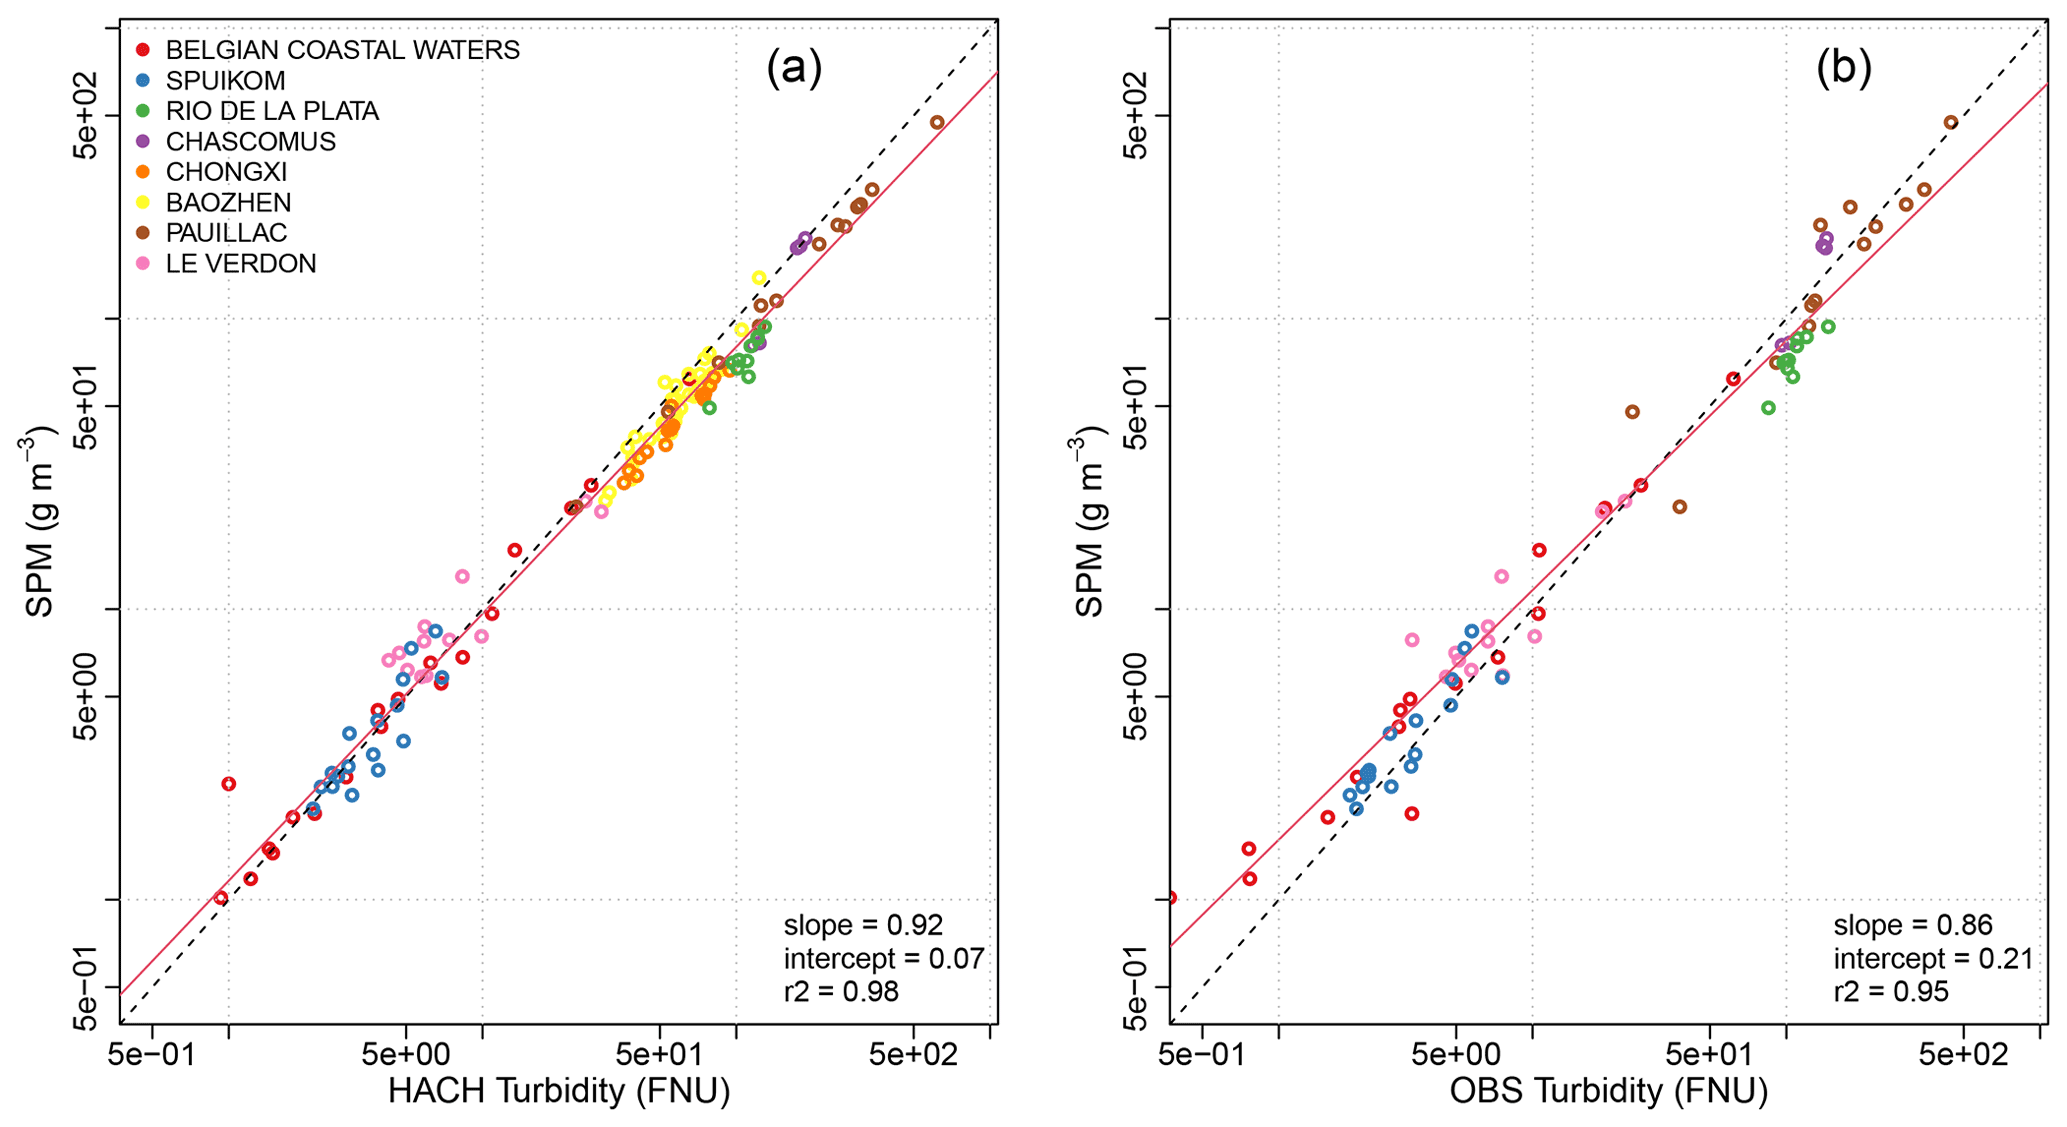
Figure 3SPM as a function of turbidity. Turbidity from OBS is given by the side-scattering measurement. The dotted line is the 1:1 line and the red line represents the linear regression between SPM and turbidity.
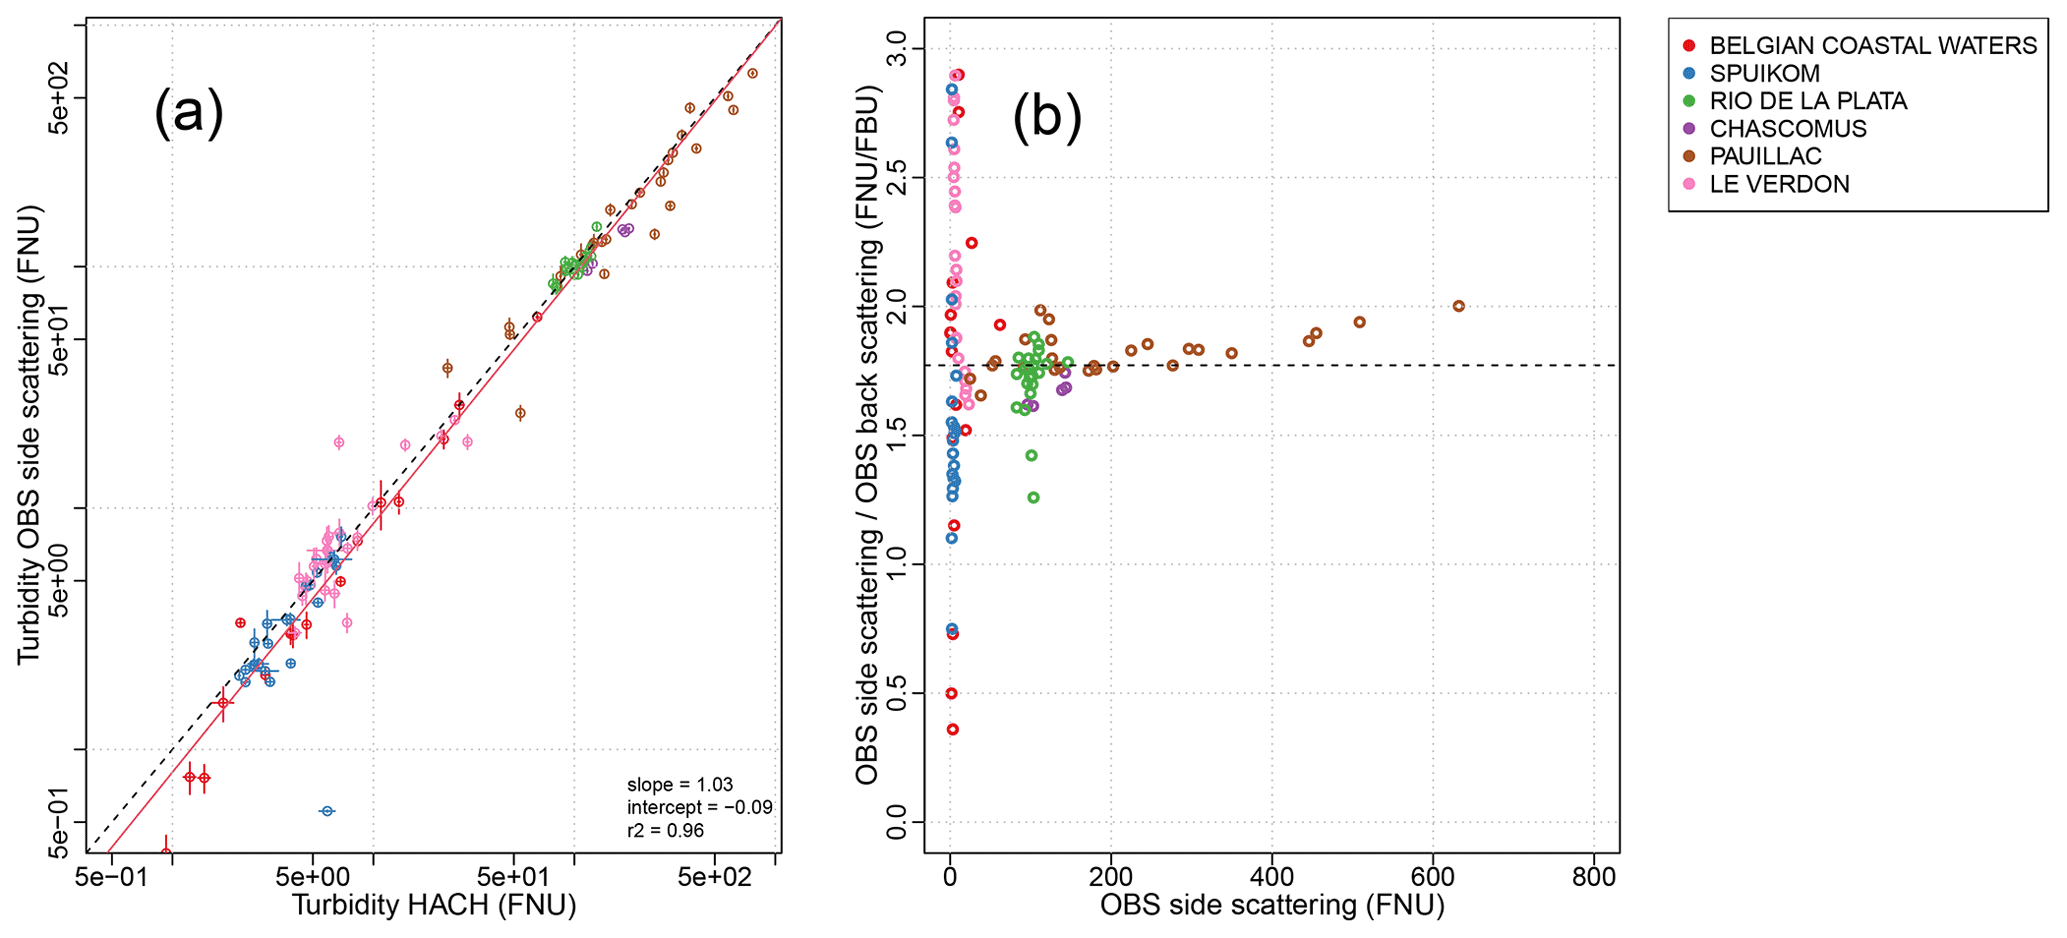
Figure 4Turbidity measured by HACH instrument as a function of side-scattering turbidity measured by the OBS instrument (a). The red line shows the least squares regression between these variables. (b) Ratio of the OBS side-scattering to backscattering ratio as a function of the OBS side-scattering. The horizontal dotted line represents the median value of the scattering ratio.
When possible, after AC-9 data measurements, the water sample collected was directly filtered through disc filters (pore size 0.2 µm, Whatman). As in Doxaran et al. (2009b), the tube was rinsed twice with Milli-Q water and once with the filtrate, and then filled with the filtrate. The absorption signal of the filtrate was measured, providing aCDOM in m−1 after applying corrections for temperature and salinity. The absorption coefficient of suspended particles (ap, in m−1) was finally calculated by subtracting the signal from the non-water absorption coefficient.
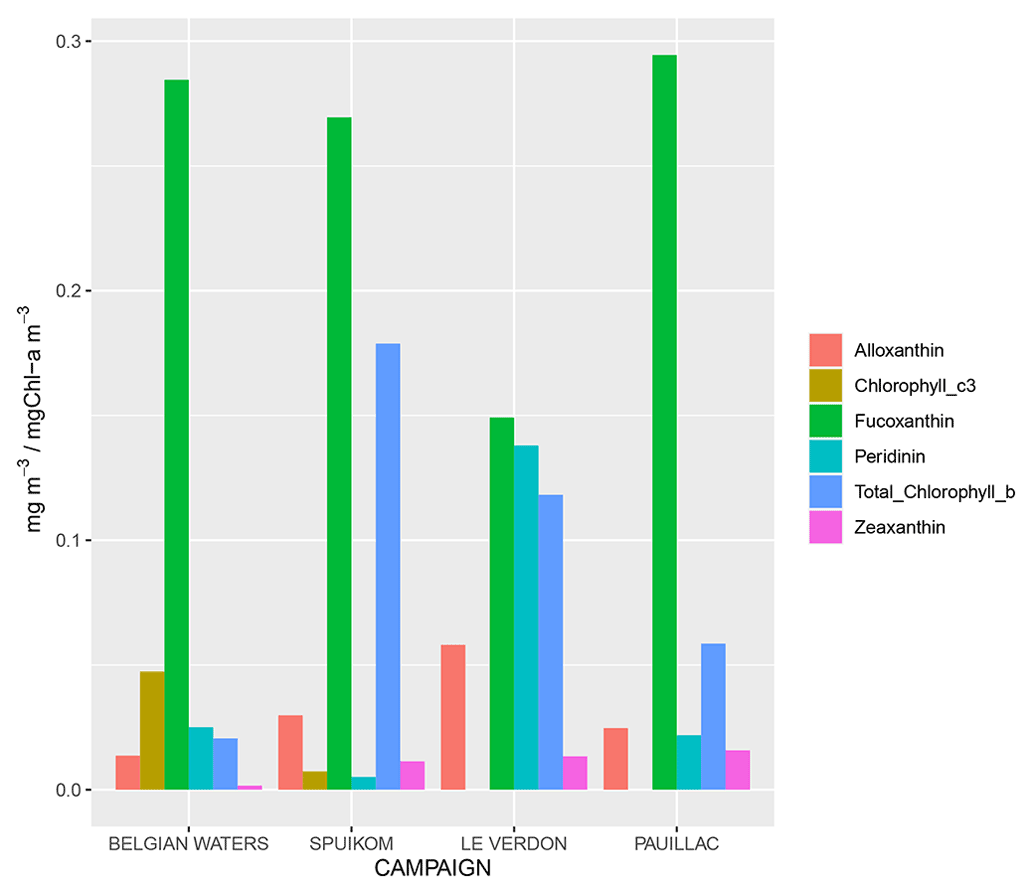
Figure 5For each campaign, average concentration of alloxanthin, fucoxanthin, peridinin, chlorophyll c3, zeaxanthin, and total chlorophyll b normalized by the concentration in chlorophyll-a.
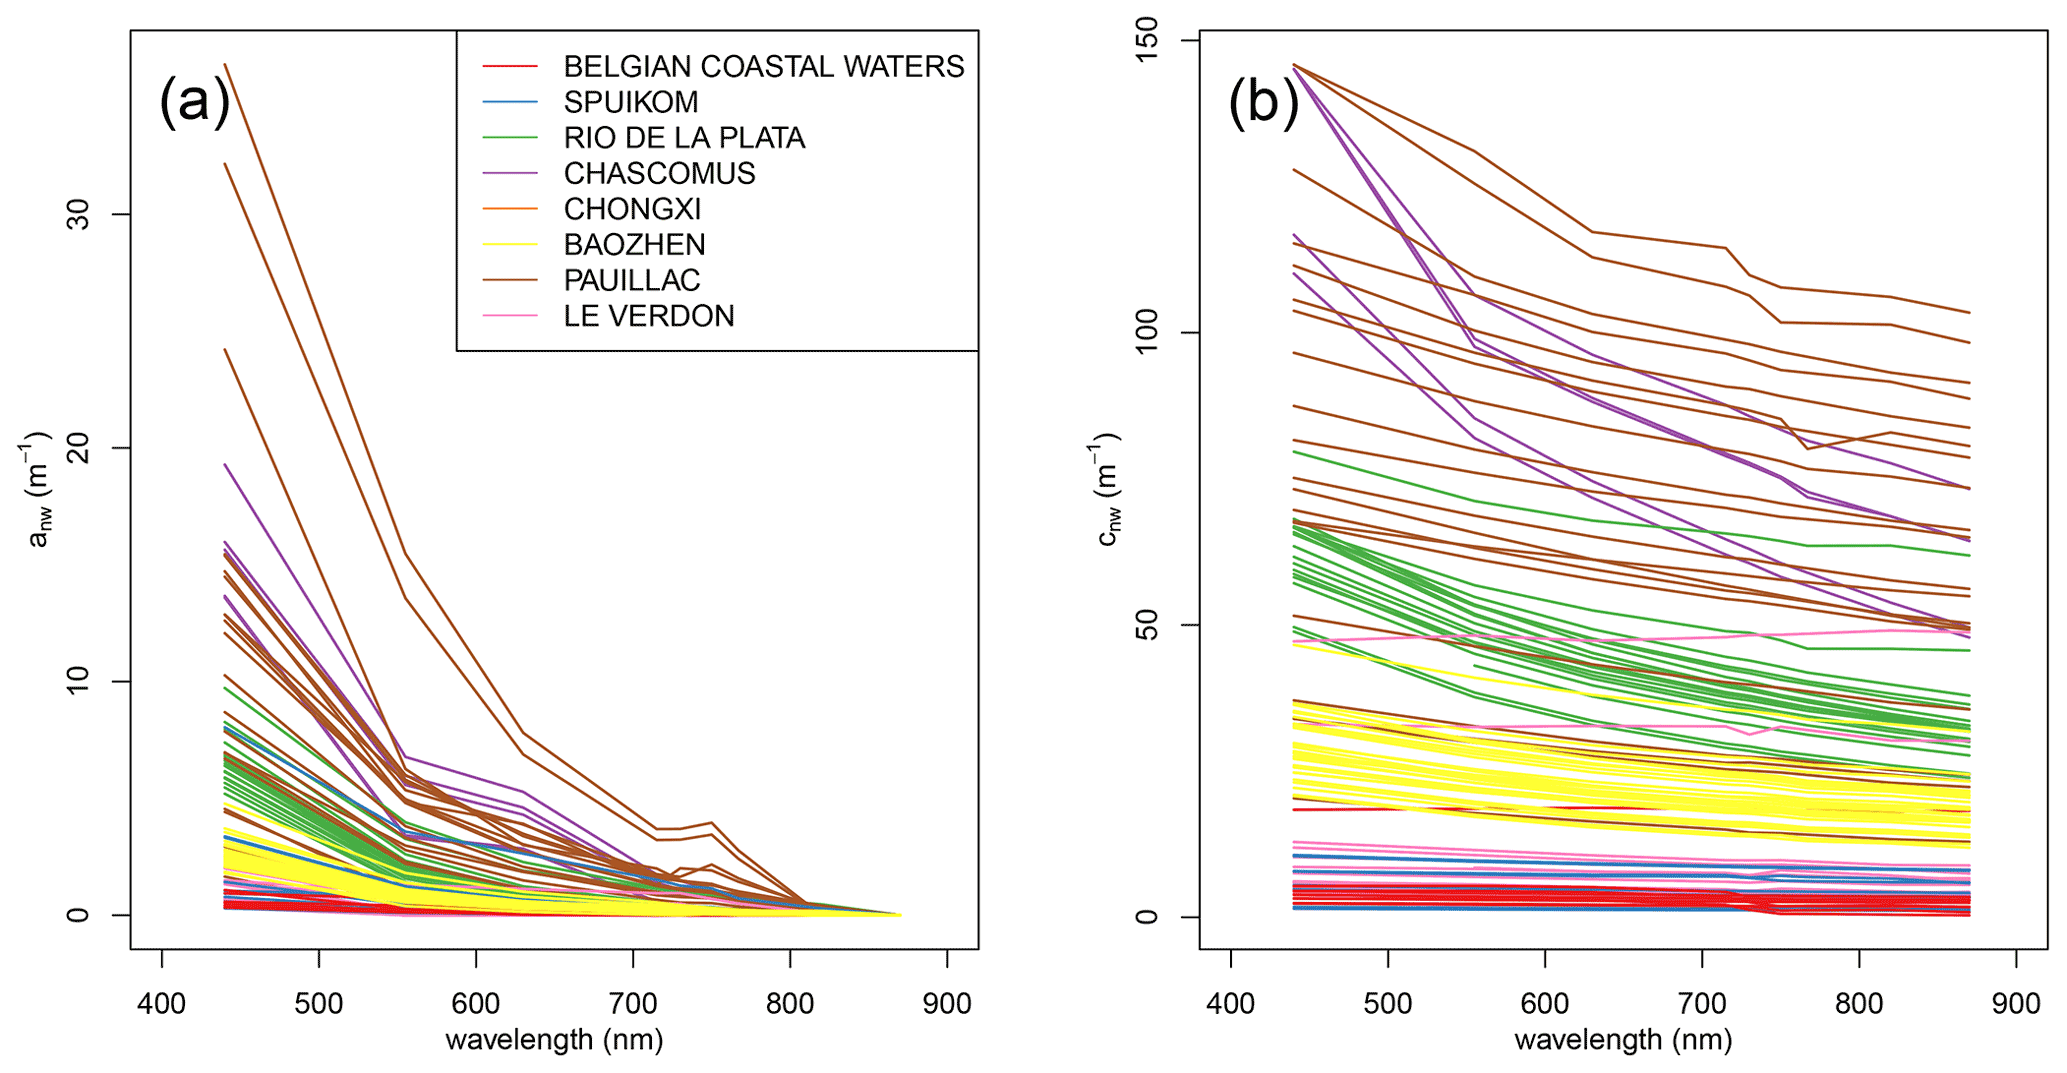
Figure 6Non-water absorption (a) and attenuation coefficients (b) measured with the AC-9 instrument.
3.4 Concentration of suspended particulate matter and suspended inorganic particulate matter
SPM concentration was determined gravimetrically following the protocol of Tilstone et al. (2002) which is based on Van der Linde (1998). Water was sampled from the surface (maximum 2 m depth) with a NISKIN bottle on board the RV Simon Stevin or with a bucket in estuarine and inland waters. A sufficient volume of water was filtered on a pre-ashed GF/F filter and conserved at −20 ∘C before analysis. The volume filtrated was determined as a function of the turbidity following recommendations of Neukermans et al. (2012). Inorganic suspended particulate matter (SPIM) was also calculated in all campaigns except in the Yangtze River. All the SPM measurements have been conducted with three replicates to assess variability except for the campaigns in the Yangtze estuary where only one sample has been measured per station. Filters were dried at 75 ∘C for 24 h and weighed in order to determine the suspended matter concentration (SPM, in g m−3). For SPIM measurements, filters were then burned at 450 ∘C for 4 h to remove the organic part, and weighed again to estimate the suspended inorganic particulate concentration (SPIM, in g m−3).
3.5 Chlorophyll-a and other pigment concentrations
Phytoplankton pigments including Chl-a were determined using high-performance liquid chromatography (HPLC) following the protocol of Van Heukelem and Thomas (2001) in campaigns in the Belgian coastal waters, the Spuikom, and the Gironde. In Belgian coastal waters, measurements were provided by the LifeWatchBE sampling campaigns (Mortelmans et al., 2019; Flanders Marine Institute, 2021) of VLIZ. Pigment standards were acquired from the Danish Hydrographic Institute (DHI). In the Gironde, the analysis of pigments was performed by the SAPIGH analytical platform of the “Institut de la Mer de Villefranche” (CNRS-France). In the Argentinian campaigns, Chl-a was determined spectrophotometrically using hot ethanol (60–70 ∘C) (Jespersen and Christoffersen, 1987). As for turbidity and SPM, water samples have been collected from surface water with a bucket in inland waters or subsurface waters with a NISKIN in sea water.
4.1 SPM and turbidity results
In the HYPERMAQ dataset, SPM ranges between 1 and 474 g m−3 (Table 3) and turbidity measured from HACH and OBS (side-scattering measurements) ranges between 0.9 and 771 FNU and between 0.2 and 632 FNU respectively. A very good relationship is observed between SPM and turbidity which almost follows the 1:1 line for both instruments (Fig. 3). A linear model between both parameters gives very good coefficients of determination (R2=0.98 for HACH and R2=0.95 for OBS) and slopes (0.92 for HACH and 0.86 for OBS). However, we can notice that for very high turbidity (>500 FNU), turbidity values measured by HACH tend to be slightly higher than SPM values (Fig. 3a) but not OBS turbidity values. As expected from previous results, when comparing side-scattering turbidity obtained from OBS and turbidity measured by HACH, a good relationship is retrieved (Fig. 4a) with a R2 of 0.96 and a slope of 0.84. Despite larger variability for very high turbidity, these results confirm that OBS is a good tool for continuous measurements of turbidity in turbid environments.
The ratio of the side scattering versus the back scattering derived from OBS measurements has a particular interest as it can provide information on the size and properties of the particles; e.g. a higher ratio could be explained by larger particles (Nechad et al., 2016). In the HYPERMAQ dataset, this ratio (Fig. 4b) displayed a very high variability in low turbidity environments and an increasing slope for high-turbidity environments (i.e. Pauillac) as also observed by Nechad et al. (2016). The very high variability when turbidity is low is explained by the strong impact of uncertainty on low back scattering values in the ratio calculation. In Fig. 4b, it can be observed that the side scattering versus back scattering ratio varies significantly between and within sampled sites. For instance, this ratio is higher in the Gironde estuary at Le Verdon than in the Spuikom lagoon. It seems also to be higher in the Río de la Plata and in the Gironde at Pauillac than in the Chascomús lake, though the Río de la Plata showed high variability. Finally, the median ratio of the whole dataset is 1.77, which is close to the mean value of 1.72 found in Nechad et al. (2016) in turbid waters.
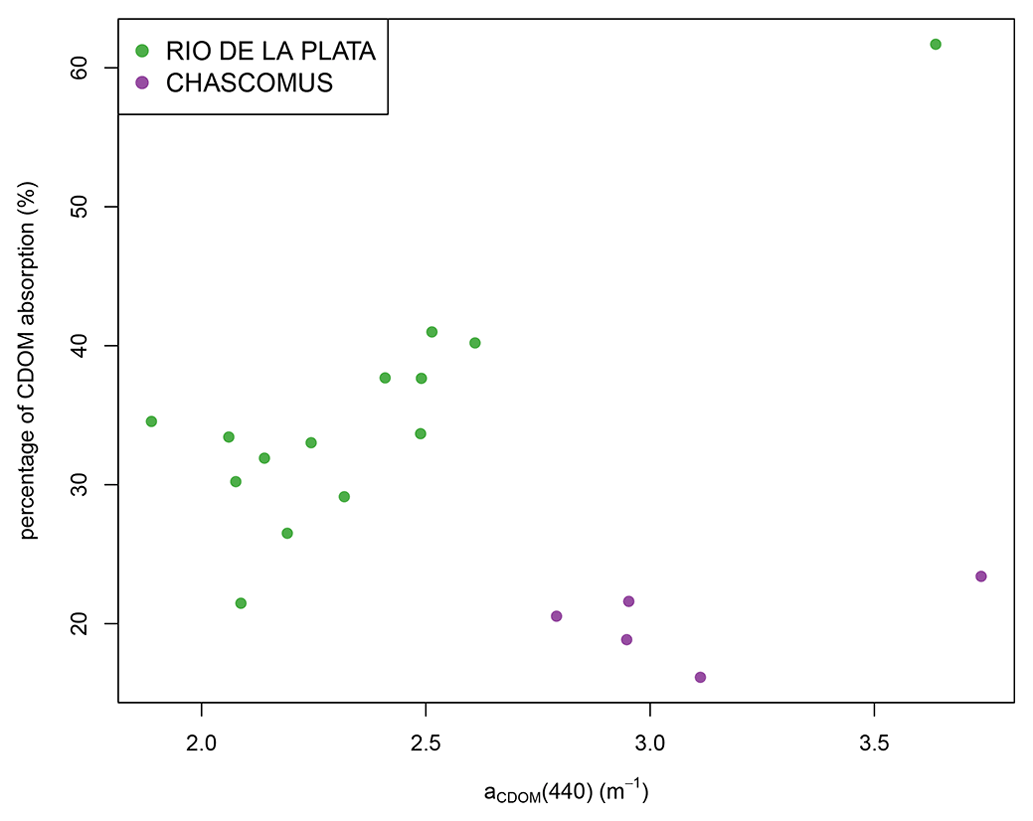
Figure 7Percentage of CDOM absorption as a function of aCDOM(440). aCDOM was only measured during two campaigns.
4.2 Chl-a and other pigment concentrations
Chl-a are extremely variable within HYPERMAQ test sites with values ranging between 0.91 mg m−3 in the Gironde estuary at Le Verdon and 180.7 mg m−3 in the Chascomùs lake, although most of the observations are within the range of 3 to 10 mg m−3 (Table 4). In addition, very high variability is observed within Belgian waters and Spuikom, with Chl-a values ranging by a factor of 10. This variability is mainly due to the fact these study areas have been sampled in two different seasons (i.e. spring and summer).
Phytoplankton pigments derived from HPLC analysis were available in the Gironde estuary, in the Belgian coastal waters, and in the Spuikom. The relative contribution of some key pigments for phytoplankton groups identification (Uitz et al., 2006; Mackey et al., 1996) are represented in Fig. 5. In the Gironde estuary at Le Verdon significant concentration of fucoxanthin, peridin, and chlorophyll-b are observed suggesting that diatoms, dinoflagellates, and chlorophytes are co-existing at similar levels. However, at Pauillac where phytoplankton biomass is higher (Table 4), the high concentration of fucoxanthin suggests that planktonic assemblages were dominated by diatoms. In Belgian waters, high value of fucoxanthin is also observed. This pattern was expected as fucoxanthin characterized the two phytoplankton groups which are dominant during spring and summer in the southern North Sea: diatoms and the prymnesiophyte Phaeocystisglobosa (Lancelot et al., 2005). The last one is also characterized by the presence of chlorophyll-c3. In the Spuikom, fucoxanthin and chlorophyll-b show high concentrations indicating an important proportion of diatoms and chlorophytes.
4.3 Absorption and attenuation coefficients
Very wide ranges of light absorption and attenuation coefficients were measured as representative of low to extremely turbid waters. As expected in CDOM- and sediment-rich waters, the spectral variations of the non-water absorption coefficients were closely following an exponential function, with decreasing values from short visible to near-infrared wavelengths (Fig. 6a). The respective contributions of CDOM and suspended particles to light absorption at 440 nm (Fig. 7) were observed to vary from 20 % to 40 % for CDOM and hence from 60 % to 80 % for suspended particles, which could be expected in productive waters strongly influenced by sediment inputs from rivers and resuspension effects.
The spectral variations of the non-water attenuation coefficients (cnw, Fig. 6b) showed a smooth decrease with increasing wavelengths, closely following the power law function with varying slopes. These variations of the spectral slope are expected to be representative of different particle size distributions due to the combined influences of wind-driven and tidal currents, and to the mixing between mineral-rich (sediments) and organic-rich (phytoplankton) particles.
4.4 Water reflectance
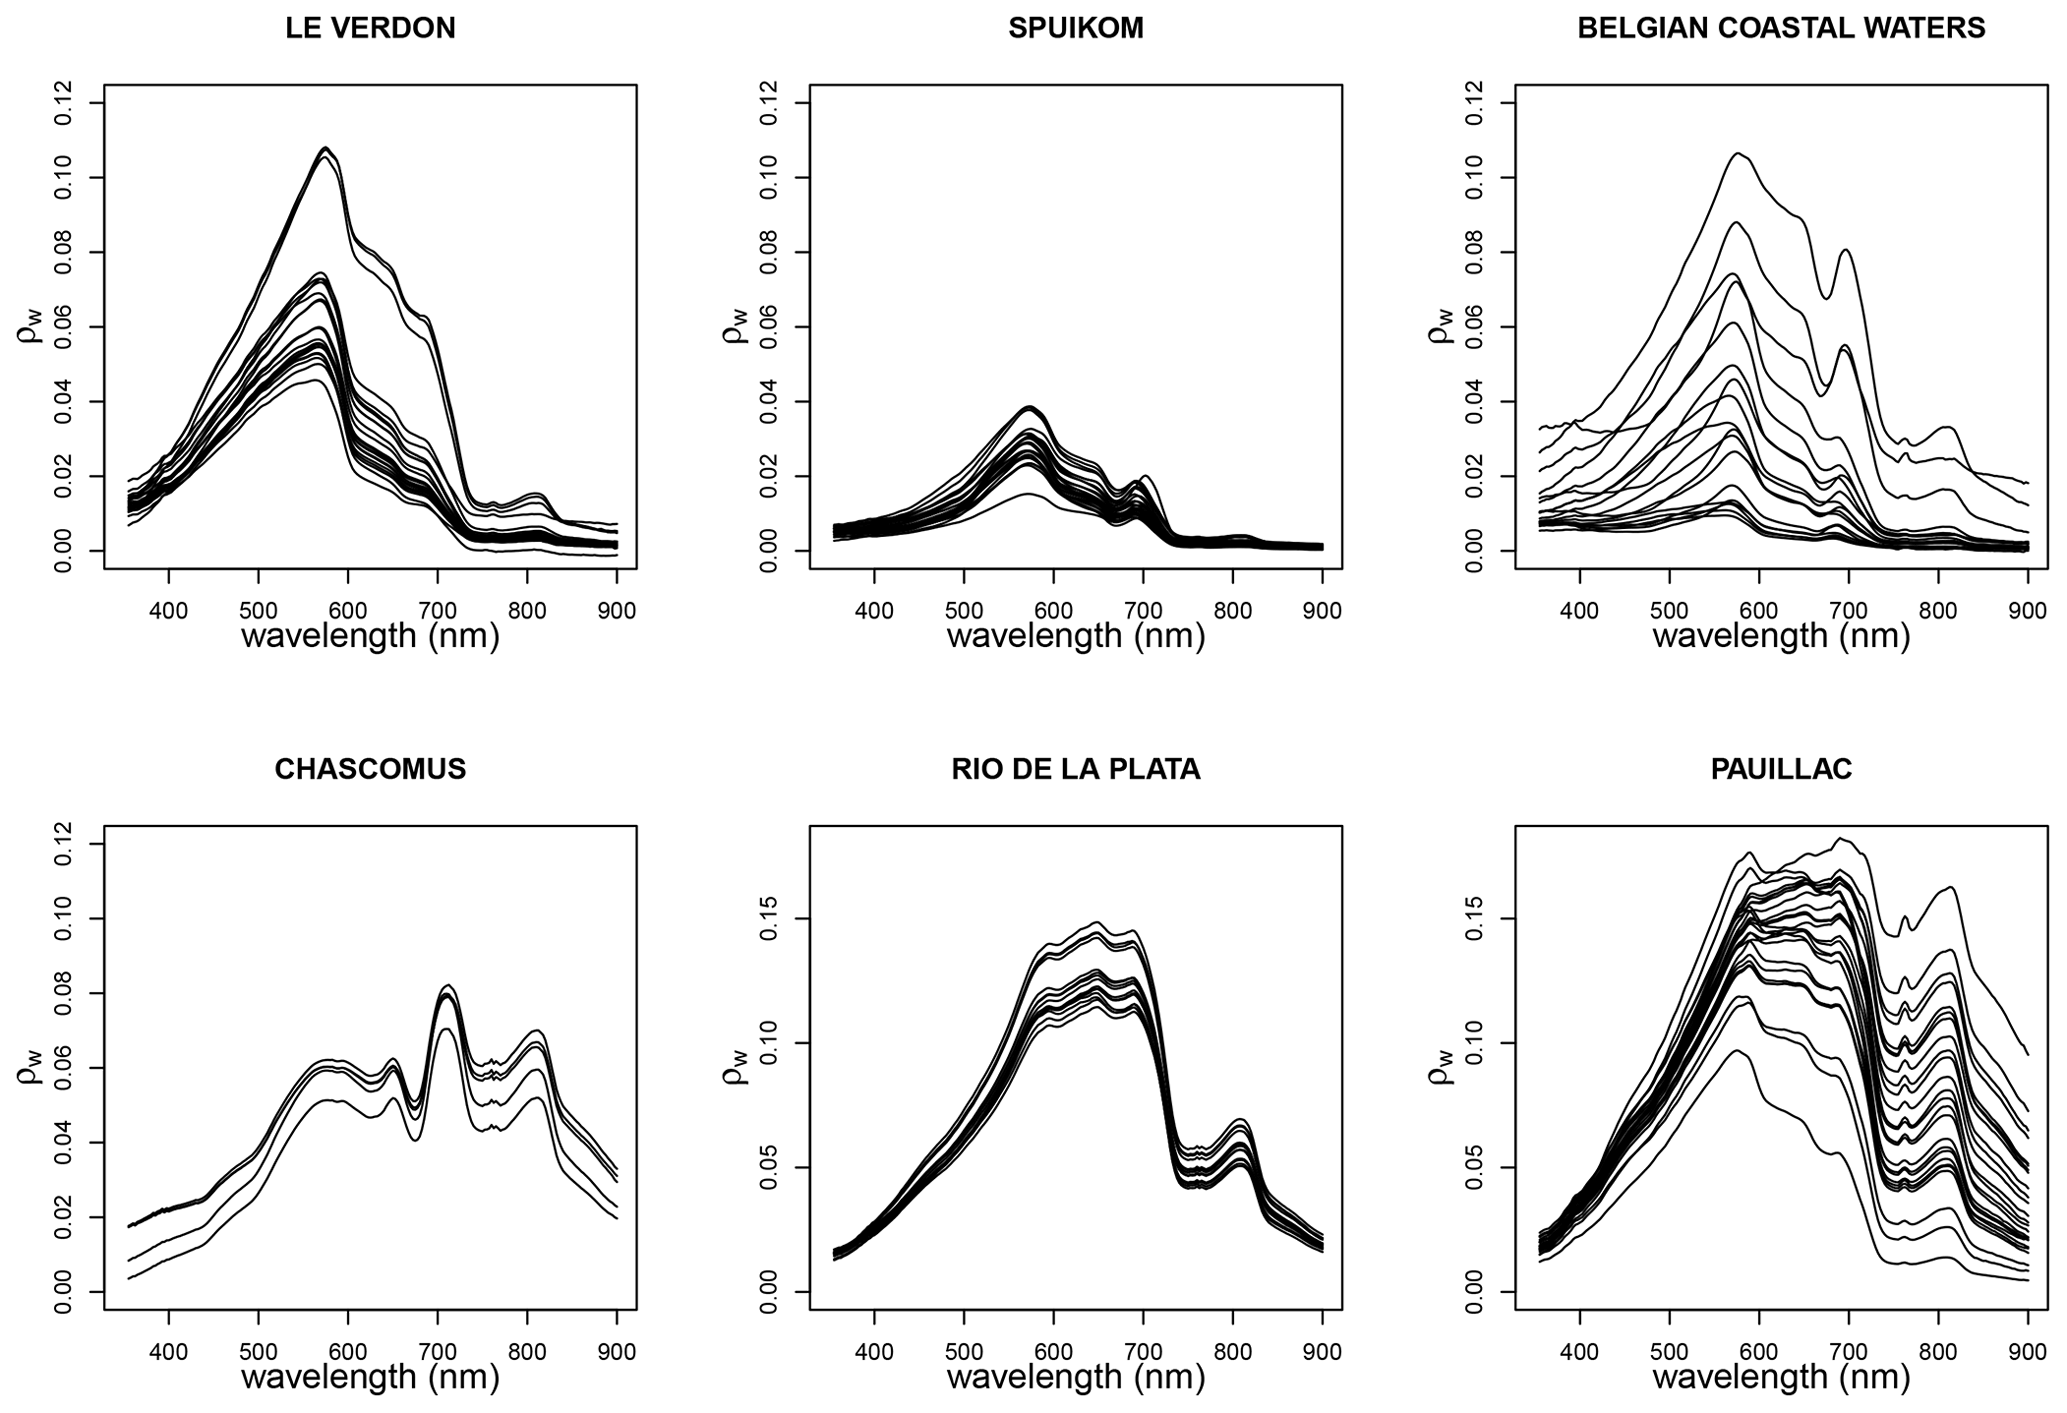
The large diversity of water-leaving reflectance spectra is displayed in Fig. 8. Maximum reflectance in each spectrum varies from less than 0.02 on some spectra of the Belgian coastal waters to more than 0.15 in the Gironde estuary at Pauillac. Shapes of the spectra are also very variable. The mark of strong chlorophyll-a absorption around 670 nm is well observed in the Chascomús and Spuikom lakes as well as in some spectra of the Belgian coastal waters. The two extremely turbid sampling stations, the Rio de la Plata and the Gironde at Pauillac, show some similarities in their spectral shapes although a large variability is observed at Pauillac due to a larger impact of tides.
The relationship of water reflectance at 645 and 860 nm and turbidity (Fig. 9) shows expected patterns with a saturation of the reflectance at 645 nm when turbidity is higher than 200 FNU (Luo et al., 2018). Indeed, for these extreme turbidity values the band at 860 nm shows a more linear relationship.
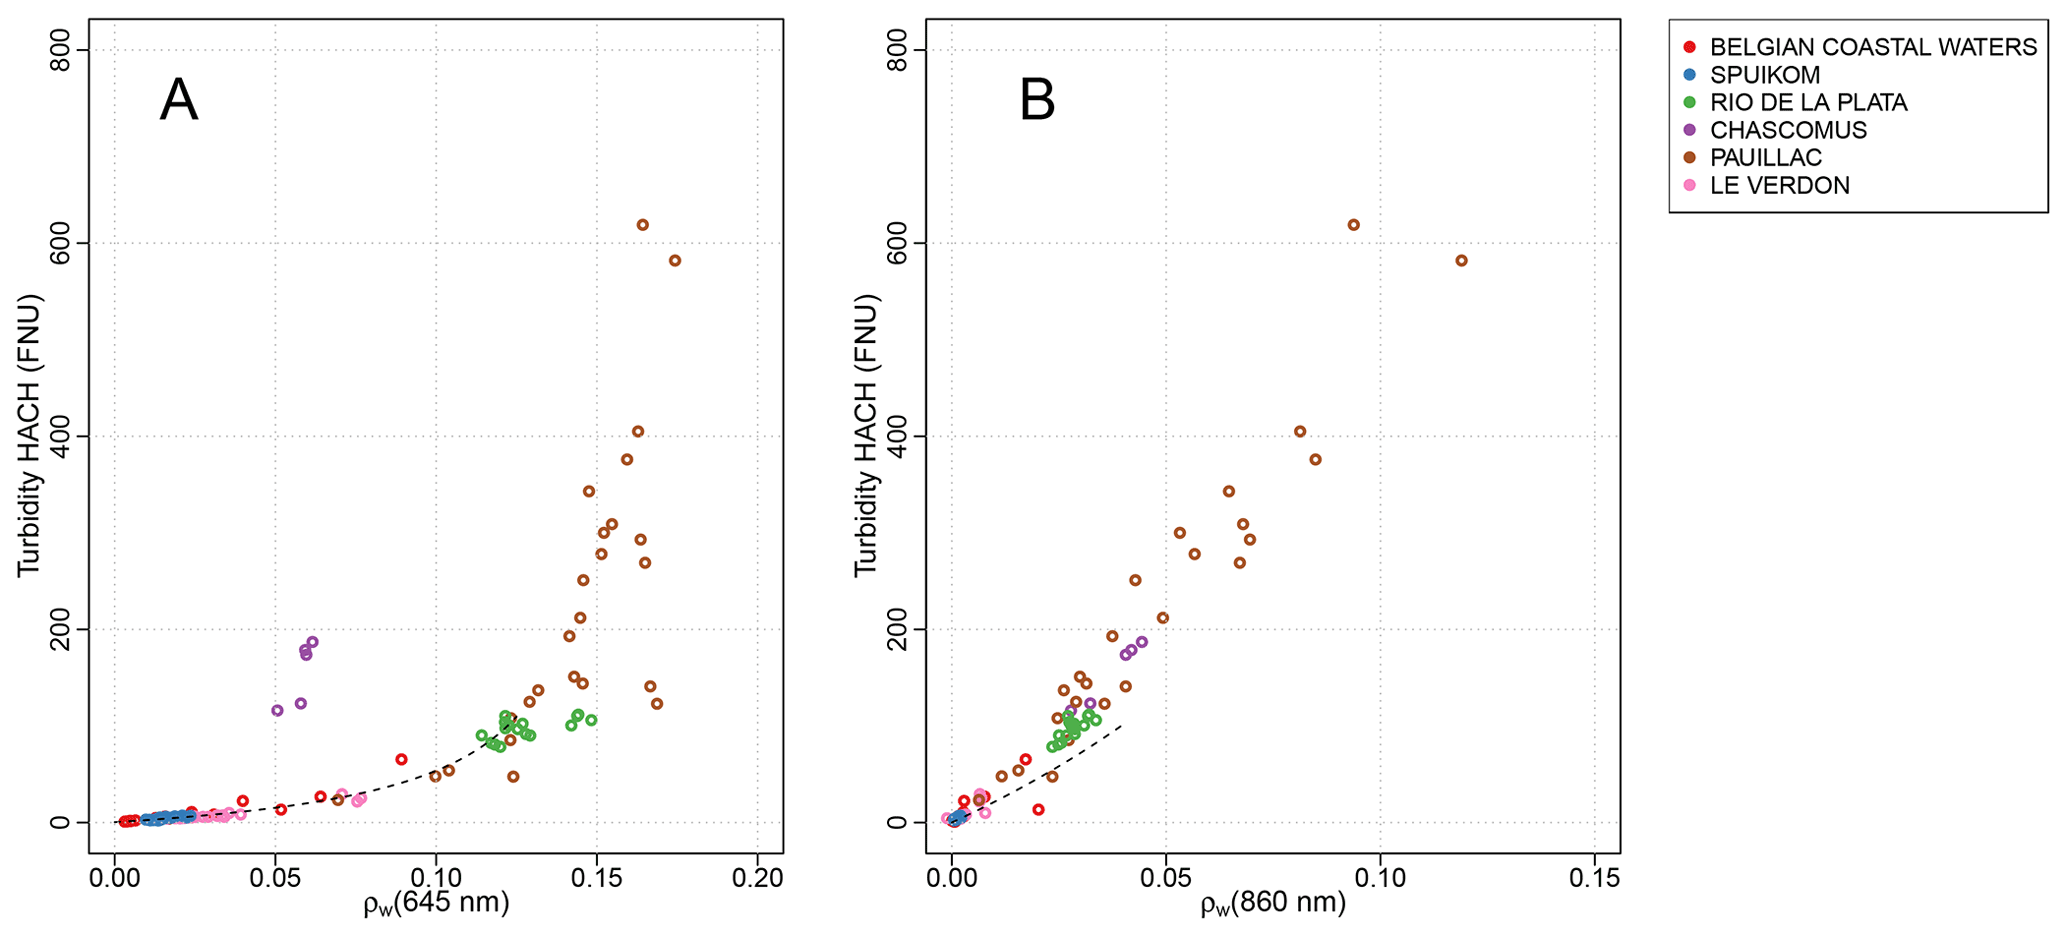
Figure 9Turbidity as a function of water reflectance at 645 nm (a) and 850 nm (b). Black dotted line represents the model of Nechad et al. (2009) between 0 and 100 FNU.
Data are available from Lavigne et al. (2022), hosted at PANGAEA (http://www.pangaea.de, last access: 24 October 2022) under the https://doi.org/10.1594/PANGAEA.944313.
Coastal and inland waters strongly interact with human activities. Some of these activities, like fisheries or tourism, rely on a good ecological status whereas the same activities but also others like farming, industry, or urbanization tend to affect water quality. Hence, monitoring these waters is extremely important, and for that optical remote sensing is a valuable tool as it allows a large spatial and temporal coverage. However, it is still challenging to retrieve biogeochemical parameters in complex case 2 waters (Odermatt et al., 2012) because the transfer of light in water is affected by temporally and spatially variable inputs of CDOM and terrestrial sediments. To help the scientific community to build comprehensive database for the development of algorithms, the HYPERMAQ dataset provides data for six different studies areas with SPM and Chl-a ranging from moderate to extremely turbid and productive, and located over three continents (i.e. Europe, South America, and Asia). The HYPERMAQ dataset includes big river estuaries characterized by high turbidity, inland lagoons with productivity ranging from moderate to extreme, and finally Belgian coastal waters in the North Sea characterized by the high spatio-temporal variability of optical properties (Vantrepotte et al., 2012). The parameters shared in the HYPERMAQ dataset include descriptors of biogeochemical conditions (i.e. Chl-a, SPM, turbidity), and AOPs (i.e. water reflectance) and IOPs (anw and cnw). Although this dataset does not aim to cover the whole variability of case 2 waters, it provides valuable information to describe turbid and even extremely turbid waters and has the potential to help the development of remote sensing algorithms. It can also contribute to the production of a larger optical database, based on in situ measurements for a comprehensive description of case 2 waters.
HL, AD, DD, FS, AC, XS, JIG, PRR, MB, QV and KR participated to one or more field campaigns. Data processing has been made by HL, AD and JIG (turbidity), DD (absorption), KR, MB, QV, PRR, AD (water reflectance), and AC, AD, DD, FS, KS (chlorophyll-a, pigments and SPM). HL, DD, AD have compiled data and created the final dataset. All the authors participated in manuscript redaction and revision.
The contact author has declared that none of the authors has any competing interests.
Publisher’s note: Copernicus Publications remains neutral with regard to jurisdictional claims in published maps and institutional affiliations.
This work has been founded and promoted by the Research program for earth observation 580 STEREO III HYPERMAQ project (contract nr. SR/00/335). Flemish LifeWatch BE programme, funding by FWO, is thanked for its contribution to the water sampling in the Belgian Coastal Zone. We thank VLIZ for providing the Zeekat and ship time on the RV Simon Stevin and her crew for their support during sampling. Inland water sampling in Belgium was also founded by the Belspo PONDER (SR/00/325) project. The SAPIGH analytical platform of the “Institut de la Mer de Villefranche” (CNRS-France) is thanked for having performed the analysis of pigments in the Gironde. NASA, USGS, ESA, and EUMETSAT are thanked for offering free access to Landsat 8 and Sentinel 2 images.
This research has been supported by the Belgian Federal Science Policy Office (STEREO III (grant nos. SR/00/335 and SR/00/325)) and the Fonds Wetenschappelijk Onderzoek (Flemish LifeWatch BE programme grant).
This paper was edited by François G. Schmitt and reviewed by Giorgio Dall'Olmo and one anonymous referee.
Abril, G., Etcheber, H., Le Hir, P., Bassoullet, P., Boutier, B., and Frankignoulle, M.: Oxic/anoxic oscillations and organic carbon mineralization in an estuarine maximum turbidity zone (The Gironde, France), Limnol. Oceanogr., 44, 1304–1315, 1999.
Aubriot, L., Zabaleta, B., Bordet, F., Sienra, D., Risso, J., Achkar, M., and Somma, A.: Assessing the origin of a massive cyanobacterial bloom in the Río de la Plata (2019): Towards an early warning system, Water Res., 181, 115944, https://doi.org/10.1016/j.watres.2020.115944, 2020.
Castaing, P. and Allen, G. P.: Mechanisms of seaward escape of suspended sediment from the Gironde: a macrotidal estuary in France, Mar. Geol., 40, 101–118, 1981.
Castagna, A., Amadei Martínez, L., Bogorad, M., Daveloose, I., Dasseville, R., Dierssen, H. M., Beck, M., Mortelmans, J., Lavigne, H., Dogliotti, A., Doxaran, D., Ruddick, K., Vyverman, W., and Sabbe, K.: Optical and biogeochemical properties of diverse Belgian inland and coastal waters, Earth Syst. Sci. Data, 14, 2697–2719, https://doi.org/10.5194/essd-14-2697-2022, 2022.
Chen, Z., Saito, Y., Hori, K., Zhao, Y., and Kitamura, A.: Early Holocene mud-ridge formation in the Yangtze offshore, China: a tidal-controlled estuarine pattern and sea-level implications, Mar. Geol., 198, 245–257, 2003.
Diovisalvi, N., Berasain, G., Unrein, F., Colautti, D., Fermani, P., Llames, M. E., Torremorel, A. M., Lagomarsino, L., Pérez, G., Escaray, R., Bustingorry, J., Ferraro, M., and Zagarese, H.: Chascomús: estructura y funcionamiento de una laguna pampeana turbia, Ecología Austral, 20, 115–127, 2010.
Diovisalvi, N., Salcedo Echeverry, G. E., Lagomarsino, L., Zagarese, M. E.: Seasonal patterns and responses to an extreme climate event of rotifers community in a shallow eutrophic Pampean lake, Hydrobiologia, 1, 125–137, https://doi.org/10.1007/s10750-014-1909-2, 2014.
Dogliotti, A. I., Camiolo, M., Simionato, C., Jaureguizar, A. J., Guerrero, R. A., and Lasta, C. Á.: First optical observations in the turbidity maximum zone in the Río de la Plata estuary: A challenge for atmospheric correction algorithms, Ocean Optics XXII (USA, 26 al 31 de octubre de 2014), 2014.
Dogliotti, A. I., Ruddick, K., and Guerrero, R.: Seasonal and inter-annual turbidity variability in the Río de la Plata from 15 years of MODIS: El Niño dilution effect, Estuar. Coast. Shelf Sci., 182, 27–39, 2016.
Dogliotti, A. I., Gossn, J. I., Gonzalez, C., Yema, L., Sanchez, M., and O'Farrell, I. L.: Evaluation of Multi-and Hyper-Spectral Chl-a Algorithms in the RÍo De La Plata Turbid Waters During a Cyanobacteria Bloom, in: 2021 IEEE International Geoscience and Remote Sensing Symposium IGARSS, 7442–7445, IEEE, https://doi.org/10.1109/IGARSS47720.2021.9553148, 2021.
Doxaran, D., Froidefond, J. M., Lavender, S. J., and Castaing, P.: Spectral signature of highly turbid waters. Application with SPOT data to quantify suspended particulate matter concentrations, Remote Sens. Environ., 81, 149–161, 2002.
Doxaran, D., Babin, M., and Leymarie, E.: Near-infrared light scattering by particles in coastal waters, Opt. Exp., 15, 12834–12849, 2007.
Doxaran, D., Froidefond, J. M., Castaing, P., and Babin, M.: Dynamics of the turbidity maximum zone in a macrotidal estuary (the Gironde, France): Observations from field and MODIS satellite data, Estuar. Coast. Shelf Sci., 81, 321–332, 2009a.
Doxaran, D., Ruddick, K., McKee, D., Gentili, B., Tailliez, D., Chami, M., and Babin, M.: Spectral variations of light scattering by marine particles in coastal waters, from the visible to the near infrared, Limnol. Oceanogr., 54, 1257–1271, 2009b.
Flanders Marine Institute: LifeWatch observatory data: nutrient, pigment, suspended matter and secchi measurements in the Belgian Part of the North Sea, VLIZ, https://doi.org/10.14284/441, 2021.
Framiñan, M. B. and Brown, O. B.: Study of the Río de la Plata turbidity front: I. Spatial and temporal distribution, Cont. Shelf Res., 16, 1259–1282, 1996.
Hieronymi, M., Krasemann, H., Müller, D., Brockmann, C., Ruescas, A., Stelzer, K., and Regner, P.: Ocean colour remote sensing of extreme case-2 waters, Spectrum, 2, 4, Living Planet Symposium, Proceedings of the conference held 9–13 May 2016 in Prague, Czech Republic, edited by: Ouwehand, L., ESA-SP Volume 740, ISBN 978-92-9221-305-3, p. 56, 2016.
Hieronymi, M., Müller, D., and Doerffer, R.: The OLCI Neural Network Swarm (ONNS): a bio-geo-optical algorithm for open ocean and coastal waters, Front. Mar. Sci., 4, 140, https://doi.org/10.3389/fmars.2017.00140, 2017.
Irigoien, X. and Castel, J.: Light limitation and distribution of chlorophyll pigments in a highly turbid estuary: the Gironde (SW France), Estuar. Coast. Shelf Sci., 44, 507–517, 1997.
Jespersen, A. M. and Christoffersen, K.: Measurements of chlorophyll-a from phytoplankton using ethanol as extraction solvent, Archiv für Hydrobiologie, 109, 445–454, 1987.
Lacroix, G., Ruddick, K., Ozer, J., and Lancelot, C.: Modelling the impact of the Scheldt and Rhine/Meuse plumes on the salinity distribution in Belgian waters (southern North Sea), J. Sea Res., 52, 149–163, 2004.
Lancelot, C., Spitz, Y., Gypens, N., Ruddick, K., Becquevort, S., Rousseau, V., Lacroix, G., and Billen, G.: Modelling diatom and Phaeocystis blooms and nutrient cycles in the Southern Bight of the North Sea: the MIRO model, Mar. Ecol. Prog. Ser., 289, 63–78, 2005.
Lavigne, H., Dogliotti, A., Doxaran, D., Shen, F., Castagna, A., Beck, B., Vanhellemont, Q., Sun, X., Gossn, J. I., Pannimpullath, R., Sabbe, K., Vansteenwegen, D., and Ruddick, K.: The HYPERMAQ dataset, PANGAEA [data set], https://doi.org/10.1594/PANGAEA.944313, 2022.
Li, P., Yang, S. L., Milliman, J. D., Xu, K. H., Qin, W. H., Wu, C. S., Chen, Y. P., and Shi, B. W.: Spatial, temporal, and human-induced variations in suspended sediment concentration in the surface waters of the Yangtze Estuary and adjacent coastal areas, Estuar. Coasts, 35, 1316–1327, 2012.
Luo, W., Shen, F., He, Q., Cao, F., Zhao, H., and Li, M.: Changes in suspended sediments in the Yangtze River Estuary from 1984 to 2020: Responses to basin and estuarine engineering constructions, Sci. Total Environ., 805, 150381, https://doi.org/10.1016/j.scitotenv.2021.150381, 2022.
Mackey, M. D., Mackey, D. J., Higgins, H. W., and Wright, S. W.: CHEMTAX-a program for estimating class abundances from chemical markers: application to HPLC measurements of phytoplankton, Mar. Ecol. Prog. Ser., 144, 265–283, 1996.
Morel, A. and Maritorena, S.: Bio-optical properties of oceanic waters: A reappraisal, J. Geophys. Res.-Oceans, 106, 7163–7180, 2001.
Morel, A. and Prieur, L.: Analysis of variations in ocean color 1, Limnol. Oceanogr., 22, 709–722, 1977.
Mortelmans, J., Deneudt, K., Cattrijsse, A., Beauchard, O., Daveloose, I., Vyverman, W., Vanaverbeke, J., Timmermans, K., Peene, J., Roose, P., Knockaert, M., Chou, L., Sanders, R., Stinchcombe, M., Kimpe, P., Lammens, S., Theetaert, H., Gkritzalis, T., Hernandez, F., and Mees, J.: Nutrient, pigment, suspended matter and turbidity measurements in the Belgian part of the North Sea, Sci. Data, 22, https://doi.org/10.1038/s41597-019-0032-7, 2019.
Muylaert, K., Gonzales, R., Franck, M., Lionard, M., Van der Zee, C., Cattrijsse, A., Sabbe, K., Chou, L., and Vyverman, W.: Spatial variation in phytoplankton dynamics in the Belgian coastal zone of the North Sea studied by microscopy, HPLC-CHEMTAX and underway fluorescence recordings, J. Sea Res., 55, 253–265, 2006.
Nechad, B., Dogliotti, A., Ruddick, K., and Doxaran, D.: Particulate backscattering and suspended matter concentration retrieval from remote-sensed turbidity in various coastal and riverine turbid waters, in: Living Planet Symposium, Proceedings of the conference held 9–13 May 2016 in Prague, Czech Republic, edited by: Ouwehand, L., ESA-SP Volume 740, ISBN 978-92-9221-305-3, p. 419, 2016.
Neukermans, G., Ruddick, K., Loisel, H., and Roose, P.: Optimization and quality control of suspended particulate matter concentration measurement using turbidity measurements, Limnol. Oceanogr.: Methods, 10, 1011–1023, 2012.
Odermatt, D., Gitelson, A., Brando, V. E., and Schaepman, M.: Review of constituent retrieval in optically deep and complex waters from satellite imagery, Remote Sens. Environ., 118, 116–126, 2012.
Pérez, G. L., Llames, M. E., Lagomarsino, L., and Zagarese, H.: Seasonal variability of optical properties in a highly turbid lake (Laguna Chascomús, Argentina), Photochem. Photobiol., 87, 659–670, 2011.
Ruddick, K. G., Cauwer, V. D., Park, Y. J., and Moore, G.: Seaborne measurements of near infrared water-leaving reflectance: The similarity spectrum for turbid waters, Limnol. Oceanogr., 51, 1167–1179, 2006.
Shen, F., Verhoef, W., Zhou, Y., Salama, M., and Liu, X.: Satellite estimates of wide-range suspended sediment concentrations in Changjiang (Yangtze) estuary using MERIS data, Estuar. Coasts, 33, 1420–1429, 2010a.
Shen, F., Zhou, Y. X., Li, D. J., Zhu, W. J., and Suhyb Salama, M.: Medium resolution imaging spectrometer (MERIS) estimation of chlorophyll-a concentration in the turbid sediment-laden waters of the Changjiang (Yangtze) Estuary, Int. J. Remote Sens., 31, 4635–4650, 2010b.
Shen, F., Zhou, Y., Li, J., He, Q., and Verhoef, W.: Remotely sensed variability of the suspended sediment concentration and its response to decreased river discharge in the Yangtze estuary and adjacent coast, Cont. Shelf Res., 69, 52–61, 2013.
Shen, F., Tang, R., Sun, X., and Liu, D.: Simple methods for satellite identification of algal blooms and species using 10-year time series data from the East China Sea, Remote Sens. Environ., 235, 111484, https://doi.org/10.1016/j.rse.2019.111484 2019.
Tilstone, G. H., Moore, G. F., Sørensen, K., Doerffer, R., and Røttgers, R.: REVAMP Protocols, REVAMP methodologies – EVG1 – CT – 2001 – 00049, Working meeting on MERIS and AATSR Calibration and Geophysical Validation (ENVISAT MAVT-2003), held in Frascati, 20–24 October 2003, ESA Special Publication WPP-233, https://odnature.naturalsciences.be/downloads/publications/tilstone_esawpp233_revampprotocols330.pdf (last access: 24 October 2022), 2002.
Torremorell, A., Bustigorry, J., Escaray, R., and Zagarese, H. E.: Seasonal dynamics of a large, shallow lake, laguna Chascomús: the role of light limitation and other physical variables, Limnologica, 37, 100–108, 2007.
Torremorell, A., Llames, M. E., Pérez, G. L., Escaray, R., Bustingorry, J., and Zagarese, H. E.: Annual patterns of phytoplankton density and primary production in a large, shallow lake: the central role of light, Freshwater Biol., 54, 437–449, 2009.
Uitz, J., Claustre, H., Morel, A., and Hooker, S. B.: Vertical distribution of phytoplankton communities in open ocean: An assessment based on surface chlorophyll, J. Geophys. Res.-Oceans, 111, C08005, https://doi.org/10.1029/2005JC003207, 2006.
Van der Linde, D. W.: Protocol for the determination of total suspended matter in oceans and coastal zones, Joint Research Centre, Ispra, Technical note I.98.182, 1998.
Van Heukelem, L. and Thomas, C. S.: Computer-assisted high-performance liquid chromatography method development with applications to the isolation and analysis of phytoplankton pigments, J. Chromatography A, 910, 31–49, 2001.
Vantrepotte, V., Loisel, H., Dessailly, D., and Mériaux, X.: Optical classification of contrasted coastal waters, Remote Sens. Environ., 123, 306–323, 2012.
Zhu, W., Wang, M., and Zhang, B.: The effects of urbanization on PM2. 5 concentrations in China's Yangtze River Economic Belt: New evidence from spatial econometric analysis, Journal of Cleaner Production, 239, 118065, https://doi.org/10.1016/j.jclepro.2019.118065, 2019.